1. Introduction
Mobile mapping systems, based on terrestrial/aerial vehicles or on human-carried devices, have been used in the past dozen of years to map and monitor areas of interest for a wide range of applications [
1,
2,
3,
4,
5,
6,
7,
8,
9,
10]. These systems are equipped with navigation and imaging sensors. The former ones are usually based on the integration of positioning with the global navigation satellite system (GNSS) and inertial navigation with an inertial measurement unit (IMU), the latter ones consist of laser scanners and cameras. Despite their high reliability, the use of mobile mapping systems in indoor environments is usually limited (due to vehicle size and difficulties in moving it in such environments).
During the decade, several portable mobile mapping systems have been developed in order to enable accurate surveys also in environments that are difficult to reach with (large terrestrial/aerial) vehicles [
11,
12,
13]. A recent example of a commercial solution allowing accurate surveying also in difficult/indoor environments is the Leica Pegasus backpack [
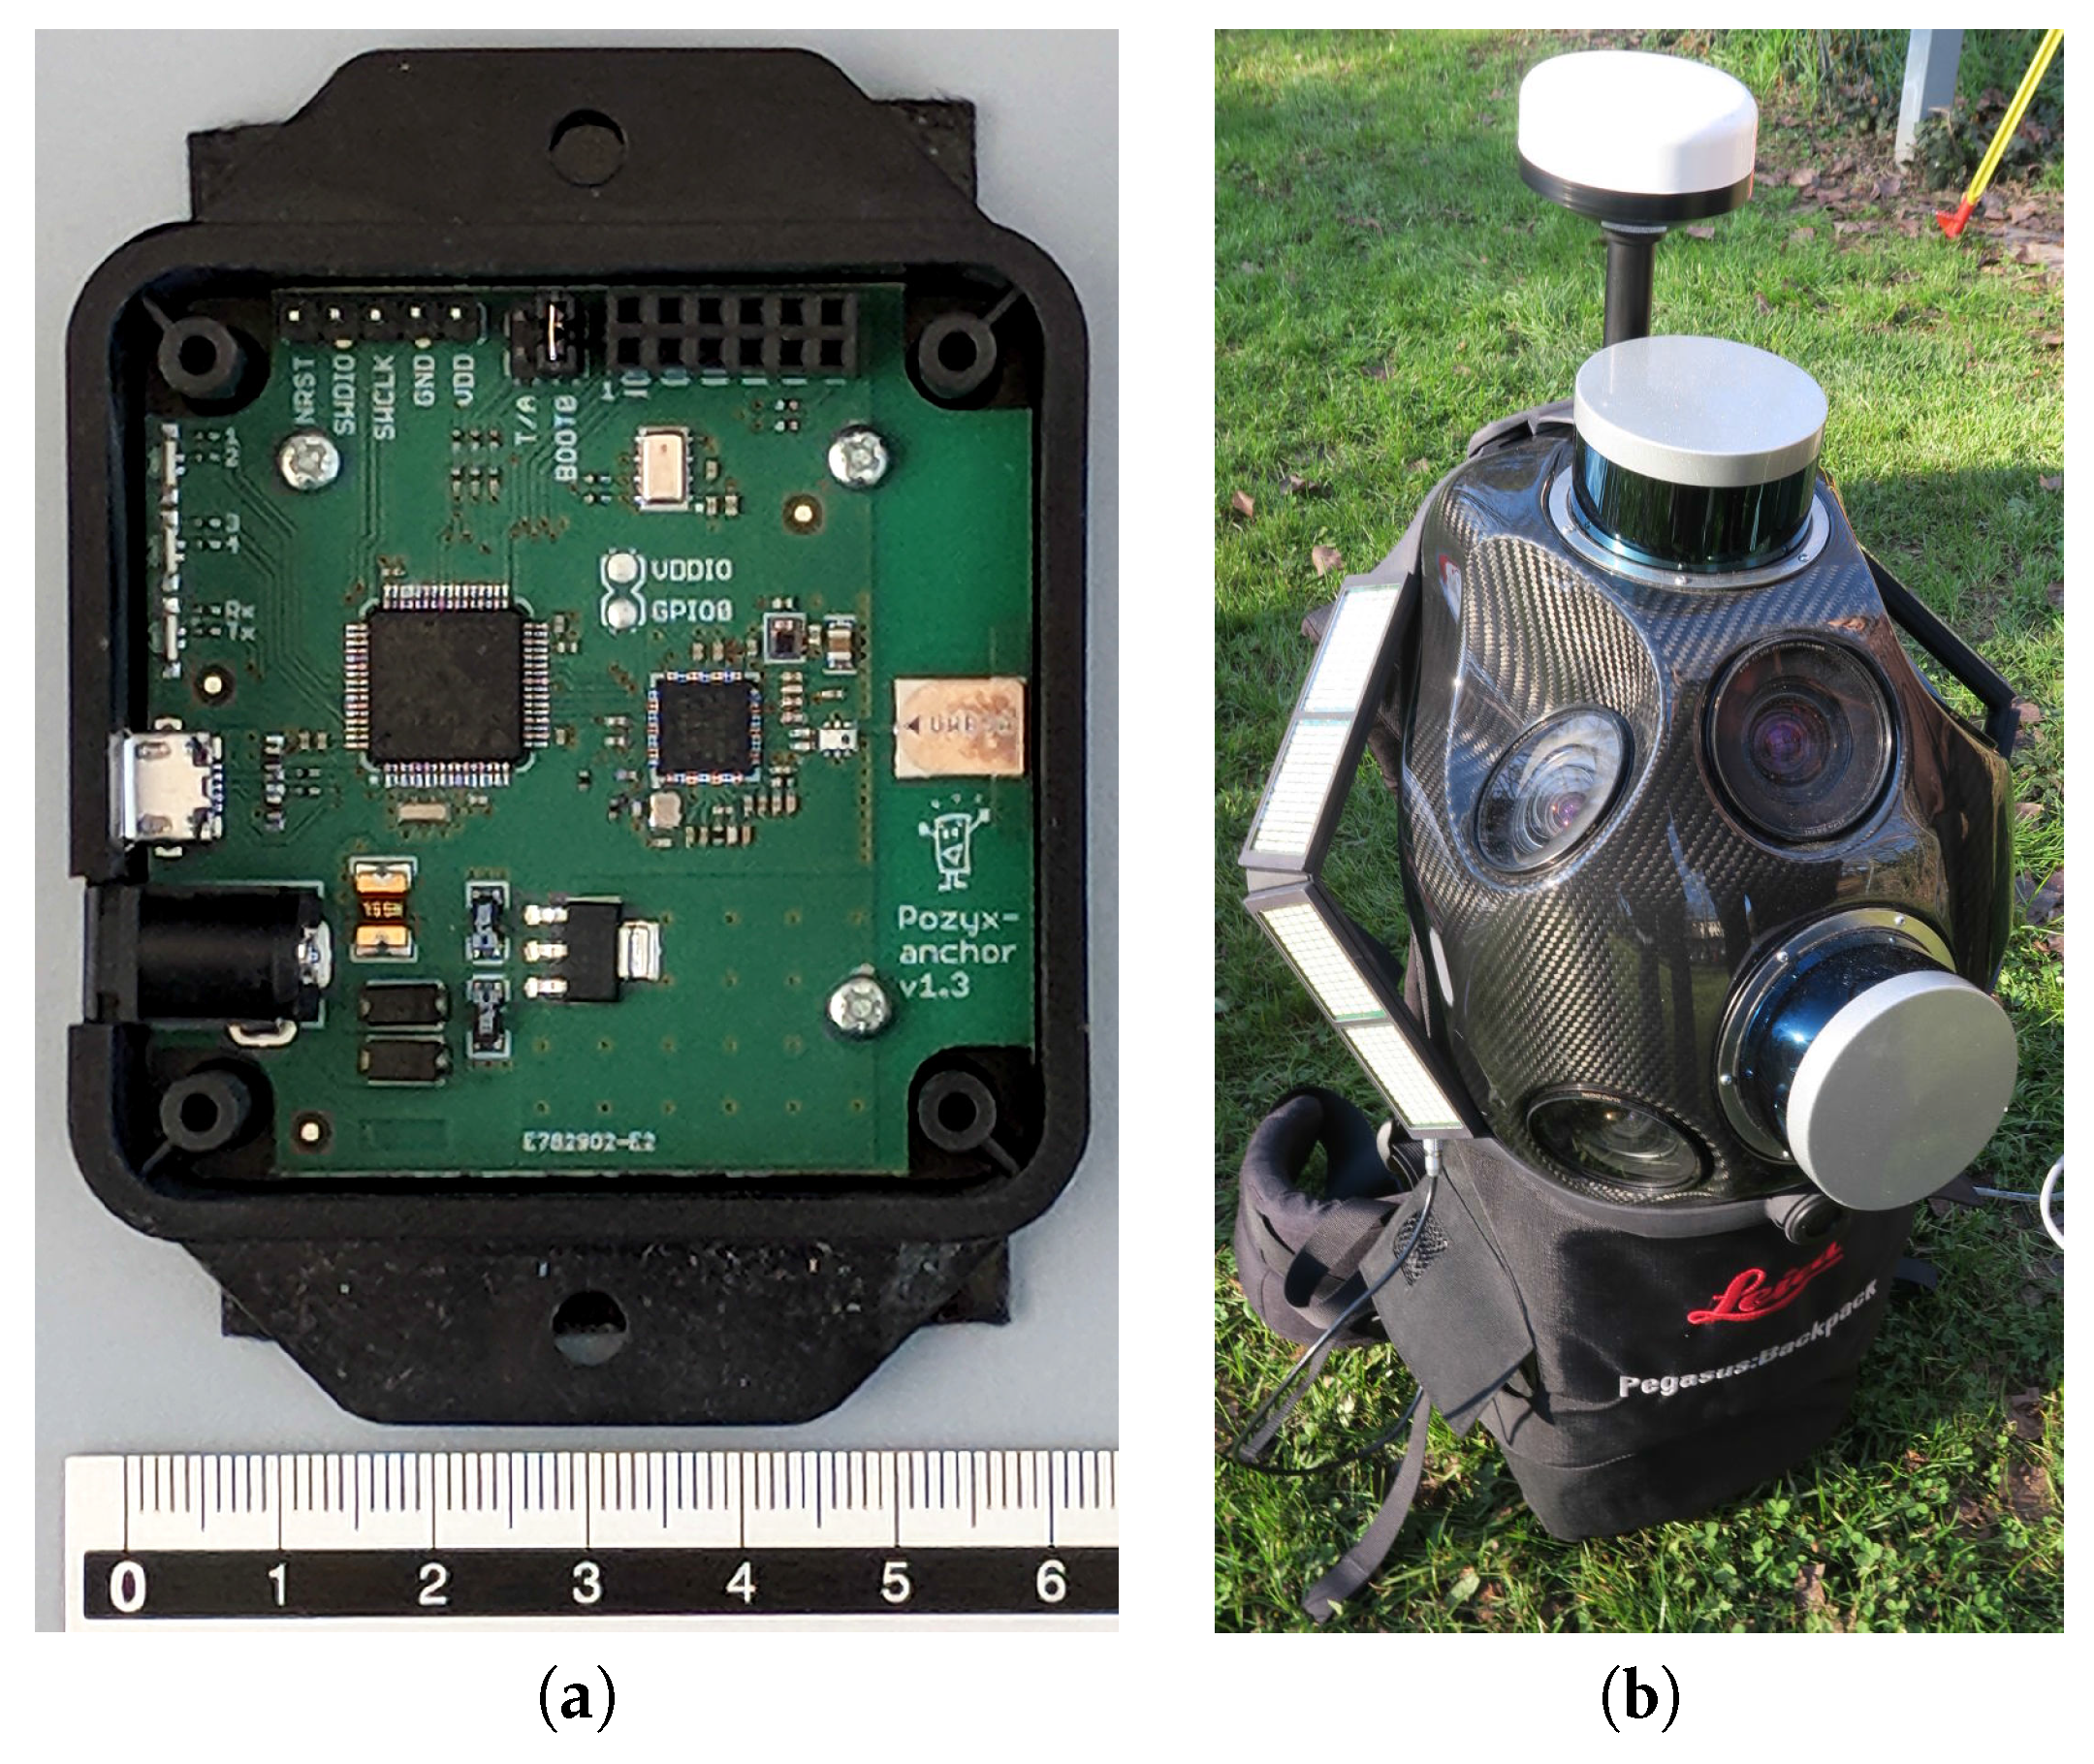
14]. It is a wearable pedestrian mapping system enabling almost ubiquitous 3D data capture, i.e., outdoors, indoors, underground. Given its limited size (
cm) and weight (11.9 kg), its nominal reconstruction accuracy (relative error 3 cm, in local coordinates; absolute error 5 cm, in georeferenced coordinates) [
15], it can be considered a very interesting solution for quick and accurate surveys of small-/medium-sized sites.
The primary goal of this paper is to compare accuracies between the state-of-the-art portable laser scanner system described above and an alternative mobile mapping system. The proposed system is based on the use of photogrammetry [
16,
17,
18,
19] and ultra-wide band (UWB) sensors [
20,
21], whose principal characteristics are its low-cost and very high portability. A GNSS receiver can be optionally employed if data georeferencing is required [
22,
23]. The rationale is that of developing a low-cost system for indoor surveys, which requires only minimal human expertise and effort in its use. The imaging sensor is a standard consumer camera, i.e., Canon G7X, whereas positioning in local coordinates is obtained by means of a set of Pozyx UWB devices [
24] (
Figure 1a). Metric reconstruction is achieved by combining a self-calibrated photogrammetric reconstruction [
25,
26,
27,
28,
29] computed with Agisoft PhotoScan [
30] with UWB measurements. Georeferencing is obtained by using a Topcon HiPer V GNSS receiver [
31], positioned before the bastion entry. The considered system is lightweight, easy to use and cheaper than the Pegasus backpack. Indeed, most of the weight is given by the GNSS receiver, 1 kg approximately, so that all the required instrumentation can be carried with a quite small backpack. Data collection simply requires properly spreading UWB devices inside the environment, taking photos with the camera and a UWB sensor attached to it and acquiring GNSS measurement outdoors, if needed. The overall cost of the photogrammetric system is relatively low, about
$6k, out of which
$400 is for the camera,
$150 per Pozyx device and
$4k for the (geodetic grade) GNSS receiver.
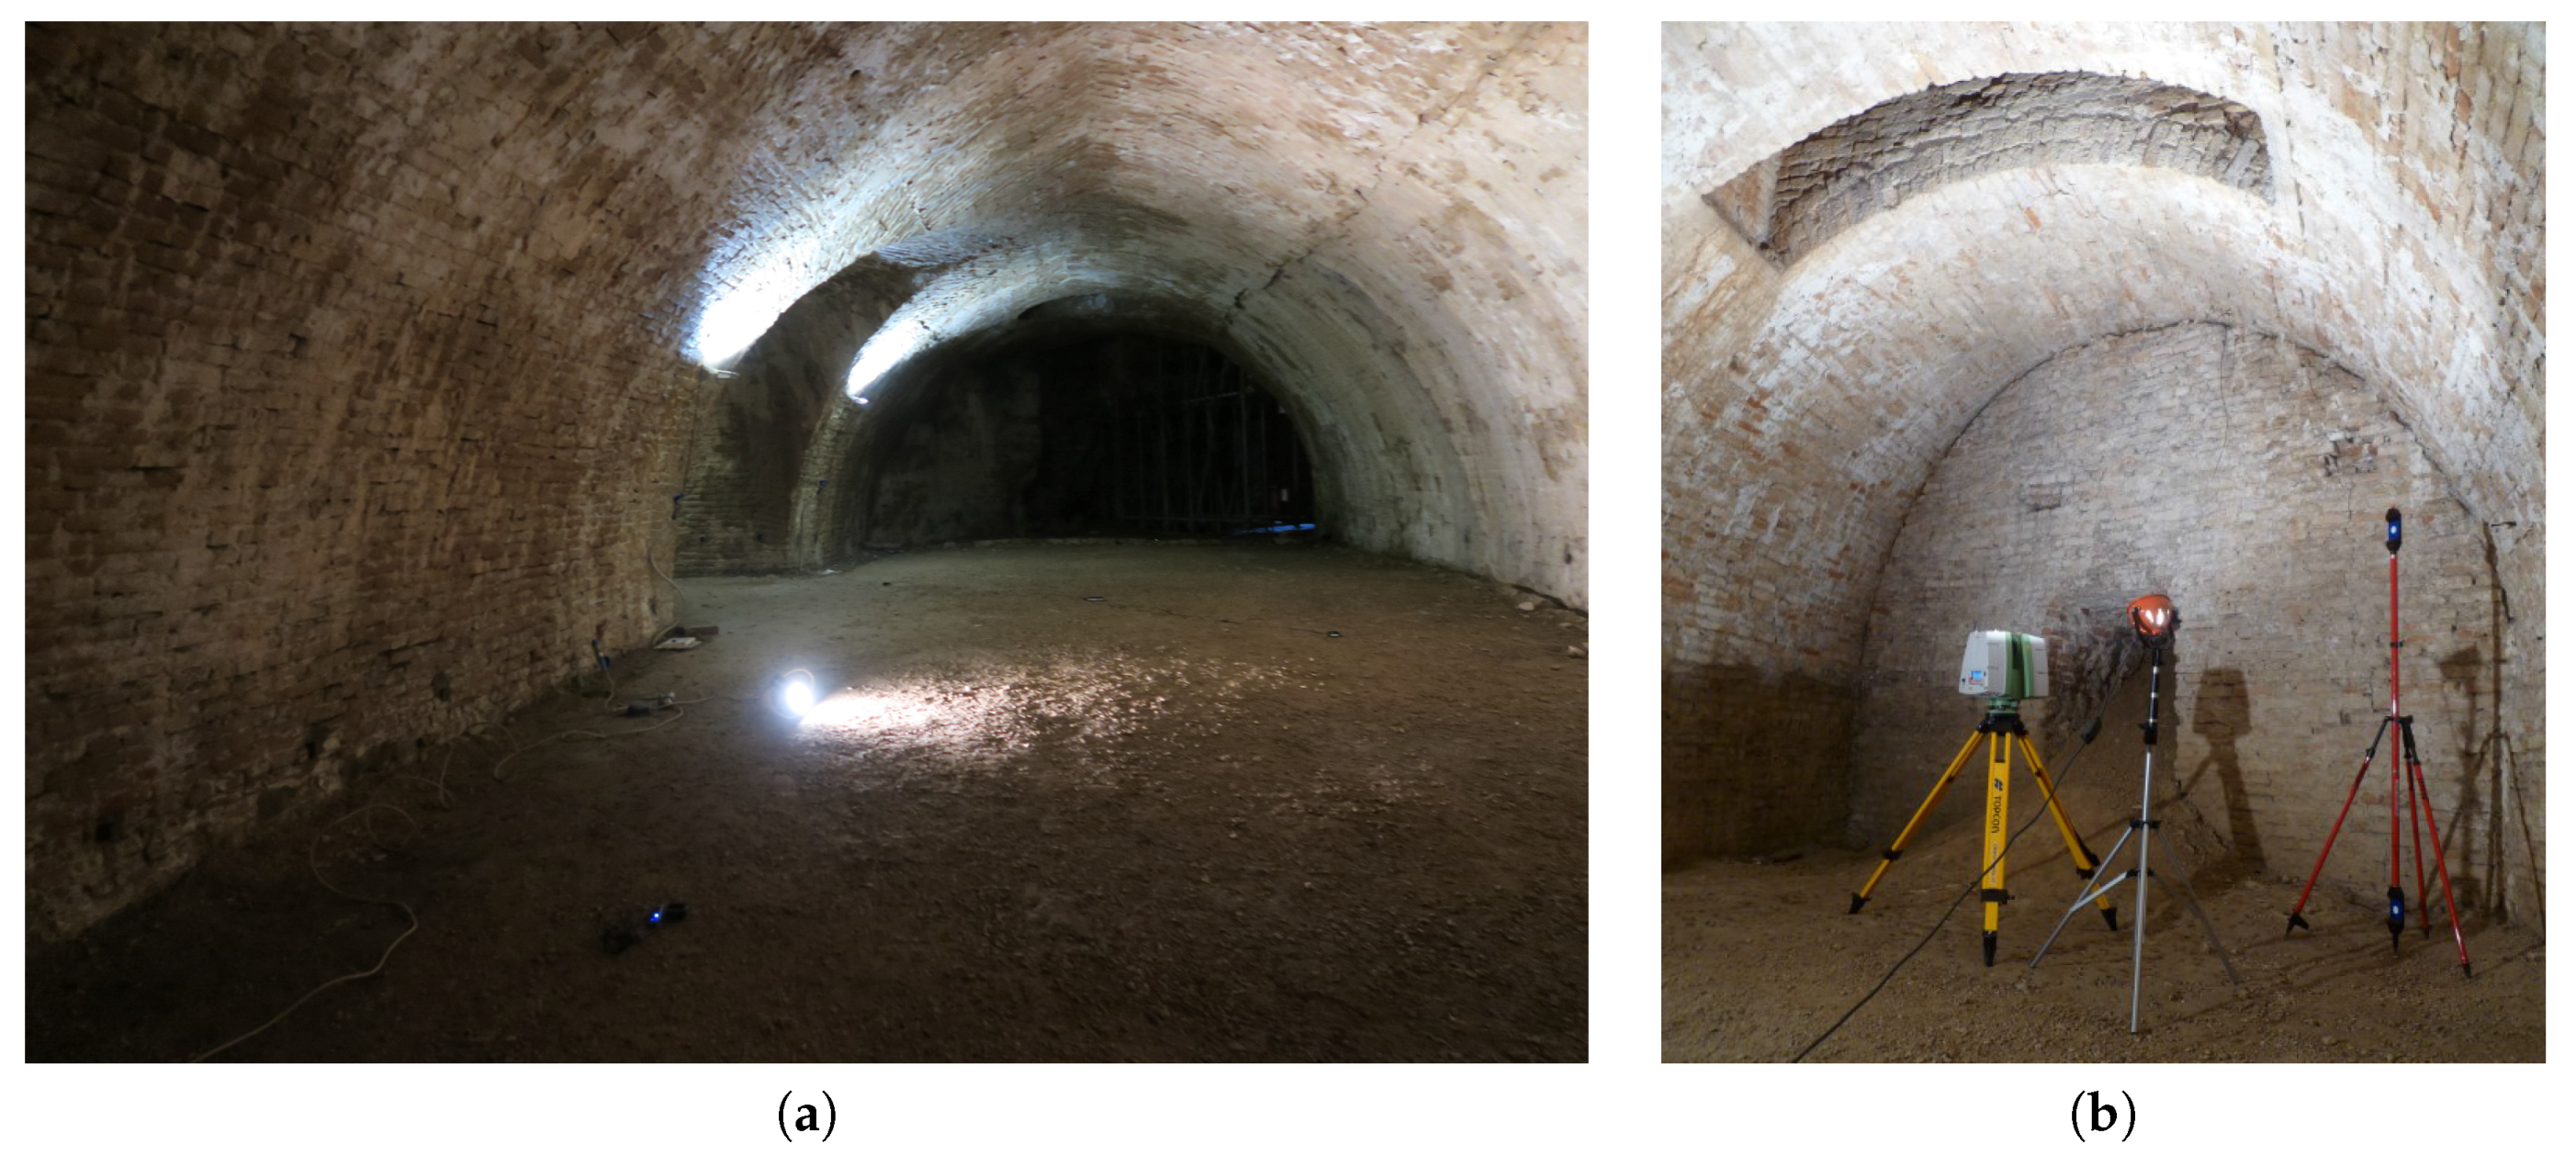
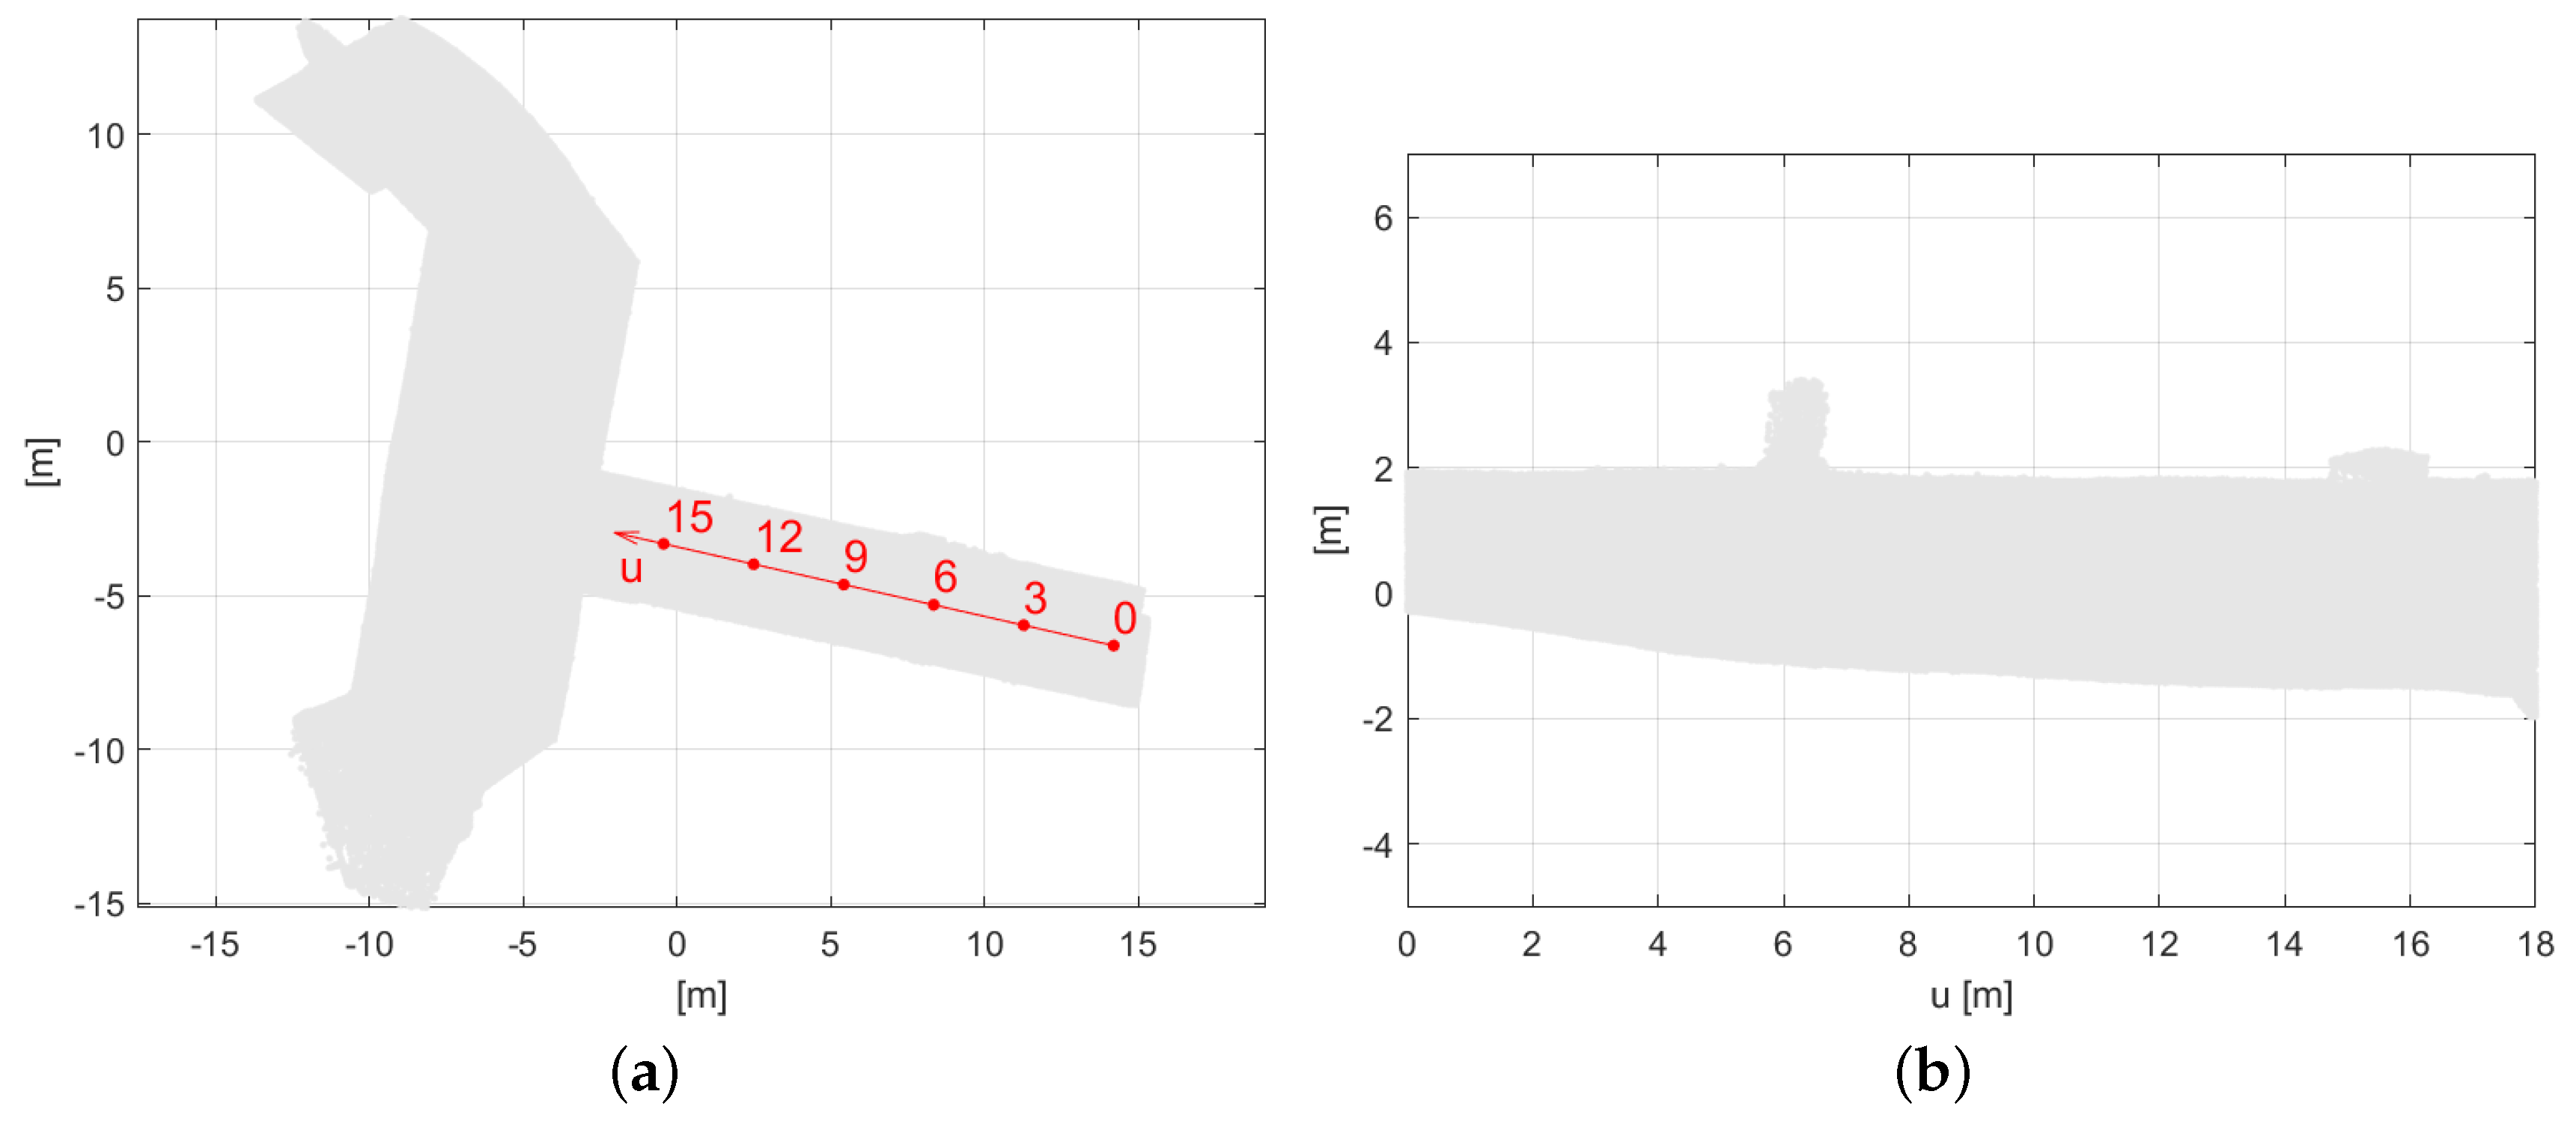
The considered case study for validating the proposed low-cost system is the survey of the Impossible bastion (the “Impossible bastion” is a defense post, which historically was considered unconquerable, thus the term “impossible”), a medieval structure (XVIth century) located within the ancient city walls of Padua, Italy (
Figure 2a).
This historical building (nowadays almost completely underground) was surveyed by the Interdepartmental Research Center of Geomatics (CIRGEO) of the University of Padua in 2016 with a terrestrial laser scanner (TLS), within the framework of a fellowship (Culturalmente 2015). The 3D model produced from the TLS survey is shown
Figure 2b.
The 3D model produced with the proposed low-cost mobile mapping system is compared with the TLS survey, which is used as reference dataset.
The survey with the Pegasus backpack was conducted on 21 December 2016 (
Figure 1b). It is worth noticing that the GNSS signal is available only before entering the bastion; hence, most of the survey was done just by relying on Pegasus’ inertial navigation system (INS) [
22,
32,
33] and on simultaneous localization and mapping (SLAM) technology [
34,
35].
The Pegasus backpack and our low-cost mobile mapping system are compared with the TLS survey taking into consideration both absolute and relative positioning accuracy. Absolute positioning accuracy aims at comparing two georeferenced models, i.e., models whose coordinates are related to a global coordinate reference system. Relative positioning accuracy aims at evaluating differences in the reconstructed 3D models, in which the georeferencing component has been removed. As such, relative positioning involves point coordinates related to a local reference frame. In the latter case, error is due to differences in the shape of the reconstructed models, whereas in the first case, georeferencing error can have a larger impact than shape differences between the models. These two cases will be referred to as absolute and relative error.
This paper extends a previous work presented in [
36] providing a much more detailed analysis of both the Pegasus backpack and photogrammetric reconstruction errors. Furthermore, this work considers the use of a larger UWB network, which provided a better metric reconstruction (e.g., a better estimate of the photogrammetric reconstruction scale factor).
The rest of the paper is organized as follows:
Section 2 describes the TLS survey.
Section 3 provides details on the Pegasus survey and investigates its performance on the considered case study with respect to the TLS 3D model.
Section 4 describes the low-cost mobile mapping system proposed in this paper and validates its results. Finally, the discussion and conclusions are drawn in
Section 5 and
Section 6, respectively.
2. 3D Reference Model-TLS Survey
In order to provide a 3D reference dataset for the assessment of the other two systems considered in this work, the interior of the Impossible bastion was fully surveyed with a Leica ScanStation C10 TLS. Based on time-of-flight (TOF) measuring principle, this scanning system combines all-in-one portability with the ability of performing surveys similar to a total station (traverse and resection). The laser features a full field-of-view thanks to the adoption of the Smart X-Mirror design, low beam divergence (<6 mm @ 50 m), high accuracy (6 mm @ 50 m), long range (300 m @ 90% reflectivity), dual-axis compensator and high scan speed (50k pts/s). In addition, the total station-like interface and on-board graphic color touch screen display allow users on-site data viewing. Moreover, this scanner also has internal memory storage of 80 gigabytes, which is ideal for surveying large areas.
The laser survey of the fortification was carried out by using the traversing method. This surveying procedure allows the user to take advantage of the Leica C10 built-in dual-axis compensator to use conventional surveying techniques to perform a traverse and establishing relationships between successive scanner positions within a known or assumed coordinate system. Because the dual-axis compensator automatically corrects scan data for the vertical displacements, the traverse procedure does not require as many targets as regular target-based registration. In this case study, an open traverse consisting of nine laser stations was set up to completely cover the study area.
On each station, the laser scanner was set on a tripod and then carefully leveled and plumbed directly over the top of the traverse mark on the ground. Leveling of the instrument is required in order to enable automatic registration of acquired scans and to minimize measurement errors. After setting out the TLS, the bearing and coordinates of the back station were set in order to define the fore station. The positions of back and fore stations were measured by the laser scanner using proper Leica target poles (
Figure 2b), whose sizes are automatically stored in the laser firmware.
In order to meet the requirement of a clear line of sight between each target station (back and fore) and the laser station, scanner positions were carefully designed by taking into account the inner geometry of the fortification. From each laser station, a set of scans was acquired with an average spatial resolution of about 1 cm at a distance of 10 m. Following a few initial tests, this value was deemed the most suited to generate a 3D model with a good level of detail for subsequent analyses.
Furthermore, in order to georeference the TLS-based 3D model, the traverse was properly connected to four control points (CPs) located outside of the bastion. Due to the morphological characteristics of the ancient structure and of the surrounding environment, three points were set at the tunnel entry, while the fourth one was placed in front of the left wing, being visible from the interior of the bastion through a small aperture. These CPs were measured both with a double frequency GNSS receiver (Topcon HiPer V) and with the Leica C10. In the latter case, specific Leica retroreflective 6” circular targets were employed. At the four CPs, GNSS observations were collected in network real-time kinematic (NRTK) mode, i.e., receiving real-time corrections from a nation-wide network of permanent GNSS stations (Topcon NetGEO network [
37]).
The raw data collected with the ScanSation C10 were then imported in Leica Cyclone software for processing. First, the scan station sequence was assembled in the Cyclone Traverse Editor in order to build the traverse. To this aim, instrument and target heights measured in the field were set for each scanner position. After verification and validation of the parameters entered, the traverse could be carried out. At the end of this processing step, the laser stations and associated point clouds coordinates were defined in a common reference frame. Basically, by traversing, a preliminary alignment (registration) of the scans could be obtained. However, since the generation of a laser traverse is always affected by residual errors, the registration results need to be refined further. A global alignment procedure, based on the well-known ICP (iterative closest point, [
38,
39]) algorithm, was therefore applied to all the pre-registered scans. Being an iterative process, the ICP algorithm requires a good initial guess about the “closeness” between two point clouds in order to converge to the correct solution. In this case, such an initial estimate was provided by the output of the traverse, at the end of which scans acquired from different locations resulted in being just spatially “close” to each other. Thus, by exploiting this information, scan pre-alignment could be automatically refined with the ICP. After this step, a global point cloud of 27 million points was obtained with an average residual alignment error reduced to a few millimeters: 0.008 m, 0.003 m and 0.004 m are the maximum, minimum and average error, respectively.
The global point cloud was then georeferenced in the Leica Cyclone through the GNSS coordinates of the four CPs observed during TLS traversing. The residual georeferencing error was about 1.5 cm, which is the same order of magnitude of the precision of the real-time corrected GNSS coordinates of the CPs.
4. Photogrammetric Reconstruction with the UWB Positioning System
This section considers an alternative 3D model of the bastion relying on the use of a very low-cost system with respect to those of
Section 2 and
Section 3. The proposed system is based on photogrammetric reconstruction, obtained with a standard consumer camera and Agisoft PhotoScan [
30]. Then, metric reconstruction is achieved by integrating the photo-based 3D reconstruction with measurements of the Pozyx UWB positioning system [
24]. Finally, a Topcon HiPer V GNSS receiver is used for georeferencing the 3D model. The rationale of this system is to produce a georeferenced 3D model avoiding the need for CPs inside of the bastion, where GNSS positioning is not reliable, and using low-cost and easily portable instruments.
Data acquisition in the bastion was carried out on 25 July 2017. Images have been taken by using a Canon G7X camera (20.2 MPix), with settings fixed at constant values (1/60-s shutter speed, f/1.8 aperture, 8.8-mm focal length, i.e., 35 mm equivalent: 24 mm). Five hundred and seven images have been collected in approximately one hour varying camera position and orientation. Portable spotlights were used in order to properly illuminate the bastion during image acquisitions.
Agisoft PhotoScan performed reconstruction with camera self-calibration: images were aligned with the highest accuracy setting, leading to an RMS reprojection error of 1.24 pixel, whereas high quality and mild depth filtering were set in the dense point cloud generation, resulting in a model with 190 million points. The average number of images used to reconstruct a single point was 5.3. Clear outliers have been manually deleted from the generated point cloud by means of CloudCompare, and the point cloud has been downsampled to a resolution similar to Pegasus point cloud, i.e., 27 millions of points. Let be the coordinate system associated with the 3D model provided by PhotoScan. A proper transformation (i.e., scaling factor, translation and rotation) was estimated as described in the following in order to map into the global reference system (i.e., WGS84 UTM32).
Since the GNSS signal was not available/reliable inside of the bastion, local positioning was obtained by using an UWB positioning system. In such a system, each device is a radio transmitter and receiver that provides ranging measurements once connected to another UWB device. Ranging is usually obtained by the time of flight of the radio signal, even if this clearly causes a decrease of ranging accuracy when devices are not in a clear line of sight (i.e., when obstacles are along the line connecting the two devices). A set of UWB devices, named anchors, are fixed to constant positions. Then, the UWB rover position is obtained by trilateration of range measurements provided by UWB anchors. A more detailed description of the Pozyx system used can be found in [
8,
24].
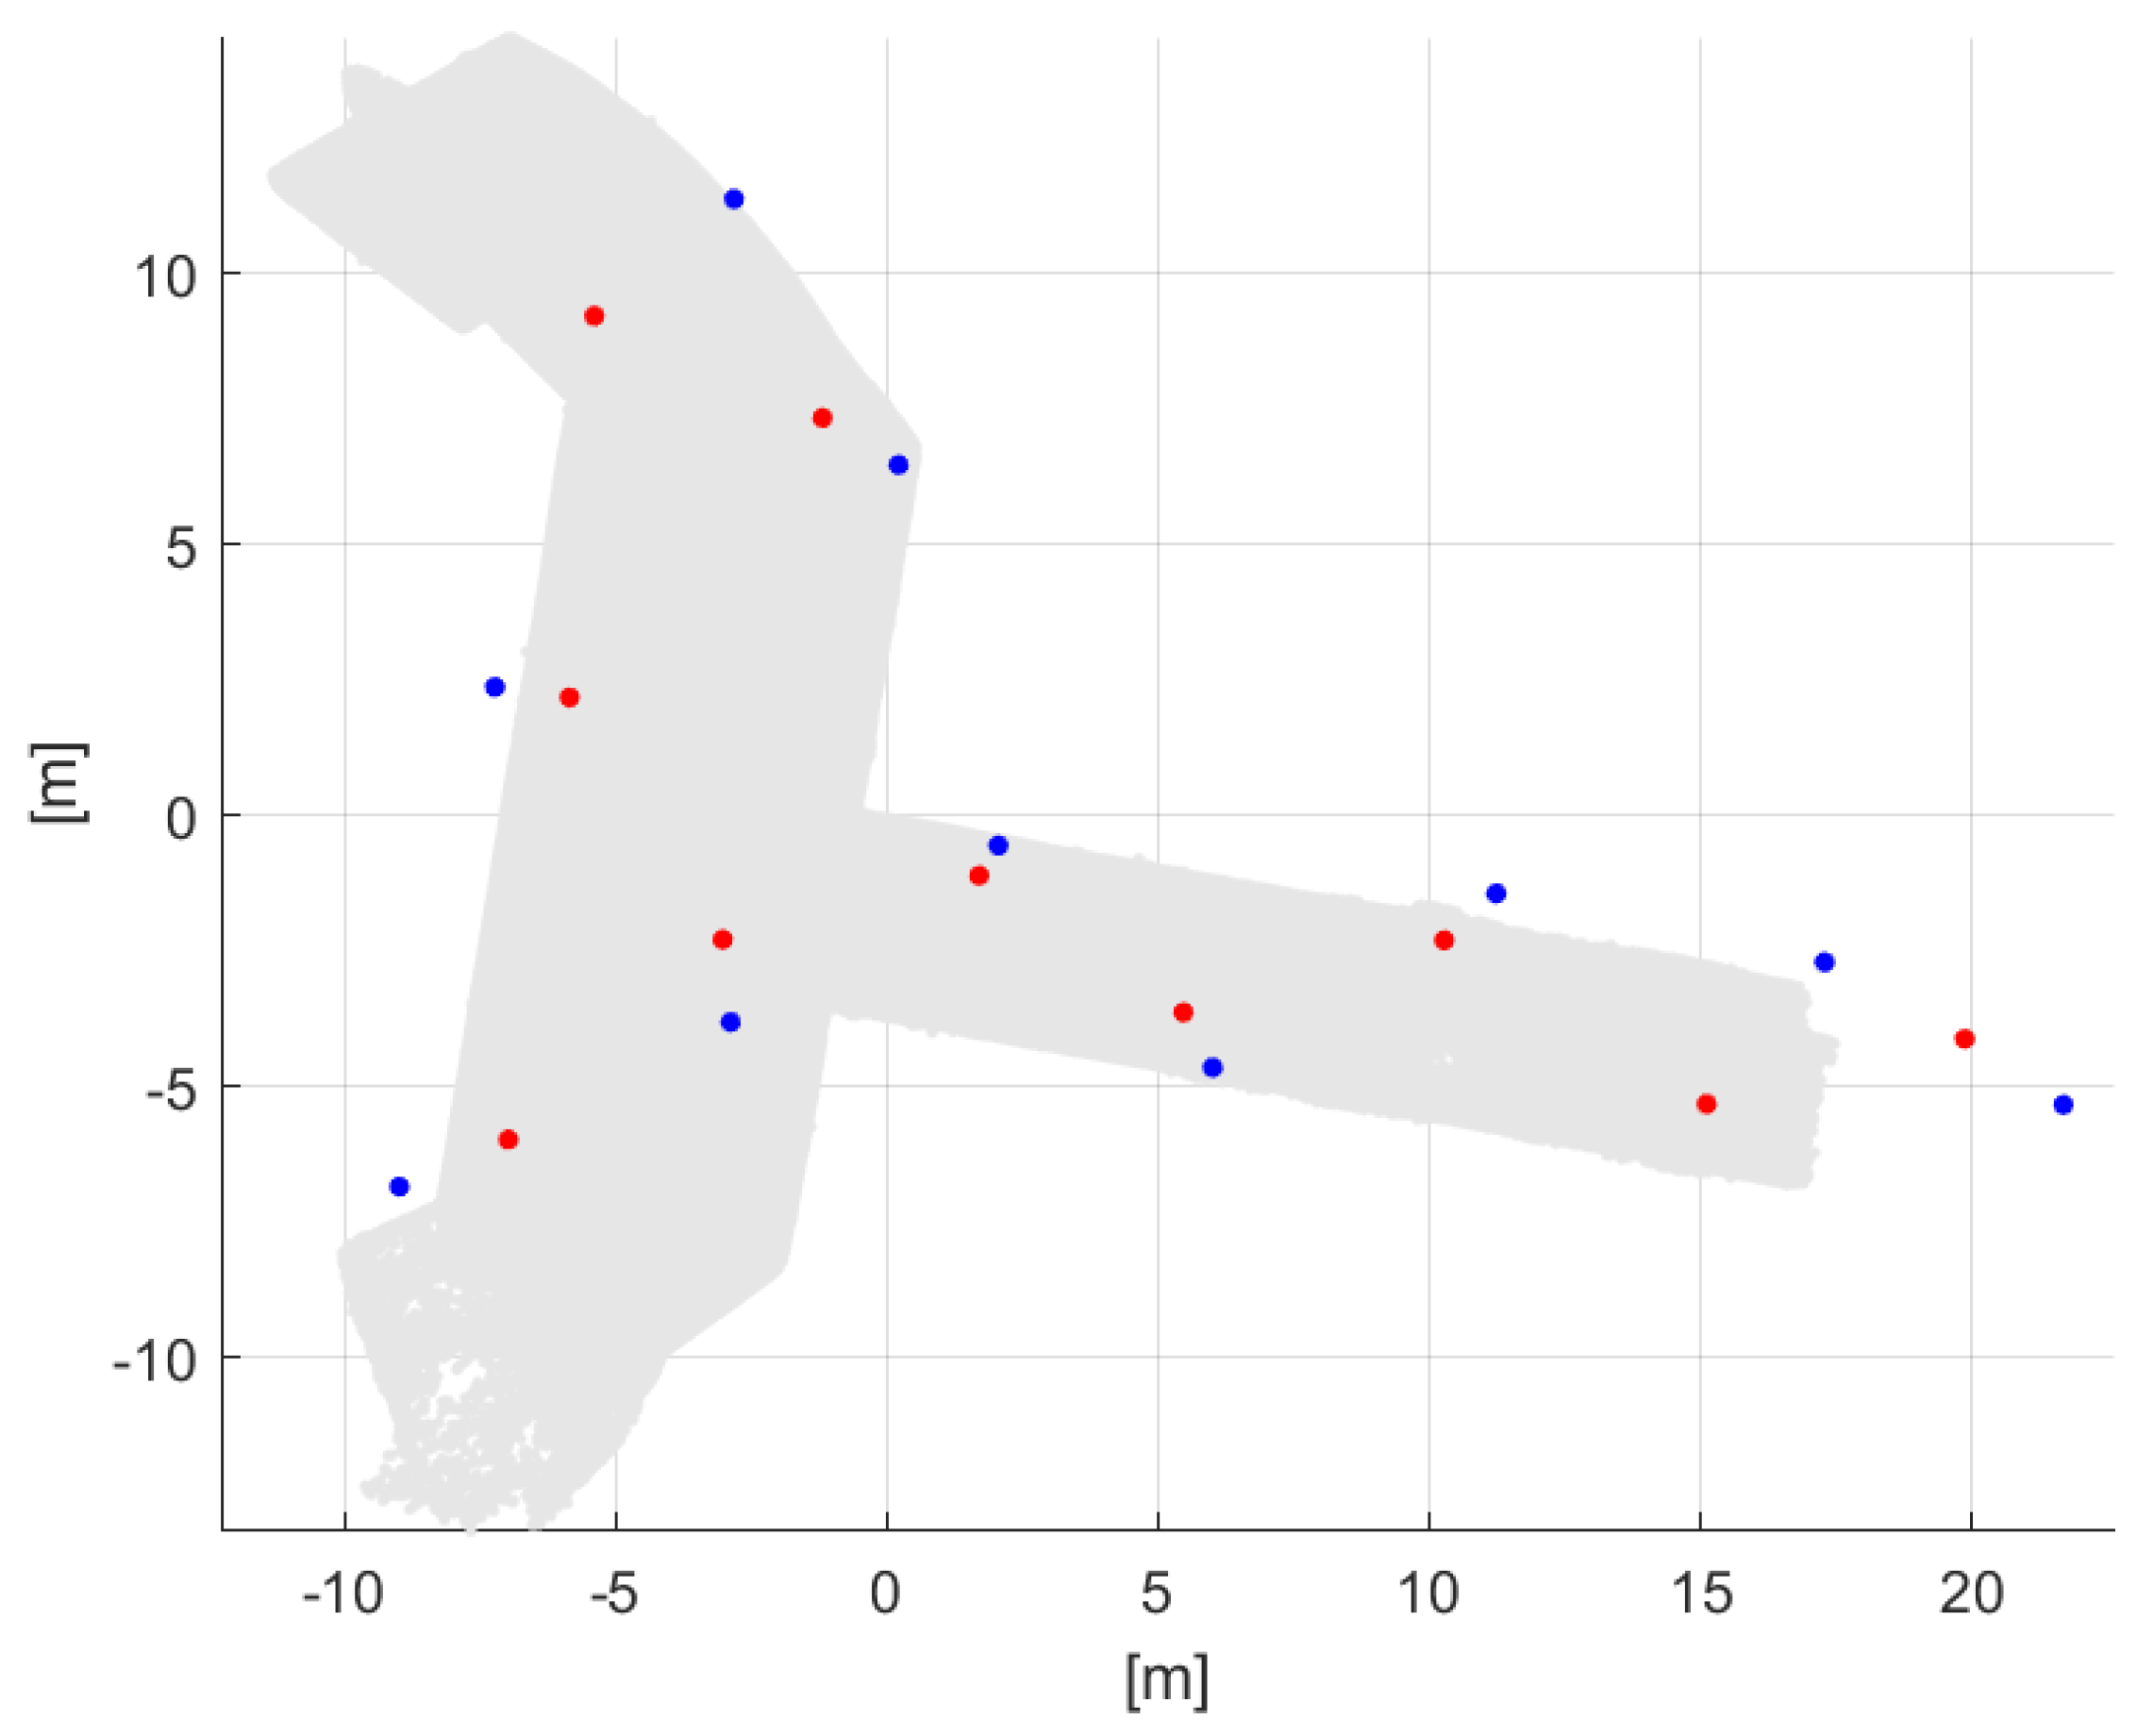
During the photogrammetric survey, a Pozyx rover was rigidly attached to the camera, whereas nine Pozyx anchors were distributed inside of the bastion (as shown in
Figure 6) to enable assessment of rover positions during the indoor survey. Another Pozyx anchor was positioned outside of the bastion, in order to track the rover also in front of the tunnel entry, i.e., where GNSS is available.
Interestingly, Pozyx devices are provided with an auto-detecting procedure that allows them to automatically detect and communicate with each other. Once turned on, rovers and anchors start to communicate and to provide range measurements. In this case study, a rover was used to collect (anchor-rover) range measurements during the survey, whereas positioning was performed in post-processing. Nevertheless, it is worth noticing that the software provided with the Pozyx system provides also real-time positioning, if needed. However, this functionality was not used in our experiments in order to save computational power, hence allowing a higher data rate collection.
Given the ease of use of the Pozyx system, distributing anchors in the bastion and setting the system required just a few minutes. Ideal positioning of UWB anchors is usually in high positions (e.g., high on a wall) to increase the probability of the direct line-of-sight in measurements [
24], but in this case study, they were placed on the ground due to the impossibility of attaching anything to the walls.
Calibration of the UWB systematic error has been previously considered in several works [
40,
41,
42,
43,
44,
45]; however, according to our experiments, systematic errors of low-cost Pozyx devices are significantly anisotropic and difficult to properly model [
8], i.e., the dependence on the relative orientation between rover and anchors is typically not negligible. Motivated by this consideration, the Pozyx system is used without any ad hoc calibration procedure.
In order to make the system as simple to use as possible, anchor positions were obtained by means of a self-positioning procedure: a local coordinate system was established by considering range measurements provided by three UWB devices as described in [
24], then trilateration (and nonlinear optimization) was used in order to estimate the positions of the remaining anchors (blue dot marks in
Figure 6). Anchor self-positioning was performed assuming anchors placed on a planar surface (2D positioning). Their positions were measured also by means of a Leica TCR 702 Total Station (red dot marks in
Figure 6). While using a total station requires some expertise, distributing UWB devices on the ground is a very easy task. Hence, the rationale of UWB self-positioning is that of providing a simple survey procedure for unspecialized personnel.
Blue and red points in
Figure 6 clearly show the error of the self-positioning procedure due to UWB measurement errors. In order to ease the comparison,
Figure 6 shows anchor positions overlapping on the bastion map (gray points): bastion coordinates in the
system are obtained by means of the map from
to
, which was estimated as described in the following.
Rover altitude with respect to the ground varied across a relatively small interval. Hence, in order to ease the rover positioning problem, rover altitude has been assumed to be fixed to a constant value, i.e., 1.5 m. Range measurements are combined by using an extended Kalman filter (EKF) in order to obtain estimates of the rover position in the
coordinate system [
46]. The rover dynamic model is modeled as follows:
where
is the rover 2D position at time
t on the planar surface at constant altitude,
T is the length of the time interval between the two estimates and
is the model noise.
The measurement equation for anchor
i is:
where
is the measurement of anchor
i at time
t,
is the position of anchor
i (
u and
v are two orthogonal direction on the horizontal plane) and
is the measurement noise. Future investigation foresees also the integration with pedestrian positioning estimation methods [
47,
48,
49].
The computed rover positions in the metric coordinate system, are used to estimate the parameters (translation vector, rotation matrix, scale factor) for mapping the photogrammetric point clouds from the photo to UWB frame. Least squares fitting (minimizing the sum of squared residuals) provided the best values for the parameters.
In the scaling process, the same weights have been given to all camera positions estimated by the UWB system. However, positions far from UWB anchors are clearly affected by a higher estimation error with respect to those surrounded by anchors. Introducing different weights depending on the considered position might improve scale estimation performance and will be the object of our future investigation.
Similarly to [
8], the optimization problem considered for scale estimation was also extended to solve the synchronization between camera and UWB sensors measurements.
A further improvement of the above estimates can be obtained by taking into account also misalignments due to the lever arm and boresight between the camera and rover. The rover was fixed with a proper position and orientation in order to make the axes of its coordinate system have approximately the same orientation of those of the camera, and translation between their centers is mostly in a single direction (the vertical axis). Calibration of the camera-UWB rover system was performed similarly to the procedure described in [
50]. The correction of camera positions can be applied once an estimate of the transformation from
to
is available. Then, the transformation
to
is re-estimated with the updated coordinates, and the process can be iterated until convergence.
Georeferencing of the photogrammetric model is obtained as follows: first, the UWB rover is set outside of the bastion over the position of the GNSS CP closest to the tunnel entry. This allows estimating the translation term between the
local frame and the global mapping frame (WGS84, UTM32). North and vertical directions are estimated by exploiting IMU measurements (the IMU was pre-calibrated as described in [
40], i.e., calibration of accelerometer and magnetometer): magnetometer and accelerometer data, collected in the rover reference frame are first transformed in the coordinate systems of the cameras and then in the
system by using camera orientations (computed during the photogrammetric reconstruction) and the previously-estimated transformation from
to
. To be more specific, let
and
be the (calibrated) accelerometer and magnetometer measurement vectors taken during the acquisition of the
i-th image. Since during image acquisition the camera is assumed to be still, accelerometer measurement
corresponds to a measurement of the vertical direction in the rover reference frame (i.e., the opposite of the gravity direction). Furthermore, since they correspond to directions, they can be assumed to be unit vectors (i.e., they can be normalized). Let
,
be the rotation matrix and translation vector corresponding to the transformation from the rover to the camera reference frame, then measurement vectors in the camera reference frame are obtained by applying the corresponding transformation to
and
:
Let
,
be the rotation matrix and translation vector corresponding to the
i-th camera position and orientation in the photogrammetric reconstruction computed by PhotoScan, then:
Finally, the rotation
of the previously estimated transformation from
to
is applied to
and
:
The obtained
and
are in the UWB reference system
. Being that the rover is firmly held during camera acquisitions, the (unnormalized) estimate of the vertical direction
is obtained by averaging accelerometer measurements in the
reference system:
After normalization of
, then the north direction is estimated by averaging the projections of magnetometer measurements (in the
coordinate system) on the plane orthogonal to the vertical direction. Let
be the projection matrix to such a plane, then:
To conclude, the
vector is normalized, and the 3D model is rotated according to the estimated north-vertical directions. Clearly, since the median is a more robust estimator with respect to the mean, it shall be considered in (
6) and (
7), in particular when the number of images is relatively low.
Table 4 reports the results obtained comparing photogrammetric and TLS reconstructions. To be more specific, the following cases are considered:
- (A)
Relative error case: obtained registering the two point clouds by using the ICP algorithm. UWB anchor positions were estimated through the self-positioning procedure.
- (B)
As in (A), but discarding the final part of the left wing of the bastion.
- (C)
Relative error case: similarly to A, but with the optimal scale (experimentally set) of the photogrammetric reconstruction being used: this case should provide results on the relative error case similar to the use of ground CPs.
- (D)
As in (C), but discarding the final part of the left wing of the bastion.
- (E)
Absolute error case: obtained with UWB anchor positions estimated through the self-positioning procedure.
For comparison, results obtained by using anchor positions (in local coordinates) surveyed with Leica TCR 702 Total Station are considered, as well:
- (F)
Similar to Case (A), but with surveyed anchor positions.
- (G)
Similar to Case (E), but with surveyed anchor positions.
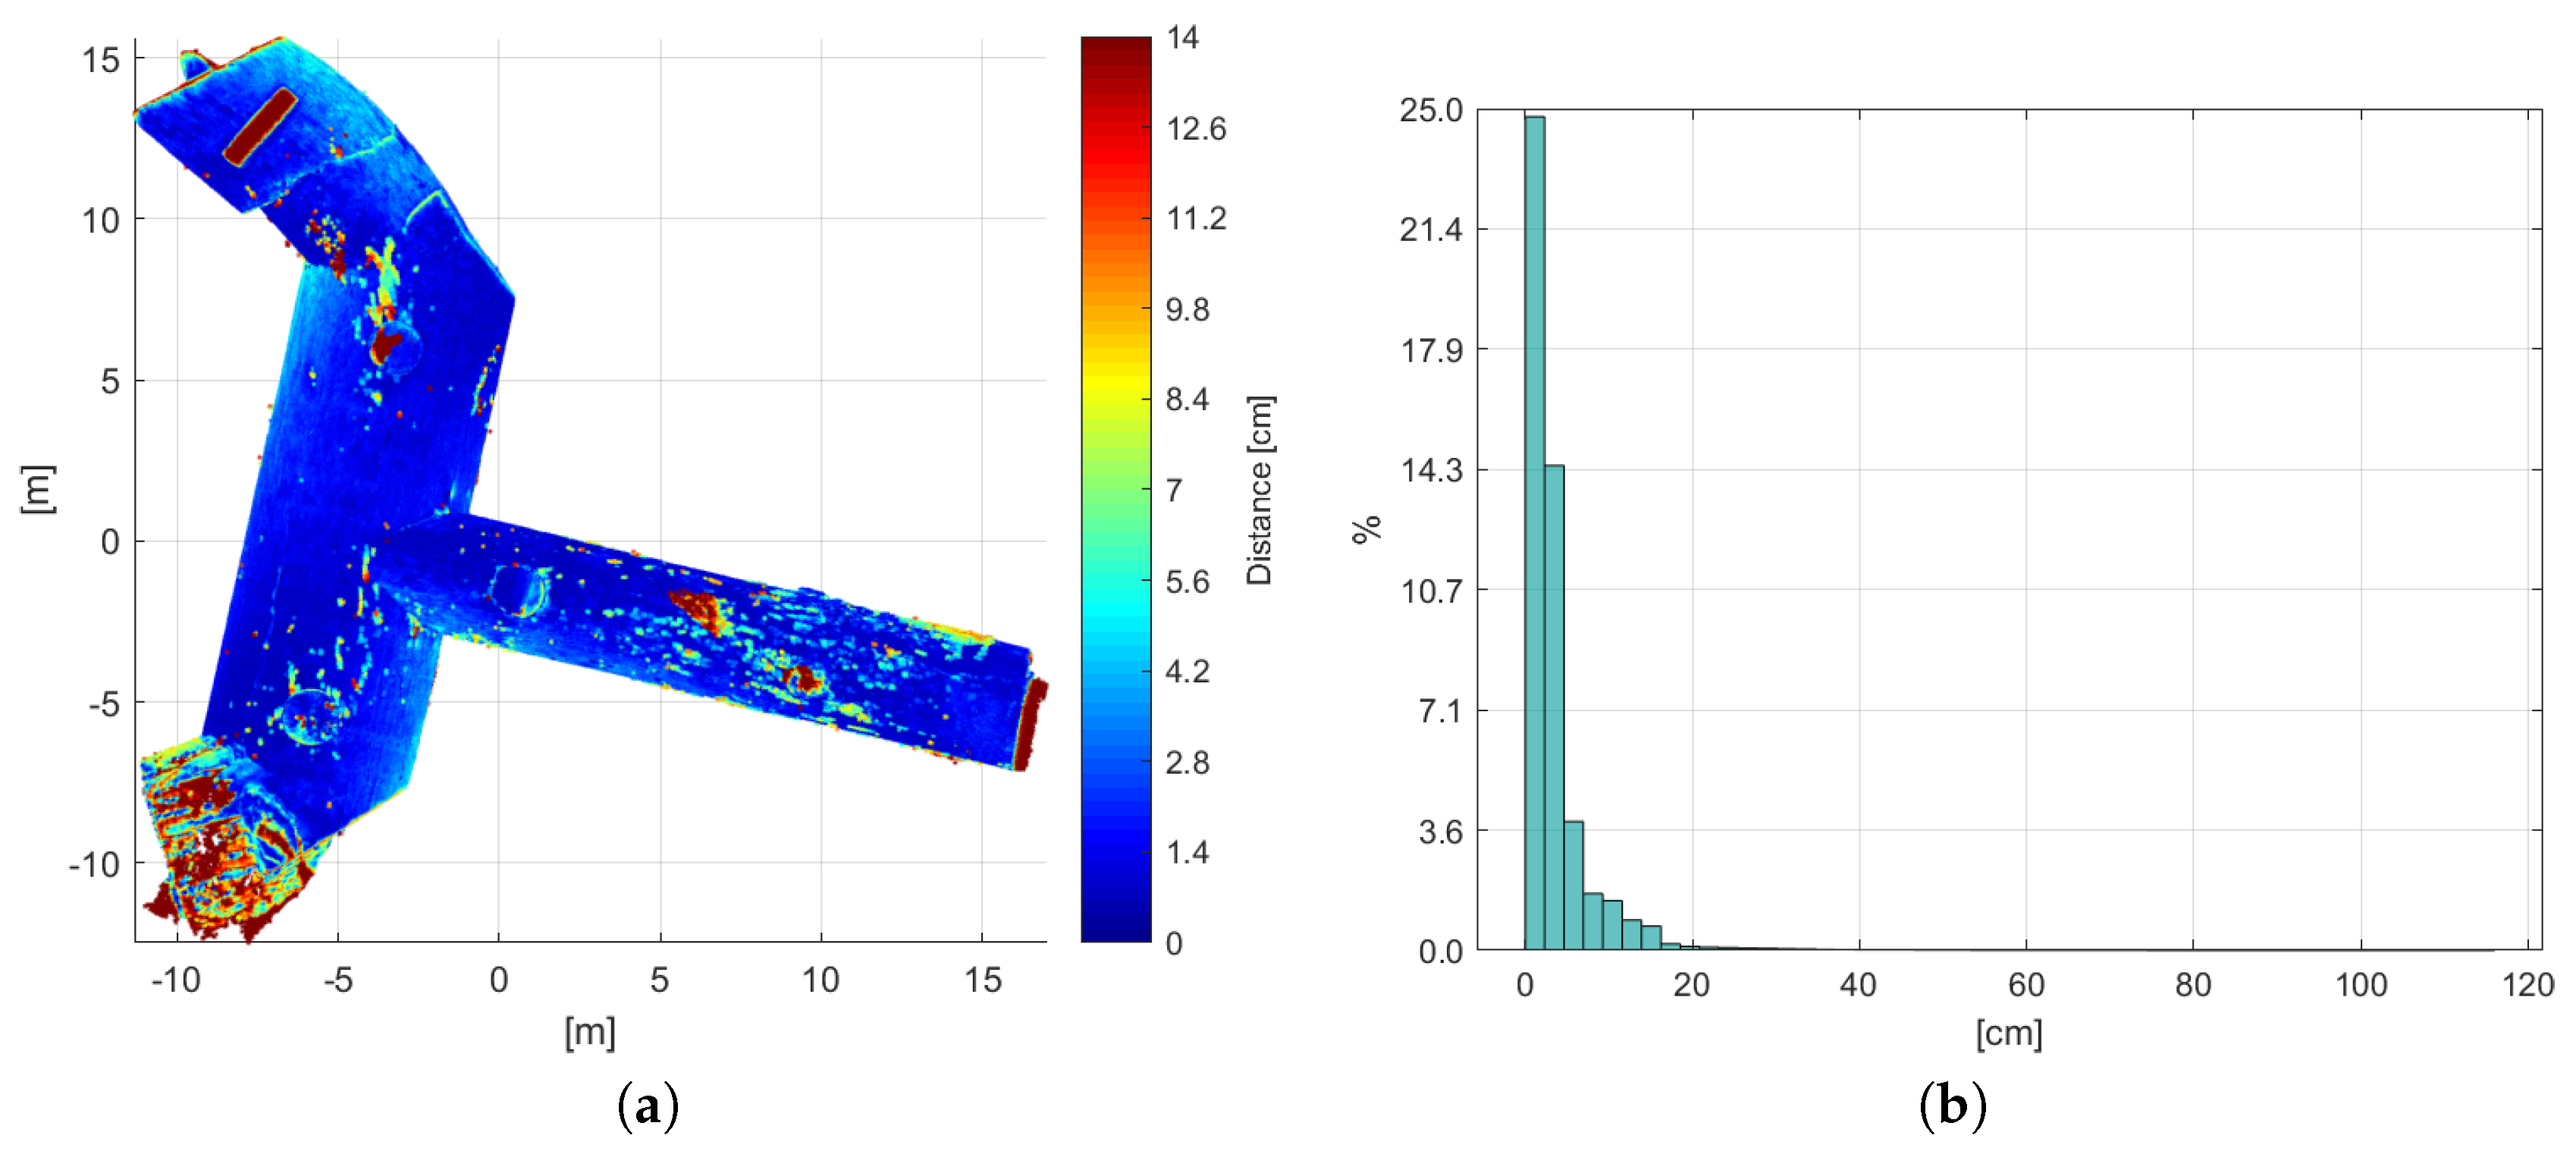
Error map and distribution for Case (A) are shown in
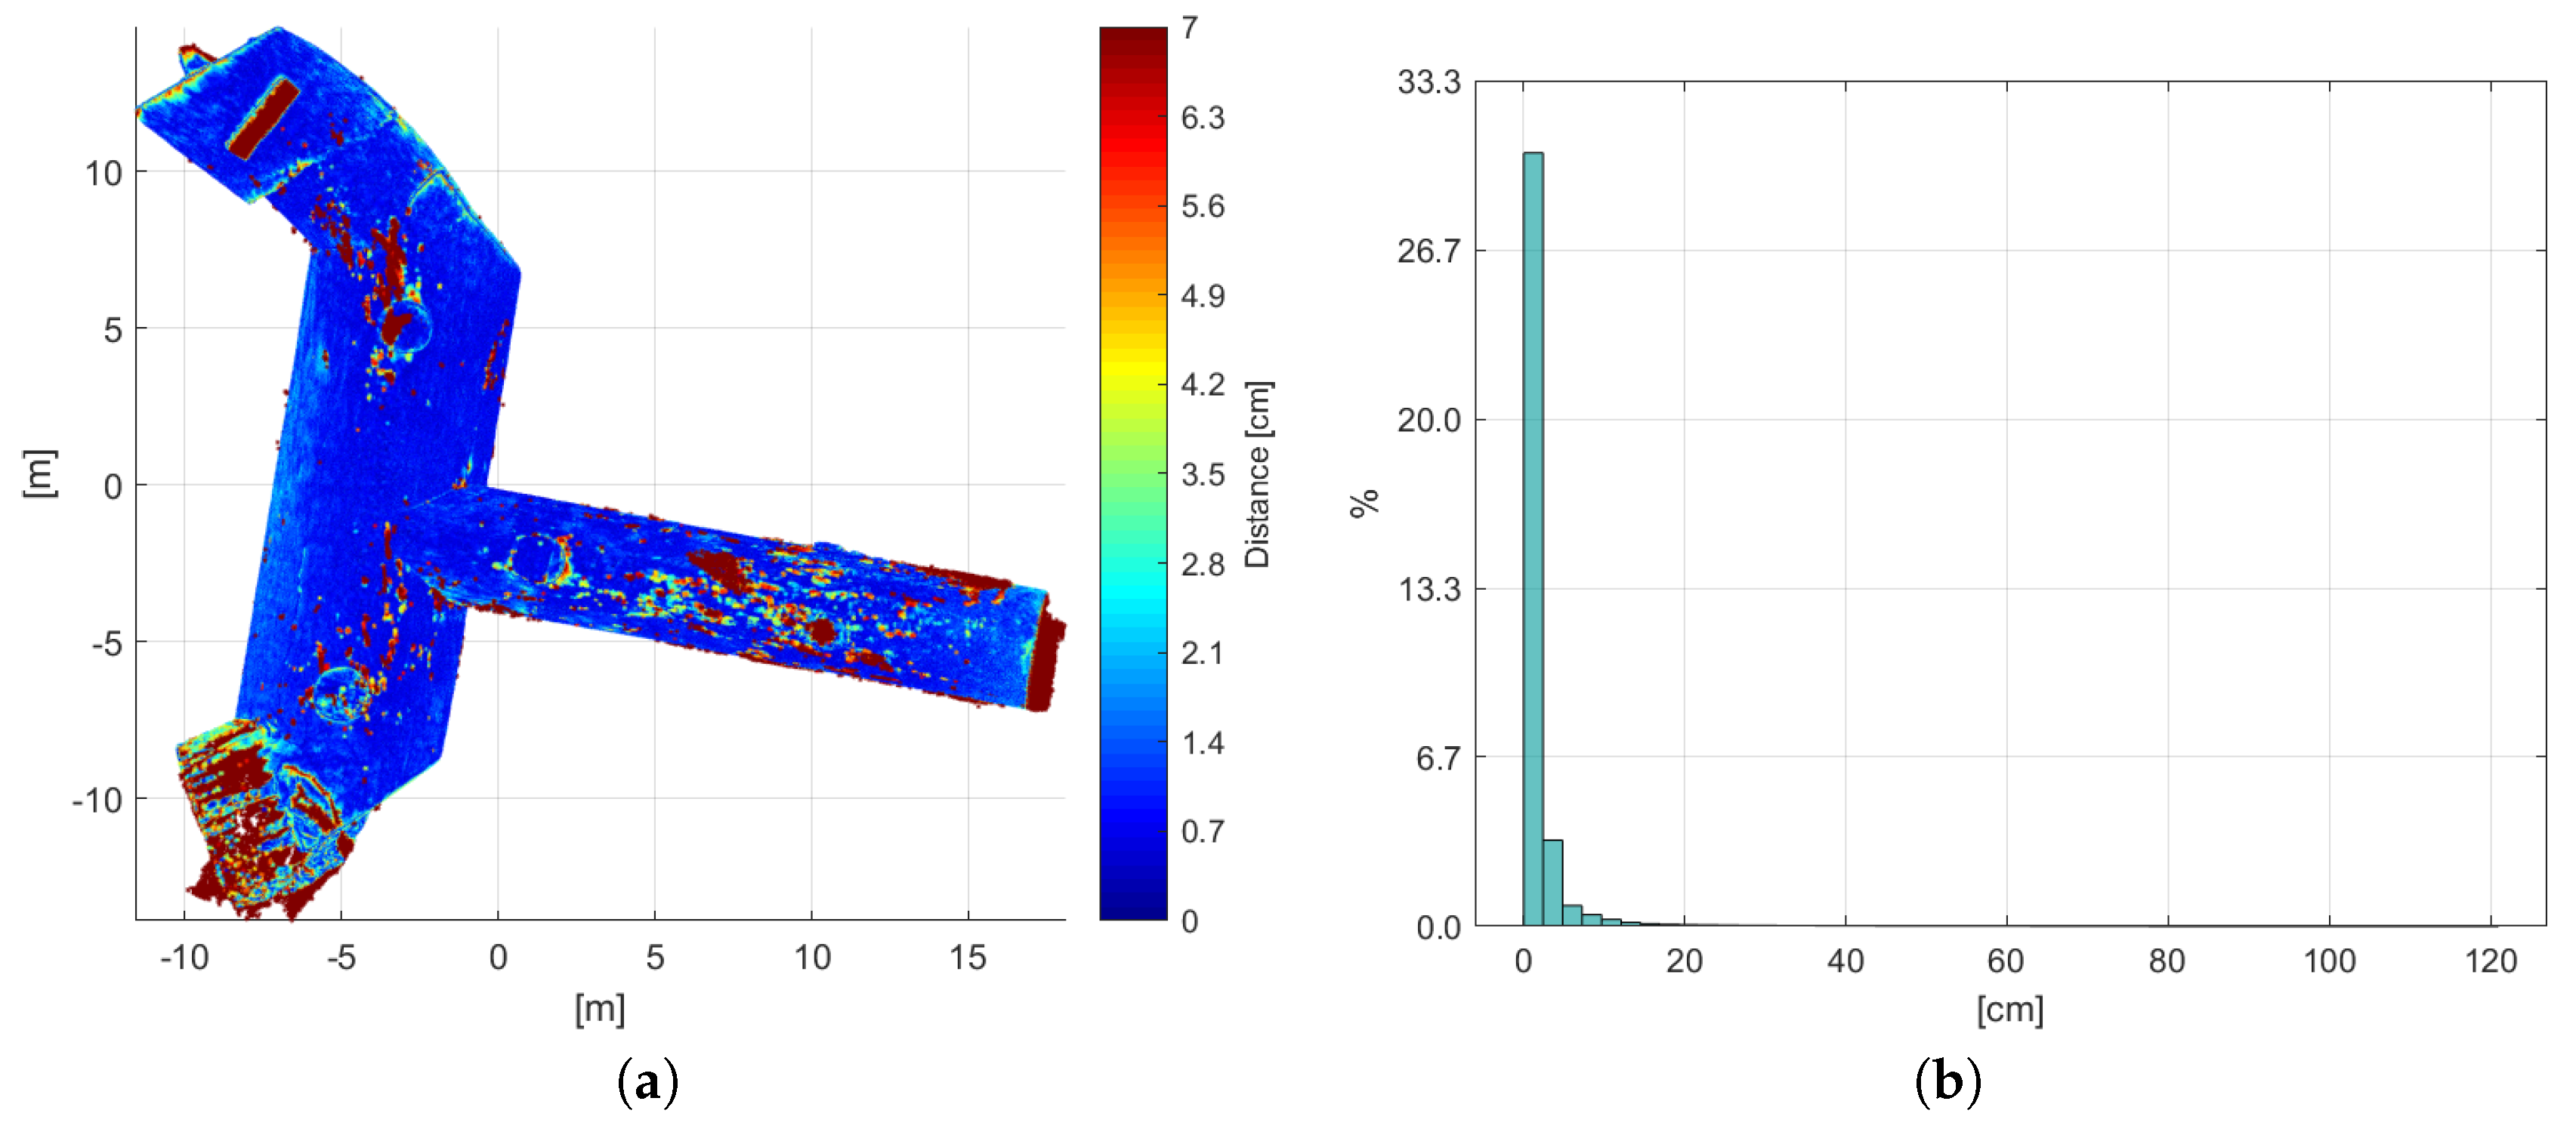
Figure 7. For comparison, the error map and distribution for Case (C) are shown in
Figure 8.
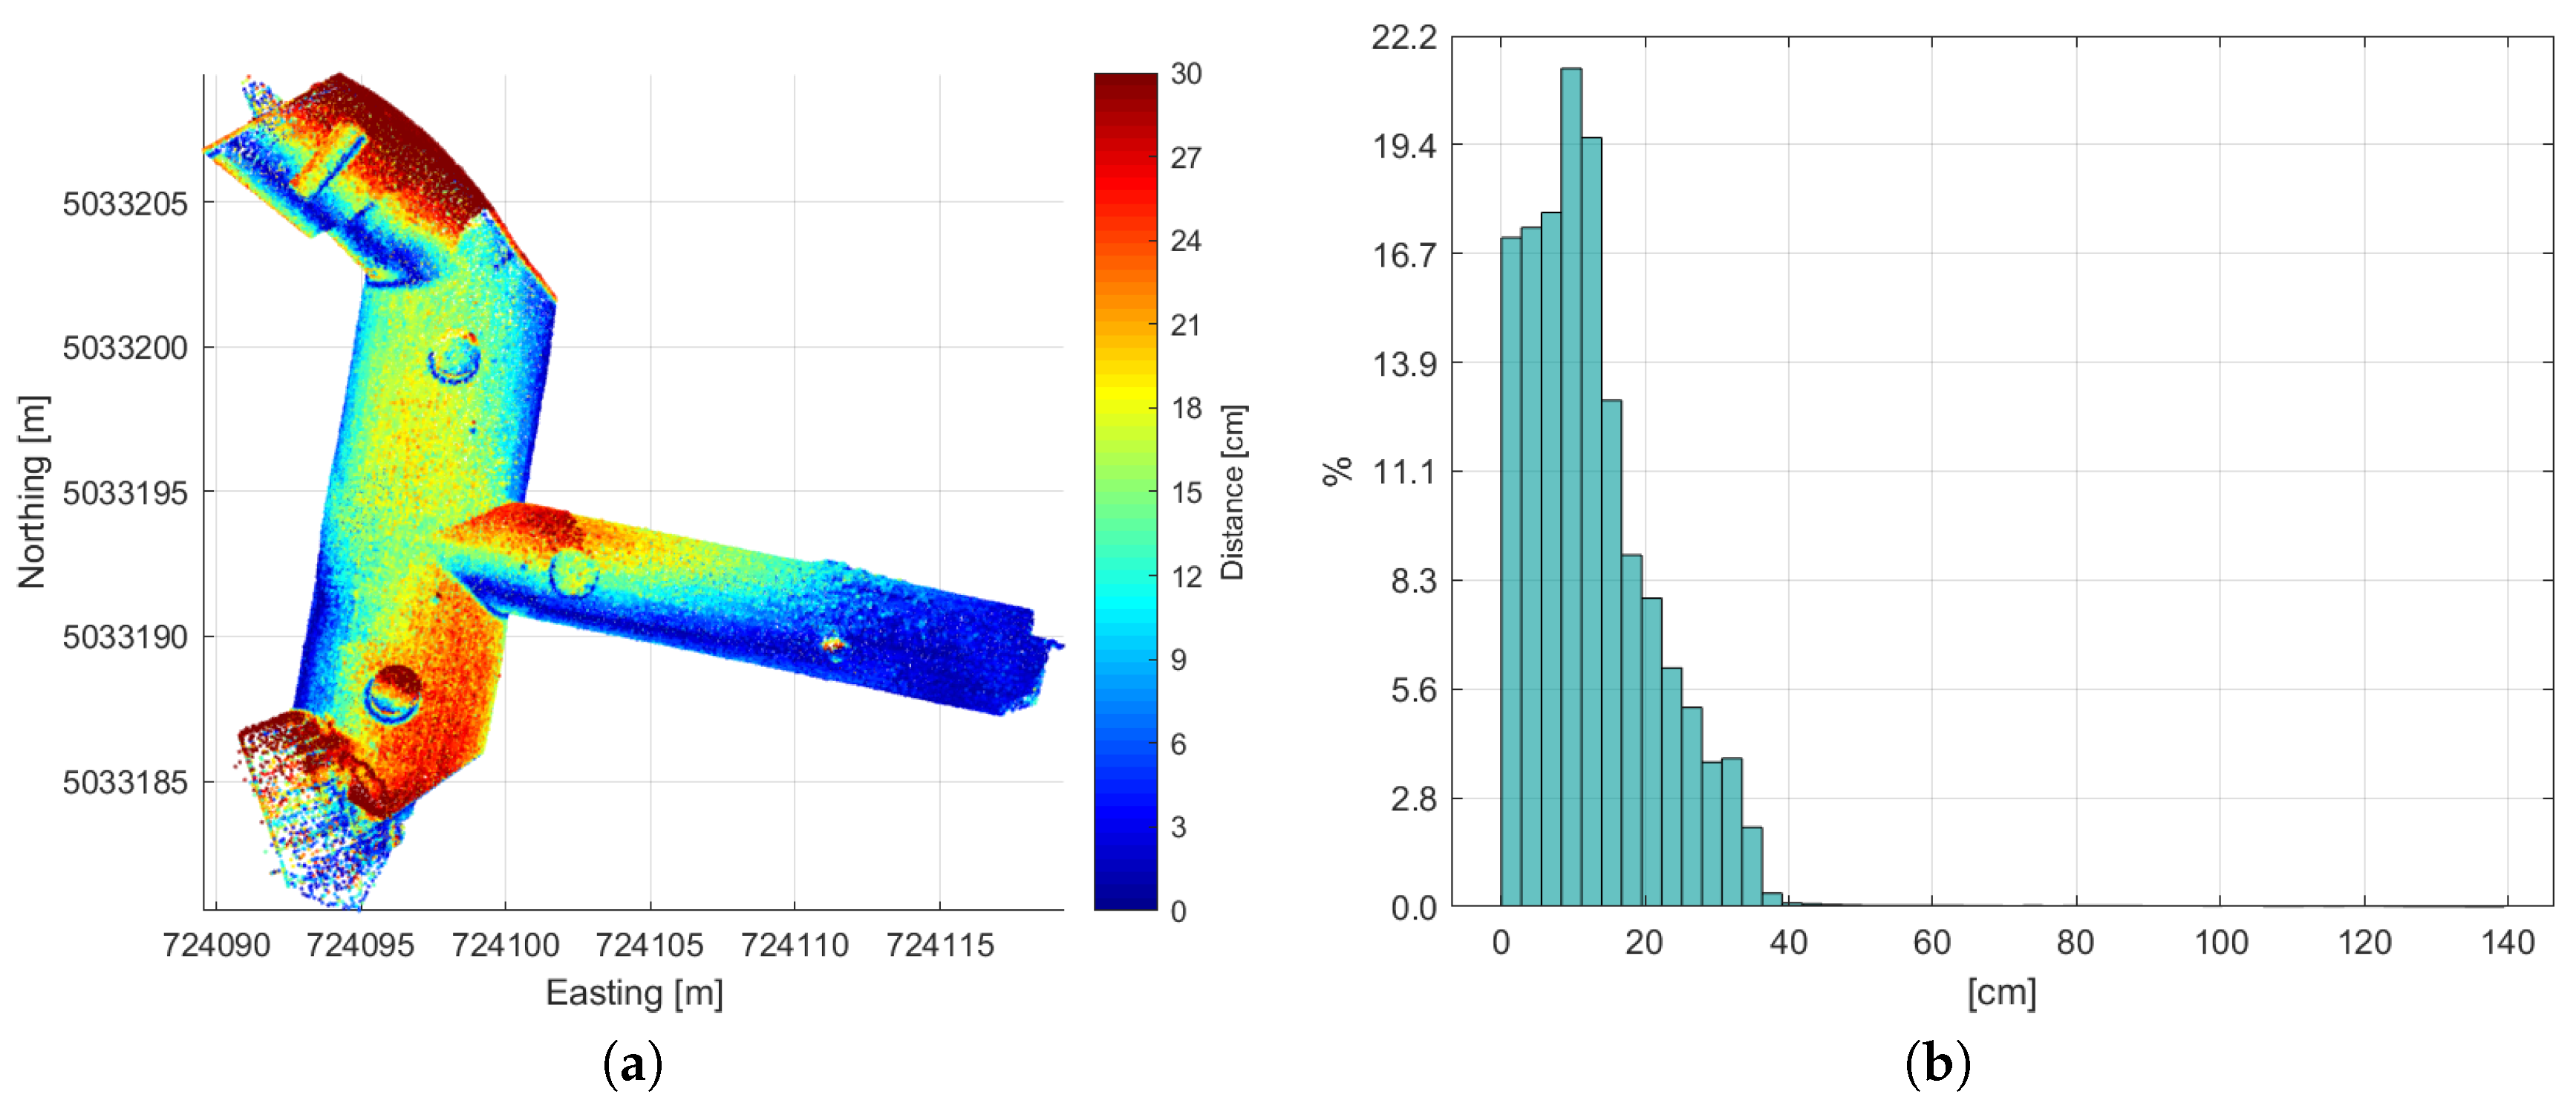
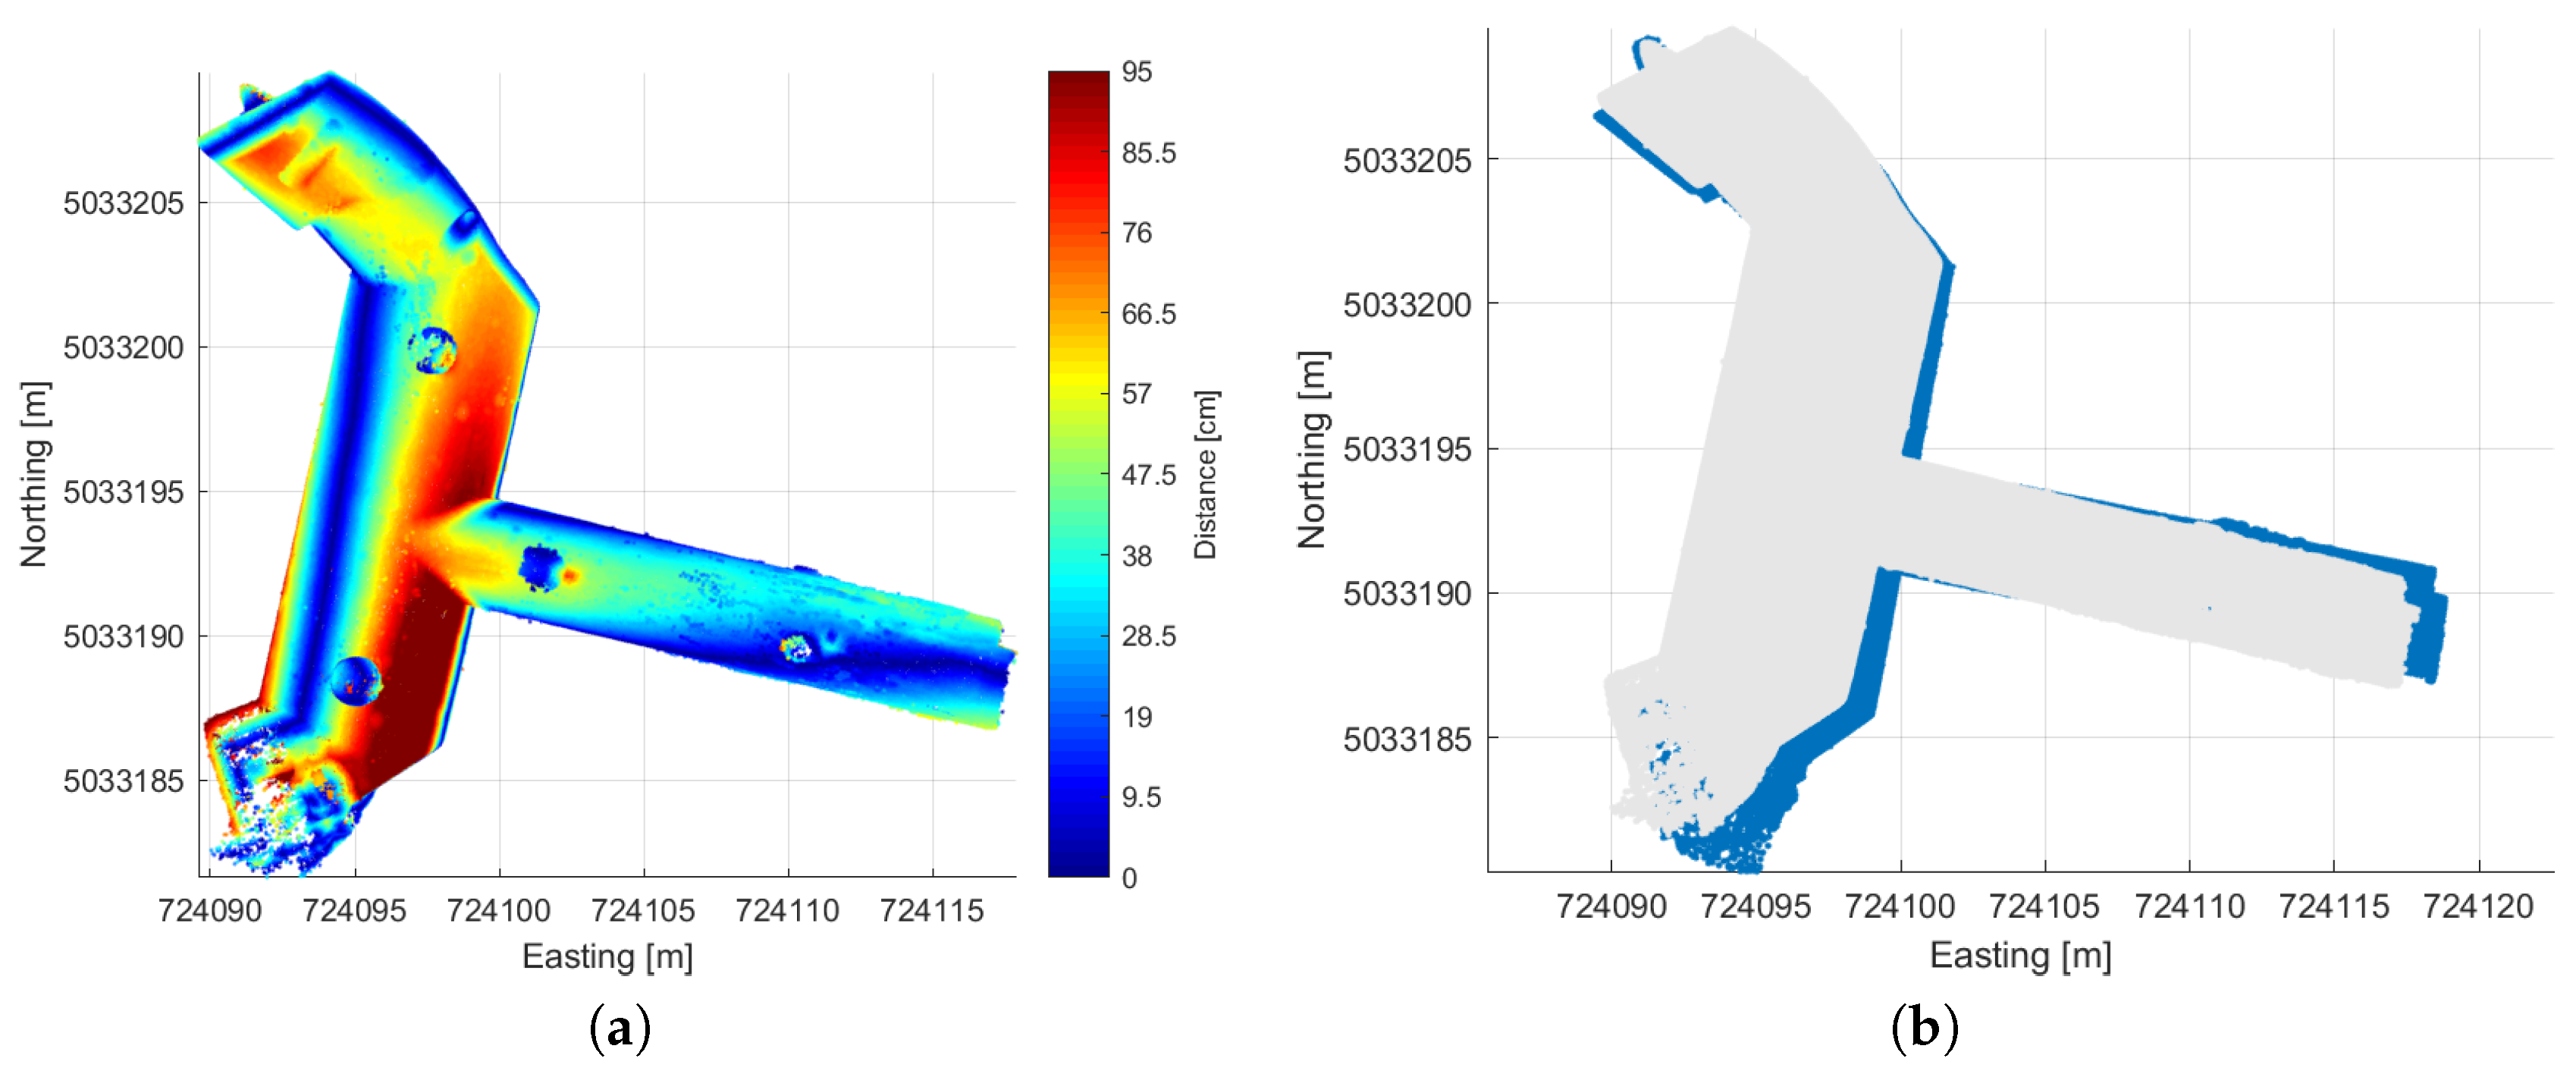
Figure 9a shows the map of point-to-point distances between TLS and photogrammetric point clouds in the WGS84 UTM32 coordinate system, i.e., Case (E). In order to ease the comparison,
Figure 9b reports a top-view of the two overlapping models (TLS (blue) and the photogrammetric ones (gray)).
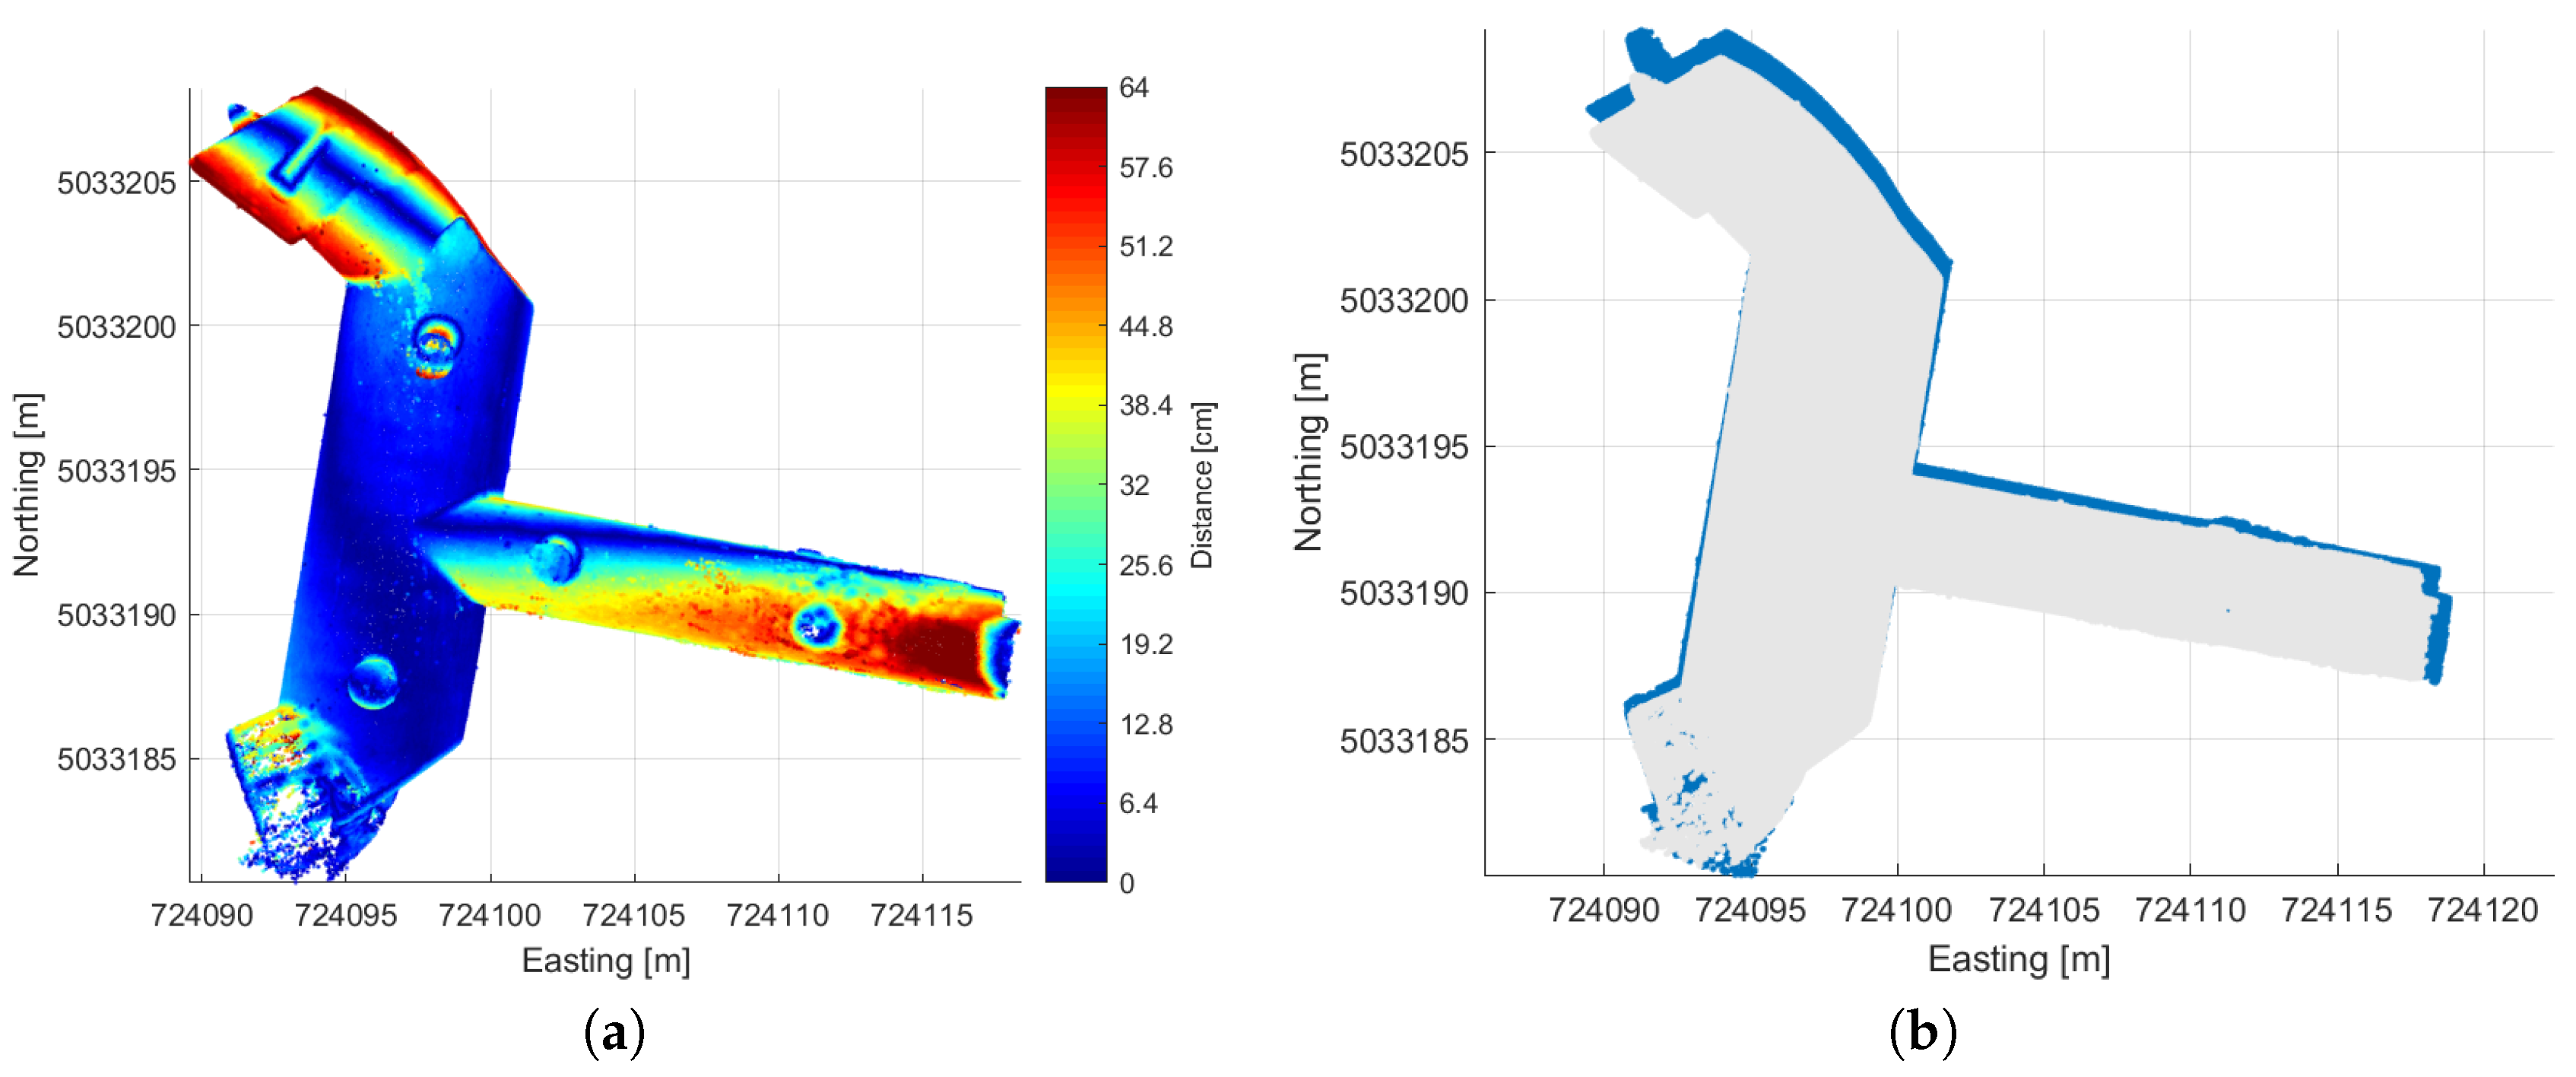
Finally,
Figure 10a shows the map of point-to-point distances between TLS and photogrammetric point clouds in Case (G).
Figure 10b reports a top-view of the two overlapping models (TLS (blue) and the photogrammetric ones (gray)).
5. Discussion
Table 1, obtained comparing different scans of the Leica Pegasus backpack, shows that RMS between the two georeferenced point clouds is 5.8 cm (absolute error case), whereas it reduces to 3.1 cm after registering them by using the ICP algorithm (relative error case). These results are actually in accordance with the Pegasus backpack specifications: 3 cm of relative accuracy indoors, whereas absolute position accuracy can go up to 50 cm for a ten-minute walk [
15].
Despite that at first glance the numerical results reported above might suggest that the relative error of the proposed photogrammetric system can be potentially smaller than the Pegasus backpack’s, actually this is apparently contradicted by examining the results obtained in Case (F) in
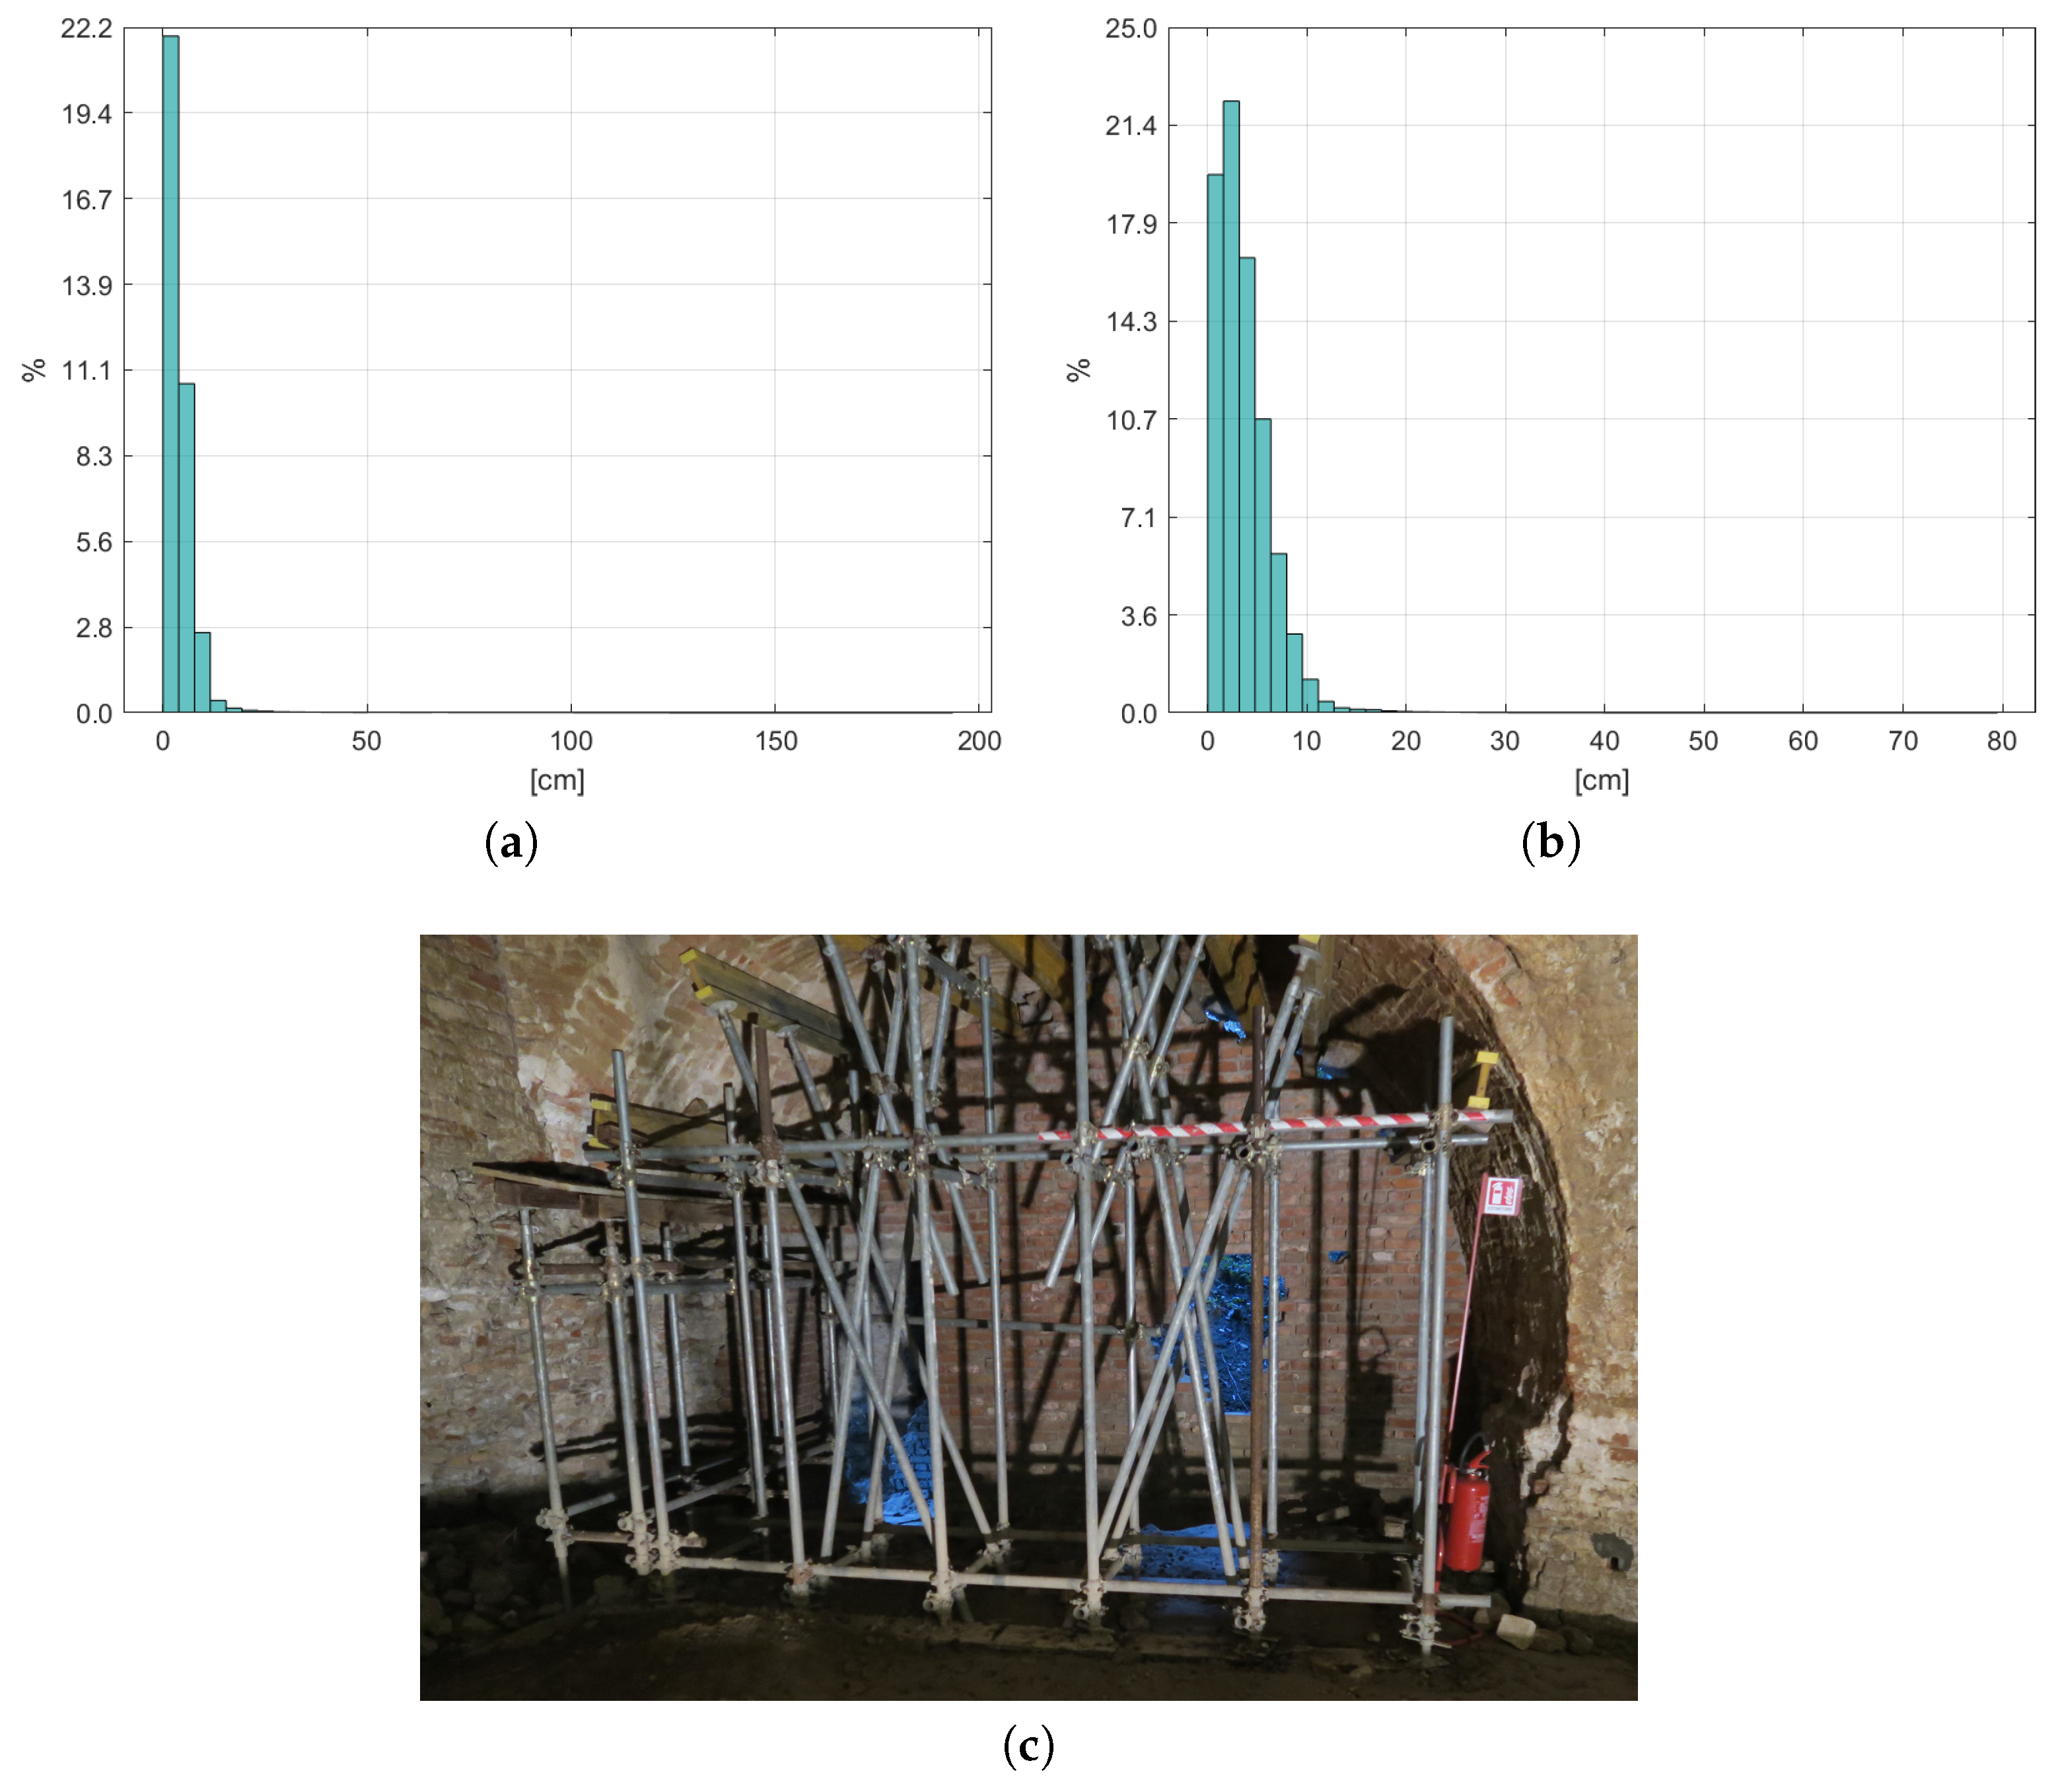
Table 4. Case (F) is analogous to (A), but for the anchor positions, which were surveyed with Leica TCR 702 Total Station in this case. It is clear that Case (F) should be considered as an optimal anchor positioning case, i.e., UWB self-positioning is expected to lead to worse (or equal) performance. Consequently, the fact that RMS for Case (A) is lower than in Case (F) (and lower than the backpack’s) should be considered just a matter of chance. Instead, Case (F) shows that the expected “best” relative RMS error for photogrammetry with UWB self-positioning (9.7 cm) is worse than that of the Pegasus backpack (5.8 cm).
Even though differences between the two Pegasus acquisitions are within the backpack’s official margins of tolerance,
Figure 3 shows that most significant differences are actually due to missing points in one of the two point clouds. Taking into account also laser scanning sensors’ positions and orientations in the backpack (
Figure 1b), this suggests that the completeness of the acquired dataset may depend also on the backpack’s orientation with respect to the objects of interest during the survey: varying backpack orientation shall be a preferable working condition in order to ensure the acquisition of more complete datasets.
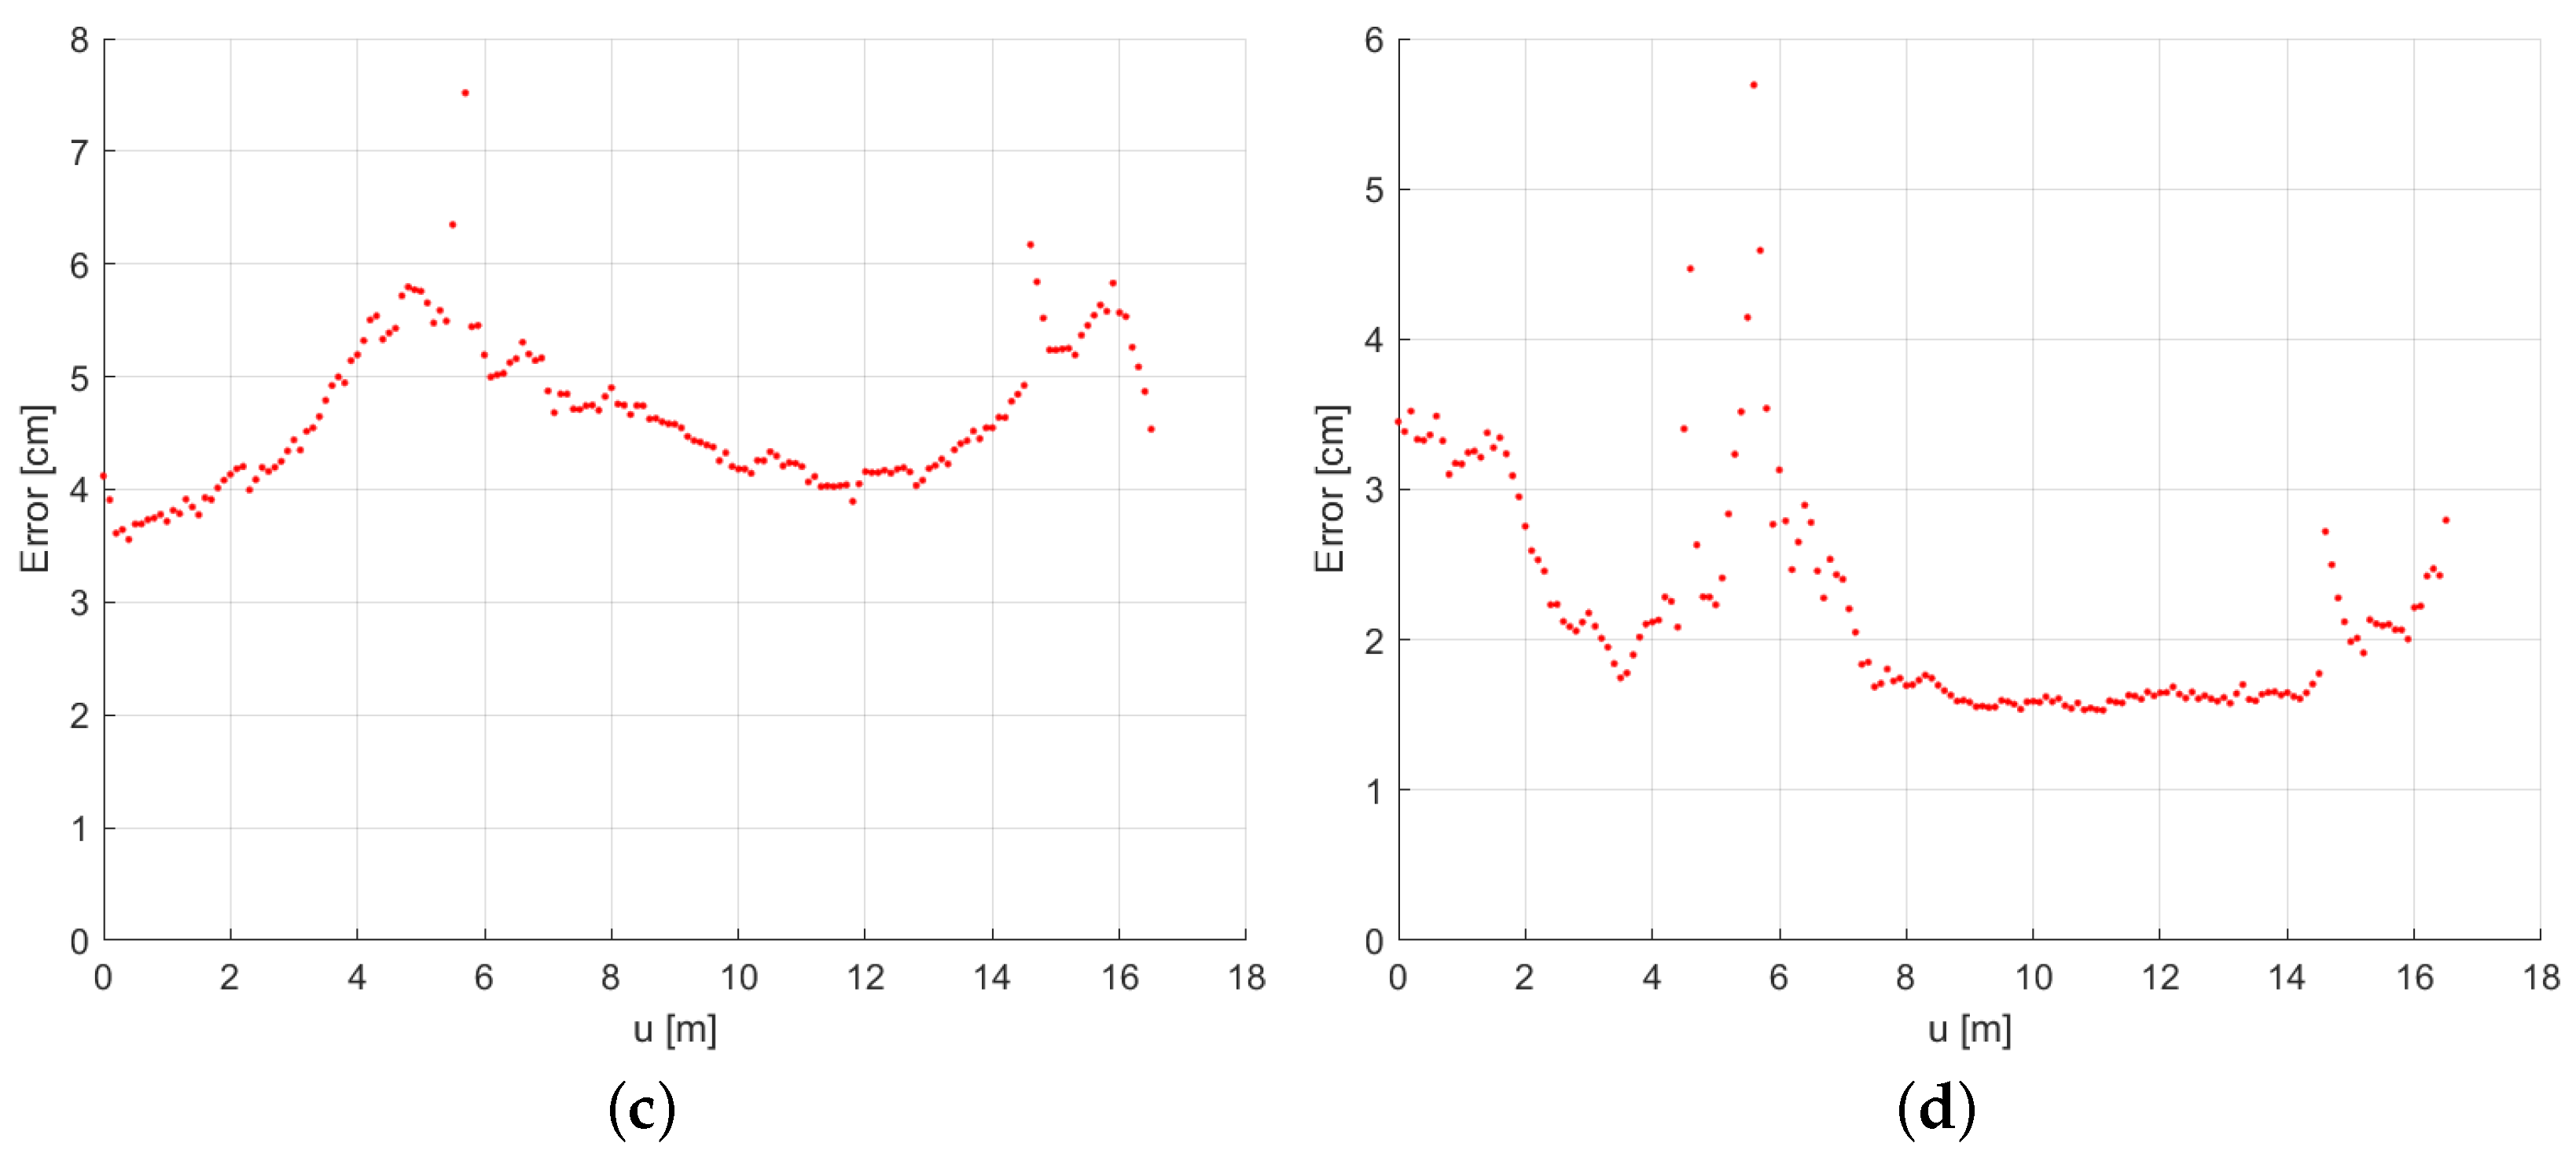
Comparing backpack relative RMS errors, the negative influence of the final part of the bastion left wing is clear (
Figure 4c): this area is intrinsically difficult to reconstruct, and both mobile mapping systems performed poorly in this part. This can be noted that even if actually this area has a more significant influence on the backpack error than on the photogrammetric one, which changes just from 6.1 cm to 4.6 cm by neglecting this area.
Comparison of the Pegasus 3D model with the reference one (TLS,
Section 2) confirms that Pegasus reconstruction is usually very accurate both in the relative (RMS = 4.6 cm, discarding the final part of the left wing) and in the absolute error case (RMS = 16.1 cm).
Comparison of Cases (A) and (C) in
Table 4 shows that UWB self-positioning in the low-cost photogrammetry presented in
Section 4 allows obtaining a good scaling factor estimate and consequently reconstruction accuracy close to the optimal one (RMS = 6.1 cm and 5.9 cm, in the self-positioning and in the optimal scale case, respectively). This shows that if georeferencing is not needed, photogrammetric reconstruction with UWB self-positioning might be considered instead of the use of control points, in order to easily obtain a quite reliable metric reconstruction.
Differently from the Pegasus, which maintains good performance in both relative and absolute error cases, performance degradation of the low-cost system of
Section 4 is significant when going from local to map coordinates (e.g., from relative (RMS = 6.1 cm) to absolute errors (RMS = 50.3 cm)). Two main factors cause such significant performance degradation: estimation error of GNSS point in
coordinates and the assessment of
orientation with respect to the georeferenced coordinate system. The first error is actually caused by the positioning estimation error of the UWB system, whereas the second is mostly due to IMU measurement errors and to calibration errors of the camera-UWB rover system.
The following observations are now in order:
The obtained results show that both the mobile mapping systems (Leica Pegasus and UWB-based photogrammetry) allowed producing accurate 3D models in the relative error case, with quite comparable accuracy.
Absolute accuracy (map coordinates) showed an apparent difference between the two portable systems (partially motivated by the use of a better IMU in the Leica Pegasus backpack with respect to the photogrammetric system proposed in this paper).
Results shown in this paper confirm the nominal characteristics of the Leica Pegasus backpack, as listed in its specifications [
15].
Given its acceptable weight and quite good portability, the Leica Pegasus backpack is a very good candidate to produce accurate 3D models in areas where the GNSS signal is not available or hard to reach with other instruments (the weight of Leica ScanStation C10 is similar to the Pegasus one; however, the Pegasus backpack is easier to carry by a human operator in certain difficult environments).
Given the great portability of a standard camera and of Pozyx devices, which are small (the maximum side size is 6 cm) and lightweight (12 g, approximately), the proposed system is particularly well suited for mobile mapping applications where instruments have to be carried for long periods by human operators.
In this paper, UWB self-positioning was performed assuming that anchors were distributed on a 2D planar surface. Future investigation will extend UWB self-positioning to more general cases.
Comparison of
Figure 6a,b shows that the proposed UWB self-positioning procedure led to quite significant errors on certain estimated anchor positions. This had a relatively small effect on the scale estimation error; however, it negatively influenced the north-vertical direction estimation used for georeferencing (comparison between Case (E) and (G) in
Table 4).
Calibration errors of the camera-UWB rover system affect the performance of the photogrammetric system in the georeferenced case. Improvements shall be investigated, in particular to improve the relative orientation estimation.
The synchronization procedure between camera and UWB acquisitions, presented in
Section 4, is clearly subject to estimation errors. A more robust synchronization shall be considered to improve the results.
Further future investigations will be dedicated to the reduction of photogrammetric error in the georeferenced case. Possible viable solutions that will be investigated are: including outdoor area in the photogrammetric reconstruction in order to make estimates of GNSS positions in the reconstruction more reliable, increasing the number of outdoor UWB anchors and/or GNSS points used for georeferencing the 3D model.
Both Leica Pegasus backpack and the photogrammetric system presented in
Section 4 allowed for significantly reducing the survey duration with respect to TLS. Most of the time of the backpack survey was spent on calibrating the backpack’s sensors, whereas data acquisition was very fast (a few minutes). The time to set up the UWB system was relatively fast (a few minutes), but image acquisition for photogrammetric reconstruction was longer than the backpack’s data acquisition.

 ,
, 

