A Self-Consistent Physical Model of the Bubbles in a Gas Solid Two-Phase Flow


1
School of Physical Science and Technology, China University of Mining and Technology, Xuzhou 221116, China
2
Key Laboratory of Coal Processing and Efficient Utilization, Ministry of Education, China University of Mining and Technology, Xuzhou 221116, China
*
Authors to whom correspondence should be addressed.
Appl. Sci. 2018, 8(3), 360; https://doi.org/10.3390/app8030360
Submission received: 27 November 2017
/
Revised: 5 February 2018
/
Accepted: 23 February 2018
/
Published: 2 March 2018
(This article belongs to the Special Issue Modeling and Simulations for Membrane Processes of Industrial Interest)
Abstract
:We develop a self-consistent physical model of bubbles in a gas solid two-phase flow. Using the Peng-Robonson state equation and a detailed specific heat ratio equation of bubbles, we obtain the kinetic equations of the bubbles on the basis of the Ergun equation, thermodynamic equations, and kinetic equations. It is found that the specific heat ratio of bubbles in such systems strongly depends on bubble pressures and temperatures, which play an important role in the characteristics of the bubbles. The theoretical studies show that with increasing height in the systems, the gas flow rate shows a downward trend. Moreover, the larger particles in the gas solid flows are, the greater the gas velocity is. The bubble sizes increase with the increasing heights of the gas solid systems, and then decrease. The bubble velocity is affected by the gas velocity and the bubble size, which gradually increase and eventually quasi-stabilize. This shows that gas and solid phases in a gas solid two-phase flow interact with each other and a self-consistent system comes into being. The theoretical results have exhibited important value as a guide for understanding the properties and effects of bubbles in gas solid two-phase flows.
1. Introduction
Gas solid two-phase flow is a complex flow system composed of gas and solid particles, and represents an important branch of fluid dynamics. Gas solid two-phase flows exist widely in nature and industrial productions. In this context, gas solid two-phase fluidization separation, for example, has been extensively researched and developed, with a wide range of applications and high selection efficiency. It is an efficient separation method that has been gradually applied to industrial production [1,2]. With gas article fluidization separation, the system is filled with uniform air flows in the fine particulate matter media bed, which creates particle medium fluidization and forms the gas solid suspended matter with certain density and fluid properties. The theoretical analysis of the two-phase flow is much more difficult than for single-phase flow because the general differential equations describing the two-phase flow have not yet been established. Generally, a simplified two-phase theoretical model can be applied in such systems. One of the models considers that the system is a continuous medium which is a mixture of two phases, where the concepts and methods of single-phase flow are still suitable for two-phase flow. The other is called the separated model, which considers that the concept and method of the single-phase flow can be respectively used in each phase of the two-phase system, while the interaction between the two phases is included [3,4]. The second type of model has been widely associated with physical applications [5].
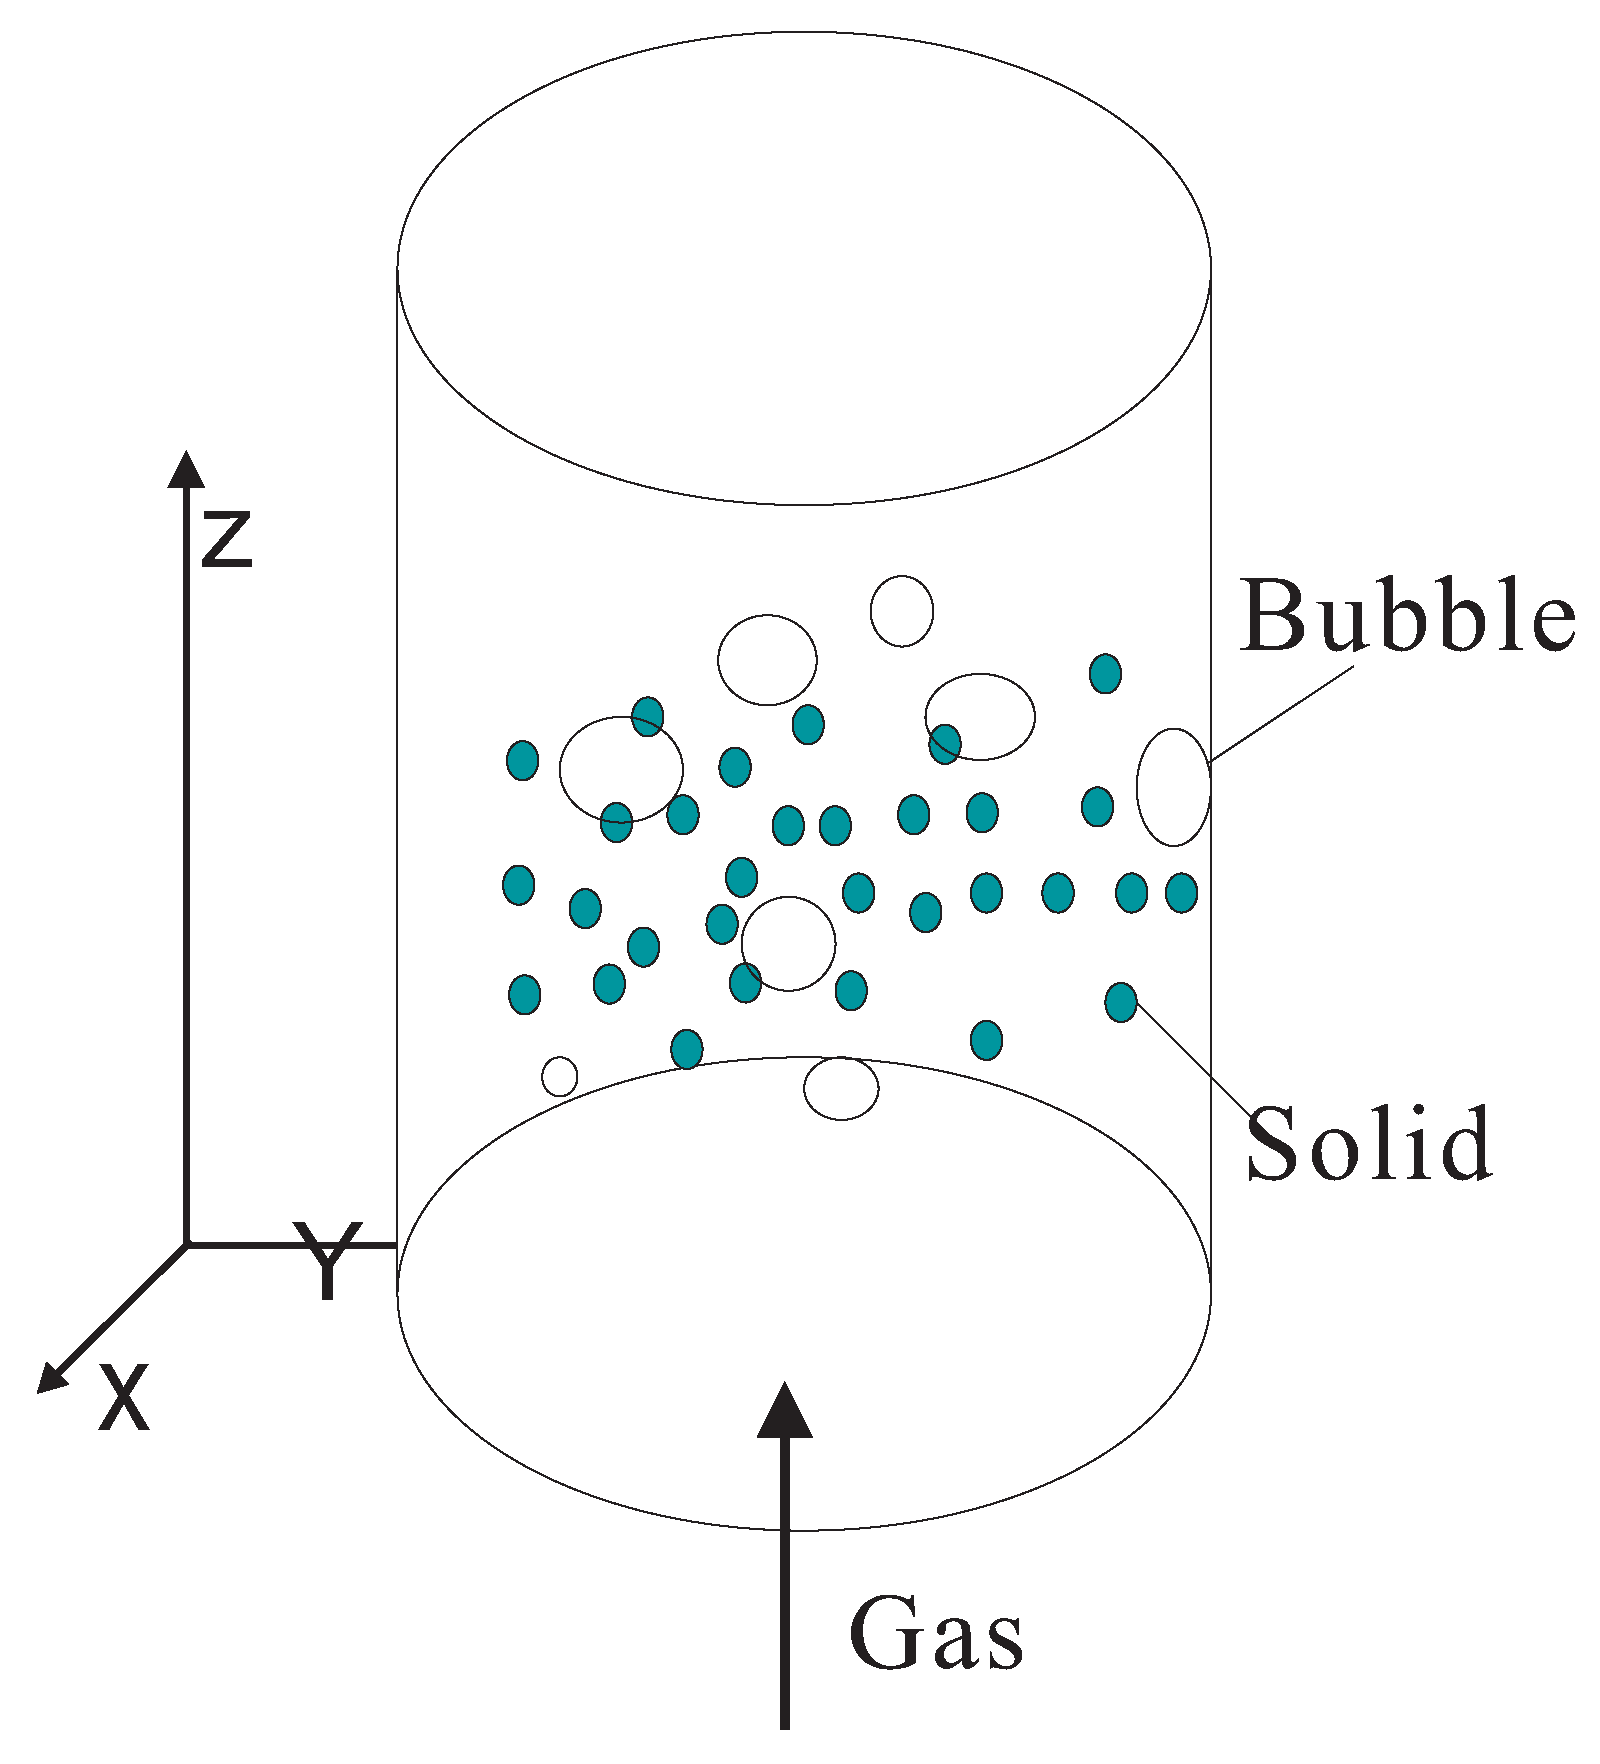
In the gas solid two-phase flows, the mixture of the gas and the particles is not uniform and time-dependent, with the two phases existing in the gas solid two-phase flows (see Figure 1). One is a continuous phase, composed of gas and particles, and is called the dense phase or emulsion phase; the other is a discontinuous phase appearing in the bubble state, and is called the bubble phase. When the quantity of gas flowing in the gas solid system is greater than the air flow required for the critical fluidized state, the excess gas can be in the form of bubbles. Bubble dynamic behavior is responsible for the most basic characteristics and phenomena in the gas solid two-phase flow system. This is significant for the understanding and study of the properties of gas solid two-phase flow systems [4]. The study of bubbles in gas solid two-phase flow forms an important part of the field of fluidization state [6]. The pressure drop, height, swelling degree, uniform mixing of the gas-solid two-phase flow, and stratified separation of particles in the gas-solid two-phase system strongly depend on the bubbles. The bubble size and rising velocity are important factors which affect the fluidization stability, the dynamics of particles, and the separation densities of fluidized beds [7]. The bubble phase and the dense phase transmit the heat and mass to each other, and then the gas-solid two-phase flows are not uniform. The growth of bubbles in the gas-solid two-phase flow can seriously affect the uniform stability of fluidization, affect the distribution of solid phase particles, and affect the state of the whole two-phase flow. As a result, research into bubble properties in the gas-solid two-phase flow system represent some of the most important and basic studies in the field [8]. Van Lare et al. developed a statistical theory to study the properties of bubbles in gas-solid systems using capacitance probe measurement experiments, and obtained consistent results between the experiments and theories [9]. Ichiki et al. studied the bubble phase and slugging phase in a fluidized bed by numerical simulations. It was found that the convective motion reveals a stronger effect on the bubble phase than on the slugging phase [10]. Farshi et al. calculated the size of bubbles in the gas-solid fluidized bed, and found that the Mori-Wen-Rowe equation is a better choice for the study of bubble size, as compared with the other theories [11]. Through the optical experimental study, Valverde et al. found that bubbles begin to be produced after fluidization of the particles, and the interactions between the hydro-kinetic force and the particles can suppress the generation of bubbles for sufficiently large particles in the two-phase flow [12]. Glasser et al. studied the relationship between the bubbles and the clusters in the gas-solid two-phase flow and found that they are similar phenomenons in the s systems [4]. Muller measured the bubble phenomenon in a two-phase system using a magnetic resonance imaging experiment in real time for the first time, and studied the bubble size, velocity, etc. in detail [13]. The nonlinear characteristics of the gas-solid two-phase flow and the relationship with bubbles were studied by Homsy et al. [14]. Zahra researched the nonlinear dynamic characteristics of the gas-solid system using the two phase theory [15]. Komatsu and Hayakawa investigated the nonlinear dynamic characteristics of the fluidized states. Their results show that solitons, like waves, exist in the system and play an important role in the system. This indicates that the nonlinear characteristic has an important role and influence on the systems [16]. At the South Korean Energy Research Institute, the bubble properties of the gas-solid fluidized bed system were studied by Choi et al. using electronic resistivity probe experiments, and a change in bubble size with height was obtained [17]. Al-Zahrani and Daous established a simplified model to predict the average velocity of bubbles rising [18].
The bubble phenomenon represents one of the most basic physical phenomena of the gas-solid two-phase flow system, and relevant scholars worldwide have paid much attention to the research of bubbles in the gas-solid two-phase flow. It is noted that at present, studies mainly focus on the improvement and research of productive processes in the actual systems. However, basic theoretical research is relatively lacking [19]. The high-speed dynamic systems have been widely used to analyze the bubble behaviors of the gas-solid system in experiments. With limited experimental approaches, we can observe and analyze the behavior of the system at the boundary surface but we cannot go deep into the internal system for detailed analysis and research. Based on the experimental results, the relatively simplified models can be fitted out, and are usually based on fluid mechanics or continuum medium theory. The numerical simulation can also be used to analyze the motion characteristics of bubbles. Due to a certain gap between the numerical simulation models and the existing experimental conditions, the simulation results can only partly explain the experimental results. In this work, we hope to understand the the gas-solid two-phase flow system more from the point of view of physics. Using thermodynamics and fluid mechanics theory, we establish a new bubble physical model. The dynamic properties of bubbles in the gas-solid two-phase flow system as shown in Figure 1 are studied using the self-consistent theoretical method. Through establishing and researching the bubble thermodynamic equation, we examine the properties of bubbles in the gas-solid two-phase flow system on the basis of Ergun and bubble dynamics equations.
2. Theoretical Model
The state equation of the general thermodynamic systems can be expressed as or , where is the density of a system, P is the pressure, and T is the system temperature. The state equation is very important for general thermodynamic systems. With this equation, the other thermodynamic properties which cannot be measured by experiments directly can be obtained. The ideal gas state equation can be represented as , while for the real gas (thermodynamic systems), the state of equation can be written as . Here, R is the gas constant, and is called the compression coefficient, which indicates the deviation from the ideal gas state equation. The ideal gas model is a theoretical model which can be used as one of the criteria to measure the real gas state equations, which can be used for approximate estimations in a practical application. When the pressure is close to zero or the volume is close to infinity, any real gas state equations should be reduced to the ideal gas equation. A gas-solid two-phase flow is a complex thermodynamic system, and thus the theoretical model of the system simplified as an ideal system is no longer applicable.
2.1. PR Equation and the Heat Capacity Ratio of Bubbles
None of the real thermodynamic systems conform completely with the law of ideal gas. The deviation depends on the pressure, the temperature, and the gas properties, especially with respect to the degree of difficulty of gas liquefactions. The gas-solid two-phase flow bubble systems contain not only gas interacting between air molecules, but also partial solid particles. With the change of ambient pressures and temperatures, the proportion of the particle phase and the gaseous phase varies. Therefore, the system is a non-ideal complex system, which needs the non-ideal state equation for study. The non-ideal gas state equation is widely used in engineering, and includes the Van der waals equation, the Redlich Kwong (RK) equation, the virial equation and so on. When the RK equation is used to calculate strong polar compounds, it causes large deviations and is thus rarely used to calculate liquid pressures, volumes, and temperatures. The virial equation is not a good match for the polar compounds, and gas-solid two-phase flow cannot be described by a set using the virial coefficient [20]. There are large deviations for the RK and Redlich Kwong Soave (RKS) equations in calculating the critical compressibility factor and liquid density. However, the Peng-Robonson (PR) equation makes up for the obvious deficiencies, with a better accuracy in the calculation of saturated vapor pressure, saturated liquid density, and other aspects, especially in calculations of the multiphase fluid systems, which are some of the most commonly used equations in engineering design calculations. In this paper, the PR equation is developed to investigate the gas-solid two-phase flow [21]. In this system, the PR equations, which are corrected by Stryjek and Vera, are proposed to calculate the bubble properties of the gas-solid two-phase flow system [22]. The specific form of the PR equation is
where , , , , P is the system pressure , R is the gas constant (J· mol· K), V is the molar volume (m mol), T is the absolute temperature (K), is eccentric factor with the zero dimension, is critical temperature, and is the critical pressure [22]. The gas-solid two-phase flow system is a thermodynamic system consisting of a large number of solid particles and bubble phases, and the internal energy of the thermodynamic system is a state function of the system. According to the internal energy differential formula, it is expressed as
where U is the internal energy of system, and is the constant volume molar specific heat of the system. The differential form of the internal energy of the non-ideal thermodynamic system can be given by combining the thermodynamic state equations, which reads
According to the first law of thermodynamics (), in the gas-solid two-phase flow system, the internal energy of gas changes through the quantitative non-ideal gas via the adiabatic free expansion process. This occurs outside for the gas in the adiabatic process with .
Combined with the differential form of internal energy of non-ideal gas, we can obtain
In order to avoid tedious calculus, the PR equation can be simplified as , where the deviation from the non-ideal gas to the ideal gas is attributed to the deviation factor . After solving the state equation for the differential coefficient, . According to the definition of the constant-volume molar-specific heat , the expression can be obtained. Thus, the differential equation of the state equation can be expressed as
Combining with the differential formula of the internal energy, we acquire
Furthermore, we consider the Newton velocity formula , where is the propagation velocity of the sound wave in the system, and is the medium density. This process can be approximately regarded as a quasi-static adiabatic process during acoustic wave propagation, . Hence, the partial derivative of the equation is the partial derivative under the adiabatic condition, and is regarded as the volume of unit molar mass. By Equation (6), it can be written as
Here, is the density of bubble systems, which can be calculated by (kg/m), and the speed of sound with m/s. Considering the above calculations, the heat capacity ratio of the gas-solid two-phase flow bubble system is obtained as
It is clear that the heat capacity ratio is very different from the previous studies, where it is not a constant, but a function of the system pressures and the temperatures.
2.2. Gas Velocity Equation in the Gas-Solid Two-Phase Flow System
In the gas-solid two-phase flow system, the bubbles slowly rise from the bottom of the whole system as shown in Figure 1. This is similar to the motions of bubbles in the water [23]. Consequently, our research focuses on the characteristics of bubbles in the direction Z of the motion with a steady state in the X-Y plane. Based on the results of the previous results and the experiments, Ergun obtained the comprehensive expression that the pressure drop of the gas-solid system decreases with the change of Z, which reads
is the spherical degree of solid particles. The first item of the Equation (9) at the right is the viscosity term, and it takes the leading role when the flow rate is low. The second item of Equation (9) at the right is the inertia term, which plays a major role when the flow rate is higher and the flow is turbulent. is the void content in the gas-solid two-phase flow which represents the proportion of space occupied by the gas and the space occupied by the system. u is the gas velocity of the gas-solid two-phase flow. is the solid particle diameter. is the density of the gas-solid flow. is the viscosity of this flow. The critical fluidization velocity is the fluidized velocity where the gas-solid flow pressure drop is equal to the weight of the solid particles, which can be derived from the Ergun equation for the minimum fluidization conditions. The Ergun Equation (9) can be written as
Here, , and . As a result, we can obtain the equation, which is
The critical fluidization velocity is obtained as
where g is the acceleration of gravity, and is the solid particle density. The relationship of the solid particle density , the density of the entire system , and the gas/air density is . There are several drag models proposed based on analytical [24,25], experimental [26], and numerical [27] approaches. In the current study we use Ergun’s model [28] which has been widely used in fluidized beds investigations. Moreover, the average bubble diameter of the gas-solid two-phase flow in the Mori and Wen models can be expressed as a function of the bubble rise height Z, with the maximum bubble diameter of . In the whole two-phase flow system, bubbles rise slowly from low to high, and the size diameter rising along the height of Z is [28]
is the average area of each circular pinhole.
2.3. Bubble Size and Velocity Equation
For such a thermodynamic system with the adiabatic model, the pressure inside the bubbles is related to the initial state of the bubbles and the volume of the bubbles. Therefore, the relationship between the bubble pressure P and the volume V is [19]
where and are respectively the initial pressure and volume of bubbles, and is the saturated pressure. The simulation model of the bubbles is approximately considered as the sphere model. The relationship of the bubble volume V with the rising velocity u and the height Z is obtained through the formula of sphere volume and diameter size, which is
Based on the above deductions, u as the function of Z follows, we have
Through self-consistent solving Equations (11), (12) and (14)–(16), the change of the air velocity u with regard to the rising height Z in the gas-solid two-phase flow can be obtained as shown in Figure 1. Then, the distribution of the bubble diameter , as well as the distribution of the velocity of characteristic bubbles at the specific height Z in the gas-solid two-phase flow are as follows:
In the gas-solid two-phase flow system, the distributions and properties of the solid phase lead to the pressure and temperature variations of the bubble phase, and then result in the changes of the bubble heat capacity ratio . Moreover, the changes of the heat capacity ratio affect the distributions and variations of the solid phases, and thus strongly influence the property of the gas-solid two-phase flow system. The solid and gaseous phases in the system represent a self-consistent system, and mutually affect and restrict each other.
3. Results and Discussion
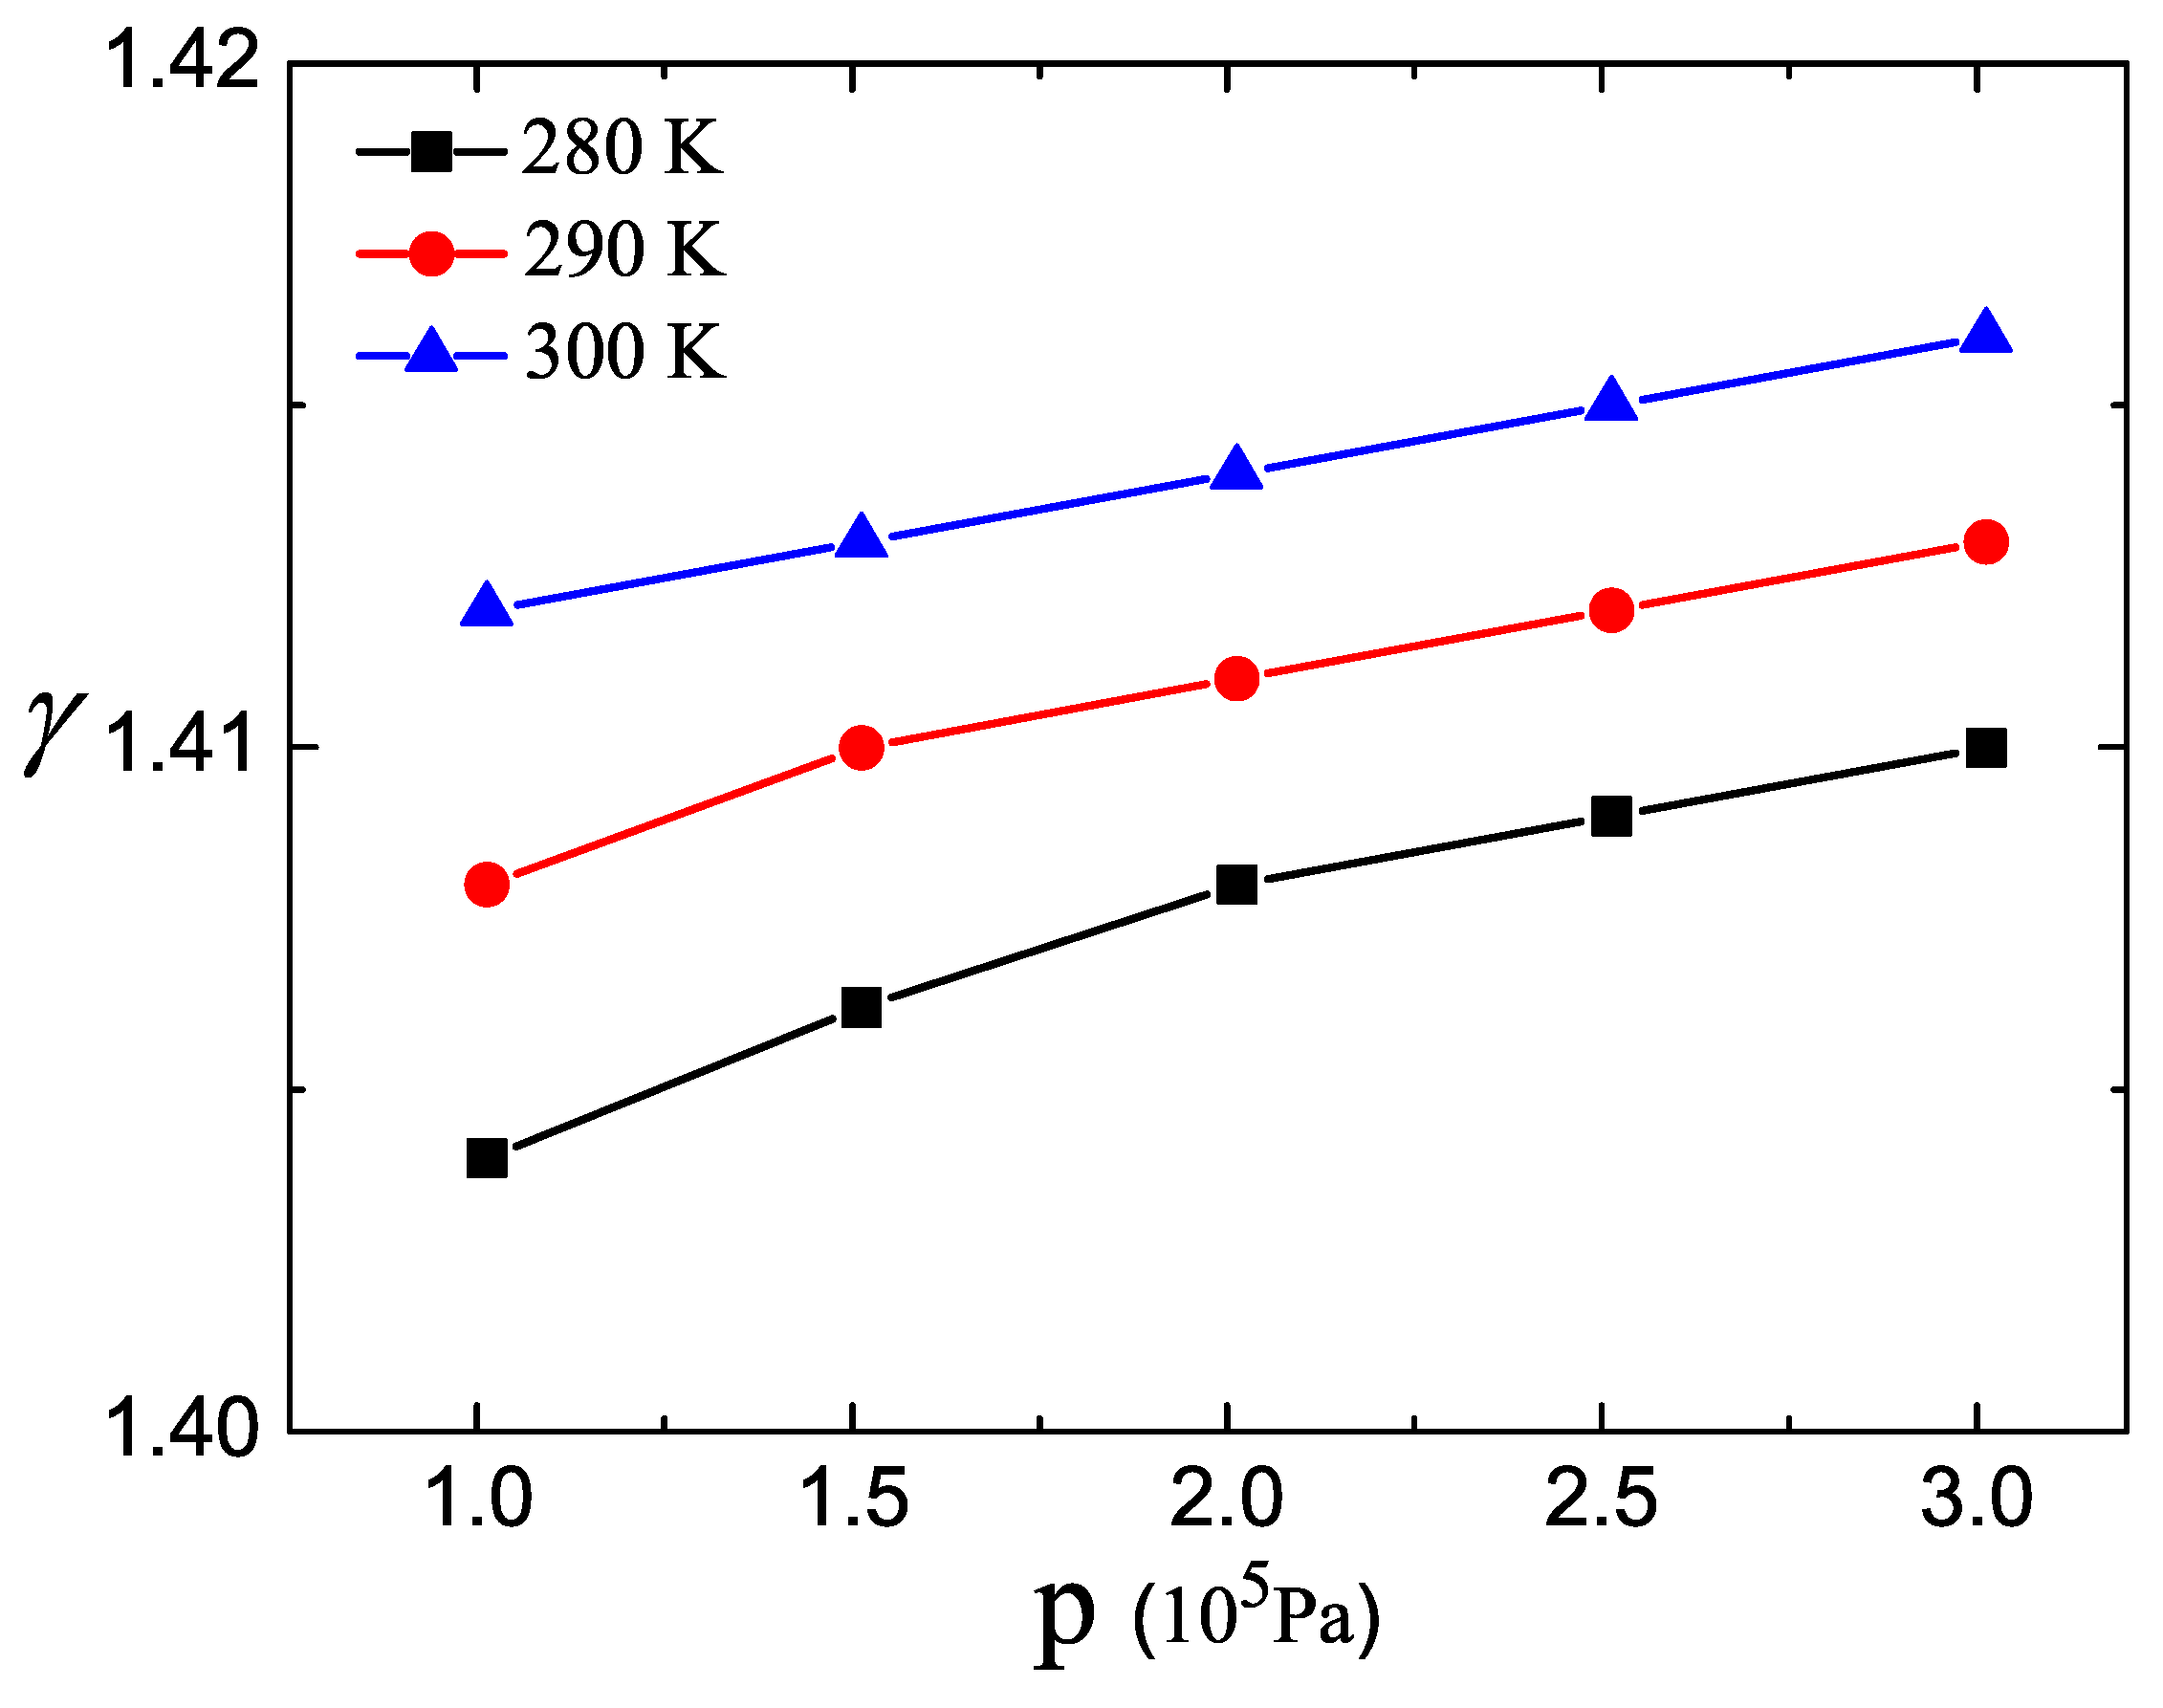
Equations (8) and (11)–(16), form self-consistent systems of equations. For a given Z, initial pressure , and initial volume , the gas velocity u, bubble size , and the change law of the bubble rising velocity are simulated through the self-consistent calculations in the gas-solid two-phase flow systems as shown in Figure 1. Figure 2 shows the heat capacity ratio of the bubble systems in the gas-solid two-phase flow as the function of the pressure P for the different temperatures T. It can be seen from Figure 2 that the heat capacity ratio of the bubbles increase with the increasing of pressure P at a fixed temperature T. It shows that our numerical result is obviously different from that in the ideal gas systems, which is a function of the temperature and the pressure for our mode. The heat capacity ratio in ideal gas system is a constant (1.4) and the value does not change with the state parameters of the systems. In the past, when studying the characteristics of bubbles, the heat capacity ratio has usually been regarded as the ideal gas constant [23]. We obtain the expression of specific heat capacity of the gas-solid two-phase flow system through establishing a non-ideal gas model. With the increasing temperature, the heat capacity ratio also increases clearly. Meanwhile, it can be clearly seen that Equation (16) is a complicated exponential root and the index variety can lead to the fundamental changes of the equation. Moreover, the small changes of the heat capacity ratio also lead to extensive changes of u, , and . As a result, the bubble system heat capacity indicates an important effect on the properties of the overall bubbles in the gas-solid two-phase flow.
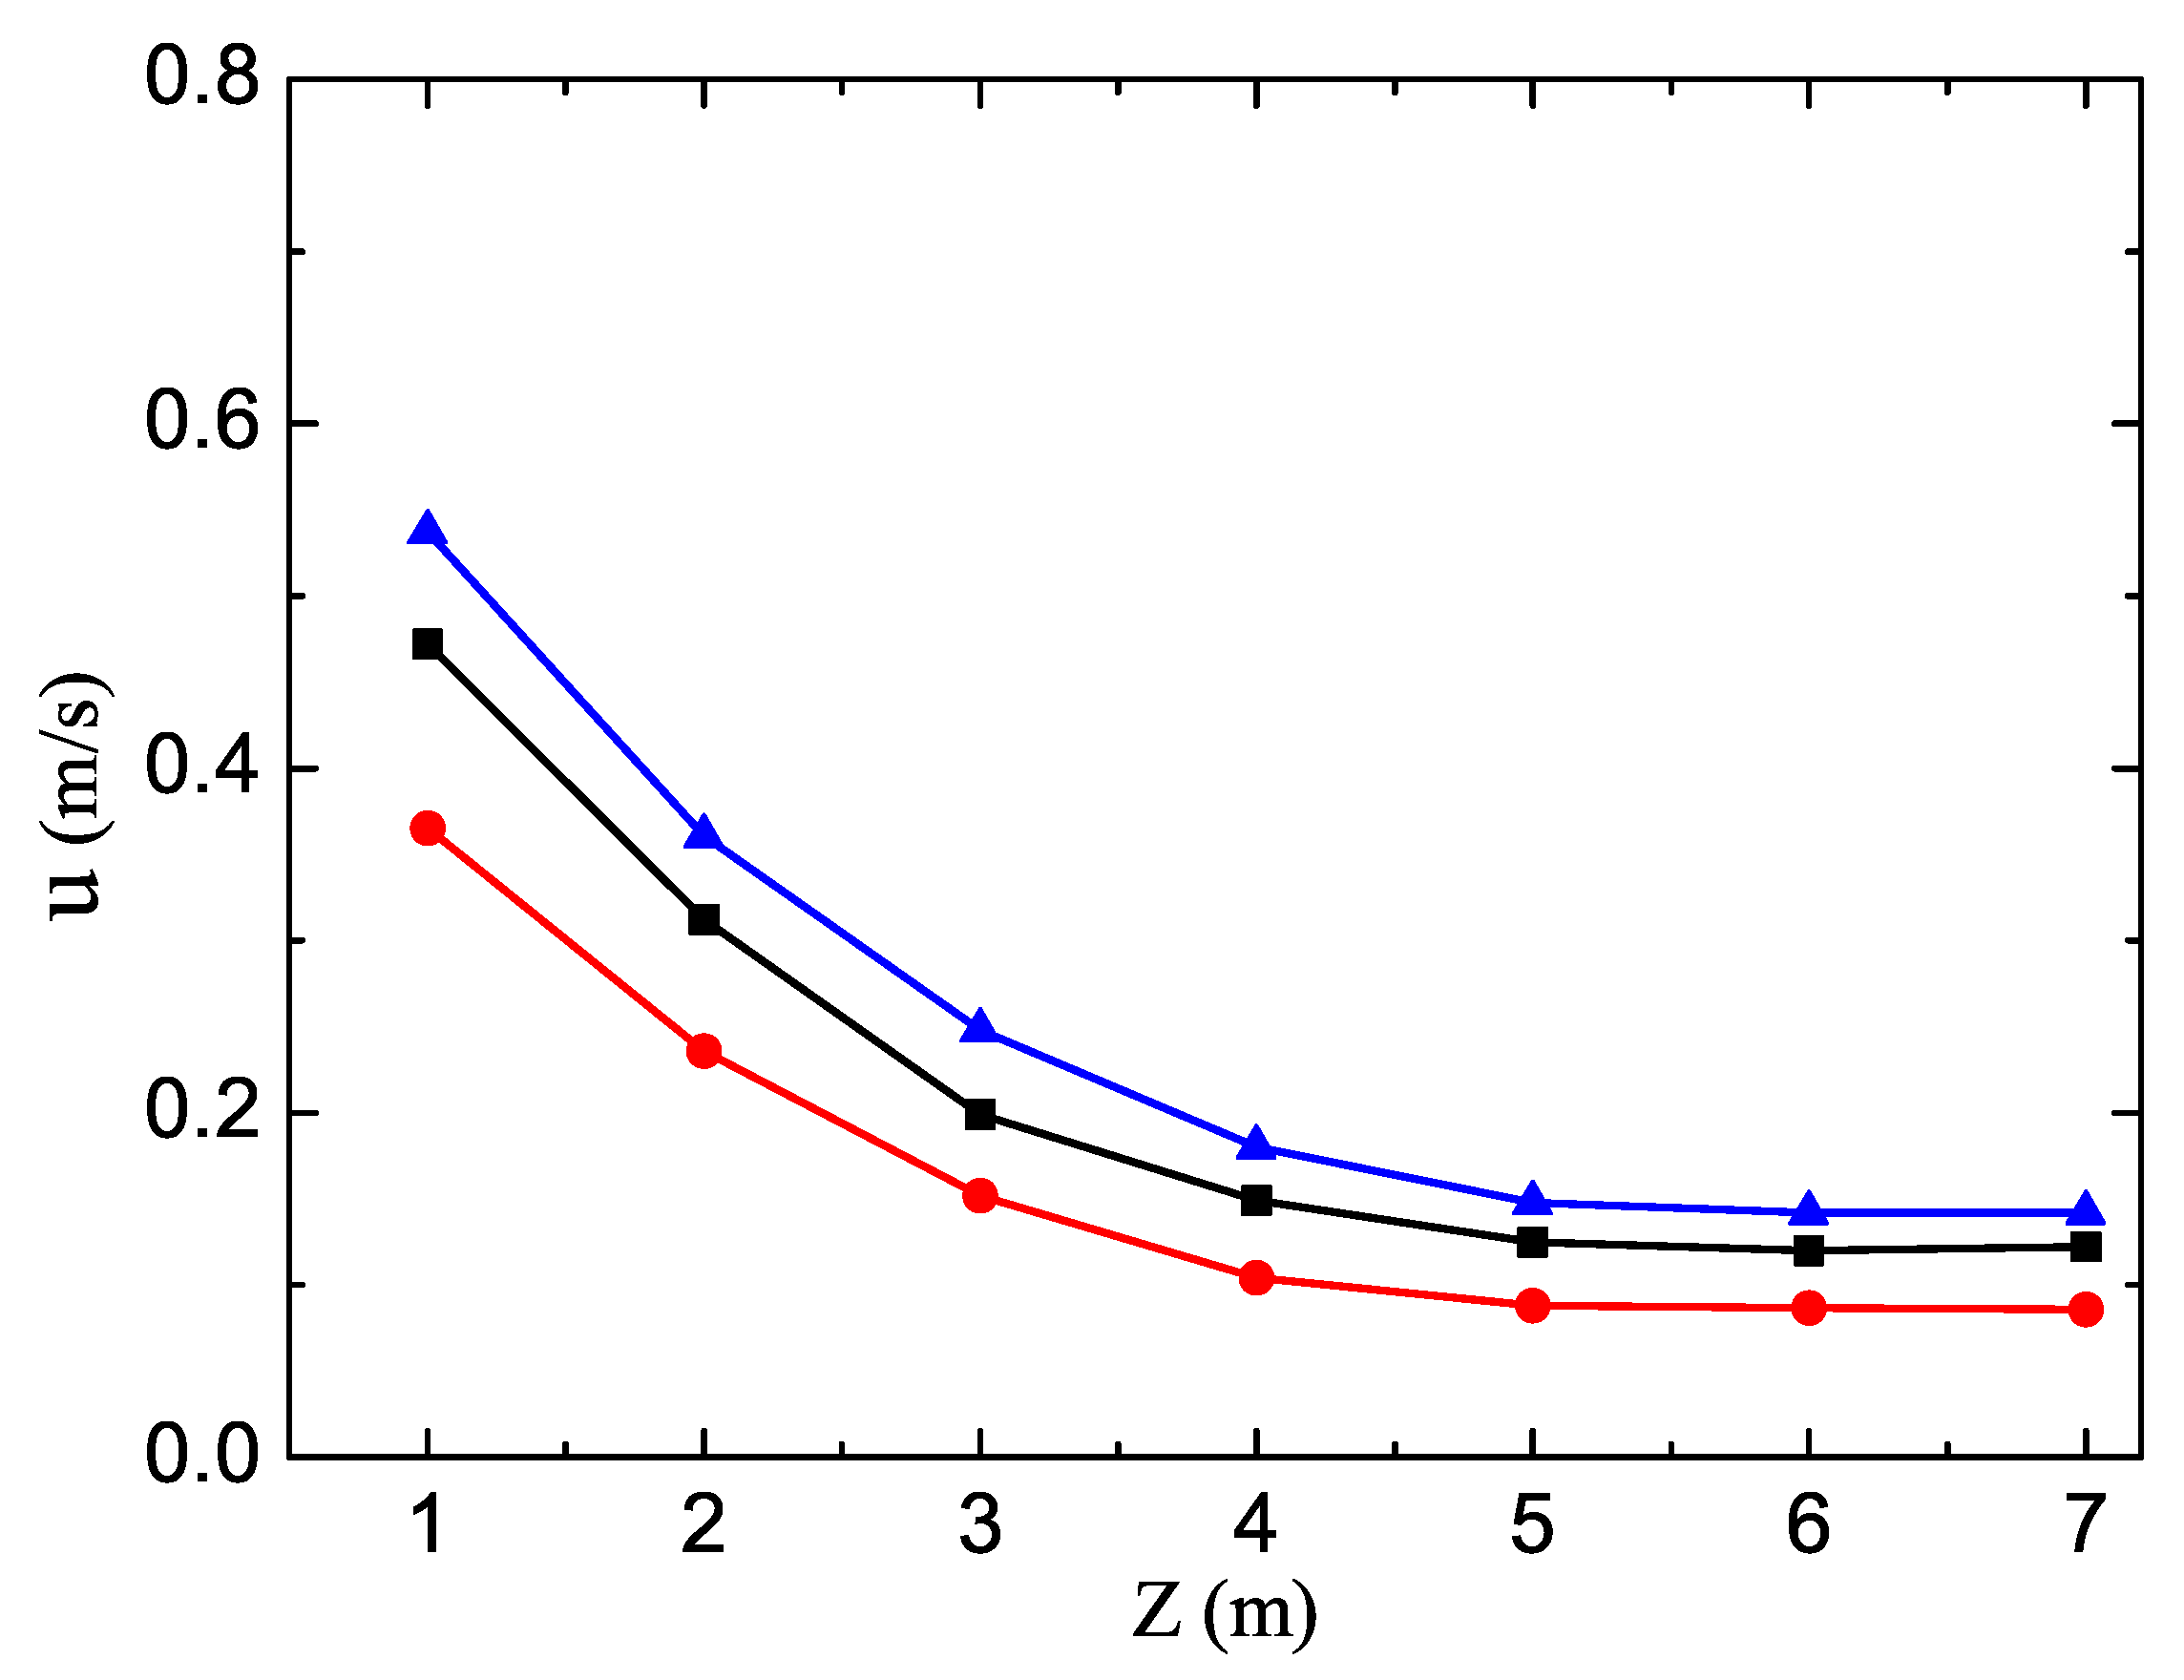
In this paper, three different parameters for solid particles are selected respectively in order to compare them with each other. These parameters are black triangles (, kg/cm, m), black squares (, kg/cm, m) and black dots (, kg/cm, m) as shown in Figure 3, Figure 4 and Figure 5. In Figure 3, the air velocity u as the function of Z in three sets of parameters is obtained through the self-consistent calculations in the gas-solid two-phase flow. As can be seen in Figure 3, with the increase of the height Z, the air flow rate u in the gas-solid two-phase flow shows a downward trend, with a smaller and smaller decline rate with increasing Z, gradually stabilizing and reaching a stable airflow state. This shows that the smaller the particle density, the greater the air flow rate in the gas-solid two-phase flow. The greater the diameter of solid particles, the greater the airflow velocity at the same height. The physical reason behind this is that the large particle diameter results in a large void ratio , which leads to a large flow velocity. Due to the differences in the particle size, the pressure, and the temperature in the gas-solid two-phase flow, the whole system becomes very different and the environment around the bubbles also becomes very different. As shown in Figure 2, this effect is reflected in the specific heat capacity of the bubbles, which changes significantly, resulting in changes of gas speed and solid speed in the whole gas-solid two-phase flow. It is clear that the air velocity gradually stabilizes, which is beneficial to the stability of the gas-solid two-phase flow. The results indicate that such a system can be used as a medium for particle separations.
Figure 4 shows the bubble diameter as the function of the gas flow height Z by the self-consistent calculations in the gas-solid two-phase flow. It is shown that with increasing the height Z, bubble sizes show a variation of decreasing and then increasing, just like the U type, in the gas-solid two-phase flow. This indicates that the gas velocity, the pressure, the particle density, and the particle diameter are combined together and collectively influence the diameter of bubbles in the gas-solid two-phase flow. When the bubbles rise with the air flow, the external pressure decreases, since the external airflow rate is relatively large. At the same time, the solid particles suppress the increase of bubble volume, resulting in the bubble sizes being smaller in the initial stage. With increasing height Z, the external air velocity, solid phase particle density, particle diameter, spherical degree, and other factors cannot suppress the increase of air bubbles because the pressure P is so weak. At this time, the reduction of external pressure plays a key role. Consequently, the bubble sizes increase with the increase of the rising speed. It is found that the bubble phase depends strongly on the solid phase in the gas-solid two-phase flow. The greater the density of solid phase particles, the smaller the bubble sizes in the two-phase flow, which reveals that the high density of the particles can inhibit the increasing of the bubble sizes. Meanwhile, the particle size is smaller, and the bubble size is smaller at the same height Z. This is because the particle size and void fraction are smaller in the gas-solid flow, which can limit the growth of the bubble. We find that our theoretical results can be compared with the recently reported results. It is experimentally found that the size of gas bubble increases gradually from the bottom of the systems (see e.g., Figure 7a of Ref. [29]). Chen et al. have found that the bubble size enlarges by increasing the height position base of the numerical simulations (see e.g., Figure 10 of Ref. [30]). However, we should notice that a local minimum of the bubble sizes is observed for our self-consistent physical model, which are not demonstrated experimentally at present. Our theoretical results are in agreement with the reported results after the local minimum sizes. Moreover, we hope our theoretical findings can be verified by experiments.
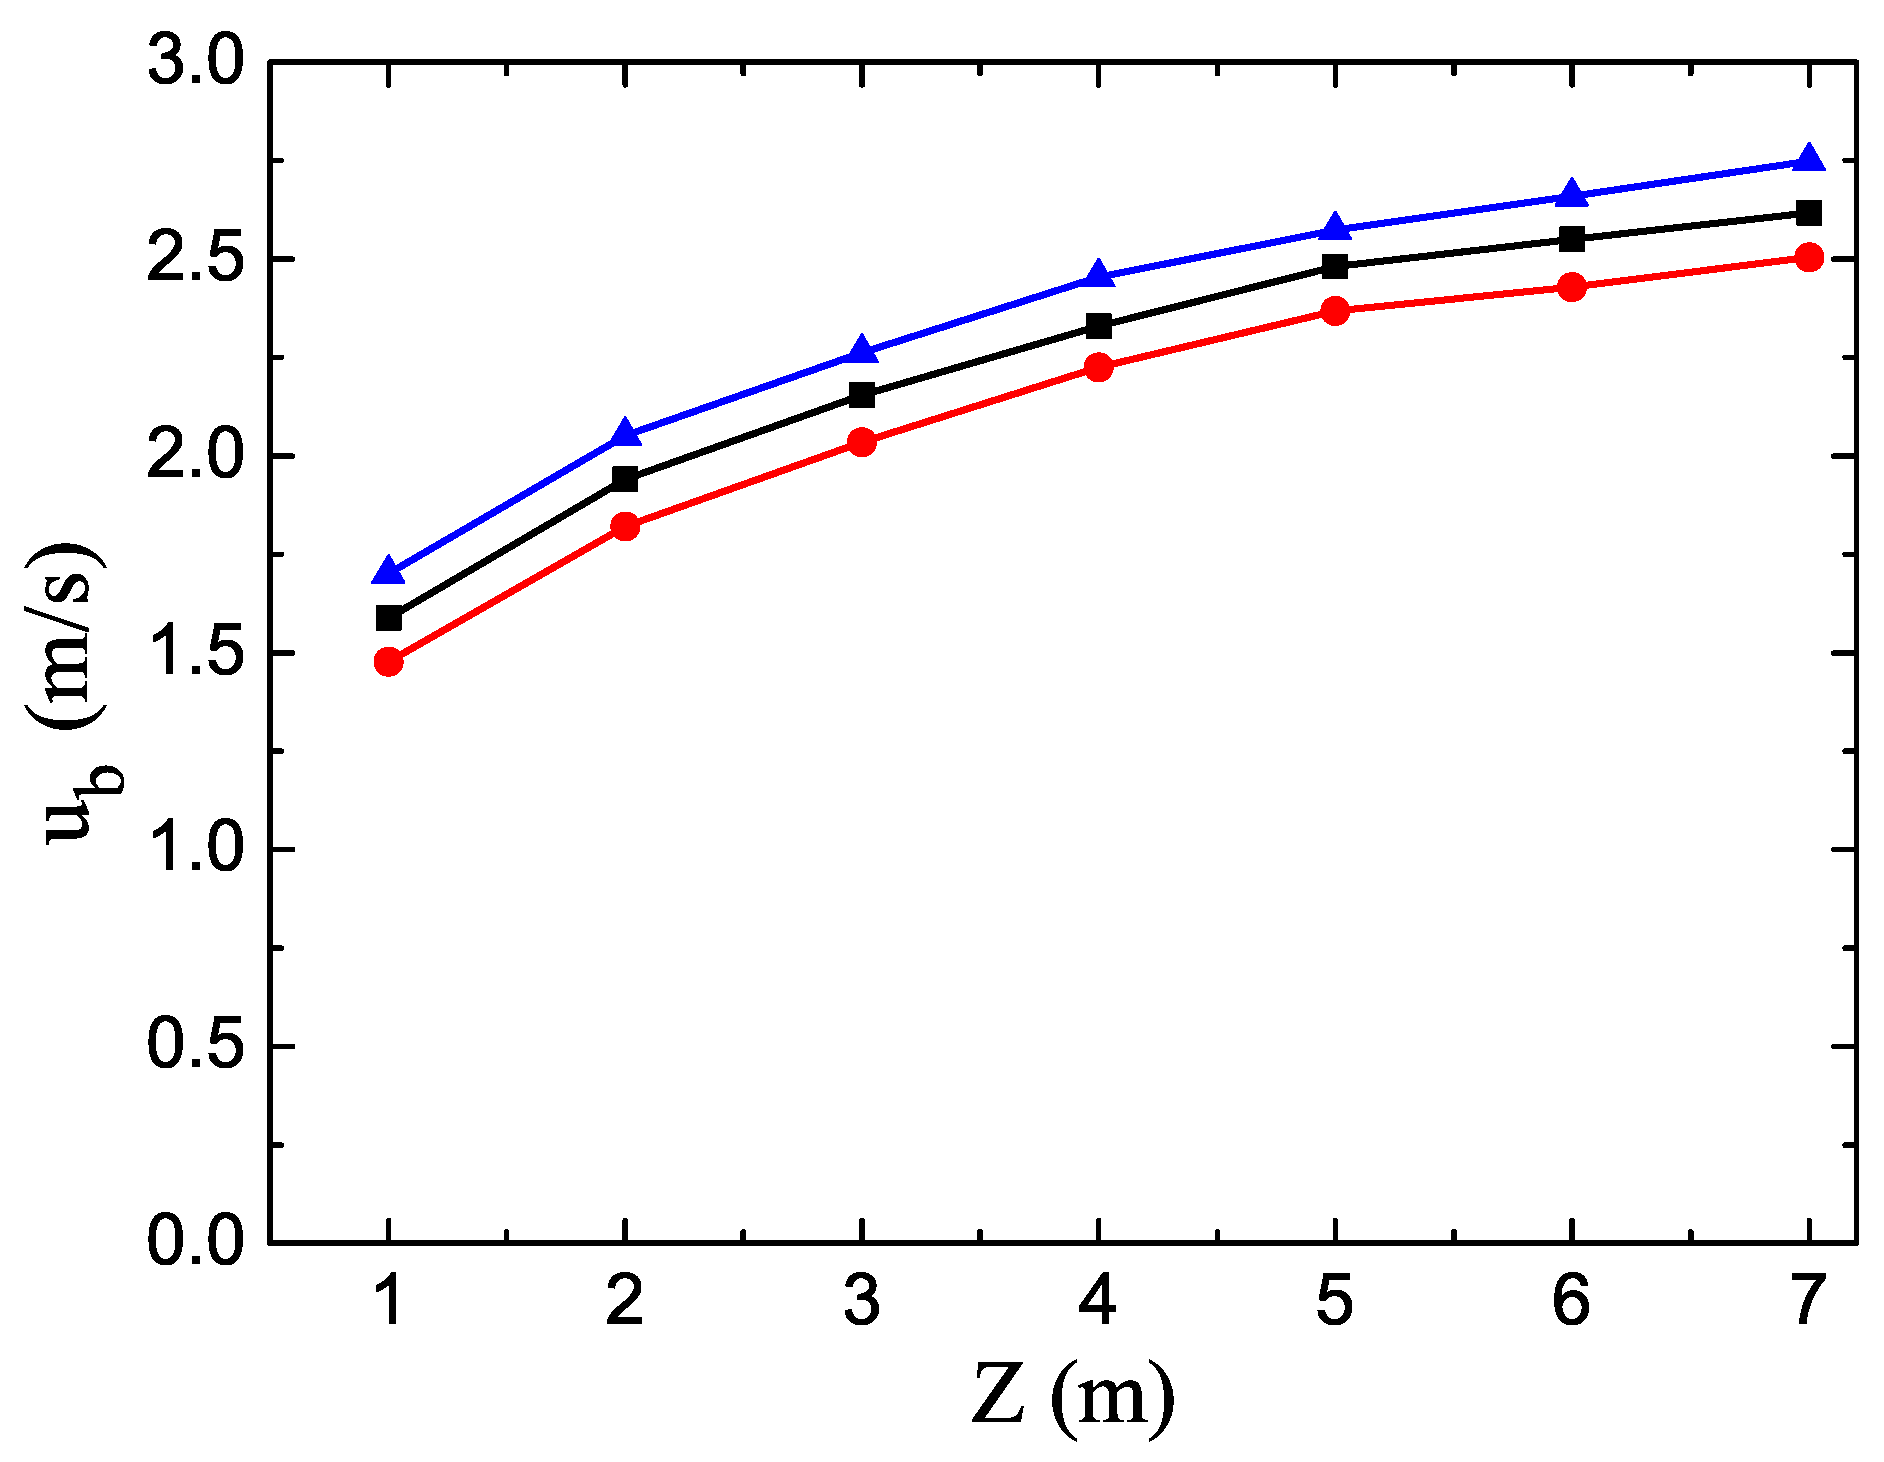
Figure 5 shows the change of the bubble rising velocity with the height Z by the self-consistent calculations in the gas-solid two-phase flow. In Figure 4, the velocity of bubbles is very different from the outside air velocity u in Figure 3 in the gas-solid two-phase flow. It is obvious that the bubble velocity is much faster than the air flow velocity. With the increasing of the height Z, the bubble velocity increases and tends to be quasi-stable in gas-solid two-phase flows. In the gas-solid two-phase flow, the smaller the particle density, the larger the bubble velocity is. The diameter of solid particles is larger, and the bubble velocity is greater at the same height. This is because particle diameter becomes larger on increasing the void fractions in the two-phase flow, which gives rise to the large bubble phase velocity. The bubble velocity is influenced by the air velocity and the bubble size. Therefore, the properties of the bubble velocity are very similar to those of the gas flow velocity in gas-solid two-phase flow. Moreover, the bubble size firstly decreases and then increases. With the effect of the both aspects, the velocity of the bubble gradually increases and eventually stabilizes. We should also point out that the gradual stabilization of the bubble velocity is beneficial to the stability of gas-solid two-phase flow systems and the separations of different particles in this system. The tracer testing technology has been widely applied to study the properties of bubbles in multi-phase flows. The very recent experimental research by the technology shows that the bubble velocity become large by increasing the bed locations (see e.g., Figure 7b of Ref. [29]). We find that our theoretical results are very consistent with the experimental results.
4. Conclusions
The properties of the bubbles in the gas-solid systems have been self-consistently investigated based on fluid mechanics theory, bubble thermodynamic equations, and kinetic equations. We found that the bubble heat ratio of the gas-solid two-phase flow significantly increases with the increase of temperature and pressure in the bubble system. The bubble heat ratio has a significant impact on the properties of bubbles. Theoretical study has shown that the air velocity decreases with the increase of the air flow height in the gas-solid two-phase flow, which finally stabilizes, with the height increasing and reaching a steady state. A local minimum in bubble sizes as a function of height can be observed. The rising velocity of bubbles depends strongly on the air velocity and the bubble sizes, with the speed gradually increasing and eventually quasi-stabilizing. The physical reason for these phenomena is that the temperature and the pressure of gas phase determine the bubble heat capacity ratio in the gas-solid two-phase flow, and the heat capacity ratio is influenced by the density, the size, and the granularity of the solid phase, which affects the air speed and bubble size conversely. Since the bubble velocity depends strongly on the air velocity and the bubble size, the gas phase and the solid phase interact with each other and a self-consistent system comes into being. Our theoretical results enrich and deepen the theory of gas-solid two-phase flow. The results presented and discussed in this paper can be used to understand the properties and effects of the bubbles in gas-solid two-phase flows.
Acknowledgments
The project was supported by the China Postdoctoral Science Foundation (No. 2014M551707, 2014T70564), the Postdoctoral Science Foundation of Jiangsu Province (No. 1302003B), the National Natural Science Foundation of China (51620105001), and the Jiangsu Natural Science Fund (BK20160055).
Author Contributions
Yuemin Zhao conceived the project; Haiming Dong performed and wrote the paper; Jingfeng He and Chenlong Duan analyzed the data and contributed reagents/materials/analysis tools.
Conflicts of Interest
The authors declare no conflict of interest.
References
- Kadanoff Leo, P. Built upon sand: Theoretical ideas inspired by granular flows. Rev. Mod. Phys. 1999, 71, 435. [Google Scholar] [CrossRef]
- Zhao, Y.M.; Duan, C.L.; Wu, L.L.; Zhang, H.J.; He, J.F.; He, Y.Q. The Separation mechanism and application of a tapered diameter Separation Bed. Int. J. Environ. Sci. Technol. 2012, 9, 719–728. [Google Scholar] [CrossRef]
- Yuan, Z.L.; Zhu, L.P.; Geng, F.; Peng, Z.B. Gas-Solid Two Phase Flow and Numerical Simulation; Southeast University Press: Nanjing, China, 2012. [Google Scholar]
- Glasser, B.J.; Sundaresan, S.; Kevrekidis, I.G. From Bubbles to Clusters in Fluidized Beds. Phys. Rev. Lett. 1998, 81, 1849. [Google Scholar] [CrossRef]
- Martyushev, L.M.; Celezneff, V. Nonequilibrium Thermodynamics and Scale Invariance. Entropy 2017, 19, 126. [Google Scholar] [CrossRef]
- Harrision, D.; Leung, L.S. Bubble Formation at an Orifice in a Fluidized Bed. Nature 1961, 190, 433–434. [Google Scholar] [CrossRef]
- Pak, H.K.; Behringer, R.P. Bubbling in vertically vibrated granular materials. Nature 1994, 371, 231–233. [Google Scholar] [CrossRef]
- Xiong, Q.; Lia, B.; Zhou, G.; Fang, X.; Xu, J.; Wang, J.; He, X.; Wang, X.; Wang, L.; Ge, W.; et al. Large-scale DNS of gas–solid flows on Mole-8.5. Chem. Eng. Sci. 2012, 71, 422–430. [Google Scholar] [CrossRef]
- Van Lare, C.E.J.; Piepers, H.W.; Sehoonderbeek, J.N.; Schoonderbeek, J.N.; Thoenes, D. Investigation on bubble characteristics in a gas fluidized bed. Chem. Eng. Sci. 1997, 52, 829–841. [Google Scholar] [CrossRef]
- Ichiki, K.; Hayakawa, H. Dynamical simulation of fluidized beds: Hydrodynamically interacting granular particles. Phys. Rev. E 1995, 52, 658. [Google Scholar] [CrossRef]
- Farshi, A.; Javaherizaden, H.; Hamzavi Abedi, M.A. An investigation of the effect of bubble diameter on the performance of gas-solid fluidized bed reactor and two-phase modeling of bubbling fluidized bed reactor in melamine production. Pet. Coal 2008, 50, 11–22. [Google Scholar]
- Valverde, J.M.; Castellanos, A.; Mills, P.; Quintanilla, M.A.S. Effect of particle size and interparticle force on the fluidization behavior of gas-fluidized beds. Phys. Rev. E 2003, 67, 051305. [Google Scholar] [CrossRef] [PubMed]
- Müller, C.R.; Davidson, J.F.; Dennis, J.S.; Fennell, P.S.; Gladden, L.F.; Hayhurst, A.N.; Mantle, M.D.; Rees, A.C.; Sederman, A.J. Real-Time Measurement of Bubbling Phenomena in a Three-Dimensional Gas-Fluidized Bed Using Ultrafast Magnetic Resonance Imaging. Phys. Rev. Lett. 2006, 96, 154504. [Google Scholar]
- Homsy, G.M. Nonlinear Waves and the Origin of Bubbles in Fluidized Beds. Appl. Sci. Res. 1998, 58, 251–274. [Google Scholar] [CrossRef]
- Tafreshi, Z.M.; Kingsley, O.G.; Adesoji, A.A. A two-phase model for variable-density fluidized bed reactors with generalized nonlinear kinetics. Can. J. Chem. Eng. 2000, 78, 815–826. [Google Scholar] [CrossRef]
- Komatsu, T.S.; Hayakawa, H. Nonlinear waves in fluidized beds. Phys. Lett. A 1993, 183, 56–62. [Google Scholar] [CrossRef]
- Choi, J.H.; Son, J.E.; Kim, S.D. Bubble size and frequency in gas fluidized beds. J. Chem. Eng. Jpn. 1988, 21, 171–178. [Google Scholar] [CrossRef]
- Al-Zahrani, A.A.; Daous, M.A. Bed expansion and average bubble rise velocity in a gas-solid fluidized bed. Powder Technol. 1996, 87, 255–257. [Google Scholar] [CrossRef]
- Best, J.P. The formation of toroidal bubbles upon the collapse of transient cavities. J. Fluid Mech. 1993, 251, 79–107. [Google Scholar] [CrossRef]
- Tian, J.X.; Jiang, H.; Guic, Y.X.; Mulerod, A. Equation of state for hard-sphere fluids offering accurate virial coefficients. Phys. Chem. Chem. Phys. 2009, 11, 11213–11218. [Google Scholar] [CrossRef] [PubMed]
- Martín, C.; Jørgen, M. Development and application of a three-parameter RK–PR equation of state. Fluid Phase Equilibria 2005, 232, 74–89. [Google Scholar]
- Gasem, K.A.M.; Gao, W.; Pan, Z.; Robinson, R.L., Jr. A modified temperature dependence for the Peng–Robinson equation of state. Fluid Phase Equilibria 2001, 181, 113–125. [Google Scholar] [CrossRef]
- Vandermeulen, J.; Leliaert, J.; Dupre, L.; Van Waeyenberge, B. Field-driven chiral bubble dynamics analysed by a semi-analytical approach. J. Phys. D 2017, 50. [Google Scholar] [CrossRef]
- Wei, L.P.; Lu, Y.J. Bubble dynamic wave velocity in fluidized bed. Chem. Eng. Sci. 2016, 147, 21–29. [Google Scholar] [CrossRef]
- Syamlal, M.; O’Brien, T.J. Fluid dynamic simulation of O3 decomposition in a bubbling fluidized bed. AICHE J. 2003, 49, 2793–2801. [Google Scholar] [CrossRef]
- Sau, D.C.; Mohanty, S.; Biswal, K.C. Prediction of critical fluidization velocity and maximum bed pressure drop for binary mixture of regular particles in gas–solid tapered fluidized beds. Chem. Eng. Process. 2008, 47, 2114–2120. [Google Scholar] [CrossRef]
- Zhang, C.X.; Qian, W.Z.; Wei, F. Instability of uniform fluidization. Chem. Eng. Sci. 2017, 173, 187–195. [Google Scholar] [CrossRef]
- Darton, R.C.; Lanauze, R.D.; Davidson, J.F.; Harrison, D. Bubble Growth due to Coalescence in Fluidized Beds. Trans. Inst. Chem. Eng. 1977, 55, 274–280. [Google Scholar]
- Zhang, C.X.; Li, P.L.; Lei, C.; Qian, W.Z.; Wei, F. Experimental study of non-uniform bubble growth in deep fluidized beds. Chem. Eng. Sci. 2018, 176, 515–523. [Google Scholar] [CrossRef]
- Chen, L.M.; Yang, X.G.; Li, G.; Yang, J.; Wen, C.H.; Li, X.; Snape, C. Dynamic modelling of fluidisation in gas-solid bubbling fluidised beds. Powder Technol. 2017, 322, 461–470. [Google Scholar] [CrossRef]
Figure 1.
Schematic for the gas-solid two-phase flows.

Figure 2.
Heat capacity ratio versus the pressure for the different temperatures.

Figure 3.
The speed of the flow versus the height Z for the different conditions.

Figure 4.
The size of the bubbles versus the height Z for the different conditions.
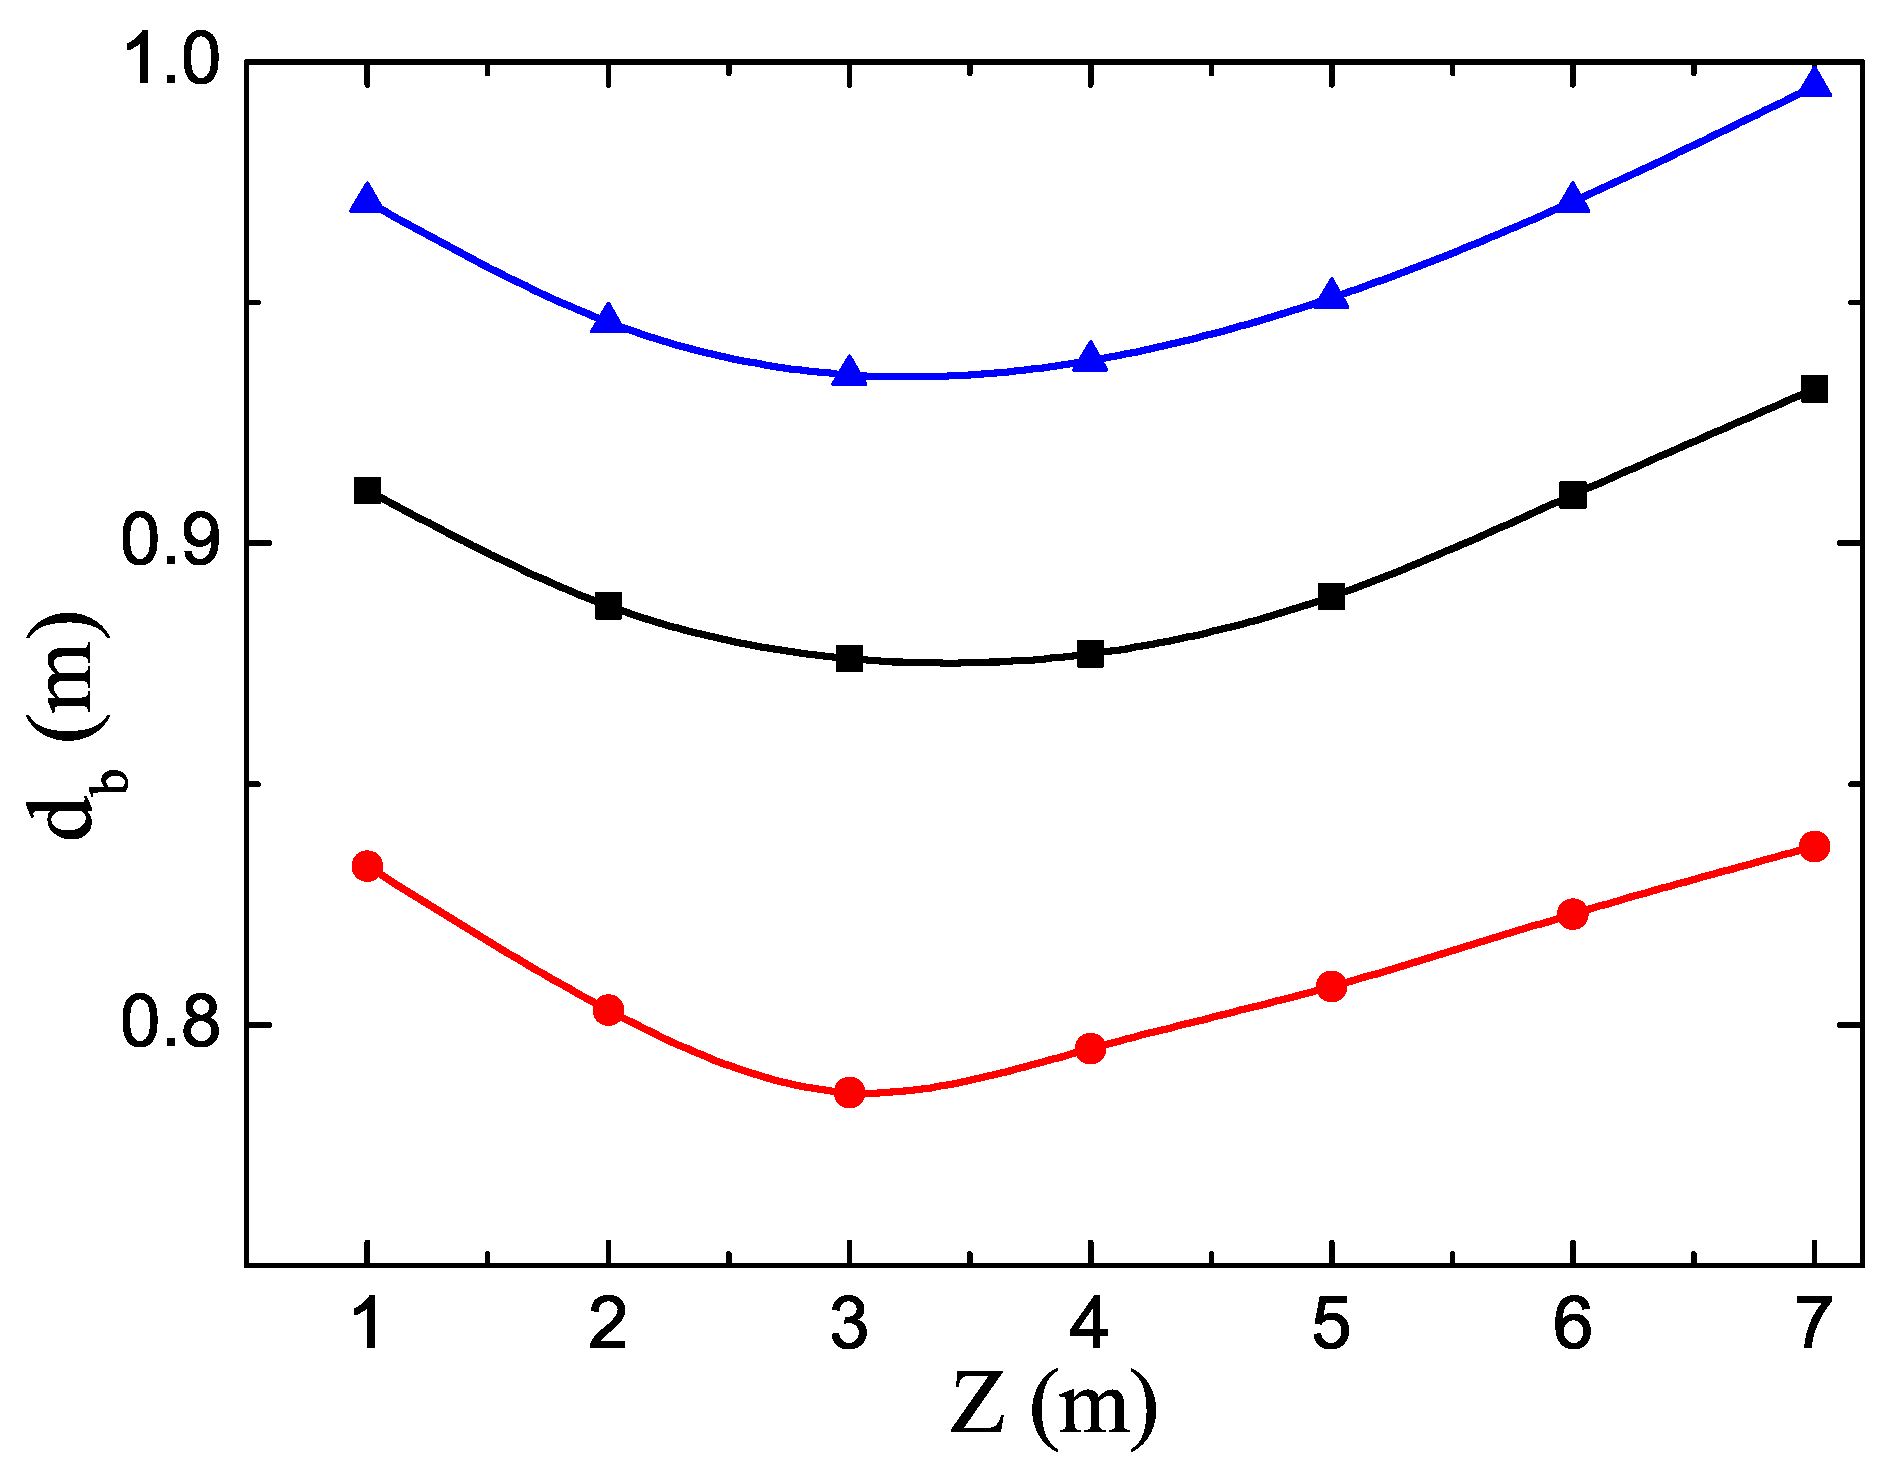
Figure 5.
The speed of the bubbles versus the height Z for the different conditions.

© 2018 by the authors. Licensee MDPI, Basel, Switzerland. This article is an open access article distributed under the terms and conditions of the Creative Commons Attribution (CC BY) license (http://creativecommons.org/licenses/by/4.0/).
Share and Cite
MDPI and ACS Style
Dong, H.; He, J.; Duan, C.; Zhao, Y. A Self-Consistent Physical Model of the Bubbles in a Gas Solid Two-Phase Flow. Appl. Sci. 2018, 8, 360. https://doi.org/10.3390/app8030360
AMA Style
Dong H, He J, Duan C, Zhao Y. A Self-Consistent Physical Model of the Bubbles in a Gas Solid Two-Phase Flow. Applied Sciences. 2018; 8(3):360. https://doi.org/10.3390/app8030360
Chicago/Turabian StyleDong, Haiming, Jingfeng He, Chenlong Duan, and Yuemin Zhao. 2018. "A Self-Consistent Physical Model of the Bubbles in a Gas Solid Two-Phase Flow" Applied Sciences 8, no. 3: 360. https://doi.org/10.3390/app8030360
Note that from the first issue of 2016, this journal uses article numbers instead of page numbers. See further details here.