REV Application in DEM Analysis of Non-Vibrational Rock Splitting Method to Propose Feasible Borehole Spacing

Department of Civil and Environmental Engineering, Hanyang University, 55 Hanyangdaehak-ro, Ansan 15588, Korea
*
Author to whom correspondence should be addressed.
Appl. Sci. 2018, 8(3), 335; https://doi.org/10.3390/app8030335
Submission received: 12 February 2018
/
Revised: 19 February 2018
/
Accepted: 21 February 2018
/
Published: 27 February 2018
Abstract
:Most of the tunnel excavation methods involve the use of explosion and vibration techniques that is not feasible in urban areas due to unavoidable production of noise, vibration, and dust. The environmental considerations of tunneling projects in urban areas demand the use of excavation methods in which minimum noise, vibration, and dust is produced. In this study, non-vibrational rock splitting method is introduced that involves the fragmentation of rock segments using a split-wedge system inserted into already drilled boreholes. The main objective of this study is the investigation of important parameters involved in the non-vibrational rock splitting method for improving its efficiency. Discrete element analysis of this method was performed using Particle Flow Code (PFC2D) and the concept of Representative Elementary Volume (REV) was used to simulate intact rocks based on their unconfined compressive strength and modulus ratio concept. Maximum borehole spacing values were obtained using the numerical simulation of rock splitting process in intact rocks. The numerical analysis results show that increased borehole spacing values can be used for all intact rock types in cases of average modulus ratio and high modulus ratio and also that decreasing the borehole depth generally results in the use of increased borehole spacing.
1. Introduction
The invention of high level explosives in the nineteenth century has made it possible to excavate large scale underground spaces. With the help of explosives used in detonation devices, almost any type of rock can be shattered to create any size of cavity and these type of explosive excavation methods are widely used in tunneling and underground space activities due to their easier and relatively simpler way of usage. However, these blasting methods carry their own limitations, as they are either restricted or not permissible at all in urban areas due to the production of vibration, noise and dust which are, for obvious reasons, unbearable for urban population. Alternatively, tunnel boring machine (TBM) can be used but it can only be used for the construction of large-sized circular openings. TBM excavation is also not possible for all types of urban excavations such as the underground space creation for the provision of public facilities such as roadways, railways, sewage facilities and transmission of electrical lines. Tunnel excavation is a vital part of the construction and development activities in urban areas especially big metropolitans, and the environmental impacts of tunneling such as vibration, noise, and dust production are necessary to be considered in the management of such projects.
The considerations stated above require the use of a tunnel excavation method in which the least noise, vibration, and dust are produced. One of such methods involves the use of a non-vibrational rock splitting method in which a split-wedge system is inserted into the boreholes already drilled in the rock and the operation of split-wedge system causes subsequent splitting of rock segments which are collected and transported out of the site easily [1]. There exists little literature on the analysis and performance of this method in different construction projects. The introductory details of this non-vibrational rock splitting method were overviewed and the drilling and free face forming method for controlled blasting excavation (Kaminiko Tunnel, Japan) was investigated [2]. The applicability of this method was analyzed for the construction of twin-tube tunnels (Follo line project, Norway) using the surface fracturing analysis through FEM (Finite Element Method) simulations [3]. The production of noise level in the whole excavation process (Blasting environmental impact assessment project, South Korea) was found to be less than 80 dBA, as recorded in a testing project [4], which is less than the Sound Exposure Level (SEL) of 82 dBA for a single transit car traveling at 50 mph at a distance of 50 feet from the receptor [5].
Non-vibrational rock splitting method is used all over the world for urban excavation projects where conventional blasting methods are not applicable. The applications of this method are not restricted to tunneling projects, rather it is used widely for building basement dig out, downtown road construction and expansion, trench excavation, vertical shaft excavation and pipe route construction. While some researchers have worked on different parameters involved in the use of this method, such as the disturbance level due to noise production and the applicability of this method under different geological conditions; there is still lack of research work regarding the excavation mechanism and investigation of fracture propagation in rock due to rock splitting in different rock strength conditions. Furthermore, the constitutive equations involving the relationship between various parameters of non-vibrational rock splitting method are also not available due to lack of research work.
An important part of the non-vibrational rock splitting method is the drilling of boreholes that not only takes much time but also produces most of the noise too. The spacing between boreholes depend on the strength parameters of the rock to be excavated. If the borehole spacing can be increased without compromising the rock splitting process, it will not only produce less noise but will also involve minimum time and power consumption which can result in an economical and efficient excavation process to be conducted. However, there are no guidelines available to select the borehole spacing values based on rock strength parameters and other excavation parameters involved in this method. For this reason, it is needed to analyze the rock splitting behavior, fracture propagation, and borehole spacing values under different rock strength conditions using the non-vibrational rock splitting method.
The main objective of this study is to investigate the optimum borehole spacing to be used for excavation process in different types of intact rock based on unconfined compressive strength. The three types of intact rock were further classified according to the modulus ratio concept [6,7], as illustrated in Figure 1, which classifies the intact rocks depending on the ratio of Young’s modulus to unconfined compressive strength. This classification was based on the laboratory tests of 613 rock specimens from different locations. In this study, numerical analysis was performed for the rock-splitting process using PFC2D, a commercial code based on particle mechanics approach, due to the inherent function of PFC2D of crack formation and coalescence so that the fracture propagation due to rock splitting process could be investigated. Microscopic parameters used in PFC2D are needed to be calibrated for simulating the strength parameters of rock-like material. The behavior of intact rock simulated in PFC2D is dependent on the selection of such microscopic parameters that reflect the true mechanical behavior of rock. For this purpose, the concept of Representative Elementary Volume (REV) was also applied in the numerical simulations in order to reflect the true mechanical behavior of rock in rock splitting model.
2. Non-Vibrational Rock Splitting Method
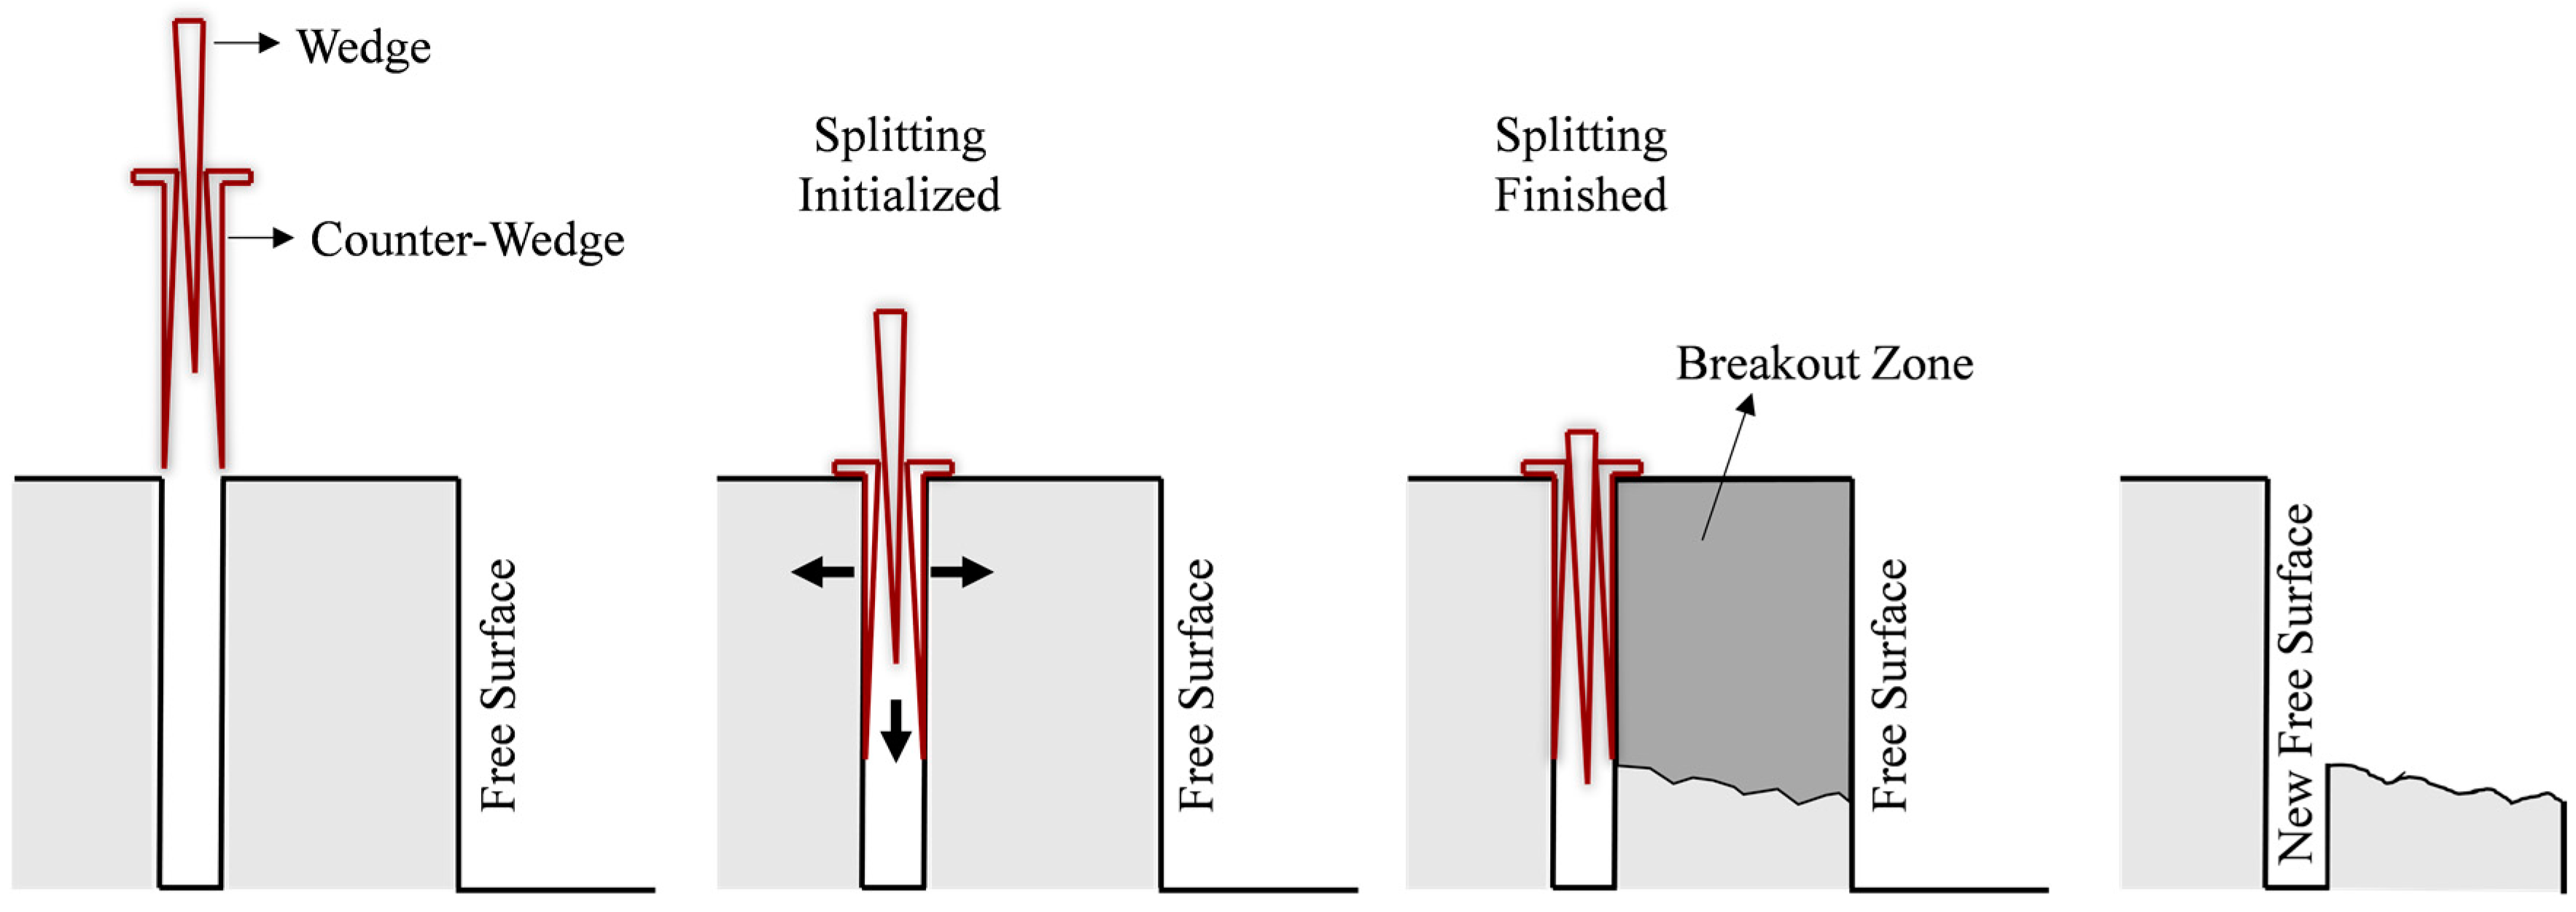
The most important feature of non-vibrational rock splitting method is the split-wedge system that consists of a combination of a steel wedge and two counter-wedges, widely used in the construction industry for rock splitting by inserting it in the already drilled boreholes in the rock [8], as illustrated in Figure 2. This system can be easily mounted on an excavator in less than 10 min and requires only one person to operate. This saves the manpower required by the other types of excavation methods from being used. Usually, the excavators are commonly available with the contractors so relatively cheaper investment has to be made for using the split-wedge system. Much less time is required to learn about the efficient operation of this system.
The use of this rock splitting method is very safe as there is always a safe distance between the rock face to be excavated and the excavator in which the driver sits. Continuous excavation process can be carried out using this mechanized method in the form of borehole drilling, rock splitting, and hauling procedures conducted simultaneously. This makes it very easy to break and excavate the rock material without causing the vibration, noise and dust problems as compared to other mechanized as well as blasting methods. The boreholes are drilled in a formation, at first, in the rock using jumbo drill so that the rock splitting process could be initiated. The general features of split-wedge system and borehole configuration widely used in the construction industry (for instance [9]) are given in Table 1. Due to the splitting action by the split-wedge system, around 70% of the borehole depth usually fragments out and some part of the borehole remains there even after the initial excavation cycle.
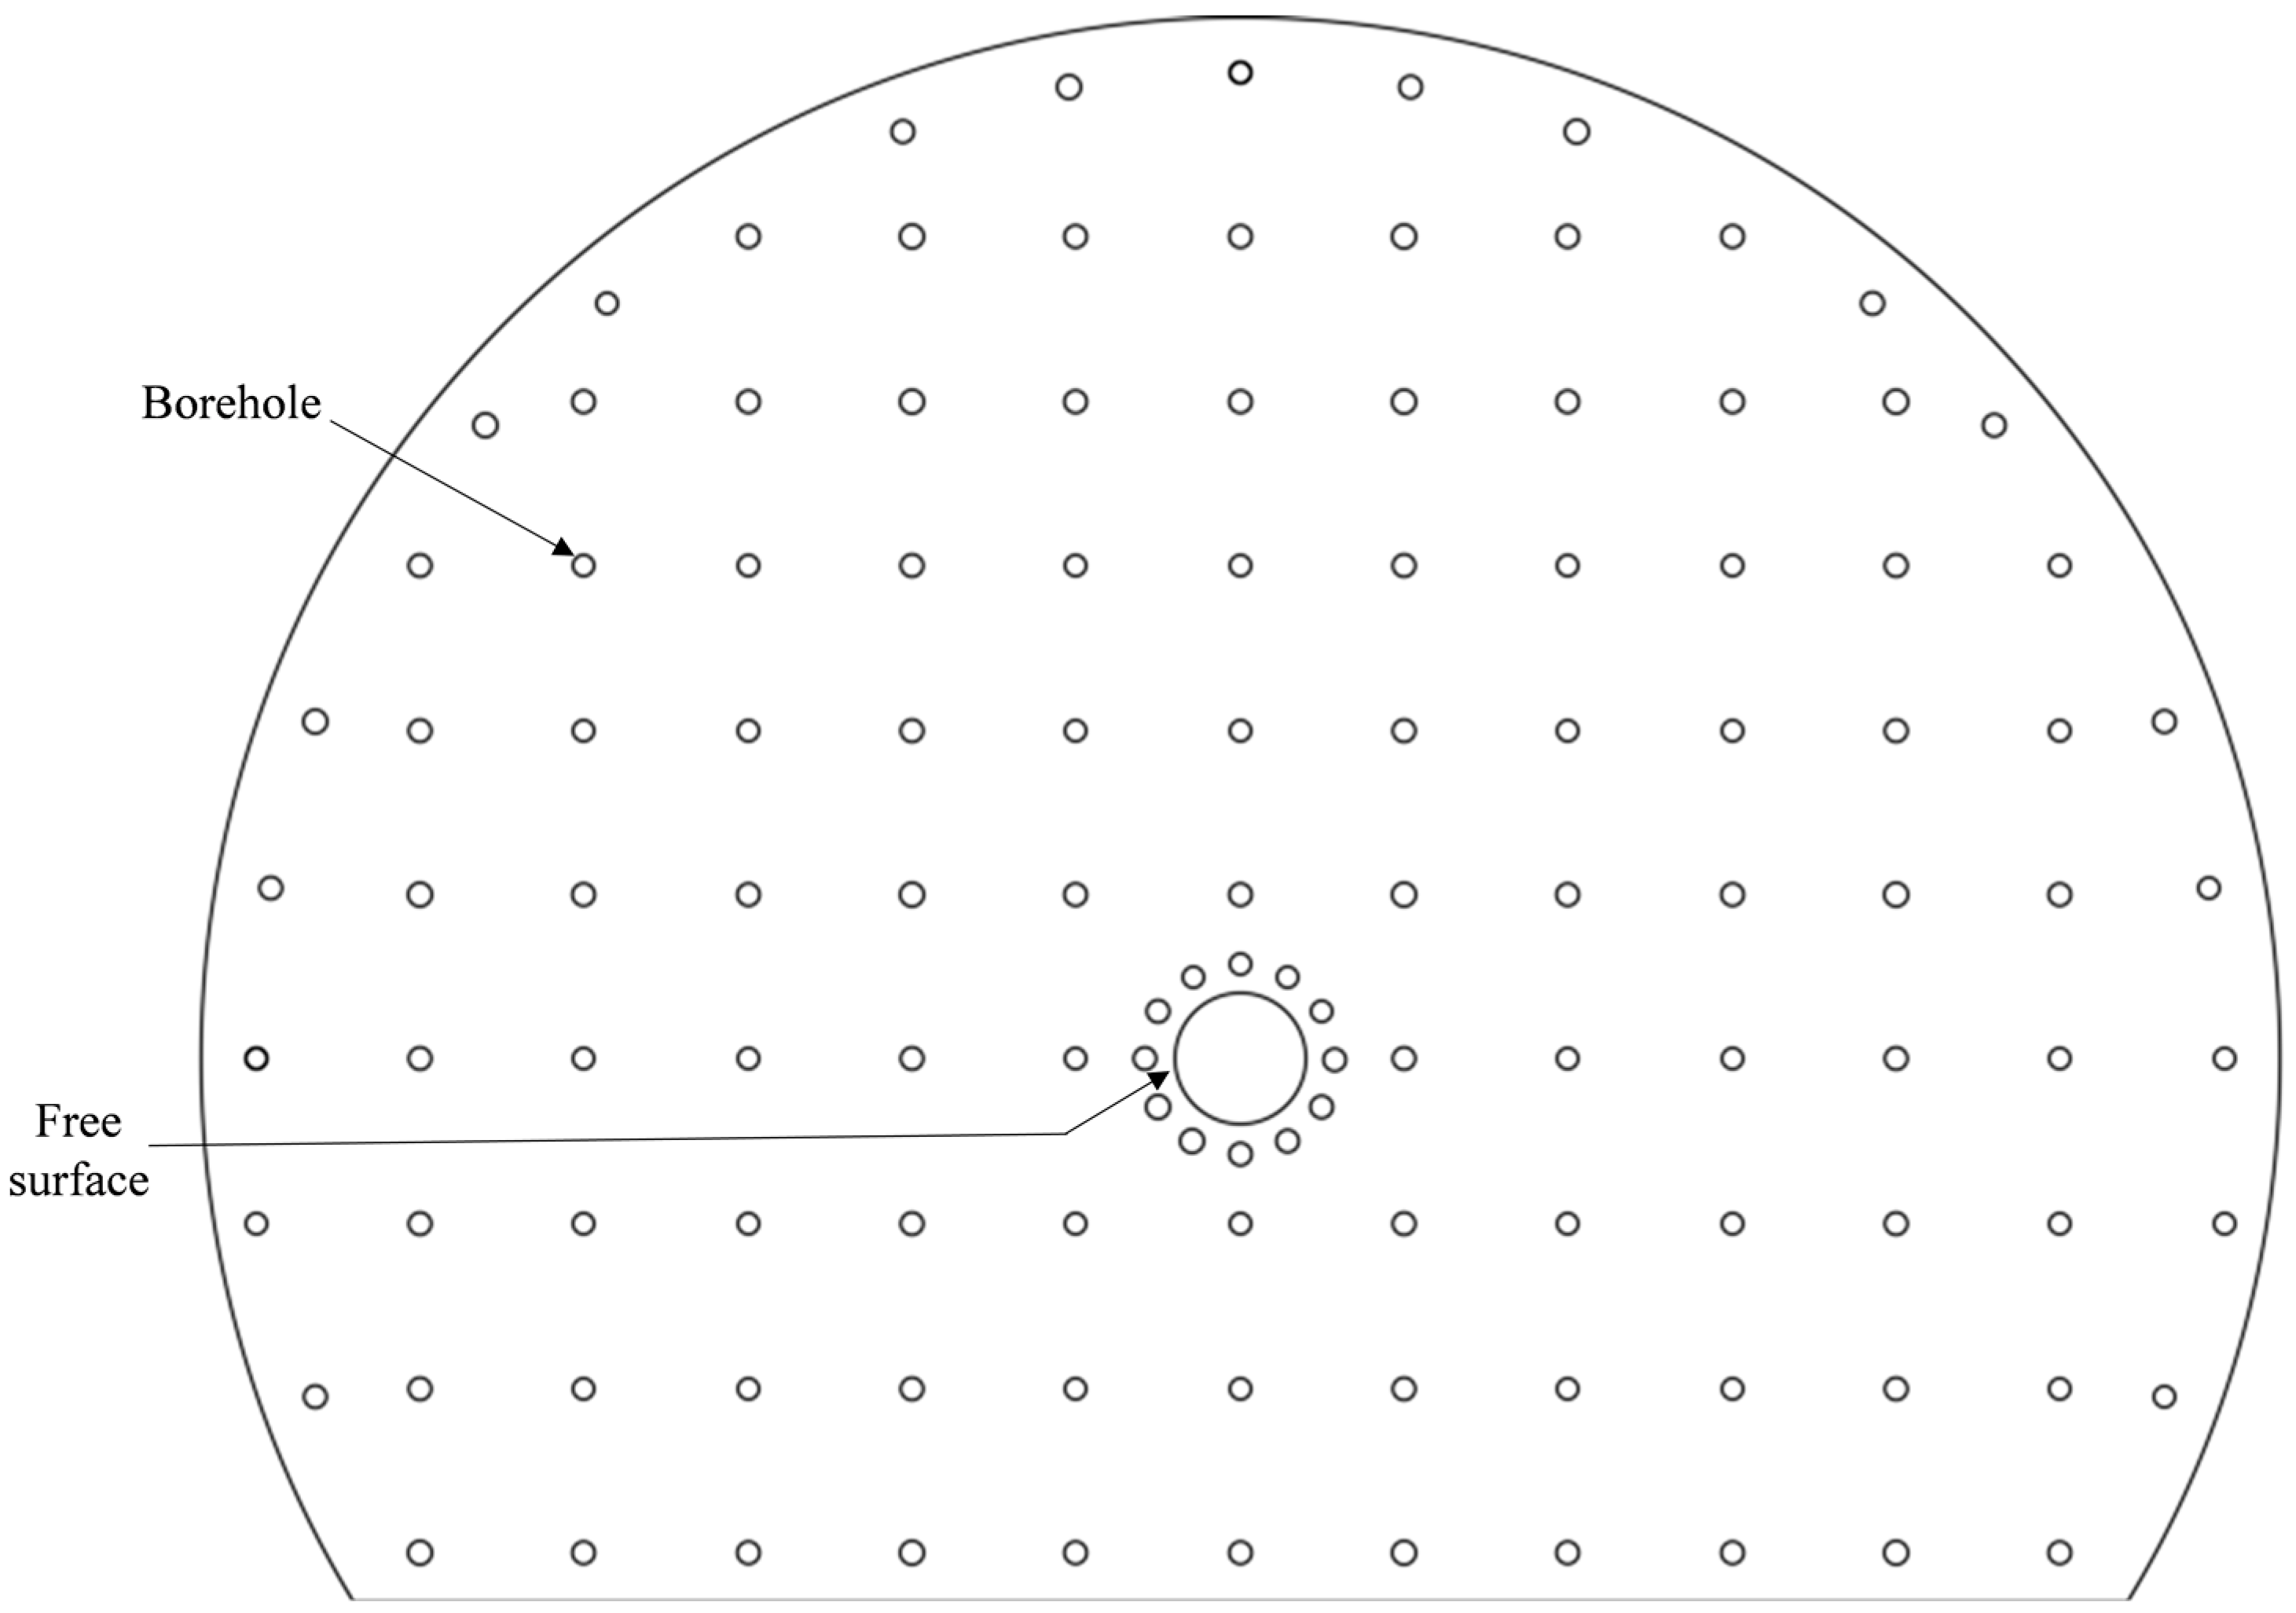
The spacing between the individual boreholes depends on the strength properties of the rock. The harder the rock material is, the smaller the borehole spacing it will require for the rock splitting process. The non-vibrational rock splitting method also requires a free surface to be artificially formed at the working face, just like the other mechanized and blasting methods used for excavation. Free face is any natural or excavated space towards which the rock mass can move during the splitting action due to fracture propagation. In order to create free surface for the excavation process, various methods have been proposed [10,11], but these methods have some limitations such as the requirement of a special forming device, accuracy and efficiency of the forming in continuity. Considering these limitations, the jumbo drill is generally used not only to create the free surface but also the borehole drilled for rock splitting process. The boreholes must be sufficiently deep and in a straight alignment for conducting successful rock splitting process. Vertical boreholes are recommended to be covered with a cloth after drilling so that the rock fragments do not enter the borehole and borehole depth is effectively maintained. The illustration of one of the conceptual borehole configuration and free surface is shown in Figure 3.
After the completion of borehole drilling, the split-wedge system is mounted on the excavator and is then inserted in the borehole adjacent to the free surface. The main cylinder of the excavator exerts pressure on the central wedge which, as a consequence, starts moving in between the counter-wedges. The movement of the wedge between the counter-wedges forces them to move apart up to 20 mm of splitting width at the face of borehole and as a result of this process, the counter-wedges start exerting pressure on the walls of the borehole. The exertion of pressure on the walls of the borehole starts creating fractures in the rock and ultimately, a breakout zone is formed that breaks out of the surface along the fractured rock and can be hauled away without any additional effort. These broken rock segments can then be transported out of the construction site for crushing or any other purposes. The splitting width of the counter-wedges at the face of borehole is usually 20 mm but this splitting width can also be designed to increase if the power consumption is increased. In this study, the intact rock material has been divided in to three types based on their unconfined compressive strength (UCS) and the typical values of borehole spacing in practice by different construction companies in South Korea (for instance [9]) are mentioned in Table 2. The borehole depth is usually kept as 1.4 m and the full length (1 m) of split-wedge system is used for the rock splitting process.
3. Numerical Simulation Process
3.1. UCS Tests Based on Modulus Ratio Concept
The DEM (Discrete Element Method) modeling of non-vibrational rock splitting method was performed using PFC and the optimum borehole spacing for soft rock, normal rock, and hard rock was proposed. In order to simulate the mechanical behavior of the rock material, a typical PFC2D model requires some microscopic parameters to be determined such as; particle radius, particle and parallel bond stiffness ratios, particle friction coefficient, and parallel bond normal and shear strengths. Since these microscopic parameters cannot be measured directly through the laboratory experiments, back calculation needs to be performed by a numerical calibration process. The microscopic parameters used in the UCS tests in PFC2D were calibrated so that the required intact rock properties, such as Young’s modulus, Poisson’s ratio and UCS were obtained. The rock materials to be used for numerical analysis in this study were classified into three types; soft rock, normal rock, and hard rock, and the UCS of these rocks was selected as 50, 100 and 150 MPa, respectively. Based on the modulus ratio concept, these rock types were further classified into three categories, presented in Table 3. In this study, the ratio of Young’s modulus to unconfined compressive strength for high modulus ratio, average modulus ratio, and low modulus ratio was used as 550:1, 300:1 and 150:1, respectively.
Using PFC2D, the UCS tests were performed to obtain the microscopic parameters of soft rock, normal rock, and hard rock in all three categories of modulus ratios. A lot of careful iterations performed for the calibrations of the microscopic parameters so that the calibration results could match with the index properties of the intact rock types used in this study. As the size of PFC models prepared to simulate the rock fracturing phenomenon was 6 m × 6 m, the minimum particle size used in the model was 6 mm due to the computational limitations. That is why, the minimum particle size used for UCS tests was also 6 mm. The microscopic parameters related to all three types of rocks obtained by the calibration process are given in Table 4. Four microscopic parameters namely; particle-particle contact Young’s modulus (Ec), Young’s modulus of parallel bond (Ēc), parallel bond normal and shear strength ( and ) depend on the respective modulus ratio of the rock and were obtained for each intact rock type in all three categories of modulus ratios by using REV concept which will be discussed in the later sections.
3.2. REV Application in PFC2D
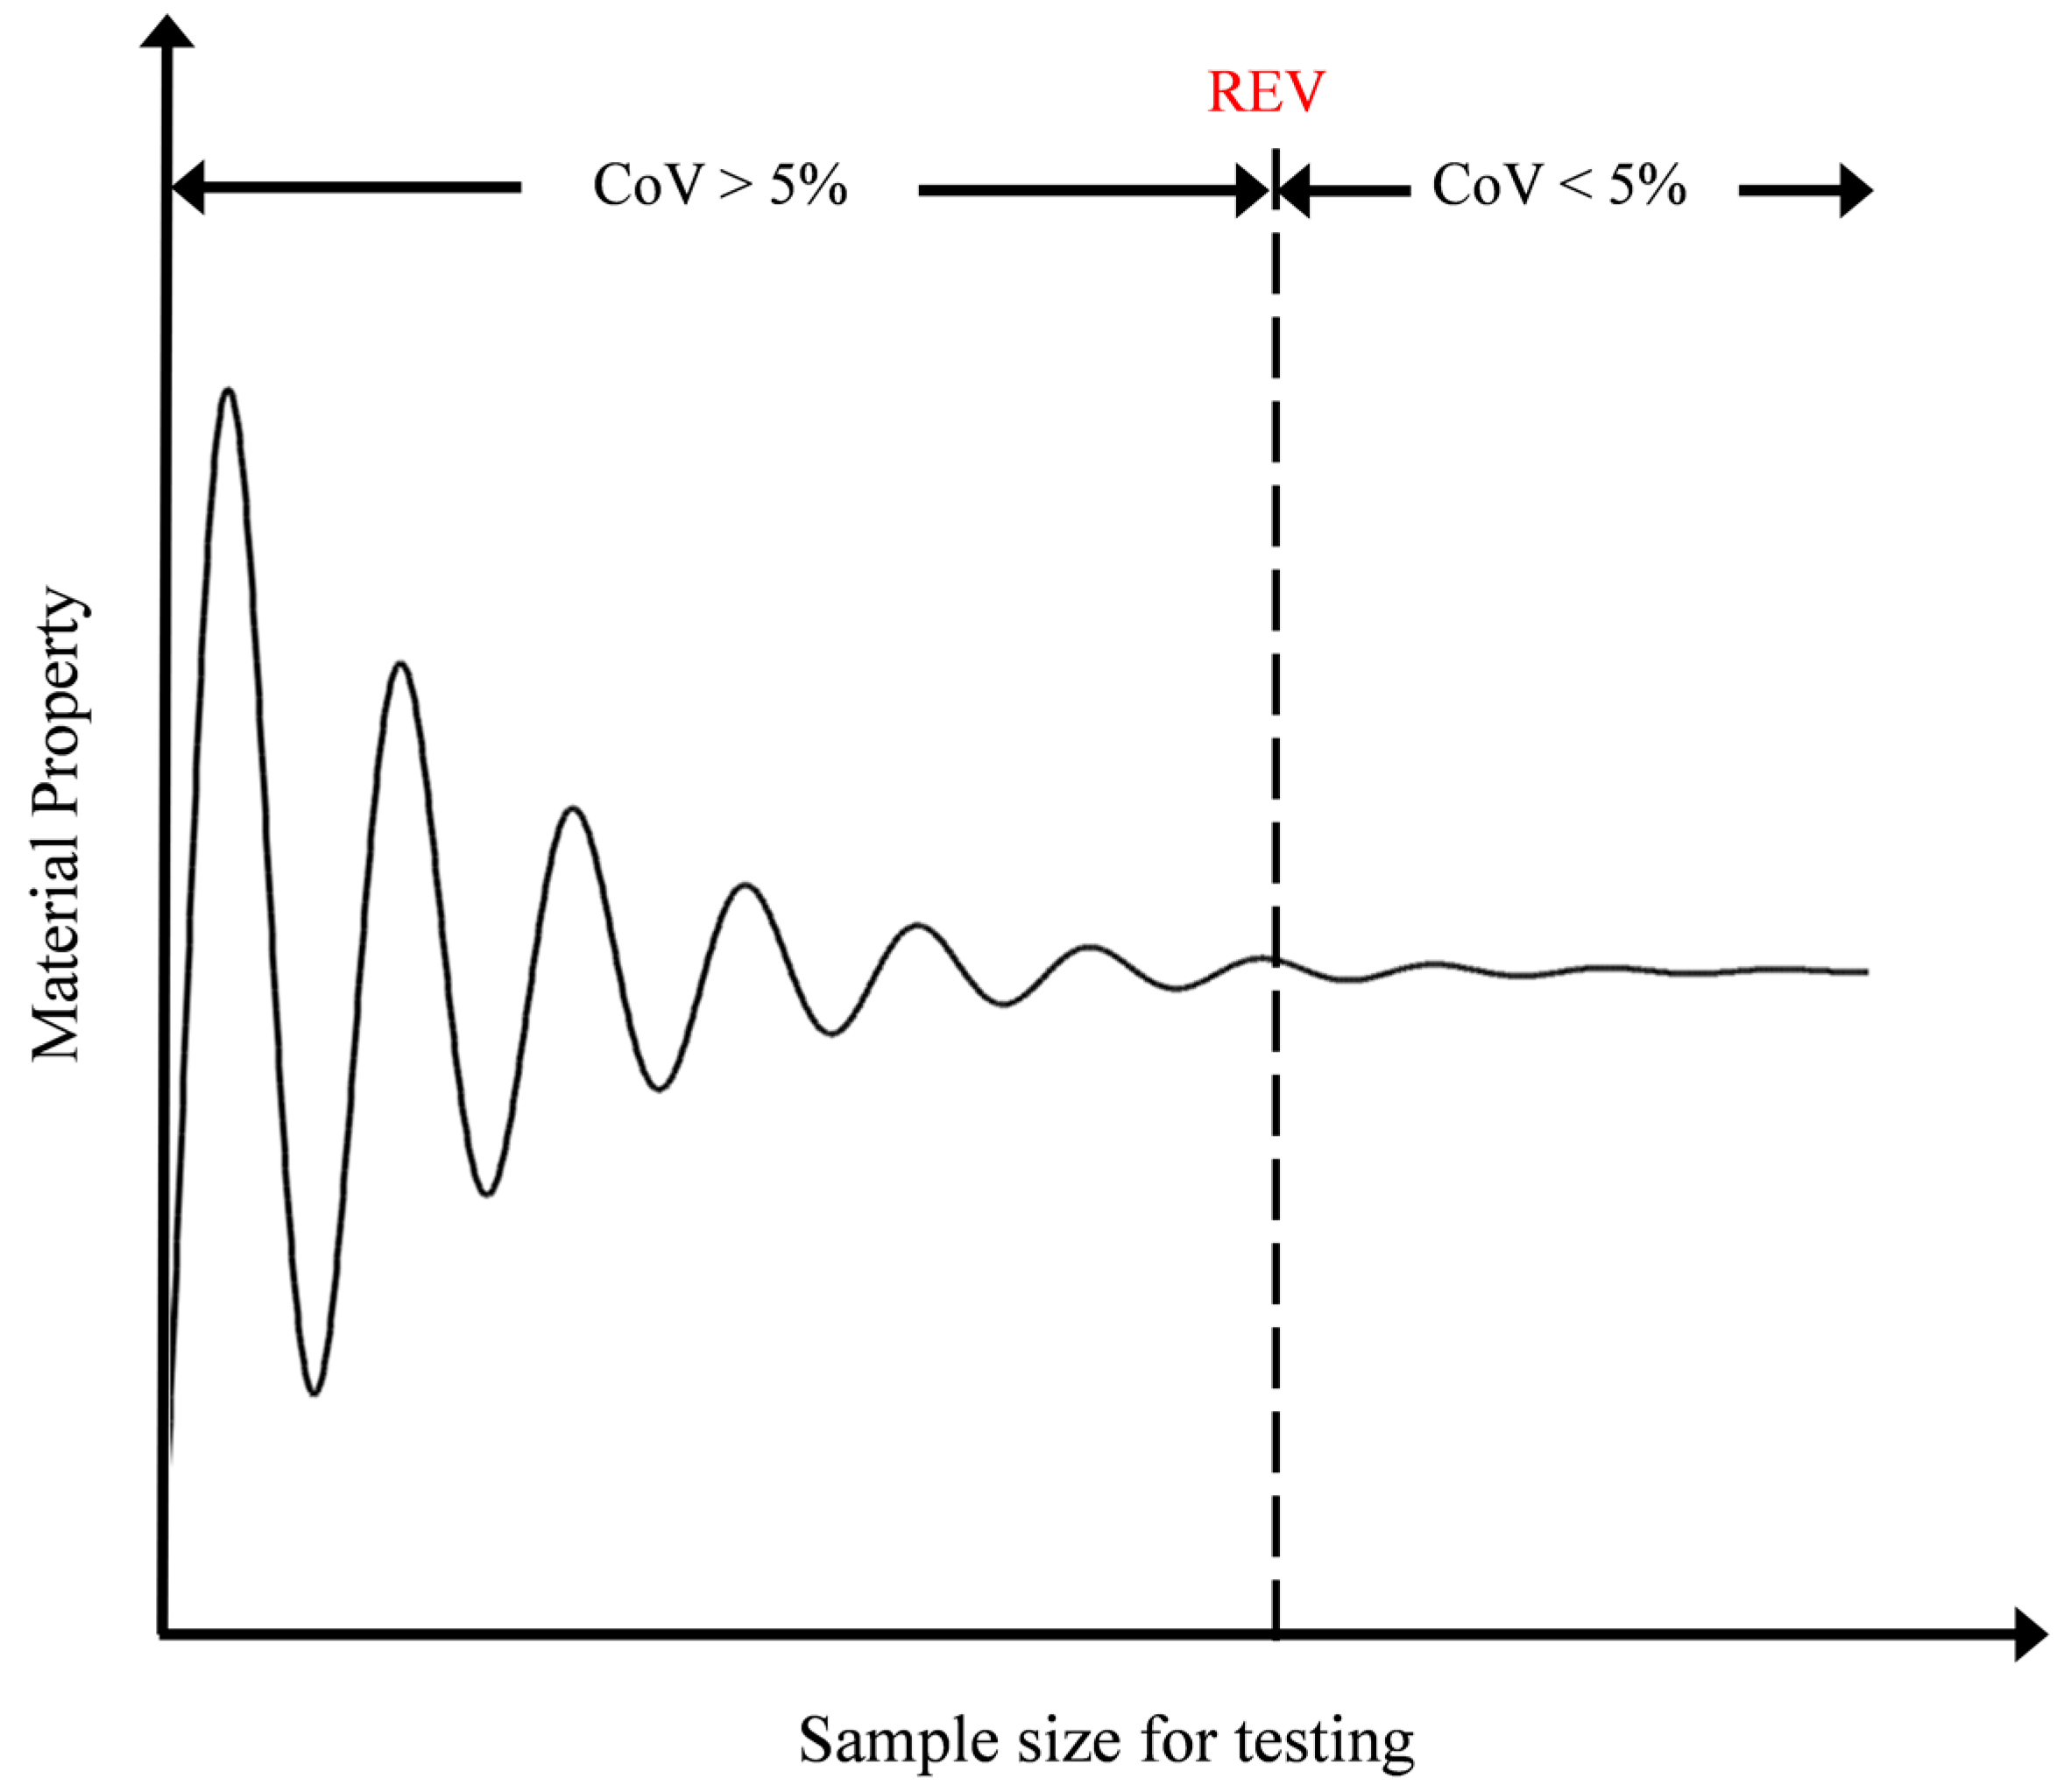
When a rock engineering project is started, compression tests need to be conducted for the determination of strength parameters of the in-situ rock. The results of the conducted tests provide the measured values that are observed to be widely spread. Different properties of the rock material are usually obtained over a wider range of domain. The spread of these values depend on the natural inhomogeneity and the presence of pre-existing discontinuities in the rock material. In order to cater for this observation, a domain of rock material is needed to be tested for which this spread of measured strength properties does not significantly affect. The basic concept of Representative Elementary Volume (REV) was introduced in 1972 [12] and it is defined as the minimum size or volume of the sampling domain above which the characteristic properties of the material remain basically constant. In other words, for any given material, REV is basically that volume of the material that is able to contain sufficient number of discontinuities or inhomogeneities so that when the tests are conducted repeatedly on the material, the average value is reasonably consistent with the test results [13] and the scatter in the values is minimum (Figure 4). This concept has been used for obtaining REV of permeability, porosity and various petrophysical properties of rock [14,15,16] as well as for investigation of REV for fractured and jointed rock mass [17,18,19,20].
In order to use particle mechanics approach in PFC modeling for rock mechanics applications and failure mechanisms, three main issues need to be considered. Firstly, the microscopic parameters such as particle stiffness and friction coefficient needs to be decided because they cannot be directly measured through physical experiments in laboratory. The other two issues are the selection of model size and particle size in compression tests for reliable simulations. The microscopic parameters needed to simulate the actual macroscopic behavior of rock can be obtained by repetitive numerical simulations to calibrate the microscopic parameters in the particle model until the desired macroscopic properties like UCS, Young’s modulus and Poisson’s ratio are achieved. These microscopic properties for a given particle size to diameter ratio obtained by this process are unique for reproducing the above mentioned macroscopic properties typically needed as the mechanical parameters of rock. The effects of model size and particle size of the bonded particle model (BPM) in PFC2D on the mechanical behavior is interrelated. Usually, the model size and particle size for compression tests is determined according to the needs of engineering application and computational limitations and non-realistic particle size needs to be used in large scale models prepared in PFC2D. Therefore, it is necessary to apply the REV concept in the PFC2D modeling in order to simulate the real behavior of rock material.
3.3. REV Calculations
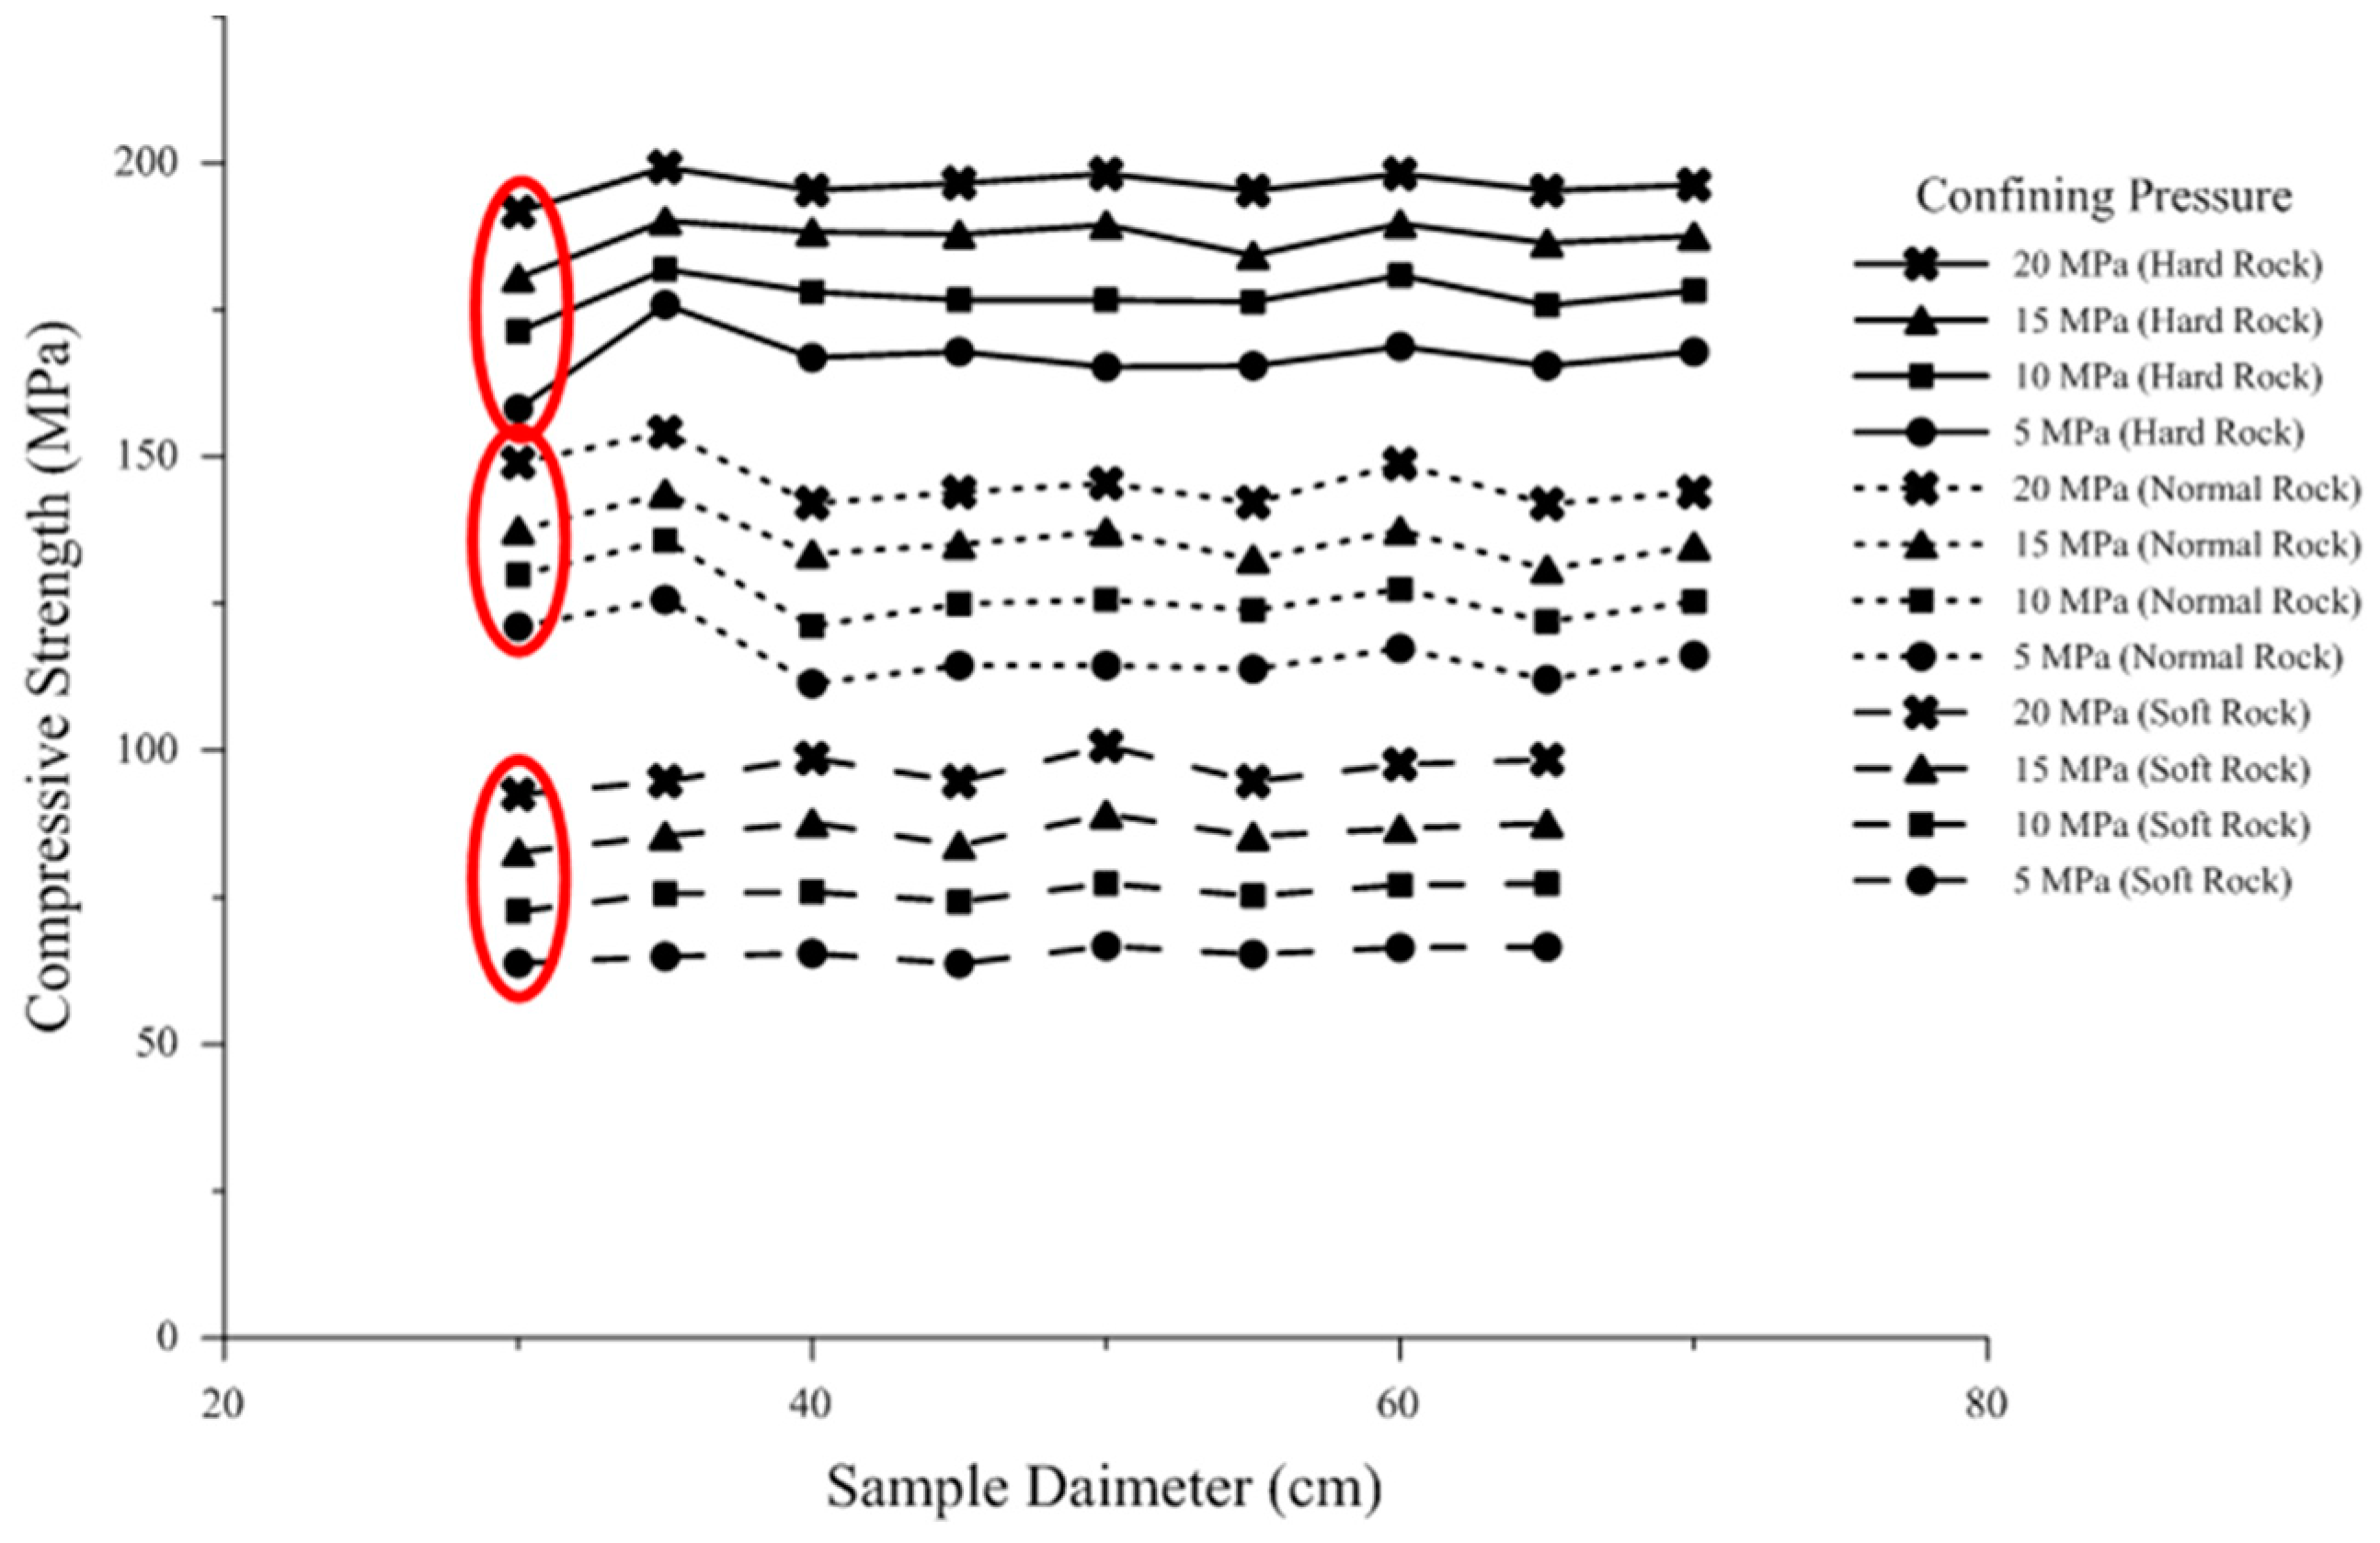
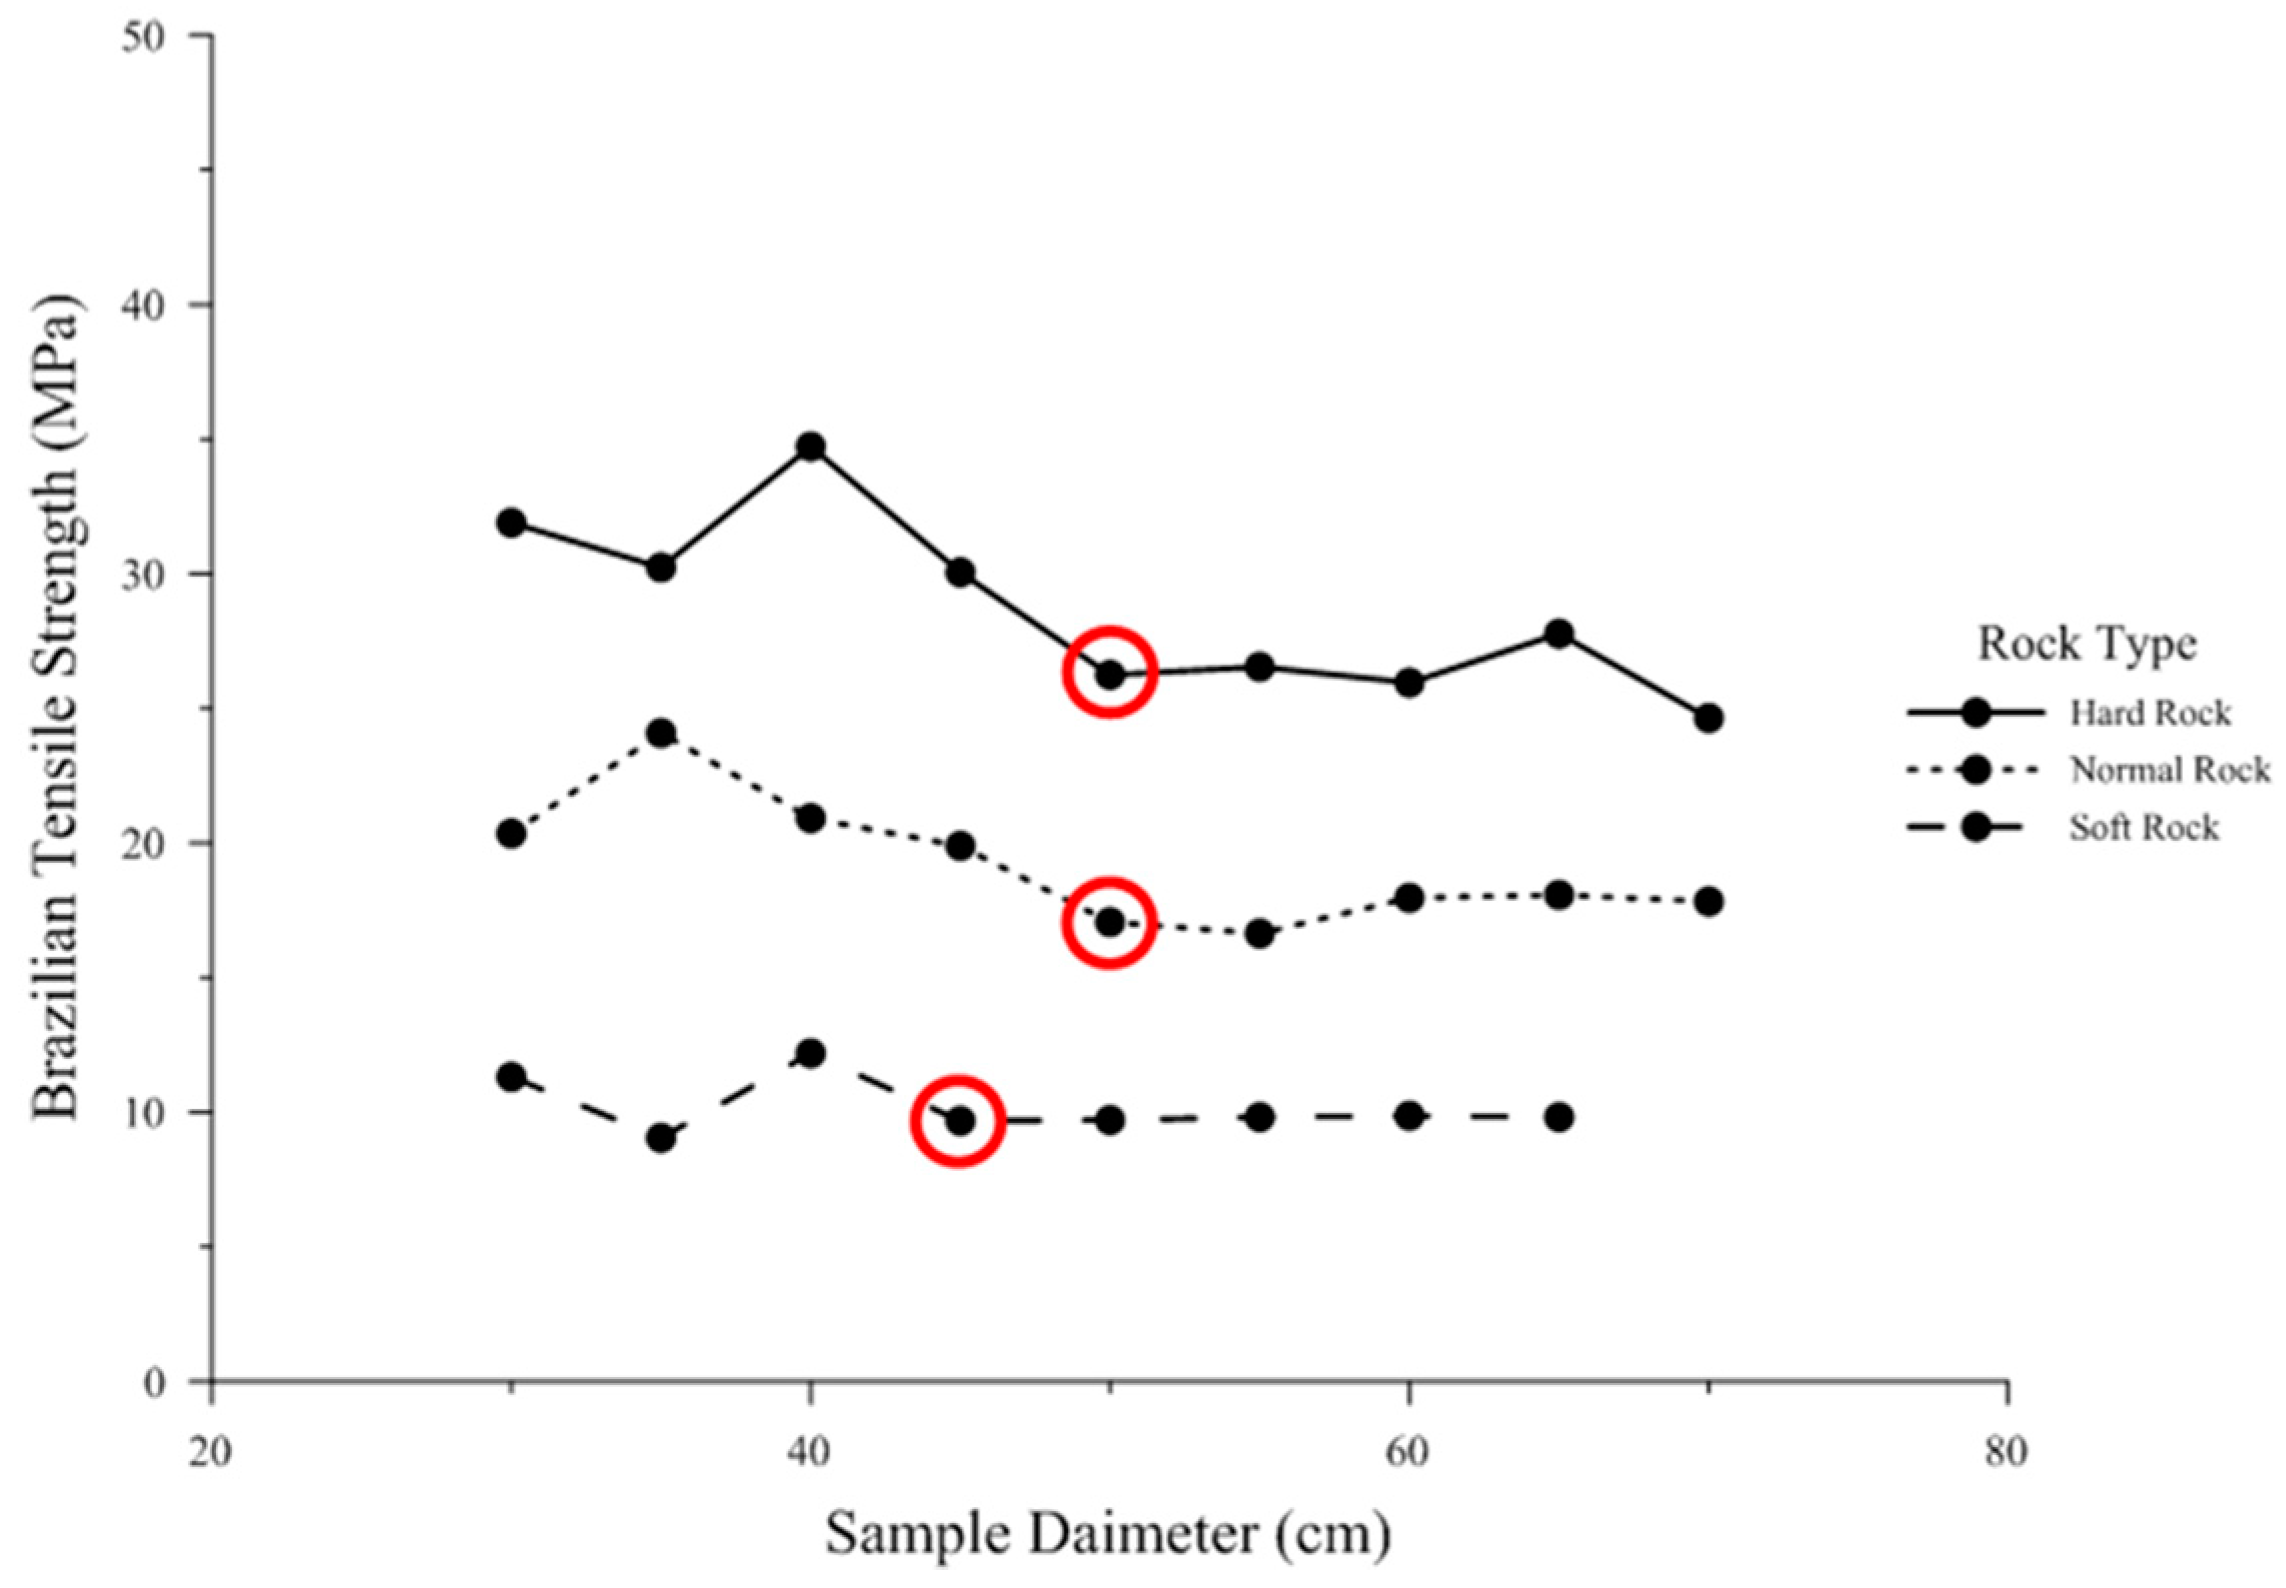
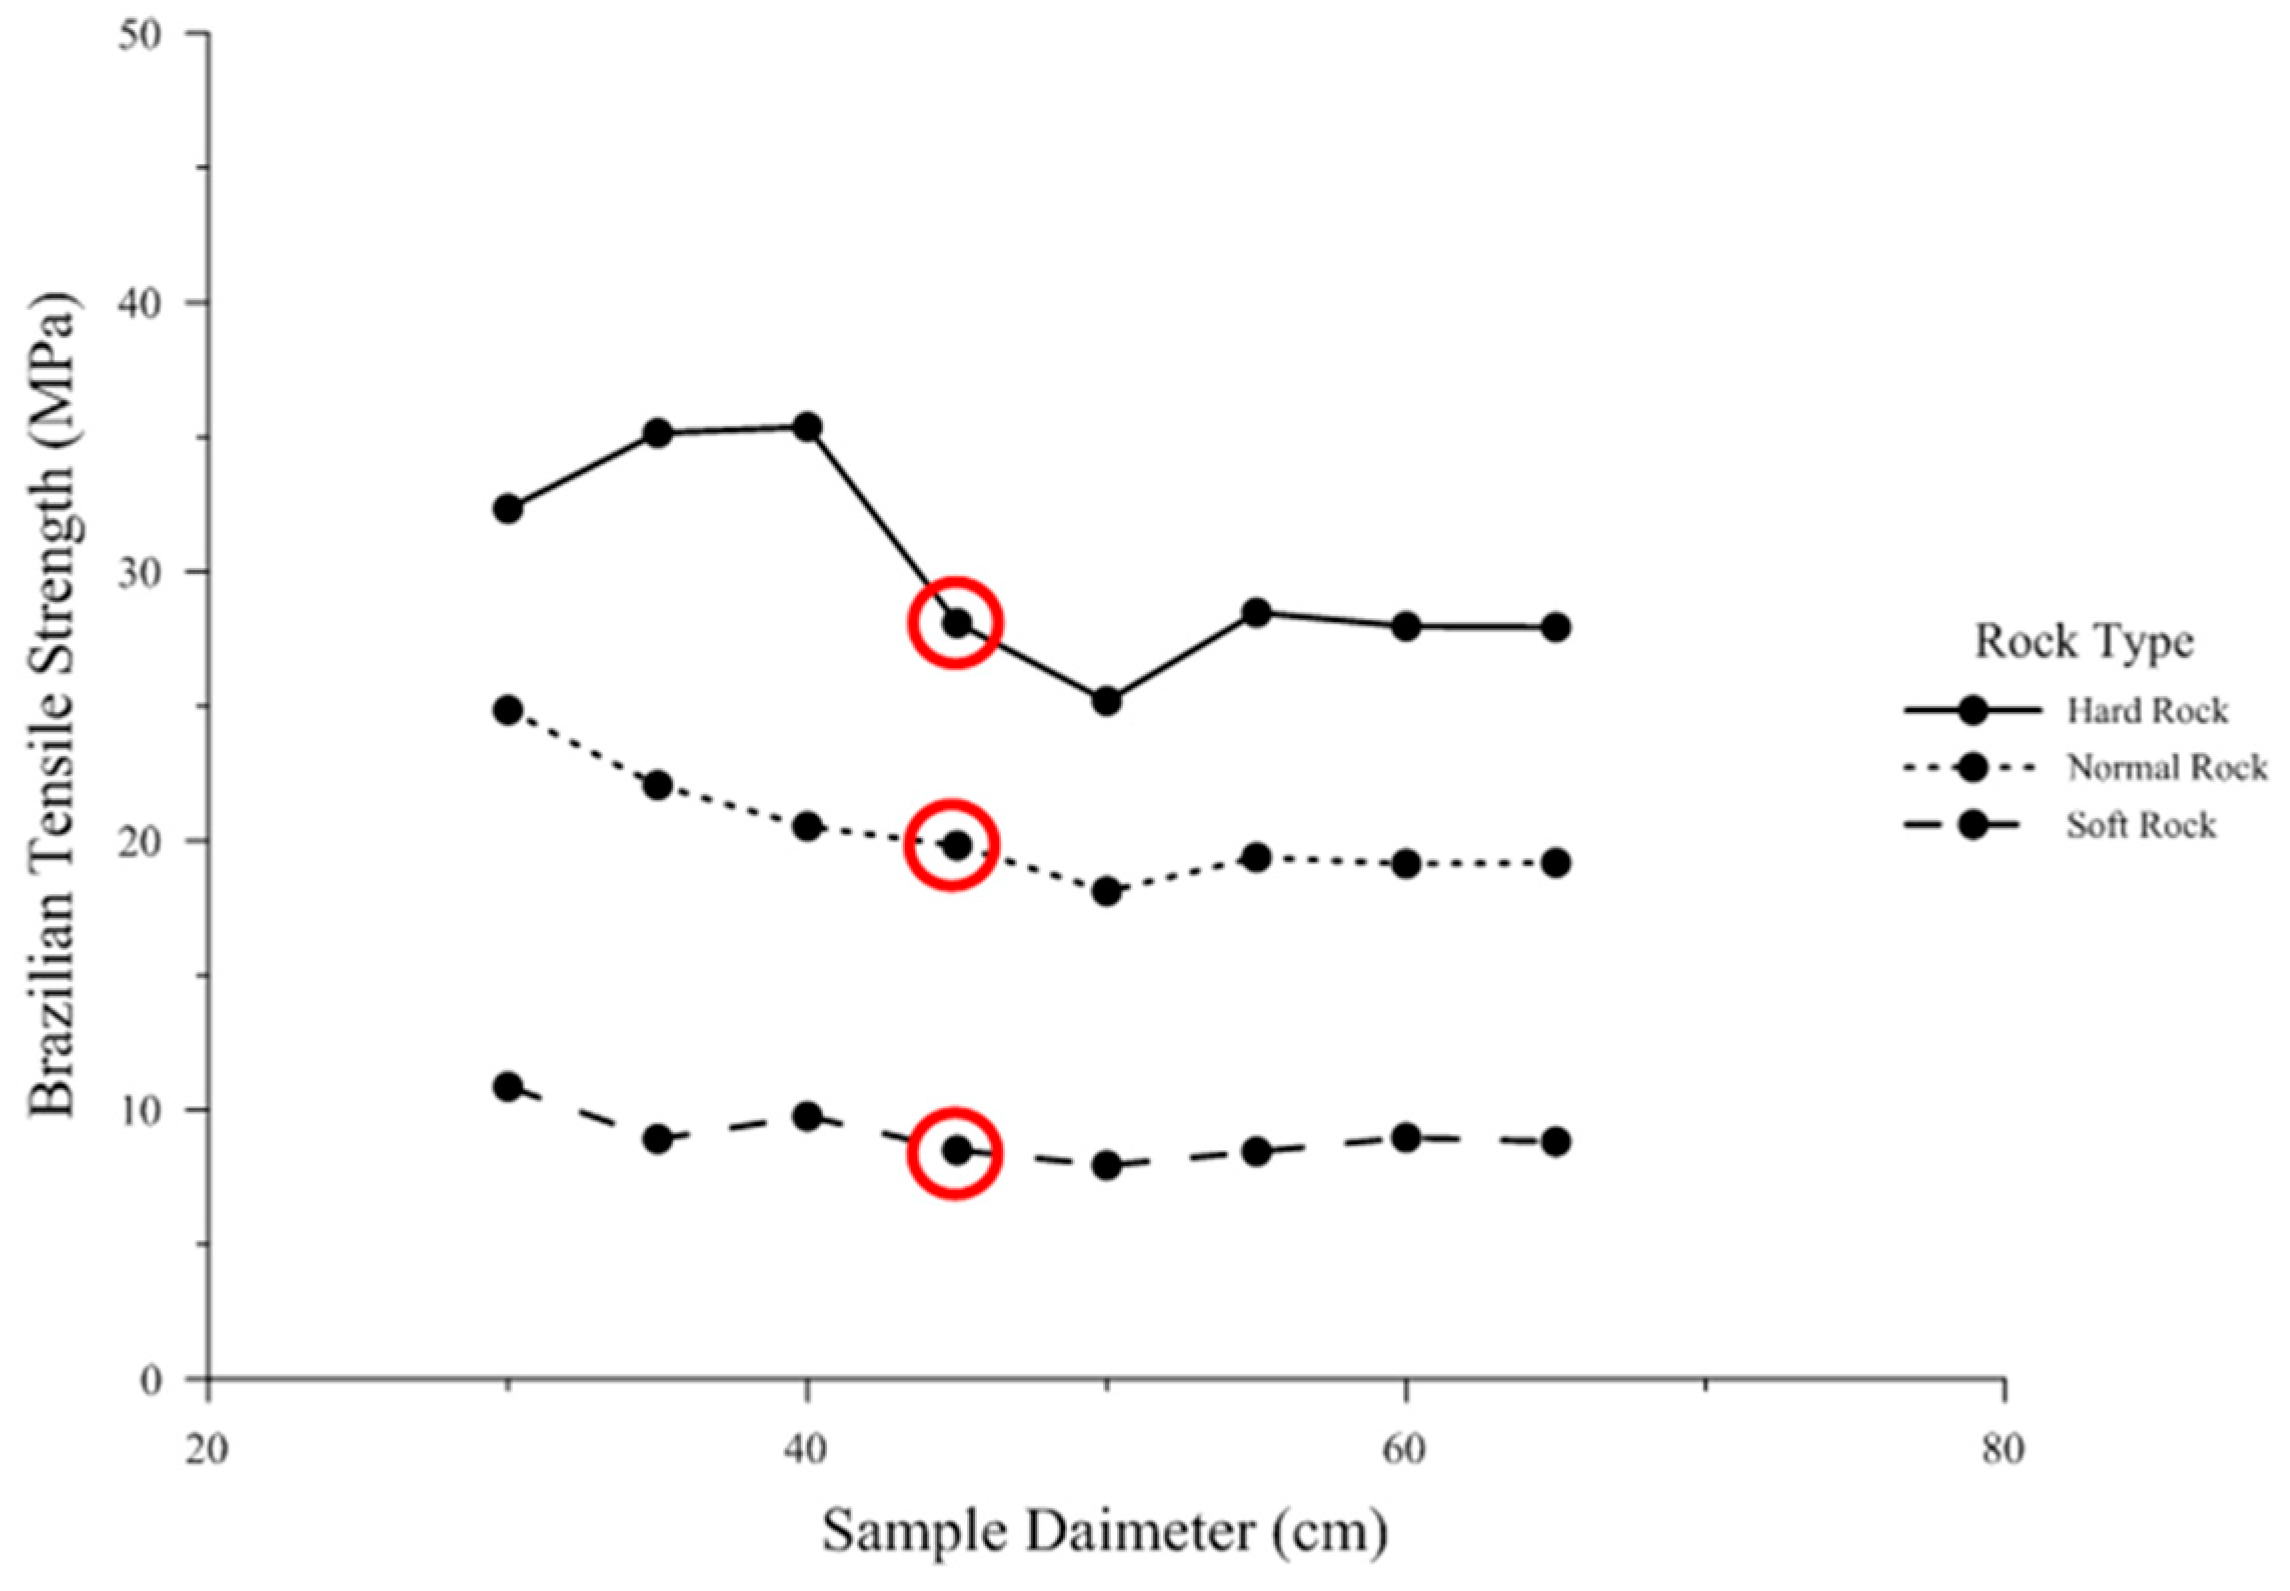
The REV concept was used in this study in order to observe the effects of sample size and particle size as well as to obtain the microscopic properties representing the homogeneous physical behavior of the model at macro scale. In this study, REV was achieved by obtaining the minimum size of the sample above which the sample diameter does not affect the mechanical behavior of the material; at coefficient of variation to be less than 5% for the average value of five consecutively larger samples. The coefficient of variation (CoV) is defined as the ratio of standard deviation to the mean values of the measured parameter under consideration. Since rock is a natural and not man-made material, the value of CoV for a rock property is generally used as less than 5% for REV studies [21,22,23,24], as the scatter in testing results or CoV of UCS, point load index and Brazilian tests was recorded as far greater than 5% after testing of many types of rock specimens [25,26,27,28,29,30]. In order to achieve REV, the initial sample of 30 cm diameter was generated and the macroscopic parameters of the sample i.e., UCS, Young’s modulus (E) and Poisson’s ratio (υ), were obtained by performing UCS tests for all rock types in PFC2D code. The microscopic parameters were sequentially calibrated so that the required macroscopic parameters could be achieved. Brazilian tensile strength (BTS) tests and compressive strength tests at confining pressures of 5, 10, 15 and 20 MPa were performed for all rock types using 30 cm diameter sample and the results were recorded. More samples were generated by increasing the sample diameter by 5 cm at a time and UCS, BTS and compression tests were performed for each increased sample diameter until the CoV of all the macroscopic parameters (UCS, E, υ, BTS and compressive strengths at various confining pressures) for five consecutively larger samples was obtained to be less than 5%. Every time diameter of the sample was increased, the calibration of microscopic parameters had to be performed in UCS tests so that the required UCS, E, and υ for the increased sample size could be achieved. For REV calculations, all the microscopic parameters given in Table 4 needed not to be changed and only four microscopic parameters namely; particle–particle contact Young’s modulus (Ec), Young’s modulus of parallel bond (Ēc), parallel bond normal and shear strength ( and ) were carefully calibrated in UCS tests each time the sample diameter was increased. In the calibration process, the values of particle-particle contact Young’s modulus (Ec) were kept equal to the values of Young’s modulus of parallel bond (Ēc), whereas, the values of parallel bond normal strength ( were kept equal to the values of parallel bond shear strength (. The compression test results for low modulus ratio, average modulus ratio, and high modulus ratio are presented in Figure 5, Figure 6 and Figure 7, respectively. The BTS test results for low modulus ratio, average modulus ratio, and high modulus ratio are presented in Figure 8, Figure 9 and Figure 10, respectively. For each case of intact rock strength (UCS), according to their modulus ratio, the compression tests as well as BTS tests were performed simultaneously by increasing the sample diameter by 5 cm at a time until REV was achieved for both compression and BTS tests. The microscopic parameters, obtained after calibration by performing UCS tests and REV calculations for BTS and compression tests, change with the increase in sample diameter. The values obtained for both compression and BTS tests were then recorded and were used to calculate CoV in each case for a set of five consecutively larger samples. The tests were used to stop conducting when the CoV was calculated to be less than 5% which indicated that the smallest sample of the set of five consecutively larger samples represents REV. Since, the CoV of all UCS tests were obtained to be less than 5%, REV was achieved at 30 cm sample diameter for all the cases when compression tests were performed but, in all the cases of BTS tests, REV was achieved at sample diameter greater than 30 cm. This means that REV is dependent on the BTS tests results more than the compression test results. That is why, the higher sample diameter among the REV results of compression and BTS tests for each case was selected to represent REV of that case. The microscopic parameters related to that sample diameter in each case were then used to simulate the intact rock for conducting the rock splitting process. In Figure 5, Figure 6, Figure 7, Figure 8, Figure 9 and Figure 10, the sample diameter at REV for each case is shown by highlighting the compression and BTS values at that sample diameter in red circles. The importance of performing REV calculations for PFC2D simulations is that if the microscopic parameters related to any sample size is used for modeling, then the compressive strength and tensile strength of the rock-like material prepared in PFC2D does not represent the actual compressive and tensile strength of the intact rock intended to be simulated for numerical analysis.
For high modulus ratio, the sample diameters at REV for soft rock, normal rock, and hard rock were obtained as 40, 45 and 45 cm, respectively. For average modulus ratio, the sample diameters at REV for soft rock, normal rock, and hard rock were obtained as 45, 45 and 45 cm, respectively. For low modulus ratio, the sample diameters at REV for soft rock, normal rock, and hard rock were obtained as 45, 50 and 50 cm, respectively. Based on the REV calculations, the values obtained for particle-particle contact Young’s modulus (Ec) and Young’s modulus of parallel bond (Ēc) for all types of rocks are presented in Table 5 and the values obtained for parallel bond normal and shear strength ( and ) for all types of rock are presented in Table 6.
3.4. Model Preparation Using REV Calculations
In order to simulate the rock splitting process in all types of rock using PFC2D, the rock splitting models of size 6 m × 6 m were prepared with fixed boundary conditions, as shown in Figure 11a. The particles at the model boundaries were fixed to control the displacements at the boundary. The microscopic parameters obtained for each rock type through REV calculations were used in simulating the rock splitting model for each case. In order to prepare a free surface, the particles at the top of the model as well as adjacent to the proposed borehole were removed up to 2 m, as shown in Figure 11b. Subsequently, a borehole of 76 mm diameter was excavated by removing the particles starting from the upper free surface of the model up to a depth of 1.4 m, as shown in Figure 11c. Finally, two walls were installed at both sides of the excavated borehole up to 1 m depth for simulating the counter-wedges, as shown in Figure 11d. The stiffness of both walls was kept as 200 GPa [31] in order to match the stiffness of structural steel used in fabricating the counter-wedges of the split-wedge system.
In order to analyze rock splitting in soft rock, normal rock, and hard rock, the initial value of borehole spacing was kept as 0.5 m that was gradually increased until the crack propagation due to split-wedge action could not reach the adjacent free space. Borehole spacing can be defined as the horizontal distance from the center of the borehole to the free space created adjacent to it. The rock splitting analyses was performed by increasing the borehole spacing values in soft, normal and hard rocks. A series of rock splitting experiments were performed by using the splitting width of 20 mm. Splitting width is the horizontal distance between the two sides of the borehole after the counter-wedges finish their splitting function. For achieving the splitting width in the rock splitting model, the two walls installed at both sides of the excavated borehole were moved apart and their displacements were monitored in both cases until the distance between both walls was obtained as 20 mm. The initial model was prepared with the borehole spacing of 0.5 m in all cases of rock strength. A number of models were generated by increasing the borehole spacing by 0.1 m at a time and rock splitting process was performed until the crack propagation failed to reach the free surface, as shown in Figure 12a,b.
4. Results
The results for all cases show that a microcracking or breakout zone, consisting of micro-tensile and micro-shear cracks, was formed between the side of the borehole and its adjacent free space due to rock splitting process. In Figure 12, the micro-tensile and micro-shear cracks generated due to rock splitting can be seen in black and red colors respectively. The grey color in the breakout zone represents the displacement vectors in the model. When the split-wedge system started splitting the sides of the borehole, micro-shear cracks were formed around the periphery of the borehole. These micro-shear cracks did not propagate further than a few centimeters from the wall of borehole. Afterwards, the micro-tensile cracks started propagating horizontally from the tip of the counter-wedge towards the adjacent free space. This horizontal propagation of micro-tensile cracks can be viewed as a result of the thrust from the counter-wedge.
In most of the cases, the propagation of the micro-tensile cracks created a primary fracture surface that separated the breakout zone from the rock material. In some cases, however, one or more secondary fracture surfaces were also observed to either emanate from the primary fracture or being developed individually due to the rock splitting action. The depth of breakout zone did not seem to vary with the borehole spacing and ranged between 1 m and 1.4 m. The maximum values of borehole spacing for which the fracture surface reached the adjacent free surface in all cases of modulus ratio for soft rock, normal rock, and hard rock are presented in Figure 13. Since, the modulus ratio concept is not considered in typically used vales of maximum borehole spacing, a comparison between the numerical analysis results and the typically used values of borehole spacing can be useful.
The numerical analysis results show that the maximum borehole spacing values for all three types of intact rock using low modulus ratio were slightly less than the typically used values of borehole spacing. However, in the cases of average modulus ratio and high modulus ratio, much greater values of maximum borehole spacing are proposed to be used in all types of intact rock as compared to the typically used values. The maximum borehole spacing tends to decrease with the increase in UCS value of intact rock because the crack formation due to the counter-wedge pressure on the borehole walls becomes easier as the strength of intact rock decreases, since the in-situ stresses are not involved in the modeling process. Whereas, the maximum borehole spacing increases with the increase in modulus ratio due to the brittleness of rock because the increase in Young’s modulus of intact rock increases the strain energy stored in it which results in the brittle nature of rock.
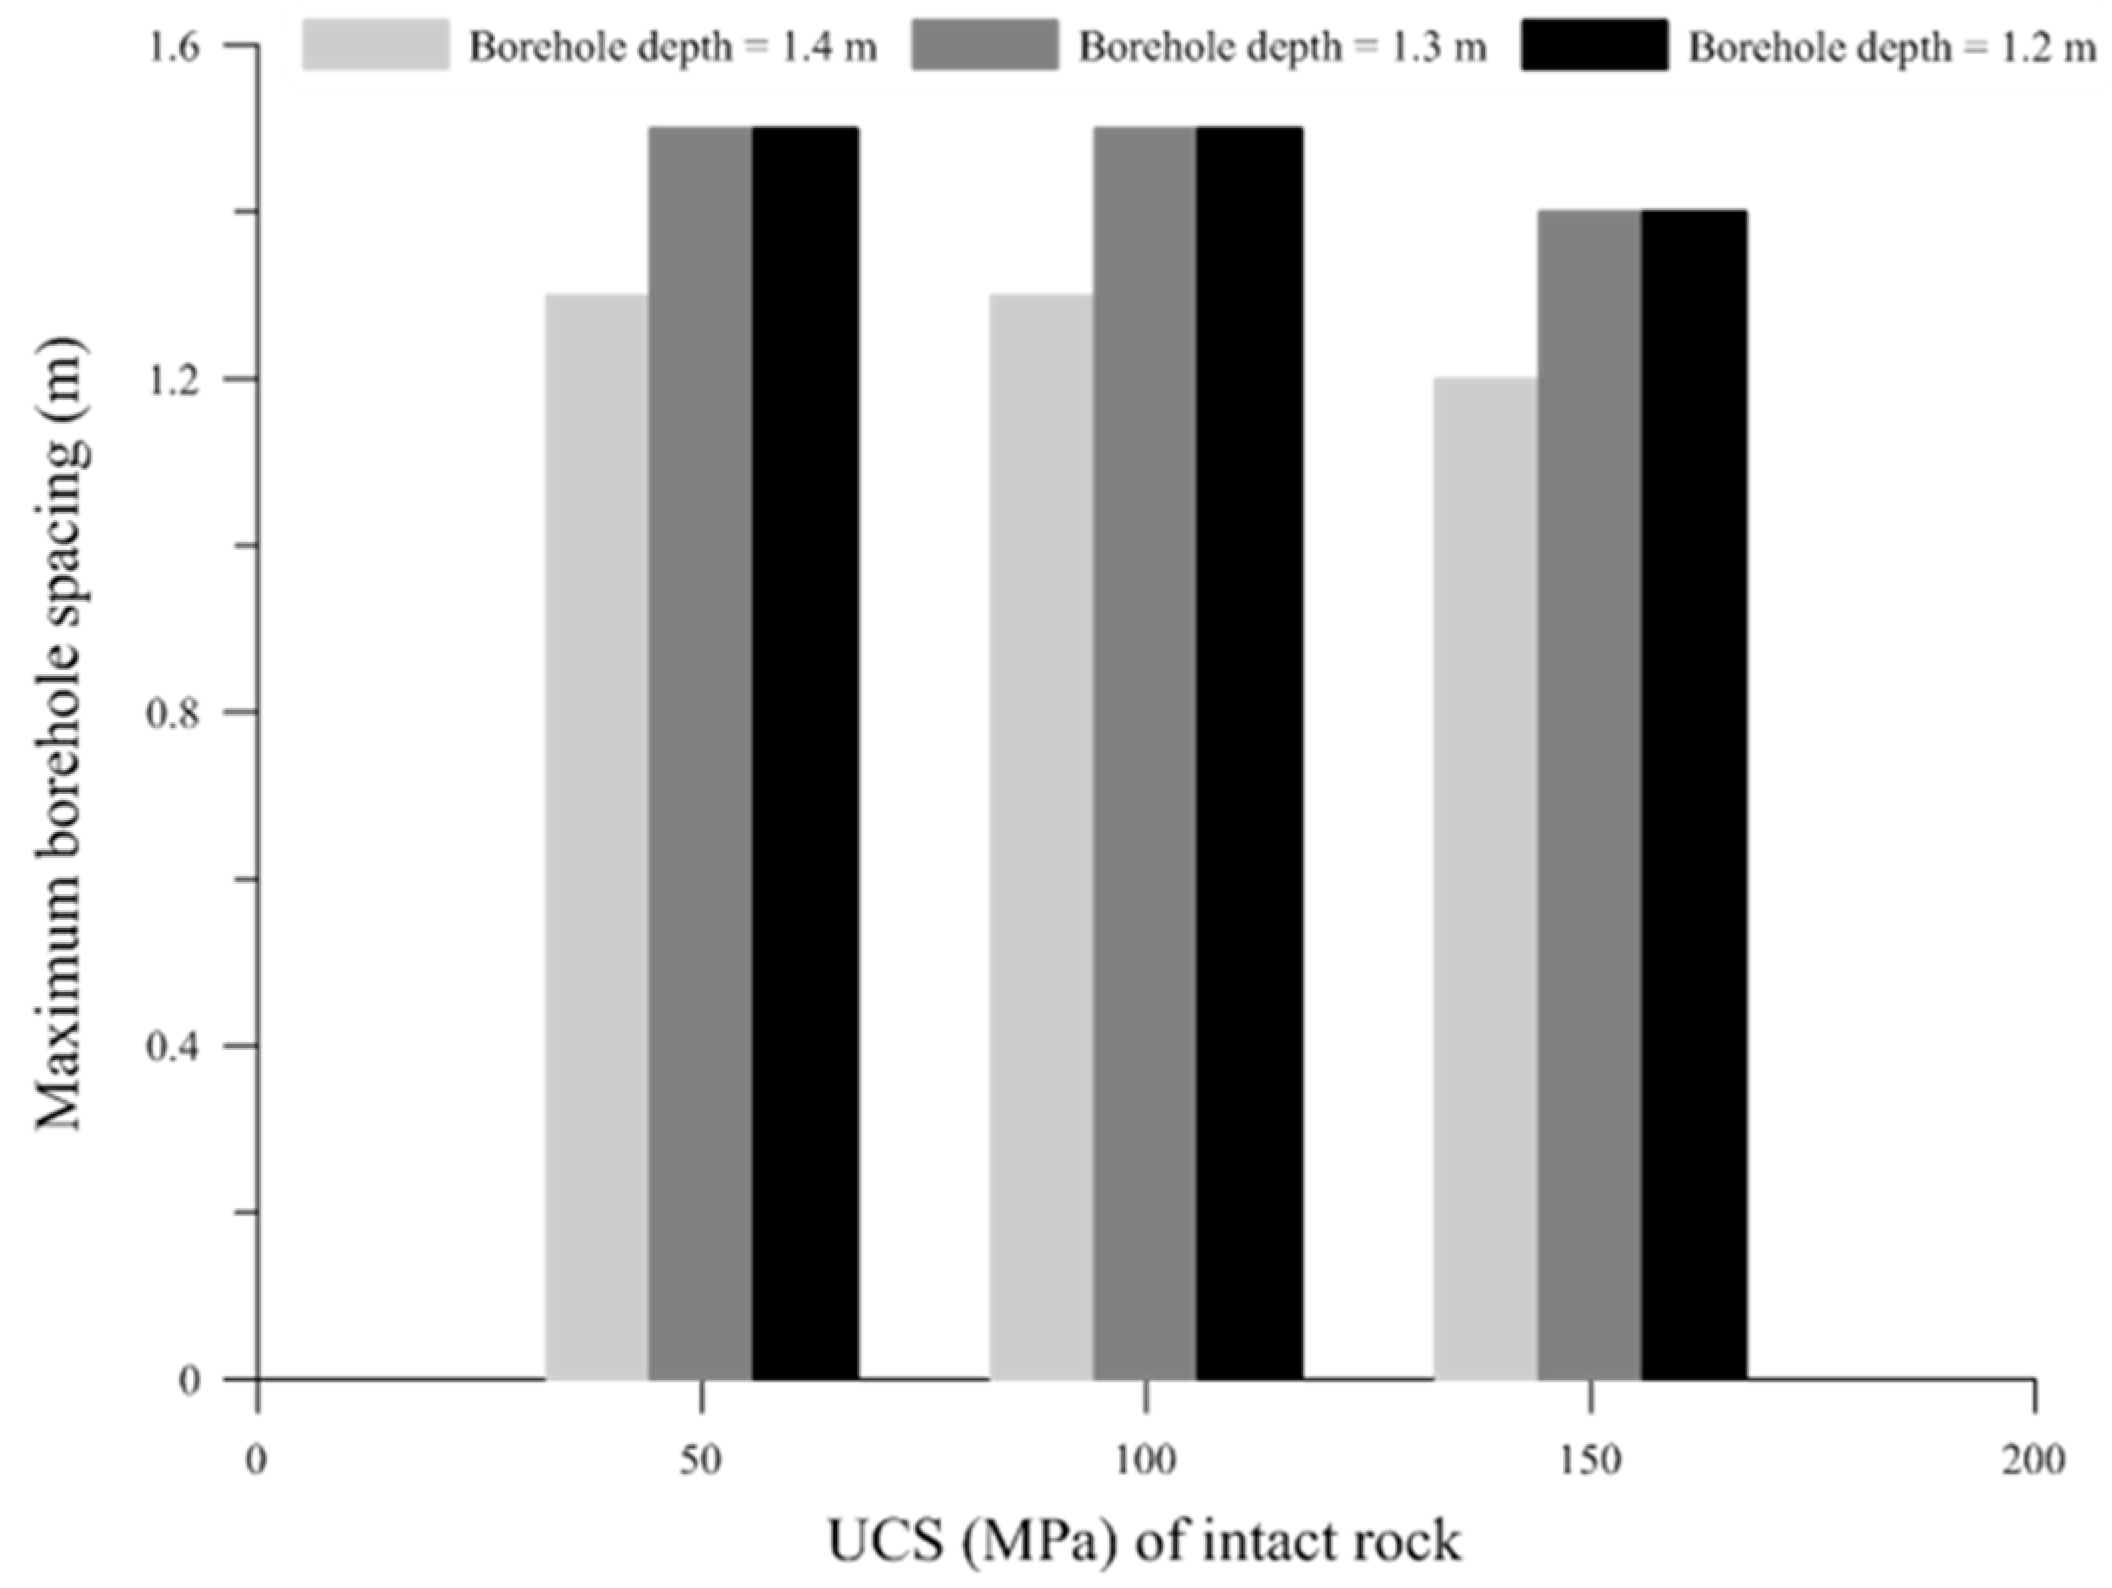
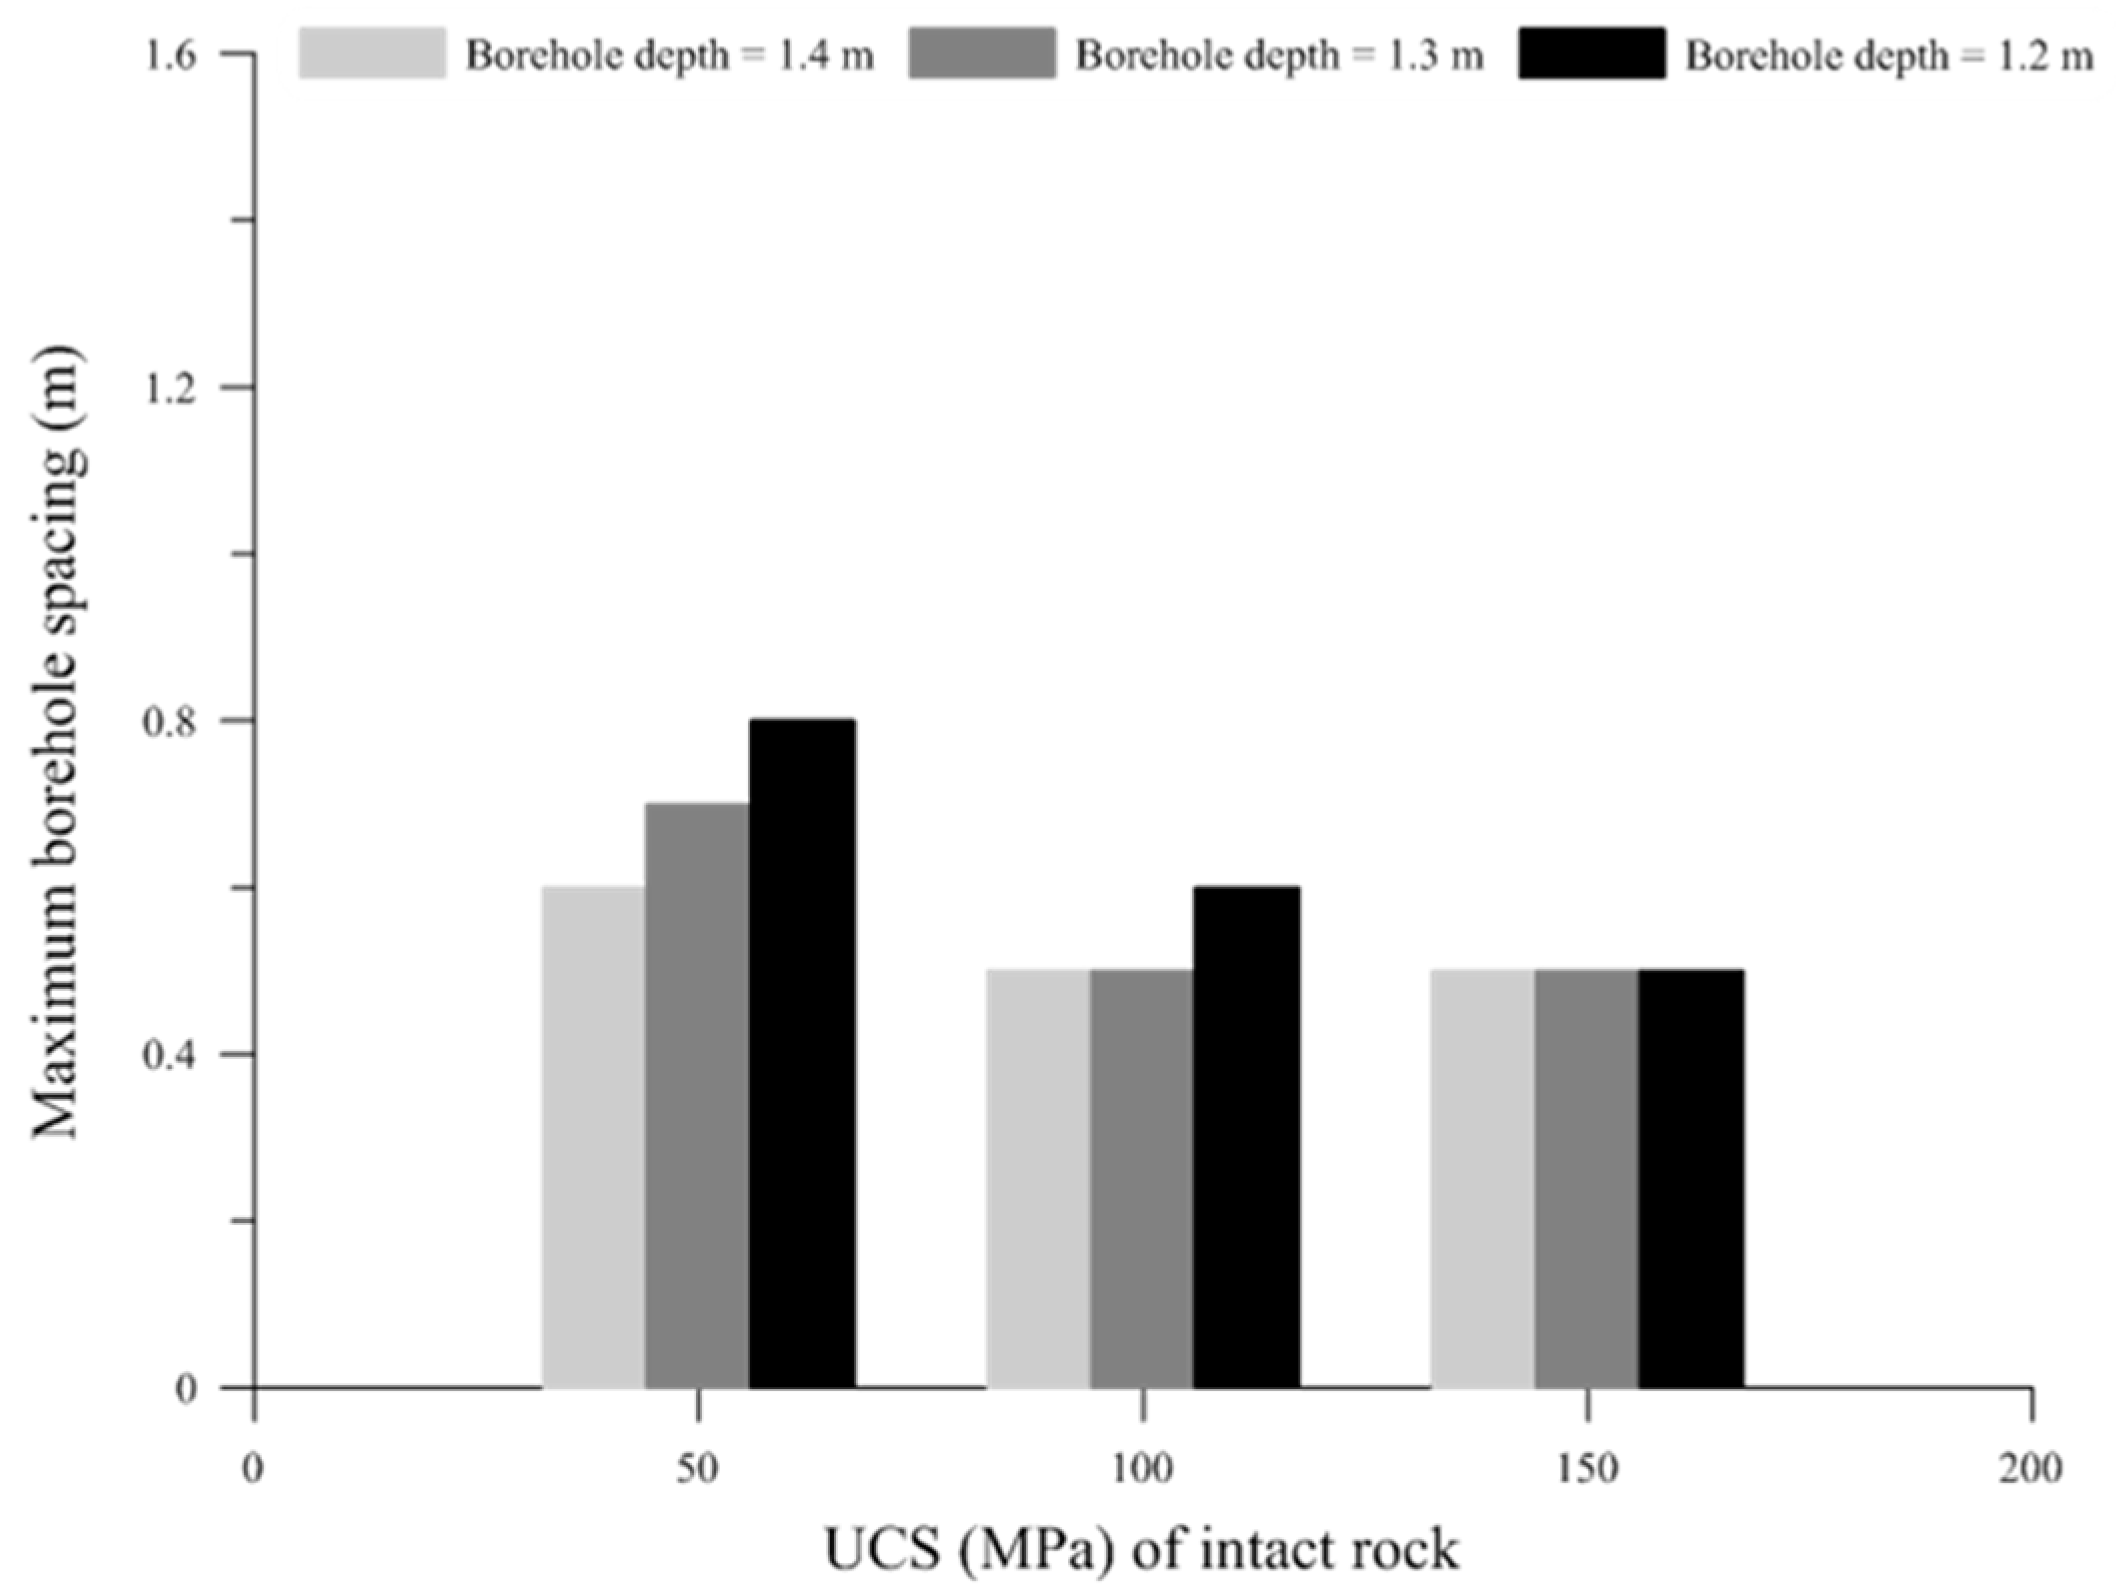
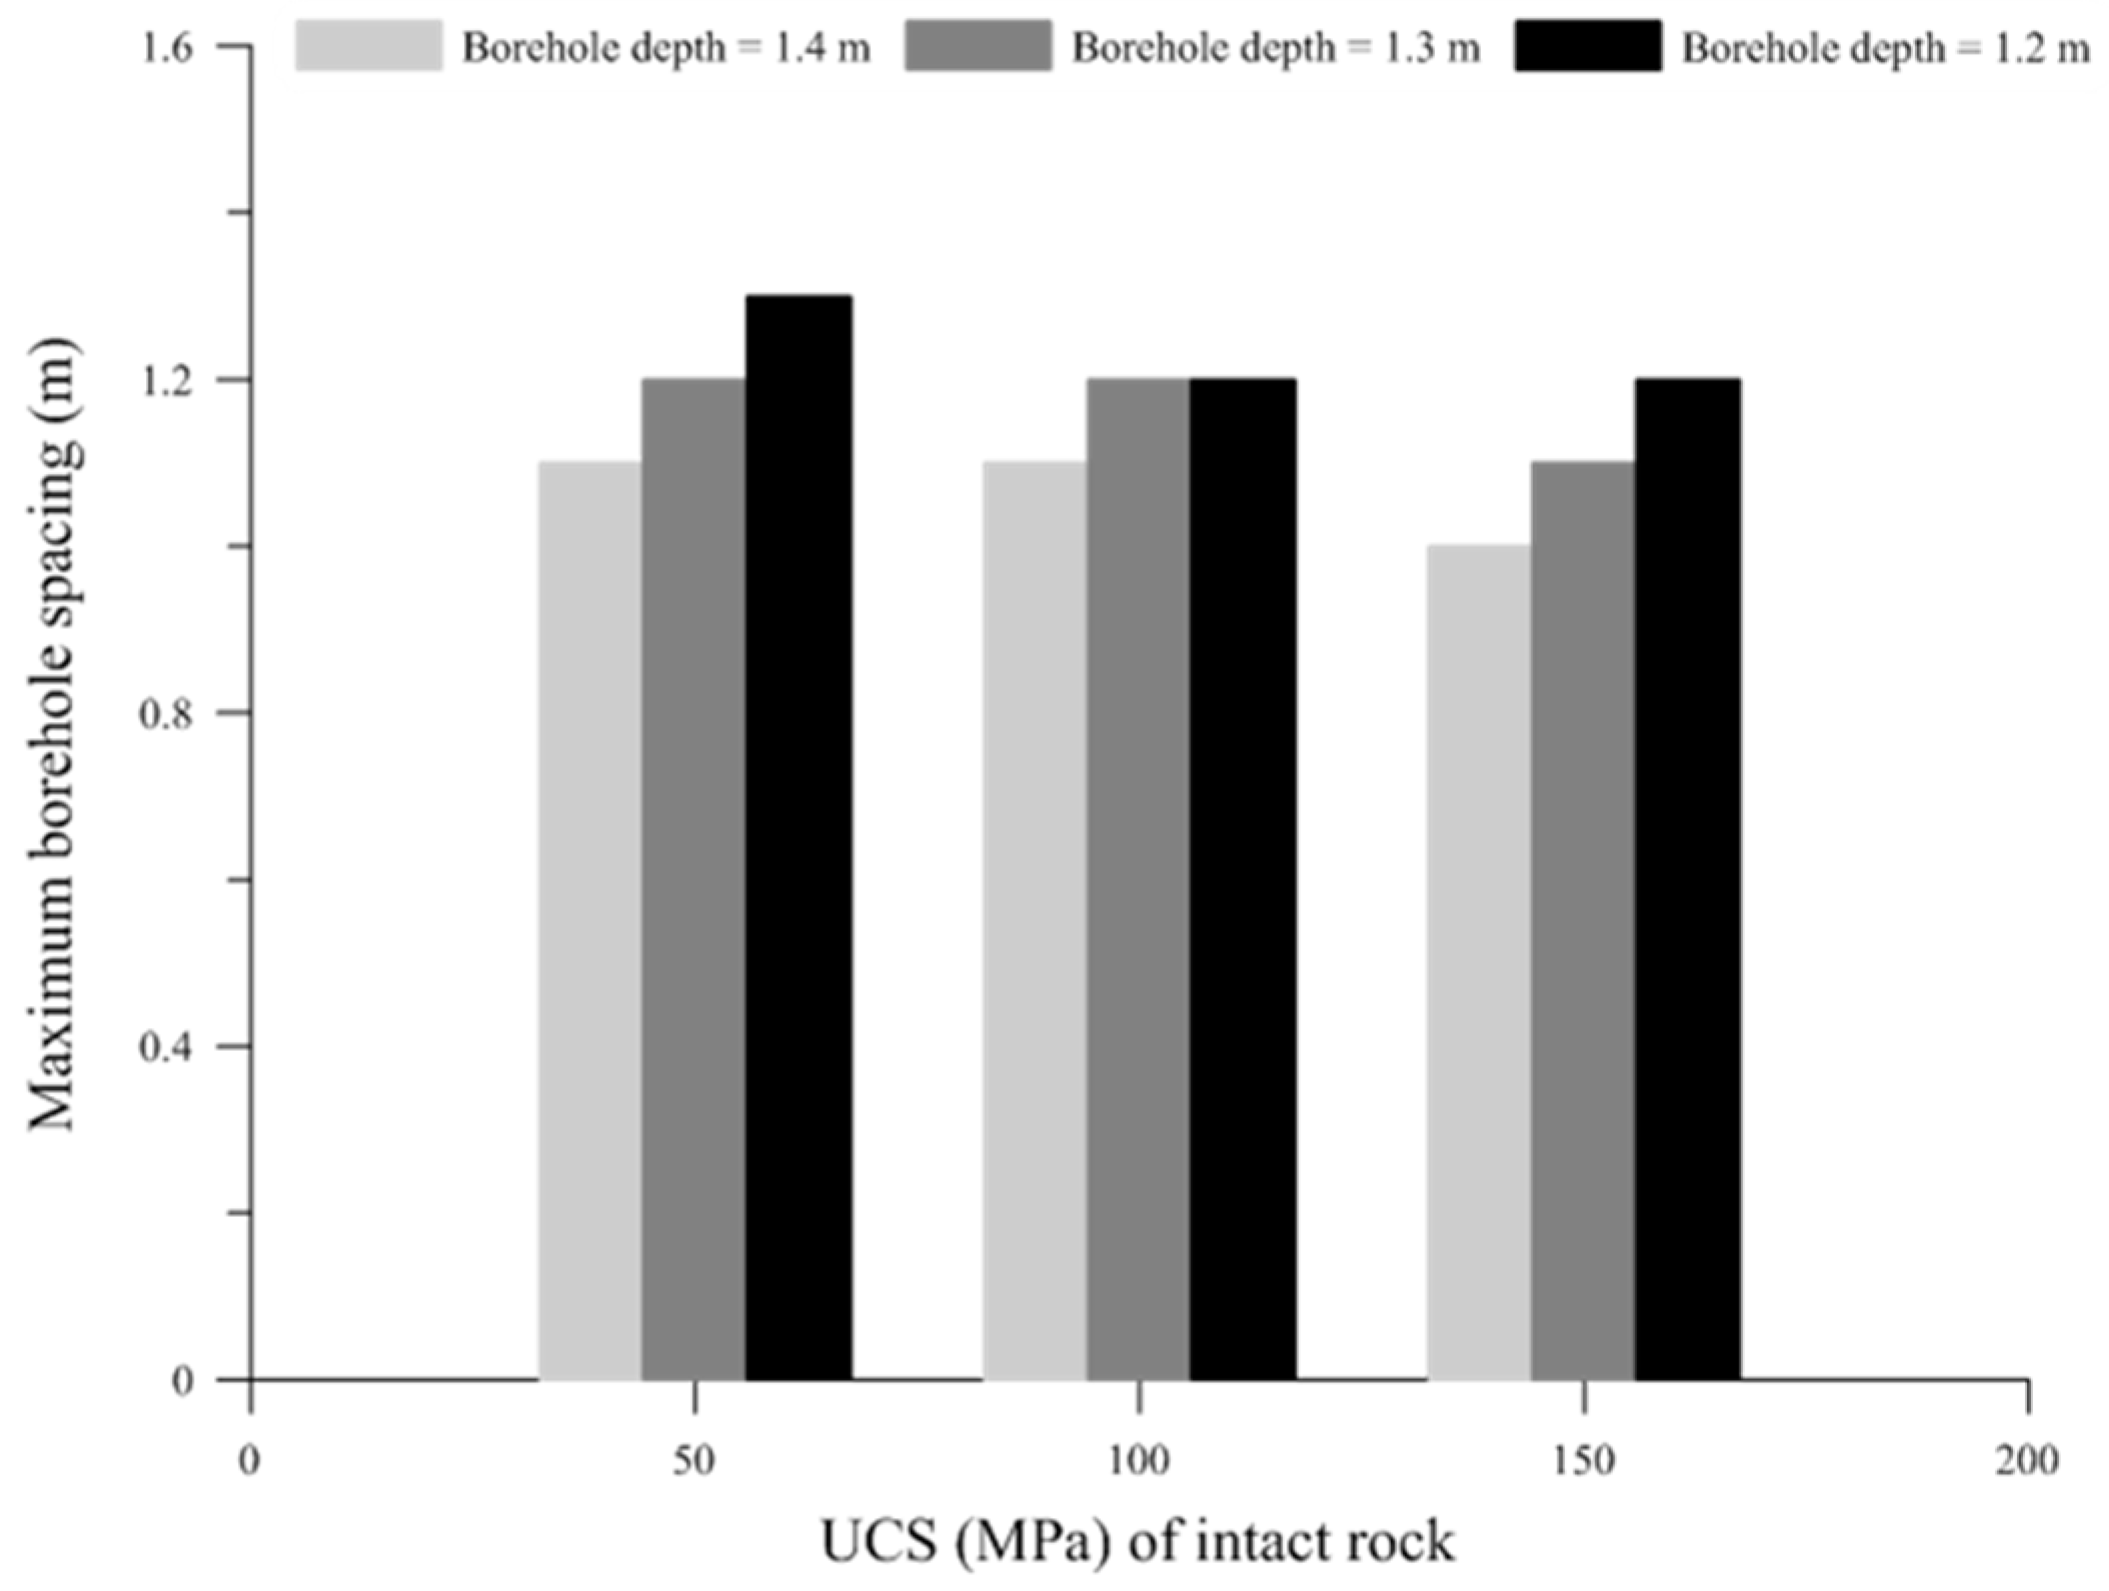
Furthermore, the breakout zones formed in all of the three intact rock types were also investigated by decreasing the depth of drilled boreholes. As shown in Figure 14a–c, respectively, the borehole depth values of 1.4, 1.3 and 1.2 m were simulated in order to investigate the maximum borehole spacing for all cases of modulus ratio in soft, normal, and hard rock using the splitting width of 20 mm. The maximum values of borehole spacing in all three types of intact rock obtained by using the borehole depth values of 1.4, 1.3 and 1.2 m were recorded and the results obtained by using low modulus ratio, average modulus ratio, and high modulus ratio are presented separately in Figure 15, Figure 16 and Figure 17, respectively.
The effect of increase in modulus ratio was observed to be overall greater than that of decrease in UCS on the increase in maximum borehole spacing. Therefore, it is proposed to consider the effect of modulus ratio of intact rock during the selection of borehole spacing in any rock strength. The results obtained for low modulus ratio shows that decreasing the borehole depth has no effects on hard rock, whereas, increased borehole spacing values were obtained for both soft rock and normal rock when the borehole depth value was decreased up to 1.2 m. So in case of low modulus ratio, the borehole depth value of 1.2 m is proposed to be used in soft rock and normal rock for utilizing increased borehole spacing values as compared to those typically used. The results for the case of average modulus ratio generally suggest that by employing 1.2 m borehole depth, increased borehole spacing values can be used in soft rock, normal rock, and hard rock. So in case of average modulus ratio, it is proposed to use 1.2 m borehole depth in all three types of rock. The effect of decrease in borehole depth on the maximum borehole spacing results in case of high modulus ratio was observed to be less than the cases of other two modulus ratio, for all three types of rock because the maximum borehole spacing values were obtained to be same when borehole depths of 1.3 and 1.2 m were used. Based on this observation, it is proposed that either 1.3 or 1.2 m borehole depth values can be used in case of high modulus ratio for soft rock, normal rock, and hard rock in order to utilize increased borehole spacing.
5. Discussion
Non-vibrational rock splitting method is effectively being used in the construction industry for tunneling and various other purposes. Borehole spacing and borehole depth are some of the important parameters involved in this method that can remarkably affect the excavation process. The borehole spacing values typically used in the field are based only on the UCS values of rock and the modulus ratio of rock is not considered at all. Using two-dimensional DEM model in this study, feasible borehole spacing values are presented according to the combined effect of UCS and modulus ratio. Although a wide range of UCS and modulus ratio were used for the numerical analysis, but the results show a clear trend in which the borehole spacing values depend on both the UCS and modulus ratio of rock. Based on the results obtained in this study, it is proposed that the guidelines suggesting the maximum borehole spacing values in different kinds of rock should be based not only on the UCS but also the modulus ratio of rock. While some important factors like pre-existing joints and fractures, and in-situ stresses were not considered, yet the findings of this study can still be useful for the industry to optimize the rock-splitting process. The existing literature on this topic does not cover the important parameters like borehole spacing, borehole depth and modulus ratio concept, so the results produced in this study can be utilized as a base to investigate various other parameters involved in the non-vibrational rock splitting method.
6. Conclusions
In order to undergo economical and efficient excavation process by using the non-vibrational rock splitting method, the increase in borehole spacing values plays a great role. For this purpose, discrete element analysis of this method was performed using PFC2D code and feasible borehole spacing values to be used in different types of intact rock are proposed in this study. The concept of Representative Elementary Volume was used to simulate intact rocks based on their unconfined compressive strength and modulus ratio concept. The modulus ratio is defined as the ratio of Young’s modulus to unconfined compressive strength of intact rock. Based on unconfined compressive strength, the intact rock was classified into soft rock, normal rock, and hard rock and their respective UCS values were used as 50, 100 and 150 MPa. Based on modulus ratio concept, the three intact rock types were further classified into high modulus ratio (550:1), average modulus ratio (300:1), and low modulus ratio (150:1). Rock splitting models were prepared for different types of intact rock and maximum borehole spacing values were recorded in each case by performing rock splitting process using 20 mm splitting width and 1.4 m borehole depth. The numerical analysis results show that increased values of borehole spacing can be used for all rock types when the intact rock has average modulus ratio and high modulus ratio. The maximum borehole spacing results for low modulus ratio were obtained slightly less than the typically used values. Therefore, it is important to consider the modulus ratio of the intact rock when the non-vibrational rock splitting method is used for excavation purposes. Furthermore, numerical simulations were performed to analyze the effects of borehole depth on maximum borehole spacing in all types of intact rock. Three different borehole depths of 1.4 m, 1.3 m and 1.2 m were analyzed using splitting width of 20 mm. The results show that decreasing the borehole depth value in rock splitting process can generally be useful by resulting in the use of increased borehole spacing values for all types of intact rocks. This study is mainly based on the discrete element analysis of the rock splitting process and maximum borehole spacing values in different strengths of intact rock are proposed to be used in non-vibrational rock splitting method. However, the presence of joints and pre-existing fractures as well as the in-situ stresses need to be considered for the future studies. Furthermore, the numerical analysis results obtained in this study also need to be compared with the field testing results or physical model test results.
Acknowledgments
This research was supported by Development of Design and Construction Technology for Double Deck Tunnel in Great Depth Underground Space (14SCIP-B088624-01) from Construction Technology Research Program funded by Ministry of Land, Infrastructure and Transport of Korean government.
Author Contributions
Turab H. Jafri and Hankyu Yoo conceived the main idea. Turab H. Jafri designed the experimental technique and performed the numerical simulations. Turab H. Jafri and Hankyu Yoo wrote the paper.
Conflicts of Interest
The authors declare no conflict of interest.
References
- Jafri, T.H.; Yoo, H.-K. Proposing feasible borehole spacing in non-vibrational rock splitting method using discrete element modeling. In Proceedings of the Advances in Structural Engineering and Mechanics (ASEM17), Seoul, Korea, 28 August–1 September 2017. [Google Scholar]
- Noma, T.; Tsuchiya, T. Development of low noise and vibration tunneling methods using slots by single hole continuous drilling. Tunn. Undergr. Space Technol. 2003, 18, 263–270. [Google Scholar] [CrossRef]
- Volden, J.A.B. Engineering Geological Evaluation of the Applicability of Drill & Split in Tunnels at the Follo Line Project. Master’s Thesis, Norwegian University of Science and Technology, Trondheim, Norway, 2015. [Google Scholar]
- Won, Y.-H.; Kang, C.-W.; Ryu, C.-H. The study of noise and vibration on application of the method breaking & excavating rock (Super wedge). In Proceedings of the KSEE Conference, Daejon, Korea, 19 October 2006. [Google Scholar]
- Federal Transportation Authority (FTA). Guidance Manual for Transit Noise and Vibration Impact Assessment; (in DOT). FTA: Washington, DC, USA, 1995. [Google Scholar]
- Deere, D.U.; Miller, R.P. Illinois Univ at Urbana Dept of Civil Engineering. Engineering Classification and Index Properties for Intact Rock; Defense Technical Information Center: Fort Belvoir, VA, USA, 1966.
- Zhang, L. Drilled Shafts in Rock: Analysis and Design; CRC Press: Boca Raton, FL, USA, 2004; ISBN 0203024427. [Google Scholar]
- Baekyang Eng Co., Ltd. Available online: http://bycsw.co.kr/en/super-wedge/ (accessed on 10 February 2018).
- Powerking Corporation. Available online: http://www.powerkingmc.com/product/pro03.php (accessed on 10 February 2018).
- Hagimori, K.; Furukawa, K.; Nakagawa, K.; Yokozeki, Y. Study of non-blasting tunnelling by slot drilling method. In Proceedings of the 7th ISRM Congress, Aachen, Germany, 16–20 September 1991. [Google Scholar]
- Murata, M.; Yokozawa, K. Mechanical excavation of hard rock tunnels without environmental disturbance: Effectiveness of TBM-driven pilot tunnels in non-blasting rock breaking method. In Proceedings of the 1st ARMS International Congress on Rock Mechanics, Seoul, Korea, 13–15 October 1997. [Google Scholar]
- Bear, J. Dynamics of Fluids in Porous Materials; Society of Petroleum Engineers: Dallas, TX, USA, 1972. [Google Scholar]
- Hudson, J.A.; Harrison, J.P. Engineering Rock Mechanics: An Introduction to the Principles; Elsevier: Amsterdam, The Netherlands, 2000; ISBN 0080530966. [Google Scholar]
- Keehm, Y.; Mukerji, T. Permeability and relative permeability from digital rocks: Issues on grid resolution and representative elementary volume. In Proceedings of the 2004 SEG Annual Meeting, Denver, Colorado, 10–15 October 2004. [Google Scholar]
- Vik, B.E.B.; Skauge, A. Evaluation of representative elementary volume for a vuggy carbonate rock—Part: Porosity, permeability, and dispersivity. J. Pet. Sci. Eng. 2013, 112, 36–47. [Google Scholar] [CrossRef]
- Shah, S.M.; Crawshaw, J.P.; Gray, F.; Yang, J.; Boek, E.S. Convex hull approach for determining rock representative elementary volume for multiple petrophysical parameters using pore-scale imaging and Lattice–Boltzmann modelling. Adv. Water Resour. 2017, 104, 65–75. [Google Scholar] [CrossRef]
- Müller, C.; Siegesmund, S.; Blum, P. Evaluation of the representative elementary volume (REV) of a fractured geothermal sandstone reservoir. Environ. Earth Sci. 2010, 61, 1713–1724. [Google Scholar] [CrossRef]
- Rong, G.; Peng, J.; Wang, X.; Liu, G.; Hou, D. Permeability tensor and representative elementary volume of fractured rock masses. Hydrol. J. 2013, 21, 1655–1671. [Google Scholar] [CrossRef]
- Baghbanan, A.; Jing, L. Hydraulic properties of fractured rock masses with correlated fracture length and aperture. Int. J. Rock Mech. Min. Sci. 2007, 44, 704–719. [Google Scholar] [CrossRef]
- Min, K.B.; Jing, L. Numerical determination of the equivalent elastic compliance tensor for fractured rock masses using the distinct element method. Int. J. Rock Mech. Min. Sci. 2003, 40, 795–816. [Google Scholar] [CrossRef]
- Koyama, T.; Jing, L. Effects of model scale and particle size on micro-mechanical properties and failure processes of rocks—A particle mechanics approach. Eng. Anal. Bound. Elem. 2007, 31, 458–472. [Google Scholar] [CrossRef]
- Gharahbagh, A.E.; Fakhimi, A. Numerical Determination of Representative Volume Element of Rock. In Proceedings of the 44th US Rock Mechanics Symposium and 5th US-Canada Rock Mechanics Symposium, Salt Lake City, UT, USA, 27–30 June 2010. [Google Scholar]
- Fakhimi, A.; Gharahbagh, A.E. Discrete element analysis of the effect of pore size and pore distribution on the mechanical behavior of rock. Int. J. Rock Mech. Min. Sci. 2011, 48, 77–85. [Google Scholar] [CrossRef]
- ASTM International. Standard Test Method for Splitting Tensile Strength of Intact Rock Core Specimens; ASTM D3967-08; ASTM International: West Conshohocken, PA, USA, 2008. [Google Scholar]
- Kim, K.; Gao, H. Probabilistic approaches to estimating variation in the mechanical properties of rock masses. Int. J. Rock Mech. Min. Sci. Geomech. Abstr. 1995, 32, 111–120. [Google Scholar] [CrossRef]
- Kahraman, S.; Bilgin, N.; Feridunoglu, C. Dominant rock properties affecting the penetration rate of percussive drills. Int. J. Rock Mech. Min. Sci. 2003, 40, 711–723. [Google Scholar] [CrossRef]
- Wiles, T.D. Reliability of numerical modelling predictions. Int. J. Rock Mech. Min. Sci. 2006, 43, 454–472. [Google Scholar] [CrossRef]
- Yarali, O.; Kahraman, S. The drillability assessment of rocks using the different brittleness values. Tunn. Undergr. Space Technol. 2011, 26, 406–414. [Google Scholar] [CrossRef]
- Sengun, N.; Altindag, R. Prediction of specific energy of carbonate rock in industrial stones cutting process. Arab. J. Geosci. 2013, 6, 1183–1190. [Google Scholar] [CrossRef]
- Perras, M.A.; Diederichs, M.S. A review of the tensile strength of rock: Concepts and testing. Geotech. Geol. Eng. 2014, 32, 525–546. [Google Scholar] [CrossRef]
- ASTM International. Standard Specification for Carbon Structural Steel; A36/A36M–08; ASTM International: West Conshohocken, PA, USA, 2008. [Google Scholar]
Figure 1.
Classification of intact rock based on modulus ratio concept.
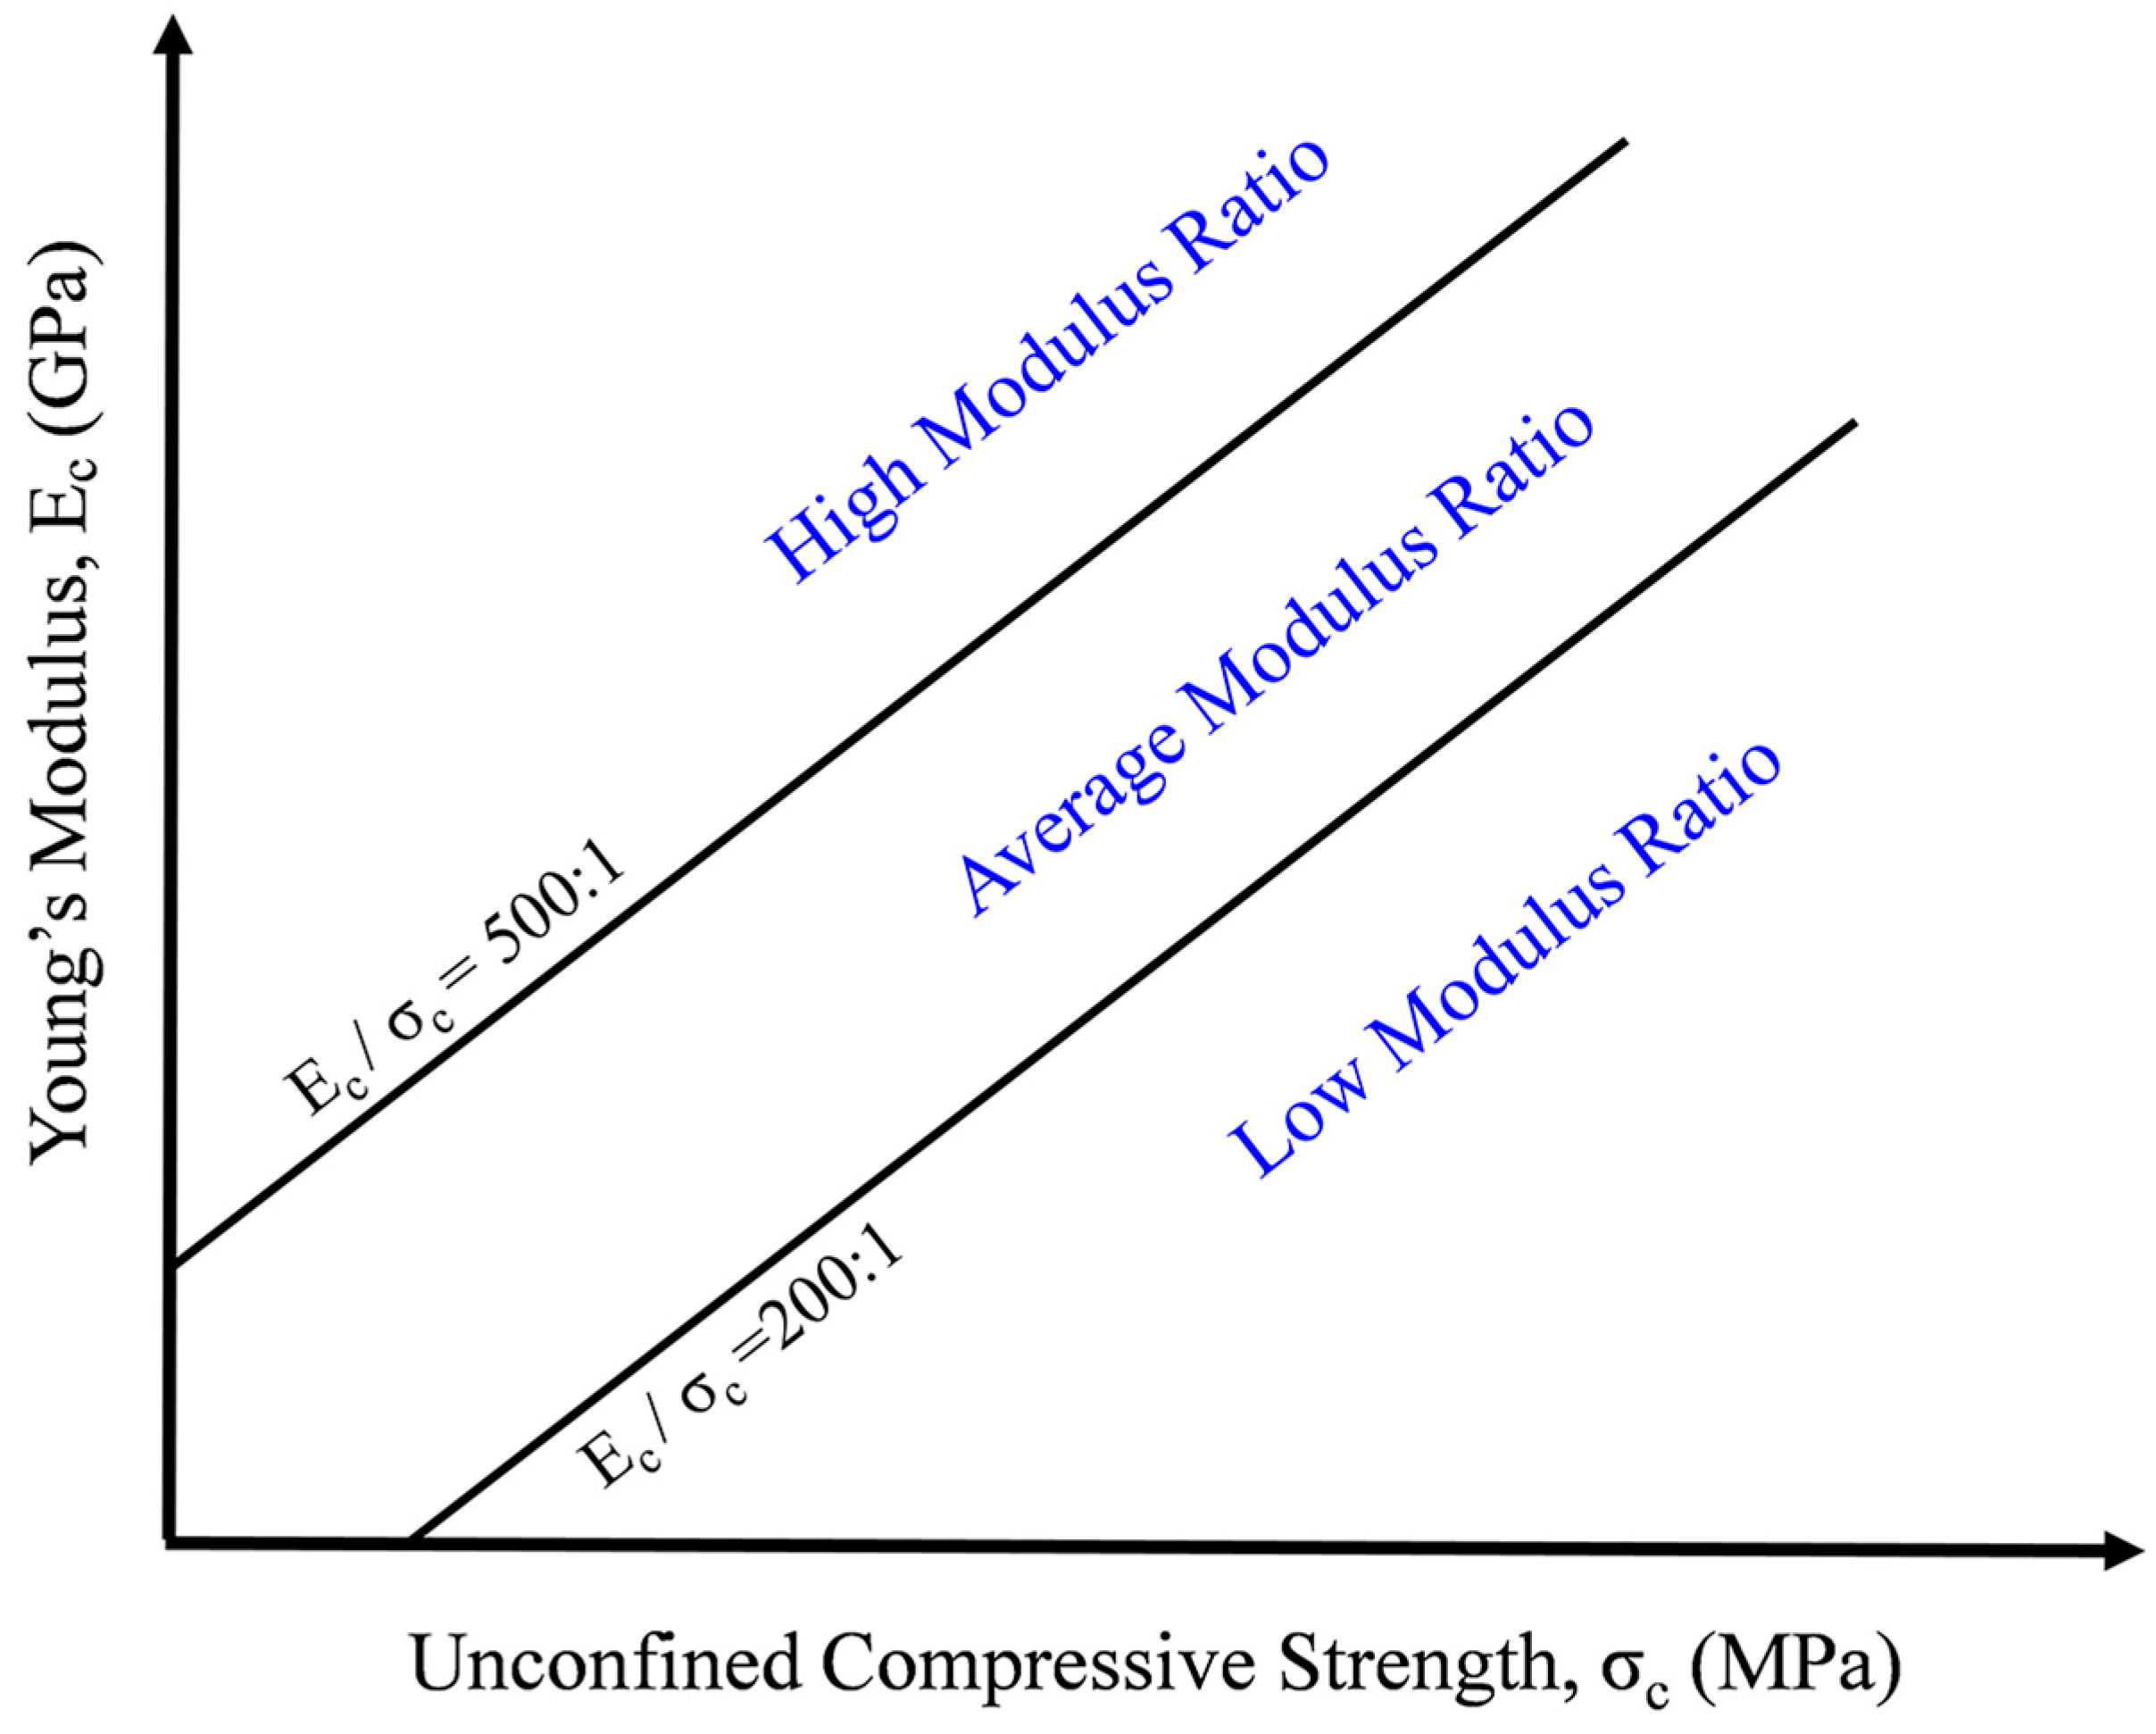
Figure 2.
Illustration of rock splitting process.

Figure 3.
Conceptual borehole configuration and free surface.

Figure 4.
Scatter in material properties with respect to the sample size, illustrating representative elementary volume (REV) based on coefficient of variation (CoV).
Figure 4.
Scatter in material properties with respect to the sample size, illustrating representative elementary volume (REV) based on coefficient of variation (CoV).

Figure 5.
Compression test results (low modulus ratio), sample diameter at REV in red circle.

Figure 6.
Compression test results (average modulus ratio), sample diameter at REV in red circle.

Figure 7.
Compression test results (high modulus ratio), sample diameter at REV in red circle.
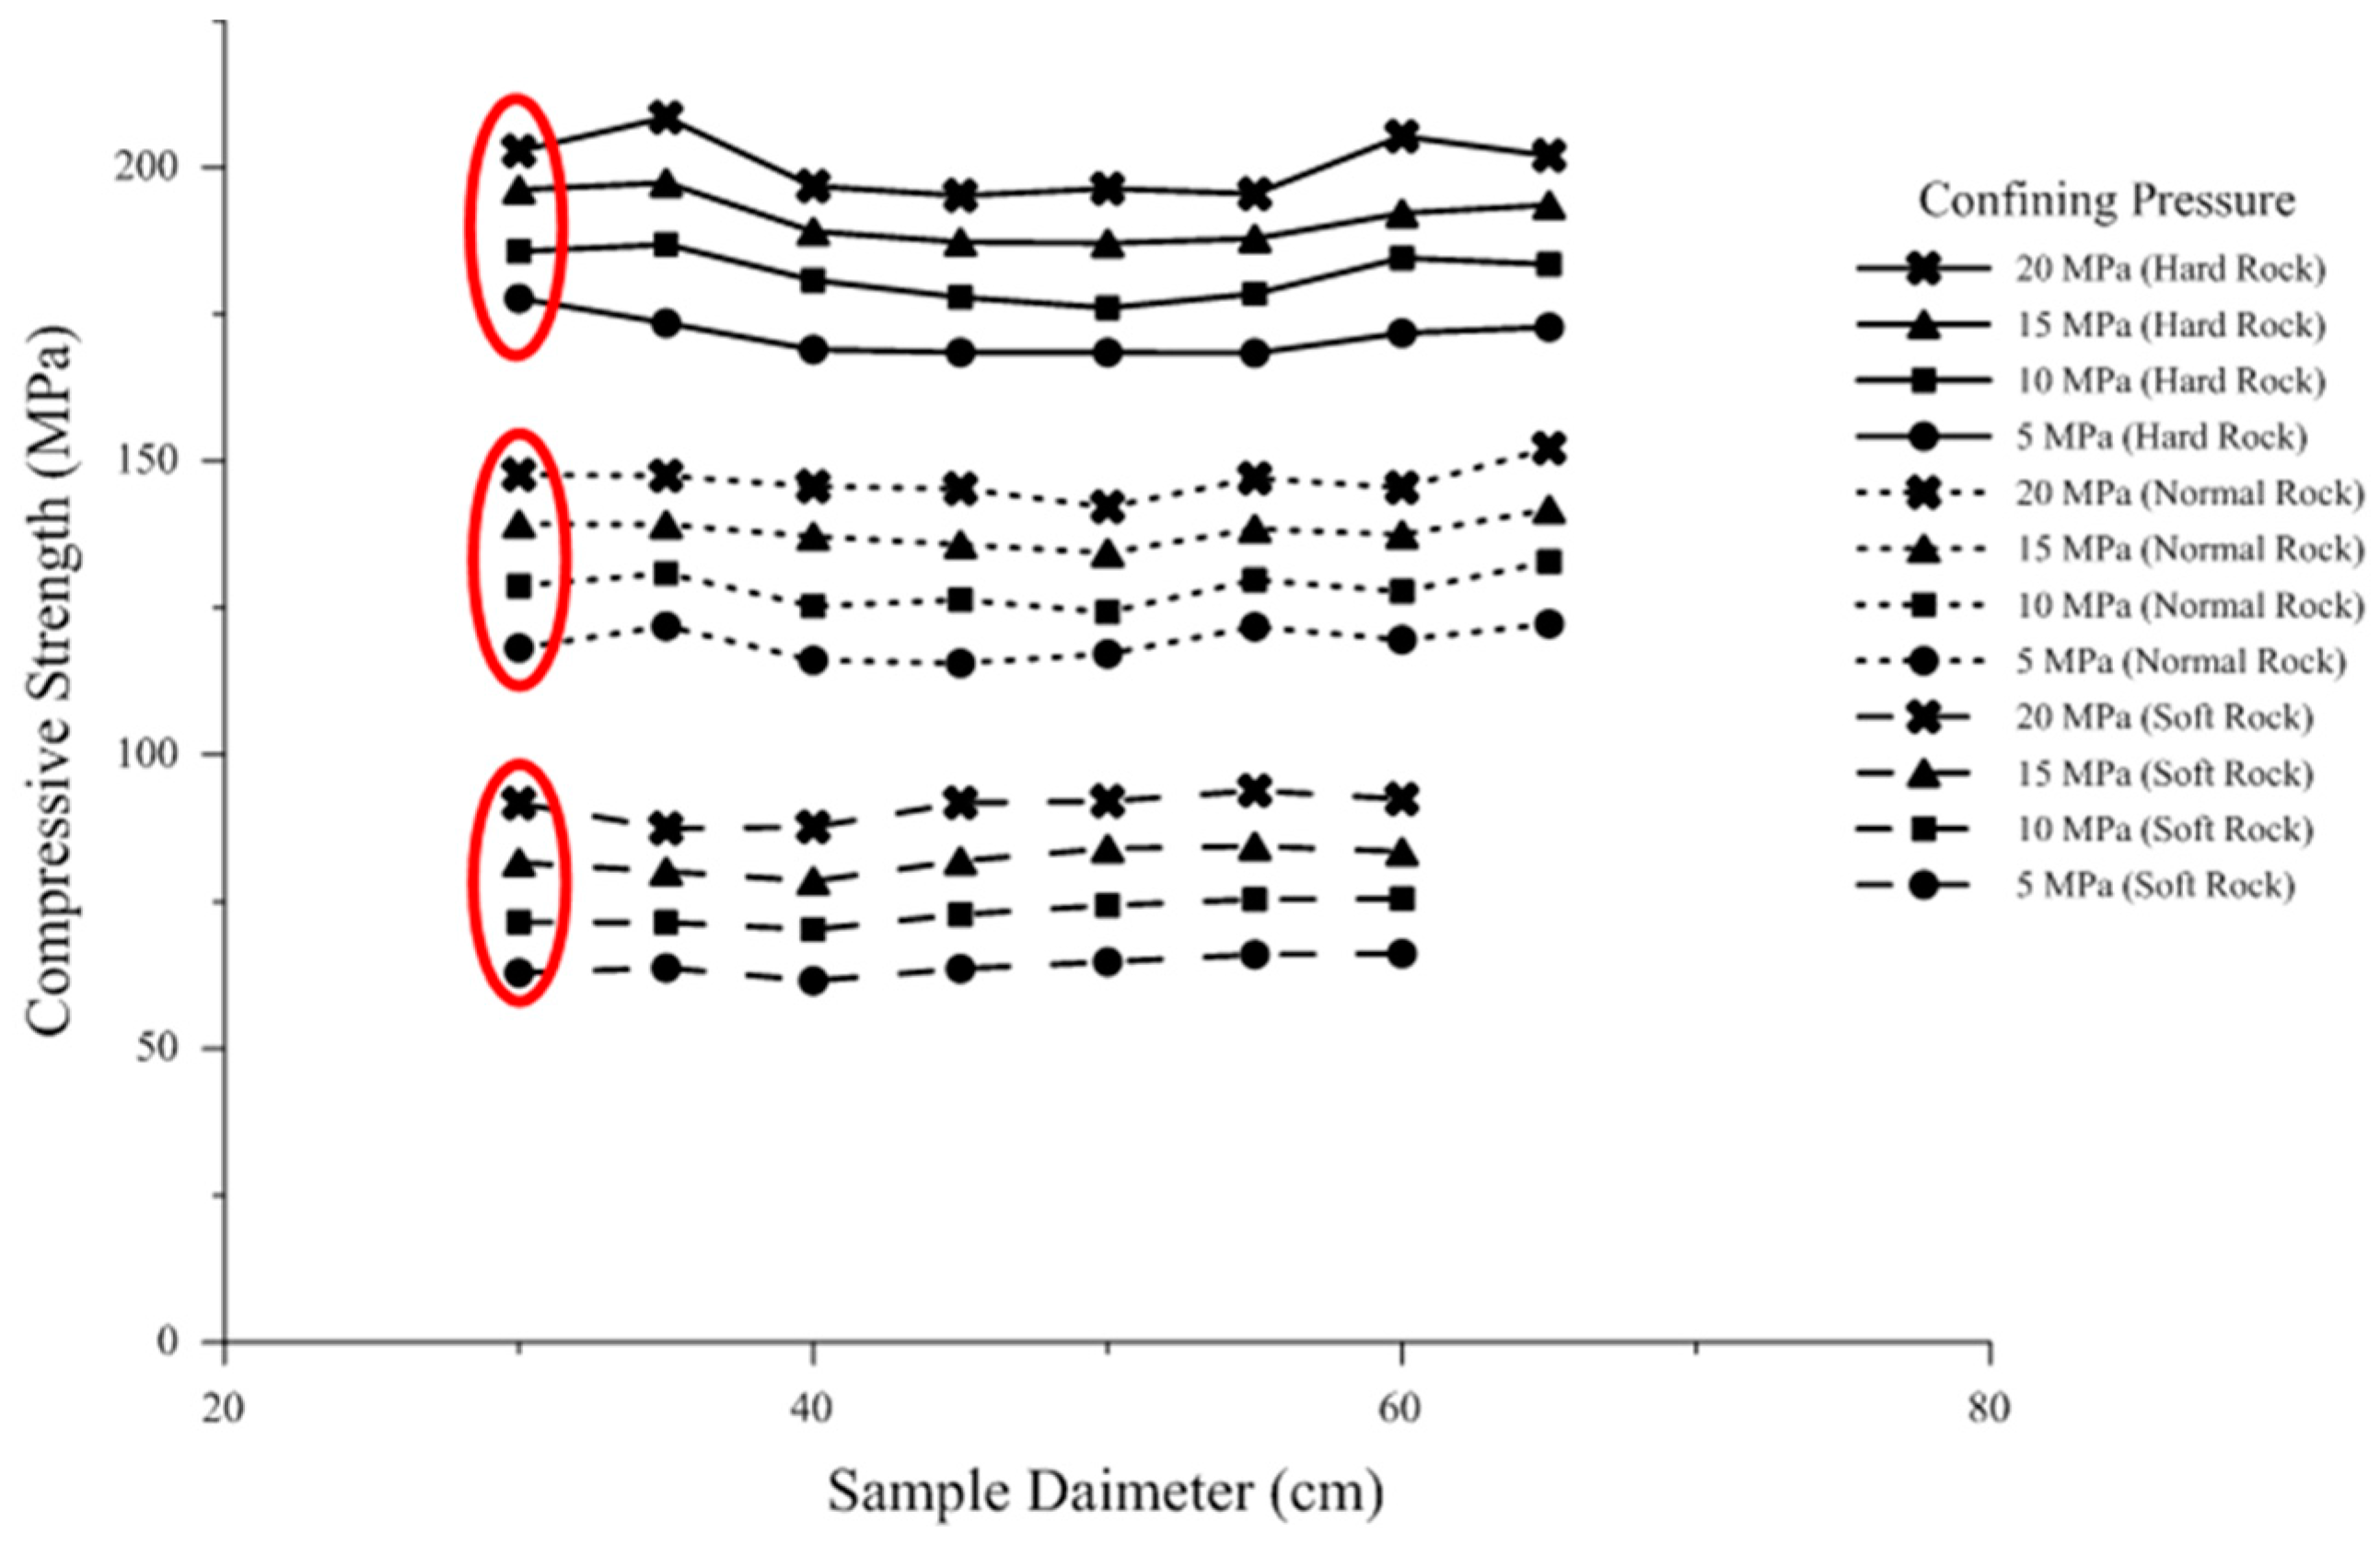
Figure 8.
Brazilian tensile strength (BTS) test results (low modulus ratio), sample diameter at REV in red circle.
Figure 8.
Brazilian tensile strength (BTS) test results (low modulus ratio), sample diameter at REV in red circle.

Figure 9.
BTS test results (average modulus ratio), sample diameter at REV in red circle.

Figure 10.
BTS test results (high modulus ratio), sample diameter at REV in red circle.
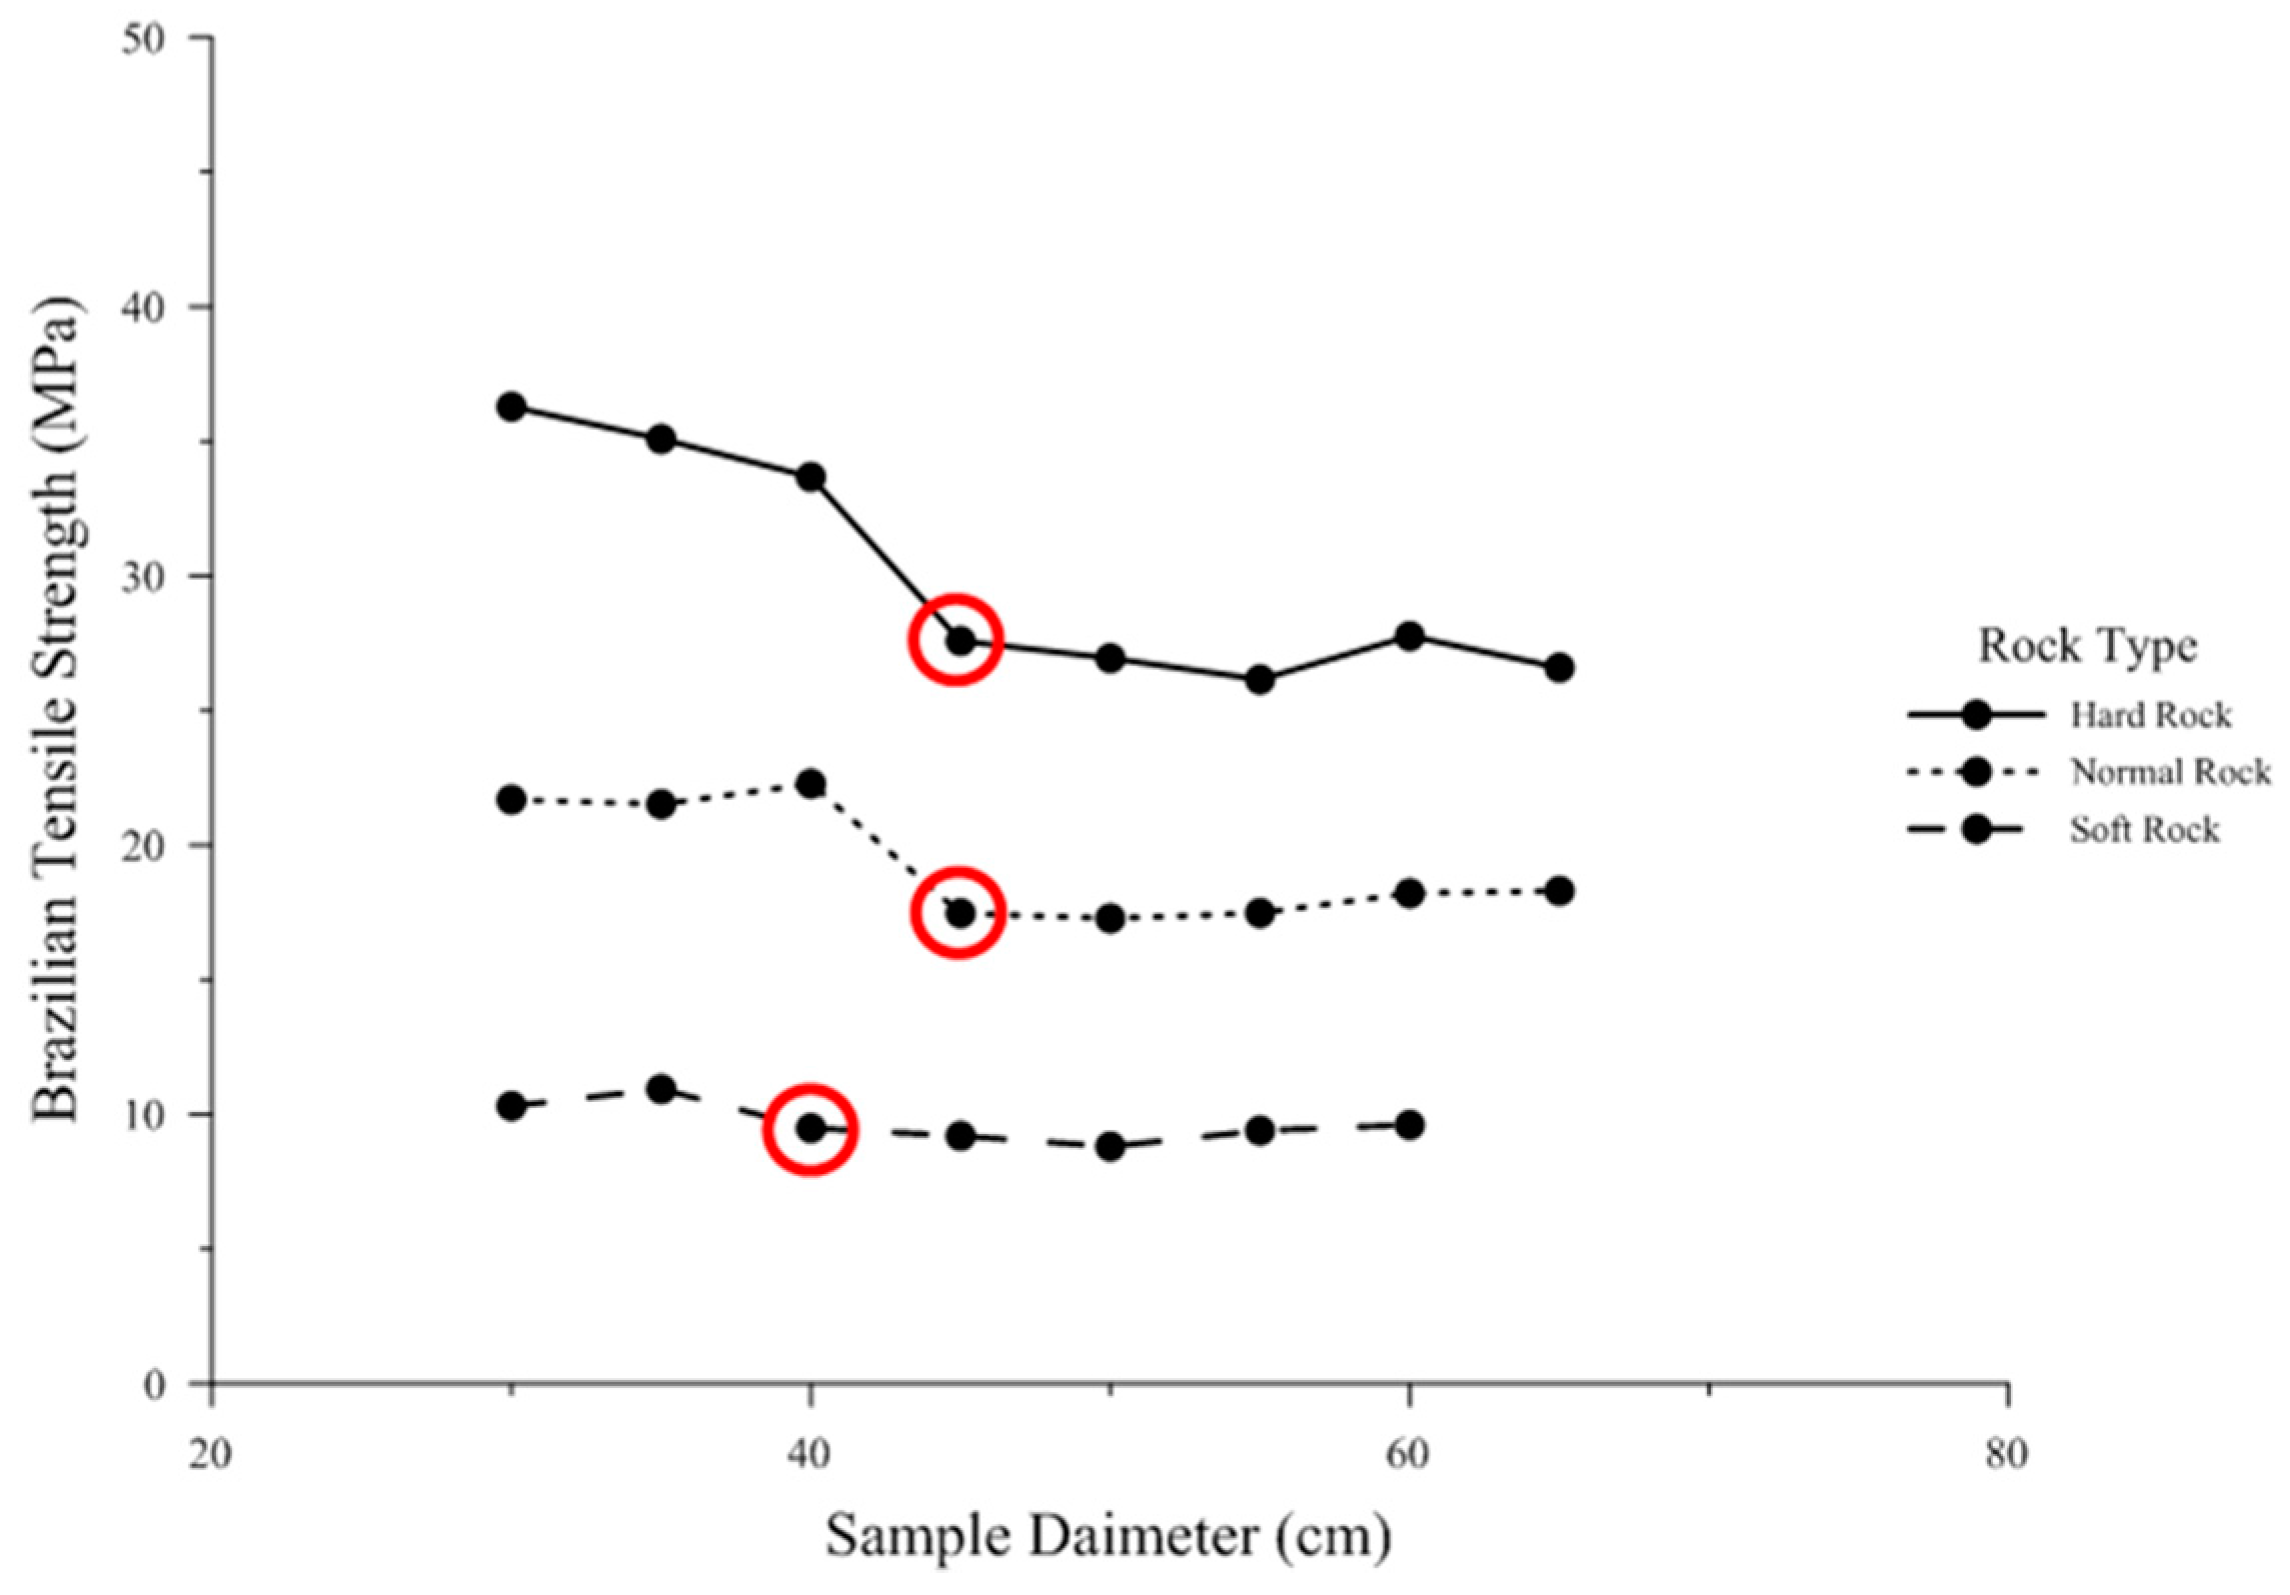
Figure 11.
Steps involved in the formation of rock splitting model, (a) bonded particle model; (b) formation of free surface; (c) borehole excavation; (d) installation of counter-wedge walls.
Figure 11.
Steps involved in the formation of rock splitting model, (a) bonded particle model; (b) formation of free surface; (c) borehole excavation; (d) installation of counter-wedge walls.
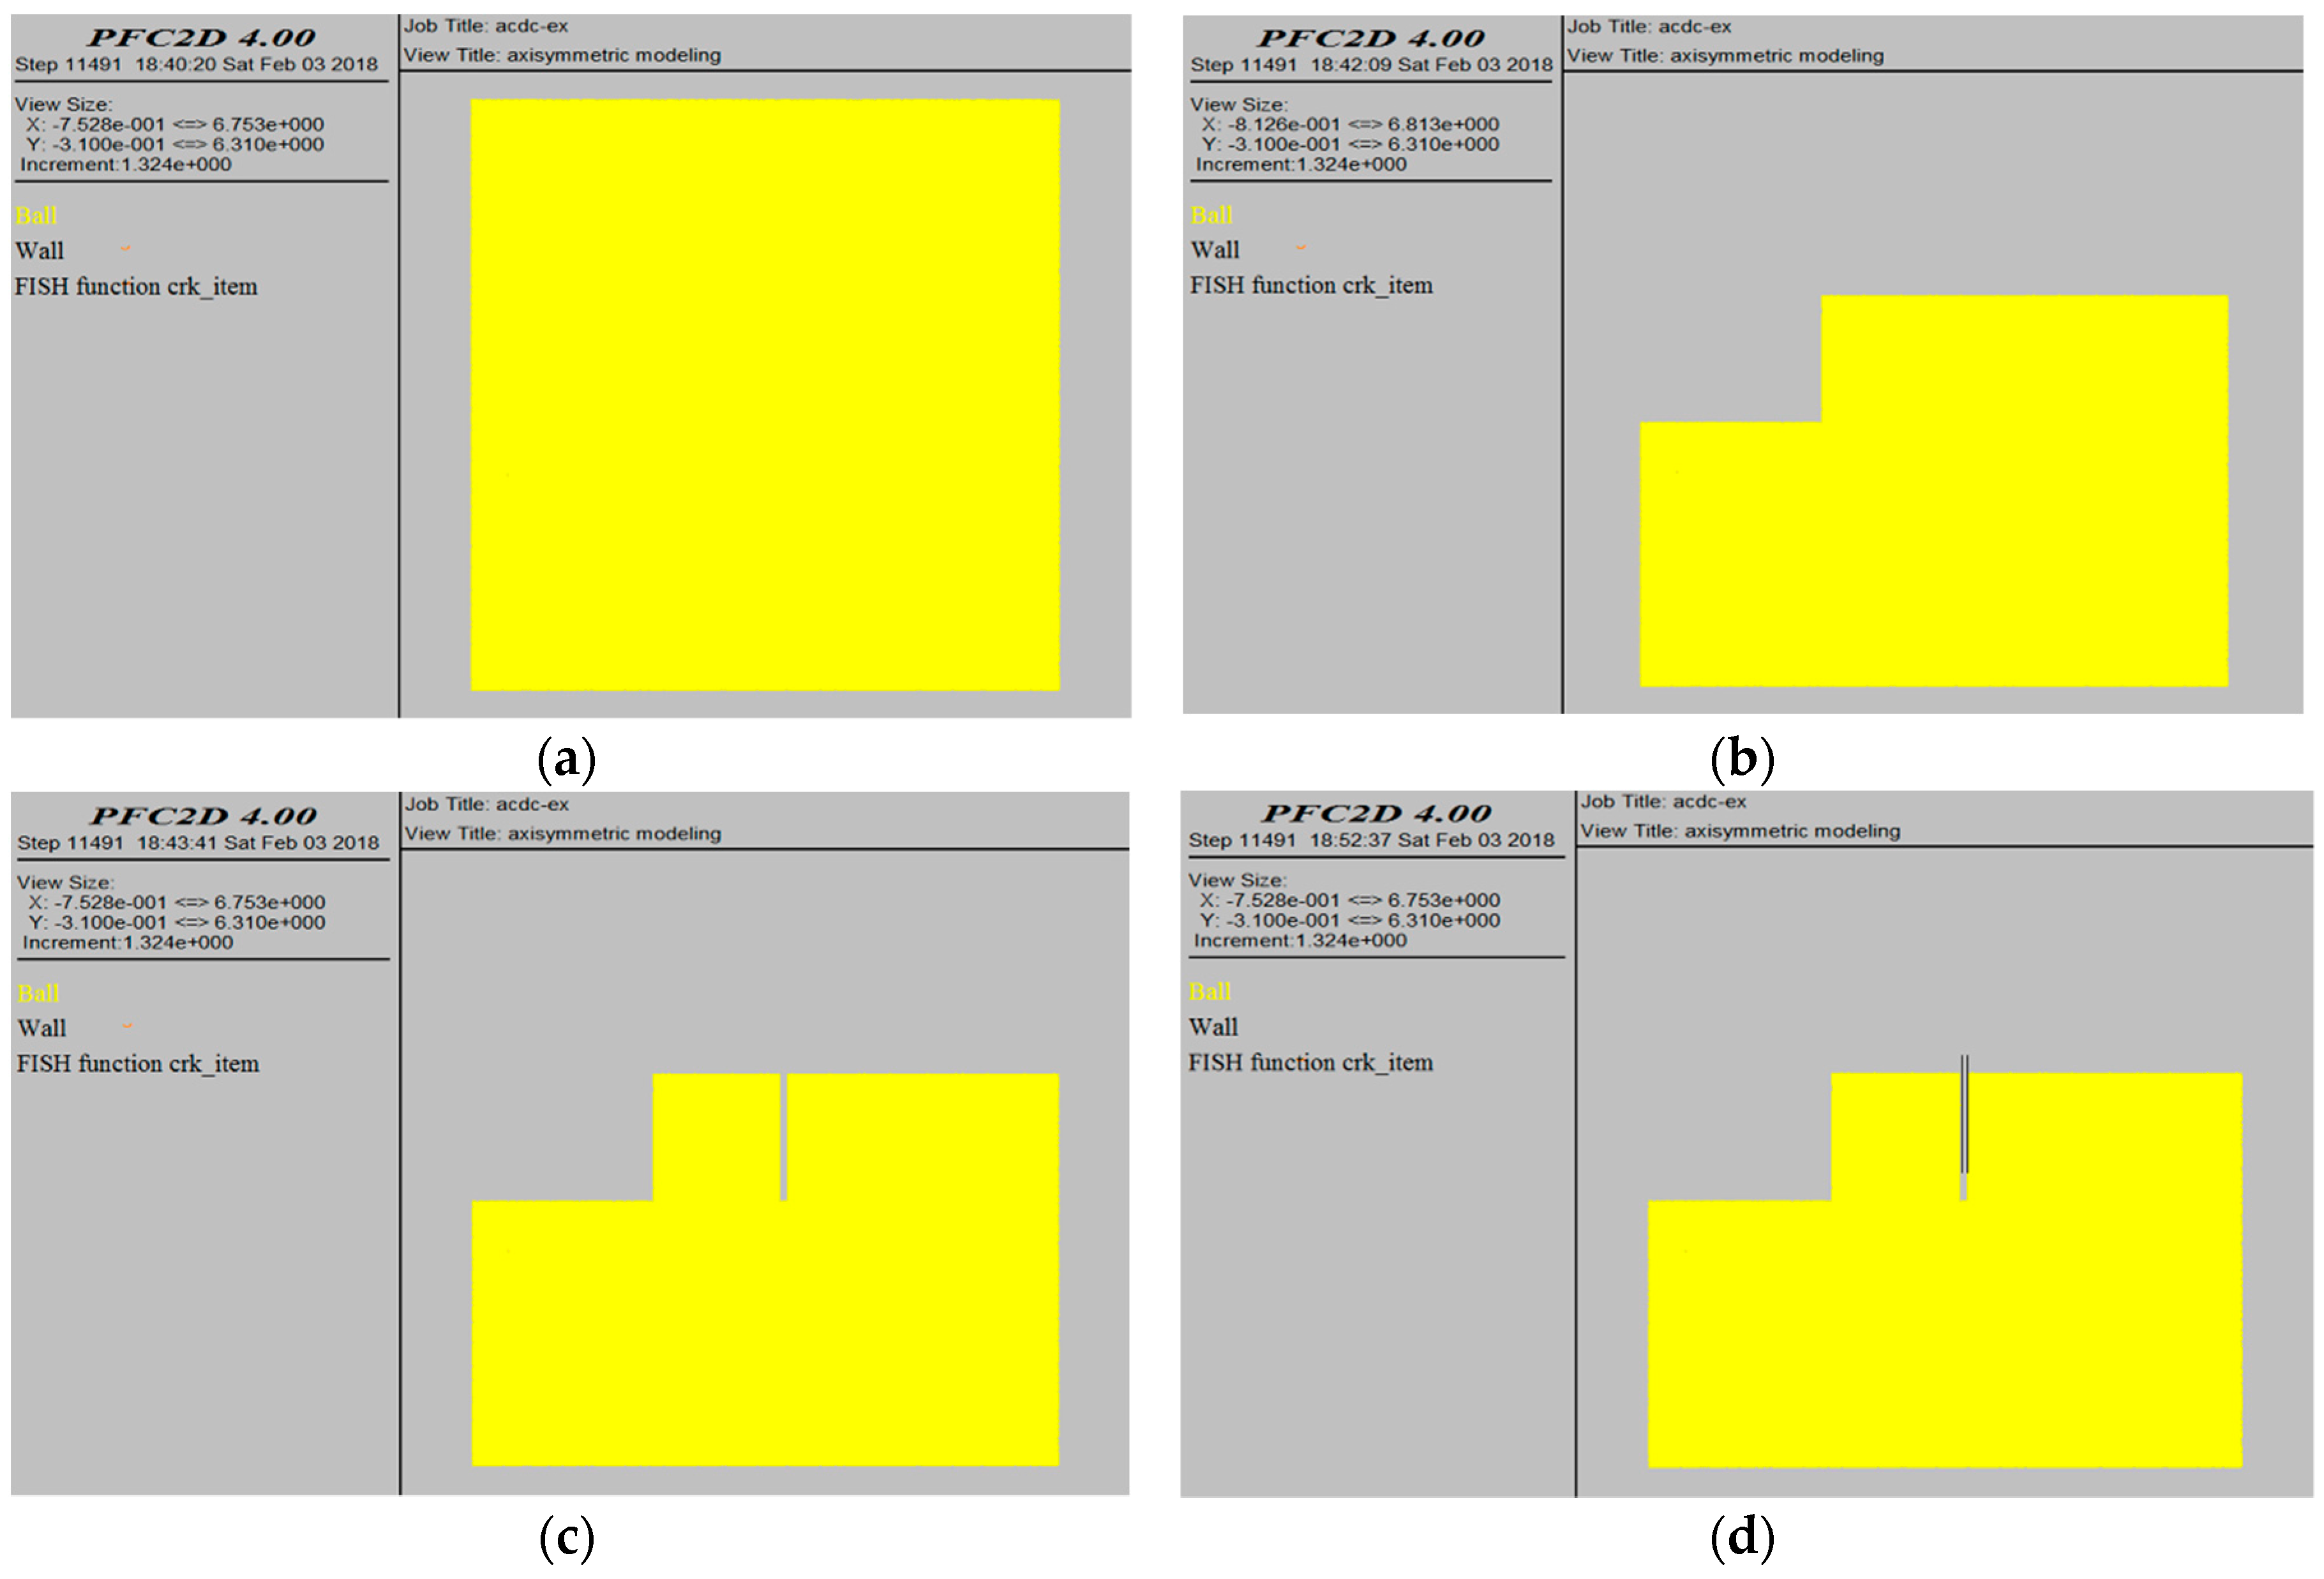
Figure 12.
Illustration of rock splitting process through crack propagation in soft rock (in yellow); at average modulus ratio, (a) initial rock splitting model (0.5 m borehole spacing); (b) final rock splitting model (1.1 m borehole spacing).
Figure 12.
Illustration of rock splitting process through crack propagation in soft rock (in yellow); at average modulus ratio, (a) initial rock splitting model (0.5 m borehole spacing); (b) final rock splitting model (1.1 m borehole spacing).
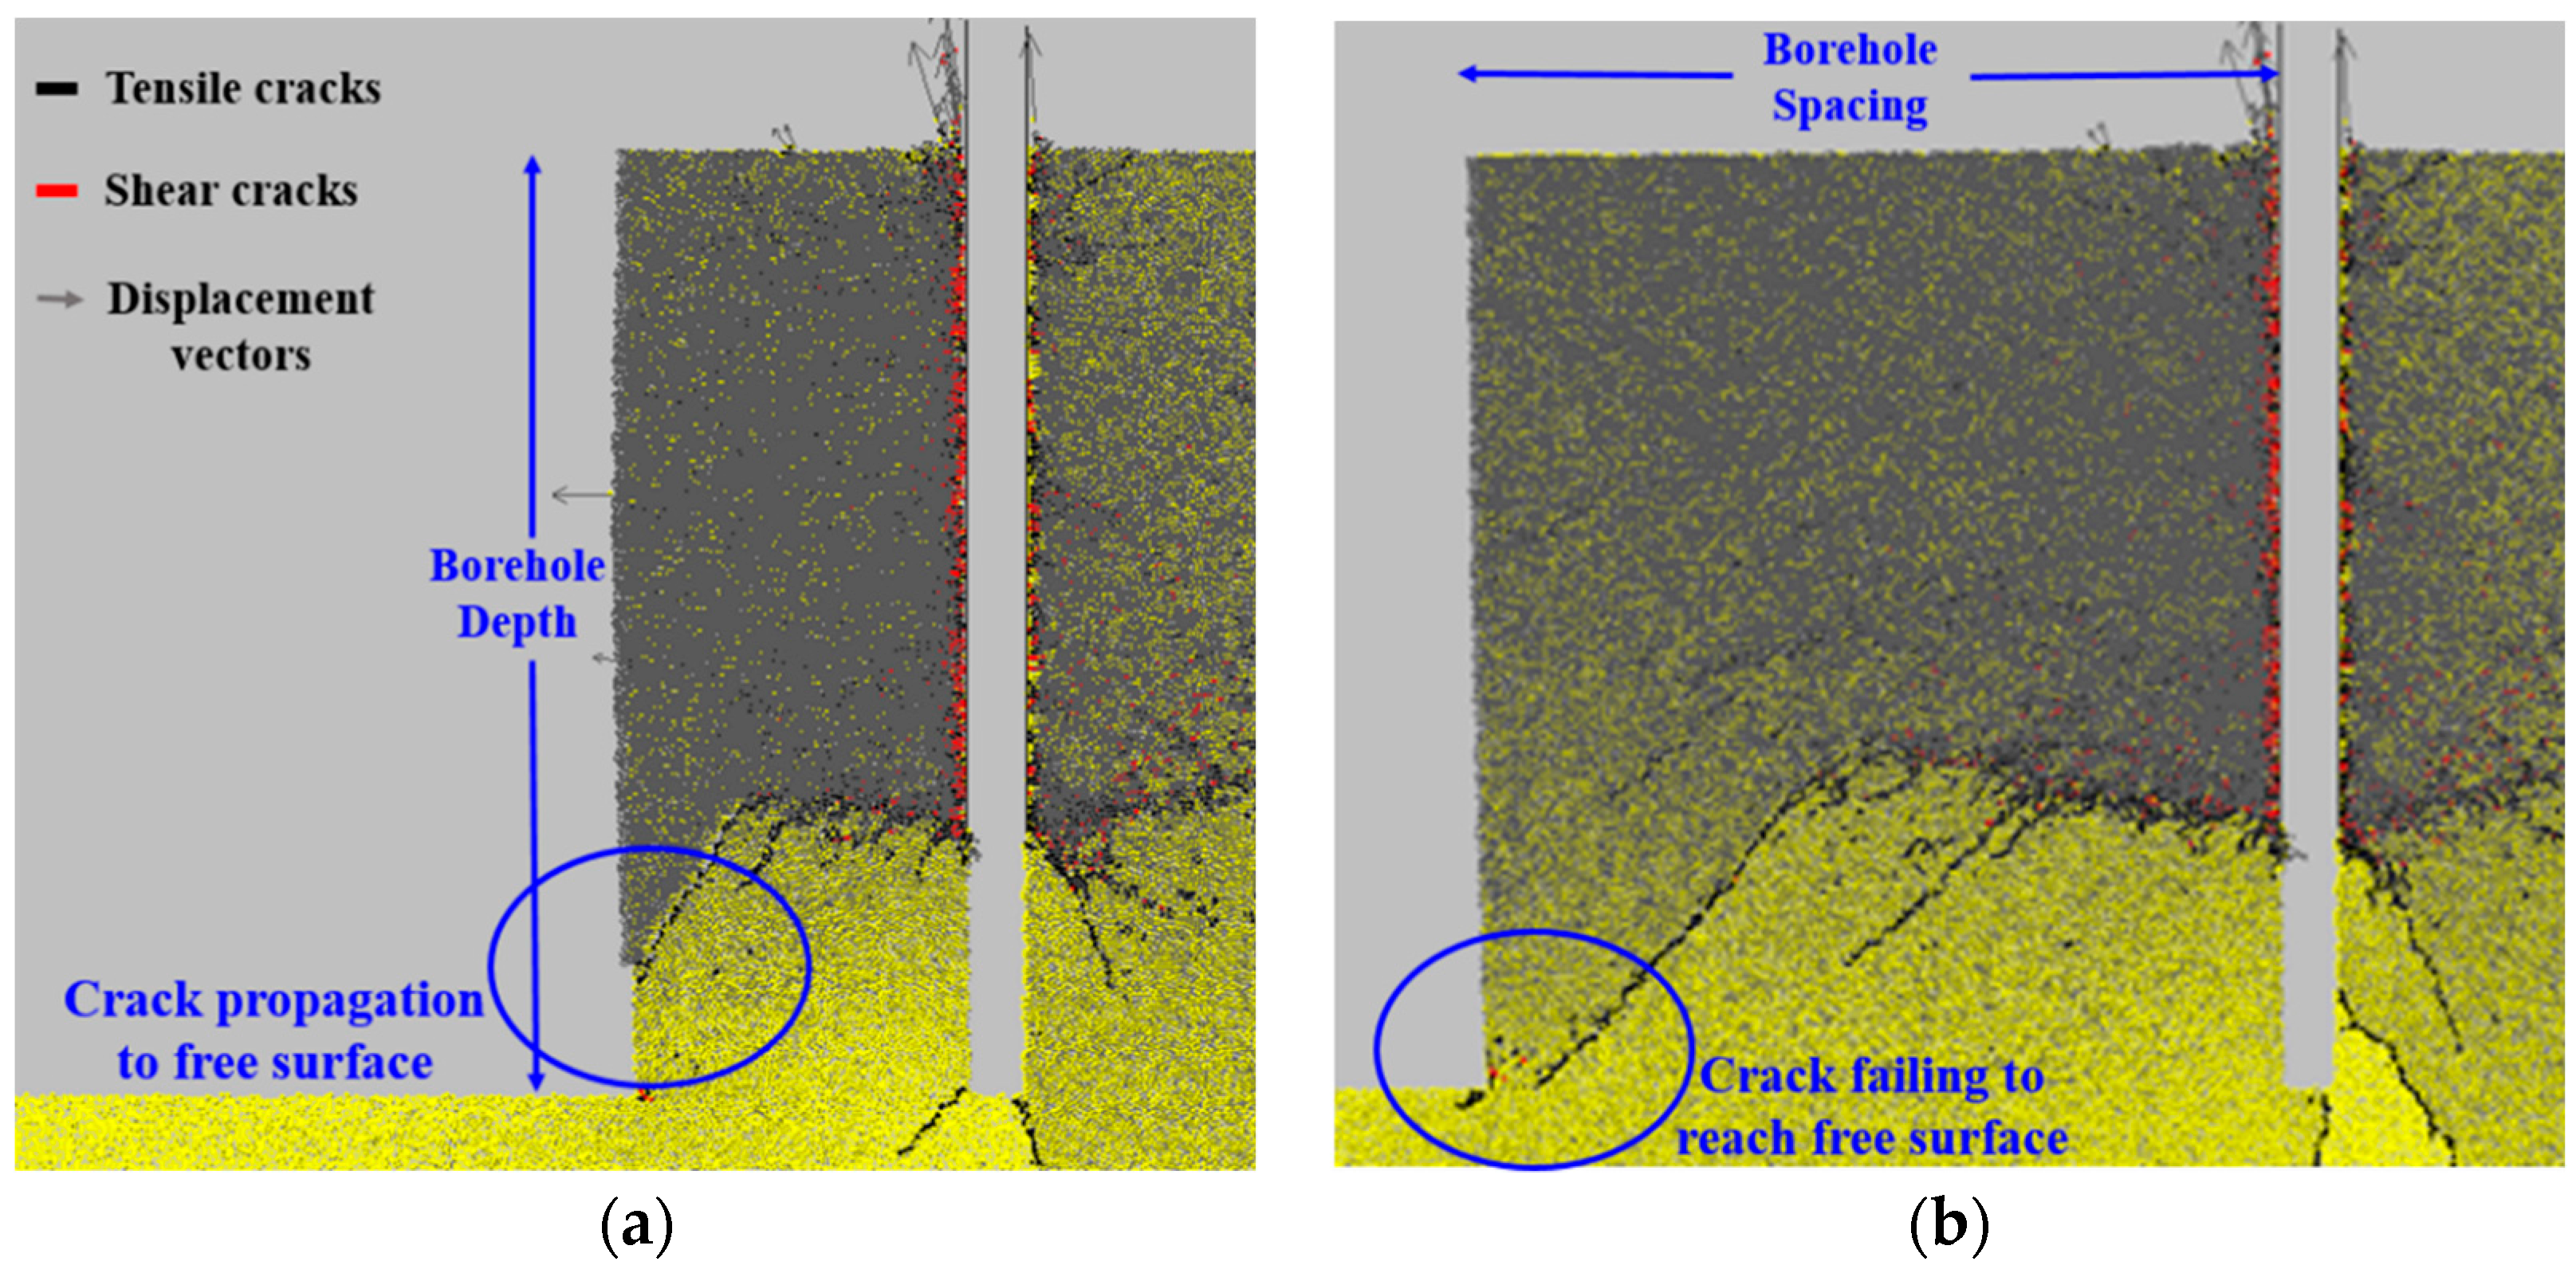
Figure 13.
Comparison of maximum borehole spacing values at different intact rock strengths (borehole depth = 1.4 m).
Figure 13.
Comparison of maximum borehole spacing values at different intact rock strengths (borehole depth = 1.4 m).

Figure 14.
Rock splitting model using constant borehole spacing (0.7 m) with three different borehole depths, (a) borehole depth = 1.4 m; (b) borehole depth = 1.3 m; (c) borehole depth = 1.2 m.
Figure 14.
Rock splitting model using constant borehole spacing (0.7 m) with three different borehole depths, (a) borehole depth = 1.4 m; (b) borehole depth = 1.3 m; (c) borehole depth = 1.2 m.
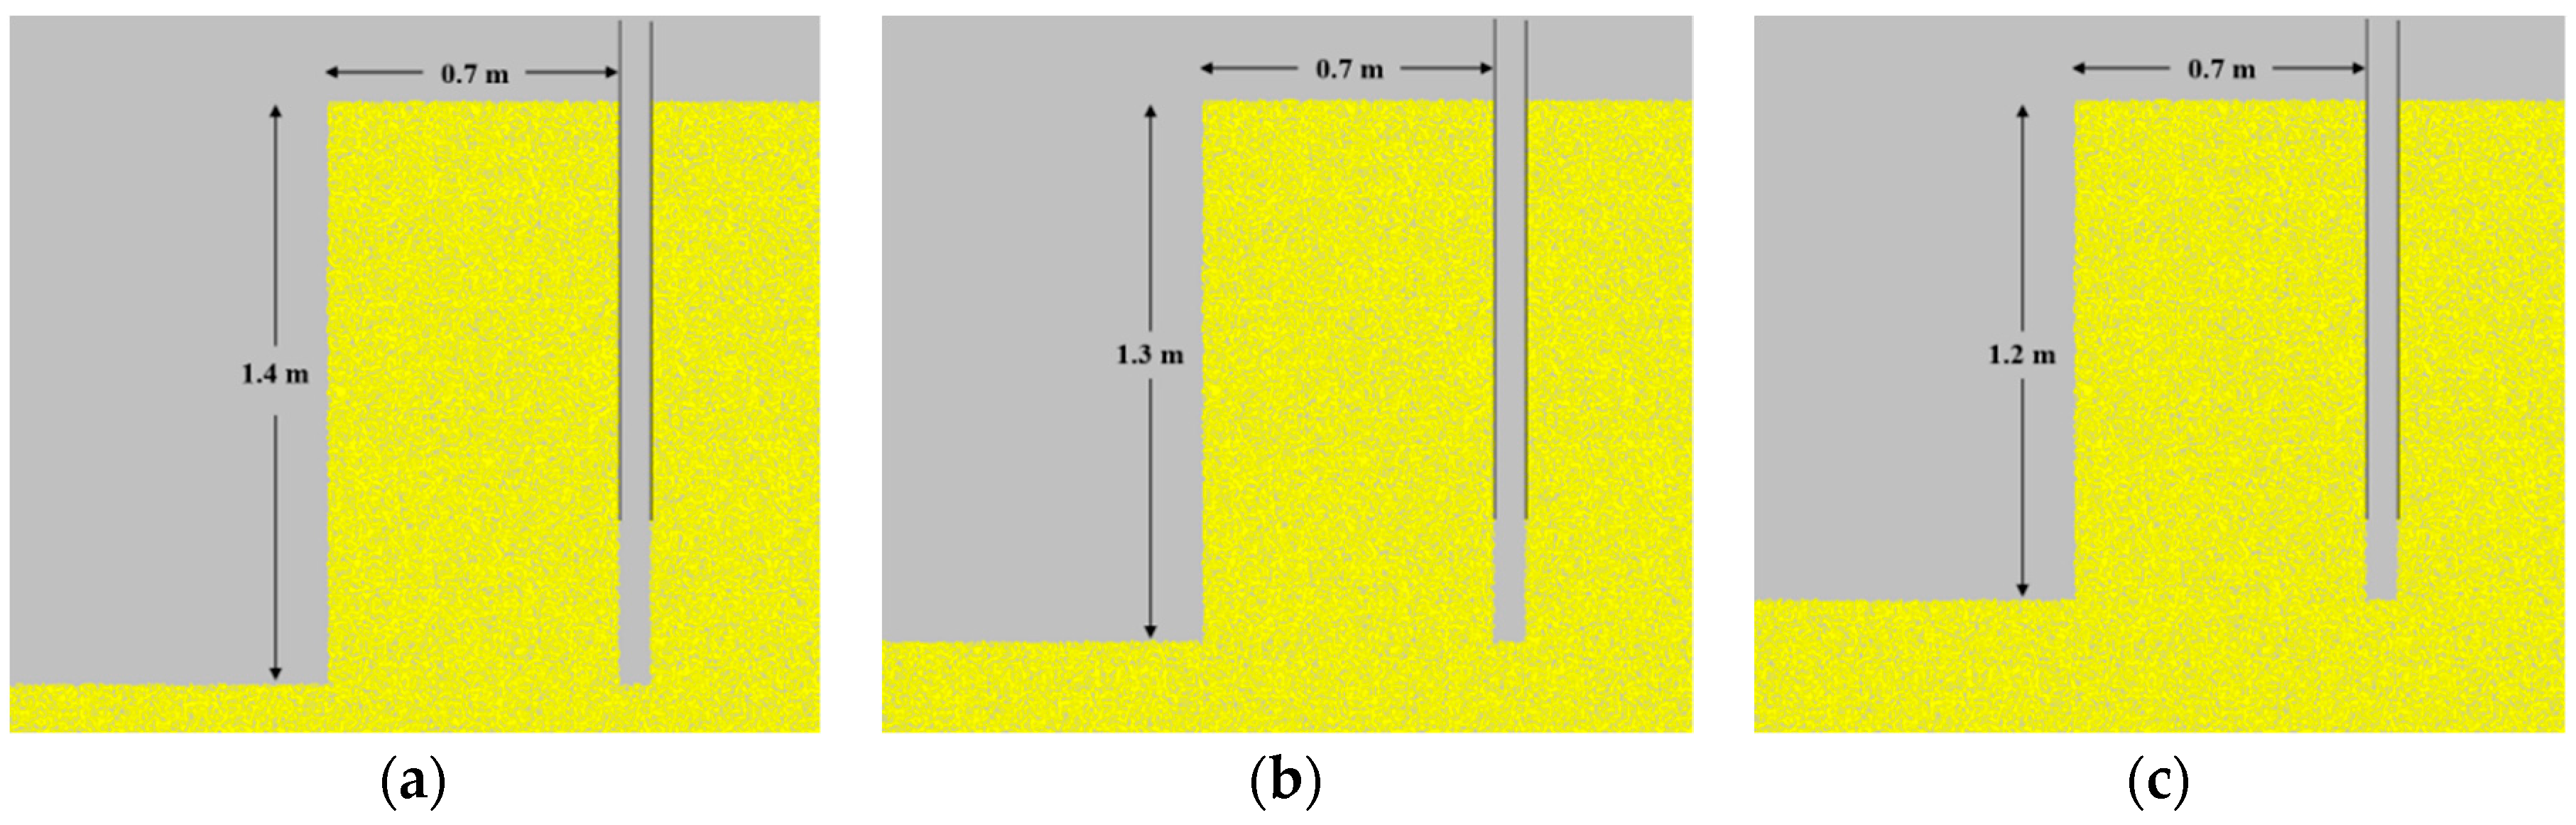
Figure 15.
Effect of borehole depth on maximum borehole spacing values at different intact rock strengths (low modulus ratio).
Figure 15.
Effect of borehole depth on maximum borehole spacing values at different intact rock strengths (low modulus ratio).

Figure 16.
Effect of borehole depth on maximum borehole spacing values at different intact rock strengths (average modulus ratio).
Figure 16.
Effect of borehole depth on maximum borehole spacing values at different intact rock strengths (average modulus ratio).

Figure 17.
Effect of borehole depth on maximum borehole spacing values at different intact rock strengths (high modulus ratio).
Figure 17.
Effect of borehole depth on maximum borehole spacing values at different intact rock strengths (high modulus ratio).

Table 1.
Characteristic features of split-wedge system and borehole.
| Characteristic Feature | Magnitude (Units) |
|---|---|
| Power of maximum rock splitting (kg) | 2.18 × 10⁶ kg |
| Length of counter-wedge (mm) | 1000 mm |
| Borehole splitting width (mm) | 15~20 mm |
| Depth of drilled borehole (mm) | 1000~1400 mm |
| Borehole diameter (mm) | 76 mm |
Table 2.
Borehole spacing values typically used according to intact rock strength 1.
| Rock Type | UCS (MPa) | Borehole Spacing (m) |
|---|---|---|
| Soft rock | 50 | 0.7 |
| Normal rock | 100 | 0.6 |
| Hard rock | 150 | 0.6 |
1 UCS, unconfined compressive strength.
Table 3.
Young’s modulus values of soft, normal, and hard rock based on modulus ratio concept.
| Rock Type | Young’s Modulus (GPa) | ||
|---|---|---|---|
| Low Modulus Ratio | Average Modulus Ratio | High Modulus Ratio | |
| Soft rock | 8 | 15 | 27.5 |
| Normal rock | 15 | 30 | 55 |
| Hard rock | 23 | 45 | 82.5 |
Table 4.
Microscopic parameters obtained by calibration after unconfined compressive strength (UCS) tests 1.
Table 4.
Microscopic parameters obtained by calibration after unconfined compressive strength (UCS) tests 1.
| Microscopic Parameter | Values Obtained by UCS Test | ||
|---|---|---|---|
| Soft Rock | Normal Rock | Hard Rock | |
| Particle density (kg/cm3) | 2630 | 2630 | 2630 |
| Minimum particle radius, Rmin (mm) | 3 | 3 | 3 |
| Particle size ratio, Rmax/Rmin | 1.66 | 1.66 | 1.66 |
| Initial sample height (mm) | 600 | 600 | 600 |
| Initial sample width (mm) | 300 | 300 | 300 |
| Particle-particle contact Young’s modulus, Ec (GPa) | —REV dependent— | ||
| Particle stiffness ratio, (kn/ks) | 2 | 2 | 2 |
| Young’s modulus of parallel bond, Ēc (GPa) | —REV dependent— | ||
| Parallel bond stiffness ratio, λ | 2 | 2 | 2 |
| Particle friction coefficient, µ | 0.5 | 0.5 | 0.5 |
| Parallel bond normal strength, mean, (MPa) | —REV dependent— | ||
| Parallel bond normal strength, std. dev, (MPa) | 5 | 10 | 10 |
| Parallel bond shear strength, mean, (MPa) | —REV dependent— | ||
| Parallel bond shear strength, std. dev, (MPa) | 5 | 10 | 10 |
1 REV, Representative Elementary Volume.
Table 5.
Particle-particle contact Young’s modulus (Ec) and Young’s modulus of parallel bond (Ēc).
| Rock Type | Microscopic Parameters (Ec and Ēc) | ||
|---|---|---|---|
| Low Modulus Ratio | Average Modulus Ratio | High Modulus Ratio | |
| Soft rock | 6.1 | 11.42 | 21.8 |
| Normal rock | 11.6 | 23 | 41.9 |
| Hard rock | 17.75 | 34.5 | 63.5 |
Table 6.
Parallel bond normal and shear strength ( and ).
| Rock Type | Microscopic Parameters ( and ) | ||
|---|---|---|---|
| Low Modulus Ratio | Average Modulus Ratio | High Modulus Ratio | |
| Soft rock | 34.5 | 32 | 31 |
| Normal rock | 66 | 68 | 67.5 |
| Hard rock | 99.4 | 101 | 100 |
© 2018 by the authors. Licensee MDPI, Basel, Switzerland. This article is an open access article distributed under the terms and conditions of the Creative Commons Attribution (CC BY) license (http://creativecommons.org/licenses/by/4.0/).
Share and Cite
MDPI and ACS Style
Jafri, T.H.; Yoo, H. REV Application in DEM Analysis of Non-Vibrational Rock Splitting Method to Propose Feasible Borehole Spacing. Appl. Sci. 2018, 8, 335. https://doi.org/10.3390/app8030335
AMA Style
Jafri TH, Yoo H. REV Application in DEM Analysis of Non-Vibrational Rock Splitting Method to Propose Feasible Borehole Spacing. Applied Sciences. 2018; 8(3):335. https://doi.org/10.3390/app8030335
Chicago/Turabian StyleJafri, Turab H., and Hankyu Yoo. 2018. "REV Application in DEM Analysis of Non-Vibrational Rock Splitting Method to Propose Feasible Borehole Spacing" Applied Sciences 8, no. 3: 335. https://doi.org/10.3390/app8030335
Note that from the first issue of 2016, this journal uses article numbers instead of page numbers. See further details here.