Multi-Agent Decision Support Tool to Enable Interoperability among Heterogeneous Energy Systems
by
 , , , ,
Brígida Teixeira
1 ,
,
Tiago Pinto
2,*,
Francisco Silva
1,
Gabriel Santos
1,
Isabel Praça
1 and 
Zita Vale
1
1
Research Group on Intelligent Engineering and Computing for Advanced Innovation and Development (GECAD), Polytechnic of Porto (IPP), 4200-072 Porto, Portugal
2
BISITE Research Group, Bioinformatic, Intelligent Systems and Educational Technology, University of Salamanca (USAL), 37007 Salamanca, Spain
*
Author to whom correspondence should be addressed.
Appl. Sci. 2018, 8(3), 328; https://doi.org/10.3390/app8030328
Submission received: 30 December 2017
/
Revised: 8 February 2018
/
Accepted: 17 February 2018
/
Published: 26 February 2018
(This article belongs to the Section Energy Science and Technology)
Abstract
:Worldwide electricity markets are undergoing a major restructuring process. One of the main reasons for the ongoing changes is to enable the adaptation of current market models to the new paradigm that arises from the large-scale integration of distributed generation sources. In order to deal with the unpredictability caused by the intermittent nature of the distributed generation and the large number of variables that contribute to the energy sector balance, it is extremely important to use simulation systems that are capable of dealing with the required complexity. This paper presents the Tools Control Center (TOOCC), a framework that allows the interoperability between heterogeneous energy and power simulation systems through the use of ontologies, allowing the simulation of scenarios with a high degree of complexity, through the cooperation of the individual capacities of each system. A case study based on real data is presented in order to demonstrate the interoperability capabilities of TOOCC. The simulation considers the energy management of a microgrid of a real university campus, from the perspective of the network manager and also of its consumers/producers, in a projection for a typical day of the winter of 2050.
1. Introduction
Electricity Markets (EM) are complex environments that are constantly adapting to the needs of society. The liberalization of its segments, namely the production, transport and distribution of energy, allows several improvements such as quality of service, reduced costs and stimulation of market models’ creation, which promote competitiveness [1,2]. As a result, EM behavior has become more unpredictable and complex due to the large number of participating entities and possible interactions between them.
Currently, EM are facing a new paradigm shift following the large-scale integration of Renewable Energy Sources (RES) [3,4]. The significant use of fossil resources for energy production is one of the major concerns of today’s society. Climate change, environmental impact and the scarcity of resources have led to the need for investment in RES, which, by reducing the emission of greenhouse gases, contributes to an increase in the quality of life and sustainable development [5]. The European Union (EU) has the target of 20-20-20 by 2020 [6,7], which establishes measures that contribute to the change of legislation in the energy sector. This program aims to achieve three goals: (i) 20% reduction in CO2 emissions by 2020 compared to 1990 levels; (ii) a 20% increase in energy efficiency; and (iii) 20% representation of RES in the energy consumption in the EU.
The inclusion of RES in EM is a highly complex task. The network operator needs to balance supply and demand in order to maximize the available resources [8]. Due to the unpredictability of the behavior of RES, this balance is difficult to achieve. Thus, a careful analysis of the behavior of market entities, namely the consumption and production profiles, is required in real time.
The large-scale implementation of Distributed Generation (DG) plays a key role in energy management and is associated with the concepts of the Smart Grid (SG) [9], microgrid [10], microgeneration [11], prosumer [12], community microgrids [13], virtual power plants [14], integrated community energy systems [15] and Demand Response (DR) [16]. The DG consists of the decentralized production of energy, which acts at the level of consumers. These can produce energy from RES and sell it to the grid. Thus, the consumer goes by the name of prosumer [17], which is a combination of consumer and producer. In DG systems, prosumers aggregate into small networks (microgrids) in order to facilitate energy scheduling within a smaller geographic area. According to Georgilakis in [18], “DGs contribute in the application of competitive energy policies, diversification of energy resources, reduction of on-peak operating cost, deferral of network upgrades, lower losses, lower transmission, distribution costs, and potential increase of service quality to the end-customers”.
In order to enable large-scale penetration of DG, it is necessary to upgrade energy transmission networks so that they have mechanisms that are capable of dealing with the unpredictability of RES and adjusting to the energy needs of the consumer. SGs respond to these needs, being equipped with ubiquitous technology that allows the control, processing and automation of the energy supply [4]. In addition, the installed sensors along the network allow the collection of a great diversity and quantity of data. These data can be used to feed simulators that provide decision support to EM entities, through artificial intelligence techniques, as a way of dealing with their increasing complexity. There is a number of benefits that the system operator can obtain from using simulated scenarios: discover failures in power supply and study solutions to make the network more efficient, reliable and secure; study and delineate the behavioral profiles of their users, so as to be able to forecast consumption and implement appropriate DR programs; design and test new market models so that EM can adapt to the new needs of their consumers; among others. On the other hand, the consumers can also obtain several advantages, such as visualization of their consumption profile, responding to the incentives of the EM in order to increase their profit (DR), charging, etc. Thus, the information flow in the grid becomes bidirectional, where the consumer is also able to react to changes in the grid [19].
For entities involved in power and energy systems to be able to cope with the changing and growing complexity of wholesale and retail markets, as well as the consequences of DG penetration, several simulation tools have emerged, allowing the study of the various concepts and their evolution (examples are presented in Section 2). However, these tools have the disadvantage of only solving problems in specific fields, and therefore, they are not able to provide a more comprehensive study involving several domains. Thus arises the need to create solutions to perform more comprehensive studies through the interconnection of the different areas of simulation tools. However, this is a complex task, since it is necessary to create communication mechanisms between systems that have heterogeneous characteristics, such as the programming language in which they are developed, the different time resolutions, the handling of events and the synchronization of processes, among several other critical aspects, as discussed in Section 2.
This paper proposes the Tools Control Center (TOOCC) framework, which has the objective of increasing the interoperability between heterogeneous agent-based systems for the simulation and study of power and energy systems’ concepts, such as EM, SG operation, energy management and participant entities. TOOCC acts as a facilitator in the interaction between entities/agents with distinct natures, through the use of ontologies, which allow the sharing of a vocabulary to ensure that all systems understand concepts equally. The framework also aims to achieve more complete simulations with different time resolutions (e.g., real-time simulation, wholesale market, etc.) in a more automated way and provides relevant information about the results to the user.
After this introductory section, Section 2 presents an overview of related work in the fields of agent-based simulation in power and energy systems, decision support systems in this domain and on interoperability between systems. Section 3 addresses the characteristics, advantages, phases and also the multi-agent architecture of TOOCC framework. A case study is presented in Section 4, which illustrates how the interaction between the systems is made and also an example of the kind of results the user can analyze. Finally, Section 5 presents the most relevant conclusions and contributions of this work.
2. Power and Energy Systems Simulation
Decision Support Systems (DSS) are widely used in very different applications such as e-commerce [20], bank clients’ management [21], pricing negotiation [22], etc. Power and energy systems’ decision support through simulation is increasingly gaining visibility due to the high uncertainty surrounding this field. Thus, DSSs have several advantages in the study of this field: understanding how different market mechanisms can affect sellers and buyers of energy; making a forecast of the network’s consumption for a certain instant, to understand the appropriate scheduling of energy; exploring new possibilities for alternative market models; deepening the understanding of how DR will affect consumers; what DR tariffs are most appropriate for certain consumer profiles; network planning, etc.
It is increasingly common to design energy and power systems under a multi-agent architecture, because their distributed nature allows them to deal with the complexity of the system [23]. In addition, each agent can represent an entity with its own desires, constraints, autonomy and flexibility. This way, an agent can represent a market participant, a network component or a system. On the other hand, the simulation allows the study of future changes to the real systems and their behavior, reducing the costs and time needed to perform upgrades. Some examples of multi-agent simulators developed to study this field are:
- The Electricity Market Complex Adaptive System (EMCAS) [24]: developed to model the EM, enabling the investigation of the physical infrastructure and the economic behavior of market participants;
- The Agent-based Modeling of Electricity Systems (AMES) [25]: allows the study of wholesale EM operation and their participants’ strategies over the time;
- The Multi-Agent Negotiation and Risk Management in Electricity Markets (MAN-REM) [26]: devoted to risk management in EM’s bilateral contracting;
- The simulation of power generation company’s behavior in electricity markets [27]: investigates the strategic behavior of power generation companies under different market-clearing mechanisms;
- The Multi-Agent Smart Grid Simulation Platform (MASGriP) [28]: designed to consider real characteristics and goals of consumers, producers, prosumers and Virtual Power Players (aggregators of small players) in SG and to allow the integration with the Multi-Agent Simulator for Competitive Electricity Markets (MASCEM);
- The Power Trading Agent Competition (Power TAC) [29]: is a competition from the perspective of brokers (energy retailers, commercial or municipal utilities, or cooperatives) in order to simulate future models and market dynamics;
- Smart Grids Information and Communication (SGiC) [30]: incorporates different incentive programs such as VPP and DR, provides support to customers and enables power routing and balancing;
- Building performance simulation [31]: uses regression surrogate models to simulate energy usage profiles of the building’s occupants and facility managers, estimate energy consumption and help quantify the impact of uncertainty, in human actions on the performance of the built environment;
- Simulation of electricity consumption of an office room [32]: considers different factors of impact on energy saving;
- Cooperative control of energy storage units in the microgrid [33]: manages the charging/discharging behavior of multiple storage units;
- Simulation of electric vehicle driver behavior in road transport and electric power networks [34]: developed to fully understand the consequences of electrical vehicles’ integration, the behavior of the drivers and its impact on road transport and electric power networks;
- Others.
In addition, there are several other solutions and simulators developed with the objective of studying power and energy systems (e.g., The Power Systems Simulator [35]; the Hybrid Optimization of Multiple Energy Resources [36,37]; Eurostag [38,39]; OMNeT++ [40]; the GridLAB-D [41]; the MOCES [42]; the GridSim [43]; the DRSim [44]; among others), or other works that can be applied to the context of energy systems such as [45,46]. Section 3.1 provides a more detailed description of some more simulators with which the proposed tool interacts.
2.1. Simulation of Heterogeneous Systems
In the literature, it is possible to find only a few solutions capable of enabling heterogeneous systems’ interoperability, in the area of power and energy systems. For instance, the Electric Power and Communication Synchronizing Simulator (EPOCHS) [47] is a pioneering MAS that combines the results of several simulators by using realistic scenarios, to solve network communication problems in the laboratory, avoiding potential costs and damages. Another similar tool is the Global Event-Driven Co-Simulation framework (GECO) [48], which aims to model and simulate the monitoring, protection and control schemes of the power systems and communication network. For these two tools, although they allow the co-simulation of several tools, their area of operation is restricted to power systems and communication network. The Mosaik system [49,50] aims to allow the simulation of heterogeneous components of the SG, providing different models that allow one to simulate producers, consumers, prosumers, electric vehicles and other elements of the network. This system addresses many of the challenges of interoperability in the area and has a similar proposal to TOOCC. However, similarly to the previous tools, it also does not have an extended domain as is desired, since it focuses on the simulation of scenarios related to SG. Furthermore, according to the authors’ understanding, Mosaik is only able to perform static simulations, which were previously configured and programmed. If it is intended to add a new system to the simulation, it must be restructured, and it is necessary to carry out new configuration programming work.
Although there are several MAS dedicated to the study of the energy sector, they are oriented towards solving problems in specific domains, for private use, limited to systems already incorporated (do not allow the connection to external systems), do not take advantage of the formal exchange of knowledge, or only support interoperability in already configured static simulations. When these systems are able to communicate with each other and to exchange knowledge, by combining their individual capacities, it is possible to solve problems that cover more comprehensive and complex domains in a more flexible way. Thus, the interoperability between systems allows the simulation of scenarios that support the growing complexity of this area, where its stakeholders are in a constant process of interaction and negotiation with each other, and there is a need for careful management of resources. The multi-agent technology has particularities that facilitate the increase of interoperability between systems [51]. However, the interoperability among systems is highly complex due to their heterogeneity. Since they are distinct tools, they may also have different domains, concept definitions, programming languages, temporal resolutions, event handling and others. It is necessary to establish a mechanism for communication between these systems, which initially would be incompatible. For MAS to be able to communicate with each other in order to overcome their individual limitations, it is necessary to use mechanisms that allow the sharing of information and knowledge that at the same time provides the necessary flexibility to deal with the execution of several processes at the same time. For this purpose, standard communication formats and protocols must exist, which ensure that the involved entities assign the same meaning to different terms [52,53].
2.2. Ontologies for Semantic Interoperability
In [54], it is mentioned that an “Ontology provides a shared vocabulary, which can be used to model a domain that is, the type of objects, and/or concepts that exist, and their properties and relation”. In the energy field, several ontologies have been developed for SG and EM. In [55,56] ontologies are used with the main goal of supporting energy management for end consumers, in the microgrid context. The ontology described in [19] aims at the interaction between building energy management and smart grids. In [57] some of the most relevant standards are combined in a new solution. A middleware to represent the power grid components is presented in [58]. And [59] provides an ontology based on Greek EM and adapted to the EU directives.
The Foundation for Intelligent Physical Agents (FIPA) [60] is an IEEE Computer Society standard of communication used for the development of MAS. With the use of this standard, it is intended to guarantee: agent life cycle management, message transport and structure, interaction protocols, ontologies and security. The messages are built under the Agent Communication Language (ACL) structure, which allows the definition of various elements (e.g., performative, sender, receiver, content, language and ontology, among others) and various communicative acts (e.g., agree, cancel, confirm, not-understood, etc.). The content of the message can be in any format, being adaptable to any ontology.
3. TOOCC
TOOCC is a multi-agent DSS developed with the purpose of creating, simulating and analyzing complex EM scenarios, by enabling interoperability between heterogeneous simulation tools. These scenarios may cover the use of several different systems or services simultaneously, or the independent use of each. The proposed system also allows one to define the necessary models and inputs for each of the scenarios and executes them in different machines of the domain, moving between them according to the needs of certain software.
This DSS is a multi-faceted tool that intends to support several entities of the power and energy system (network operator, consumers, producers, aggregators, etc.), taking into account different time horizons, from a proactive perspective. TOOCC can, for instance, be used to make future projections for a network or to schedule the energy of a house for the next hour, respecting certain restrictions. Moreover, in certain systems, this tool considers the introduction of system failures, to study their impact in a simulation.
This framework is developed in JAVA language and uses the JADE platform to implement its agents, which is FIPA compliant. In addition, to achieve interoperability between systems, TOOCC uses ontologies that allow the sharing of vocabulary and mapping of concepts between systems, so that they can communicate. The ontologies are formulated in OWL DL, with representation in RDF/XML (more details in Section 3.3).
The integration of TOOCC with other simulation tools has the following objectives:
- Interoperability: The strategic union of the individual capacities of each tool allows one to extend the domain of knowledge and to simulate problems with more coverage. Thus, more complex scenarios are executed, which allows higher quality results.
- Flexibility: In order to be able to execute scenarios with different characteristics, a high degree of flexibility is necessary in the definition of scenarios, since there is a large number of possible combinations in the relationships between systems and services.
- Realism: The addition of real data in the creation of scenarios originates results that are closer to reality. These data can be represented in models used by the tools or, for instance, as historical data to be used in forecasts.
- Graphical interface: Many of the mentioned tools do not have a graphical interface that facilitates their interaction with the user. TOOCC has an interface that allows the user to follow the execution of all the tools with which it is integrated.
- Centralized management: From a single tool, it is possible to go through all the stages of the tools, namely in the configuration, simulation and analysis of the scenarios’ results. Thus, the user does not need to worry about guaranteeing the execution of several tools, since this management is done by TOOCC.
- Results analysis: By providing some possible conclusions of the simulated scenarios, it is intended to give decision support to its user. For this, TOOCC establishes a direct comparison between the results of different scenarios and presents that information through the production of tables, graphs and files with output data with specific information.
- Automation: One of the main goals is to simplify the process of creating the scenarios, automating it as much as possible. In this way, TOOCC provides several alternatives to fill the models and inputs needed to run the tools, saving the user a lot of time. When the configuration process is complete, the simulation and results’ generation are completely automatic and autonomous. This allows the user to save much time.
- Error reduction: Although it is possible to integrate these systems manually—to run iteratively and alternately each of the systems and to constantly adjust their configurations, inputs and models—this is a process that can easily introduce errors, given that it requires much attention and user interaction. The usage of TOOCC simplifies and automates the process, so it reduces possible human errors.
Figure 1 shows a general perspective of TOOCC’s flow. For the creation of scenarios, the framework receives information from stored models, as well as the input of required data to perform its configuration. This input can be fed by real data, giving a more realistic character to the whole simulation. The user can define scenarios as desired, and these can run one or more systems/services provided by other multi-agent systems, depending on the scenario’s complexity. If the user wishes, he/she can also manipulate these predefined models and adapt them according to his/her desire. If more than one scenario is run, and the simulation results are equivalent, it is possible to compare them automatically. In the end, all the results and configured comparisons will be presented to the user so that conclusions can be drawn about the studies or best decisions to be made by the user.
3.1. Systems and Services
There are two types of entities that can be part of a scenario: systems and services. Systems are more complete MAS or agents, with their own simulation and intelligence capabilities. The services, although they can be made available by a MAS, are characterized by their simplicity. Usually, these are algorithms that provide support in performing other big tasks. There is a wide variety of tools and algorithms already available to TOOCC, namely Multi-Agent Simulator for Competitive Electricity Markets (MASCEM) [61], Adaptive Decision Support for Electricity Market Negotiation (AiD-EM) [62], Intelligence and Decision Support multi-agent system (IDeS) [63] and PLCMAS (Programmable Logic Controller Multi-Agent System) [63]. These tools were all developed within GECAD research group.
The main objective of MASCEM is the simulation of scenarios with the purpose of studying the behavior of EM and their entities. For this, the simulator has implemented the rules and characteristics of the three main European energy markets: MIBEL(Iberian Peninsula) [64], EPEX(central Europe) [65] and NordPool (northern Europe) [66]. In addition, the simulator also allows the participation in each of its market types, which vary in restrictions and time perspectives, namely day-ahead spot market, balancing market, intra-day market, bilateral contracts and forward contracts. On the other hand, it is also possible to model the characteristics, desires and behavior of the entities that constitute to the market (e.g., consumer, producer, prosumer, aggregators, market operator and system operator). In order to adequately represent the complexity and dynamism of the interaction between the participating entities in EM, the simulator is designed under a multi-agent architecture, which uses the JADE platform.
AiD-EM is a multi-agent tool that provides decision support to players who wish to participate in the EM. This system uses artificial intelligence techniques to determine which are the best proposals in the market, depending on the purpose of the player. The simulator has several subsystems, with specific roles. For example, the Adaptive Learning Strategic Bidding System (ALBidS) [67] aims to provide strategic support in auctioned markets, while the Decision Support for Energy Contracts Negotiation (DECON) [68] is designed to support the direct contract of energy between entities. AiD-EM allows one to deal with different user profiles and adopt the strategies most appropriate for each opponent. This tool can work directly with the MASCEM simulator, where market entities choose to use the AiD-EM decision support system, and like the simulator, it also uses the JADE platform for agent development.
The PLCMAS tool allows one to test the scenarios in a real environment, being able to apply the results to physical devices, making them act accordingly. These devices are essentially lights, sockets and HVAC and need to be connected to a Programmable Logic Controller (PLC).
The IDeS system provides several services to external systems, namely: forecast algorithms (i.e., artificial neural networks, support vector machines and fuzzy inference systems), DR programs, energy resource management systems at the house, SG and microgrid levels, among others. Most of the services provided in TOOCC belong to this tool.
3.2. Inputs and Models
To run all systems/services, it is necessary to provide specific input data to each of them, to make the proper configuration. The input, in addition to configuration parameters, may also include models, simulated data and real data. For this purpose, there are two possible sources: (i) a database where the real data and models are stored; or (ii) by reading files with a specific structure. Regarding the real data, these refer to consumption data (HVAC, lights and sockets), meteorological conditions, production (solar and wind generation) and energy transactions related to several EM.
The designed models are the result of a study of the necessary requirements to model SG and EM and have already been tested several times in different types of problems. These includes large-scale short and real-time resource optimization; components of SGs (generators, storage units, loads and electric vehicles); DR tariffs that allow one to manage the flexibility of energy consumption; energy consumption tariffs for the United States of America, Brazil and several countries of the EU; aggregation models of players; players trading profiles; market proposals; among others. The wide variety of models offered by TOOCC, combined with the mentioned tools, allow the specification of very diversified scenarios, particularly in the context in which it is inserted, with its particular characteristics and objectives. In addition, it is also possible to carry out studies on the impact of these models in a given context.
Depending on the systems or algorithms involved in the simulation, the temporal resolution of the simulation will also be different. For example, TOOCC can process a real-time simulation and act on the physical devices of a building, simulate the operation of the EM where it is necessary to wait for the registration of the bids or make a consumption forecast, which has no time constraints with which to comply.
3.3. Simulation and Interoperability
In order to allow interoperability between the multi-agent tools presented in Section 3.1, ontologies are used in the simulation phase, enabling them to speak the same language and to understand the same concepts and terms, preventing different interpretations of the same information. The use of ontologies also facilitates the execution of scenarios, especially in those that use different tools. Within this work, we can find two types of ontologies. The first type is conceptual ontologies, which are the basis for communication between systems. These ontologies allow the description of the vocabulary that will be shared between the systems, from measures (e.g., energy ontology, temperature ontology, etc.), to more complex concepts such as load flexibility in DR (e.g., load flexibility ontology) and power management (e.g., scheduling, optimization and forecasting ontology). Although TOOCC uses these ontologies to establish communication with other systems, they are developed independently of the TOOCC and are already publicly available in [69]. The second type of ontology is related to the procedural part of the systems (application ontology), and it is used in the system’s registration phase to describe the way the systems work, namely by the description of its services and possible communications, detailing inputs and outputs.
Currently, for TOOCC to be able to communicate with a new system, it is necessary that it uses the mentioned ontologies in its communications. First, the new system must be able to communicate with the TOOCC’s application ontology to be incorporated into the system. Through this ontology, the TOOCC is able to automatically generate the necessary structures for the configuration of the new system simulation. Subsequently, the new system should also incorporate the conceptual ontologies in order to be understood by TOOCC. For this purpose, the system can internally use the same ontologies or make the appropriate mapping from the ontologies to its own model. In the future, to help the integration of external systems, the development of a library is intended that allows the automatic conversion of the data structures in the respective ontologies. Moreover, using the semantic model instead of converting to classes/structures makes it possible to change the model without the need to reprogram code, which can be an advantage to adapt the model by the external systems’ developers.
During the simulation, the external systems will be constantly sending messages that must be interpreted by TOOCC. These messages may signal a request to run another system (already configured in the simulation preparation phase) or the arrival of the results of an earlier request. For this purpose, the tool has a message server that is constantly listening to new messages, and when a new message arrives at the system, it is in charge of triggering the event (behavior) that will treat it. This event, through analysis of the simulation configuration, knows the next steps of the simulation and, if necessary, generates new events in order to follow the simulation.
Figure 2 presents the TOOCC multi-agent perspective. The agents are organized hierarchically, and each one contributes to the resolution of part of the problem, by sharing vocabulary resulting from the combination of several ontologies, as illustrated in the figure. TOOCC contains the following agent types:
- TOOCC agent: This is the main agent of TOOCC and is responsible for launching and managing the GUI component. In addition, when the user initiates the simulation, this agent creates new agents, intended to execute each scenario. This agent is unique in the system, and the user will always interact with it.
- Scenario agent: This is used to manage the scenario for which it was created. This agent verifies that the systems, to which it needs to connect, are alive, and if they are, it sends the necessary input data to their execution and orders the start of simulation. Several scenario agents can be executed at the same time.
- System agent: This allows one to establish communication between specific services from the systems, instead of whole systems, mapping information between them. This agent can assume specific characteristics depending on the system with which it will interact.
3.4. Results Comparison and Analysis
The component of analysis and the comparison of results allow one to demonstrate to the user the results of the scenarios’ execution. These results can be visualized through graphs, tables and output files specially designed for this purpose. In addition to visualizing the results, it is also possible to establish comparisons between them. This mechanism allows the user to draw quick conclusions about the problem and to produce auxiliary tools to aid in decision support.
The comparison of the results is also achieved using ontologies. Because ontologies allow systems to know the same vocabulary and concepts, it is possible to automatically detect the output data of the same or comparable type and make that information available to the user.
4. Case Study
As already mentioned, the DG raises several challenges in energy management. The network operator must have great flexibility and control over the electricity consumption and production, in order to avoid the waste of energy and to minimize costs.
The following case study aims to illustrate the TOOCC simulation process, demonstrating some of its advantages by giving decision support to entities of different levels of energy management. To do this, the study consists of a co-simulation involving several systems. The first step refers to the energy scheduling in a microgrid, from a general perspective provided by the network operator. Afterwards a local perspective provided by each load belonging to the same microgrid is considered, namely to assess the impact of the microgrid management on the individual consumers. A specific individual consumer emulated physically in the GECAD building lab is analyzed, using a home energy management system, SCADA House Intelligent Management (SHIM), to manage the consumption resources of this building while respecting the energy scheduling imposed by the Network Manager (NM).
In Section 4.1, it is possible to find more details about the network’s constitution and the load that will exemplify the local process. Section 4.2 explains how TOOCC is used to simulate the described scenario. For this purpose, the integration of several systems is made to match their results and achieve the most complete, robust and reliable result, namely NM, Facility Manager (FM), IDeS and PLCMAS. Finally, Section 4.3 presents the results of the performed simulation.
4.1. Specifications
The considered simulation scenario is composed of a small voltage network of an existing university campus in Portugal, represented in Figure 3. The considered microgrid has 21 buses, 20 loads, 20 photovoltaic systems, 4 wind generators, 7 storage systems, 2 capacitors, 300 electrical vehicles and 1 external supplier. In addition, this is a future scenario, relative to a typical day of the winter of 2050, based on a study presented in [70]. For demonstration purposes, this study contains the results of the network manager and only one of the loads.
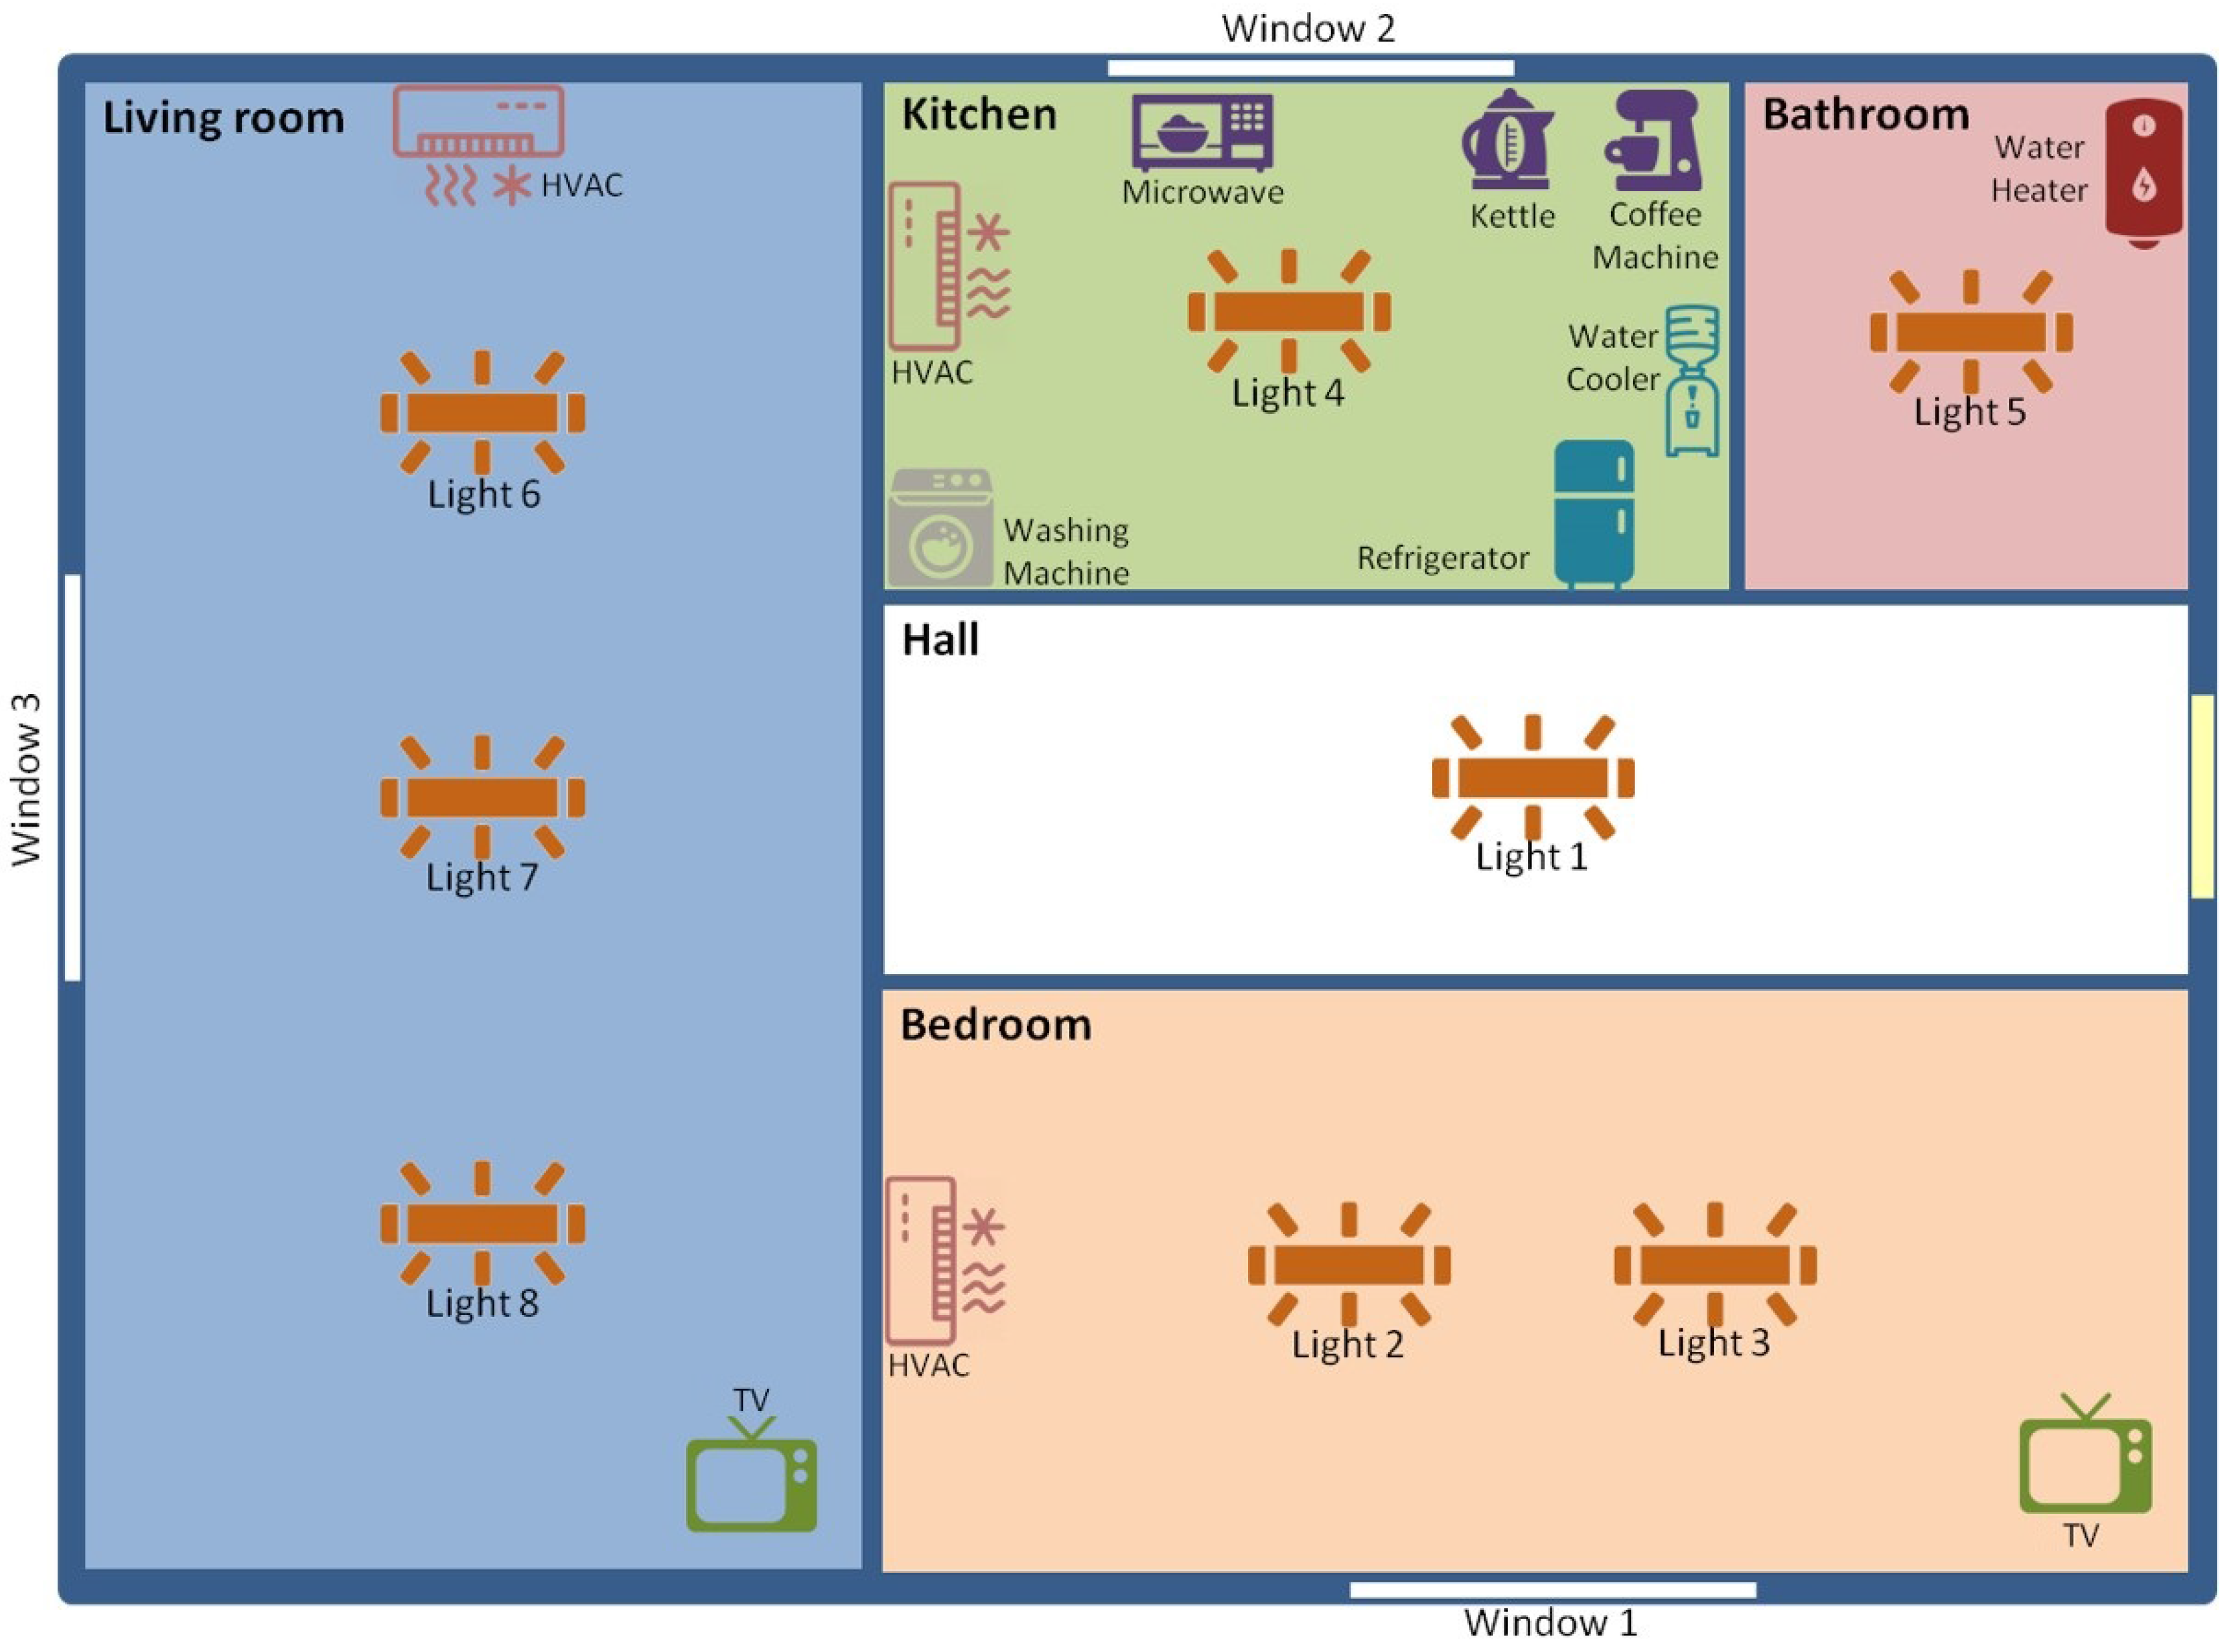
The reference load in this study is Load 15. It is, in reality, a laboratory that aims to simulate the energy consumption of a house, illustrated in Figure 4, by monitoring the usage of several appliances and loads, namely HVAC, lights and sockets, among others. The simulated smart house has a bedroom, a hall, a bathroom, a kitchen and a living room. The remaining loads are simulated through agents, which use historical data of the energy consumption of the respective buildings of the campus.
4.2. TOOCC Perspective
In order to simulate the current scenario, TOOCC needs to configure it. This tool allows the same scenario to be modeled in different ways, reconfiguring the interaction between the previously-presented systems, in a rather automatic process. In this case, the simulation will integrate the IDeS and PLCMAS systems, with two agents, namely an NM agent (network operator) and an FM agent (Load 15).
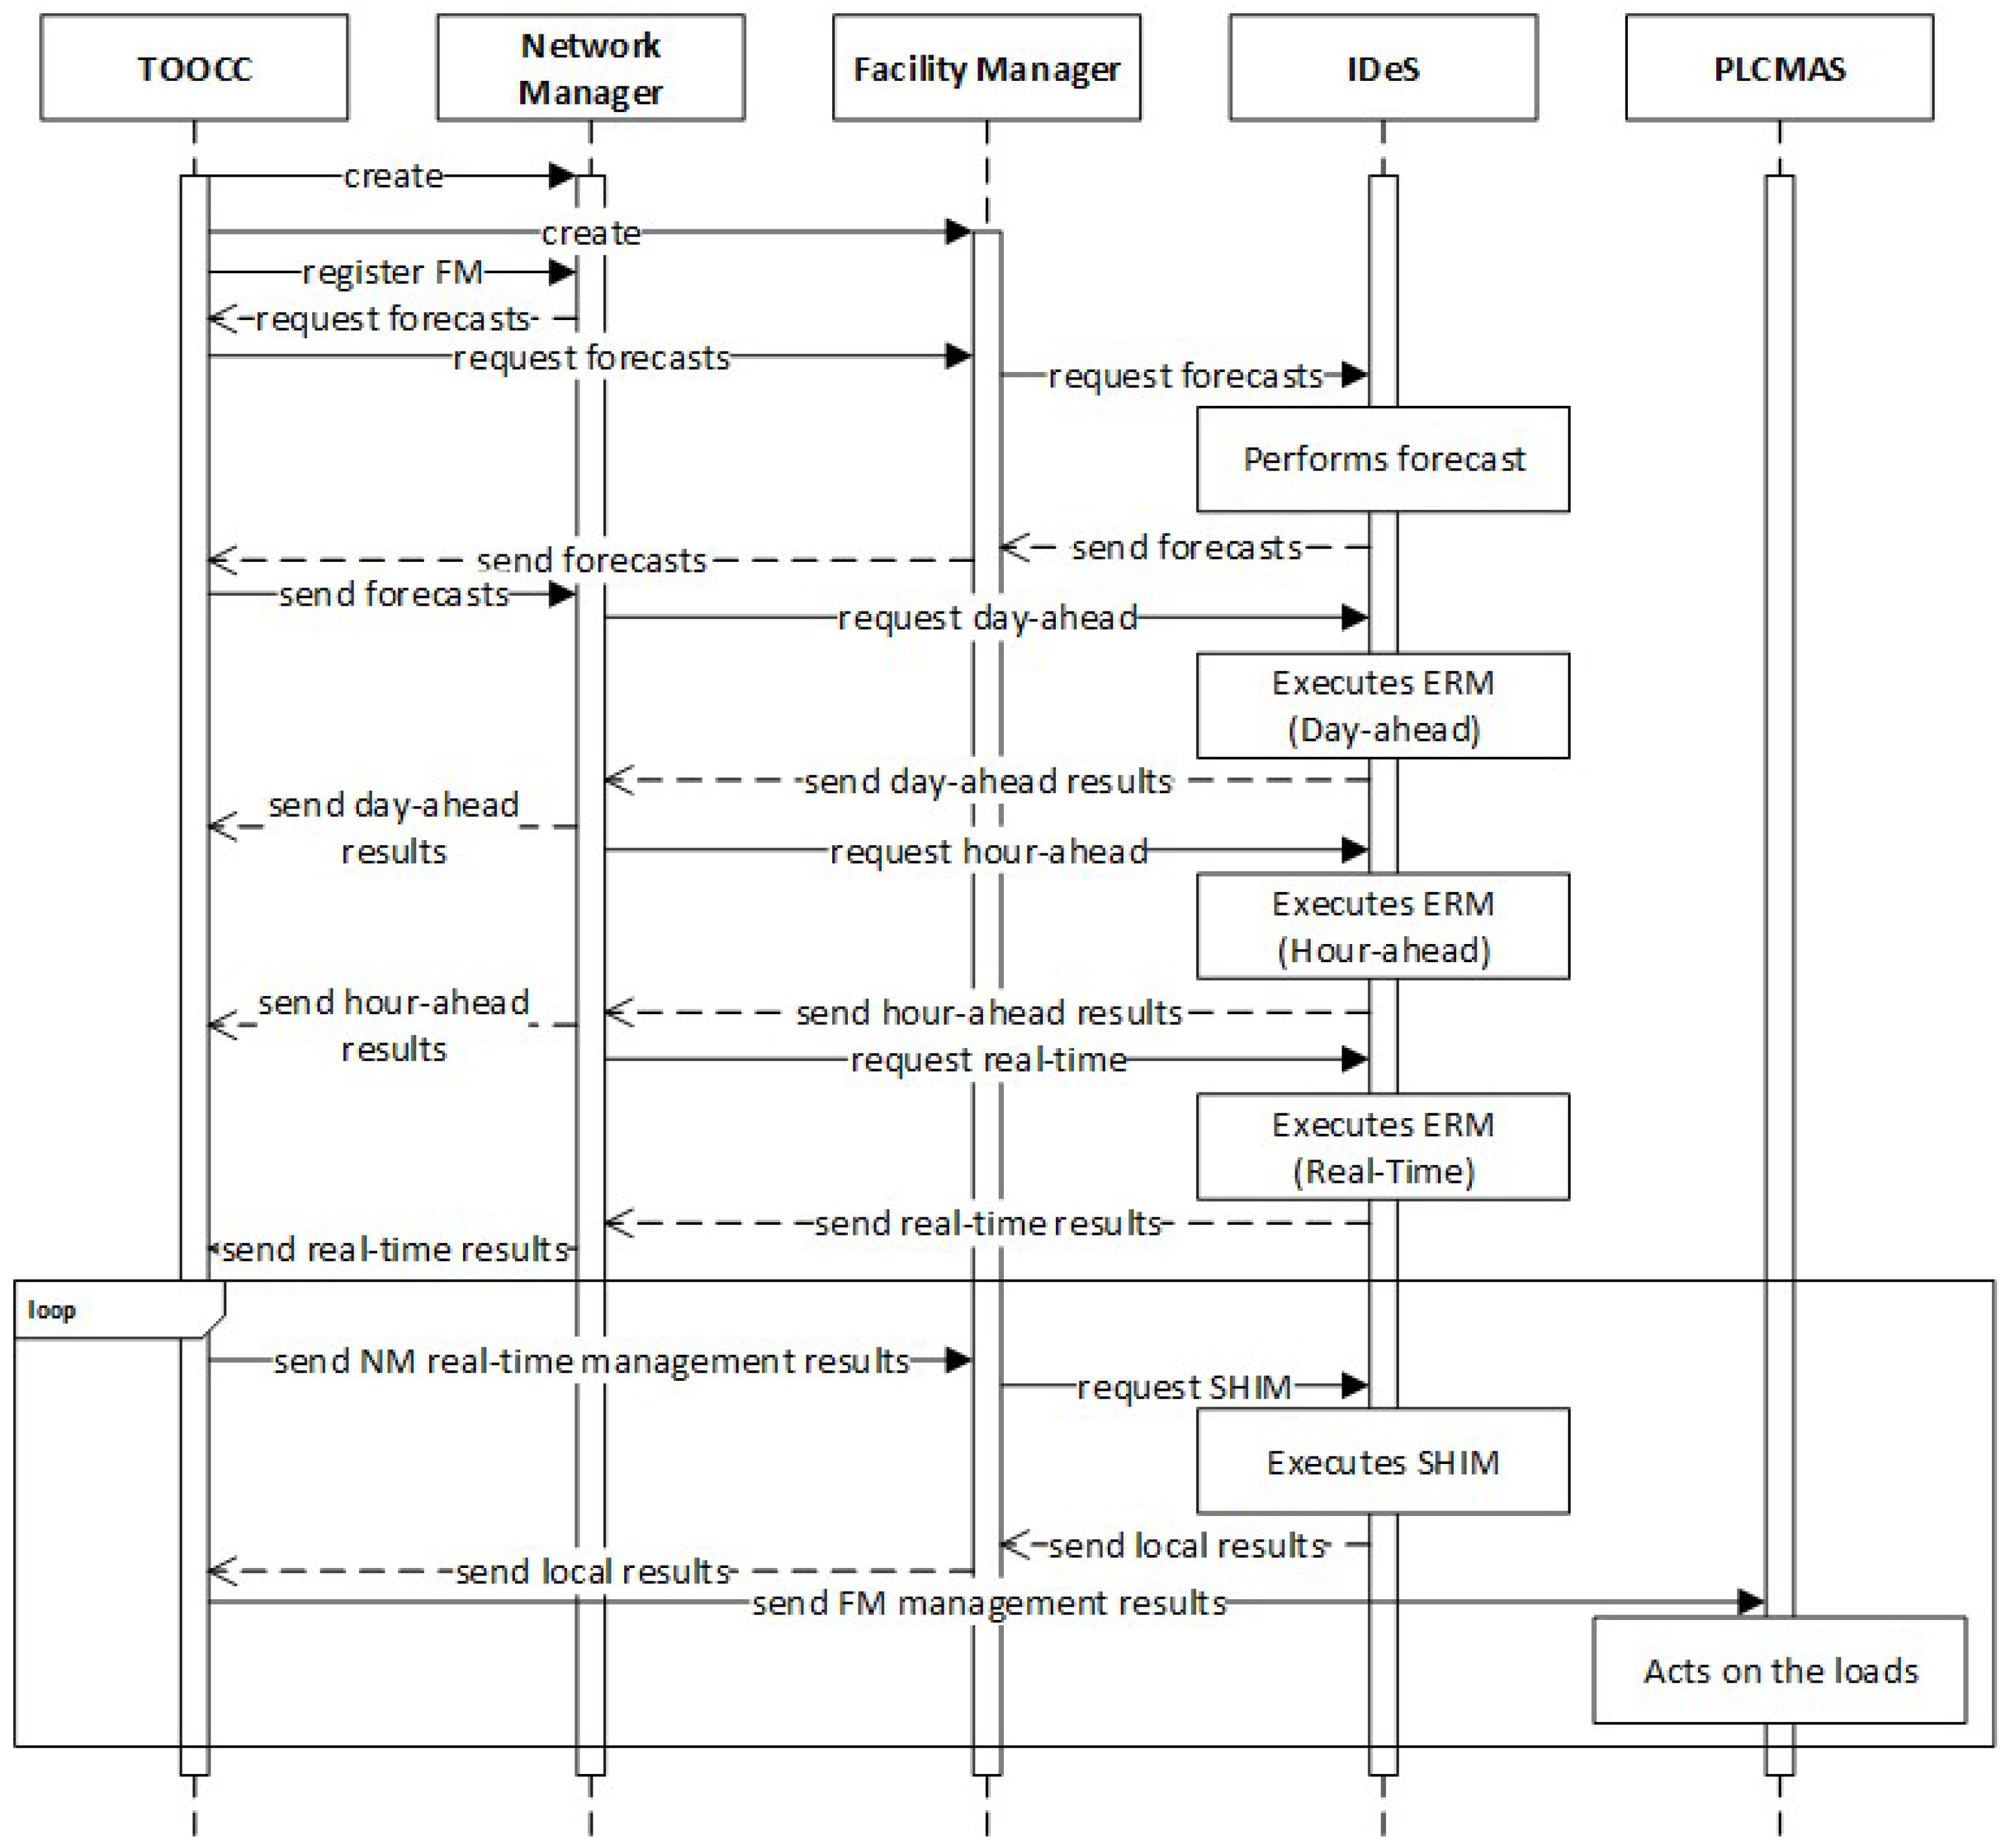
Figure 5 illustrates the interaction between the four different systems and demonstrates how the concepts of the ontologies presented in Section 3.3 are shared between the systems. The communications shown in this figure represent specific interactions between some of the most relevant agents, which are accomplished by a direct use of the considered ontologies. It shows that the initialization of the NM’s scheduling requires the reception of the forecasts from all grid loads/FMs. The forecasts of each load include information on the consumption, production, characteristics and state of the facility’s resources (e.g., sockets, lights, PV generation, etc.). The scenario considers one FM per consumer of the considered microgrid, which is responsible, in this stage, to send the specific consumption and generation forecasts to the NM. FM gets its forecasts by interacting with the IDeS system, which is responsible for executing the forecast algorithm, based on the history of its consumption and power production.
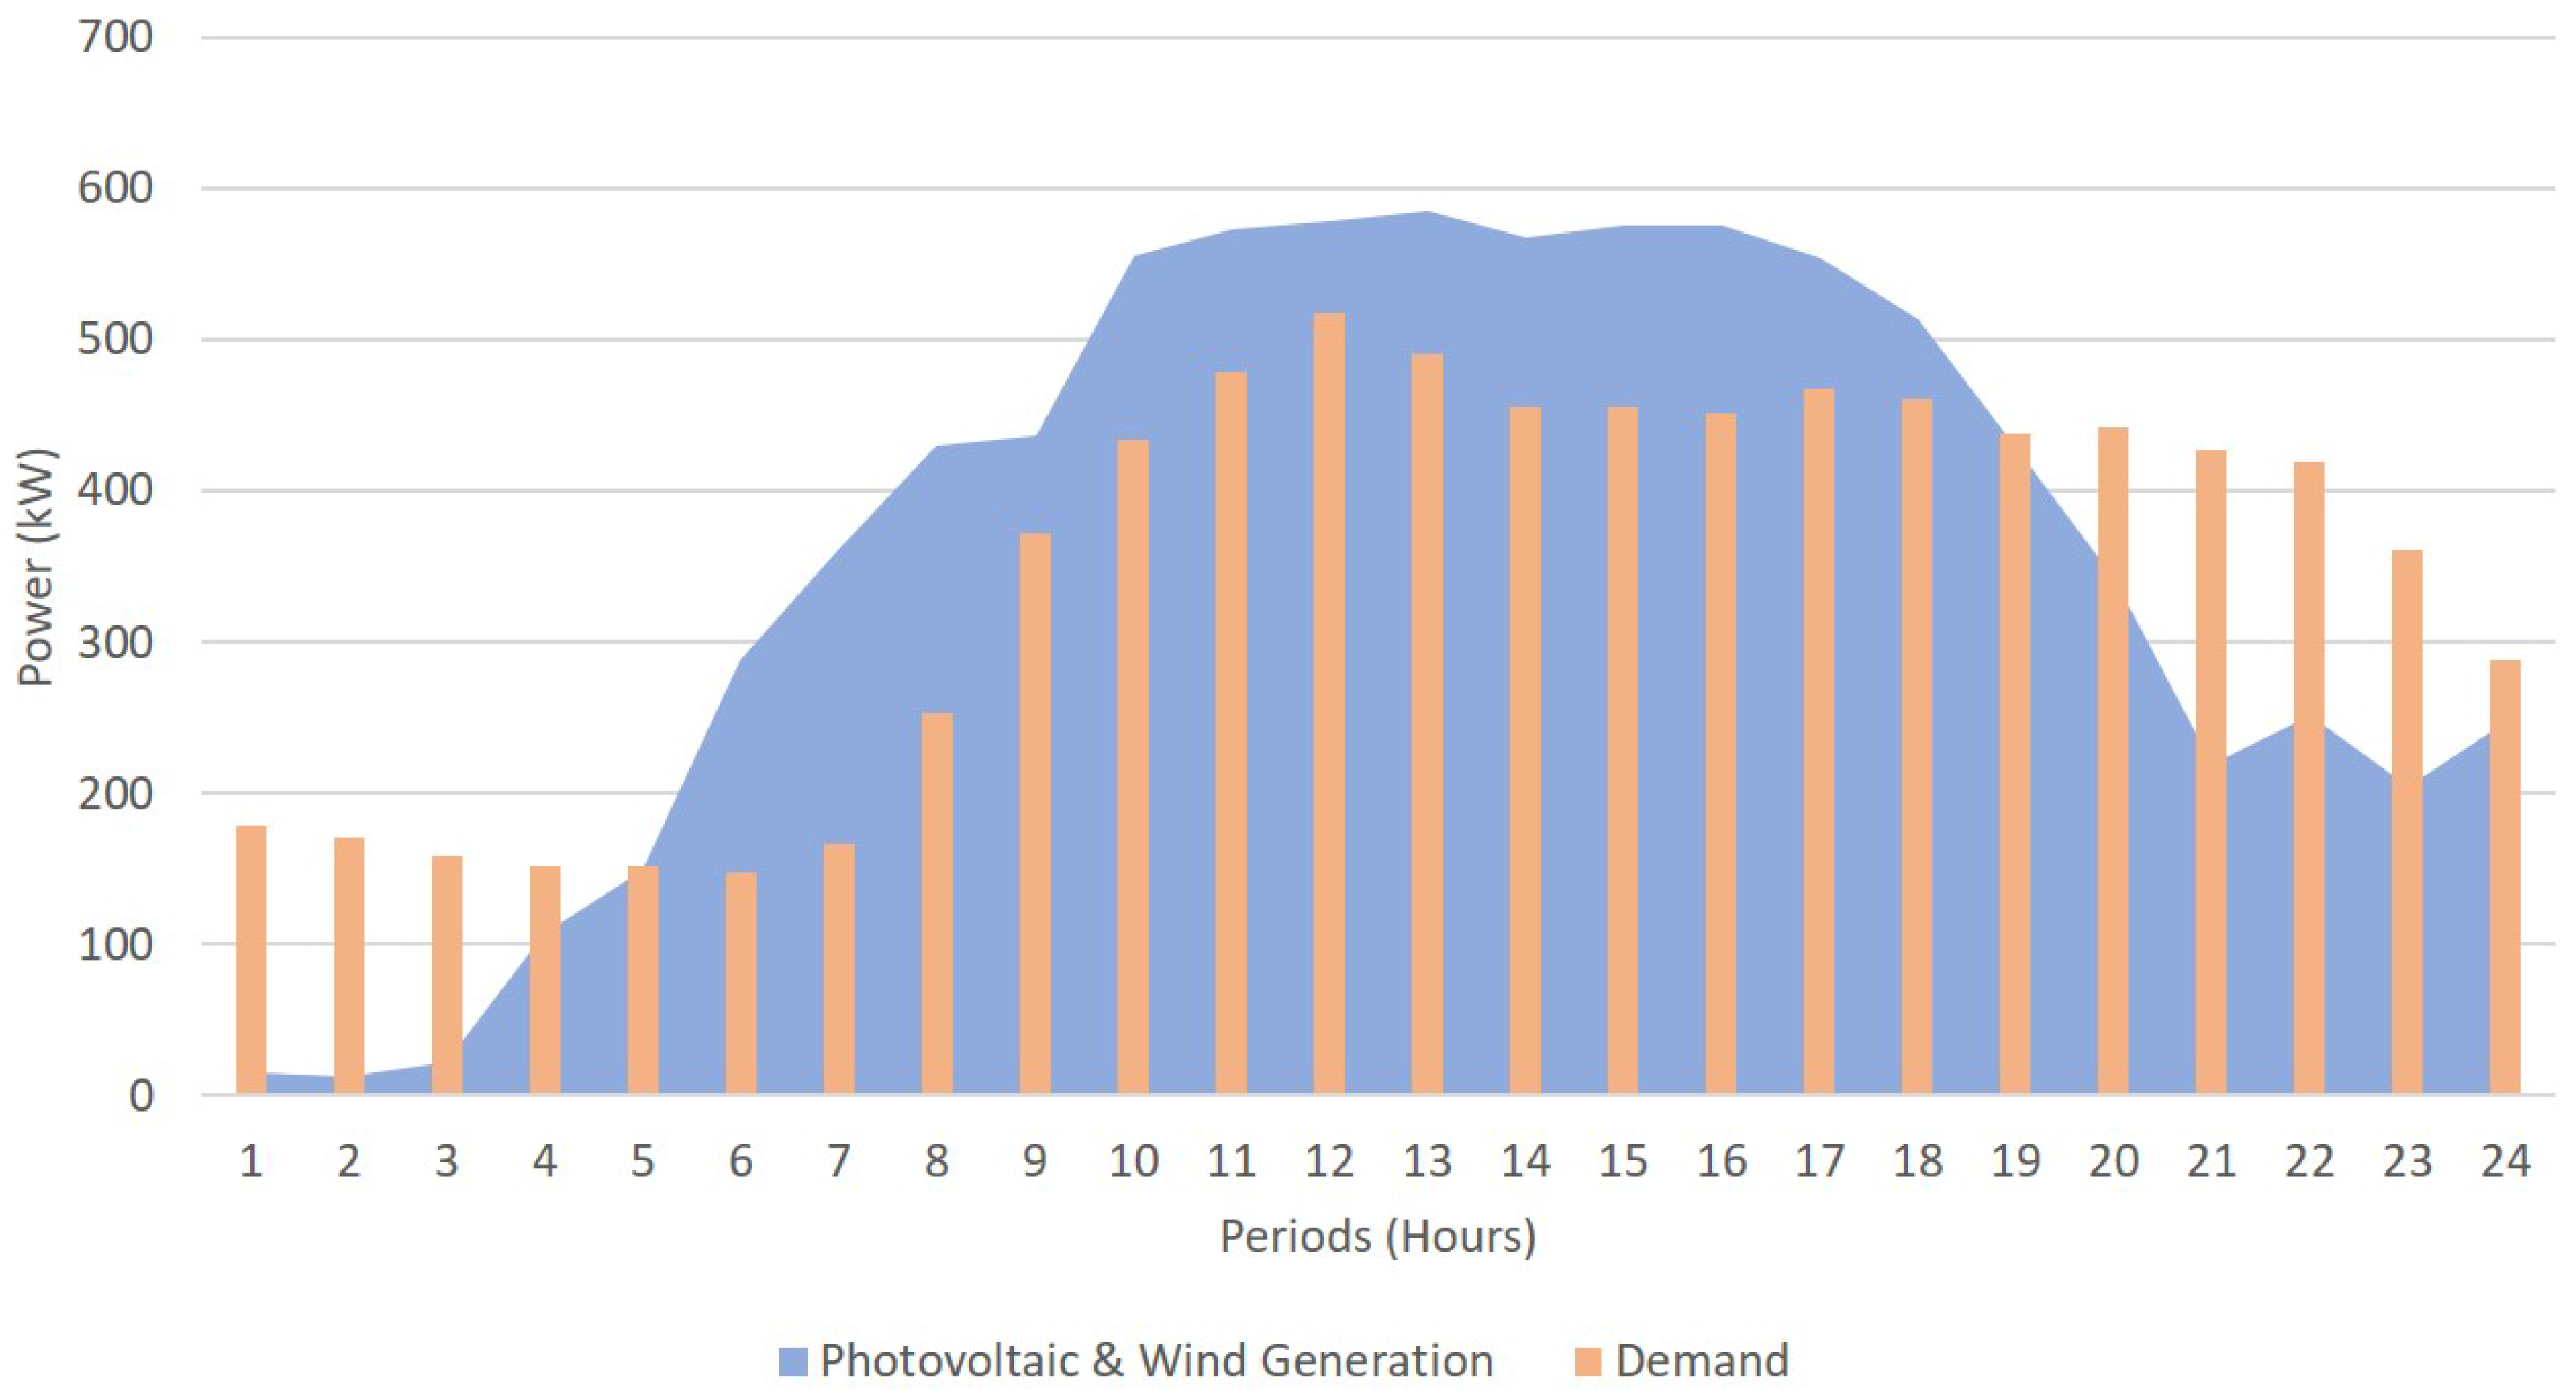
Figure 6 illustrates the forecasts of energy, relative to consumption and distributed production (solar and wind) for the whole microgrid, for the following day. As can be observed, the production peak occurs between 10 a.m. and 6 p.m., where the highest incidence of sunlight is verified, reaching the value of approximately 585 kW. During the night periods, production comes from wind generators. Comparing 1 a.m. and 10 p.m., for instance, it is possible to verify a great difference in the production of energy, due to changes in the state of the wind. As for consumption, between 10 a.m. and 10 p.m. there is a high energy consumption. Since the microgrid is relative to a university campus, this consumption corresponds to the period of classes. The peak consumption is around 11 p.m., reaching about 518 kW. This happens because there is a transition of classes between morning and afternoon, which sums more consumption. The classes of the night have less students, which explains the smaller consumption.
As soon as the FM agent receives all the forecasts, it sends them to TOOCC, which in turn routes them to NM. At this point, the simulation already meets the necessary conditions to carry out the next step, that is to obtain the energy scheduling of the microgrid for the next day.
The next step is to start the scheduling of the energy by the NM agent. For this purpose, the NM uses the Energy Resources Management (ERM) [71] system, provided by IDeS, which executes in three stages: scheduling day-ahead, hour-ahead and real-time. The first stage is for the network operator to perform the energy management for the next day, taking into account forecasts of all loads. The second phase (our-ahead scheduling) is analogous to the previous phase, but it uses up-to-date forecasts, with one hour of delay of the desired moment, guaranteeing a smaller error. The third phase, corresponding to the real-time scheduling, is the same process, but for the next five minutes. This three-phase approach allows the network operator to have a forecast of how the power consumption will be across the network, and the DG available to meet the demand for the next day. As the DG comes from volatile sources, it is important that the NM can adjust itself over time, using up-to-date forecasts, as the estimated value tends to be closer to reality. In this way, energy wastage is avoided, as well as power supply failure. In this case study, the forecasts are exchanged between FM and NM through TOOCC, which acts as an intermediary between the two systems.
Once the real-time scheduling results are obtained, they must be sent to the FM, i.e., Load 15 of the network, so that it can perform the forward local scheduling of energy. Once again, TOOCC has the role of receiving real-time results and forwards them to FM. The FM sends a request for the SCADA House Intelligent Management (SHIM) [72] platform, the execution of which is secured by the IDeS system. This platform is able to perform the local residential energy scheduling, considering the demands and restrictions of the NM.
At this point, in real-time, Load 15 is able to use the results obtained from its own energy management, by acting directly on its physical devices. In order to do this, the FM sends the results to TOOCC, so that it can order the PLCMAS system to implement the necessary changes, once it is connected to the devices responsible for simulating the appliances of the house.
4.3. Results
This subsection presents the obtained results from the process described in Section 4.2, where each sub-system has its own results. However, through TOOCC, the results of a sub-system have a direct impact on the systems that are dependent on its results in order to proceed with their execution. Thus, the following figures show the results of each sub-system. Firstly, the results regarding the scheduling made by NM using ERM will be presented. Then, it is possible to verify the obtained information from local energy management of Load 15, namely through SHIM and PLCMAS. At the end of the subsection, the results of the case study are discussed in a more comprehensive perspective of the problem, explaining how the results are related and the advantages of interoperability between those systems.
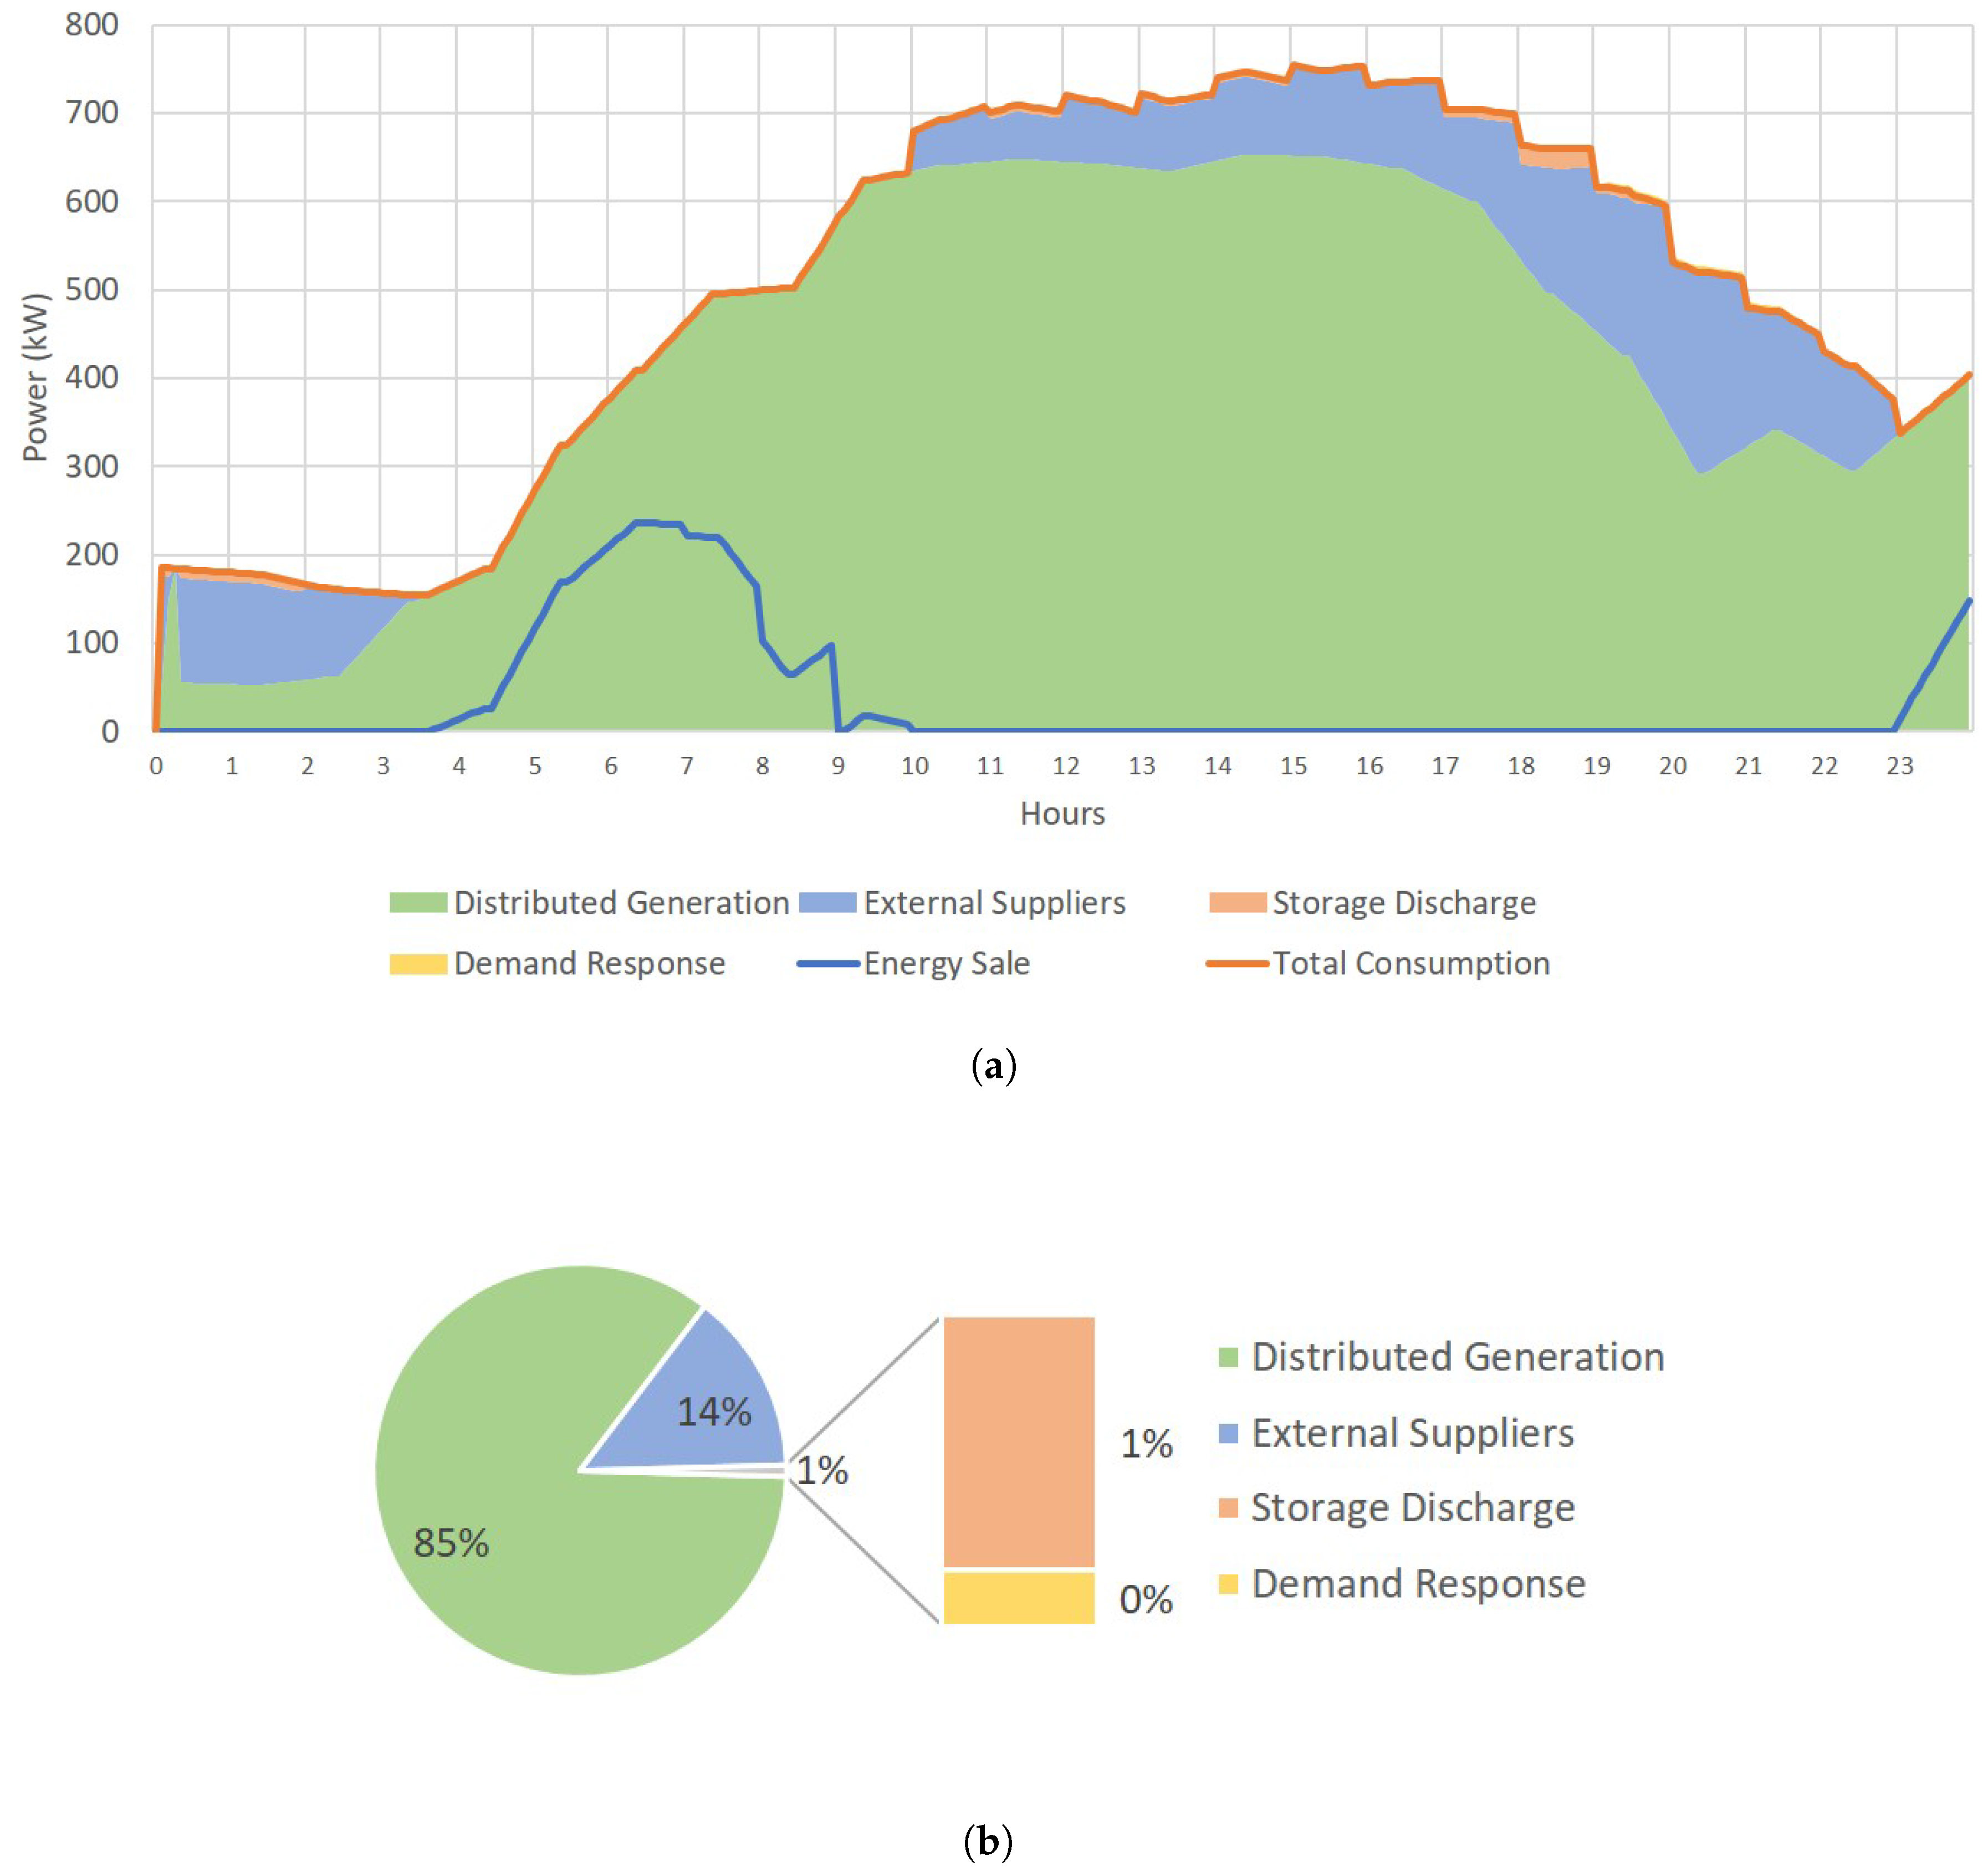
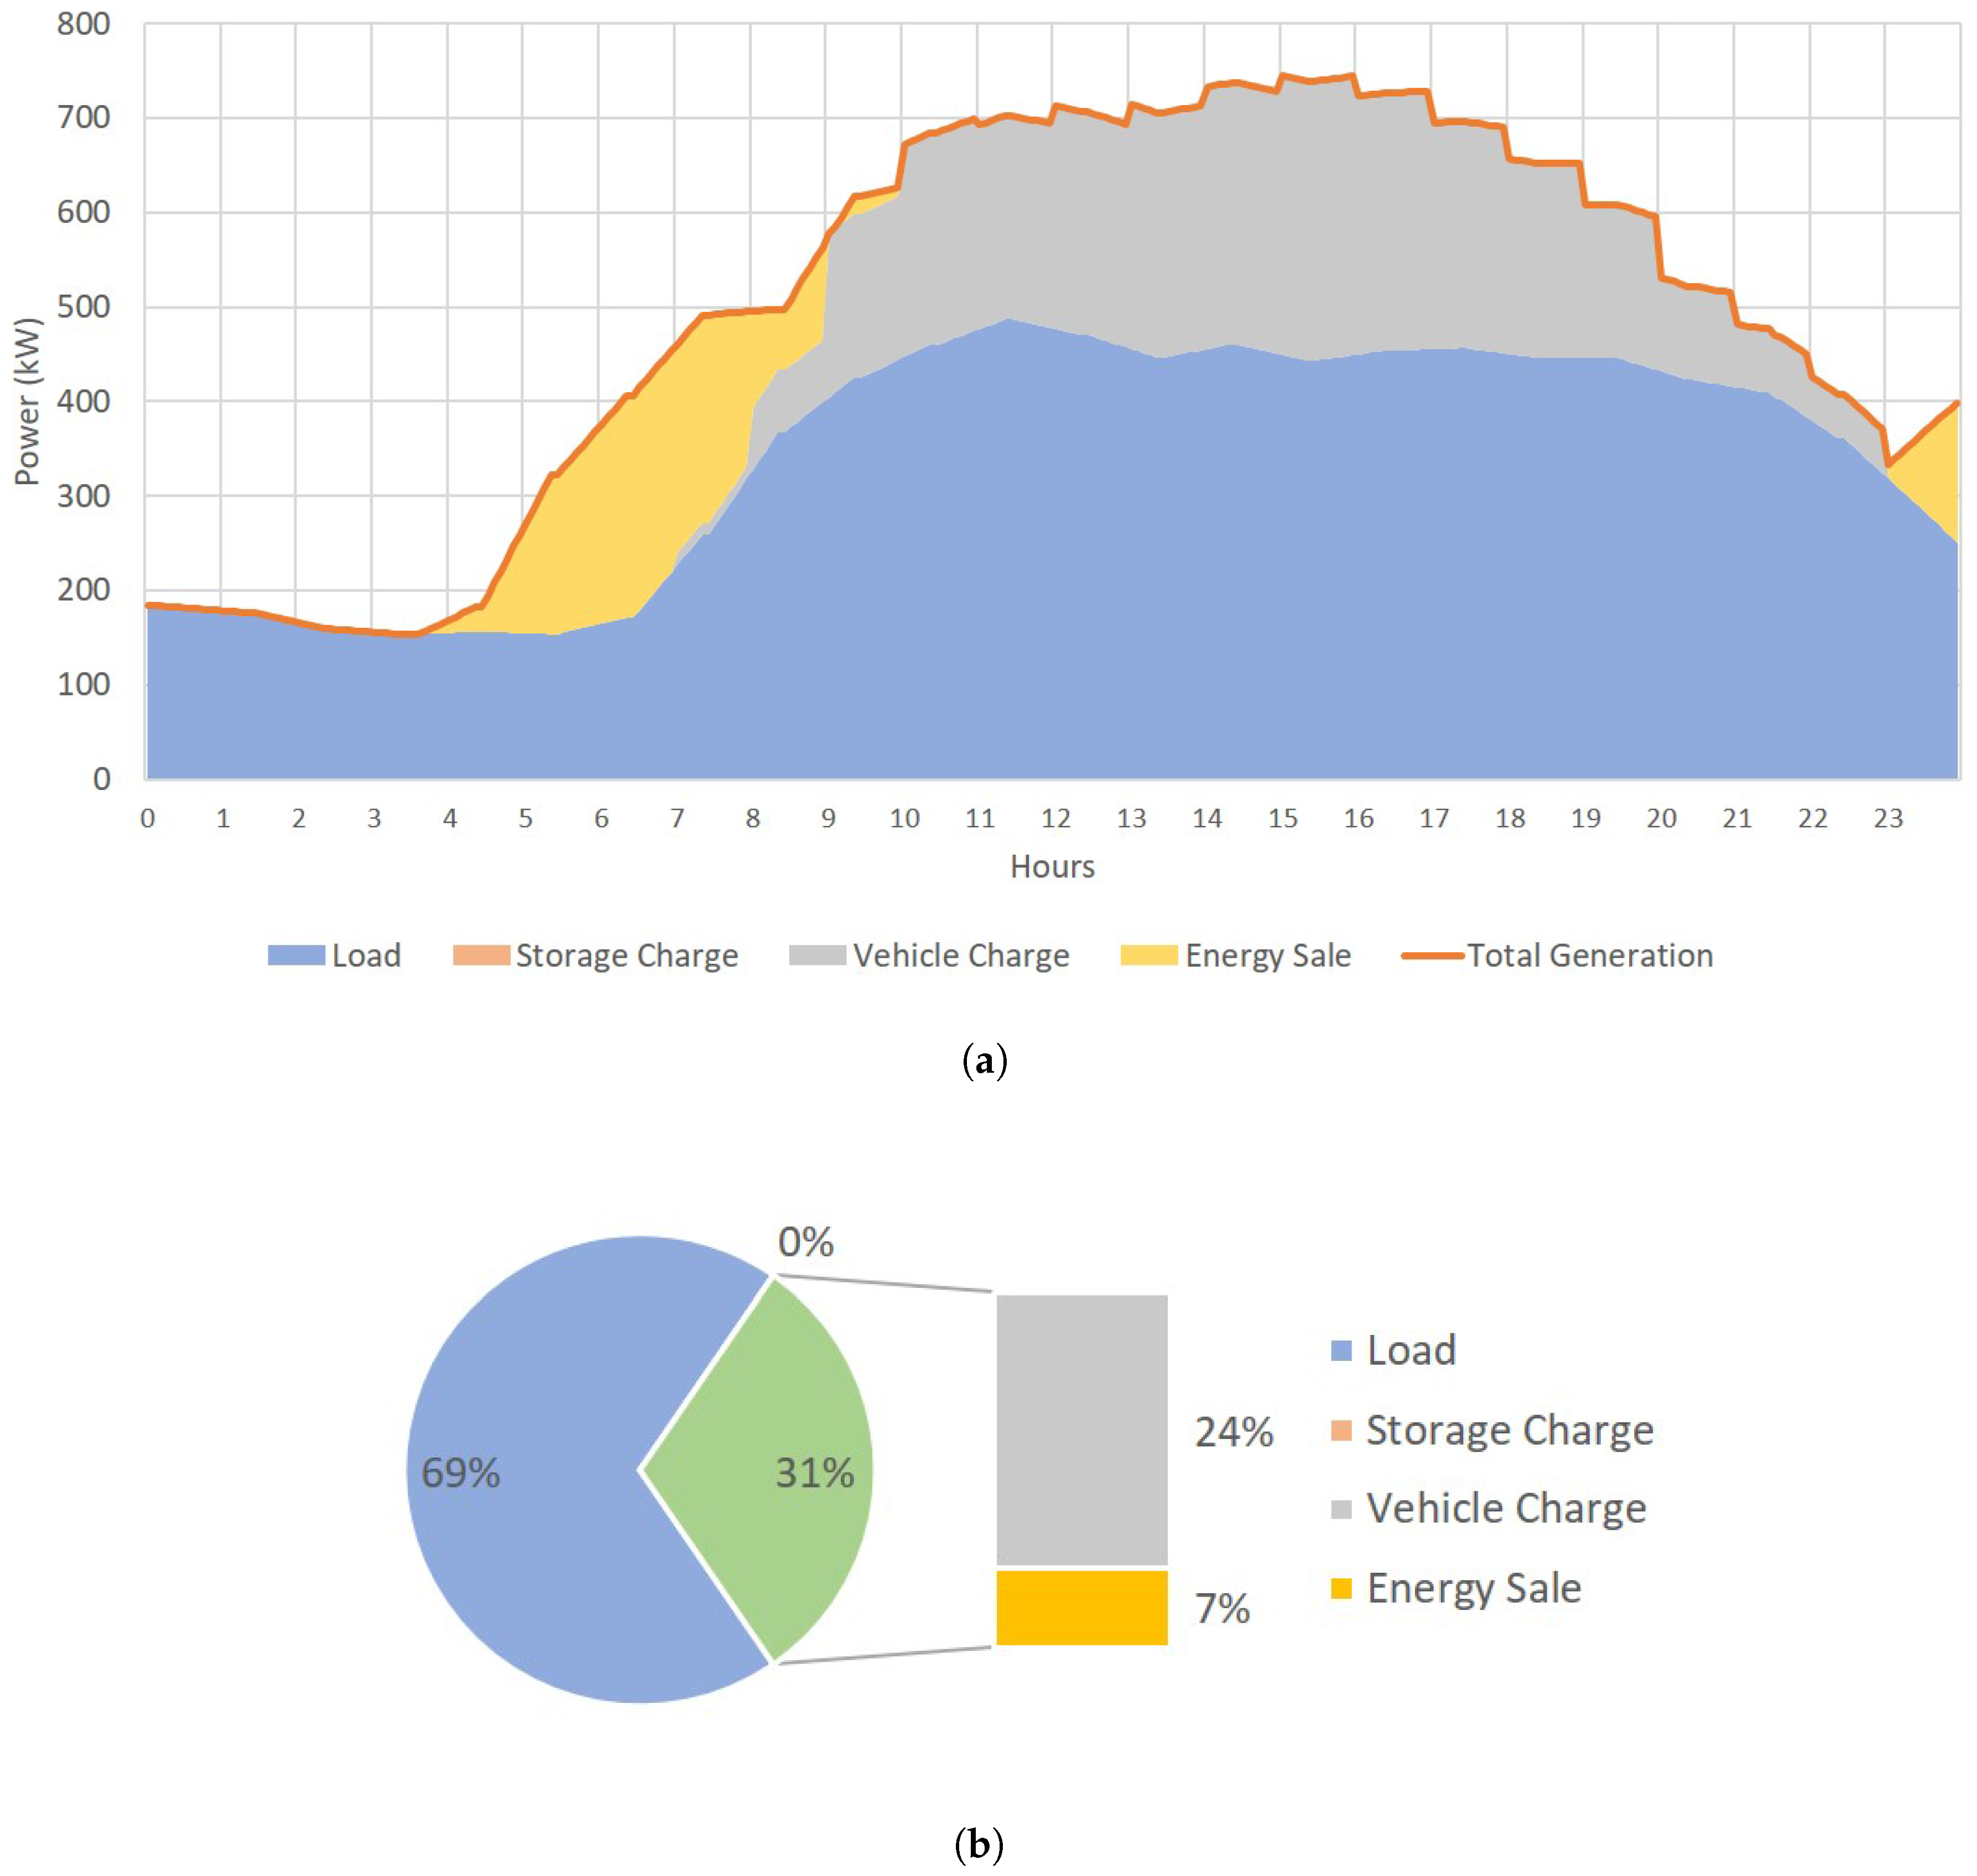
Figure 7a,b allows one to understand what will be the origin of the energy, which will be used to supply the expected consumption of the microgrid. It is possible to observe that the largest source of used energy will be the DG (about 85%), except for the first hours of the day, where there is no sunlight and the wind speed is not enough to satisfy the entire energy demand. In these cases, it is necessary to obtain energy from external energy sources, namely from the electricity market (14%), the use of energy stored in batteries (1%), for example EV, and demand response (with negligible value). Throughout the day, when there is surplus production, it is possible to sell energy to other entities, as seen between 3 a.m. and 10 a.m., and at the end of the day, in a total of 9898 kW.
By analyzing the energy consumption of the microgrid through Figure 8a,b, it can be seen that the two largest sources of energy consumption refer to EV charging (24%) and loads (69%), e.g., plugging in. In addition, there are no battery charges, so the surplus energy is all sold outside the microgrid.
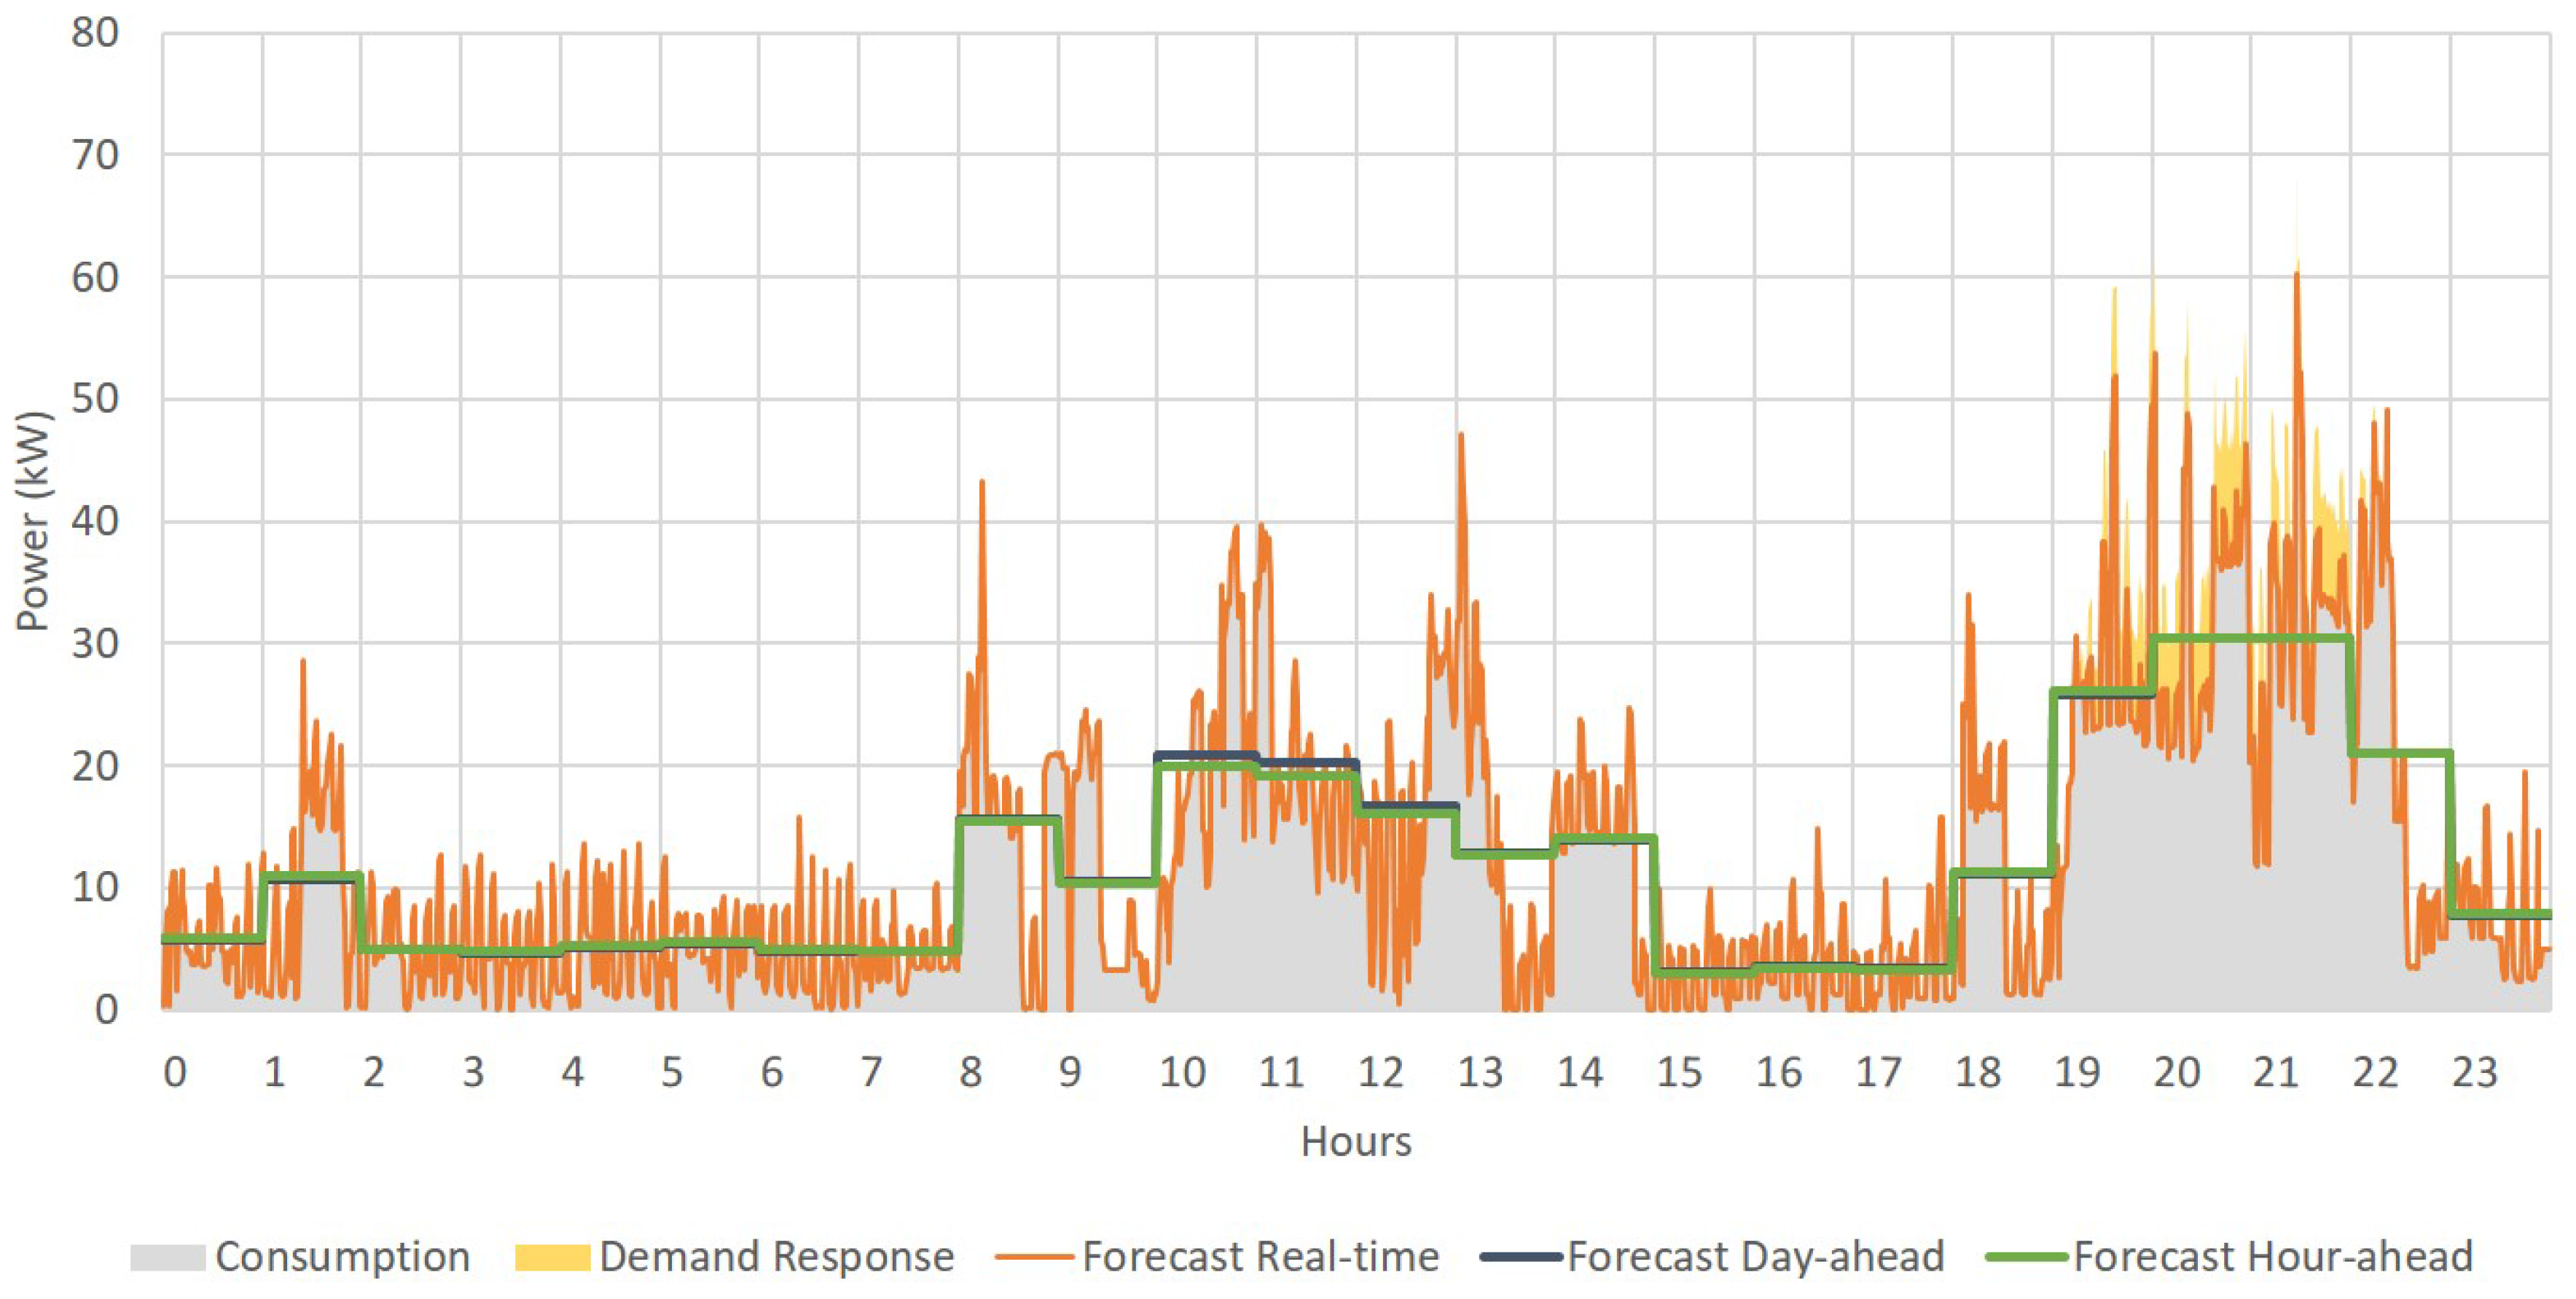
The graph shown in Figure 9 illustrates the scheduling done by NM for Load 15. Since this load simulates the operation of a house, its energy consumption profile differs with the generality of the microgrid. In addition, one can see how the results ranged between day-ahead, hour-ahead and real-time scheduling. The highest peak of consumption is in the evening (between 6 p.m. and 11 p.m.), something that is traditional in the domestic consumer’s profile. It is also during this period that there is a greater demand response, where consumption is transferred to other periods with lower consumption, such as after 12 a.m.
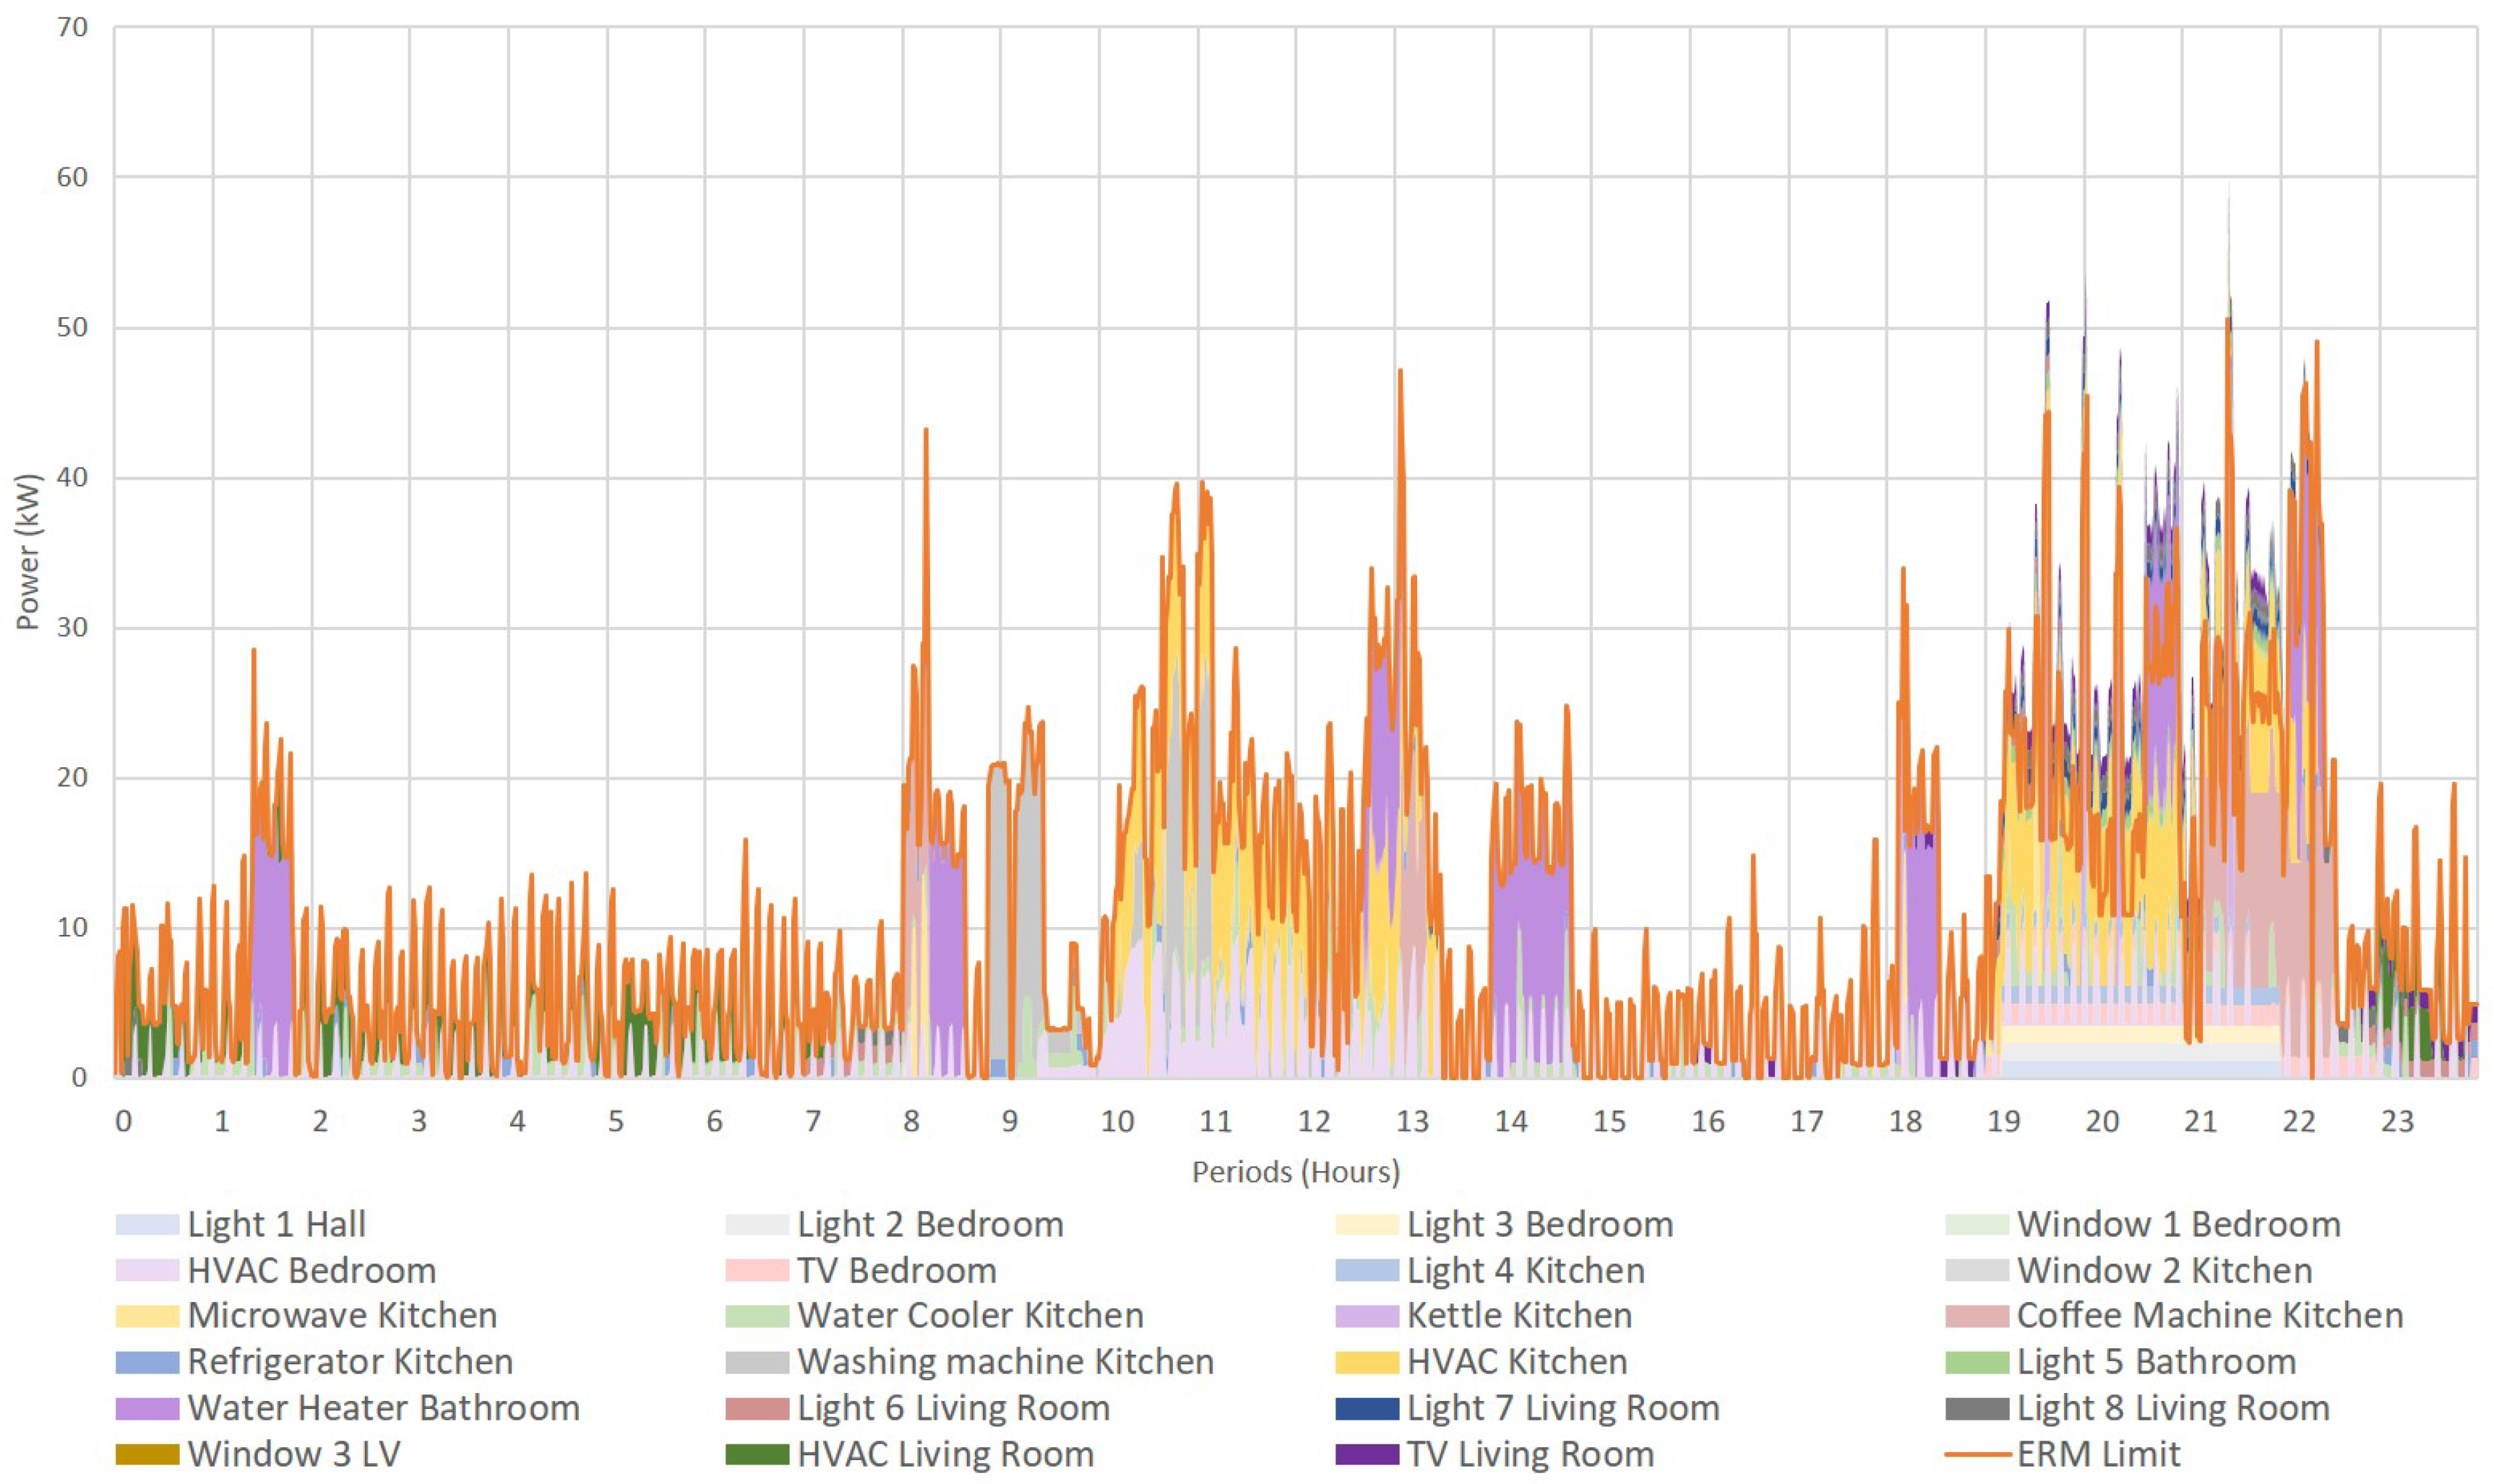
Figure 10 presents the local scheduling of Load 15, considering the ERM load limit per period. Here can be seen the cuts needed to meet the limits imposed by the NM and the shifting of consumptions for off-peak hours, in order to have a more uniform consumption over time and to take advantage of the hours when energy is less expensive. In order to protect some cut devices, the FM sets priorities, where those with the highest priority are not cut. In this case study, since it refers to the winter season, the HVAC and water heater devices have the highest priority since they are important to fight the cold.
The home energy scheduling enables the real-time adaptation of the considered house to multiple events that occur at higher levels of the energy value chain. In particular, the effective control of the physical energy consumption devices is performed as a result of the intelligent energy management that takes into account the variations of local generation, energy prices and user preferences and habits. Moreover, the applied demand response and energy prices result directly from the energy resources management performed by the aggregator, which, in turn, considers the perspective of the whole aggregated area and respective players, in terms of generation, consumption and storage. Finally, the wholesale market itself has an indirect influence on the outcomes of the energy planning in the house, since the prices considered in the energy scheduling at the aggregator level consider the participation and impact in the market. This bidirectional flow of information, from the small device inside the house to the wholesale market, and vice versa, can only be achieved by means of advanced systems that integrate multiple specific sub-systems, such as TOOCC. TOOCC supports the communication and integration between a diversity of different systems, algorithms and players, thus enabling the co-simulation of the full energy chain, which cannot be achieved by using the different tools independently and in a non-integrated way. The results of this case study thereby demonstrate the advantages and significant advances that TOOCC brings to the current literature.
5. Conclusions
The large-scale integration of the DG into EM presents several challenges for the stakeholders, aiming at a balance between satisfying its own needs, not wasting energy and preventing failures. In this scope, analysis and simulation tools allow participant entities to have mechanisms that allow them to achieve their objectives.
This paper presents the TOOCC framework as a new solution to allow the interoperability between heterogeneous systems in the area of energy systems simulation, through the construction of scenarios, its simulation and analysis of the obtained results. Scenarios can be configured to simulate more or less complex problems, integrating multiple multi-agent systems and combining their individual capabilities into a more complete simulator, in order to study the behavior of the involved entities, new market models, consumption profiles, energy management of the network and virtual power plants, among other concepts, and its relations. In addition, the simulation of tools for different contexts can also provide decision support to a wide variety of entity types, depending on the user’s purpose. TOOCC provides interoperability; flexibility in the creation of the scenario due to the combination of infinite possibilities that result from the personalization of models and possible tools to use; realism by providing historical data; centralized management of the simulation and the scenario’s configuration; results analysis to provide decision support to its user; automation in all simulation processes; human error reduction; and a graphical interface for the user be able to follow all process.
In order to achieve interoperability between systems, TOOCC relies on public ontologies to enable systems to understand the same concepts. For a new tool to be able to communicate with TOOCC, it needs to implement those ontologies or make the necessary mappings.
A case study was presented to exemplify how the systems which simulate different entities of energy and power systems are interoperable by using the TOOCC framework. The case study is relative to energy management in a real microgrid, where the interactions between the consumer and the microgrid aggregator were simulated and studied, in order to understand the benefits that can result from this. Through forecasts of the consumer’s energy consumption, the aggregator can perform better energy management of the network, avoiding the waste of energy in the grid and providing the consumer with cost savings. With this, the consumer can take advantage of periods where energy has a lower cost, through consumption shifting, avoiding consumption peaks at times where the price of energy is higher, without having to reduce his/her comfort and compromising his/her daily needs.
Results show that TOOCC allows the simplified configuration of scenarios with a high degree of complexity and that its execution is done automatically, without the need for any human intervention. This supports the conclusion that TOOCC is an innovative enhanced decision support system, which allows one to go a step further in the study and simulation of this field. For this purpose, the proposed framework provides the mechanisms for the joint simulation and analysis of multiple systems directed to the study of specific problems, resulting in a complete tool for studying the problem as a whole.
As future work, the priority is to enable interoperability with further external systems, to cover the simulation of other areas in energy systems. It is also intended to provide a public version of the tool, but it is not yet possible to make it fully available due to the existence of integrated systems that interact directly with physical devices, some of which may be critical. Since it is intended that the tool is always available to the user, it is important that there are no critical faults that jeopardize the good functioning of the system. TOOCC has mechanisms to prevent communication failures between agents, taking advantage of the potential of the ACL’s message format. However, work must be done in this regard. Moreover, it is also necessary to improve the fault simulation mechanism (e.g., technical problems in a microgrid node), since it is in an initial state, due to its complexity. Another aspect to improve relates to the availability of more complete results’ analysis mechanisms.
Acknowledgments
This work has been developed in the scope of the European Union’s Horizon 2020 research and innovation programme under the Marie Sklodowska-Curie grant agreement No. 641794 (project DREAM-GO); CONTEST project - SAICT-POL/23575/2016; and has also been supported by FEDER Funds through COMPETE program and from National Funds through FCT under the project UID/EEA/00760/2013.
Author Contributions
Brígida Teixeira, Tiago Pinto, Francisco Silva and Gabriel Santos conceived and designed the computational models; Brígida Teixeira, Tiago Pinto, Francisco Silva and Gabriel Santos conceived and designed the experiments; Brígida Teixeira performed the experiments; Tiago Pinto, Francisco Silva and Gabriel Santos analyzed the data; Zita Vale contributed with expertise in AI methods for power systems; Isabel Praça contributed with expertise in MAS simulation; Brígida Teixeira wrote the paper; Tiago Pinto, Zita Vale, Isabel Praça revised and improved the paper.
Conflicts of Interest
The authors declare no conflict of interest.
References
- Shahidehpour, M.; Yamin, H.; Li, Z. Market Overview in Electric Power Systems; John Wiley & Sons, Inc.: New York, NY, USA, 2002; pp. 1–20. [Google Scholar]
- Silva, F.; Teixeira, B.; Pinto, T.; Santos, G.; Vale, Z.; Praça, I. Generation of realistic scenarios for multi-agent simulation of electricity markets. Energy 2016, 116, 128–139. [Google Scholar] [CrossRef]
- Knieps, G. Renewable Energy, Efficient Electricity Networks, and Sector-Specific Market Power Regulation. In Evolution of Global Electricity Markets: New Paradigms, New Challenges, New Approaches; Sioshansi, F.P., Ed.; Academic Press: Boston, MA, USA, 2013; pp. 147–168. [Google Scholar]
- Ahlstrom, M.; Ela, E.; Riesz, J.; O’Sullivan, J.; Hobbs, B.F.; O’Malley, M.; Milligan, M.; Sotkiewicz, P.; Caldwell, J. The Evolution of the Market: Designing a Market for High Levels of Variable Generation. IEEE Power Energy Mag. 2015, 13, 60–66. [Google Scholar] [CrossRef]
- Wüstenhagen, R.; Menichetti, E. Strategic choices for renewable energy investment: Conceptual framework and opportunities for further research. Energy Policy 2012, 40, 1–10. [Google Scholar] [CrossRef]
- European Commission. 2020 Climate & Energy Package. 2017. Available online: https://ec.europa.eu/clima/policies/strategies/2020_en (accessed on 1 June 2017).
- European Commission. Energy Challenges and Policy. 2013. Available online: http://ec.europa.eu/europe2020/pdf/energy2_en.pdf (accessed on 1 June 2017).
- Lund, H.; Kempton, W. Chapter 5—Analysis: Large-scale integration of renewable energy. In Renewable Energy Systems, 2rd ed.; Lund, H., Ed.; Academic Press: Boston, MA, USA, 2014; pp. 79–129. [Google Scholar]
- Colloca, L.; Miller, F.G. Smart Grids: Infrastructure, Technology, and Solutions; Electric Power and Energy Engineering; Taylor & Francis: Boca Raton, FL, USA, 2013; pp. 277–286. [Google Scholar]
- Khodayar, M.E.; Manshadi, S.D.; Vafamehr, A. The short-term operation of microgrids in a transactive energy architecture. Electr. J. 2016, 29, 41–48. [Google Scholar] [CrossRef]
- Balcombe, P.; Rigby, D.; Azapagic, A. Environmental impacts of microgeneration: Integrating solar PV, Stirling engine CHP and battery storage. Appl. Energy 2015, 139, 245–259. [Google Scholar] [CrossRef]
- Kotilainen, K.; Jarventausta, P.; Aalto, P. Prosumer centric co-creation in Smart Grid innovation ecosystem. In Proceedings of the IEEE PES Innovative Smart Grid Technologies Conference Europe, Melbourne, Australia, 28 November–1 December 2016; pp. 884–889. [Google Scholar]
- Yuan, C.; Illindala, M.S.; Khalsa, A.S. Co-Optimization Scheme for Distributed Energy Resource Planning in Community Microgrids. IEEE Trans. Sustain. Energy 2017, 8, 1351–1360. [Google Scholar] [CrossRef]
- Richter, A.; Moskalenko, N.; Hauer, I.; Schröter, T.; Wolter, M. Technical integration of virtual power plants into German system operation. In Proceedings of the 2017 14th International Conference on the European Energy Market (EEM), Dresden, Germany, 6–9 June 2017; pp. 1–6. [Google Scholar]
- Koirala, B.P.; Koliou, E.; Friege, J.; Hakvoort, R.A.; Herder, P.M. Energetic communities for community energy: A review of key issues and trends shaping integrated community energy systems. Renew. Sustain. Energy Rev. 2016, 56, 722–744. [Google Scholar] [CrossRef]
- Good, N.; Ellis, K.A.; Mancarella, P. Review and classification of barriers and enablers of demand response in the smart grid. Renew. Sustain. Energy Rev. 2017, 72, 57–72. [Google Scholar] [CrossRef]
- Lasseter, B. Microgrids [distributed power generation]. In Proceedings of the 2001 IEEE Power Engineering Society Winter Meeting, Columbus, OH, USA, 28 January–1 February 2001; Volume 1, pp. 146–149. [Google Scholar]
- Georgilakis, P.S.; Hatziargyriou, N.D. Optimal distributed generation placement in power distribution networks: Models, methods, and future research. IEEE Trans. Power Syst. 2013, 28, 3420–3428. [Google Scholar] [CrossRef]
- Schachinger, D.; Kastner, W.; Gaida, S. Ontology-based abstraction layer for smart grid interaction in building energy management systems. In Proceedings of the 2016 IEEE International Energy Conference (ENERGYCON), Leuven, Belgium, 4–6 April 2016; pp. 1–6. [Google Scholar]
- Angermann, H.; Pervez, Z.; Ramzan, N. Taxo-Semantics: Assessing similarity between multi-word expressions for extending e-catalogs. Decis. Support Syst. 2017, 98, 10–25. [Google Scholar] [CrossRef]
- Quijano-Sanchez, L.; Liberatore, F. The BIG CHASE: A decision support system for client acquisition applied to financial networks. Decis. Support Syst. 2017, 98, 49–58. [Google Scholar] [CrossRef]
- Fu, X.; Zeng, X.J.; Luo, X.; Wang, D.; Xu, D.; Fan, Q.L. Designing an intelligent decision support system for effective negotiation pricing: A systematic and learning approach. Decis. Support Syst. 2017, 96, 49–66. [Google Scholar] [CrossRef]
- Howell, S.; Rezgui, Y.; Hippolyte, J.L.; Jayan, B.; Li, H. Towards the next generation of smart grids: Semantic and holonic multi-agent management of distributed energy resources. Renew. Sustain. Energy Rev. 2017, 77, 193–214. [Google Scholar] [CrossRef]
- Conzelmann, G.; Boyd, G.; Koritarov, V.; Veselka, T. Multi-agent power market simulation using EMCAS. In Proceedings of the IEEE Power Engineering Society General Meeting, San Francisco, CA, USA, 16 June 2005; pp. 917–922. [Google Scholar]
- Li, H.; Tesfatsion, L. The AMES wholesale power market test bed: A computational laboratory for research, teaching, and training. In Proceedings of the 2009 PES ’09 IEEE Power and Energy Society General Meeting, Calgary, AB, Canada, 26–30 July 2009; pp. 1–8. [Google Scholar]
- Algarvio, H.; Lopes, F. Risk Management and Bilateral Contracts in Multi-agent Electricity Markets. In Communications in Computer and Information Science; Corchado, J.M., Bajo, J., Kozlak, J., Pawlewski, P., Molina, J.M., Gaudou, B., Julian, V., Unland, R., Lopes, F., Hallenborg, K., et al., Eds.; Springer: Cham, Switzerland, 2014; Volume 430, pp. 279–308. [Google Scholar]
- Aliabadi, D.E.; Kaya, M.; Şahin, G. An agent-based simulation of power generation company behavior in electricity markets under different market-clearing mechanisms. Energy Policy 2017, 100, 191–205. [Google Scholar] [CrossRef]
- Oliveira, P.; Pinto, T.; Morais, H.; Vale, Z. MASGriP a multi-agent smart grid simulation platform. In Proceedings of the IEEE Power and Energy Society General Meeting, San Diego, CA, USA, 22–26 July 2012; pp. 1–8. [Google Scholar]
- Ketter, W.; Collins, J.; Reddy, P. Power TAC: A competitive economic simulation of the smart grid. Energy Econ. 2013, 39, 262–270. [Google Scholar] [CrossRef]
- Haan, J.E.S.; Nguyen, P.H.; Kling, W.L.; Ribeiro, P.F. Social interaction interface for performance analysis of smart grids. In Proceedings of the 2011 IEEE First International Workshop on Smart Grid Modeling and Simulation (SGMS), Brussels, Belgium, 17 October 2011; pp. 79–83. [Google Scholar]
- Papadopoulos, S.; Azar, E. Integrating building performance simulation in agent-based modeling using regression surrogate models: A novel human-in-the-loop energy modeling approach. Energy Build. 2016, 128, 214–223. [Google Scholar] [CrossRef]
- Lin, H.; Wang, Q.; Wang, Y.; Liu, Y.; Sun, Q.; Wennersten, R. The energy-saving potential of an office under different pricing mechanisms—Application of an agent-based model. Appl. Energy 2017, 202, 248–258. [Google Scholar] [CrossRef]
- Huang, C.; Weng, S.; Yue, D.; Deng, S.; Xie, J.; Ge, H. Distributed cooperative control of energy storage units in microgrid based on multi-agent consensus method. Electr. Power Syst. Res. 2017, 147, 213–223. [Google Scholar] [CrossRef]
- Marmaras, C.; Xydas, E.; Cipcigan, L. Simulation of electric vehicle driver behavior in road transport and electric power networks. Transp. Res. Part C Emerg. Technol. 2017, 80, 239–256. [Google Scholar] [CrossRef]
- Siemens. Grid Analysis Tools. 2017. Available online: http://w3.usa.siemens.com/smartgrid/us/en/transmission-grid/products/grid-analysis-tools/Pages/grid-analysis-tools.aspx (accessed on 1 June 2017).
- Kreckelbergh, S.; Vechiu, I. Sizing and dynamic analyzes of a micro-grid supplying a harbor industrial area. In Proceedings of the 2012 16th International Conference on System Theory, Control and Computing (ICSTCC), Sinaia, Romania, 12–14 October 2012; pp. 1–5. [Google Scholar]
- HOMER. Homer. 2017. Available online: http://www.homerenergy.com/ (accessed on 1 June 2017).
- Tractebel Engineering S.A. EuroStag. 2017. Available online: http://www.eurostag.be/ (accessed on 1 June 2017).
- Asimakopoulou, G.E.; Voumvoulakis, E.M.; Dimeas, A.L.; Hatziargyriou, N.D. Impact of large-scale integration of intelligent meters to the operation of the power system of crete. In Proceedings of the 2011 16th International Conference on Intelligent System Applications to Power Systems (ISAP), Hersonissos, Greece, 25–28 September 2011; pp. 1–6. [Google Scholar]
- OMNeT++. OMNeT++: Discrete Event Simulator. 2017. Available online: http://omnetpp.org/ (accessed on 1 June 2017).
- GridLAB-D. GridLAB-D: Power Distribution System Simulation. 2017. Available online: http://www.gridlabd.org/ (accessed on 1 June 2017).
- Exel, L.; Felgner, F.; Frey, G. Multi-domain modeling of distributed energy systems—The MOCES approach. In Proceedings of the 2015 IEEE International Conference on Smart Grid Communications (SmartGridComm), Miami, FL, USA, 2–5 November 2015; pp. 774–779. [Google Scholar]
- Anderson, D.; Zhao, C.; Hauser, C.H.; Venkatasubramanian, V.; Bakken, D.E.; Bose, A. A virtual smart grid. IEEE Power Energy Mag. 2012, 10, 49–57. [Google Scholar] [CrossRef]
- Wijaya, T.K.; Banerjee, D.; Ganu, T.; Chakraborty, D.; Battacharya, S.; Papaioannou, T.; Seetharam, D.P.; Aberer, K. DRSim: A cyber physical simulator for demand response systems. In Proceedings of the 2013 IEEE International Conference on Smart Grid Communications (SmartGridComm), Vancouver, BC, Canada, 21–24 October 2013; pp. 217–222. [Google Scholar]
- Du, B.; Guo, S. Production planning conflict resolution of complex product system in group manufacturing: A novel hybrid approach using ant colony optimization and Shapley value. Comput. Ind. Eng. 2016, 94, 158–169. [Google Scholar] [CrossRef]
- Argoneto, P.; Renna, P. Capacity sharing in a network of enterprises using the Gale–Shapley model. Int. J. Adv. Manuf. Technol. 2013, 69, 1907–1916. [Google Scholar] [CrossRef]
- Hopkinson, K.; Wang, X.; Giovanini, R.; Thorp, J.; Birman, K.; Coury, D. EPOCHS: A platform for agent-based electric power and communication simulation built from commercial off-the-shelf components. IEEE Trans. Power Syst. 2006, 21, 548–558. [Google Scholar] [CrossRef]
- Lin, H.; Veda, S.S.; Shukla, S.S.; Mili, L.; Thorp, J. GECO: Global event-driven co-simulation framework for interconnected power system and communication network. IEEE Trans. Smart Grid 2012, 3, 1444–1456. [Google Scholar] [CrossRef]
- Schütte, S.; Scherfke, S.; Tröschel, M. Mosaik: A framework for modular simulation of active components in Smart Grids. In Proceedings of the 2011 IEEE First International Workshop on Smart Grid Modeling and Simulation (SGMS), Brussels, Belgium, 17 October 2011; pp. 55–60. [Google Scholar]
- Scherfke, S. Mosaik Documentation. 2018. Available online: https://media.readthedocs.org/pdf/mosaik/latest/mosaik.pdf (accessed on 15 January 2018).
- Fischer, K. Dealing with interoperability: An agent-oriented perspective. In Proceedings of the 2009 IEEE International Technology Management Conference (ICE), Leiden, The Netherlands, 22–24 June 2009; pp. 1–4. [Google Scholar]
- Santodomingo, R.; Rohjans, S.; Uslar, M.; Rodríguez-Mondéjar, J.A.; Sanz-Bobi, M.A. Ontology matching system for future energy smart grids. Eng. Appl. Artif. Intell. 2014, 32, 242–257. [Google Scholar] [CrossRef]
- Genesereth, M.R.; Ketchpel, S.P. Software agents. In Communications of the ACM; Bradshaw, J.M., Ed.; MIT Press: Cambridge, MA, USA, 1994; Chapter An Agent-b; Volume 37, pp. 48–53, 147. [Google Scholar]
- Man, D. Ontologies in Computer Science. Didact. Math. 2013, 31, 43–46. [Google Scholar]
- Santos, G.; Femandes, F.; Pinto, T.; Silva, M.; Abrishambaf, O.; Morais, H.; Vale, Z. House management system with real and virtual resources: Energy efficiency in residential microgrid. In Proceedings of the 2016 Global Information Infrastructure and Networking Symposium (GIIS), Porto, Portugal, 19–21 October 2016; pp. 1–6. [Google Scholar]
- Santos, G.; Pinto, T.; Vale, Z.; Praça, I.; Morais, H. Electricity markets ontology to support MASCEM’s simulations. In Communications in Computer and Information Science; Springer: Berlin, Germany, 2016; Volume 616, pp. 393–404. [Google Scholar]
- Hippolyte, J.L.; Howell, S.; Yuce, B.; Mourshed, M.; Sleiman, H.A.; Vinyals, M.; Vanhee, L. Ontology-based demand-side flexibility management in smart grids using a multi-agent system. In Proceedings of the 2016 IEEE International Smart Cities Conference (ISC2), Trento, Italy, 12–15 September 2016; pp. 1–7. [Google Scholar]
- Maffei, A.; Srinivasan, S.; Castillejo, P.; Martinez, J.F.; Iannelli, L.; Bjerkan, E.; Glielmo, L. A Semantic Middleware Supported Receding Horizon Optimal Power Flow in Energy Grids. IEEE Trans. Ind. Inform. 2017, 14, 35–46. [Google Scholar] [CrossRef]
- Alexopoulos, P.; Kafentzis, K.; Zoumas, C. Elmo: An Interoperability Ontology for the Electricity Market. In Proceedings of the International Conference on e-Business, Milan, Italy, 7–10 July 2009; pp. 15–20. [Google Scholar]
- FIPA. FIPA: The Foundation for Intelligent Physical Agents. 2017. Available online: http://www.fipa.org/ (accessed on 1 June 2017).
- Praça, I.; Ramos, C.; Vale, Z.; Cordeiro, M. Mascem: A Multiagent System that Simulates Competitive Electricity Markets. IEEE Intell. Syst. 2003, 18, 54–60. [Google Scholar] [CrossRef]
- Pinto, T.; Morais, H.; Sousa, T.; Sousa, T.M.; Vale, Z.; Praça, I.; Faia, R.; Pires, E.J.S. Adaptive Portfolio Optimization for Multiple Electricity Markets Participation. IEEE Trans. Neural Netw. Learn. Syst. 2016, 27, 1720–1733. [Google Scholar] [CrossRef] [PubMed]
- Teixeira, B.; Silva, F.; Pinto, T.; Santos, G.; Praça, I.; Vale, Z. TOOCC: Enabling Heterogeneous Systems Interoperability in the Study of Energy Systems. In Proceedings of the 2017 IEEE PES General Meeting, Chicago, IL, USA, 16–20 July 2017. [Google Scholar]
- MIBEL. MIBEL: The Iberian Electricity Market. 2017. Available online: http://www.mibel.com (accessed on 1 June 2017).
- EPEXSpot. EPEX SPOT: European Power Exchange. 2017. Available online: http://www.epexspot.com/en/ (accessed on 1 June 2017).
- NordPool. The Nord Pool Markets. 2017. Available online: http://www.nordpoolspot.com/ (accessed on 1 June 2017).
- Pinto, T.; Vale, Z.; Sousa, T.M.; Praça, I. Negotiation context analysis in electricity markets. Energy 2015, 85, 78–93. [Google Scholar] [CrossRef]
- Pinto, T.; Vale, Z.; Praça, I.; Pires, E.J.S.; Lopes, F. Decision support for energy contracts negotiation with game theory and adaptive learning. Energies 2015, 8, 9817–9842. [Google Scholar] [CrossRef]
- GECAD. GECAD’s Intelligent Energy Systems Ontologies. 2018. Available online: http://www.gecad.isep.ipp.pt/ontologies/ies/ (accessed on 15 January 2018).
- Silva, M.; Fernandes, F.; Morais, H.; Ramos, S.; Vale, Z. Hour-ahead energy resource management in university campus microgrid. In Proceedings of the 2015 IEEE Eindhoven PowerTech, Eindhoven, The Netherlands, 29 June–2 July 2015; pp. 1–6. [Google Scholar]
- Silva, M.; Morais, H.; Sousa, T.; Faria, P.; Vale, Z. Time-horizont distributed energy resources scheduling considering the integration of real-time pricing demand response. In Proceedings of the 2015 IEEE Eindhoven PowerTech, Eindhoven, The Netherlands, 29 June–2 July 2015; pp. 1–6. [Google Scholar]
- Fernandes, F.; Morais, H.; Vale, Z.; Ramos, C. Dynamic load management in a smart home to participate in demand response events. Energy Build. 2014, 82, 592–906. [Google Scholar] [CrossRef]
Figure 1.
Tools Control Center’s (TOOCC) general overview. MASCEM, Multi-Agent Simulator for Competitive Electricity Markets; AiD-EM, Adaptive Decision Support for Electricity Market Negotiation; IDeS, Intelligence and Decision Support multi-agent system; PLCMAS, Programmable Logic Controller Multi-Agent System.
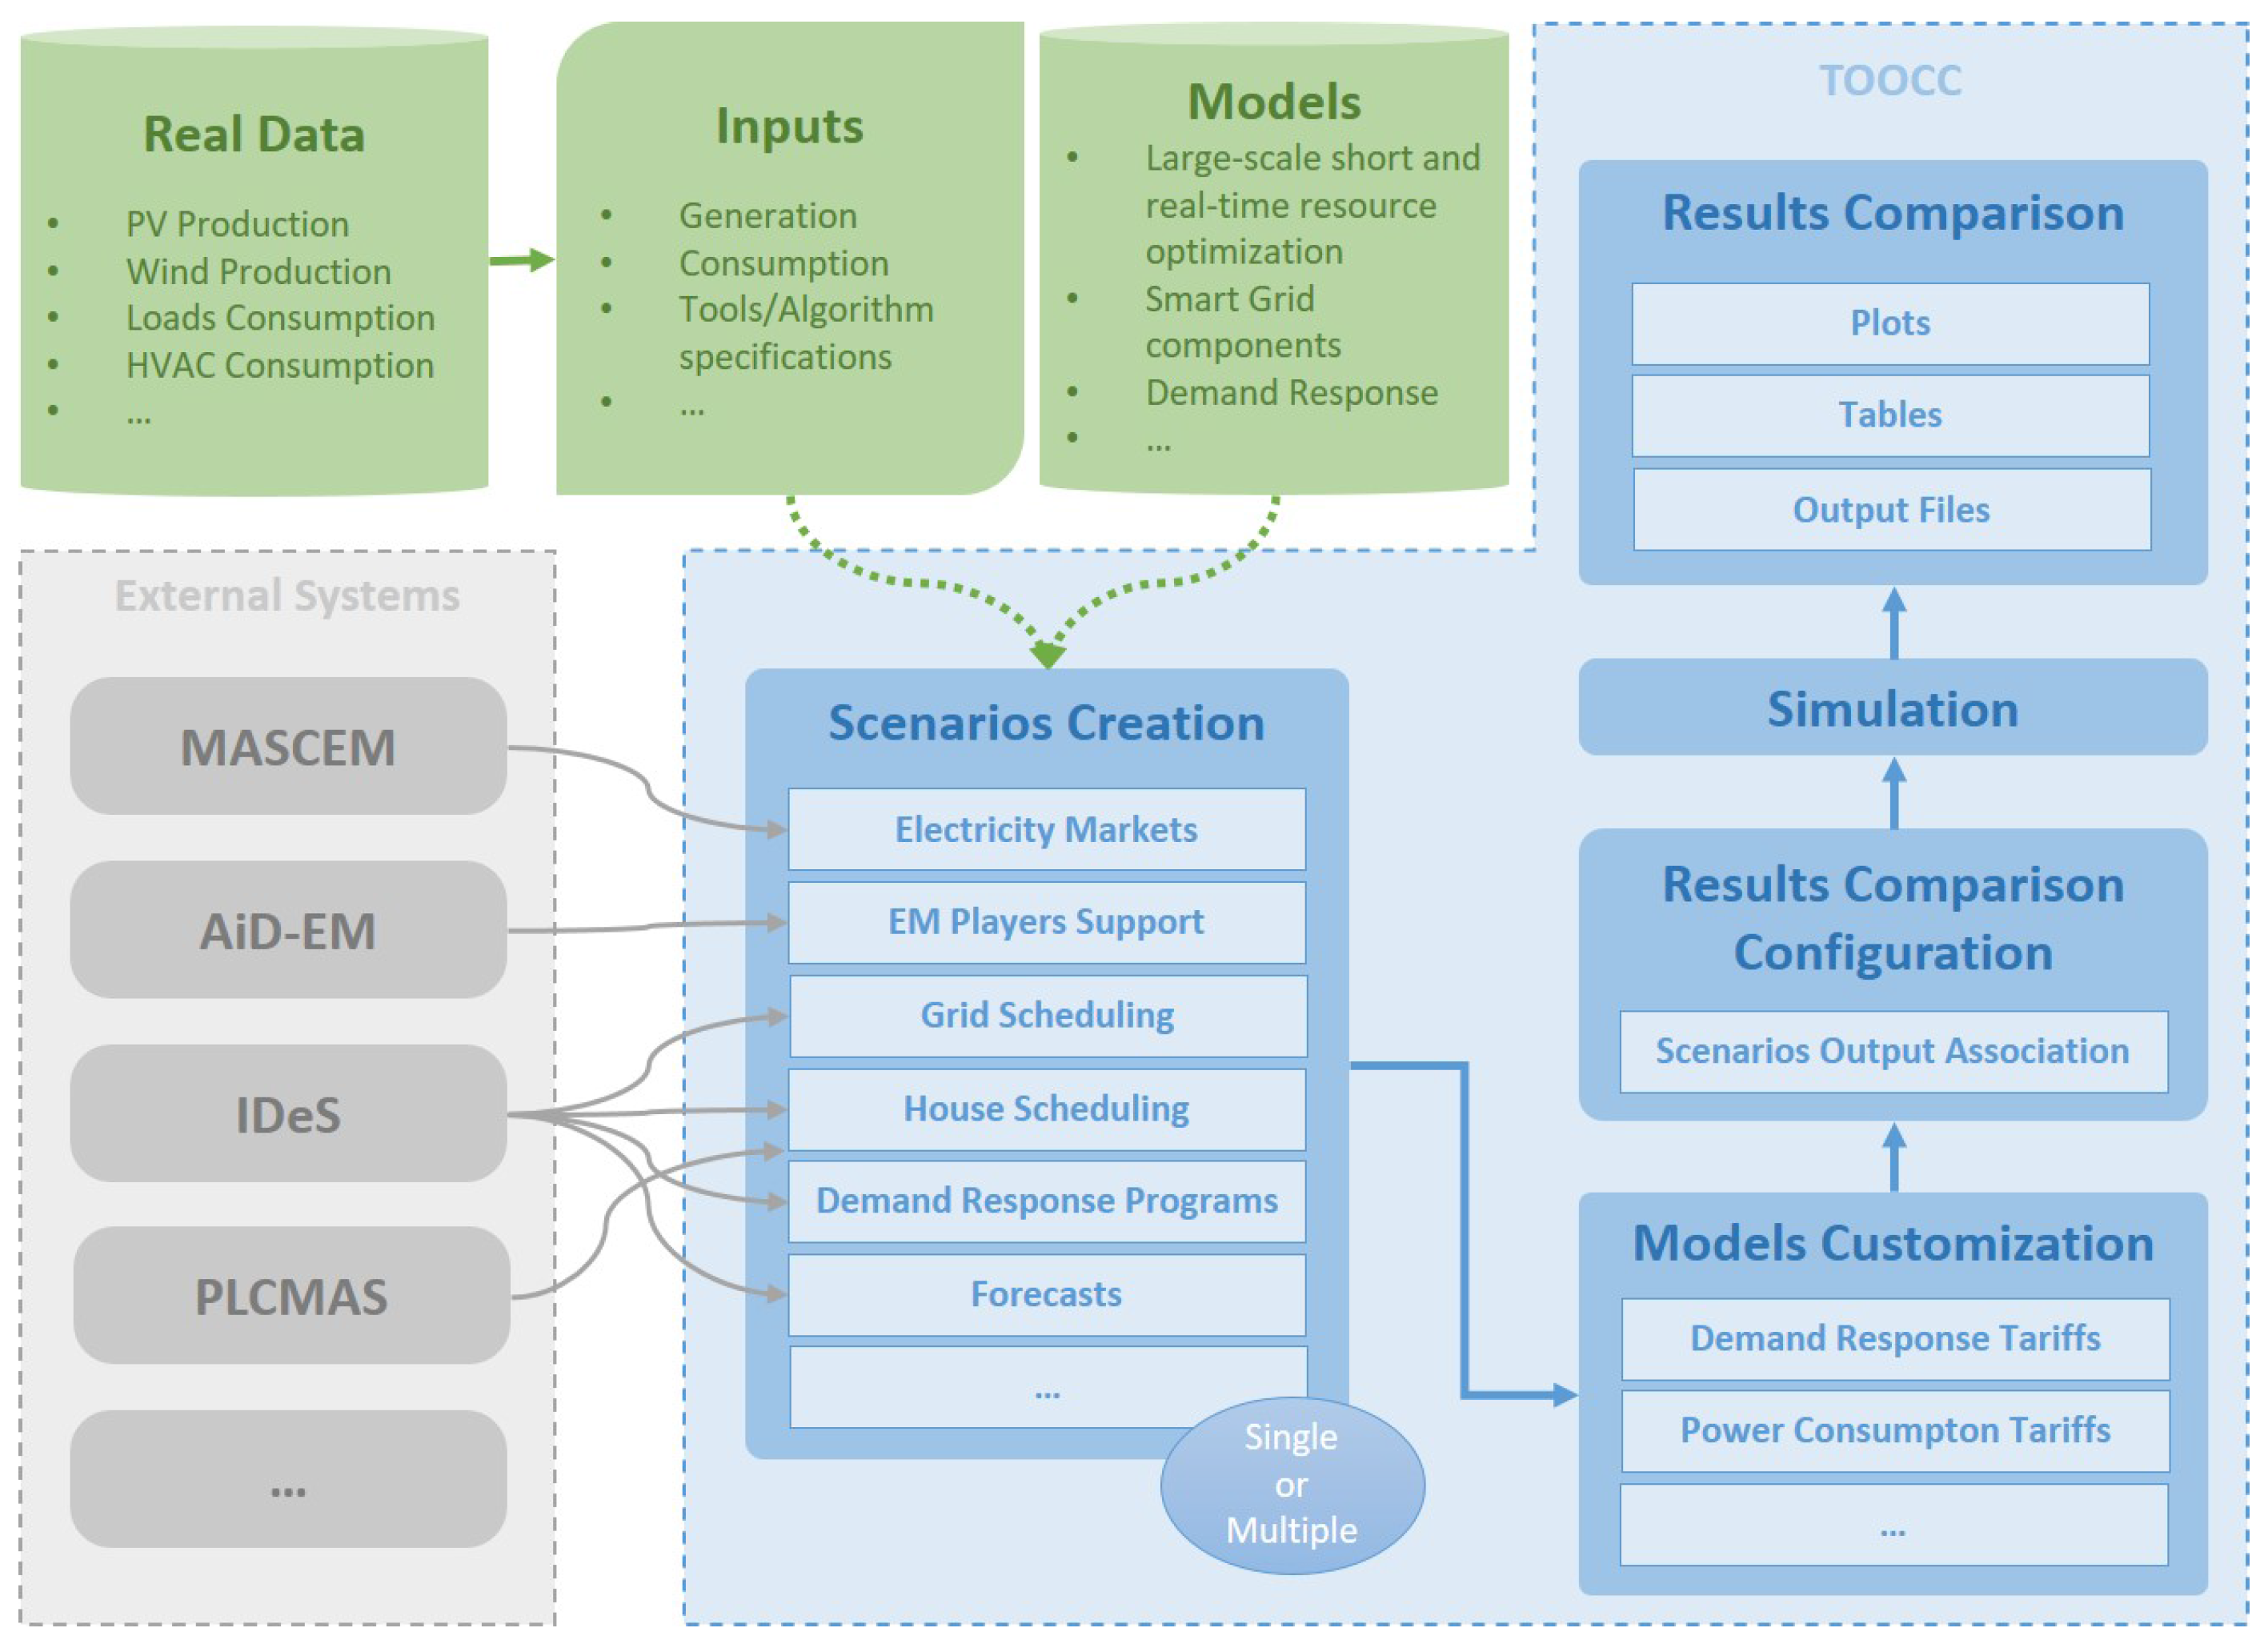
Figure 2.
TOOCC’s multi-agent perspective. SHIM, SCADA House Intelligent Management.
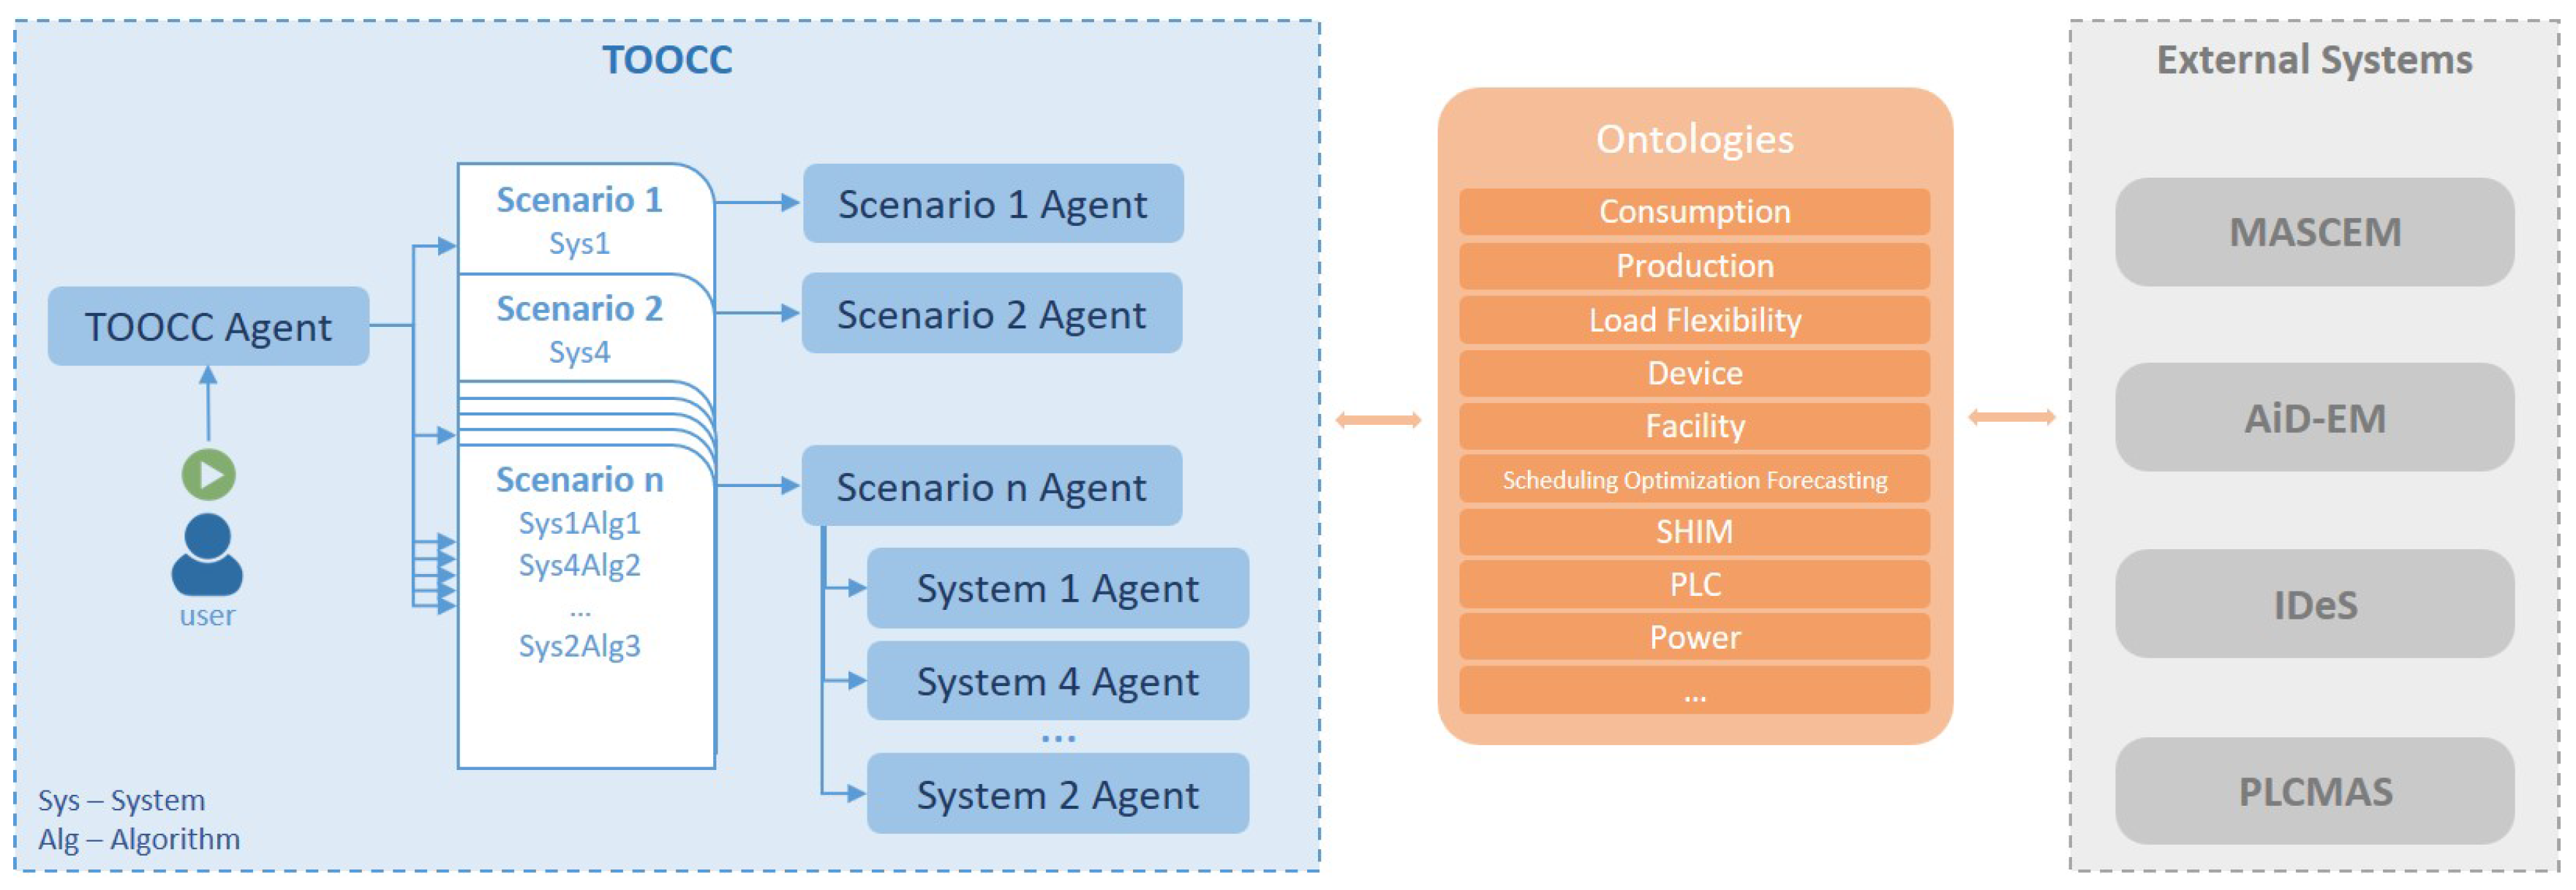
Figure 3.
Case study Low Voltage distribution network. Image adapted from [70].
Figure 3.
Case study Low Voltage distribution network. Image adapted from [70].

Figure 4.
Simulated house composition.

Figure 5.
Simplified sequence diagram of TOOCC’s interaction with external systems. ERM, Energy Resources Management system.
Figure 5.
Simplified sequence diagram of TOOCC’s interaction with external systems. ERM, Energy Resources Management system.

Figure 6.
Power demand and distributed generation forecast, for each hour of the day.

Figure 7.
Real-time scheduling results for generation: (a) full overview; (b) production distribution.
Figure 7.
Real-time scheduling results for generation: (a) full overview; (b) production distribution.

Figure 8.
Real-time scheduling results for consumption: (a) full overview; (b) consumption distribution.
Figure 8.
Real-time scheduling results for consumption: (a) full overview; (b) consumption distribution.

Figure 9.
Aggregator scheduling result for the emulated smart home.

Figure 10.
GECAD’s smart home energy scheduling results.

© 2018 by the authors. Licensee MDPI, Basel, Switzerland. This article is an open access article distributed under the terms and conditions of the Creative Commons Attribution (CC BY) license (http://creativecommons.org/licenses/by/4.0/).
Share and Cite
MDPI and ACS Style
Teixeira, B.; Pinto, T.; Silva, F.; Santos, G.; Praça, I.; Vale, Z. Multi-Agent Decision Support Tool to Enable Interoperability among Heterogeneous Energy Systems. Appl. Sci. 2018, 8, 328. https://doi.org/10.3390/app8030328
AMA Style
Teixeira B, Pinto T, Silva F, Santos G, Praça I, Vale Z. Multi-Agent Decision Support Tool to Enable Interoperability among Heterogeneous Energy Systems. Applied Sciences. 2018; 8(3):328. https://doi.org/10.3390/app8030328
Chicago/Turabian StyleTeixeira, Brígida, Tiago Pinto, Francisco Silva, Gabriel Santos, Isabel Praça, and Zita Vale. 2018. "Multi-Agent Decision Support Tool to Enable Interoperability among Heterogeneous Energy Systems" Applied Sciences 8, no. 3: 328. https://doi.org/10.3390/app8030328
Note that from the first issue of 2016, this journal uses article numbers instead of page numbers. See further details here.