Article

Effective Biopotential Signal Acquisition: Comparison of Different Shielded Drive Technologies

1
CAS Key Laboratory of Human-Machine Intelligence-Synergy Systems, Shenzhen Institutes of Advanced Technology, Chinese Academy of Sciences, Shenzhen 518055, China
2
Shenzhen College of Advanced Technology, University of Chinese Academy of Sciences, Shenzhen 518055, China
3
Institute of Pharmacy and Bioengineering, Chongqing University of Technology, Chongqing 400054, China
4
The Third Affiliated Hospital of Sun Yat-Sen University, Guangzhou 510630, China
5
Southern University of Science and Technology, Shenzhen 518055, China
6
Department of Anatomy, School of Medicine, Shandong University, Jinan 250100, China
*
Authors to whom correspondence should be addressed.
Appl. Sci. 2018, 8(2), 276; https://doi.org/10.3390/app8020276
Submission received: 15 November 2017 / Revised: 26 January 2018 / Accepted: 6 February 2018 / Published: 12 February 2018
(This article belongs to the Special Issue Bio-Inspired Robotics)

Abstract

:
Biopotential signals are mainly characterized by low amplitude and thus often distorted by extraneous interferences, such as power line interference in the recording environment and movement artifacts during the acquisition process. With the presence of such large-amplitude interferences, subsequent processing and analysis of the acquired signals becomes quite a challenging task that has been reported by many previous studies. A number of software-based filtering techniques have been proposed, with most of them being able to minimize the interferences but at the expense of distorting the useful components of the target signal. Therefore, this study proposes a hardware-based method that utilizes a shielded drive circuit to eliminate extraneous interferences on biopotential signal recordings, while also preserving all useful components of the target signal. The performance of the proposed method was evaluated by comparing the results with conventional hardware and software filtering methods in three different biopotential signal recording experiments (electrocardiogram (ECG), electro-oculogram (EOG), and electromyography (EMG)) on an ADS1299EEG-FE platform. The results showed that the proposed method could effectively suppress power line interference as well as its harmonic components, and it could also significantly eliminate the influence of unwanted electrode lead jitter interference. Findings from this study suggest that the proposed method may provide potential insight into high quality acquisition of different biopotential signals to greatly ease subsequent processing in various biomedical applications.

1. Introduction

As important indicators of various physiological parameters of the human body, biopotential signals can directly reflect the physical condition as well as the health status of an individual [1]. With the increase in demand for technologically driven medical devices and the advancements in neuroscience, cognitive psychology, and artificial intelligence research, biopotential signals are being increasingly applied to real-time health monitoring, disease diagnoses, control rehabilitation devices, and brain–computer interfaces among others [2,3]. Generally, biopotential signals such as electrocardiogram (ECG), electromyography (EMG), electroencephalography (EEG), and electro-oculogram (EOG) are characterized by high impedance, low frequency, low amplitude, and strong background noise [4,5]. For instance, the amplitude and frequency of an ECG signal typically lie within the range of 0.05–4 mV and 0.05–150 Hz, respectively [6]; the EMG signal has an amplitude that is relatively weaker, in the range of 0.1–2 mV, and a frequency in the range of 0–500 Hz [7,8]; and the EOG signal’s amplitude is in the range of 0.4–10 mV with a spectrum in the range of 0.1–38 Hz [9].
When a biopotential signal is recorded, the target/output of the recordings is almost completely submerged by the background noise/interference inherent in the recordings because the signal is often characterized by low amplitude [10]. Thus, such noise/interference is majorly classified into three categories as follows: Firstly, power line interference, which is composed of a 50 Hz or 60 Hz frequency and its harmonics, commonly defined as the electromagnetic noise produced from the power supply circuitry and electronic equipment [11]. Secondly, movement artifacts caused by poor contact between the electrodes and the surface of an individual’s skin [12], or as a result of movement of the wires/cables between the electrodes and the amplifier [13]. Thirdly, physiological artifacts in the form of other signal(s) recorded alongside the originally desired biopotential signals [14,15].
To date, several methods have been proposed to eliminate the above-described interferences/noises from a biopotential signal of interest. To that end, most of the methods focused on improving hardware circuitry and using software filtering techniques [16,17,18]. There are many commonly applied hardware-based methods for minimizing the interferences inherent in biopotential signal recordings, such as twisting input leads together to reduce the area of the loop formed by the wires [19], or making the acquisition devices dependent on batteries (direct current) for their power supply [20]. Adopting a high common-mode rejection ratio amplifier, a driven-right-leg circuit, active electrodes, and isolation can further suppress interferences [21,22,23]. The conventional hardware-based methods are limited since they can only reduce the extraneous interferences to a certain extent. Furthermore, Chimeno et al. proposed an interference model that considers interference directly coupled to the measuring electrodes and adds an internal interference arising from the amplifier’s power supply [19]. Their study suggested that internal interference from the power supply can affect any measuring instrument with either differential or single-ended input. While the model mainly focused on the case of using analog amplifiers powered by power line transformers, battery-supplied biopotential recording systems did not suffer from such problems with power-supply interference.
In addition, shielded technology is also one of the commonly used hardware methods to suppress power line interference. The most popular shielded technology is the use of a small coax cable, where the outer layer is connected to a certain type of driven signal to prevent the inner wire signal from being contaminated by extraneous interferences. Alnasser showed that unshielded electrodes account for most power line interference, and electrode shielding, together with driven-right-leg, is quite effective in reducing that interference [24]. Sudirman et al. proposed a method that utilized a faraday shield in which the subjects were required to be in a faraday metal cage to eliminate 50 Hz power line interference in an ECG signal, whereby the whole size of the cage must be significantly smaller than the wavelength of the noises [25]. Lee et al. developed a flexible active electrode that contained a shielding metal plate with guarding feedback to protect the ECG signals from extraneous noises [26]. Sullivan et al. used a shielding layer on printed circuit board and implemented a non-contact sensor to record clear EEG and ECG signals [27]. With so many shielded technologies coexisting, it is necessary to compare the performance of different shielding methods so that a general guideline can be established when selecting shielded technologies; it would be best to propose an improved method that could be used reliably to achieve effective biopotential acquisition in clinical or academic practices.
On the other hand, various software-based filtering techniques have also been utilized to minimize the power line noise/interference inherent in biopotential signal recordings [28]. The most common approach is to use a digital notch filter at the power line frequency (50 Hz/60 Hz), which could be easily implemented with low computational cost [29,30]. However, there are often cases when the power line interference contains not only the 50 Hz/60 Hz component but also multiple harmonic components, as well as other interferences caused by the instability of the power supply system [31,32,33]. Hence, filter banks with notch frequencies located at the fundamental and harmonic components of power line interference were also employed [34]. However, such filter banks would cause information loss of target signals since the frequency range largely overlaps for the biopotential signals and power line interference [35]. Hence, a number of improved filtering techniques have been proposed over the years to minimize interferences in biopotential recordings [36,37,38,39,40]. For instance, Tomasini et al. used an adaptive power line interference filter to estimate the fundamental frequency and harmonics of power line interference, and the estimated interference was subtracted from the noise-affected biosignal [22]. Keshtkaran et al. presented a scalable very-large-scale integration architecture of a robust algorithm for power line interference cancelation in multichannel biopotential recordings [23], and they also proposed an adaptive notch filter to estimate the contents of power line interference with a modified recursive least squares algorithm [41]. Although these filtering technologies showed great performance and robustness, the real time computation load is still high for low-power embedded systems, especially when the sampling frequency is high. Therefore, instead of removing the interferences from the contaminated signal using digital filtering, a robust solution to prevent power line interference from contaminating the biopotential signal during the recording stage would be preferred for long-term healthcare monitoring applications.
During biopotential signal acquisition, device movements, wire jitter, or subject involuntary twitching are inevitable, thus affecting the quality of the recorded signals. The standard and commonly applied method for eliminating interferences resulting from electrode lead jitter is to apply high-pass filtering to the recorded signals [42]. This is the case because the frequencies of the signals are usually very low, and the high-pass filter will cut off the frequencies of interest containing useful information in the desired signal. With regards to thechallenges posed by extraneous interferences in biopotential signal recording, the existing hardware-based methods have limited effect while the traditional software filtering techniques inevitably render the target signal distorted after reducing the interferences. If such interferences can be prevented from mixing up with the desired signal before the raw signal gets into the acquisition device, a quality raw signal could be obtained, thus making the subsequent signal processing and analysis tasks accurate and easier.
The current study proposes an improved hardware-based shielded technology aimed at effectively attenuating the interferences associated with biopotential signal recordings. The proposed technology attempts to resolve the adverse effects of the distributed resistance and capacitance of shielded cables by introducing a shielded signal to suppress resulting interferences as much as possible, and also to prevent the target signal from being distorted. Subsequently, three different methods for the proposed shielded technology were built and applied individually to ECG, EOG, and EMG recordings obtained in our laboratory. The experimental results showed that the proposed method can effectively suppress power line interference, and also shield the target signal. Furthermore, by recording the EMG signal in a shielded room, it was verified that the proposed hardware-based shielded drive circuit can also eliminate electrode lead jitter interference.

2. Methods

2.1. Subjects

Twenty healthy subjects including 12 males and 8 females were recruited, and all participated in the biopotential signal acquisition experiments designed for the current study. The mean age of the subjects was 26.3 years with an age range of 21–31. Prior to the data acquisition experiments, each participant was carefully examined to be sure that they had no impairment with respect to their heart function (for quality ECG signal), eyelid function (for proper EOG recordings), and limb muscle function (for a normal EMG signal). Additionally, the subjects were adequately informed about the objective as well as the purpose of the study, after which they all gave written informed consent and provided permission for the publication of their data. The experimental protocols were approved by the Institutional Review Board of the Shenzhen Institutes of Advanced Technology, Chinese Academy of Sciences (SIAT-IRB-130124-H0015).

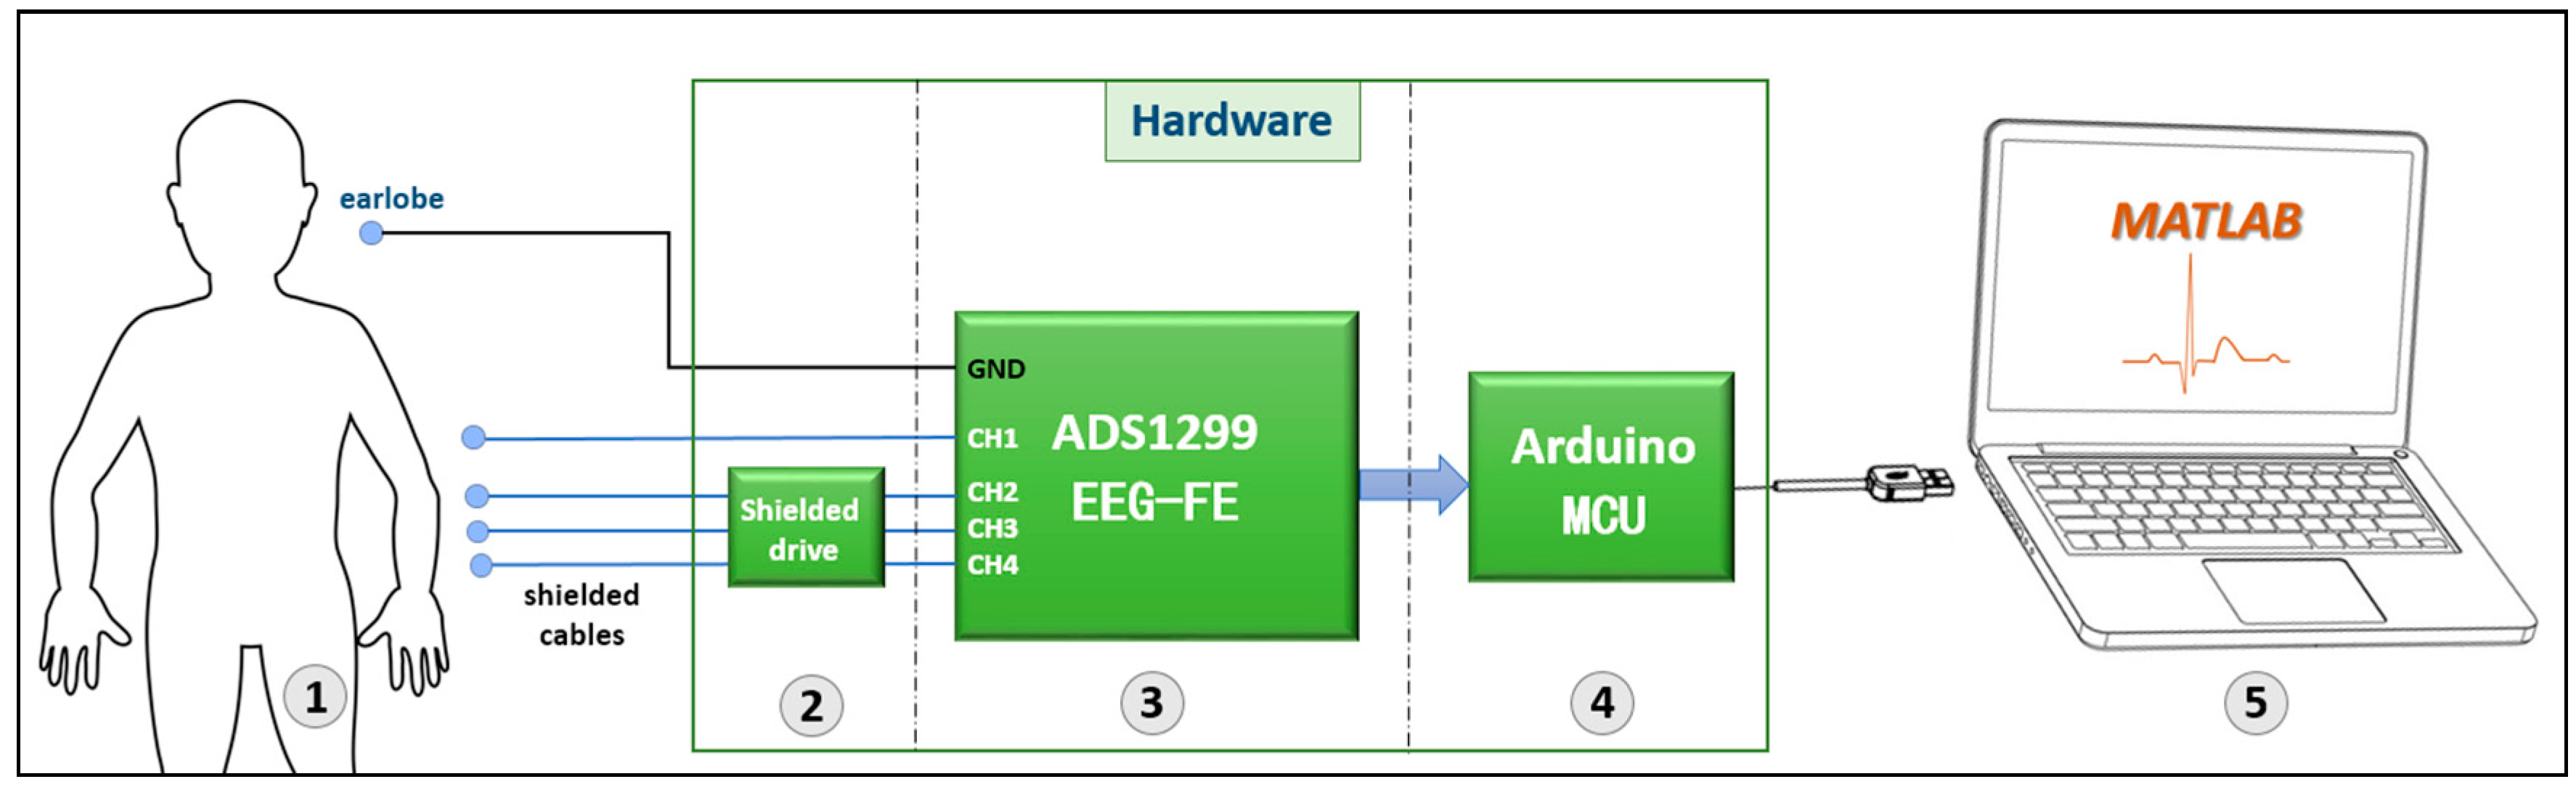
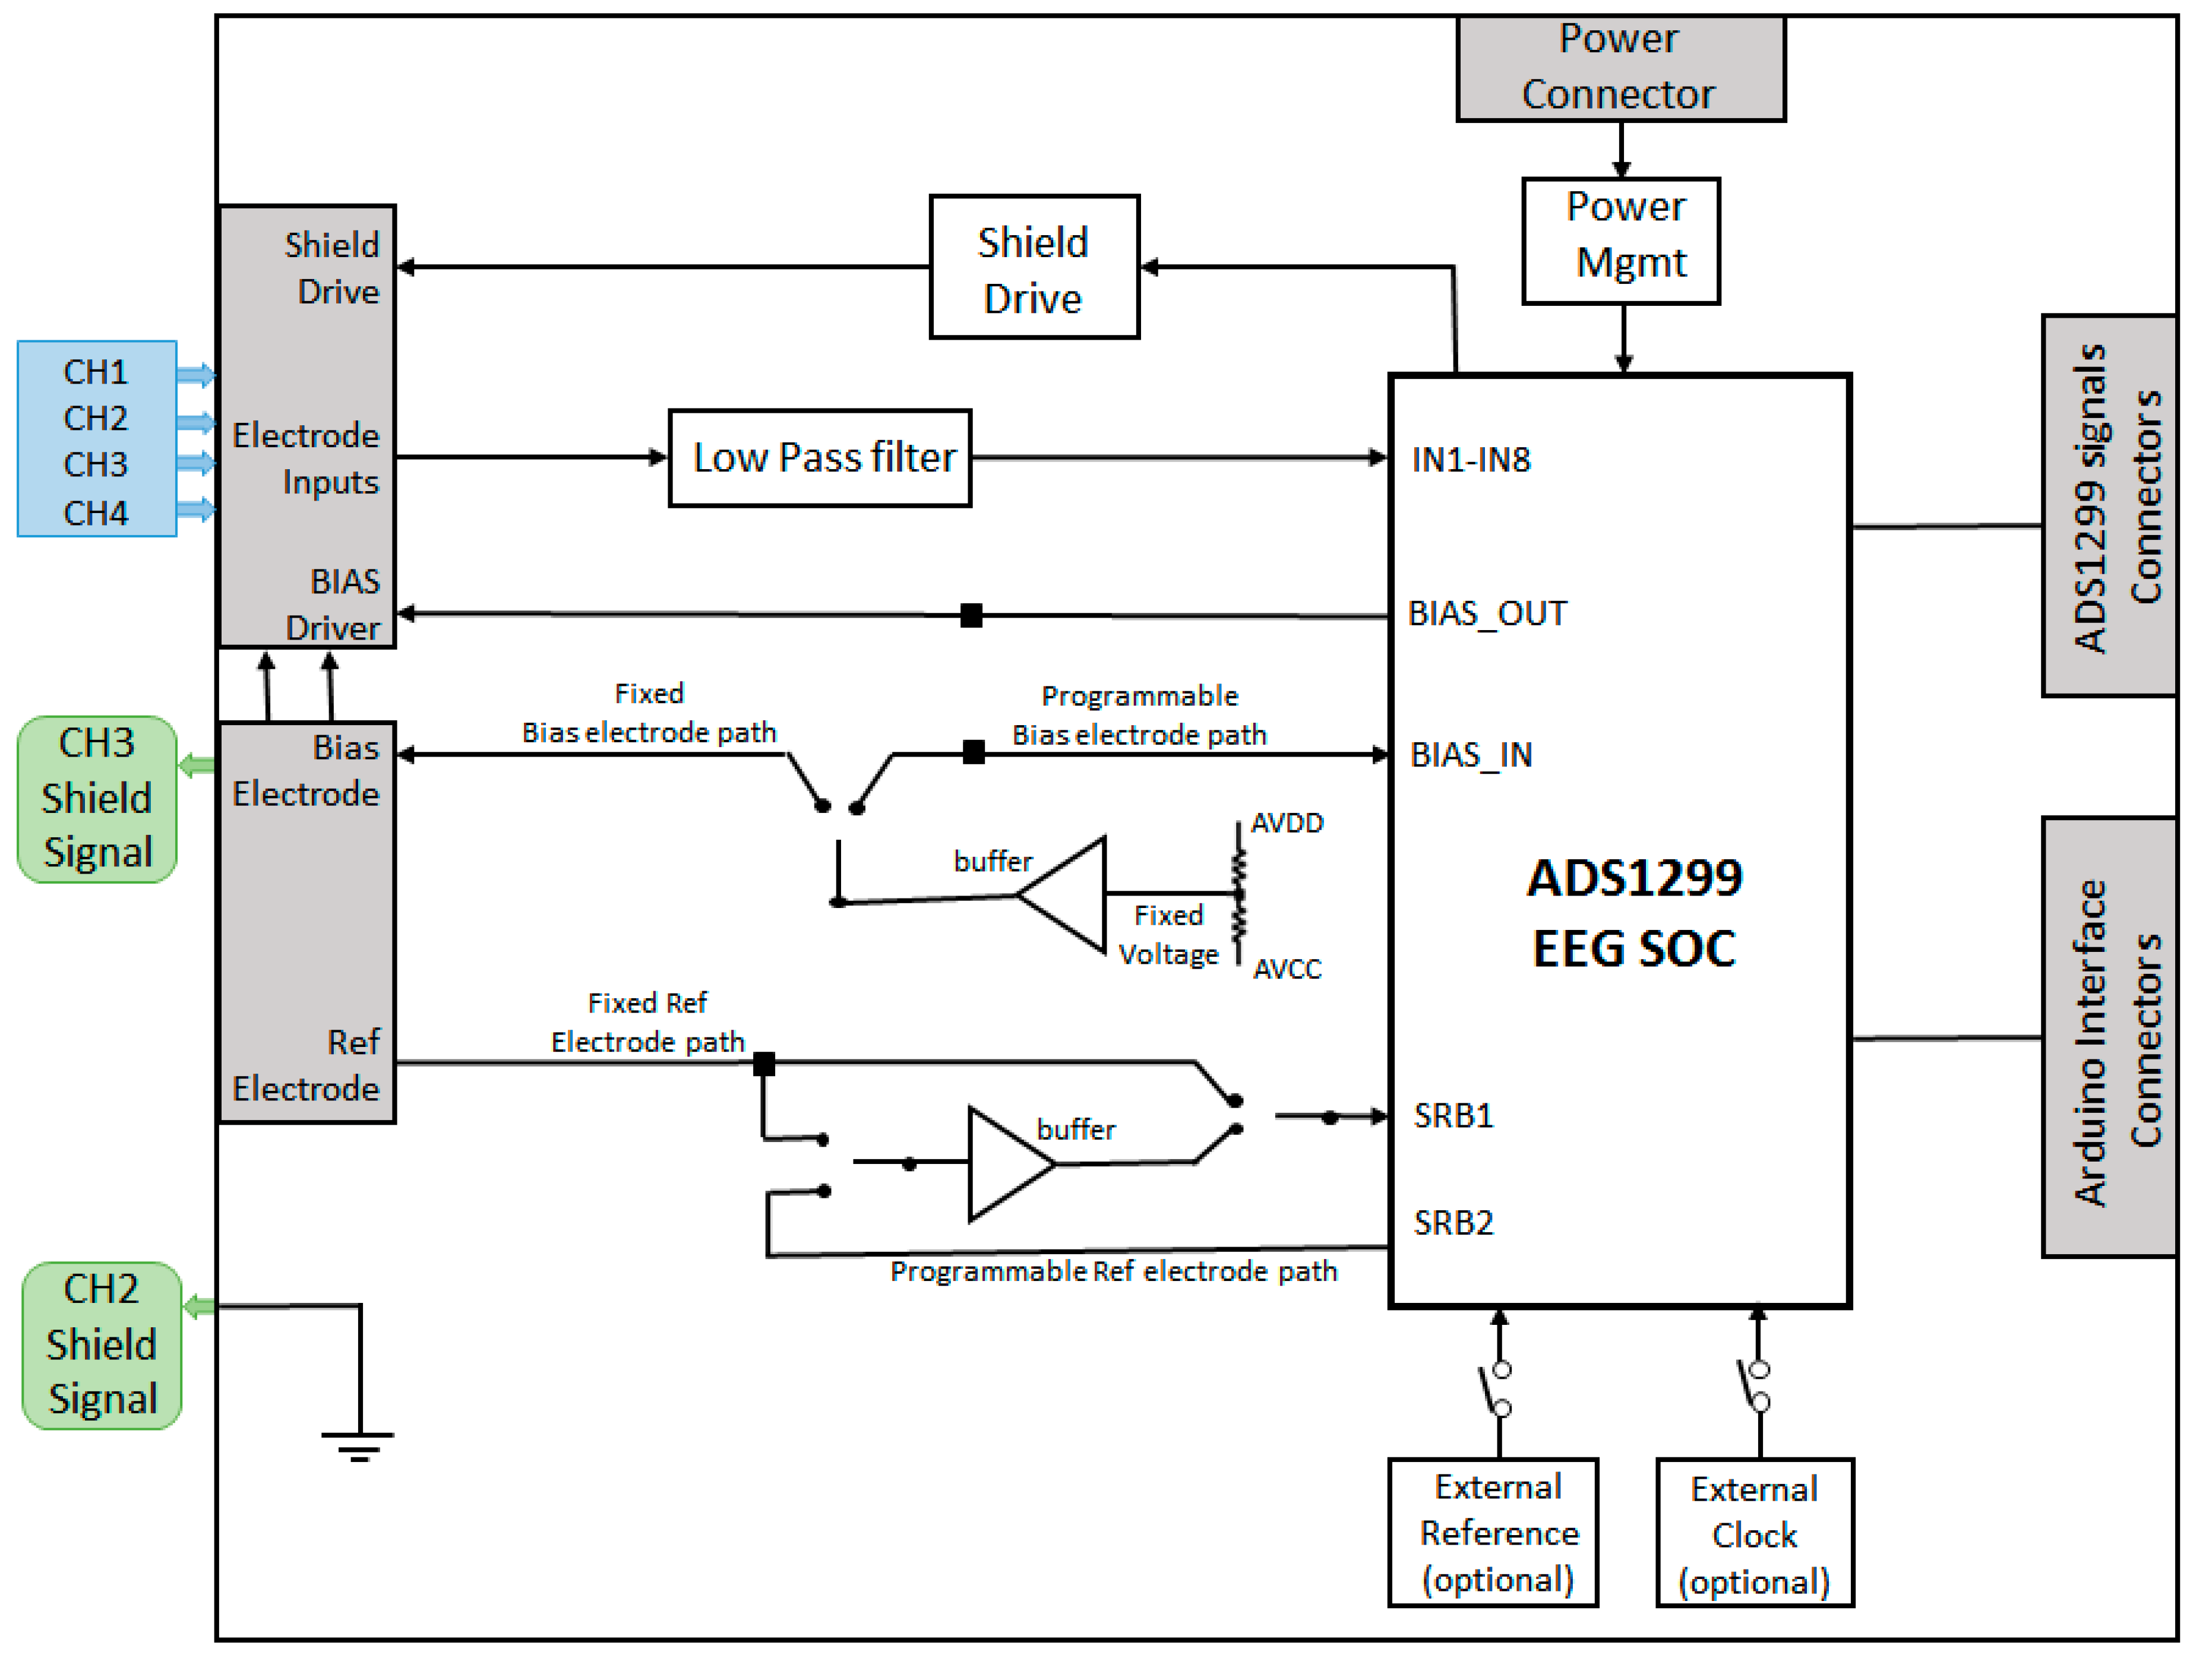
2.2. Equipment Setup and Signal Recording

In this study, the ADS1299EEG-FE kit of Texas Instruments (Dallas, Texas, United States) was used as the biopotential signal collection device and was connected to an Arduino microcontroller. The ADS1299EEG-FE demonstration kit has obvious advantages in the collection of biopotential signals such as eight channels of low-noise synchronous EEG recording (which can collect multiple signals simultaneously); a 24-bit high resolution analog to digital converter (ADC), −110 dB common-mode rejection ratio, and very low internal noise (which ensures the accuracy of biopotential signal detection); a 1–24 times adjustable programmable gain amplifier (PGA), which meets the needs of different occasions; a single channel 16 kHz sampling rate (which ensures that the biopotential signals bandwidth is sufficient); and an integrated driven-right-leg circuit (which further reduces environmental interference) [43]. In addition, its flexible connection with the Arduino microcontroller (Arduino is an electronic product development platform based on the microcontroller systems) ensures the development and integration of hardware and software components [44].
As shown in Figure 1, the three previously described biopotential signals (ECG, EOG, and EMG) were collected by the aid of electrodes attached to the subject’s ( ) skin through the shielded cables into the ADS1299EEG-FE hardware ( ), then the recorded signals went through the Arduino microcontroller ( ) via a USB interface to the laptop ( ), and finally the waveforms and spectra components of the collected signals were analyzed using the MATLAB programming tool. Additionally, shielded cables were used as electrode leads, so as to protect the signal in the core from extraneous interferences.
The recorded signals were sampled at the rate of 2000 Hz and subsequently amplified 24 times. To compare the effects of the hardware-based shielded drive technology with the software-based method, this study also designed a 3-order Butterworth software notch filter with a bandwidth of 6 Hz and an attenuation of 120 dB at the 50 Hz center frequency. The software filter was applied to the raw data of Method 1 (No-Shield), and the performance was evaluated by comparing the time waveforms and spectra of the biopotential signals with different hardware-shielded methods.

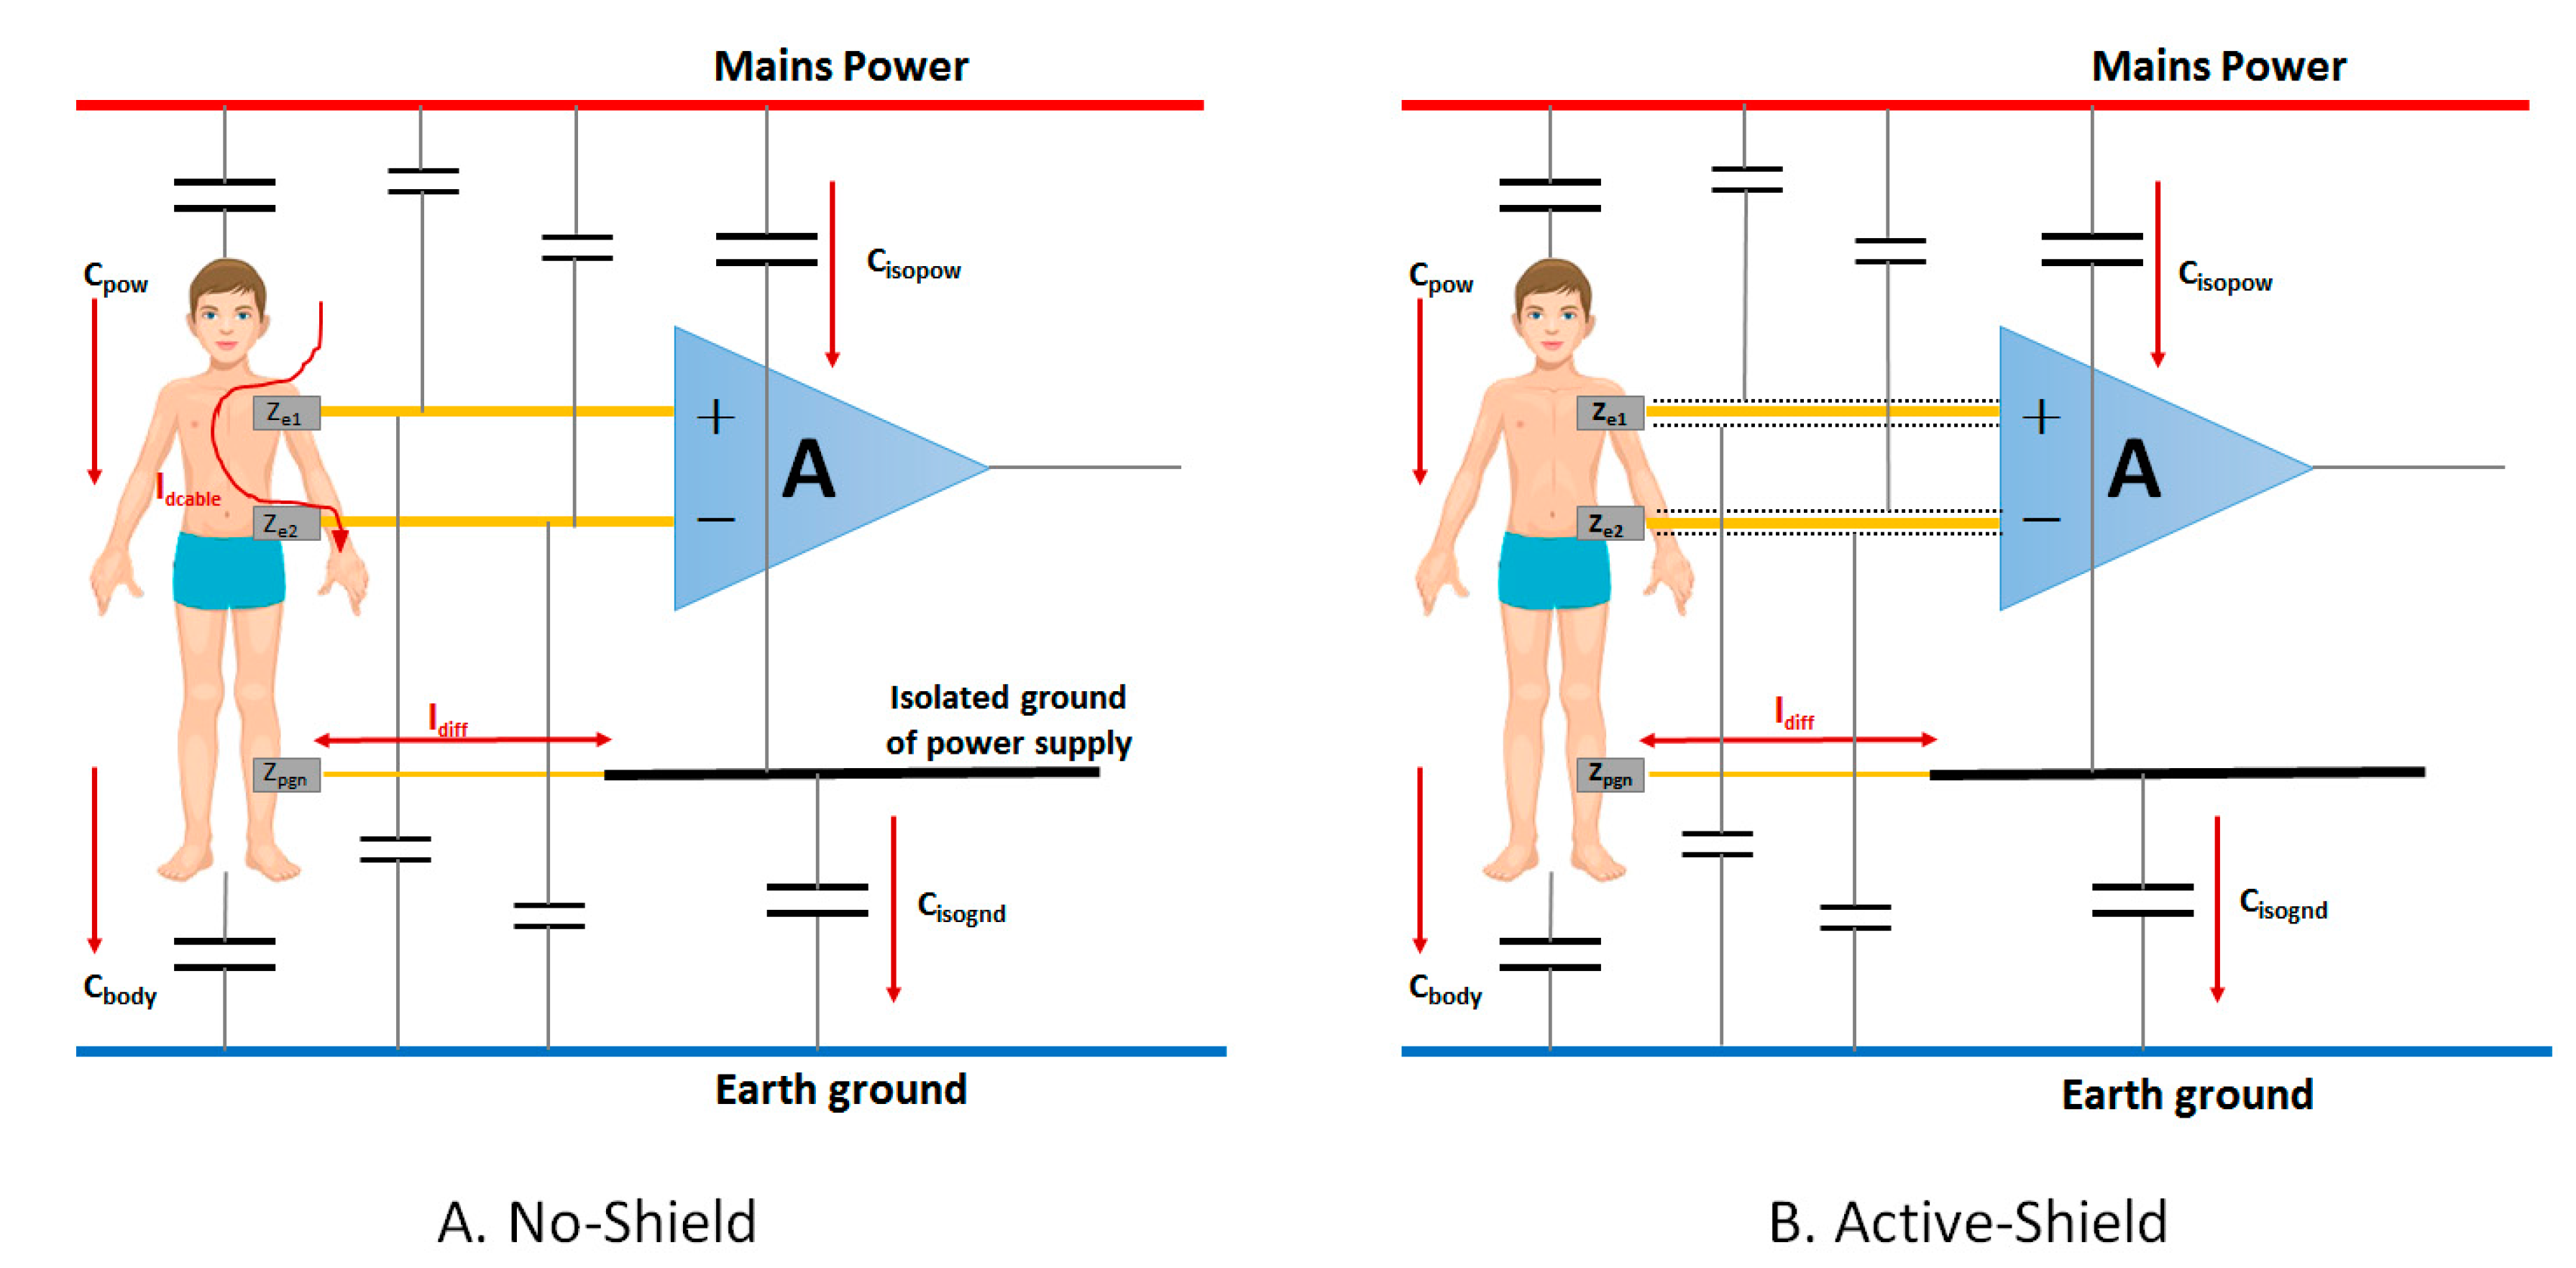
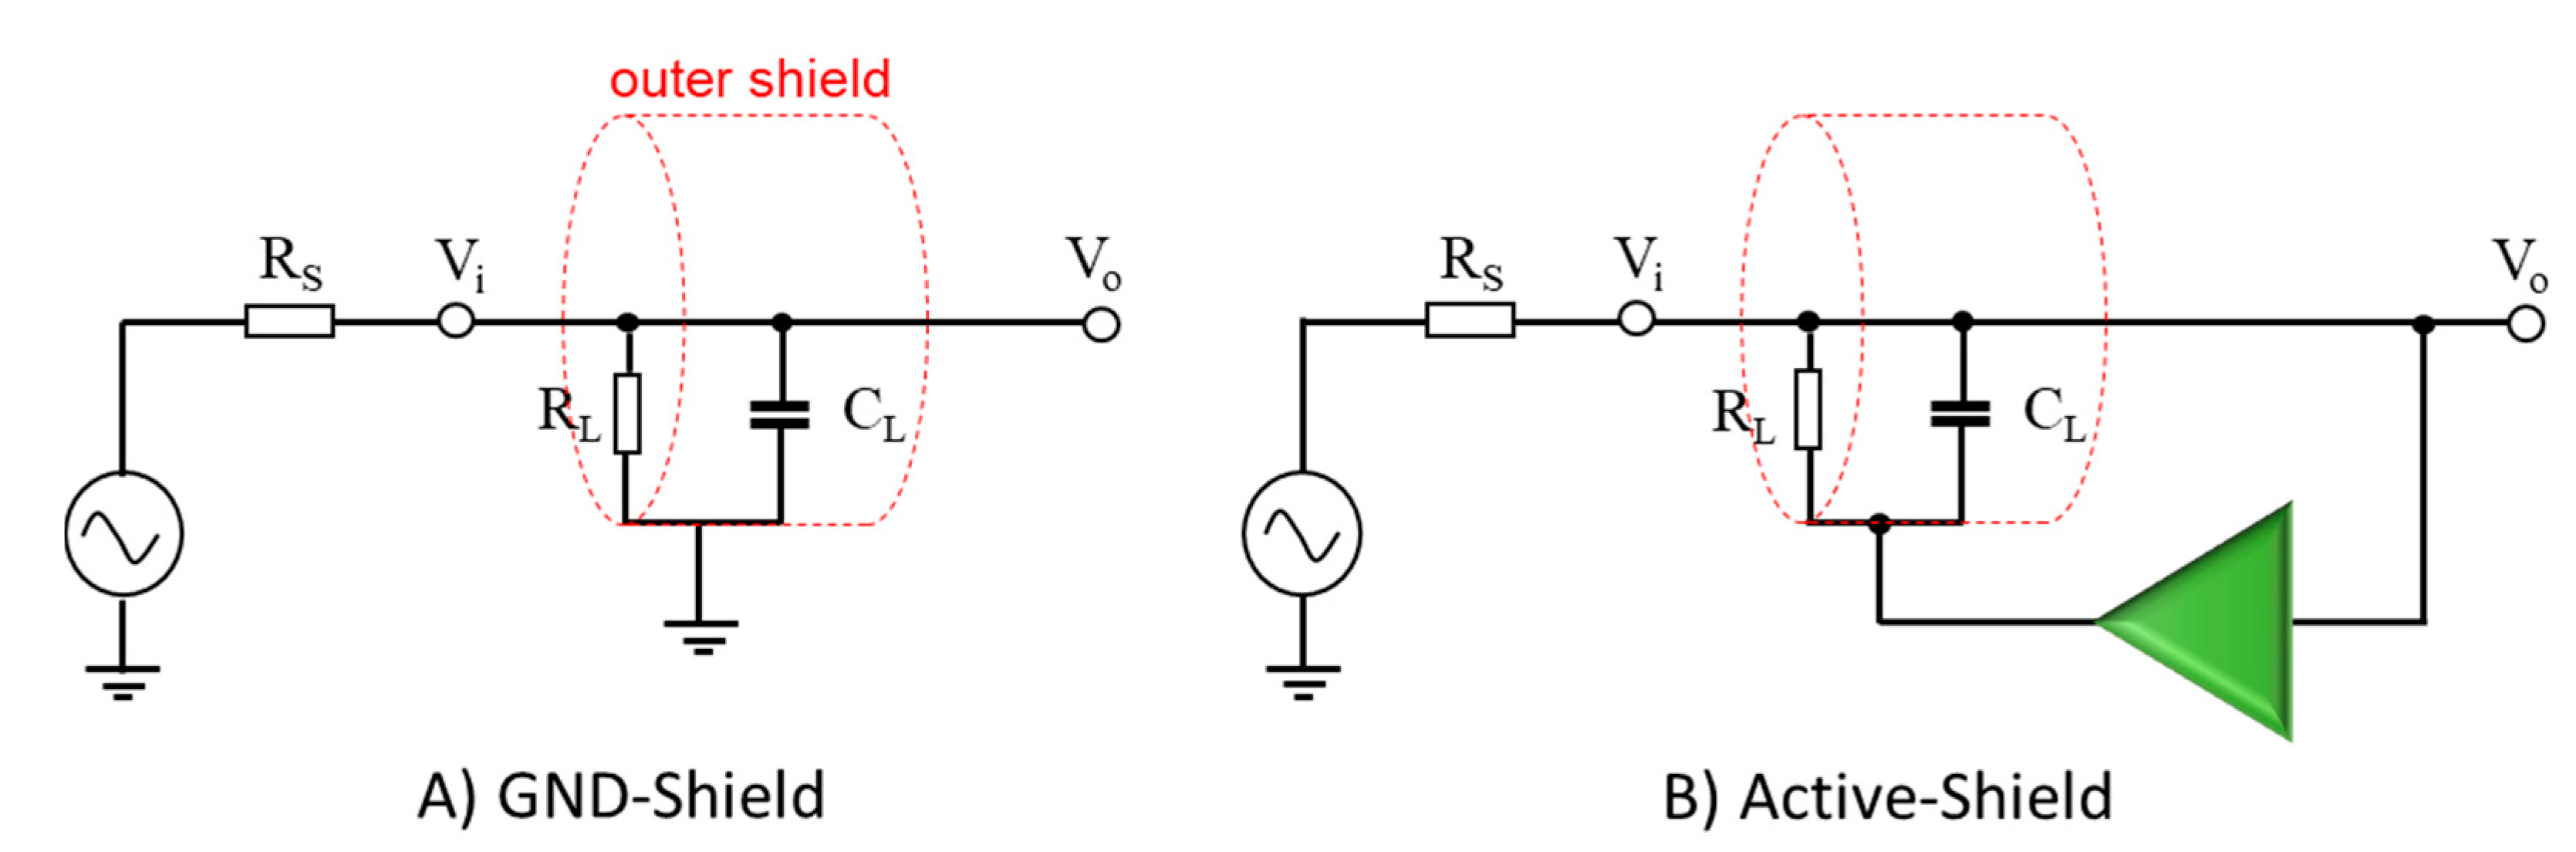
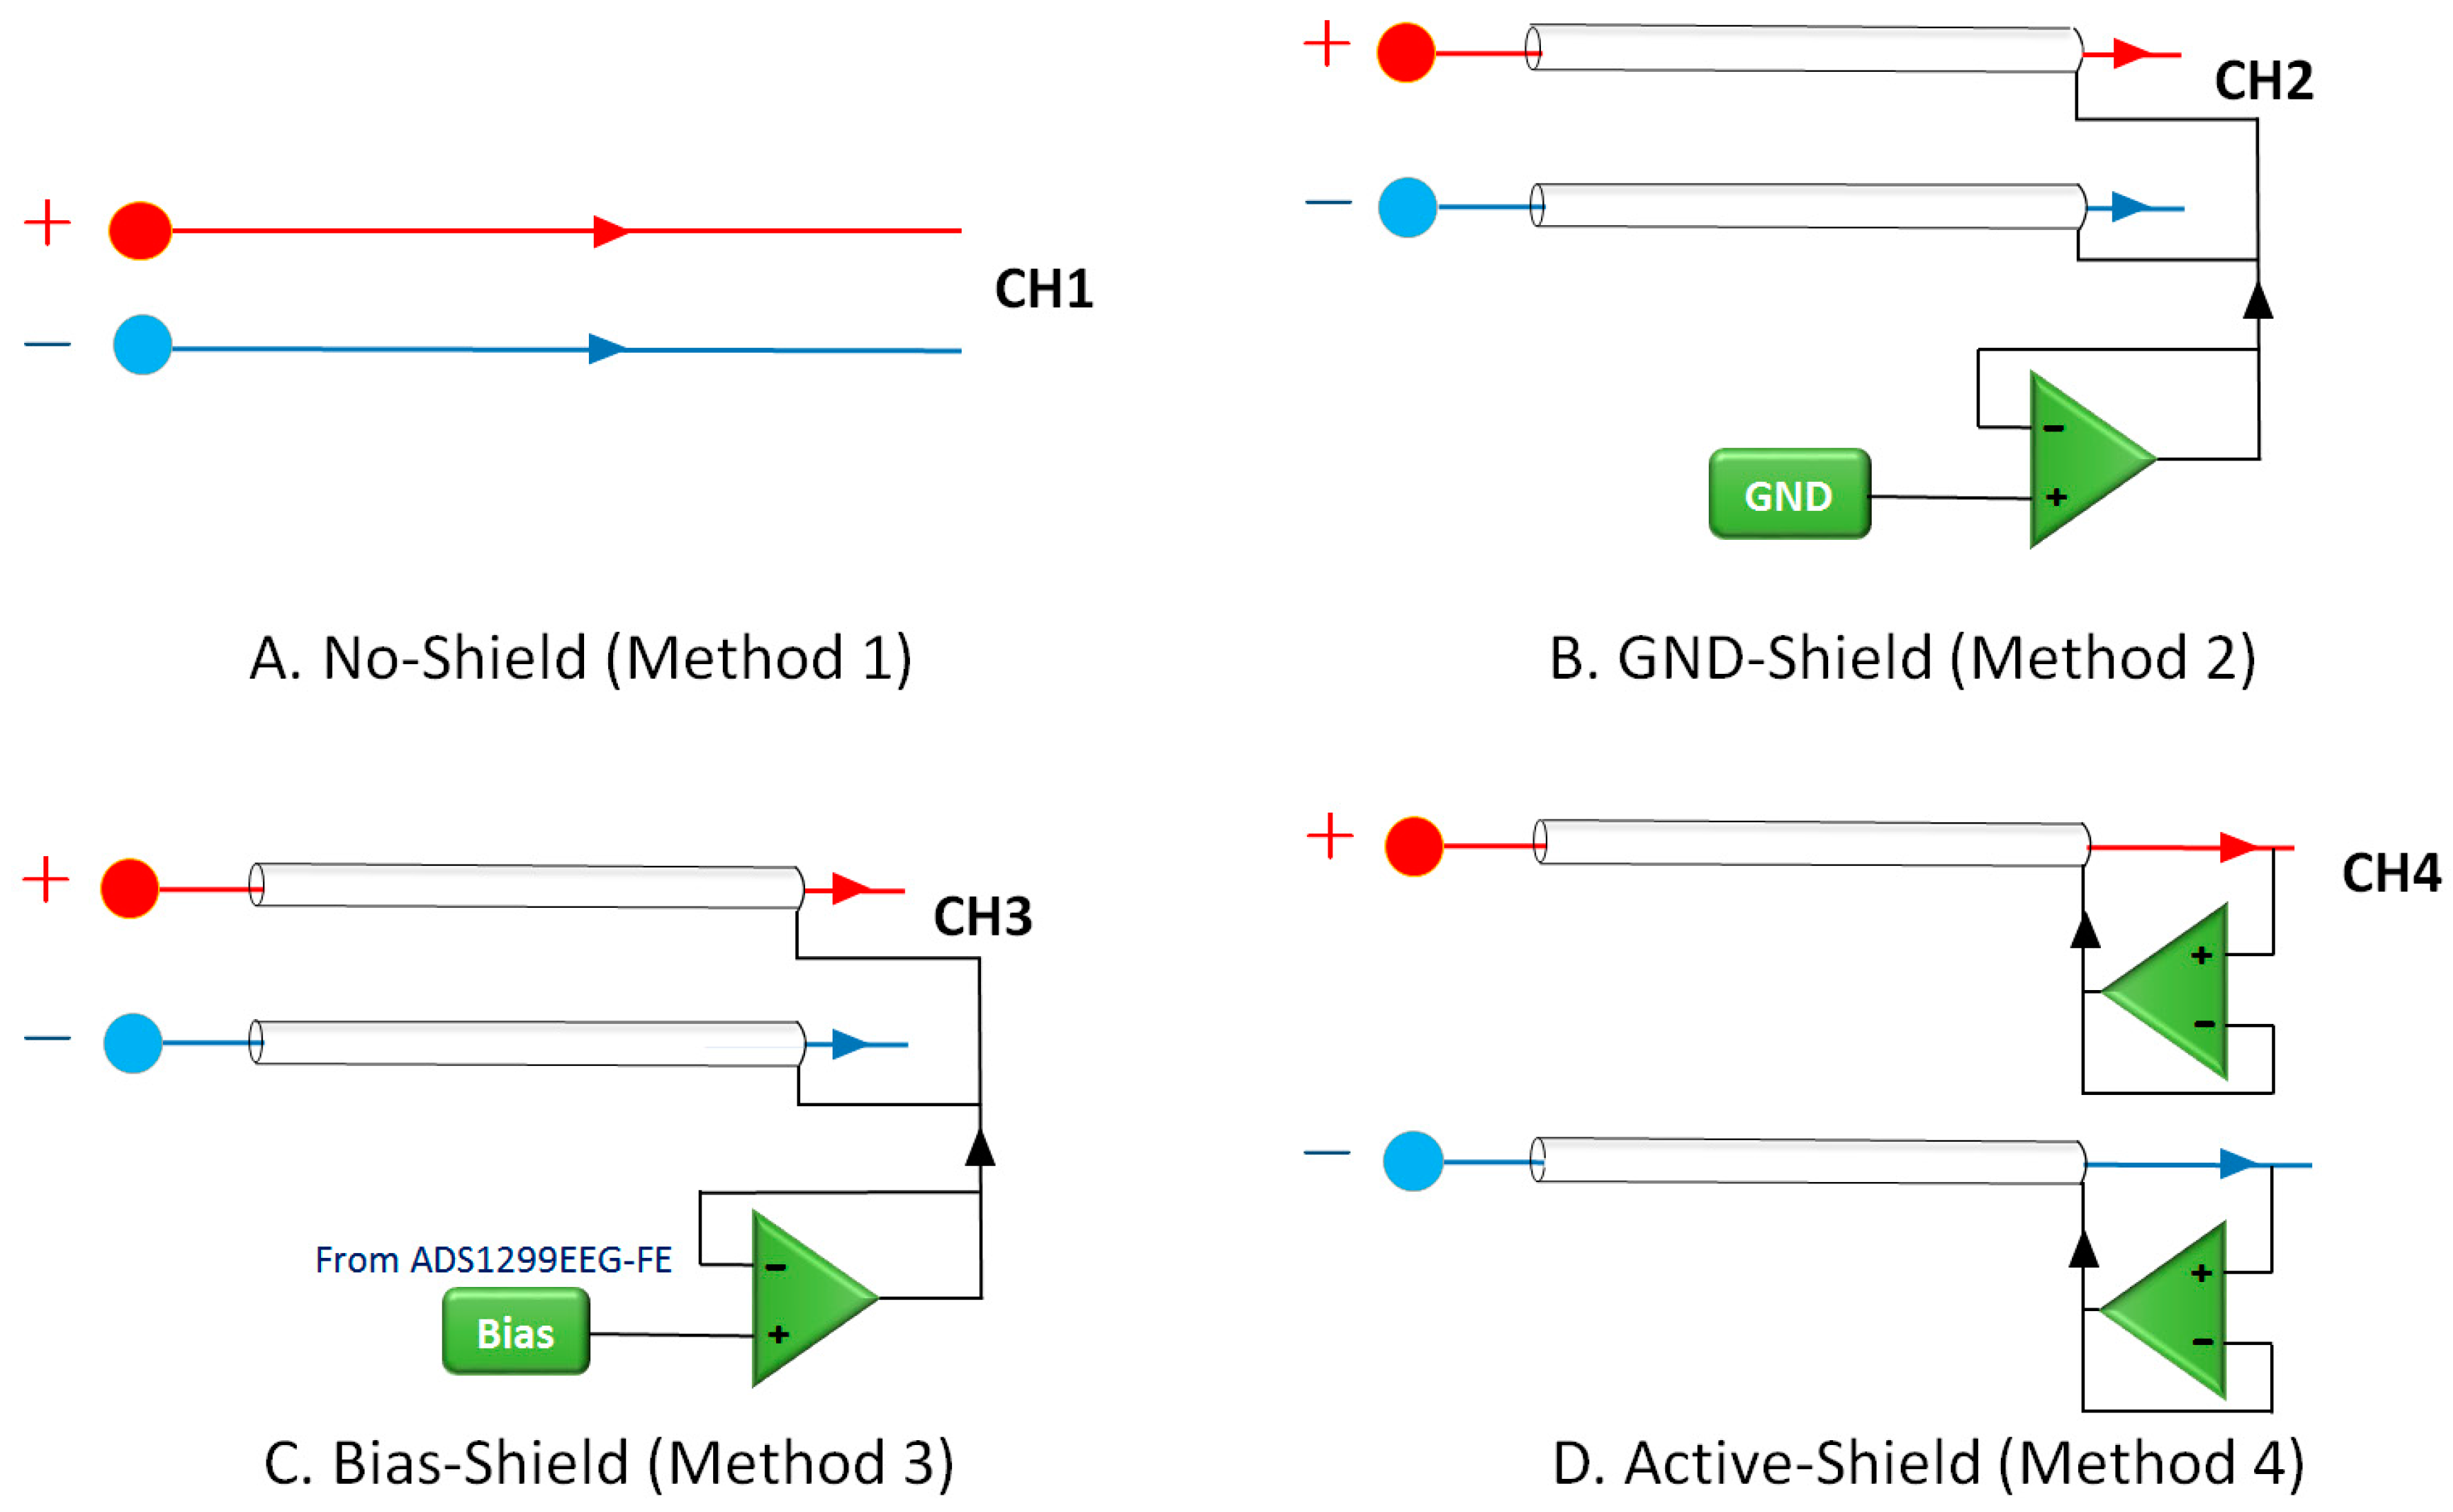
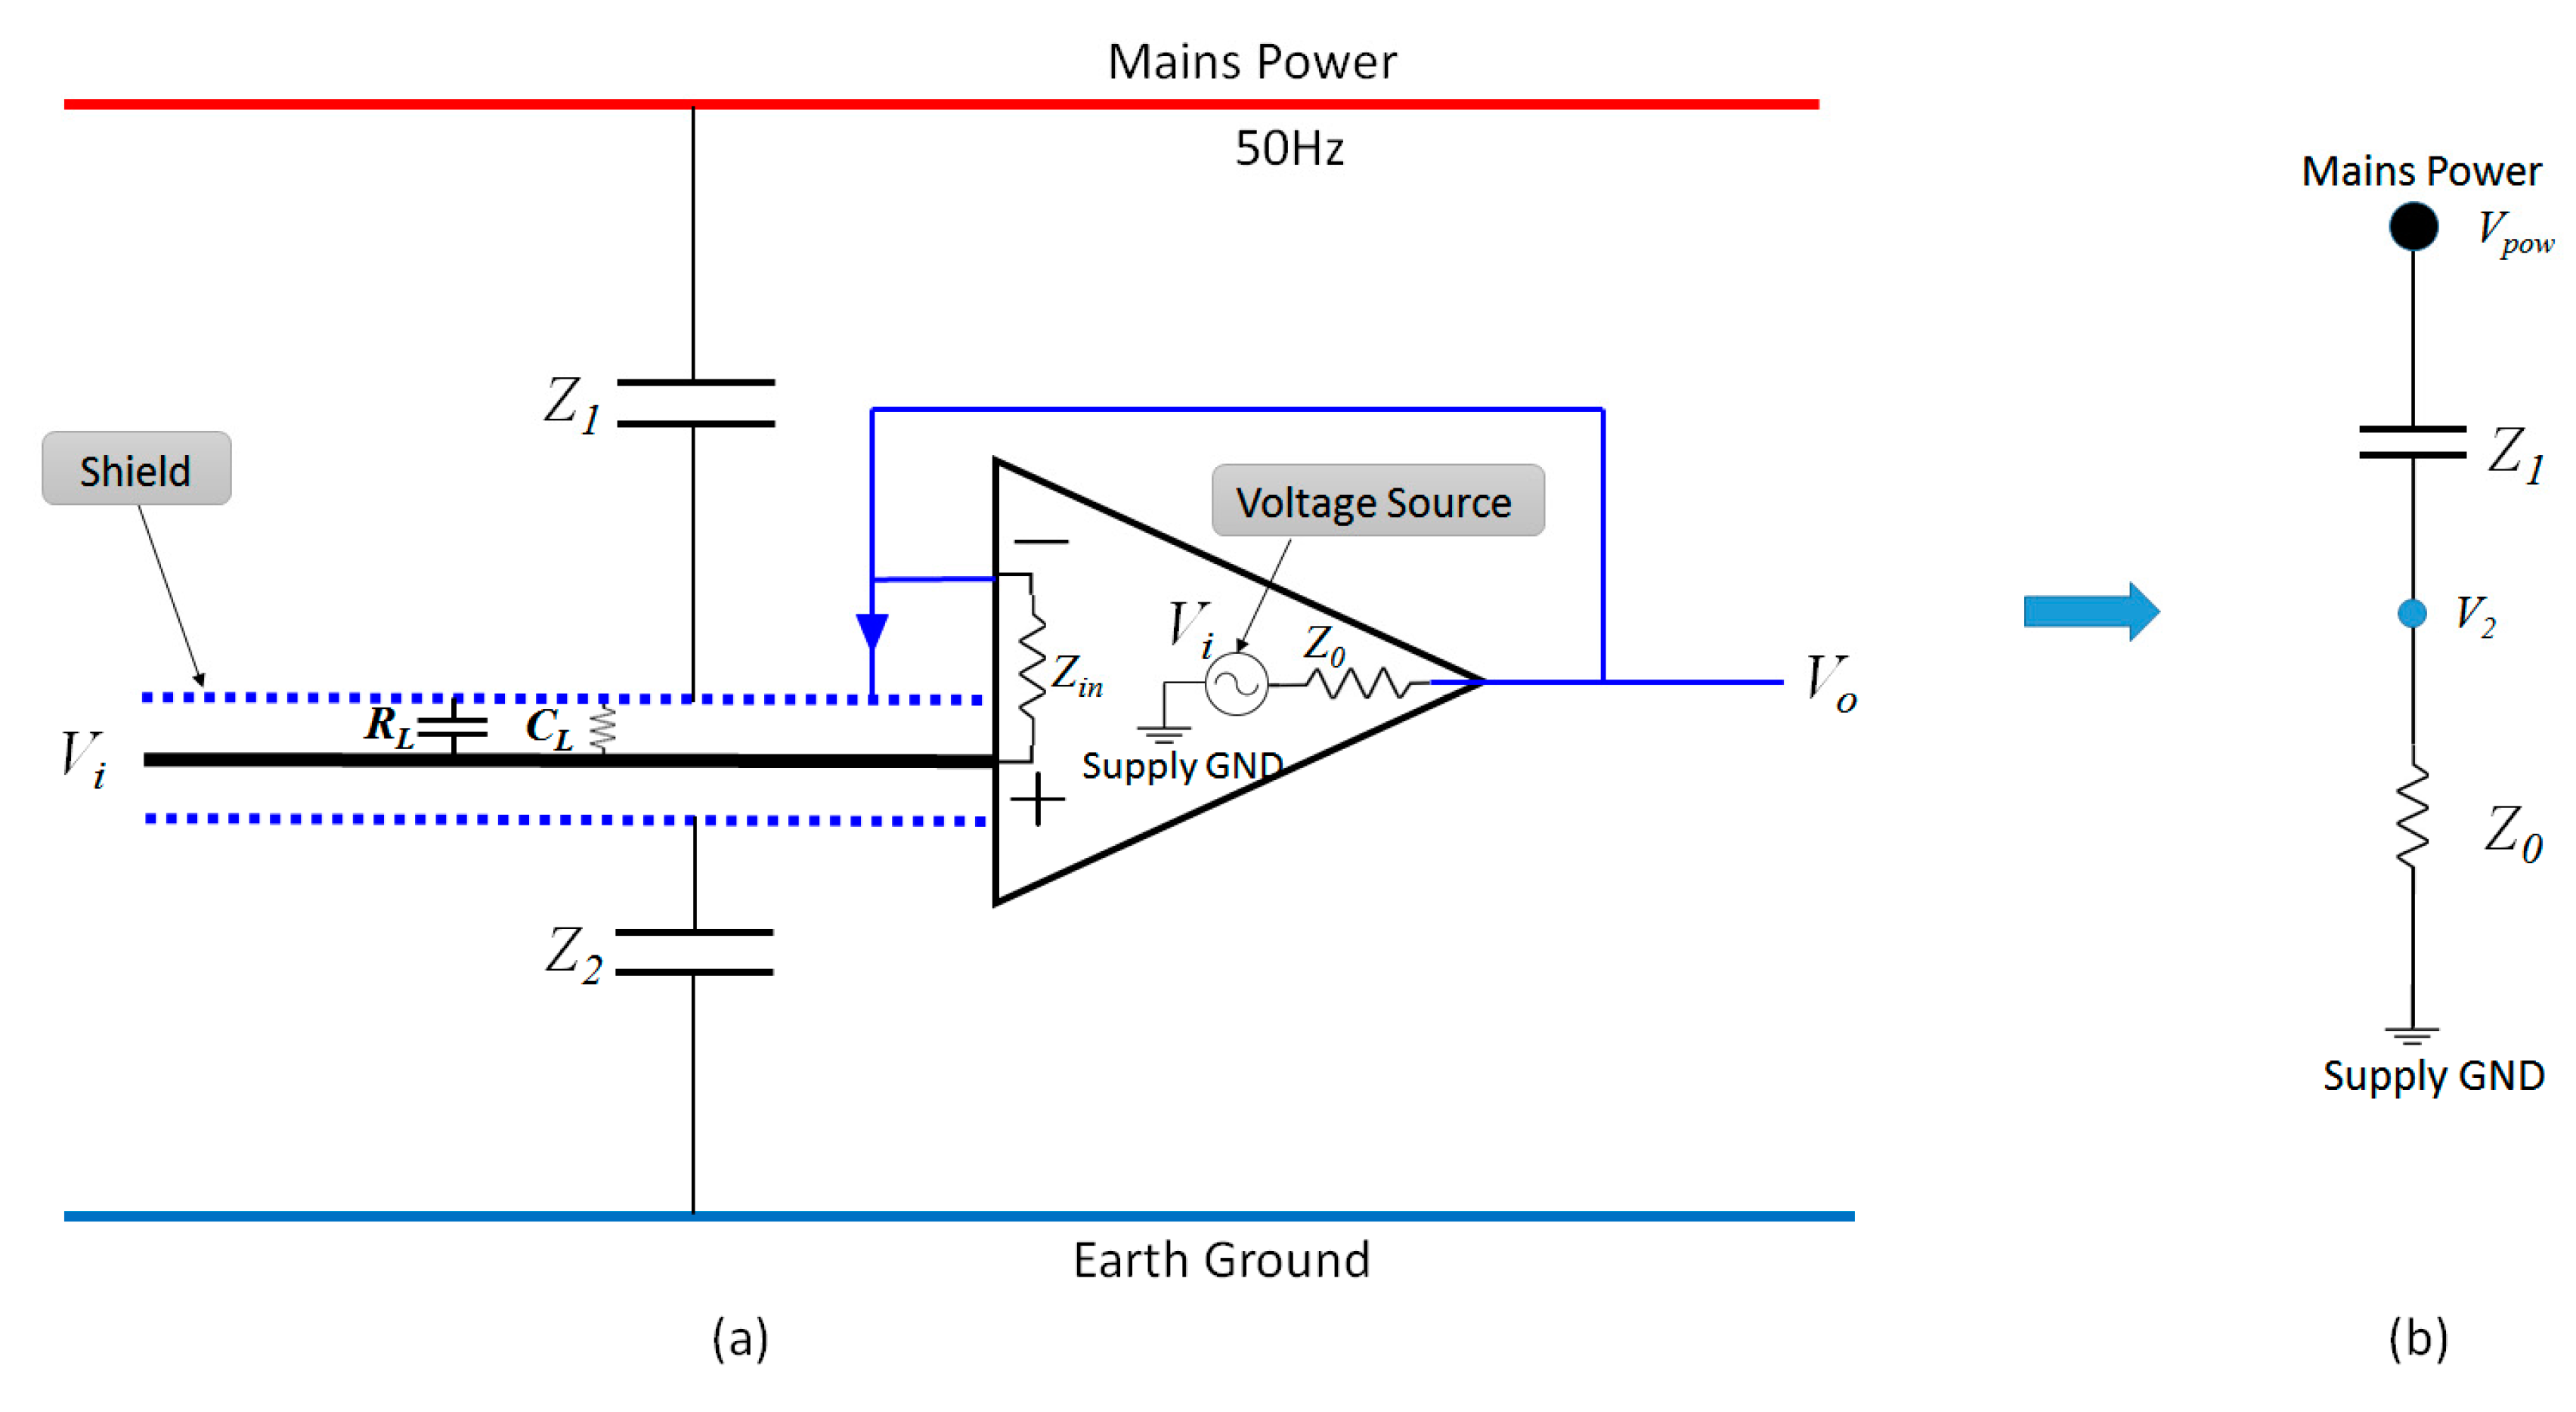
2.3. Experimental Principle

In order to prevent the adverse effects of extraneous electromagnetic fields while transmitting the recorded signal (from to in Figure 1), shielded cables were utilized as the electrode leads. When the signal is recorded, the shield is usually grounded, thus avoiding the effects of extraneous interferences on the signal in the inner core wire. Although the shielded cables protect the signals in the core from extraneous electromagnetic fields, a distributed resistance and capacitance often exists between the shield and the core wire, thus affecting the quality of recorded biopotential signals that are generally characterized by low amplitude and high impedance [45]. Therefore, this study implemented a shielded drive technology, in which the signal in the core drives the signal in the shield, as shown in Figure 2D. When the output of the amplifier is connected to the shield, which means that the shield is connected to a low internal resistance voltage source, the effect of the shielded cable against interference remains unchanged. However, since the voltage of the core is equal to the voltage of the shield, according to Ohm’s law [46], the current in the core automatically becomes zero which then nullifies the resistance and capacitance that once existed between the shield and the core. Hence, the biopotential signal passing through the shielded cable is no longer affected by the distributed resistance and capacitance.
During the experiments, a total of four electrode channels were simultaneously used to record the ECG, EOG, and EMG signals across all 20 of the recruited subjects. Meanwhile, the first electrode channel denoted as Channel 1 was set as the control channel, thus it was not implemented on the proposed shielded drive circuit. In addition, we implemented three different shielded drive techniques on the other channels (Channel 2, Channel 3 and Channel 4). As shown in Figure 2A, the first channel adopted the conventional method that has no shield (herein referred to as Method 1). In Figure 2B, the second channel connected the outer shields of both electrode cables to the buffered ground signal of the ADS1299EEG-FE, as shown in Figure 3 (referred to as Method 2). Figure 2C shows that the outer shields of the electrode cables of the third channel were connected to the buffered BIAS_SHD signal (Figure 3) generated by the integrated circuit of ADS1299EEG-FE (referred to as Method 3). In Figure 2D, the signal of the inner wire was fed back to the shield using a low impedance output of an amplifier (herein referred to as Method 4). And thus, the voltage of the shielded cable with respect to the shield became zero. Furthermore, the four channels shared the same driven-right-leg (DRL) electrode placed on the earlobe, as the ground and the DRL signal were generated from the integrated circuit of the ADS1299EEG-FE kit. The DRL circuit sensed the common-mode of a selected set of electrodes and created a negative feedback loop by driving the body with an inverted common-mode signal [47].

2.4. Experimental Procedures

In the current study, a total of four different experiments were designed. To investigate the effectiveness of the developed shielded drive circuit with respect to reducing power line interference, three of the experiments were performed under normal laboratory conditions (NLC) (that is, the laboratory was unshielded from sound and electro-magnetic interference) for the recording of ECG, EOG, and EMG signals from the subjects. To equally examine if the proposed method could eliminate the interference of electrode lead jitter, the fourth experiment was designed to collect an EMG signal in a sound-proofed and electro-magnetically shielded laboratory designated as shielded laboratory conditions (SLC). For all of the experiments, the same hardware platform of ADS1299 was used, and only the locations of the electrodes were different for different types of biopotential signals. Prior to the commencement of the experiments, the surface of the subjects’ skin was properly cleaned with the aid of an alcohol. Subsequently, conductive gel was applied to the electrodes before attaching them to the skin to minimize the impedance between the skin surface and the electrode. During the experiments, the laptop was completely powered by battery to reduce all forms of power line interference that may result from using an alternating current (AC) supply. The experiments are described in the following subsections.

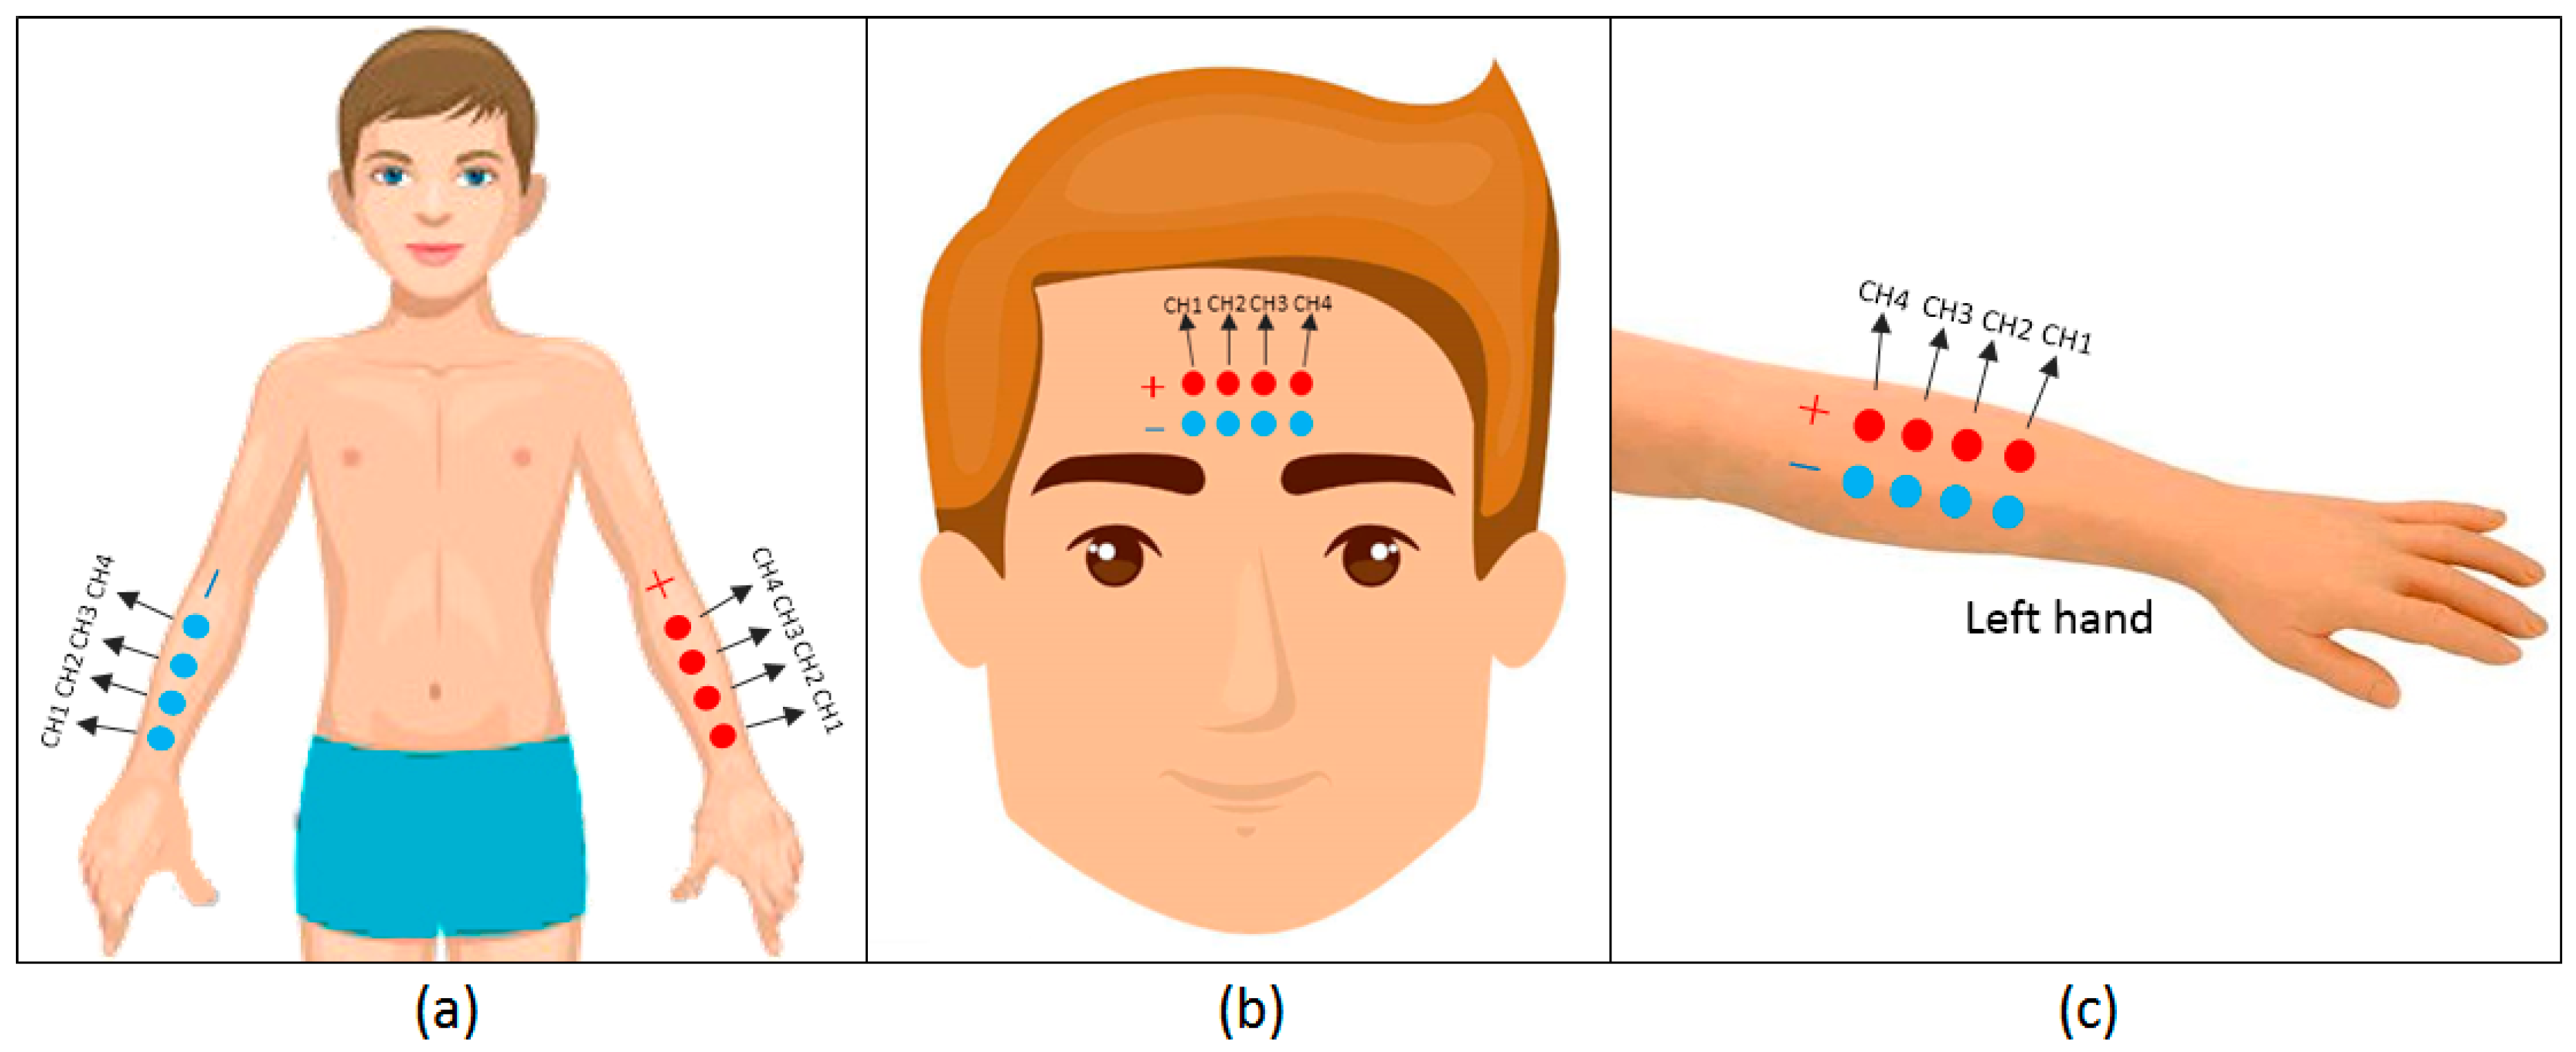
2.4.1. ECG Data Acquisition Experiment

In the normal laboratory condition, the subjects were instructed to sit comfortably on a chair in a quiet and relaxed manner. Then, the positive and negative nodes of the four electrode channels were placed on the left and right forearm of each subject, respectively, as shown in Figure 4a. It is noteworthy that the electrodes on both sides of the forearms were placed as symmetrically as possible to minimize the impedance mismatch of the positive and negative inputs of each channel. Afterwards, each subject completed three experimental trials with each trial lasting for 5 min, and they all maintained a quiet mode during the signal recording. Lastly, the time waveform and spectra of the recorded signals were monitored in real time via a graphical user interface (GUI) module in the acquisition. Note that the data collection scenario described here is designated as Experiment 1.

2.4.2. EOG Data Acquisition Experiment

By placing the positive and negative nodes of the four electrodes on the forehead of each subject, the EOG signals were recorded under normal laboratory conditions. The placement of the electrode nodes on the forehead of each subject was done in a two by four (consisting of two rows and four columns) grid, as shown in Figure 4b. The first row of the grid represents the positive nodes of the channels while the second row consists of the negative nodes of the channels. The electrode channels were placed close to each other as much as possible to ensure that similar ocular signals were obtained across the channels. The EOG recording session also lasted for 5 min and each subject performed 3 trials. During each experimental trial, the subjects actually blinked their eyes every 2 s with a consistent intensity all through the recordings. Furthermore, the characteristics (in terms of waveform and spectrum) of the recorded EOG signals were observed through a GUI module to assess the recorded signals. Note that the data collection scenario described here is designated as Experiment 2.

2.4.3. EMG Data Acquisition Experiment

The EMG recordings were acquired under normal laboratory conditions by placing the positive and negative nodes of each of the four electrode channels on the left forearm of the subjects, as shown in Figure 4c. The electrodes were placed in a relatively close position to one another to ensure that the recorded EMG signals were identical during muscle contraction. Then, the subjects completed three trials with each trial lasting for 5 min, and they all maintained a quiet mode during the signal recording session. During the experiment, the subject’s arm was initially relaxed and his/her hand remained in an open state. After about a minute, the subject clenched his/her fist and kept it closed for 3 s. Then the subject opened his/her hand and returned to the relaxed state. The EMG signal was recorded during the process and the temporal waveforms were observed via a GUI module to assess the signal quality. Note that the data collection scenario described here is designated as Experiment 3.
To avoid the effect of power line interference, the EMG signal recording experiment was performed in the shielded room. In the shielded room, up to 30 dB acoustic noise could be avoided; this is in line with the national standards which conform to GB/T16403-1996 and GB/T16296-1996. Under these laboratory conditions, each subject sat in a comfortable manner while the positive and negative ends of four electrodes were attached to the muscles on their left forearm. To prevent the electrodes from being displaced during the experiment, a bandage was used to firmly hold the electrodes to their skin, as shown in Figure 5. During the experiment, the subjects’ forearms with the electrodes were maintained in a stationary position, along with the electrode lead cables, for the first minute. Then, the electrode lead cables were individually shaken at about the same amplitude for 10 s and then returned to their initial positions. Afterwards, each subject repeated the experiment three trials while each trial lasted for 3 min and the recorded signals were examined through a GUI. Note that the data collection scenario described here is designated as Experiment 4.

3. Results and Analysis

By utilizing the biopotential signals obtained from all the recruited subjects, results were obtained for each of the above-described experimental scenarios. For each experimental scenario, the obtained results were compared amongst all subjects, and they were observed to be consistent. Hence, the results obtained for a representative subject are presented and analyzed as follows.

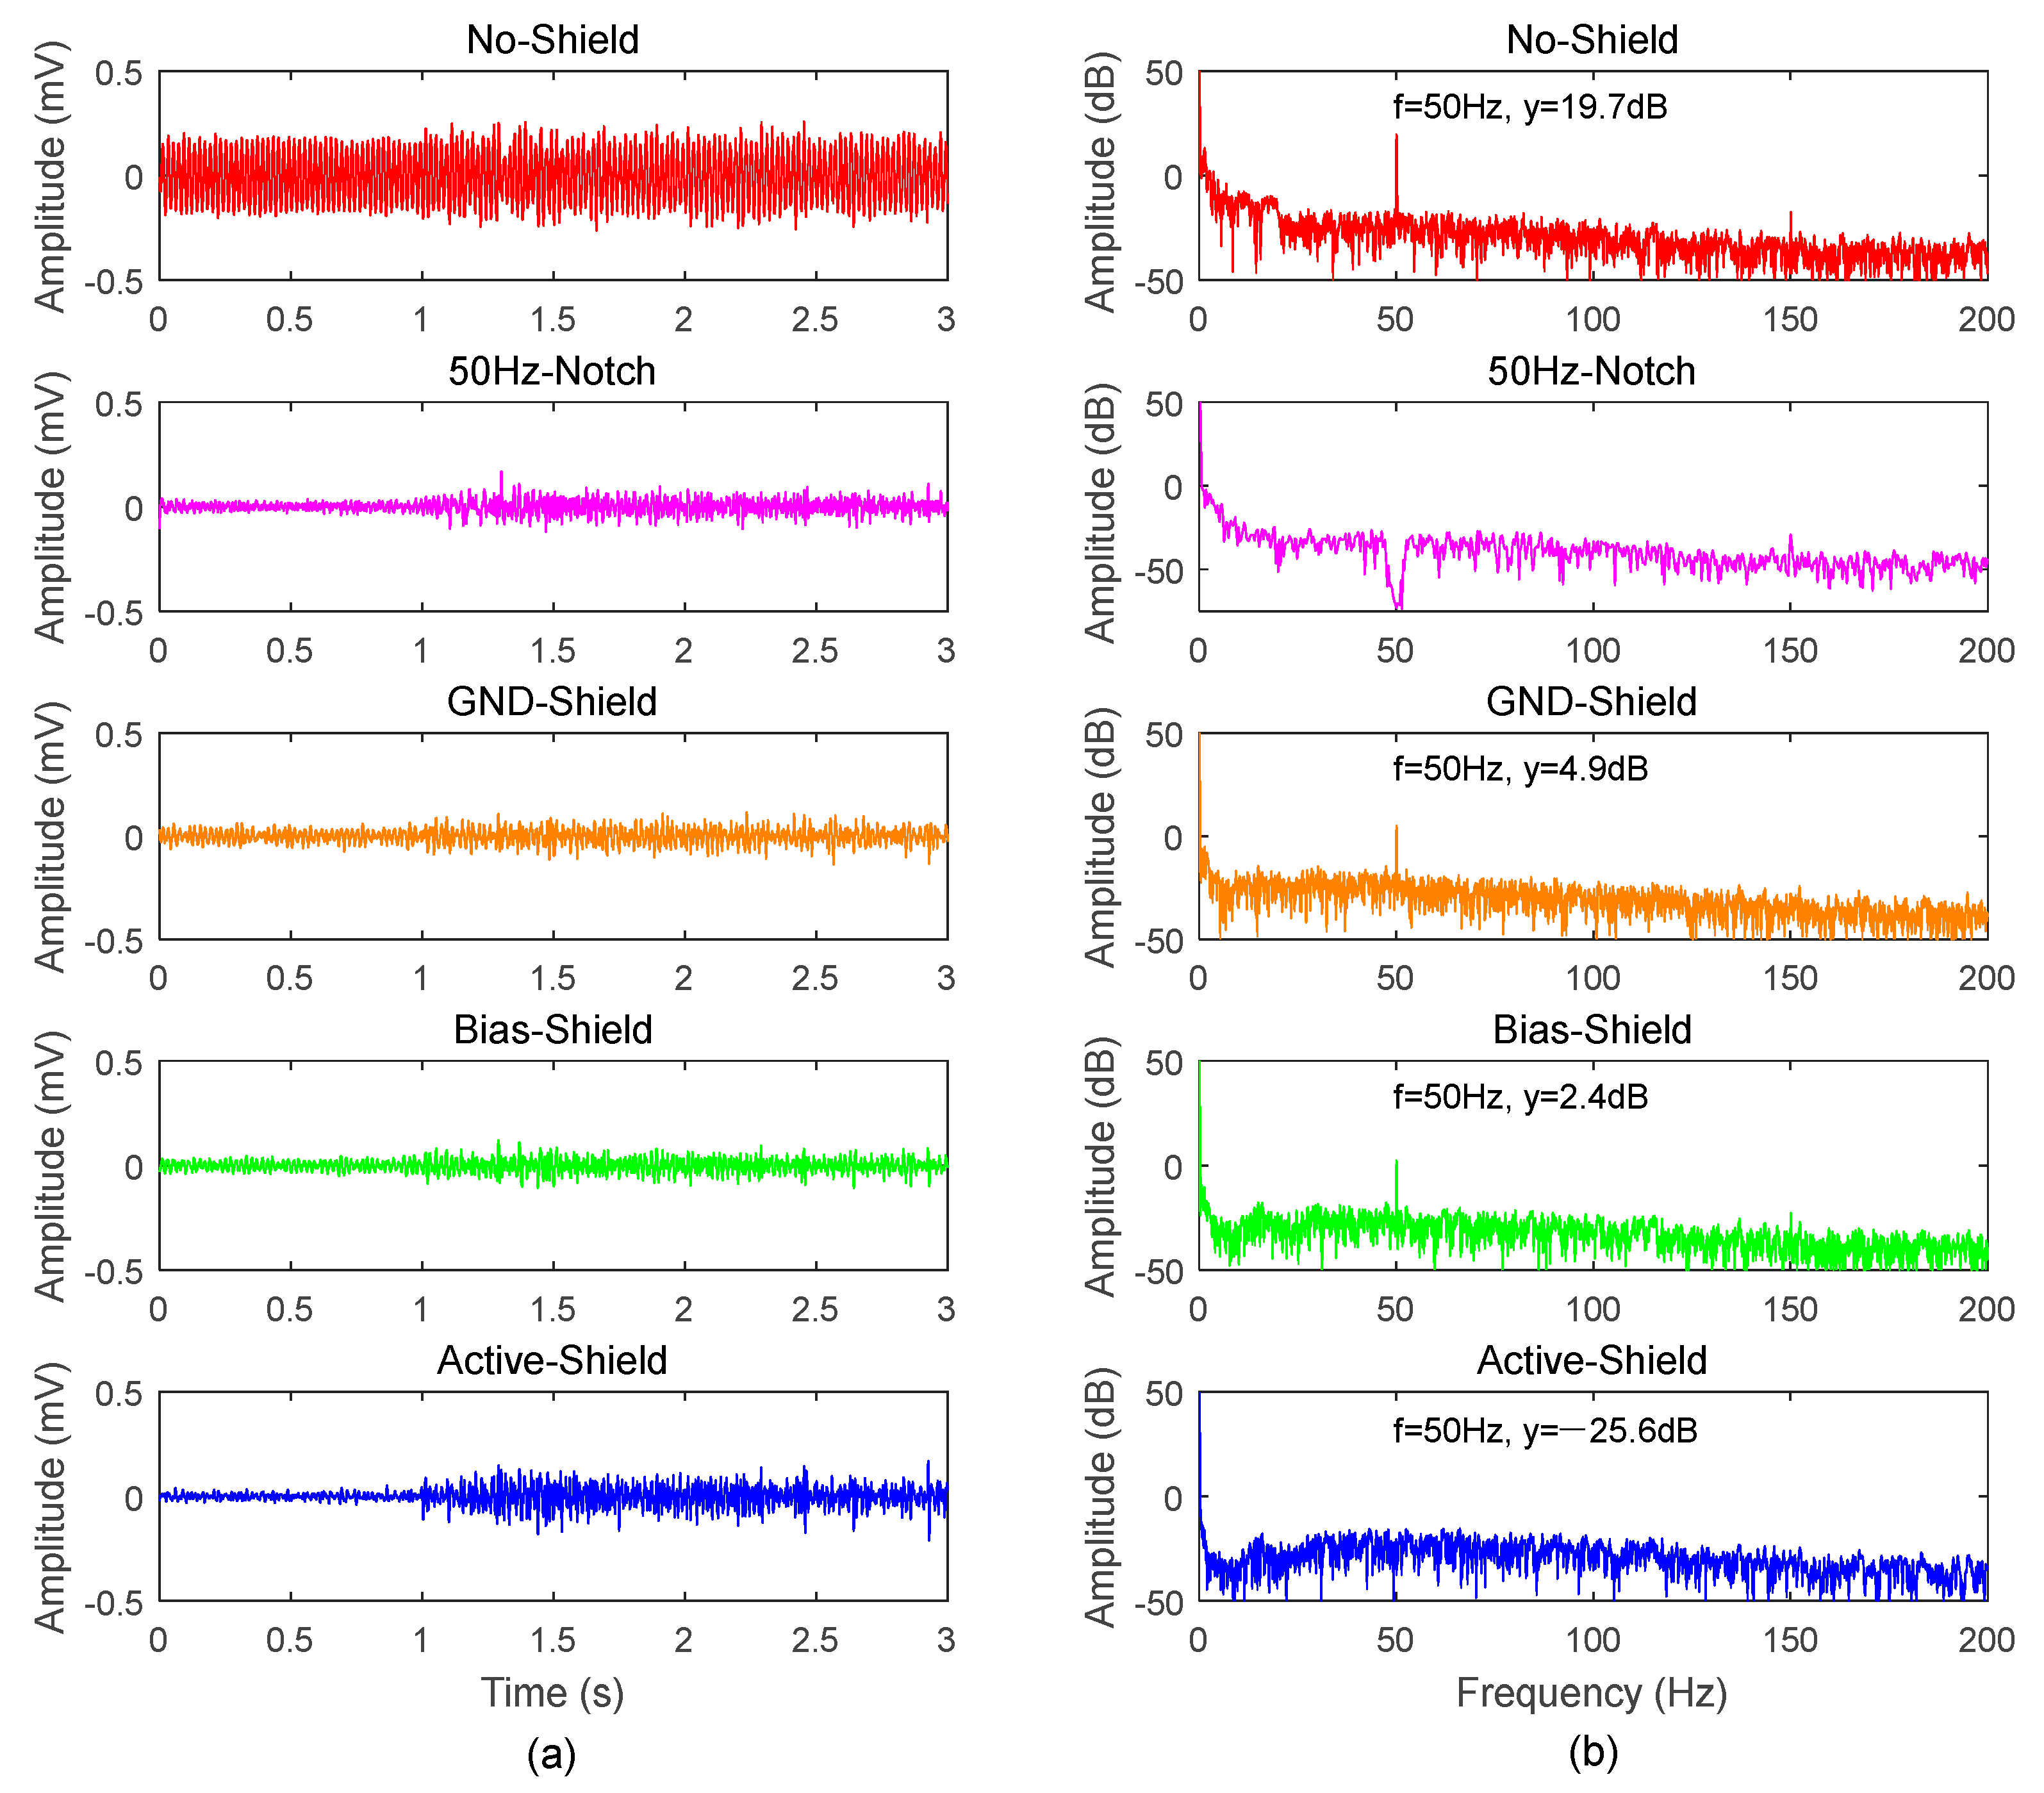
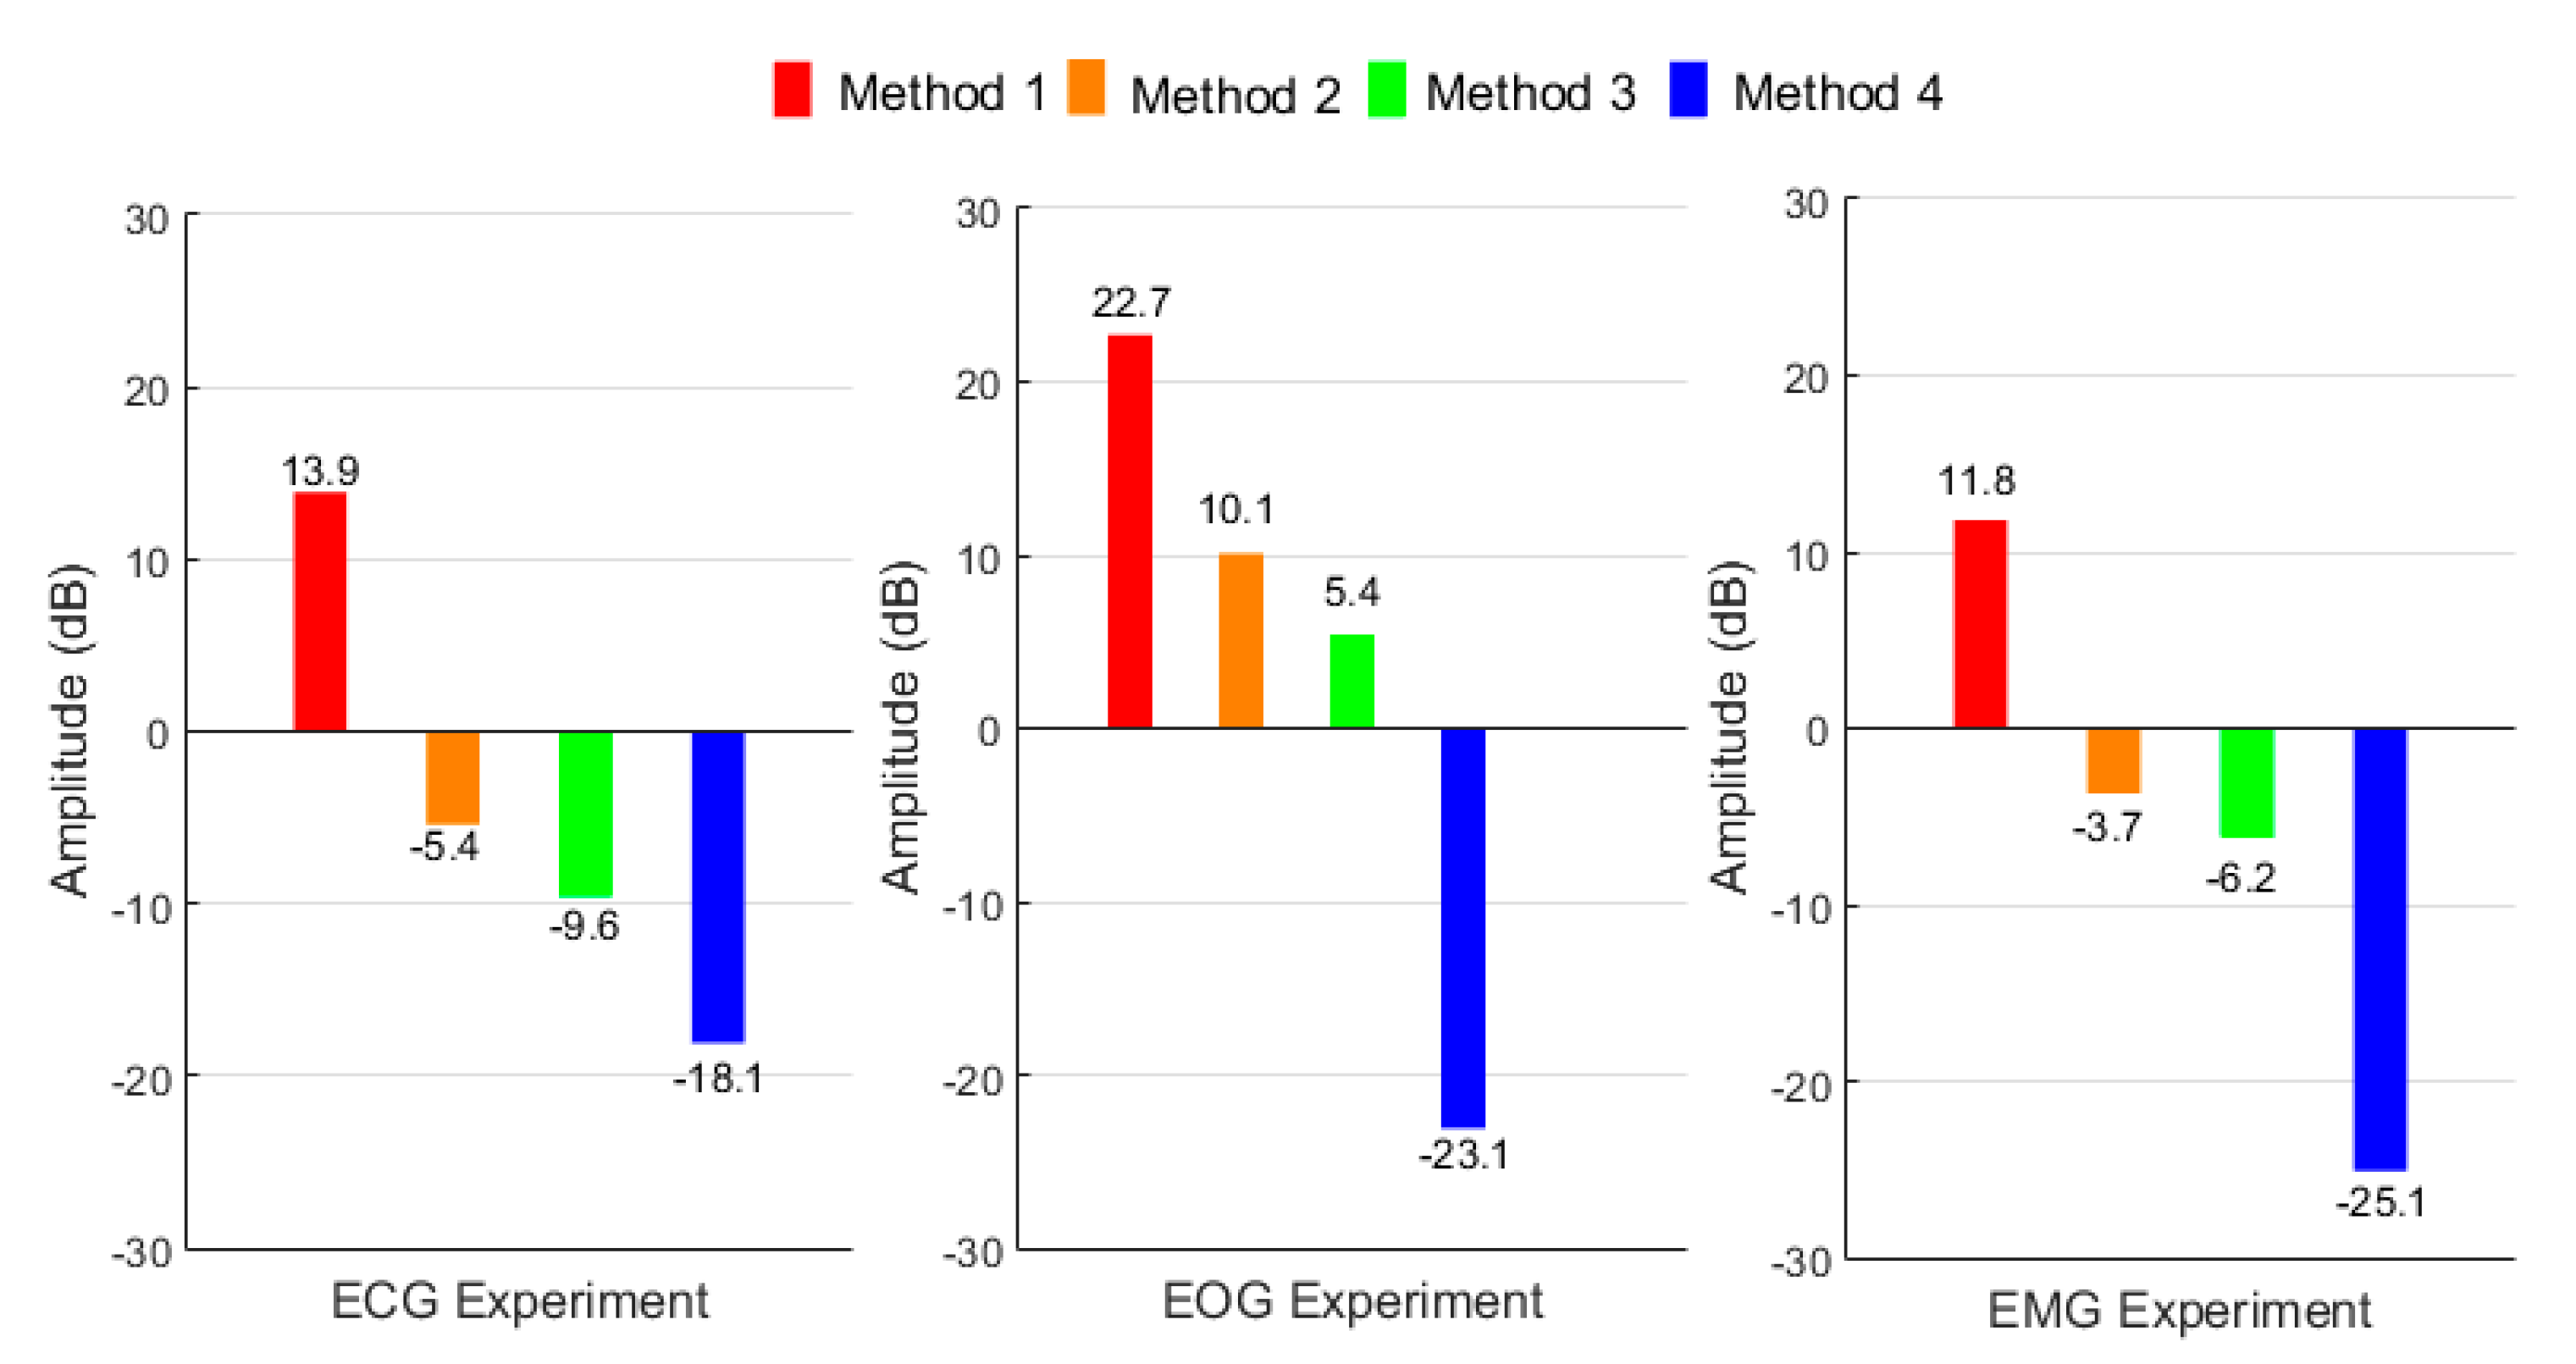
3.1. Reduction of Power Line Interference

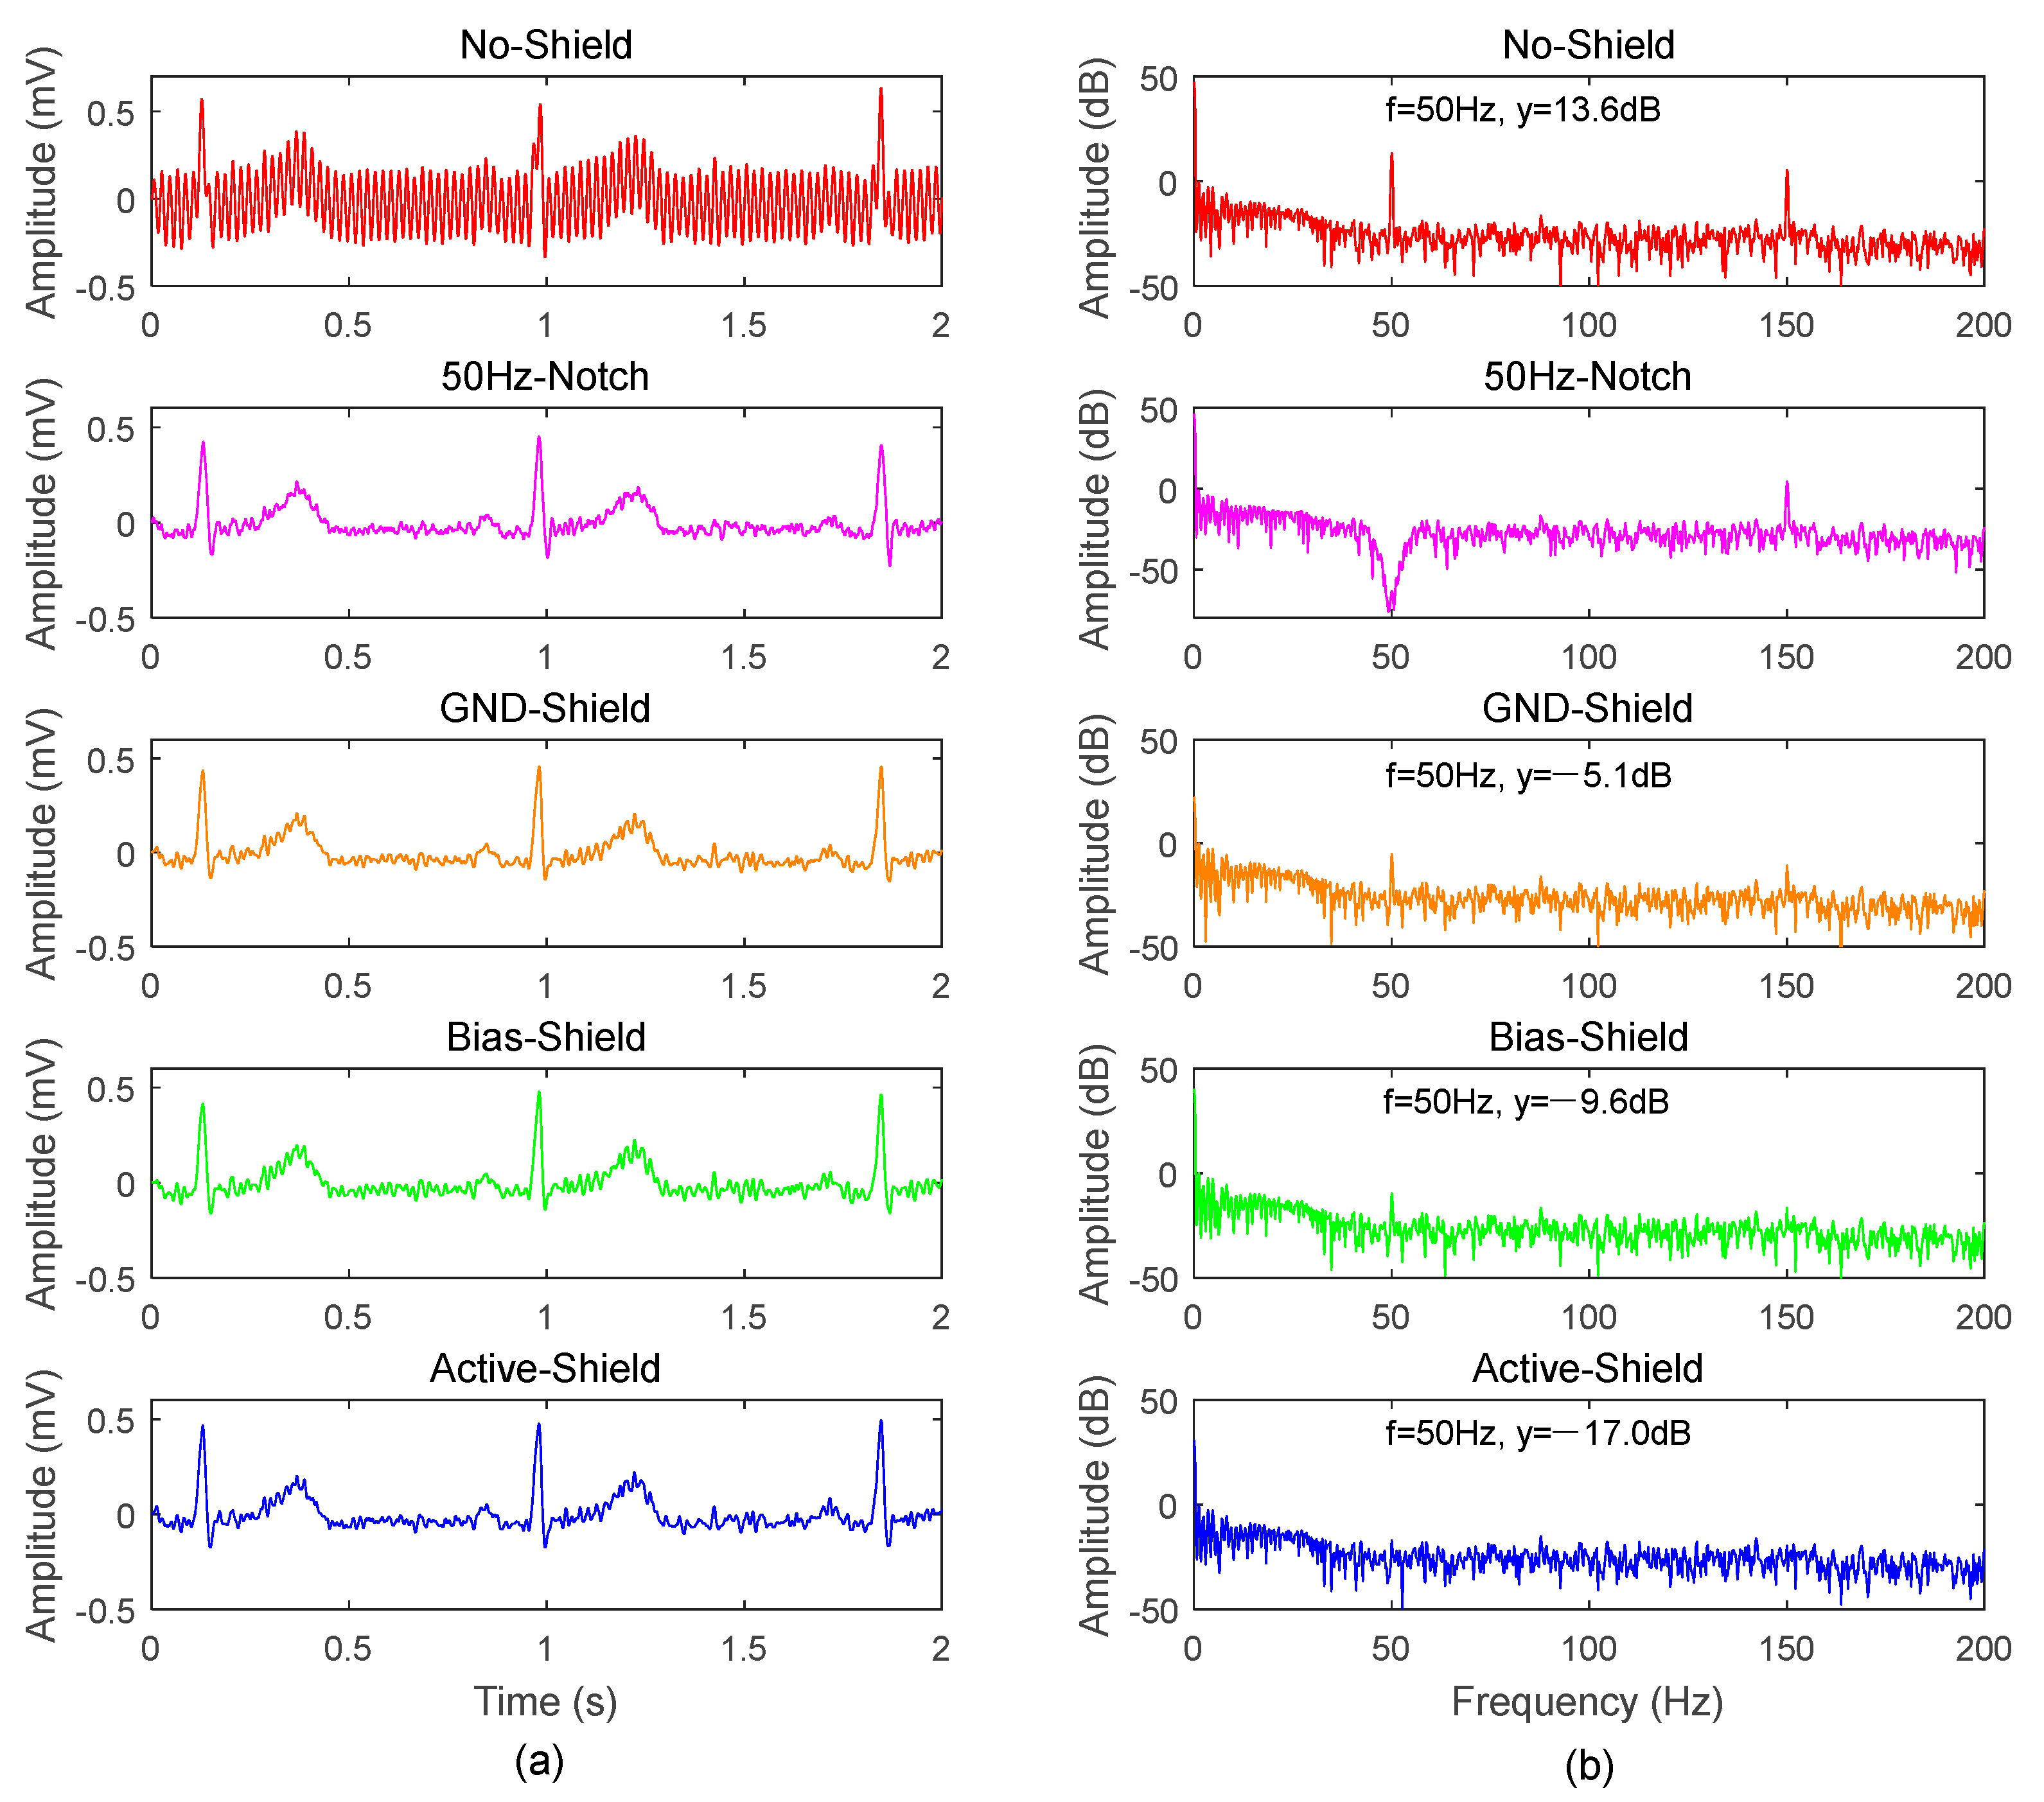
3.1.1. Analysis of ECG Recordings

The time-domain waveform and spectrum of the ECG signal of a representative subject collected under NLC are shown in Figure 6. It can be seen from the ECG waveform that Method 1 reflects a series of sine wave that superimposes the ECG signals and thus prevents the ECG recordings from being obvious. However, Methods 2, 3 and 4 produced obvious ECG signals, whose time-domain waveforms are better than that of Method 1. Furthermore, the difference amongst Methods 2, 3 and 4 is not obvious, probably because of their mixture with other biopotential signals such as EMG. This finding suggests that the waveforms of ECG signals acquired with the proposed shielded drive technology would be better than that of the conventional unshielded drive approach.
By analyzing the ECG spectrum, it can be seen that the 50 Hz frequency in the ECG signal collected by Method 1 is as high as 13.6 dB; the 50 Hz power line frequency amplitude of Method 2 is −5.1 dB, which is 18.7 dB lower than that of Method 1; the 50 Hz power frequency amplitude of Method 3 is −9.6 dB, which is 23.2 dB lower than that of Method 1; while Method 4 records a 50 Hz frequency amplitude of −17.0 dB which achieves a reduction of 30.6 dB in comparison to Method 1, and it is much better. In addition, the harmonics of 50 Hz in the spectrum of Method 4 are also eliminated. So it could be concluded that the use of shielded drive can effectively suppress power line interference during ECG signal recording, especially when utilizing Method 4.
The plot on the second row in Figure 6 shows the time domain waveform and spectrum of the raw signal (the signal gotten from Method 1) after undergoing filtering via a 50 Hz notch filter. Its waveform is similar to those of the shielded drive methods, but the spectrum has a large depression near 50 Hz. Because ECG signal frequency lies in the range of 0.05–100 Hz, the useful components of the recordings would be lost. In contrast, the hardware-shielded results are seen to be better.

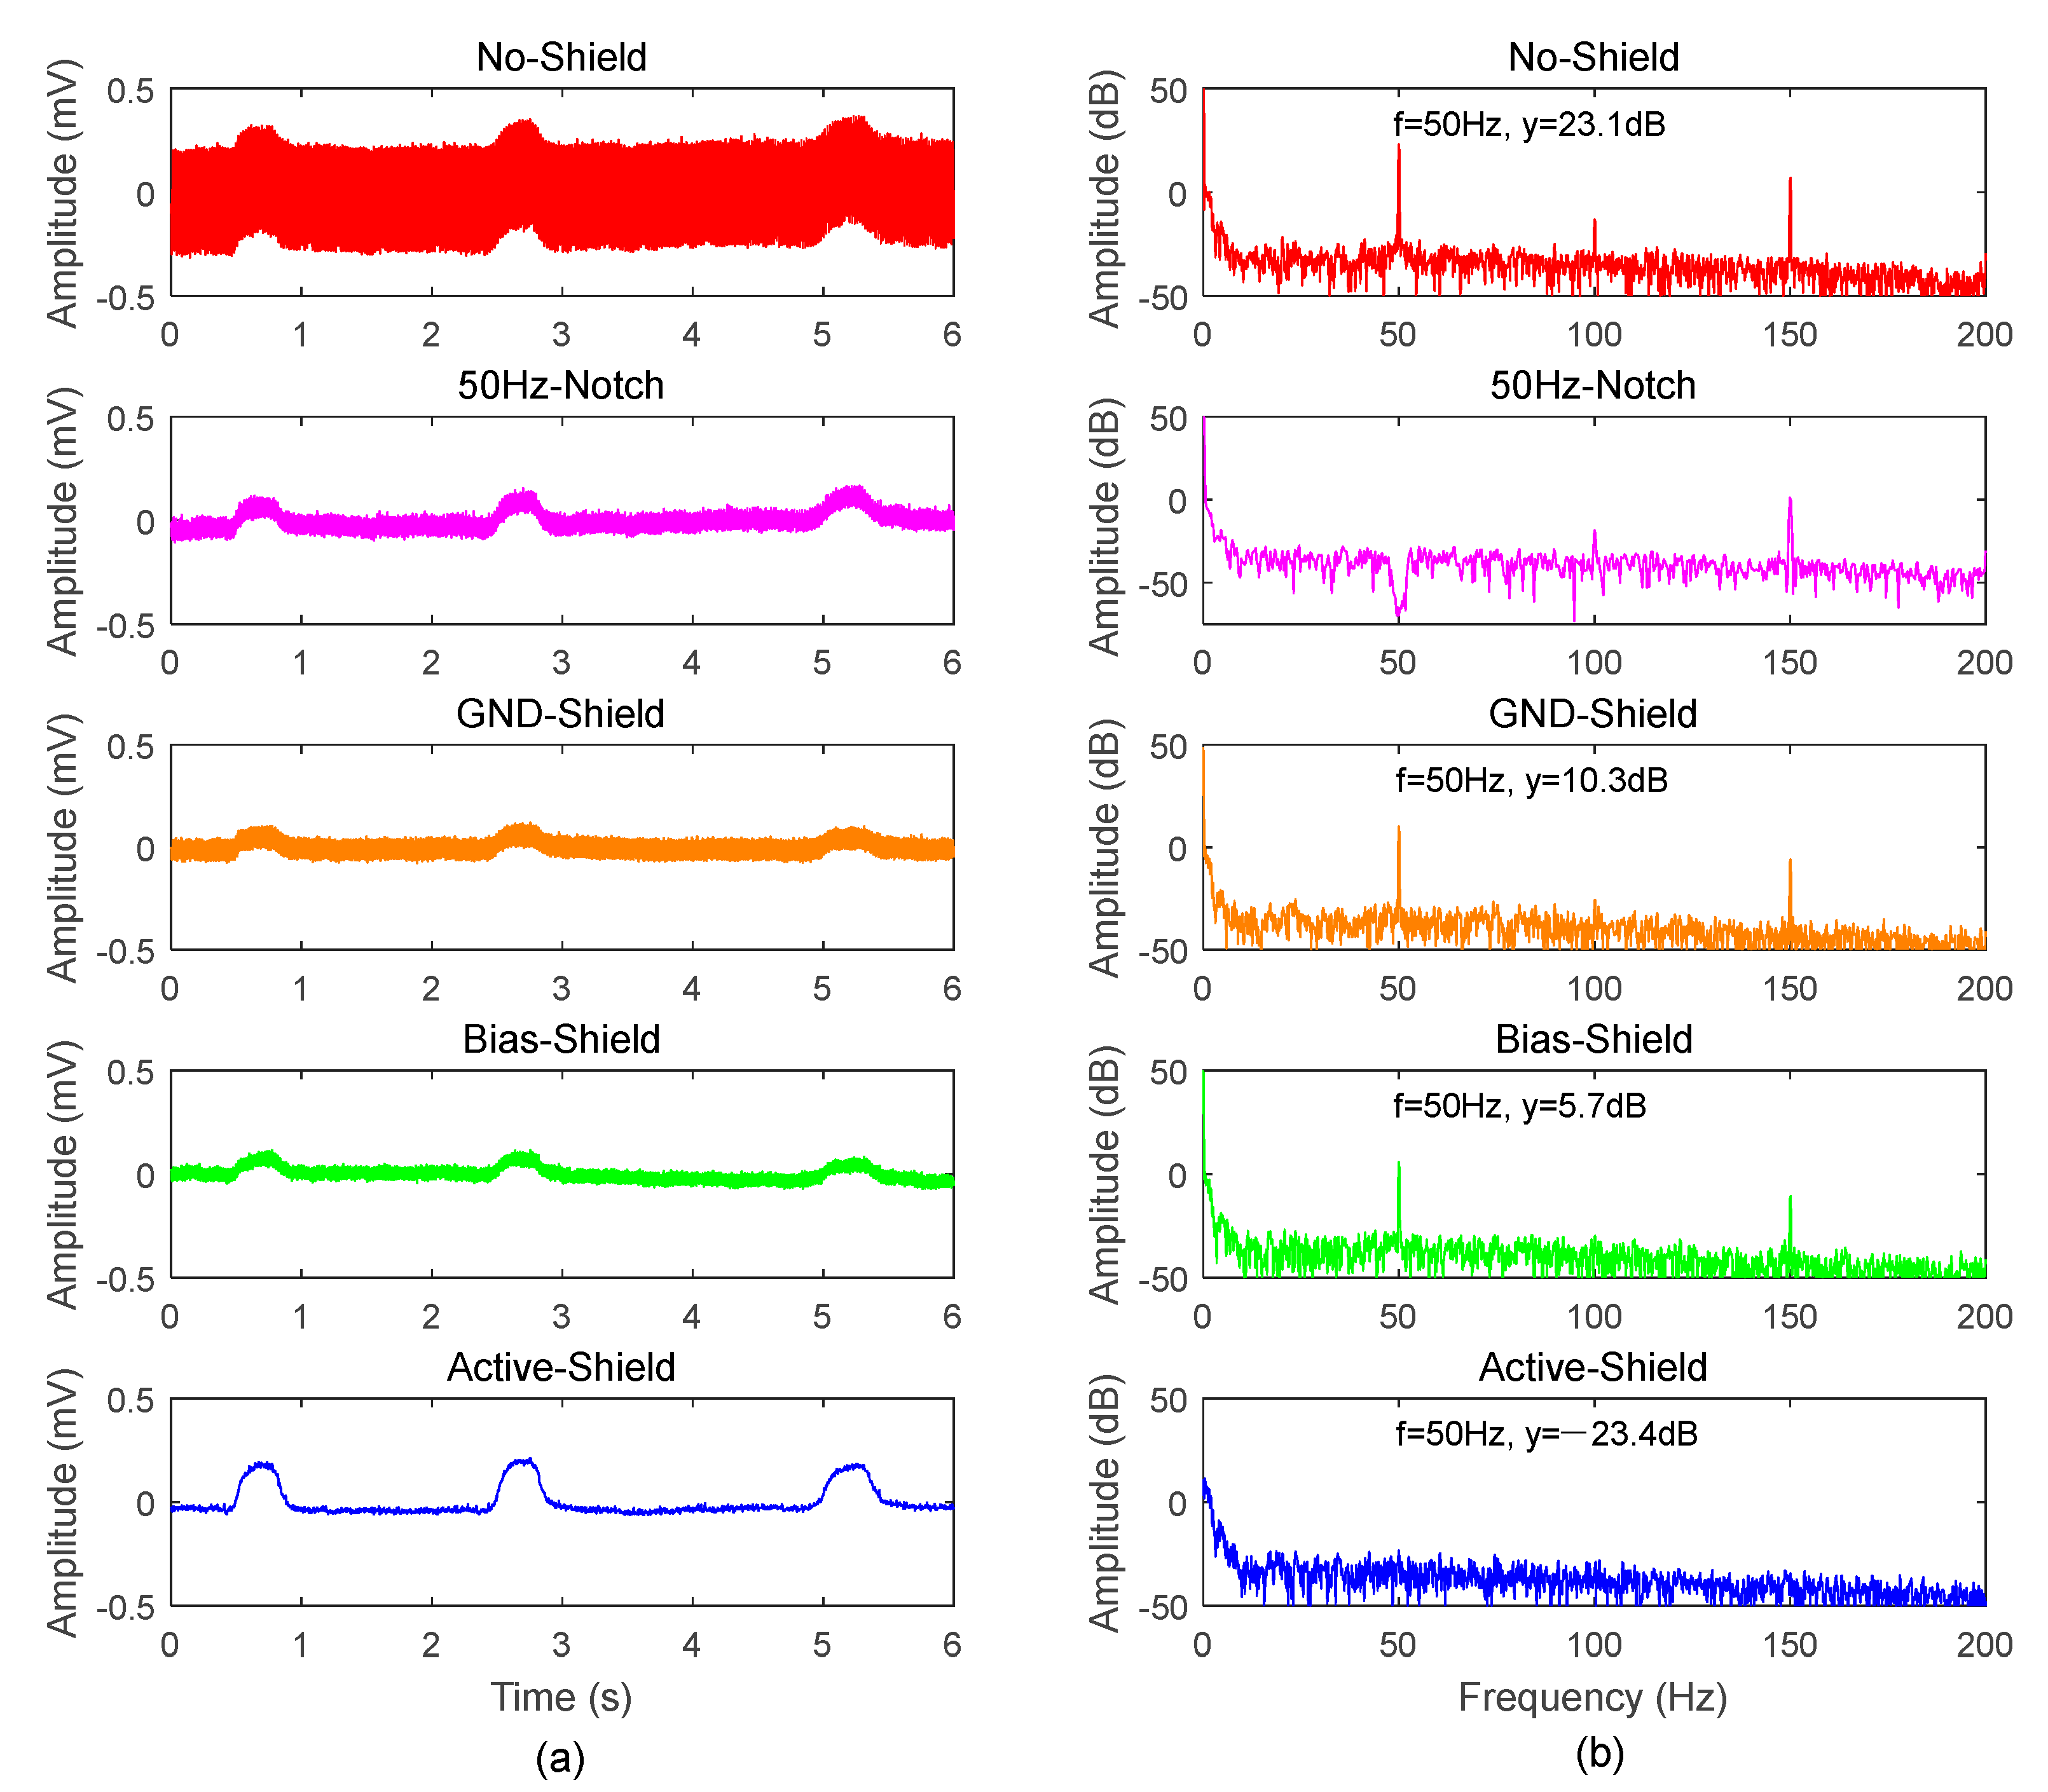
3.1.2. Analysis of EOG Recordings

The analysis of spectrum and waveforms of the EOG signal for a representative subject acquired from Experiment 2 is shown in Figure 7. The waveform of the signal obtained by applying Method 1 is a series of approximate sine waves with a peak-to-peak value of 0.5 mV, and blink signals can be seen by the signal envelope; the signal obtained by Method 2 is approximately sinusoidal with a reduced peak-to-peak value of 0.1 mV; the peak-to-peak value of the curve of Method 3 is further reduced to 0.06 mV, and the EOG signal becomes more obvious; In Method 4, the obtained EOG signal has almost no sine wave sequence with a fairly clean blink signal. Thus, the EOG signals obtained via the proposed shielded drive methods are better in comparison to those obtained via the unshielded drive approach (Method 1), and the EOG signal of Method 4 is considered to be the best.
Furthermore, it could be seen from the spectrum analysis results that the 50 Hz frequency of EOG signal acquired by Method 1 is as high as 23.1 dB; the 50 Hz frequency amplitude of Method 2 is 10.3 dB, which is 12.8 dB lower than that of Method 1; Method 3 has a 50 Hz frequency amplitude of 5.7 dB, which is 17.4 dB lower than that of Method 1; Method 4’s 50 Hz frequency amplitude of −23.4 dB is 46.5 dB lower than that of Method 1, which is considered very good. Moreover, the 50 Hz harmonics in the EOG spectrum of Method 4, such as 100 Hz and 150 Hz, also disappeared. We can also conclude that using the shielded drive approach could significantly reduce power line interference when recording EOG signal especially with Method 4.
It can also be seen from Figure 7 that the graph obtained after applying the 50 Hz-Notch filter reflects the waveform as well as spectrum of the raw signal (the output of Method 1) which is characterized by a relatively much lower amplitude. The waveform is similar to that of Method 2, but the spectrum has a large depression around 50 Hz, which eventually led to the loss of useful components of the target signal. Hence, the proposed hardware-based method would be better.

3.1.3. Analysis of EMG Recordings

Figure 8 shows the results obtained after analyzing the EMG signals of a representative subject collected in Experiment 3. In the picture, the forearm muscles of the representative subject were initially in their rest state (without activation/contraction), and a second later the muscles were activated. The waveform of the non-activated muscles as obtained by Method 1 represents a series of sine waves that jitters up and down after the activation of the arm muscles; the waveform of the non-activated muscles as obtained by Method 2 denotes a noisy line, and when the muscle is contracted, the EMG signal patterns become obvious. The waveform obtained after applying Method 3 is similar to that of Method 2, but with relatively smaller amplitude; the waveform of non-activated muscles obtained by applying Method 4 appears to be cleaner compared to Method 3, and there is a significant EMG signal burst when the forearm muscles are activated. Therefore, it can be deduced that the conclusion of Experiment 3 is consistent with those of Experiment 1 and Experiment 2, which further proves the potential of the proposed shielded drive technology.
By analyzing the EMG signal spectrum at 50 Hz, Method 1 achieved a high amplitude of 19.7 dB; Method 2 recorded an amplitude of 4.9 dB, which is 14.8 dB lower than that of Method 1; Method 3 achieved an amplitude of 2.4 dB, which is 17.3 dB lower than that of Method 1. Meanwhile, Method 4 recorded an amplitude of −25.6 dB, which is 45.3 dB lower than that of Method 1, which appeared to be very efficient in comparison to the other methods.
From Figure 8, the graph on the second row denotes the time domain waveform and spectrum after the raw signal (the output of Method 1) was subjected to a 50 Hz notch filtering. Its time domain waveform is similar to that of Method 3, but the spectrum is depressed around 50 Hz. That is, the frequency range of the EMG signal is 0–500 Hz, and the useful components of the signal are lost. In contrast, the hardware-shielded drive processing has a better effect.
Figure 9 shows the mean values of the spectral values at 50 Hz averaged across all the 20 subjects for the ECG, EOG, and EMG experiments under NLC. It could be observed that the spectral amplitude of the 50 Hz interference gradually decreased from Method 1 to Method 4 for all three different experiments, with Method 4 achieving the lowest power line interference that almost fell below the noise floor level. The averaged results in Figure 9 were in accordance with the observations of each individual subject from Figure 6, Figure 7 and Figure 8.

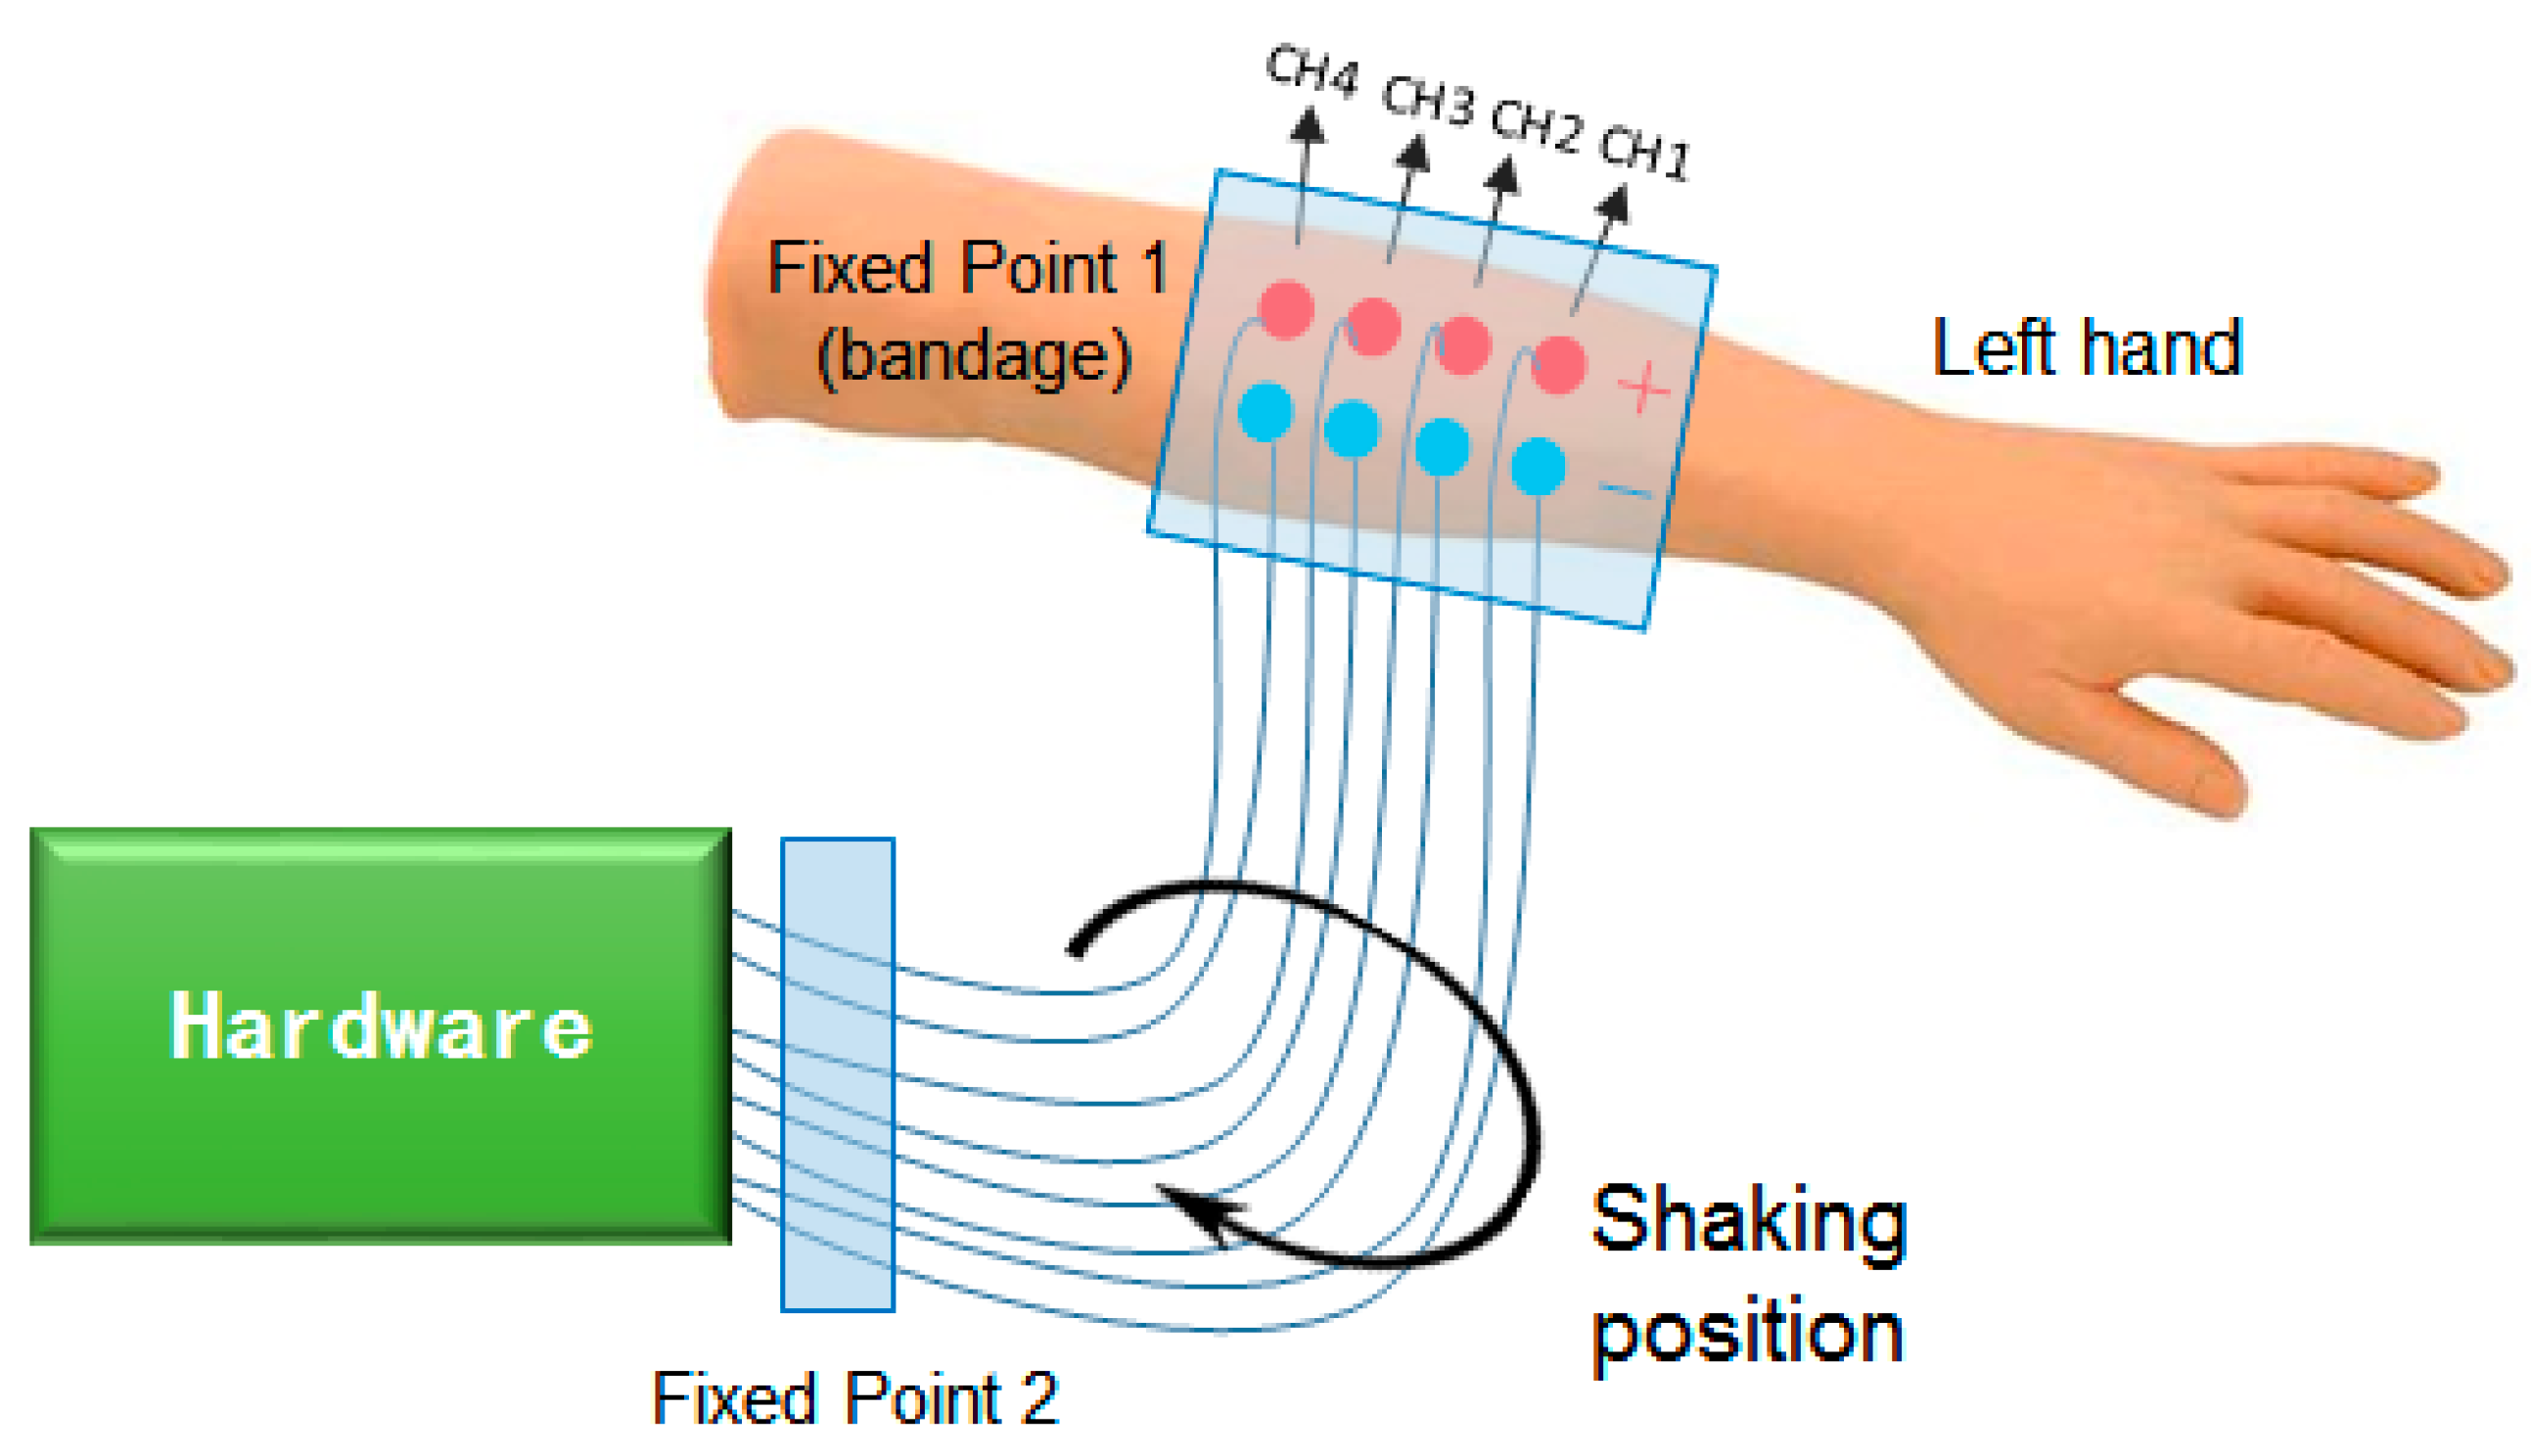
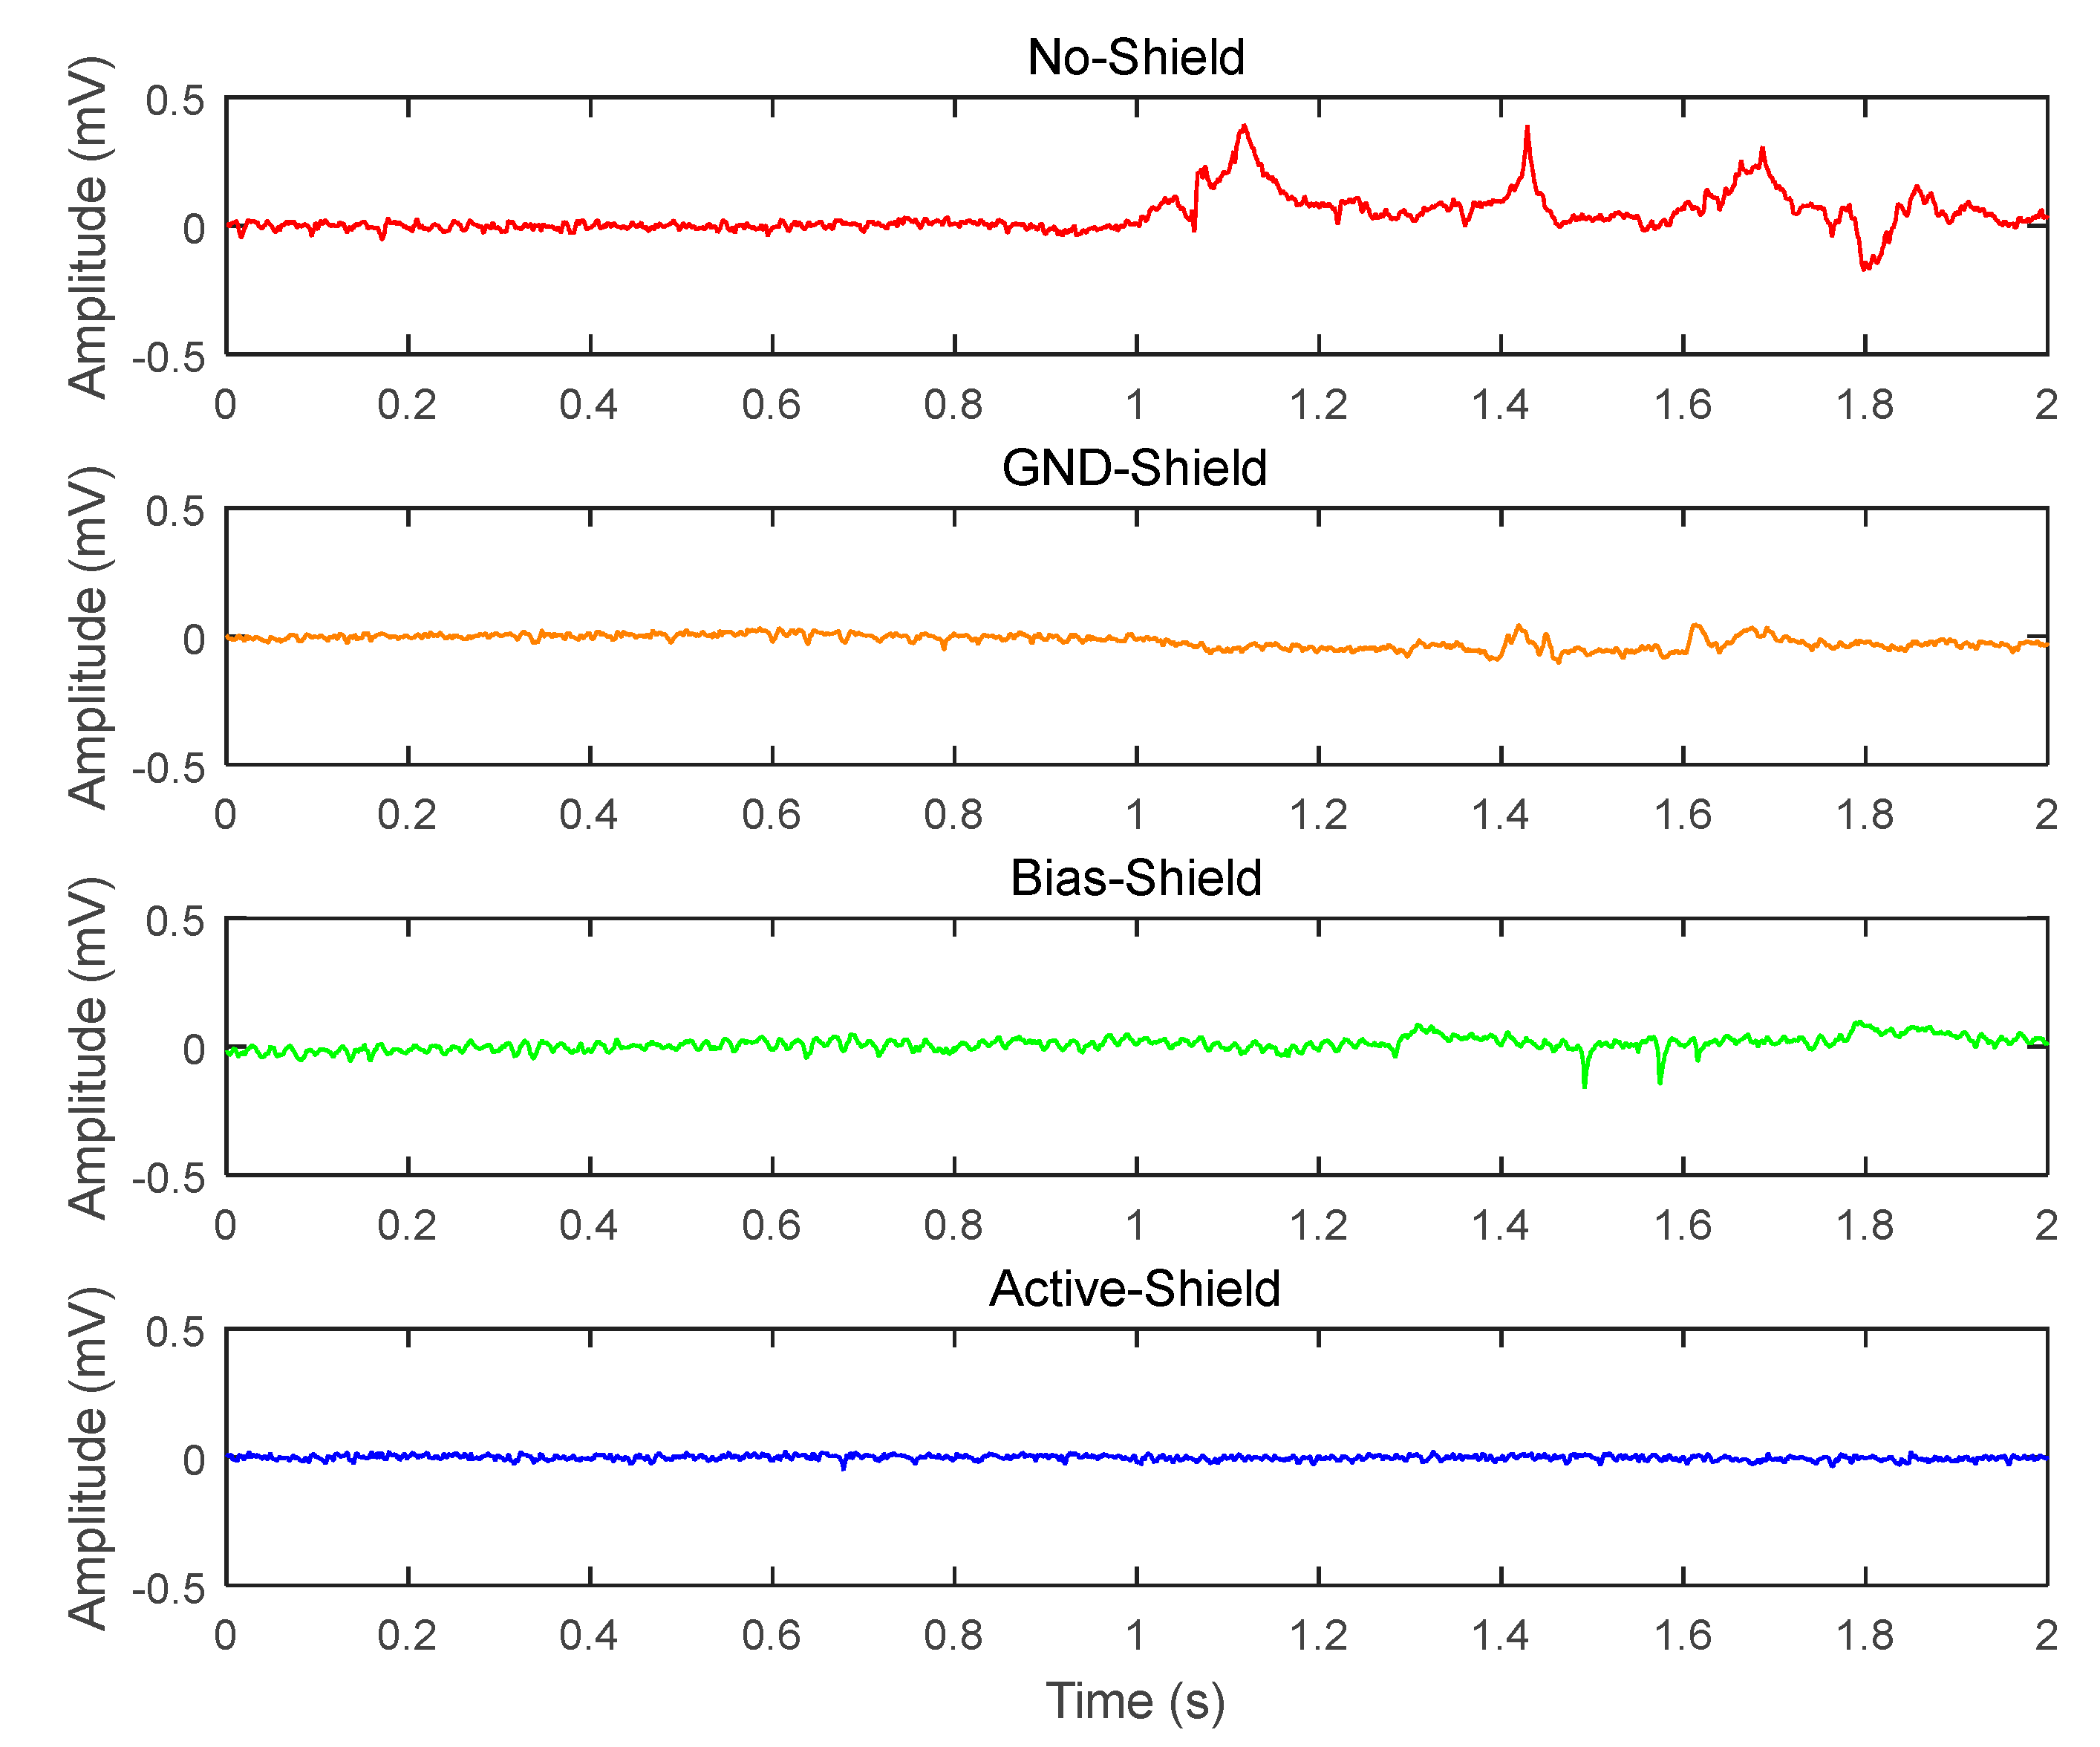
3.2. Elimination of Electrode Lead Jitter Interference

The results which were obtained based on the EMG recordings (muscles relaxed) acquired in the shielded room session are presented in Figure 10. By closely observing the plots in Figure 10, one can see that the waveform across all four of the tested methods exhibited almost the same characteristics in the first second, which is because the electrode leads were maintained in a fixed state while recording the signals. After the first second, the electrode lead cables were individually shaken at about the same amplitude and the waveform of Method 1 changed greatly while that of Method 2 is changed slightly in comparison to that of the first second. Additionally, Method 3 could be seen to exhibit a slightly lower waveform compared to Method 1 while the waveform of Method 4 has almost no change with respect to that of the first second. This implies that Method 4 has substantially eliminated the interference of the electrode lead jitter on the target signal. Therefore, it could be said that the proposed shielded drive approach would significantly eliminate the interference of the electrode lead jitter, especially when implemented with Method 4.

4. Discussion

Towards developing an efficient method for optimal attenuation of multi-source noise/interference in biopotential signal acquisition, this study proposed hardware-based shielded drive technology. Importantly, the proposed method could efficiently shield the recorded biopotential signals from extraneous interferences as much as possible and also preserve the signal quality during the transmission process to obtain a high quality target signal prior to entering the acquisition device. In this regard, three different types of shielded drive methods were developed and their performances were evaluated. The evaluation was done with respect to the capability of methods to attenuate the effect of two kinds of extraneous interferences using a four-electrode channel recording system across three kinds of biopotential signals (ECG, EOG and EMG).

4.1. Reduction of Power Line Interference

With respect to the attenuation of power line interference, three key biopotential signals (ECG, EOG, and EMG) were considered and recorded under the same laboratory settings which have been designated as Experiment 1, Experiment 2 and Experiment 3 in the current study. The analyses of the biopotential signals obtained have been shown in Figure 6, Figure 7 and Figure 8. The waveforms as well as spectrum characteristics shown in the Figures indicate that the proposed shielded drive methods could effectively suppress power line interference. Also, the effect of Method 4 (Active-Shield) is considered to be the best since it suppressed almost all of the power line interference of 50 Hz as well as its harmonics in the ECG, EOG, and EMG to 32.0 dB, 45.8 dB, and 36.9 dB respectively, as shown in Table 1. Table 1 shows the average dB values across subjects for the three different shielded methods (GND-Shield, Bias-Shield, and Active-Shield) against No-Shield method in suppressing the 50 Hz power line frequency in Experiment 1, Experiment 2, and Experiment 3. It is noteworthy that the greater the number, the better the performance of the methods in suppressing the 50 Hz power line interference. Although the designed notch filter was able to eliminate the 50 Hz frequency inherent in the raw signal’s (i.e., No-Shield signal) spectrum, useful components of the target signal near 50 Hz were destroyed, and also the associated harmonic components were still present in the target signal. Adli et al. designed an automatic interference control device (AICD) for the elimination of power line interference, and the AICD was able to suppress the 60 Hz frequency in biopotential signal recordings to 30 dB, yet their method could not eliminate the associated harmonic components [4]. However, by utilizing the proposed shielded drive method, the 50 Hz frequency and its harmonic components were significantly reduced, thus leading to improved quality of the target signals.
Figure 11A showed an intensive model of the No-Shield method for measuring ECG signals, similar to the interference model in Chimene’s study [19]. Because of the capacitive coupling to the mains power (Cpow) and the capacitive coupling to the safety earth ground (Cbody), the power line interference is present at the patient’s body as a common-mode signal and it might not be the same as the isolated ground of the power supply, causing a leakage current (Idiff) between the patient and the power-supply ground. When the leakage current flowed through the contact impedance of Zpgn, it would introduce a 50 Hz signal visible on both inputs of the amplifier. However, this is not the only source of the 50 Hz disturbance. In case the cables all have a different capacitive coupling to the mains and to ground, the voltage difference between the two cables of the positive and negative inputs will not be zero, causing a current (Idcable) from one cable to the other through the electrodes. For example, even if the current is as low as 0.1 µA, and the two electrodes have an impedance of only 5 kΩ, the differential 50 Hz signal on the bipolar input will be as large as 1 mV, which is a considerable amount of disturbance with the amplitude even larger than that of the ECG signal. In contrast, Figure 11B shows the capacitive coupling model of the Active-Shield method. In this case, the signal of the inner wire is fed back to the shield using a low impedance output of an amplifier. Note that there is still capacitive coupling between the mains power and the outer shields of both electrodes.
Based on the Figure 11B, the equivalent circuit of the amplifier, as well as the capacitive coupling, is shown in Figure 12a below (also in the revised manuscript) to examine whether the capacitive coupling between the mains power and the shields would introduce significant flux to the loop for the Active-Shield method. The amplifier that drives the outer shield could be equalized to a high input impedance Zin, a low output impedance Z0 (usually less than 100 Ω), and a voltage source with the same voltage with the input Vi (in reference to the isolated ground of the power supply). The output voltage Vo was composed of two independent components V1 and V2, where V1 is attributed to the voltage source Vi (voltage follower) and V2 is caused by the capacitive coupling between the mains power and the outer shield. When considering the second part V2, the voltage source could be regarded as a short circuit according to Thevenin’s Theorem and therefore the equivalent circuit is shown in Figure 12b, which is actually a voltage divider circuit between the mains power voltage Vpow and the isolated ground, with a series circuit by Z1 and Z0. According to the voltage dividing rule, the V2 voltage could be written as:
V 2 = Z 0 Z 0 + Z 1 ( V pow V isognd )
Given that Z1 is the coupling impedance between the power line and the shield and could be a few hundred MΩ or even larger, whereas the amplifier output impedance Z0 is usually less than 100 Ω, the corresponding V2 is usually a few dozen μV or even less in reference to the isolated ground. That is to say, the power line only introduces an interference V2 of a few μV for the Active-Shield method, because of the low output impedance of the amplifier. Similar analysis could be applied to the other electrode of the Active-Shield method, and it could also be concluded that the presence of the power line only introduces a few dozen μV (or less) of interference V 2 to the other outer shield. Although the potential of the two shields are different for the Active-Shield method, we can see that the actual potential difference ( V 2 V 2 ) caused by the power line interference is quite limited, since both V2 and V 2 are the order of μV and their difference is much smaller.
On the other hand, since the impedance ZL between the outer shield and the inner core wire is usually quite high (in the order of TΩ) and the other ends of both shields are open (not connected to human body or electrodes), little leakage current would flow from the outer shield to the inner wire or elsewhere, leading to negligible effects of the power line induced V2 on the voltage of the inner wire (Figure 12). Therefore, the differential voltage between the two inner core wires introduced by the power line interference is also negligible.
As for the electric flux induced by the magnetic field of the power line, we tried to minimize the area of the loop enclosed by the electrode wires during the experiment. For example, we kept the wires as short as possible and made sure that the two electrode cables were as close as possible by twisting them together. In this way, the effective area exposed to the power line magnetic field was largely reduced and the effects of the loop flux induced by the magnetic field were also rather limited. The limited power-line induced flux through the loop could be further confirmed by our experimental observations from Figure 6, Figure 7, Figure 8 and Figure 9 for the case of Active-Shield method.
Besides, it should be noted that although the electrodes of the four channels were attached as closely as possible in Experiment 2 and Experiment 3, there were still slight differences in the electrode positions, as shown in Figure 4b,c. Therefore, the amplitude of the EOG and EMG signals of four channels might have shown slight differences, as observed in Figure 7a and Figure 8a. Moreover, although the EOG signal frequency is in the range of 0.1–38 Hz, which has no overlap with the spectrum of power line interference, common software bandpass filter methods cannot obtain satisfactory filtered results in routine practices. The reason for this is that the amplitude of the 50 Hz interference is much stronger than EOG signal, and the limited stop-band attenuation at 50 Hz is not enough to bring power line interference below the noise floor level. Hence, our experimental results obviously show that the proposed shielded drive method would potentially be effective for the acquisition of multiple biopotential signals.

4.2. Elimination of Electrode Lead Jitter Interference

By conducting an additional experiment that involved the recording of EMG signals in an electromagnetic shielded room designated as Experiment 4, the effect of electrode lead jitter was studied as shown in Figure 10. By examining the results in Figure 10, one can see that all the shielded drive methods could significantly eliminate the interference in the EMG recordings caused by electrode lead jitter. Of the three shielded drive methods, the Active-Shield (Method 4) had the best performance, which almost completely eliminated the electrode lead jitter interference. It is conceivable that the Active-Shield method could be applied not only to EMG signals but also to the other biopotential signals.
For shielded technologies, the electrode cable consists of a small coax cable, where the outer layer is shielding the inner signal wire. Figure 13 shows the transmission line models of the electrode cable of the two different shielded methods, in which the outer shield is connected to different shielding signals (only one of the two input electrodes of each channel is plotted for simplicity).
As seen from Figure 13, the outer shield is connected to the isolated ground of the power supply for the GND-Shield method. In this way, the inner signal wire is protected against the capacitive coupling from the mains power, since the potential between the cables becomes zero and there is no current from one cable to the other through the electrodes, leading to no differential interference input. However, there is a considerable capacitance (CL) and resistance (RL) between the inner signal wire and the outer shield. Consequently, when there were some movements of the electrode cables, a large amount of movement artifacts will be seen in the output, caused by variation in the impedance (CL and RL) of the cable. The situation was similar for the case of Bias-Shield method. In contrast, for the Active-Shield method, the signal of the inner wire is put on the outer shield using a low impedance output of an amplifier, so the shield has almost the same potential as the inner signal wire in this case. Therefore, the change in CL and RL caused by cable movements will no longer have any influence on the potential of the inner wire and the system output. The model in Figure 13 provides the explanation for why the proposed Active-Shield circuit is effective in eliminating the electrode lead jitter interference (Figure 10).
The developed shielded drive circuit in the current study exhibits a simple structure and low cost, and is effective in suppressing power line interference as well as eliminating electrode lead jitter interference which simplifies the subsequent signal processing and analysis tasks. It could prevent the signal from extraneous noises without any requirement of hardware or software filtering. These characteristics of the proposed method are significantly important in developing biopotential signal acquisition and processing methods needed in wearable devices and other types of portable devices. It is noteworthy that the proposed shielded drive circuit built in the current study is independent of the acquisition system and thus we could integrate the shielded drive circuit into different acquisition devices to improve the signal quality in our future work.

5. Conclusions

In this study, the performances of different shielded technologies in reducing power line interference were comprehensively compared for effective biopotential acquisition. By investigating the performance of the proposed Active-Shield circuit with respect to ECG, EOG, and EMG signals acquired under normal laboratory settings, experimental results revealed that the proposed shielded drive method could effectively suppress power line interference including its harmonic components, and greatly improve the signal quality compared to conventional hardware-shielded and software filtering methods. The results also showed that the shielded drive circuit could significantly eliminate the influence of electrode lead jitter interference on the acquired signals, so it could be a great candidate to take care of the noises introduced by body movements of the subjects. In conclusion, the findings of the present study could be quite useful for providing a simple and effective solution to reduce power line interference and movement artifacts to obtain high-quality biopotential signals.

Acknowledgments

This work was supported in part by the Shenzhen High-level Overseas Talent Program (Peacock Plan) (#KQJSCX20160301141522), the National Natural Science Foundation of China under grants (#61771462, #81572233, #61403367, #61650305, #81760416, #81501620, #U1613222,# 61603375), and the Shenzhen Basic Research Grant (#JCYJ20150401145529005, #JCYJ20160331185848286, #GJHS20160329112841007).

Author Contributions

Yanbing Jiang made substantial contributions and wrote the paper; Shixiong Chen conceived and designed the experiments; Xueyu Liu and Xin Wang performed the experiments to acquire the data; Mingxing Zhu and Yanjuan Geng analyzed the data; Peng Li, Fei Chen and Fengxia Wu revised it critically for important intellectual content; Oluwarotimi Williams Samuel and Paul Oluwagbenga Idowu revised the manuscript; and Guanglin Li gave the general supervision of the research group.

Conflicts of Interest

The authors declare no conflict of interest.

References

  1. Pu, X.; Wan, L.; Sheng, Y.; Chiang, P.; Qin, Y.; Hong, Z. A Wireless 8-Channel ECG Biopotential Acquisition System for Dry Electrodes. In Proceedings of the 2012 IEEE International Symposium on Radio-Frequency Integration Technology (RFIT), Singapore, 21–23 November 2012; pp. 140–142. [Google Scholar]
  2. Burns, A.; Doheny, E.P.; Greene, B.R.; Foran, T.; Leahy, D.; O’Donovan, K.; Mcgrath, M.J. Shimmer: An Extensible Platform for Physiological Signal Capture. In Proceedings of the 2010 Annual International Conference of the IEEE Engineering in Medicine and Biology, Buenos Aires, Argentina, 31 August–4 September 2010; p. 3759. [Google Scholar]
  3. Pradhan, A.; Nayak, S.K.; Pande, K.; Ray, S.S.; Pal, K.; Champaty, B.; Anis, A.; Tibarewala, D.N. Acquisition and Classification of Emg Using a Dual-Channel Emg Biopotential Amplifier for Controlling Assistive Devices. In Proceedings of the 2016 IEEE Annual India Conference (INDICON), Bangalore, India, 16–18 December 2016; pp. 1–5. [Google Scholar]
  4. Adli, Y.Y.; Nakamura, T.; Kitaoka, K. Automatic Interference Controller Device for Eliminating the Power-Line Interference in Biopotential Signals. In Proceedings of the 17th IEEE Instrumentation and Measurement Technology Conference, Baltimore, MD, USA, 1–4 May 2000; Volume 3, pp. 1358–1362. [Google Scholar]
  5. Samuel, O.W.; Geng, Y.; Li, X.; Li, G. Towards Efficient Decoding of Multiple Classes of Motor Imagery Limb Movements Based on Eeg Spectral and Time Domain Descriptors. J. Med. Syst. 2017, 41, 194. [Google Scholar] [CrossRef] [PubMed]
  6. Duskalov, I.K.; Dotsinsky, I.A.; Christov, I.I. Developments in ECG Acquisition, Preprocessing, Parameter Measurement, and Recording. IEEE Eng. Med. Biol. Mag. 1998, 17, 50–58. [Google Scholar] [CrossRef]
  7. Samuel, O.W.; Li, X.; Geng, Y.; Asogbon, M.G.; Fang, P.; Huang, Z.; Li, G. Resolving the Adverse Impact of Mobility on Myoelectric Pattern Recognition in Upper-Limb Multifunctional Prostheses. Comput. Biol. Med. 2017, 90, 76–87. [Google Scholar] [CrossRef] [PubMed]
  8. Samuel, O.W.; Zhou, H.; Li, X.; Wang, H.; Zhang, H.; Sangaiah, A.K.; Li, G. Pattern Recognition of Electromyography Signals Based on Novel Time Domain Features for Amputees’ Limb Motion Classification. Comput. Electr. Eng. 2017, 2017, 1–10. [Google Scholar] [CrossRef]
  9. Schlögl, A.; Keinrath, C.; Zimmermann, D.; Scherer, R.; Leeb, R.; Pfurtscheller, G. A Fully Automated Correction Method of Eog Artifacts in EEG Recordings. Clin. Neurophysiol. 2007, 118, 98–104. [Google Scholar] [CrossRef] [PubMed]
  10. Ferdi, Y. Improved Lowpass Differentiator for Physiological Signal Processing. In Proceedings of the International Symposium on Communication Systems Networks and Digital Signal Processing, Newcastle upon Tyne, UK, 21–23 July 2010; pp. 747–750. [Google Scholar]
  11. Chavdar, L.; Mihov, G.; Ivanov, R.; Daskalov, I.; Christov, I.; Dotsinsky, I. Removal of Power-Line Interference from the ECG: A Review of the Subtraction Procedure. BioMed. Eng. OnLine 2005, 4, 50. [Google Scholar] [CrossRef]
  12. Zhong, Y.; Zhong, P.; Wang, J. The Research of Removing Baseline Wander for ECG. Comput. Appl. Chem. 2007, 24, 465–468. [Google Scholar]
  13. De Luca, C.J.; Gilmore, L.D.; Kuznetsov, M.; Roy, S.H. Filtering the Surface EMG Signal: Movement Artifact and Baseline Noise Contamination. J. Biomech. 2010, 43, 1573–1579. [Google Scholar] [CrossRef] [PubMed]
  14. Fatourechi, M.; Bashashati, A.; Ward, R.K.; Birch, G.E. EMG and EOG Artifacts in Brain Computer Interface Systems: A Survey. Clin. Neurophysiol. 2007, 118, 480–494. [Google Scholar] [CrossRef] [PubMed]
  15. Moretti, D.V.; Babiloni, F.; Carducci, F.; Cincotti, F.; Remondini, E.; Rossini, P.M.; Salinari, S.; Babiloni, C. Computerized Processing of EEG-EOG-EMG Artifacts for Multi-Centric Studies in Eeg Oscillations and Event-Related Potentials. Int. J. Psychophysiol. 2003, 47, 199–216. [Google Scholar] [CrossRef]
  16. Magri, J.; Grech, I.; Casha, O.; Gatt, E.; Micallef, J. Design of Cmos Front-End Circuitry for the Acquisition of Biopotential Signals. In Proceedings of the 2016 IEEE International Conference on Electronics, Circuits and Systems, Monte Carlo, Monaco, 11–14 December 2016; pp. 161–164. [Google Scholar]
  17. Costa, H.M.; Tavares, M.C. Removing Harmonic Power Line Interference from Biopotential Signals in Low Cost Acquisition Systems. Comput. Biol. Med. 2009, 39, 519–526. [Google Scholar] [CrossRef] [PubMed]
  18. Mneimneh, M.A.; Yaz, E.E.; Johnson, M.T.; Povinelli, R.J. An Adaptive Kalman Filter for Removing Baseline Wandering in ECG Signals. In Proceedings of the Computers in Cardiology, Valencia, Spain, 17–20 September 2006; pp. 253–256. [Google Scholar]
  19. Chimene, M.F.; Pallas-Areny, R. A Comprehensive Model for Power-Line Interference in Biopotential Measurements. In Proceedings of the 16th IEEE Instrumentation and Measurement Technology Conference, Venice, Italy, 24–26 May 1999; Volume 1, pp. 573–578. [Google Scholar]
  20. Zhang, J.; Wang, L.; Yu, L.; Yang, Y.; Zhang, Y.; Li, B. A Low-Offset Analogue Front-End IC for Multi-Channel Physiological Signal Acquisition. In Proceedings of the 2009 Annual International Conference of the IEEE Engineering in Medicine and Biology Society, Minneapolis, MN, USA, 3–6 September 2009; pp. 4473–4476. [Google Scholar]
  21. Spinelli, E.M.; Martinez, N.H.; Mayosky, M.A. A Transconductance Driven-Right-Leg Circuit. IEEE Trans. Biomed. Eng. 1999, 46, 1466–1470. [Google Scholar] [CrossRef] [PubMed]
  22. Tomasini, M.; Benatti, S.; Milosevic, B.; Farella, E.; Benini, L. Power Line Interference Removal for High-Quality Continuous Biosignal Monitoring with Low-Power Wearable Devices. IEEE Sens. J. 2016, 10, 3887–3895. [Google Scholar] [CrossRef]
  23. Keshtkaran, M.R.; Yang, Z. A Robust Adaptive Power Line Interference Canceler VLSI Architecture and Asic for Multichannel Biopotential Recording Applications. IEEE Trans. Circuits Syst. II Exp. Briefs 2014, 61, 788–792. [Google Scholar] [CrossRef]
  24. Alnasser, E. The Stability Analysis of a Biopotential Measurement System Equipped with Driven-Right-Leg and Shield-Driver Circuits. IEEE Trans. Instrum. Meas. 2014, 63, 1731–1738. [Google Scholar] [CrossRef]
  25. Sudirman, R.; Zakaria, N.A.; Jamaluddin, M.N.; Mohamed, M.R.; Khalid, K.N. Study of Electromagnetic Interference to ECG Using Faraday Shield. In Proceedings of the Third Asia International Conference on Modelling & Simulation, Bali, Indonesia, 25–29 May 2009; pp. 745–750. [Google Scholar]
  26. Lee, S.M.; Sim, K.S.; Kim, K.K.; Lim, Y.G.; Park, K.S. Thin and Flexible Active Electrodes with Shield for Capacitive Electrocardiogram Measurement. Med. Biol. Eng. Comput. 2010, 48, 447–457. [Google Scholar] [CrossRef] [PubMed]
  27. Sullivan, T.J.; Deiss, S.R.; Cauwenberghs, G. A Low-Noise, Non-Contact Eeg/Ecg Sensor. In Proceedings of the Biomedical Circuits and Systems Conference, Montreal, QC, Canada, 27–30 November 2007; pp. 154–157. [Google Scholar]
  28. Yacoub, S.; Raoof, K. Power Line Interference Rejection from Surface Electromyography Signal Using an Adaptive Algorithm. IRBM 2008, 29, 231–238. [Google Scholar] [CrossRef]
  29. Jayant, H.K.; Rana, K.P.S.; Kumar, V.; Nair, S.S.; Mishra, P. Efficient Iir Notch Filter Design Using Minimax Optimization for 50 Hz Noise Suppression in ECG. In Proceedings of the 2015 International Conference on Signal Processing, Computing and Control (ISPCC), Waknaghat, India, 24–26 September 2015; pp. 290–295. [Google Scholar]
  30. Liang, Q.; Ming, Y.E. Design of Digital Trap Filter for Reducing Power Line Interference in Semg. Comput. Eng. Appl. 2009, 45, 61–63. [Google Scholar]
  31. Spinelli, E.M.; Mayosky, M.A. Two-Electrode Biopotential Measurements: Power Line Interference Analysis. IEEE Trans. Biomed. Eng. 2005, 52, 1436–1442. [Google Scholar] [CrossRef] [PubMed]
  32. Mitov, I.P. A Method for Reduction of Power Line Interference in the ECG. Med. Eng. Phys. 2004, 26, 879. [Google Scholar] [CrossRef] [PubMed]
  33. Dotsinsky, I.; Stoyanov, T. Power-Line Interference Removal from ECG in Case of Power-Line Frequency Variations. Int. J. Bioautom. 2008, 3, 334–340. [Google Scholar]
  34. Hamilton, P.S. A Comparison of Adaptive and Nonadaptive Filters for Reduction of Power Line Interference in the ECG. IEEE Trans. Biomed. Eng. 1996, 43, 105–109. [Google Scholar] [CrossRef] [PubMed]
  35. Kaur, M.; Singh, B. Powerline Interference Reduction in ECG Using Combination of Ma Method and Iir Notch. Int. J. Recent Trends Eng. 2009, 2, 125–129. [Google Scholar]
  36. Huang, C.-C.; Liang, S.-F.; Young, M.-S.; Shaw, F.-Z. A Novel Application of the S-Transform in Removing Powerline Interference from Biomedical Signals. Physiol. Meas. 2008, 30, 13–27. [Google Scholar] [CrossRef] [PubMed]
  37. Avendano-Valencia, L.D.; Avendano, L.E.; Ferrero, J.M.; Castellanos-Dominguez, G. Improvement of an Extended Kalman Filter Power Line Interference Suppressor for ECG Signals. In 2007 Computers in Cardiology; IEEE: Piscataway, NJ, USA, 2007; pp. 553–556. [Google Scholar]
  38. Mewett, D.T.; Reynolds, K.J.; Nazeran, H. Reducing Power Line Interference in Digitised Electromyogram Recordings by Spectrum Interpolation. Med. Biol. Eng. Comput. 2004, 42, 524–531. [Google Scholar] [CrossRef] [PubMed]
  39. Ziarani, A.K.; Konrad, A. A Nonlinear Adaptive Method of Elimination of Power Line Interference in ECG Signals. IEEE Trans. Biomed. Eng. 2002, 49, 540. [Google Scholar] [CrossRef] [PubMed]
  40. Weiting, Y.; Runjing, Z. An Improved Self-Adaptive Filter Based on Lms Algorithm for Filtering 50 Hz Interference in ECG Signals. In Proceedings of the 2007 8th International Conference on Electronic Measurement and Instruments, Xi’an, China, 16–18 August 2007; IEEE: Piscataway, NJ, USA, 2007; pp. 3-874–3-878. [Google Scholar]
  41. Keshtkaran, M.R.; Yang, Z. A Fast, Robust Algorithm for Power Line Interference Cancellation in Neural Recording. J. Neural Eng. 2014, 11, 026017. [Google Scholar] [CrossRef] [PubMed]
  42. Isaksen, J.; Leber, R.; Schmid, R.; Schmid, H.J.; Generali, G.; Abächerli, R. The First-Order High-Pass Filter Influences the Automatic Measurements of the Electrocardiogram. In Proceedings of the 2016 IEEE International Conference on Acoustics, Speech and Signal Processing (ICASSP), Shanghai, China, 20–25 March 2016; pp. 784–788. [Google Scholar]
  43. Acharya, D.; Rani, A.; Agarwal, S. EEG Data Acquisition Circuit System Based on ADS1299EEG-FE. In Proceedings of the 2015 4th International Conference on Reliability, Infocom Technologies and Optimization (ICRITO), Noida, India, 2–4 September 2015; IEEE: Piscataway, NJ, USA, 2015; pp. 1–5. [Google Scholar]
  44. D’Ausilio, A. Arduino: A Low-Cost Multipurpose Lab Equipment. Behav. Res. Methods 2012, 44, 305–313. [Google Scholar] [CrossRef] [PubMed]
  45. Reverter, F.; Li, X.; Meijer, G.C.M. Stability and Accuracy of Active Shielding for Grounded Capacitive Sensors. Meas. Sci. Technol. 2006, 17, 2884. [Google Scholar] [CrossRef]
  46. Schagrin, M.L. Resistance to Ohm’s Law. Am. J. Phys. 1963, 31, 536–547. [Google Scholar] [CrossRef]
  47. Haberman, M.A.; Spinelli, E.M.; García, P.A.; Guerrero, F.N. Capacitive Driven-Right-Leg Circuit Design. Int. J. Biomed. Eng. Technol. 2015, 17, 115. [Google Scholar] [CrossRef]
Figure 1. Schematic diagram of the data acquisition system, the subject; different shielded drive methods proposed in this study; ADS1299EEG-FE kit, where EEG_FE refers to analog front-end designed for electroencephalography, GND is the ground of the power supply, and CH means the input channel index of the kit; Arduino Microcontroller Unit (MCU); the laptop.
Applsci 08 00276 g001
Figure 2. Schematic diagram of the different shielded drive methods investigated in this study.
Applsci 08 00276 g002
Figure 3. ADS1299EEG-FE functional block diagram.
Applsci 08 00276 g003
Figure 4. Electrodes location diagram: (a) shows the location of the electrodes for electrocardiogram (ECG) acquisition; (b) shows the location of the electrodes for electro-oculogram (EOG) acquisition; (c) shows the location of the electrodes for electromyography (EMG) acquisition.
Applsci 08 00276 g004
Figure 5. EMG acquisition setup with the introduction of electrode lead jitter.
Applsci 08 00276 g005
Figure 6. The comparison of the time waveforms (a) and spectra (b) of the ECG signals (subject #11) under different conditions. The 50Hz notch condition (2nd row) was obtained by applying 50 Hz notch filter (software) to raw data of the No-Shield condition (1st row).
Applsci 08 00276 g006
Figure 7. The comparison of the time waveforms (a) and spectra (b) of the EOG signals (subject #7) under different conditions. The 50Hz notch condition (2nd row) was obtained by applying 50 Hz notch filter (software) to raw data of the No-Shield condition (1st row).
Applsci 08 00276 g007
Figure 8. The comparison of the time waveforms (a) and spectra (b) of the EMG signals (subject #4) under different conditions. The 50 Hz notch condition (2nd row) was obtained by applying 50 Hz notch filter (software) to raw data of the No-Shield condition (1st row).
Applsci 08 00276 g008
Figure 9. Mean spectral amplitude of 50 Hz interference (averaged across all subjects) of the four different shielded methods under three different experimental sessions: ECG, EOG and EMG experiments.
Applsci 08 00276 g009
Figure 10. The time waveforms of the recorded signals (subject #15) with the electrode lead cables initially kept still (0–1 s) and then shaken simultaneously (1–2 s) for the four different shielded conditions.
Applsci 08 00276 g010
Figure 11. The capacitive coupling model for the power line interference for GND-Shield and Active-Shield methods.
Applsci 08 00276 g011
Figure 12. Equivalent circuit of one electrode for the Active-Shield method: (a) equivalent circuit of the amplifier and the capacitive coupling introduced by the mains power, (b) the equivalent voltage divider circuit of the amplifier.
Applsci 08 00276 g012
Figure 13. Transmission line model of the electrode cable for GND-Shield and Active-Shield methods.
Applsci 08 00276 g013
Table 1. Performance of three shielded methods (Method 2, Method 3, and Method 4) relative to the unshielded method (Method 1) in suppressing the 50 Hz power line interference for different experiments, The ECG, EOG and EMG Experiments represent recording sessions of electrocardiogram, electro-oculogram, and electromyography signals, respectively.
M1–M2 (dB)M1–M3 (dB)M1–M4 (dB)
ECG Experiment19.323.532.0
EOG Experiment12.617.345.8
EMG Experiment15.518.036.9
Note: M1, M2, M3 and M4 represent the spectrum values at the 50 Hz power line interference for the signal recordings of Method 1, Method 2, Method 3 and Method 4, respectively.

