Towards New Mappings between Emotion Representation Models

Department of Software Engineering, Faculty of Electronics, Telecommunications and Informatics, Gdansk University of Technology, 80-233 Gdansk, Poland
Appl. Sci. 2018, 8(2), 274; https://doi.org/10.3390/app8020274
Submission received: 24 November 2017
/
Revised: 10 January 2018
/
Accepted: 9 February 2018
/
Published: 12 February 2018
(This article belongs to the Special Issue Socio-Cognitive and Affective Computing)
Abstract
:Featured Application
(1) When you need emotions described in one representation model and get results in another form from an affect recognition system; (2) In a late fusion of hypotheses on affect from diverse algorithms (in multimodal emotion recognition); (3) In an evaluation of mappings between emotion representation models.
Abstract
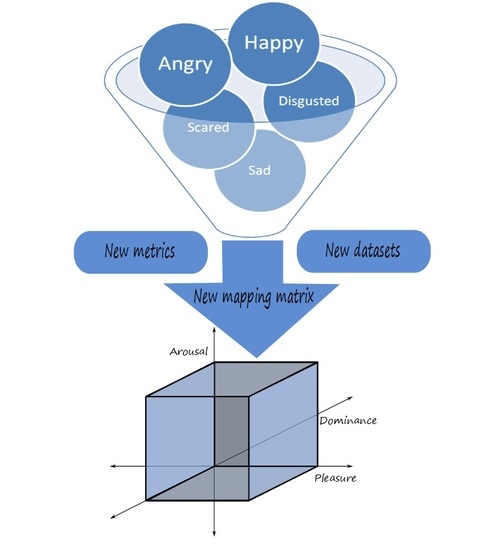
There are several models for representing emotions in affect-aware applications, and available emotion recognition solutions provide results using diverse emotion models. As multimodal fusion is beneficial in terms of both accuracy and reliability of emotion recognition, one of the challenges is mapping between the models of affect representation. This paper addresses this issue by: proposing a procedure to elaborate new mappings, recommending a set of metrics for evaluation of the mapping accuracy, and delivering new mapping matrices for estimating the dimensions of a Pleasure-Arousal-Dominance model from Ekman’s six basic emotions. The results are based on an analysis using three datasets that were constructed based on affect-annotated lexicons. The new mappings were obtained with linear regression learning methods. The proposed mappings showed better results on the datasets in comparison with the state-of-the-art matrix. The procedure, as well as the proposed metrics, might be used, not only in evaluation of the mappings between representation models, but also in comparison of emotion recognition and annotation results. Moreover, the datasets are published along with the paper and new mappings might be created and evaluated using the proposed methods. The study results might be interesting for both researchers and developers, who aim to extend their software solutions with affect recognition techniques.
1. Introduction
This paper concerns one of the challenges in automatic multimodal affect recognition, i.e., mapping between emotion representation models. There are numerous emotion recognition algorithms that differ on input information channels, output labels, and representation models and classification methods. The most frequently used emotion recognition techniques that might be considered when designing an emotion monitoring solution include: facial expression analysis, audio (voice) signal analysis in terms of modulation, textual input analysis, physiological signals and behavioral patterns analysis. As literature on emotion recognition methods is very broad and has already been summarized several times, for an extensive bibliography, one may refer to Gunes and Piccardi [1] or Zeng et al. [2].
Hupont et al. claim that multimodal fusion improves robustness and accuracy of human emotion analysis. They observed that current solutions mostly use one input channel only and integration methods are regarded as ad-hoc [3]. Late fusion combines the classification results provided by separate classifiers for every input channel; however, this requires some mapping between emotion representation models used as classifier outputs [3]. Differences in emotion representation models used by emotion recognition solutions are among the key challenges in fusing affect from the input channels.
This paper concentrates on the challenge of mapping between emotion representation models. The purpose of the paper is to propose a method (including a set of metrics) for an evaluation of the mapping accuracy, as well as to propose a new mapping. The main research question addressed in this study is as follows: How to compare results from multiple emotion recognition algorithms, especially when they are provided in different affect representation models?
The studies related to this research fall into two categories: (1) emotion representation models, which are used as an output of affect recognition solutions; and (2) research on mapping algorithms between the models.
(1) There are three major model types of emotional state representation: discrete, dimensional and componential [4]. Discrete models distinguish a set of basic emotions (word labels) and describe each affective state as belonging to a certain emotion from the predefined set. A significant group of emotion recognition algorithms uses emotion representation based on labels only, e.g., distinguishing stress from a no-stress condition [5]. The label-based representation causes serious integration problems, when the label sets are different. Fuzziness of linking concepts with words and a problem of semantic disambiguation are the key issues causing the difficulty. One of the best known and extensively adapted discrete representation model is Ekman’s six basic emotions model, which includes joy, anger, disgust, surprise, sadness and fear [6]. Although the model was not initially proposed for emotion recognition, it is the one used most frequently, for example in e-learning affect-aware solutions [7]. Simple affective applications, such as games, frequently use very simple models of two or three labels [8,9]. Furthermore, some more sophisticated solutions, applied in e-learning, incorporating affect recognition, use their own discrete label set [10,11,12].
Dimensional models represent an emotional state as a point in a multi-dimensional space. The circumplex model of affect, one of the most popular dimensional models, was proposed by Russell [13]. In this model, any emotion might be represented as a point in a space of two continuous dimensions of valence and arousal. The valence (pleasure) dimension differentiates positive from negative emotions, while the dimension of arousal (activation) enables a differentiation between active and passive emotional states. Both dimensions are continuous with neutral affective states represented in the middle of the scale [14]. The model was repeatedly extended with new dimensions, such as dominance and imageability. One of the extended models found some applications in affective computing, for example, the PAD (pleasure-arousal-dominance) model [15,16]. Furthermore, Ekman’s six emotions model has been adapted as a dimensional model with each emotion forming one dimension (sometimes a dimension for neutral state is also added). The dimensional models are frequently used by the emotion recognition algorithms and off-the-shelf solutions. Dimensional adaptation of Ekman’s six basic emotions is used for solutions based on facial expressions, and Facial Action Coding Scheme (FACS) is the most widely implemented technique [17]. Sentiment analysis of textual inputs (used in opinion mining) mainly explores the valence dimension of the Circumplex/PAD model [18]. Emotion elicitation techniques based on physiology mostly report only on the arousal dimension [19], as positive and negative experiences might cause a similar activation of the nervous system.
Componential models use several factors that constitute or influence the resulting emotional state. The OCC model proposed by Ortony, Clore and Collin defines a hierarchy of 22 emotion types representing all possible states which might be experienced [20]. In contrast to discrete or dimensional models of emotions, the OCC model takes into account the process of generating emotions. However, several papers outline that the 22 emotional categories need to be mapped to a (possibly) lower number of different emotional expressions [21,22].
The analysis of the emotion recognition solutions reveals that there is no one commonly accepted standard model for emotion representation. Dimensional adaptation of Ekman’s six basic emotions and the Circumplex/PAD model are the ones widely adopted in emotion recognition solutions. The problem of mapping is multifaceted, including mapping between dimensional and discrete representations, as well as mapping among different dimensional models. There are several solutions to the first issue: using weights, representing discrete labels as points in dimensional spaces and so on. However, the paper concentrates on the latter issue of mapping between dimensional representations. Appreciating label-based and componential models, a further part of this study focuses on mapping between dimensional models only.
(2) There are few studies on mapping between emotion representation models. The papers provide mapping techniques that enable conversions among a personality model, an OCC model and a PAD model of emotion. The mappings have a significant explanatory value of how personality characteristics, moods and emotions are interrelated [16,23]. However, as the personality model is not used in emotion recognition, they are not directly applicable in this study. Exploration of the literature provides one model of mapping between Ekman’s five basic emotions and the PAD model [24]. The mapping technique reported in [23,24] provides a linear mapping based on a matrix of coefficients provided in Equation (1).
The mapping has been used in several further studies [25,26] and remains the most popular one. The existing matrix was not trained on any dataset, instead it was derived from an OCC model. The existing matrix might be considered rather as a theoretical model than a model based on evidence. Nevertheless, this is the only known mapping matrix; therefore, we use it as a reference, as there is no other one to compare our solution to. One might notice, that out of six emotions in Ekman’s basic set, the mapping utilizes only five, excluding surprise. An analysis of late fusion studies reveals that two approaches are applied: all emotion recognition algorithms use the common representation model as an output [1], or all representations are mapped into a Circumplex/PAD model of emotions. According to the author’s best knowledge, no method nor metrics have been proposed so far for evaluation of the mapping accuracy. No alternative mapping to the one presented in Equation (1) is known to the author.
The study presented in this paper aims at proposing a procedure and metrics to evaluate mapping accuracy, as well as elaborating a new mapping between Ekman’s six basic emotions and the Pleasure-Arousal-Dominance Model. The only known mapping, as reported above, is used as a reference in the evaluation procedure. The thesis of the paper was formulated as follows: The proposed metrics set and procedure allows to develop and evaluate mappings between dimensional emotion representation models.
2. Materials and Methods
In this study, mapping techniques among two emotion representation models—Ekman’s six basic emotions (dimensional extension) and the PAD model—are explored in detail, using three datasets retrieved from affect-annotated lexicons. In this section, we report: (1) the procedure for obtaining and evaluation of the mapping; (2) the datasets construction; and (3) the metric set used in the evaluation process.
2.1. The Procedure
The procedure of this study was as follows:
- (1)
- Preparation of the datasets to train, test and validate the mapping.
- (2)
- Setting up the metrics and thresholds (mapping precision).
- (3)
- Estimation using the state-of-the-art mapping matrix (for reference).
- (4)
- Training new models for mapping with linear regression.
- (5)
- Within-set and cross-set evaluation of the proposed new mapping.
The procedure proposed in this study, and especially the metric set and the datasets, might be used in further research for creating more mapping models using classifiers and a machine learning approach. The steps are described in detail in the following paragraphs.
2.2. The Datasets
There are at least two approaches that might be considered for obtaining new mappings between emotion representation models. The first one is to use a set of heuristics based on expert (psychological) knowledge, and that approach was the basis for creation of the state-of-the-art matrix. The second approach is to find a dataset that is annotated with both emotion representation models and to use statistical or machine learning techniques to find a mathematical model for the mapping. The latter approach was chosen for this study. The datasets were obtained by pairing lexicons of affect-annotated words.
The evaluation sets were retrieved from affect-annotated lexicons that use PAD and/or a dimensional adaptation of Ekman’s six basic emotions model. The available lexicons might be created by manual, automatic or semi-automatic annotation [27]. As we wanted to use the data retrieved from the lexicons as the “ground truth”, only the lexicons with manual annotations were taken into account. The following lexicons were used in this study (historical order):
- (1)
- The Mehrabian and Russel lexicon. This lexicon is a relatively old one, as it was developed and published in 1977 by Mehrabian and Russel [28]. It was developed by manual annotation of English words and contains 151 words. The annotators used a PAD model for representation of emotions for the first time and the PAD model has been a reference model ever since then. The annotated sets include mean and standard deviations of evaluations per dimension provided for all participants. Sample words with annotations are presented in Table 1.There are at least two observations derived from studying the lexicon: firstly, some words are more ambiguous than others; and, secondly, some dimensions are more ambiguous than others (distribution of standard deviations differs).
- (2)
- The ANEW Lexicon. The ANEW lexicon was initially developed for English [29], but has many national adaptations. The lexicon contains the most frequently used words (1040). Annotation is based on a PAD model, and mean as well as standard deviations per dimension are provided. Sample words with annotations are presented in Table 2.Please note the difference in scaling the dimensions for Russel and Mehrabian’s and ANEW lexicons. Re-scaling is required for comparisons.
- (3)
- The Synesketch lexicon. Synesketch [30] contains 5123 English words annotated manually with overall emotion intensity and Ekman’s six basic emotions (anger, joy, surprise, sadness, disgust and fear). The Synesketch lexicon was found partially invalid from the viewpoint of this study—some words had no annotations in any of the dimensions of the basic six emotion set. The all-zeros vector might be interpreted in two ways: a case of neutral annotation or an error. An additional feature provided within the lexicon (overall emotion intensity) was used to differentiate the two cases. If overall emotion intensity was assigned a non-zero value and the other dimensions were not, the vector was considered invalid and excluded from further analysis. Sample words with annotations are presented in Table 3.
- (4)
- The NAWL lexicon. The fourth of the lexicons, NAWL (Nencki Affective Word List), was manually annotated twice by a significant number of annotators using two different representation models, forming a natural set for this study [31,32]. The models used for annotation were: pleasure-arousal-imageability and a subset of Ekman’s six, namely: happiness, anger, disgust, sadness and fear. Please note, that for this set the dimensions of dominance and surprise are omitted. The imageability dimension as an additional one was not used in this study. The annotated set includes mean and standard deviations of evaluations per dimension provided for all participants and also for males and females separately. All participants’ metrics are used in this study. The number of words in the lexicon is 2902. Sample words with annotations are presented in Table 4.
As the lexicons, and even sometimes the dimensions within one lexicon, were annotated with different scales, re-scaling was performed for comparability of the results for different set and dimensions. A scale of <0.1> was chosen for all dimensions. Re-scaling followed the definitions of mean and standard deviation for addition and multiplication.
The lexicons were automatically paired, which required finding a common subset of words, then the operation of the pair-wise (same word) concatenation of the two annotations was performed. As a result of this pairing procedure, the following datasets were created for this study:
(1) The ANEW-MEHR dataset
The dataset was a result of pairing ANEW and Russel and Mehrabian’s lexicons [28,29]. The common subset of words is the same as for the latter (smaller) lexicon (151 words). Please note that, in this dataset, there are two independent annotations in the PAD scale paired and no annotation in Ekman’s dimensions. The set was created purposefully for estimating residual error, that is a result of pairing two independent mappings. The metric values, calculated based on the dataset, might be treated as marginal accuracies that might be obtained from the mappings based on pairing lexicons. The detailed specification of the dataset is provided in Appendix A.
(2) The SYNE-ANEW dataset
The second set used in this study was paired based on ANEW [29] and Synesketch [30] lexicons. Only a common subset of words was used as an evaluation set (267 words). The set uses all dimensions of the PAD model (including dominance) and uses a complete set of Ekman’s six basic emotions (including surprise). The detailed specification of the dataset is provided in Appendix B.
(3) The NAWL-NAWL dataset
As in NAWL, [31,32], a list of words was annotated twice, the creation of the dataset was (almost) automatic—the only operation to perform was a pair-wise (same word!) concatenation of the two annotations from separate files. The word count equals the size of the lexicon (2902). The size of the lexicon makes it preferable over other datasets: however, one must note that the dataset does not include dimensions of dominance and surprise. The detailed specification of the dataset is provided in Appendix C.
As the sets might be considered complementary rather than competitive, all three are employed in this mapping technique elaboration study. The datasets are available as a supplementary material.
2.3. Metric Set
While evaluating classifiers (and the emotion recognition algorithm is one of these), precision and accuracy are the most popular metrics. Regression models (with continuous outputs) are typically measured by MAE (mean average error), RMSE (root mean squared error) or R2 metric. All the typically used metrics are invariant to the required precision of the estimate and prone to misinterpretation if the variance of estimate error is high. Mapping between two emotion representation models might be very accurate, if the differences are calculated using precise numbers. However, with all the fuzziness related to emotion concepts, high precision might be misleading. Mathematically, we could find a difference of 0.01 in (−1, 1) scale, but this would not make sense in interpreting the emotion recognition result. Therefore, apart from typical measures of regression model evaluation, a number of metrics was proposed within this study that measures accuracy above a given precision threshold. Moreover, two approaches were adapted, treating dimensions independently and jointly (as 3D space). The definition of the proposed metric set follows. Both the proposed and typical metrics for estimate error are reported within the results section.
2.3.1. Precision in Emotion Recognition
The word annotations, with regard to sentiment, as well the emotional states themselves, are fuzzy and even sometimes ambiguous. One might note that, together with an average annotation of the word, standard deviation is reported. On the other hand, in most of the applications of affect recognition, the decisions are based on simple models, for example, two or three classes of emotions. Therefore, in most of the cases, small mathematical differences in emotion estimates are not interpretable within the application context. In this study, I proposed to use the following precision estimates: (1) absolute distance (mathematical concept equivalent to MAE (mean absolute error)); (2) distance size smaller than 10% of the scale; (3) distance size smaller than 20% of the scale; and (4) distance size smaller than standard deviation of the evaluations (if available). The latter approach uses an additional feature available for the sets, i.e., standard deviation. Please note that the metric thresholds for precision might be adjusted, whenever necessary.
2.3.2. Metrics for the Dimensions Treated Independently
The independently treated dimensions are operationalized with the following metrics (if variables in consecutive equations are assigned the same definition, the definitions are not repeated):
MAE mean absolute distance between the actual and the estimated emotional state per dimension
where
- xi—the dimension value for ith word (retrieved from the lexicon).
- –the dimension value for ith word (estimated using mapping).
- n–number of words within the set.
- X.
M10 relative number of estimates that differ from the actual value by less than 10% of the scale
where
- m10—number of estimates that differ from the actual value by less than 10% of the scale.
M20 relative number of estimates that differ from the actual value by less than 20% of the scale
where
- m20—number of estimates that differ from the actual value less than 20% of the scale.
MSD relative number of estimates that differ from the actual value by less than standard deviation size
where
- mSD—number of words, for which absolute difference between the estimate and the actual value is smaller than the standard deviation for the word.
2.3.3. Metrics for the Joint Dimensions Accuracy
The joint dimensions accuracy was operationalized with the following metrics:
PADabs mean absolute distance between the actual and the estimated emotional state in PAD space (calculated using Pythagorean theorem):
where
- ddi—direct distance between estimated and actual emotion calculated for all dimensions using Pythagorean theorem.
- pi, ai, di—the dimension value for ith word (retrieved from the lexicon).
- —the dimension value for ith word (estimated using mapping).
- n—number of words within the set.
(PAD10) relative number of estimates that differ from the actual value by less than 10% of the scale in each dimension.
where
- all10—number of words, for estimates, that differ from the actual value by less than 10% of the scale in each dimension.
(PAD20) relative number of estimates that differ from the actual value less than 20% of the scale in each dimension.
where
- all20—number of estimates that differ from the actual value by less than 20% of the scale in each dimension,
(PADSD) relative number of estimates that differ from the actual value for less than standard deviation size
where
- allSD—number of words, for which absolute difference between the estimate and the actual value is smaller than the standard deviation for the word.
(DD10) relative number of estimates that have direct distance from the estimate smaller than 10% of the scale.
where
- dd10—number of words, for which absolute distance between the estimate and the actual value (ddi) calculated for all dimensions is smaller than 10% of the scale.
(DD20) relative number of estimates that have direct distance from the estimate smaller than 10% of the scale.
where
- dd20—number of words, for which absolute distance between the estimate and the actual value (ddi) calculated for all dimensions, is smaller than 20% of the scale.
The above presented set of metrics (four per dimension and six joint-dimensions metrics) are used in the further analysis as accuracy measures.
2.4. Evaluation Calculations
Firstly, the lexicons were re-scaled and paired (details are provided in Section 2.2) forming datasets for further study. Then, the calculations held within the study were performed with Knime analytical tool as described below.
For estimating residual error of pairing lexicons, the ANEW-MEHR dataset was processed with the following steps: (1) calculation of absolute difference for valence, arousal and dominance dimensions per word; (2) calculation of typical metrics (MAE, RMSE, and R2) for the dataset; (3) calculation of absolute distance in 3D model of emotions per word; (4) comparison with thresholds per word; and (5) calculation of frequency, and threshold-based metrics. The results are reported in Section 3.1.
For reference model mapping evaluation, two datasets, SYNE-ANEW and NAWL-NAWL, were processed with the same procedure: (1) application of the reference mapping to the dataset, adding columns of predicted valence, arousal and dominance; (2) calculation of absolute difference between the actual and predicted values of dimension per word; (3) calculation of typical metrics (MAE, RMSE, and R2) for the dataset; (4) calculation of absolute distance in 3D model of emotions per word; (5) comparison with thresholds per word; and (6) calculation of frequency and threshold-based metrics. The results are reported in Section 3.2.
For obtaining and evaluating new mapping matrices, two datasets, SYNE-ANEW and NAWL-NAWL, were processed independently using the same procedure: (1) the linear regression model was trained and a mapping matrix was obtained for the set using a ten-fold cross-validation scheme with a random selection of words to separate training and validation subsets and the obtained result sets included both the actual and the estimated value of dimensions per word; (2) calculation of absolute difference between the actual and predicted values of dimension per word; (3) calculation of typical metrics (MAE, RMSE, and R2) for the dataset; (4) calculation of absolute distance in a 3D model of emotions per word; (5) comparison with thresholds per word; and (6) calculation of frequency- and threshold-based metrics. The proposed matrices are reported in Section 3.3, while the 10-fold cross-validation results are reported in Section 3.4.
Additionally, the cross-set validation was performed for the evaluation of generalizability using the following scheme: (1) application of the new mapping matrix obtained from ANEW_SYNE to the NAWL-NAWL dataset, adding columns of predicted valence, arousal and dominance; (2) calculation of absolute difference between the actual and predicted values of dimension per word; (3) calculatiaon of typical metrics (MAE, RMSE, and R2) for the dataset; (4) calculation of absolute distance in a 3D model of emotions per word; (5) comparison with thresholds per word; and (6) calculation of frequency- and threshold-based metrics. The results are reported in Section 3.5.
3. Results
Study results are reported for the evaluation sets defined in Section 2.2 and with the metrics operationalized in Section 2.3.
3.1. The Margin Accuracies—Calculations for the ANEW-MEHR Dataset
The ANEW and Russel and Mehrabian’s lexicons are both independently created and use the same PAD model for annotation. The differences (averaged over all words) among the annotations derived from the two lexicons are used in this study as an estimate of residual error, that is the result of pairing two independent mappings. The metric values are provided in Table 5.
The observations derived from pairing the annotations using the same PAD model are the following:
- -
- There is a non-zero residual error for mapping based on pairing independent affect-annotated lexicons.
- -
- The residual error is diverse among the dimensions within the PAD model—it is lowest for valence (P), higher for arousal (A) and the highest for dominance (D). This observation is compliant with results of dimensions understanding reported in literature (dominance is the least understood dimension resulting in more ambiguous annotation results).
- -
- For a threshold of 10% of the scale, 80.6% of words for valence, 57.1% of words for arousal, and 62.5% for dominance have consistent annotations; for a threshold of 20% of the scale, 95.5% of words for valence, 92% of words for arousal, and 90.2% for dominance have consistent annotations. This observation is compliant with a typical precision-accuracy trade-off.
- -
- Considering the ambiguity of annotations, it is advisable to use the metrics based on the standard deviation for annotated words, as using the same set threshold value for every dimension might cause misinterpretation of accuracy results.
- ∙
- The traditional metrics (MAE, RMSE and R2) allow for the interpretation of dimensions independently; however, in practical settings, it would be important to have a mapping that deals with all dimensions within the set threshold; the proposed metrics: PAD10, PAD20, PADSD, DD10 and DD20 allow for the interpretation of the mapping accuracies for all dimensions together (treating the PAD model as a typical 3D space).
The residual error obtained from the comparison will be used for reference in an interpretation of the results obtained in the study.
3.2. The Reference Mapping Accuracies for the SYNE-ANEW and NAWL-NAWL Datasets
The mapping matrix derived from literature and reported as in Equation (1) was used as a reference model for the model proposed in this study. The results of mapping using the known matrix for the two datasets: SYNE-ANEW and NAWL-NAWL are provided in Table 6 and Table 7, consecutively.
The absolute measures for the dataset show small differences between the dimensions. A relatively high mean distance is obtained for joined dimensions, which is partially explained by cumulating errors from all dimensions, as the metric PADABS is calculated based on the geometrical distance in 3D space.
It seems that setting a proper threshold is crucial and has an enormous influence on the resulting metrics (precision-accuracy trade-off). For a high precision (10% of the scale), accuracy results are around 25% for valence, 24% for arousal, and 23% for dominance. With lower precision requirements, the accuracies increase (46% for valence, 48% for arousal, and 45% for dominance). Setting the accuracy threshold based on standard deviation per word increases accuracies above 55% for the dimensions of arousal and dominance.
The joined dimensions accuracies are lower than for separate dimensions, which could have been expected. If for one dimension mapping is precise, it might not be for the other one and, as a result, the errors cumulate over dimensions. Therefore, we have only 1.5% accuracy for an expected precision of 10% of the scale, 14.6% accuracy for 20% precision and 25.8% for SD-based precision.
For the second dataset, the mapping accuracies are higher for all precision thresholds. This might be a result of the set size and quality (the set is derived from one lexicon purposefully annotated twice); however, one must notice the lack of Surprise and Dominance dimensions among the annotation labels. Please note, that due to the latter limitation, the results between the two sets are comparable for the single-dimension metrics, but incomparable for joint-dimensions metrics. Accuracies are still dependent on the set precision threshold.
As precision and accuracy are interchangeable, one might go further in proposing new thresholds. Perhaps, the acceptable precision should be set case-by-case, as this might depend on the context of the emotion recognition.
The accuracy results obtained for the known matrix show some room for improvement, especially for higher precision requirements and regarding all dimensions. The results justify undertaking this study towards new mappings.
3.3. The Proposed Mapping Matrices
Two mapping matrices were obtained using linear regression learning with SYNE-ANEW and NAWL-NAWL datasets. The procedure involved a 10-fold cross-validation with linear regression coefficients averaged over repetitions. Cross-validation is a validation technique for assessing how the results of a prediction model would generalize to an independent data set. It is a well-established alternative to the hand-made partitioning of a dataset to training and validation subsets for regression models [33]. One round of cross-validation involves partitioning a sample of data into complementary subsets, performing the analysis on one subset (training set), and validating the analysis on the other subset (validation set). Multiple rounds of partitioning are performed and the validation results are averaged over the rounds to evaluate the model. There are several methods of performing cross-validation [34]. In this procedure, a k-fold technique was used, with 10 folds. In 10-fold cross-validation, the original sample was partitioned randomly into 10 sub-samples of equal size. In a single fold, a single subsample was retained as the validation set, and the remaining nine sub-samples were used as training data. As a result, each of the 10 sub-samples was used exactly once as the validation data. The partitioning was randomized, and the cross-validation procedure was performed using Knime analytical tool.
The cross-validation procedure was repeated 10 times. The matrix coefficients obtained via repetition were similar (with differences <0.03 for all matrix coefficients) and were averaged over the 10 resulting models.
The two resulting matrices are provided as Equations (13) and (14) consecutively. The existing mapping matrix from literature was repeated with a column shuffle in Equation (15) for comparison.
3.4. The Proposed Mapping Accuracies for the SYNE-ANEW and NAWL-NAWL Datasets
For evaluation of the new mapping matrices, a 10-fold cross-validation procedure was performed, as described in Section 3.3 for the two datasets SYNE-ANEW and NAWL-NAWL independently. Cross-validation results for the datasets are presented in Table 8 and Table 9.
The proposed mapping matrix validation results on the SYNE-ANEW dataset are relatively high. For the dimension of valence, over 33% accuracy was obtained for the 10% precision threshold, while, for the 20% and SD-based precision thresholds, the accuracy was around 60%. For the dimension of arousal and dominance, over 58% accuracy was obtained for the 10% precision threshold, while, for the 20% and SD-based precision thresholds, the accuracy exceeded 90%. Single-dimension results are very promising. However, the joint dimension accuracies are lower. Setting a 10% precision threshold resulted in 17.8% accuracy, while the 20% and SD-based thresholds resulted in 54.9% and 59.9% accuracies, respectively. The observed accuracies are higher than for the reference mapping for the same dataset; however, these might still be insufficient for high precision requirements.
The proposed mapping matrix validation results on the NAWL-NAWL dataset are very high. For the dimension of valence, over 90% accuracy was obtained for all precision thresholds. For the dimension of arousal, over 74% accuracy was obtained for the 10% precision threshold, while, for the 20% and SD-based precision thresholds, the accuracy exceeded 97%. Single-dimension results are satisfactory. The joint dimension accuracies are slightly lower, but still exceed 97% for the 20% and SD-based precision thresholds. The observed accuracies are higher than for the reference mapping for the same dataset.
3.5. Cross-Set Accuracies for the Proposed Mapping
Additionally, the cross-set validation was performed for evaluation of generalizability following the procedure described in Section 2.4. The results are presented in Table 10.
The cross-set validation results on the NAWL-NAWL dataset are moderate: higher than reference mapping, but lower than in cross-validation on the same dataset. This result was expected—usually cross-validation procedures provide higher accuracies. For the dimension of valence: over 56% accuracy was obtained for the 10% precision threshold, while, for 20% and SD-based precision thresholds, the accuracy exceeded 87%. For the dimension of arousal: over 50% accuracy was obtained for the 10% precision threshold, while, for 20% and SD-based precision thresholds, the accuracy exceeded 84%. Single-dimension results are lower than in cross-validation, but still satisfactory for lower precision requirements. The joint dimension accuracies are lower. Setting a 10% precision threshold resulted in 30% accuracy, while the 20% and SD-based thresholds resulted in about 81% accuracies. The observed accuracies are higher than for the reference mapping for the same dataset; however, for high precision requirements this might still be insufficient.
4. Summary of Results and Discussion
The mapping technique using the linear transformation based on a coefficient matrix was evaluated in this study. The results may be summarized in the following statements.
Obtaining both accurate and precise mapping results is a challenge. The results confirm standard observations of precision-accuracy conflict. The mapping model provided is better than a reference model, but still might be insufficient for high precision requirements. The summary of results is provided in Table 11.
In the SYNE-ANEW dataset, the accuracy results are better for the proposed mapping than for the reference mapping. The same applies to the NAWL-NAWL results. In the latter, the results in cross-validation are even better than for the ANEW-MEHR dataset. Interpretation of cross-set evaluation results is limited because the dataset (and obtained matrices) differed in dimension count (for one of the datasets surprise and dominance was missing).
The proposed mapping matrices might be applied in the comparison and fusion of emotion recognition results; however, the required precision must be taken into account. Acceptable precision should be set based on the emotion recognition goals and application context, and especially on the significance of I type and II type error. Using standard deviation as a threshold for precision is one of the promising directions.
The proposed method and metrics for accuracy proved useful and allowed the mapping technique to be evaluated. Please note, that the proposed metrics are:
- dataset-independent: might be applied to any dataset constructed
- scale-independent: due to setting precision thresholds as percent of the scale or SD-based
- model-dependent: they have been proposed specifically for the pleasure-arousal dominance model; however, they might be adapted to any dimensional emotion representation model
- ambiguity-robust: valid for metrics based on the standard deviation threshold: MSD, PADSD
The author acknowledges that this study is not free from some limitations. The most important threats to its validity are listed below.
- (1)
- Only three mapping matrices were explored in detail. Perhaps more models might be proposed or retrieved from the datasets available. A comparison of the mapping accuracies obtained from a different mapping model and the same datasets would provide more insight.
- (2)
- The 10%, 20% and SD measures for threshold were chosen arbitrarily. Other thresholds might be considered for other contexts and input channels. The required precision is dependent on the context of application. Although 20% of the scale might seem a broad precision margin, in most cases, it might be sufficient, as frequently only two classes of emotions are analyzed (e.g., a stress and no-stress condition). Our previous study showed, for example, that for word annotations an intra-rater inconsistency of up to 15% of the scale was encountered in 89.1%, 74.3% and 79.4% of the ratings for valence, arousal and dominance, respectively [35]. Some inconsistency in annotations with affect is imminent due to the ambiguous nature of emotion; therefore, in this study we decided to report results for 10% as well as 20% of the scale, followed by the standard-deviation-based metric.
- (3)
- The evaluation is based only on sets retrieved from affect-annotated lexicons. It is expected that the results might be different for sets based on alternative input channels. However, training a mapping model requires a double annotation of some media (the same word/image/sound/video being assigned values in two emotion representation models). The first challenge in this research was to actually find datasets that are annotated twice, using two different emotion representation models, and that was found true only for the presented lexicons. Basing the mapping on lexicons only might limit the generalizability of the obtained solution, but currently there are no other twice-annotated datasets available.
The new matrices were obtained using the 10-fold cross-validation method for regression model. Cross-validation, although well-established, is also reported as having both advantages and disadvantages. More recent reviews suggest that traditional cross-validation needs to be supplemented with other studies [36]. Therefore, in this study, we report both cross-validation, as well as cross-set evaluation results.
The purpose of the paper was to propose a method and a set of metrics for the evaluation of the mapping accuracy and to propose a new mapping according to the procedure. Despite the limitations, the purpose was achieved, the new mapping was formed, and the thesis the proposed metric set allows for evaluation of emotion model mapping accuracy might be accepted.
Implications of the study include the following:
- (1)
- Affective states recognition algorithms provide estimates that might be wrong or imprecise. Additionally, any mapping between the emotion representation models might enlarge uncertainty related to emotion recognition, as there is non-zero accuracy error for all mappings. Therefore, it is always worthwhile considering an emotion recognition solution that provides an estimate in the representation model and that is better fitted into your context of applications.
- (2)
- The new mapping matrices might be applied when you need emotions described with a PA or PAD model and get Ekman’s six basic emotions vector form the affect recognition system. The mapping might also be found useful in a late fusion of hypotheses on emotional states obtained from multiple affect recognition algorithms. In this study, two matrices were proposed (Equations (13) and (14)) and it is important to emphasize the differences between them. The first one was derived from a smaller dataset, and is therefore less accurate, but this applies to a complete list of dimensions. However, if you expect dominance and surprise not to play an important role in your application context, you might consider the latter one, as it was derived from a bigger dataset and therefore achieved higher accuracies for all precision thresholds.
- (3)
- One of the crucial issues in applying the mapping is setting a precision threshold, which might be context-dependent. A comparison of the metrics used in this study showed that using standard deviation as a threshold might be advisable in some contexts, as it takes into account the ambiguity of the annotated words.
- (4)
- The proposed procedure and metrics were validated and proven useful in the study of mapping between the emotion representation models. The metrics might also prove useful in a comparison of the two annotations. The datasets developed for this study will be shared. The procedure, metrics and datasets set a framework for future works on mappings between the emotion representation models.
5. Conclusions
The study revealed several interesting observations that are worth exploring further. Future studies will aim at an application of data mining techniques to the proposed sets to retrieve an alternative mapping algorithm. Both linear and nonlinear models would be considered, as well as training diverse classifiers with machine learning methods. Further analysis of distance distribution would be performed, as perhaps asymmetric thresholds might be considered. Another interesting issue on whether the mapping should be input-channel dependent for better accuracies remains open.
The exploration of the mapping models and algorithms will be continued and followed by practical applications. There is an emotion monitor stand constructed at Gdansk University of Technology that uses existing technologies to extend human–systems interaction with emotion recognition and affective intervention. The concept of the stand assumed combining multiple modalities used in emotion recognition to improve the accuracy of affect classification. Integration of the existing technologies, input channels and solutions turned out to be very challenging, and among the reasons for this was the incompatibility and low-accuracy mapping between the emotion recognition models. The mapping might be integrated with the solutions already functioning at the stand.
Supplementary Materials
The following are available online at https://www.mdpi.com/2076-3417/8/2/274/s1: (1) The ANEW-MEHR dataset that contains a juxtaposition of the annotations with the same, dimensional emotion representation model retrieved from affect-annotated lexicons: Rusel and Mehrabian’s and ANEW. (2) The SYNE-ANEW dataset that contains a juxtaposition of the annotations with PAD and Ekman’s six-dimensional emotion representation models retrieved from affect-annotated lexicons, Synesketch and ANEW. (3) The NAWL-NAWL dataset that contains juxtaposition of the annotations with pleasure-arousal and a subset of Ekman’s six-dimensional emotion representation models retrieved from affect-annotated lexicon NAWL.
Acknowledgments
This study received funding from Polish–Norwegian Financial Mechanism Small Grant Scheme under the contract no Pol-Nor/209260/108/2015, as well as from DS Funds of ETI Faculty, Gdansk University of Technology.
Conflicts of Interest
The author declares no conflict of interest.
Appendix A. A Detailed Specification of the ANEW-MEHR Dataset
The ANEW-MEHR dataset was derived from Russel and Mehrabian, and ANEW lexicons of affect-annotated words. The dataset is downloadable as a semicolon-separated .csv file. The dataset is distributed under the terms and conditions of the Creative Commons Attribution (CC BY) license. When referencing the dataset, please cite this publication.
To conform with lexicon permissions in the resulting dataset, the words are coded with numbers. For affective annotations of specific words, please refer to the original lexicons. Please cite Russel and Mehrabian [28] for Mehrabian annotation and Bradley&Lang [29] for ANEW.
Specification of the columns:

| Type | Scale | Description | Source | |
|---|---|---|---|---|
| Word | character | Na | Word code | - |
| P_mehr | decimal | 0–1 | Valence dimension in Russel and Mehrabian’s publication—mean value | Russel and Mehrabian |
| A-mehr | decimal | 0–1 | Arousal dimension in Russel and Mehrabian’s publication—mean value | Russel and Mehrabian |
| D_mehr | decimal | 0–1 | Dominance dimension in Russel and Mehrabian’s publication—mean value | Russel and Mehrabian |
| P_anew | decimal | 0–1 | Valence dimension in ANEW lexicon—mean value | ANEW |
| P_SD | decimal | 0–1 | Valence dimension in ANEW lexicon—standard deviation | ANEW |
| A_anew | decimal | 0–1 | Arousal dimension in ANEW lexicon—mean value | ANEW |
| A_SD | decimal | 0–1 | Arousal dimension in ANEW lexicon—standard deviation | ANEW |
| D_anew | decimal | 0–1 | Dominance dimension in ANEW lexicon—mean value | ANEW |
| D_SD | decimal | 0–1 | Dominance dimension in ANEW lexicon—standard deviation | ANEW |
Appendix B. Detailed Specification of the SYNE-ANEW Dataset
The SYNE-ANEW dataset was derived from Synesketch and ANEW lexicons of affect-annotated words. The dataset is downloadable as a semicolon-separated .csv file. The dataset is distributed under the terms and conditions of the Creative Commons Attribution (CC BY) license. When referencing the dataset, please cite this publication.
To conform with lexicon permissions in the resulting dataset, the words are coded with numbers. For affective annotations of specific words, please refer to the original lexicons. Please cite Bradley&Lang [29] for ANEW and Krcadinac et al. [30] for the Synesketch lexicon.
Specification of the columns:
| Type | Scale | Description | Source | |
|---|---|---|---|---|
| Word | character | na | Word code | - |
| P_anew | decimal | 0–1 | Valence dimension in ANEW lexicon—mean value | ANEW |
| P_SD | decimal | 0–1 | Valence dimension in ANEW lexicon—standard deviation | ANEW |
| A_anew | decimal | 0–1 | Arousal dimension in ANEW lexicon—mean value | ANEW |
| A_SD | decimal | 0–1 | Arousal dimension in ANEW lexicon—standard deviation | ANEW |
| D_anew | decimal | 0–1 | Dominance dimension in ANEW lexicon—mean value | ANEW |
| D_SD | decimal | 0–1 | Dominance dimension in ANEW lexicon—standard deviation | ANEW |
| Hap_syne | decimal | 0–1 | Happiness dimension of six basic emotions—mean value | Synesketch |
| Sad_syne | decimal | 0–1 | Sadness dimension of six basic emotions—mean value | Synesketch |
| Ang_syne | decimal | 0–1 | Anger dimension of six basic emotions—mean value | Synesketch |
| Fea_syne | decimal | 0–1 | Fear dimension of six basic emotions—mean value | Synesketch |
| Dis_syne | decimal | 0–1 | Disgust dimension of six basic emotions—mean value | Synesketch |
| Sur_syne | decimal | 0–1 | Surprise dimension of six basic emotions—mean value | Synesketch |
Appendix C. Detailed Specification of the NAWL-NAWL Dataset
The NAWL-NAWL dataset was derived from two sentiment annotations of the same lexicon, NAWL. The dataset is downloadable as a semicolon-separated .csv file. The dataset is distributed under the terms and conditions of the Creative Commons Attribution (CC BY) license. When referencing the dataset, please cite this publication.
To conform with lexicon permissions in the resulting dataset, the words are coded with numbers. For affective annotations of specific words, please refer to the original lexicons. Please cite Rieleg et al. and Wierzba et al. [31,32] for NAWL lexicon.
Specification of the columns:
| Type | Scale | Description | Source | |
|---|---|---|---|---|
| Word | character | na | Word code | - |
| P_nawl | decimal | 0–1 | Valence dimension in NAWL—mean value | NAWL [31] |
| P_SD | decimal | 0–1 | Valence dimension in NAWL—standard deviation | NAWL [31] |
| A_nawl | decimal | 0–1 | Arousal dimension in NAWL—mean value | NAWL [31] |
| A_SD | decimal | 0–1 | Arousal dimension in NAWL—standard deviation | NAWL [31] |
| Hap_nawl | decimal | 0–1 | Happiness dimension of six basic emotions—mean value | NAWL [32] |
| Sad_nawl | decimal | 0–1 | Sadness dimension of six basic emotions—mean value | NAWL [32] |
| Ang_nawl | decimal | 0–1 | Anger dimension of six basic emotions—mean value | NAWL [32] |
| Fea_nawl | decimal | 0–1 | Fear dimension of six basic emotions—mean value | NAWL [32] |
| Dis_nawl | decimal | 0–1 | Disgust dimension of six basic emotions—mean value | NAWL [32] |
References
- Gunes, H.; Piccardi, M. Affect recognition from face and body: Early fusion vs. late fusion. In Proceedings of the IEEE International Conference on Systems, Man and Cybernetics, Waikoloa, HI, USA, 12 October 2005; pp. 3437–3443. [Google Scholar]
- Zeng, A.; Pantic, M.; Roisman, G.; Huang, T.S. A survey of affect recognition methods: Audio, visual, and spontaneous expressions. IEEE Trans. Pattern Anal. Mach. Intel. 2009, 31, 39–58. [Google Scholar] [CrossRef] [PubMed]
- Hupont, I.; Ballano, S.; Baldassarri, S.; Cerezo, E. Scalable multimodal fusion for continuous affect sensing. In Proceedings of the IEEE Workshop on Affective Computational Intelligence (WACI), Paris, France, 11–15 April 2011. [Google Scholar]
- Kołakowska, A.; Landowska, A.; Szwoch, M.; Szwoch, W.; Wrobel, M.R. Modeling emotions for affect-aware applications. In Information Systems Development and Applications; Faculty of Management, University of Gdansk: Sopot, Poland, 2015. [Google Scholar]
- Baker, R.S.J.D.; D’Mello, S.K.; Rodrigo, M.M.T.; Graesser, A.C. Better to be frustrated than bored: The incidence, persistence, and impact of learners’ cognitive—Affective states during interactions with three different computer-based learning environments. Int. J. Hum. Comput. Stud. 2010, 68, 223–241. [Google Scholar] [CrossRef]
- Ekman, P.; Friesen, W.V. Constants across cultures in the face and emotion. J. Personal. Soc. Psychol. 1971, 17, 124–129. [Google Scholar] [CrossRef]
- Landowska, A. Affective learning manifesto-10 years later. In Proceedings of the 13th European Conference of E-Learning, Copenhagen, Denmark, 30–31 October 2014. [Google Scholar]
- Obaid, M.; Han, C.; Billinghurst, M. Feed the Fish: An affectaware game. In Proceedings of the 5th Australasian Conference on Interactive Entertainment, Brisbane, Australia, 3–5 December 2008. [Google Scholar]
- Szwoch, M. Design elements of affect aware video games. In Proceedings of the International Conference Multimedia, Interaction, Design and Innovation, Warsaw, Poland, 24–25 June 2015. [Google Scholar]
- Alexander, S.; Sarrafzadeh, A.; Hill, S. Easy with Eve: A functional affective tutoring system. In Proceedings of the 8th International Conference on Workshop on Motivational and Affective Issues in ITS, Jhongli, Taiwan, 26–30 June 2006. [Google Scholar]
- Cabada, R.Z.; Estrada, M.L.B.; Beltr’n V, J.A.; Cibrian R, F.L.; García, C.A.R.; Pérez, Y.H. Fermat: Merging affective tutoring systems with learning social networks. In Proceedings of the IEEE 12th International Conference on Advanced Learning Technologies (ICALT), Rome, Italy, 4–6 July 2012. [Google Scholar]
- D’Mello, S.; Jackson, T.; Craig, S.; Morgan, B.; Chip-man, P.; White, H.; Person, N.; Kort, B.; el Kaliouby, R.; Picard, R.; et al. AutoTutor detects and responds to learners affective and cognitive states. In Proceedings of the Workshop on Emotional and Cognitive Issues at the International Conference on Intelligent Tutoring Systems, Montreal, Canada, 23–27 June 2008. [Google Scholar]
- Russell, J.A. A circumplex model of affect. J. Personal. Soc. Psychol. 1980, 39, 1161–1178. [Google Scholar] [CrossRef]
- Kołakowska, A.; Landowska, A.; Szwoch, M.; Szwoch, W.; Wróbel, M.R. Emotion recognition and its applications, human-computer systems interaction: Backgrounds and applications 3. Adv. Intell. Syst. Comput. 2014, 300, 51–62. [Google Scholar]
- Mehrabian, A. Pleasure-arousal-dominance: A general framework for describing and measuring individual differences in temperament. Curr. Psychol. 1996, 14, 261–292. [Google Scholar] [CrossRef]
- Mehrabian, A. Analysis of the big-five personality factors in terms of the PAD temperament model. Aust. J. Psychol. 1996, 48, 86–92. [Google Scholar] [CrossRef]
- Ekman, P.; Friesen, W.V. Facial Action Coding System: A Technique for the Measurement of Facial Movement; Consulting Psychologists Press: Palo Alto, CA, USA, 1978. [Google Scholar]
- Cambria, E.; Schuller, B.; Xia, Y.Q.; Havasi, C. New avenues in opinion mining and sentiment analysis. IEEE Intell. Syst. 2013, 28, 15–21. [Google Scholar] [CrossRef]
- Bach, D.R.; Friston, K.J.; Dolan, R.J. Analytic measures for quantification of arousal from spontaneous skin conductance fluctuations. Int. J. Psychophysiol. 2010, 76, 52–55. [Google Scholar] [CrossRef] [PubMed]
- Ortony, A. The Cognitive Structure of Emotions; Cambridge University Press: Cambridge, UK, 1990. [Google Scholar]
- Bartneck, C. Integrating the OCC model of emotions in embodied characters. In Proceedings of the Workshop on Virtual Conversational Characters, Melbourne, Australia, 29 November 2002. [Google Scholar]
- Steunebrink, B.R.; Dastani, M.; Meyer, J.-J.C. The OCC model revisited. In Proceedings of the 4th Workshop on Emotion and Computing, Paderborn, Germany, 15 September 2009. [Google Scholar]
- Yang, G.; Wang, Z.; Wang, G.; Chen, F. Affective Computing Model Based on Emotional Psychology; Springer: Berlin/Heidelberg, Germany, 2006. [Google Scholar]
- Wei, J.; Wang, Y.; Tu, J.; Zhang, Q. Affective Transfer Computing Model Based on Attenuation Emotion; Springer: Berlin, Germany, 2011. [Google Scholar]
- Valenza, G.; Lanata, A.; Scilingo, E.P. The role of nonlinear dynamics in affective valence and arousal recognition. IEEE Trans. Affect. Comput. 2012, 3, 237–249. [Google Scholar] [CrossRef]
- Gebhard, P. ALMA—A Layered Model of Affect; German Research Center for Artificial Intelligence (DFKI): Saarbrucken, Germany, 2005. [Google Scholar]
- Kołakowska, A.; Landowska, A.; Szwoch, M.; Szwoch, W.; Wróbel, M.R. Evaluation criteria for affect-annotated databases. In Beyond Databases, Architectures and Structure; Springer: Berlin, Germany, 2015. [Google Scholar]
- Russell, J.A.; Mehrabian, A. Evidence for a three-factor theory of emotions. J. Res. Personal. 1977, 11, 273–294. [Google Scholar] [CrossRef]
- Bradley, M.M.; Lang, P.J. Affective Norms for English Words (ANEW): Instruction Manual and Affective Ratings; Technical Report C-1; The Center for Research in Psychophysiology, University of Florida: Gainesville, FL, USA, 1977. [Google Scholar]
- Krcadinac, U.; Pasquier, P.; Jovanovic, J.; Devedzic, V. Synesketch: An open source library for sentence-based emotion recognition. Proc. IEEE Trans. Affect. Comput. 2013, 4, 312–325. [Google Scholar] [CrossRef]
- Riegel, M.; Wierzba, M.; Wypych, M.; Żurawski, Ł.; Jednoróg, K.; Grabowska, A.; Marchewka, A. Nencki Affective Word List (NAWL): The cultural adaptation of the Berlin Affective Word List–Reloaded (BAWL-R) for Polish. Behav. Res. Methods 2015, 47, 1222–1236. [Google Scholar] [CrossRef] [PubMed]
- Wierzba, M.; Riegel, M.; Wypych, M.; Jednoróg, K.; Turnau, P.; Grabowska, A.; Marchewka, A. Basic emotions in the Nencki Affective Word List (NAWL BE): New method of classifying emotional stimuli. PLoS ONE 2015, 10. [Google Scholar] [CrossRef] [PubMed]
- Picard, R.; Cook, D. Cross-validation of regression models. J. Am. Stat. Assoc. 1984, 79, 575–583. [Google Scholar] [CrossRef]
- Arlot, S.; Alain, C. A survey of cross-validation procedures for model selection. Stat. Surv. 2010, 4, 40–79. [Google Scholar] [CrossRef]
- Landowska, A. Web questionnaire as construction method of affect-annotated lexicon-risks reduction strategy. In Proceedings of the International Conference on Affective Computing and Intelligent Interaction, Xi’an, China, 21–24 September 2015. [Google Scholar]
- Varma, S.; Simon, R. Bias in error estimation when using cross-validation for model selection. BMC Bioinform. 2006, 7. [Google Scholar] [CrossRef] [PubMed]
Table 1.
Sample annotations of words from Russel and Mehrabian lexicon.
| Word | Valence Mean (SD) | Arousal Mean (SD) | Dominance Mean (SD) |
|---|---|---|---|
| strong | 0.58 (0.24) | 0.48 (0.3) | 0.62 (0.3) |
| lonely | –0.66 (0.35) | −0.43 (0.36) | −0.32 (0.3) |
| happy | 0.81 (0.21) | 0.51 (0.26) | 0.46 (0.38) |
Table 2.
Sample annotations of words from ANEW lexicon.
| Word | Valence Mean (SD) | Arousal Mean (SD) | Dominance Mean (SD) |
|---|---|---|---|
| strong | 7.11 (1.48) | 5.92 (2.28) | 6.92 (2.43) |
| lonely | 2.17 (1.76) | 4.51 (2.68) | 2.95 (2.12) |
| happy | 8.21 (1.82) | 6.49 (2.77) | 6.63 (2.43) |
Table 3.
Sample annotations of words from the Synesketch lexicon.
| Word | Emotion Intensity | Happiness | Sadness | Anger | Fear | Disgust | Surprise |
|---|---|---|---|---|---|---|---|
| strong | 0.44 | 0.72 | 0.0 | 0.07 | 0.07 | 0.0 | 0.0 |
| lonely | 1.0 | 0.0 | 1.0 | 0.0 | 0.0 | 0.0 | 0.0 |
| happy | 1.0 | 1.0 | 0.0 | 0.0 | 0.0 | 0.0 | 0.0 |
Table 4.
Sample annotations of words from the NAWL (Nencki Affective Word List) lexicon.
| Word | Happiness Mean (SD) | Anger Mean (SD) | Sadness Mean (SD) | Fear Mean (SD) | Disgust Mean (SD) | Valence Mean (SD) | Arousal Mean (SD) | Imageability Mean (SD) |
|---|---|---|---|---|---|---|---|---|
| strong | 4.85 (1.38) | 1.96 (1.46) | 1.42 (0.90) | 2.58 (1.45) | 1.38 (0.85) | 1.81 (0.98) | 2.58 (1.17) | 5.92 (1.2) |
| lonely | 1.04 (0.20) | 2.58 (1.88) | 5.31 (1.57) | 4.19 (1.96) | 1.92 (1.44) | −1.7 (1.03) | 2.48 (1.19) | 6.11 (1.01) |
| happy | 5.85 (1.29) | 1.58 (1.63) | 1.58 (1.53) | 1.62 (1.70) | 1.31 (1.19) | 2.37 (0.88) | 3.15 (0.99) | 6.41 (0.69) |
Table 5.
Mapping accuracy metrics for the ANEW-MEHR dataset.
| Dimension | Distance-Based Metrics | Threshold-Based Accuracy Metrics | ||||||
|---|---|---|---|---|---|---|---|---|
| MAE/PADABS | RMSE | R2 | M10/PAD10 | M20/PAD20 | MSD/PADSD | DD10 | DD20 | |
| P | 0.068 | 0.098 | 0.860 | 80.6% | 95.5% | 94.6% | ||
| A | 0.096 | 0.118 | 0.556 | 57.1% | 92.0% | 97.3% | ||
| D | 0.093 | 0.166 | 0.577 | 62.5% | 90.2% | 99,1% | ||
| PAD | 0.172 | 33.9% | 79.5% | 91.1% | 56.2% | 95.5% | ||
Table 6.
Accuracy metrics for reference mapping matrix applied on the SYNE-ANEW dataset.
| Dimension | Distance-Based Metrics | Threshold-Based Accuracy Metrics | ||||||
|---|---|---|---|---|---|---|---|---|
| MAE/PADABS | RMSE | R2 | M10/PAD10 | M20/PAD20 | MSD/PADSD | DD10 | DD20 | |
| P | 0.262 | 0.321 | −0.153 | 25.8% | 45.7% | 46.8% | ||
| A | 0.242 | 0.293 | −1.229 | 23.9% | 48.3% | 68.9% | ||
| D | 0.252 | 0.308 | −0.778 | 22.8% | 44.6% | 56.2% | ||
| PAD | 0.487 | 1.5% | 14.6% | 25.8% | 5.2% | 32.2% | ||
Table 7.
Accuracy metrics fora reference mapping matrix applied on NAWL-NAWL dataset.
| Dimension | Distance-Based Metrics | Threshold-Based Accuracy Metrics | ||||||
|---|---|---|---|---|---|---|---|---|
| MAE/PADABS | RMSE | R2 | M10/PAD10 | M20/PAD20 | MSD/PADSD | DD10 | DD20 | |
| P | 0.157 | 0.177 | 0.327 | 27.2% | 67.9% | 59.8% | ||
| A | 0.136 | 0.178 | −0.088 | 49.5% | 75.9% | 88.9% | ||
| D * | na | na | na | na | na | na | ||
| PA * | 0.235 | 6.7% | 46.1% | 59.9% | 32.0% | 80.8% | ||
Note: * dominance dimension is not available for the set.
Table 8.
Accuracy metrics for the new mapping for the SYNE-ANEW dataset (cross-validation results).
| Dimension | Distance-Based Metrics | Threshold-Based Accuracy Metrics | ||||||
|---|---|---|---|---|---|---|---|---|
| MAE/PADABS | RMSE | R2 | M10/PAD10 | M20/PAD20 | MSD/PADSD | DD10 | DD20 | |
| P | 0.174 | 0.297 | 0.45 | 33.3% | 59.9% | 62.5% | - | - |
| A | 0.097 | 0.122 | 0.197 | 58.7% | 90.6% | 96.8% | - | - |
| D | 0.090 | 0.113 | 0.330 | 61.6% | 92.1% | 98.3% | - | - |
| PAD | 0.239 | 17.8% | 54.9% | 59.9% | 32.0% | 80.8% | ||
Table 9.
Accuracy metrics for the new mapping for the NAWL-NAWL dataset (cross-validation results).
| Dimension | Distance-Based Metrics | Threshold-Based Accuracy Metrics | ||||||
|---|---|---|---|---|---|---|---|---|
| MAE/PADABS | RMSE | R2 | M10/PAD10 | M20/PAD20 | MSD/PADSD | DD10 | DD20 | |
| P | 0.045 | 0.056 | 0.918 | 92.4% | 99.9% | 99.3% | - | - |
| A | 0.070 | 0.088 | 0.574 | 74.9% | 97.6% | 99.1% | - | - |
| D | na | na | na | na | na | na | - | - |
| PA * | 0.090 | 70.5% | 97.6% | 98.4% | 83.7% | 99.8% | ||
Note: * dominance dimension is not available for the set.
Table 10.
Accuracy metrics for the mapping obtained from SYNE_ANEW applied on the NAWL-NAWL dataset (cross-set results).
Table 10.
Accuracy metrics for the mapping obtained from SYNE_ANEW applied on the NAWL-NAWL dataset (cross-set results).
| Dimension | Distance-Based Metrics | Threshold-Based Accuracy Metrics | ||||||
|---|---|---|---|---|---|---|---|---|
| MAE/PADABS | RMSE | R2 | M10/PAD10 | M20/PAD20 | MSD/PADSD | DD10 | DD20 | |
| P | 0.093 | 0.109 | 0.744 | 56.5% | 95.8% | 87.3% | - | - |
| A | 0.116 | 0.144 | 0.282 | 50.8% | 84.4% | 92.6% | - | - |
| D | na | na | na | na | na | na | - | - |
| PA * | 0.162 | 29.9% | 81.1% | 81.5% | 43.3% | 93.1% | ||
Note: * dominance dimension is not available for the set.
Table 11.
Mapping accuracy metrics for ANEW-MEHR dataset.
| Model | Dataset/Analysis | PADABS | PAD10 | PAD20 | PADSD | DD10 | DD20 |
|---|---|---|---|---|---|---|---|
| PAD | ANEW-MEHR simple pairing | 0.172 | 33.9% | 79.5% | 91.1% | 56.2% | 95.5% |
| PAD | SYNE-ANEW reference mapping | 0.487 | 1.5% | 14.6% | 25.8% | 5.2% | 32.2% |
| PAD | SYNE-ANEW proposed mapping cross-validation | 0.239 | 17.8% | 54.9% | 59.9% | 32.0% | 80.8% |
| PA | NAWL-NAWL reference mapping | 0.235 | 6.7% | 46.1% | 59.9% | 32.0% | 80.8% |
| PA | NAWL-NAWL proposed mapping cross-validation | 0.090 | 70.5% | 97.6% | 98.4% | 83.7% | 99.8% |
| PA | Cross-set mapping evaluation on NAWL-NAWL dataset | 0.162 | 29.9% | 81.1% | 81.5% | 43.3% | 93.1% |
© 2018 by the author. Licensee MDPI, Basel, Switzerland. This article is an open access article distributed under the terms and conditions of the Creative Commons Attribution (CC BY) license (http://creativecommons.org/licenses/by/4.0/).
Share and Cite
MDPI and ACS Style
Landowska, A. Towards New Mappings between Emotion Representation Models. Appl. Sci. 2018, 8, 274. https://doi.org/10.3390/app8020274
AMA Style
Landowska A. Towards New Mappings between Emotion Representation Models. Applied Sciences. 2018; 8(2):274. https://doi.org/10.3390/app8020274
Chicago/Turabian StyleLandowska, Agnieszka. 2018. "Towards New Mappings between Emotion Representation Models" Applied Sciences 8, no. 2: 274. https://doi.org/10.3390/app8020274
Note that from the first issue of 2016, this journal uses article numbers instead of page numbers. See further details here.