Article

Thermographic Non-Destructive Evaluation for Natural Fiber-Reinforced Composite Laminates

by
Hai Zhang
1,*,†,
Stefano Sfarra
2,3,
Fabrizio Sarasini
4,
Carlo Santulli
5,
Henrique Fernandes
6,
Nicolas P. Avdelidis
1,7,
Clemente Ibarra-Castanedo
1 and
Xavier P. V. Maldague
1
1
Computer Vision and Systems Laboratory (CVSL), Department of Electrical and Computer Engineering, Laval University, 1065 av. de la Médecine, Quebec City, QC G1V 0A6, Canada
2
Department of Industrial and Information Engineering and Economics, University of L’Aquila, 67100 L’Aquila, Italy
3
Tomsk Polytechnic University, 634028 Tomsk, Russia
4
Department of Chemical Engineering Materials Environment & UDR INSTM, Sapienza University of Rome, 00184 Rome, Italy
5
School of Architecture and Design (SAD), University of Camerino, 63100 Ascoli Piceno, Italy
6
School of Computer Sciences, Federal University of Uberlandia, Uberlandia 38400-902, Brazil
7
Aerospace Integration Research Centre (AIRC), College Road, Cranfield MK43 0AL, UK
*
Author to whom correspondence should be addressed.
Current Address: Center for Advanced Diffusion-Wave Technologies (CADIFT), Department of Mechanical and Industrial Engineering, University of Toronto, 5 King’s College Road, Toronto, ON M5S 3G8, Canada.
Appl. Sci. 2018, 8(2), 240; https://doi.org/10.3390/app8020240
Submission received: 15 December 2017 / Revised: 18 January 2018 / Accepted: 23 January 2018 / Published: 5 February 2018

Abstract

:
Natural fibers, including mineral and plant fibers, are increasingly used for polymer composite materials due to their low environmental impact. In this paper, thermographic non-destructive inspection techniques were used to evaluate and characterize basalt, jute/hemp and bagasse fibers composite panels. Different defects were analyzed in terms of impact damage, delaminations and resin abnormalities. Of particular interest, homogeneous particleboards of sugarcane bagasse, a new plant fiber material, were studied. Pulsed phase thermography and principal component thermography were used as the post-processing methods. In addition, ultrasonic C-scan and continuous wave terahertz imaging were also carried out on the mineral fiber laminates for comparative purposes. Finally, an analytical comparison of different methods was given.

Graphical Abstract

1. Introduction

Basalt, as a mineral material, can be obtained from volcanic rocks which are originated from frozen lava with a melting temperature in the range of 1500 °C to 1700 °C [1]. Basalt fiber was originally developed by the former Soviet Union and its first industrial production furnace was finished at Ukraine fibre laboratory in 1985 after 30 years of research and development [2]. The manufacturing process of basalt fiber is similar to glass fiber, but less energy and no additives are needed. Therefore, basalt fiber is in principle cheaper than glass fiber and it is also suitable to produce chopped or continuous fibers [3]. The cost of the final products also depends on the raw materials, the production process and the demanded mechanical and physical properties [4]. Although asbesto and basalt fiber have a similar composition, the latter has different morphology and surface properties which avoid carcinogenic or toxicity effects [5]. Kogan et al. [6] and McConnell et al. [7] both verified the safety of basalt fiber by animal experiments. Compared to glass fiber, basalt fiber shows similar mechanical properties and several advantages (see Table 1). Therefore, it has been considered as an alternative reinforcement for composite materials which can be used in marine, automotive, sporting equipment and civil sectors [8].
In addition to basalt fiber, several types of plant fibers have also been considered as the reinforcements for panels and semi-structural components, with the idea to improve the material biodegradability and the end-of-life scenarios. Among them, jute and hemp fibers are increasingly hybridized for use in the recent years, with the aim to exploit their advantages such as lightweight, nonabrasive, combustible, nontoxic, low cost and biodegradable properties. Although jute/hemp fibers polymer composites have acceptable mechanical properties for many applications such as furnitures, they are still not suitable to some specific fields such as acting as a type of building material.
In this regard, particleboards (PBs) and medium density fiberboards (MDFs), which are practical and cheap alternatives to solid wood, have become leading building materials in the past decade [9]. PB is a type of panel product made of sawdust and wood shavings bonded together by synthetic resin and pressed into sheets. However, the availability of wood residues restricts its development. In addition, formaldehyde, which is used as the resin material during the manufacturing process, is a type of carcinogen. Therefore, it is necessary to consider alternative post-consumer waste wood or waste paper or agricultural residues as raw materials and more benign resins [10]. This also offers environmental benefits such as diversion of waste from landfills or burning. Among the agricultural residues, bagasse is one of the largest non-wood lignocellulose by-products which is left after the crushing and extraction of the juice from the sugarcane [11].
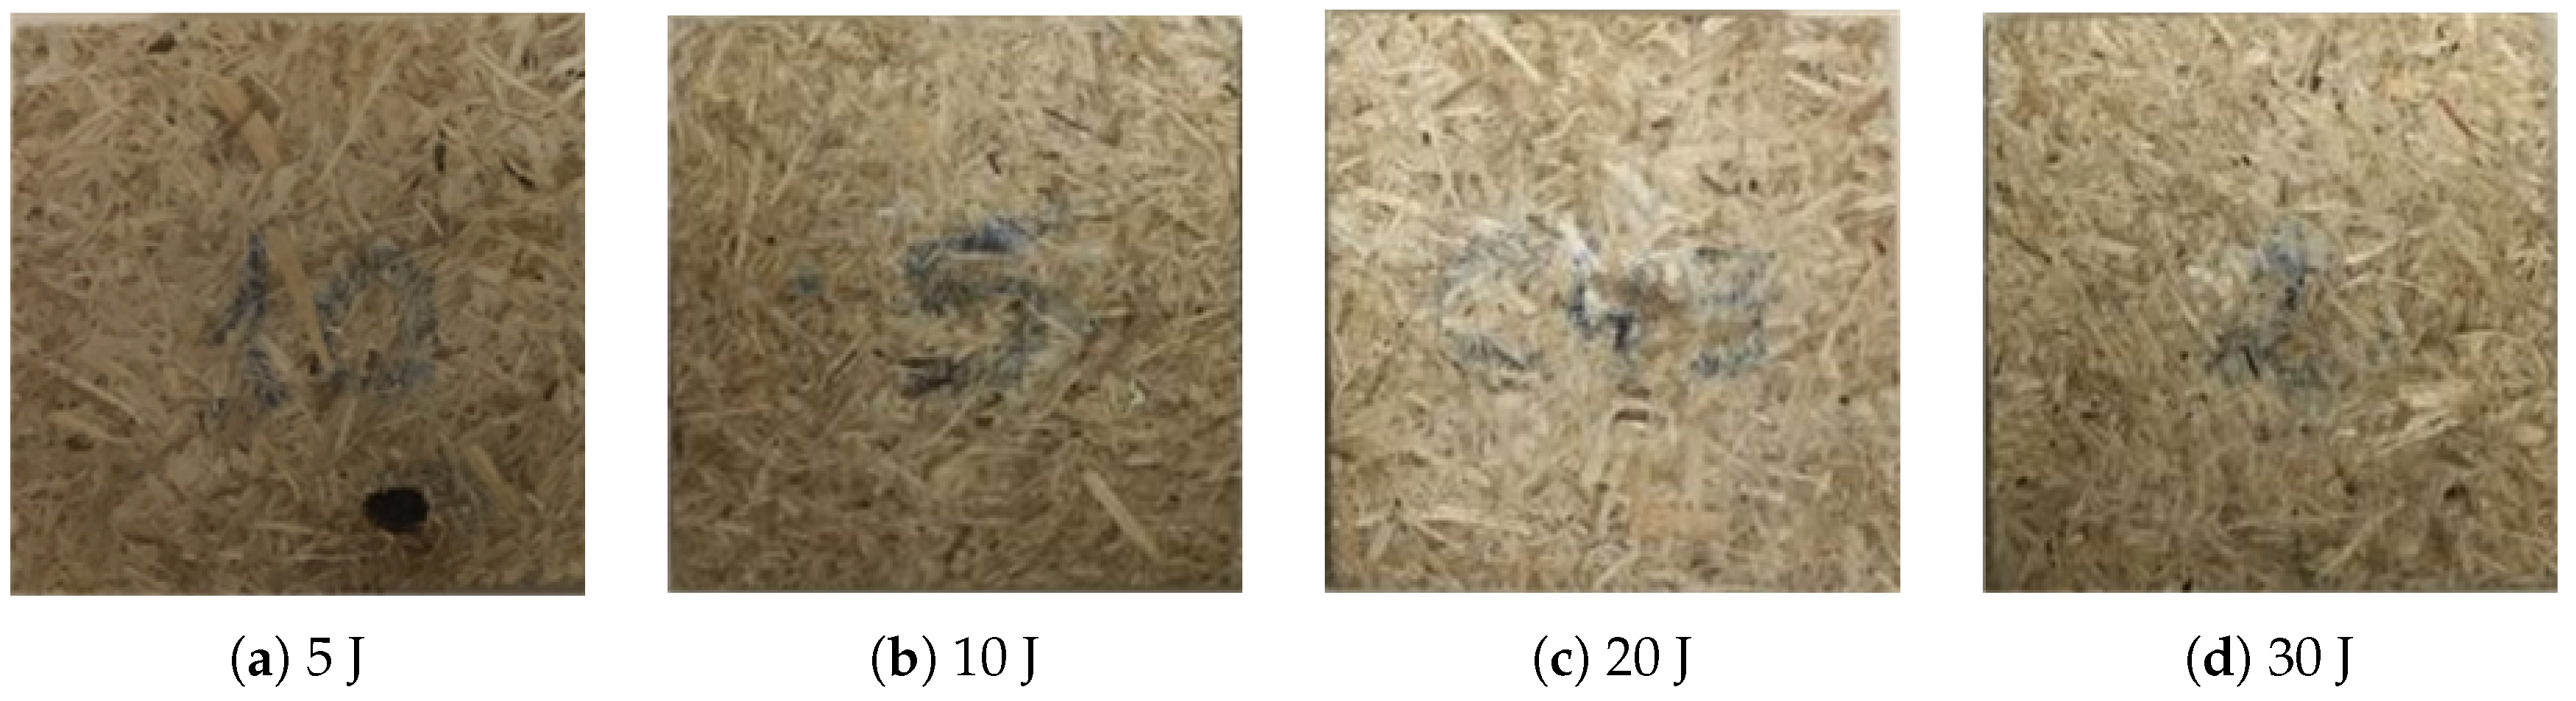
Similarly to conventional composite structures, the strength properties in the transverse direction of PBs are limited and therefore they have poor impact resistance. Low-velocity impact is usually considered as a major threat to fiber-reinforced polymer composite structures. Such foreign object loading can occur during manufacturing, assembly, maintenance and operation. The impact damage can significantly reduce the residual mechanical properties of composites even though it is hardly visible. The impact damage is becoming increasingly essential for the behavior of natural fiber composites, as they are usually reported to exhibit a limited resistance to impact loading.
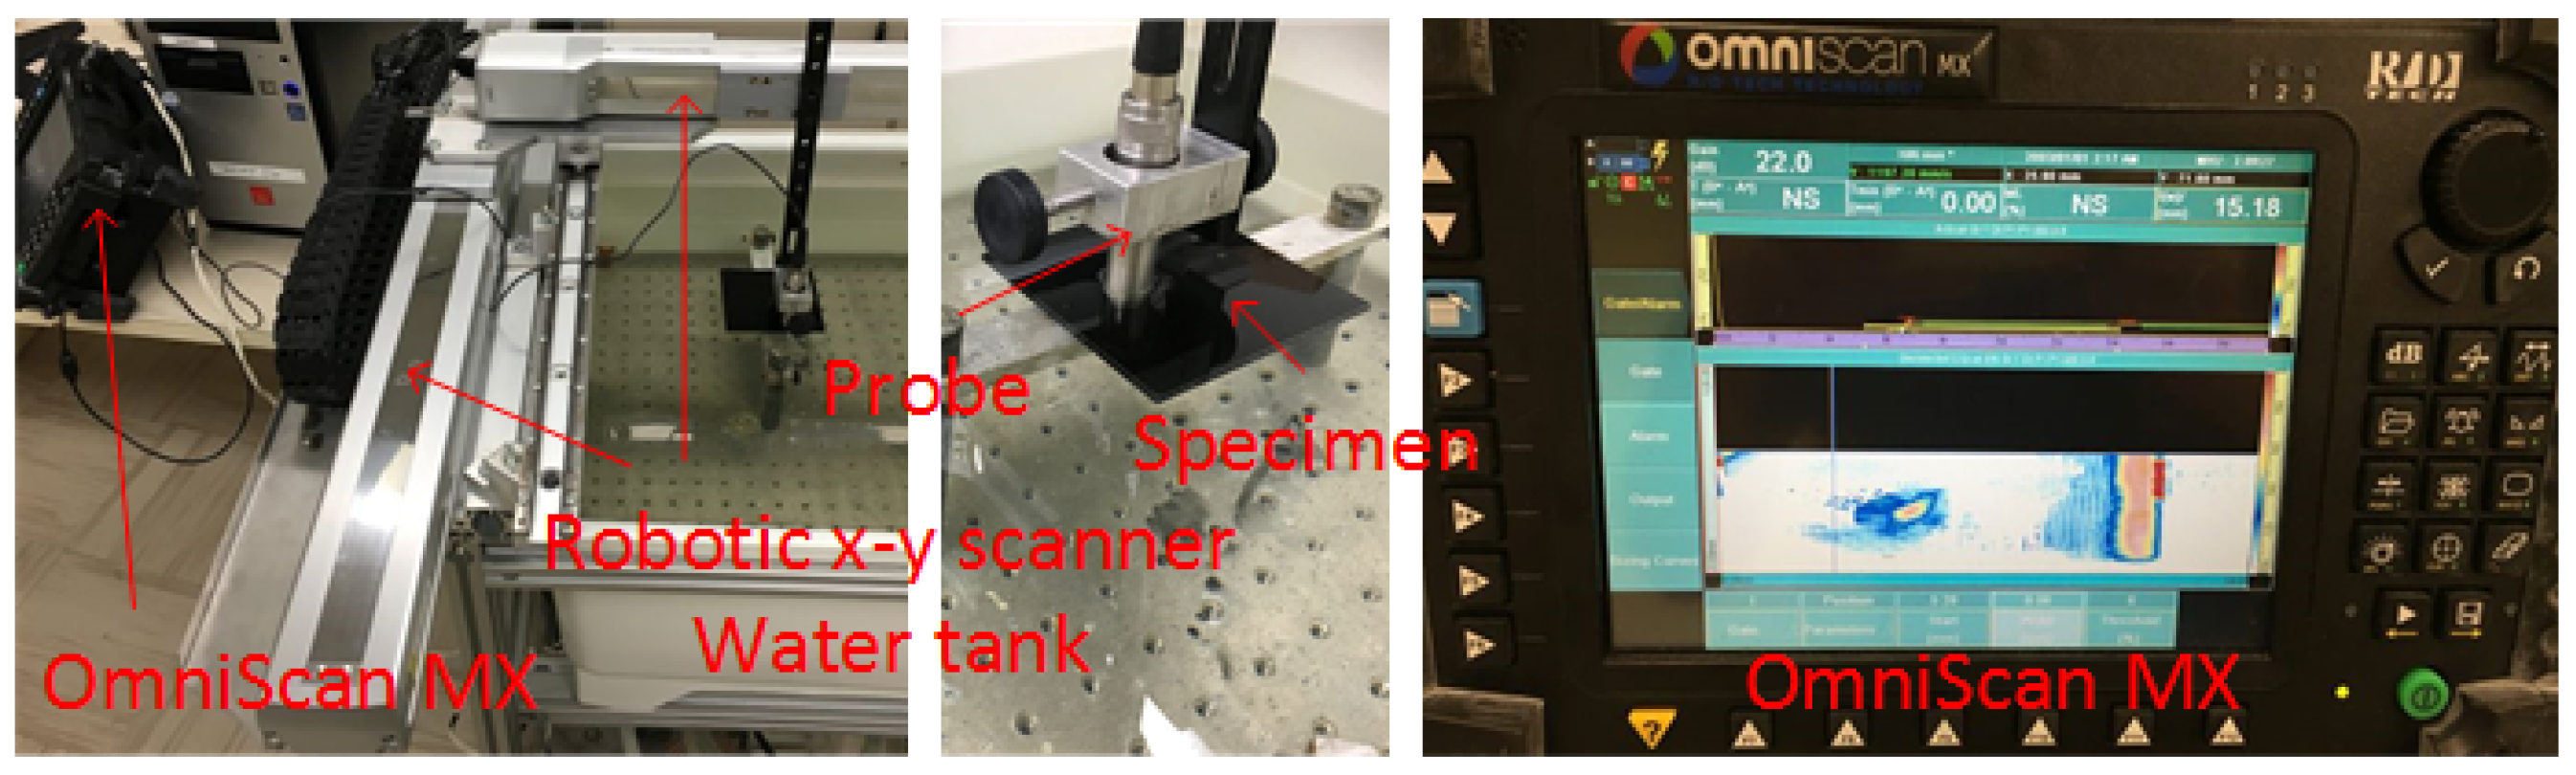
In addition to impact damage, some other manufacturing flaws such as porosities are also threats to the quality of the final product. In this regard, non-destructive testing (NDT) has been used for the evaluation of impact damage and overall quality in composite structures. The main NDT methods involve ultrasound, x-ray and infrared radiation etc. Ultrasound is a conventional and effective method for composite panels such as carbon fiber-reinforced polymer plastic (CFRP). It needs wedge such as water with the aim to get rid of air, but most of the plan fiber polymer composite materials are not water-proof. Air-coupled ultrasound has been developed, but it cannot penetrate thick materials which are often used in plant fiber composite applications. X-ray computed tomography (CT) is expensive, time-consuming, harmful to human body, and its contrast is relatively low [12].
Recently infrared thermography (IRT) is becoming increasingly attractive as a NDT method due to the fact that it has faster inspection-acquisition rate, higher spatial resolution and contrast, and it is contactless. The development of infrared image processing algothrims also enhances its advantages for use. It has been used in different fields such as electrical components, medical imaging, thermal comfort, in-line industrial monitoring, buildings, artworks, composite materials [13,14,15,16,17,18]. Although IRT has been applied in many fields, quantitative analysis is becoming increasingly important aside from inspection, which need further study, e.g., depth information, etc. [19,20].
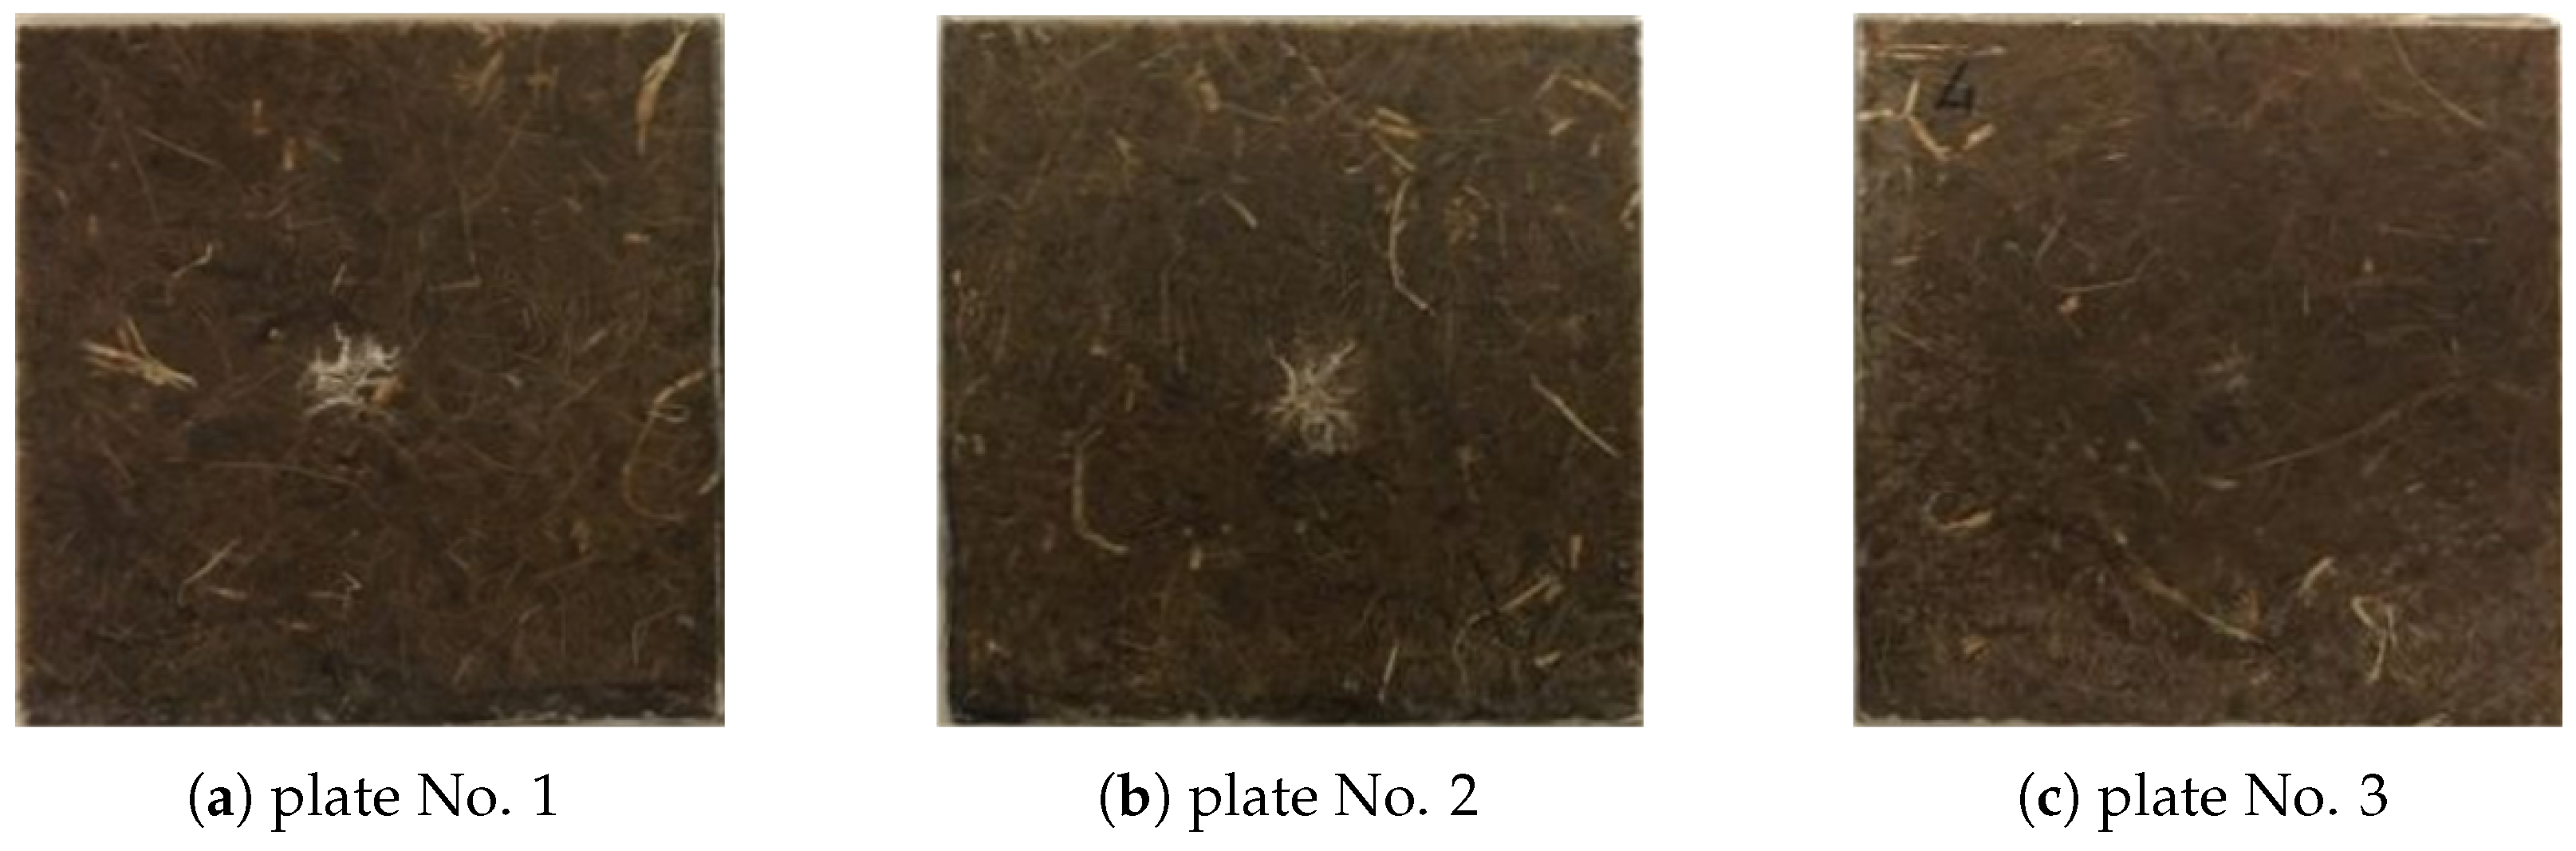
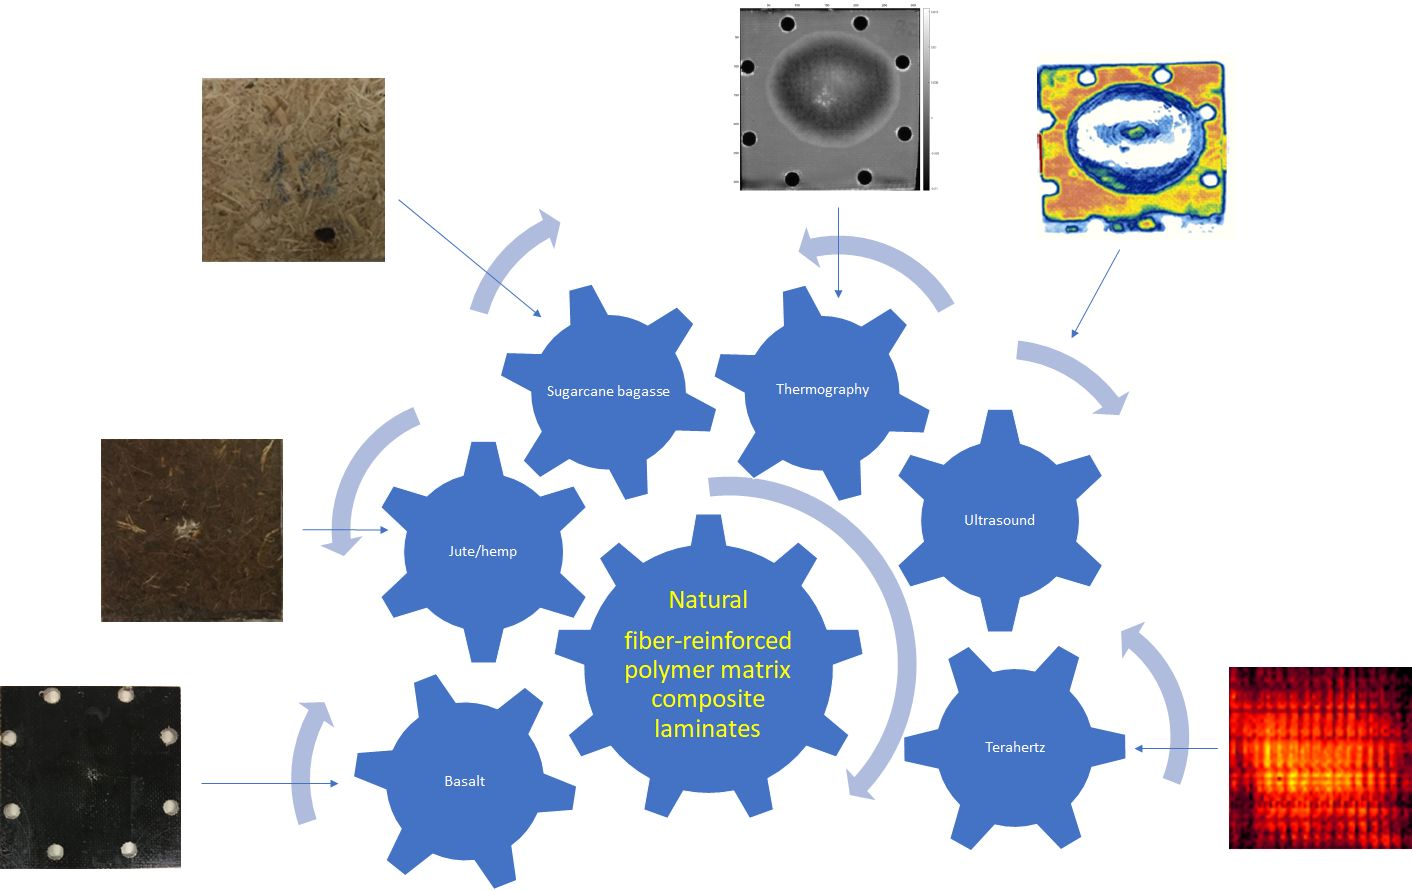
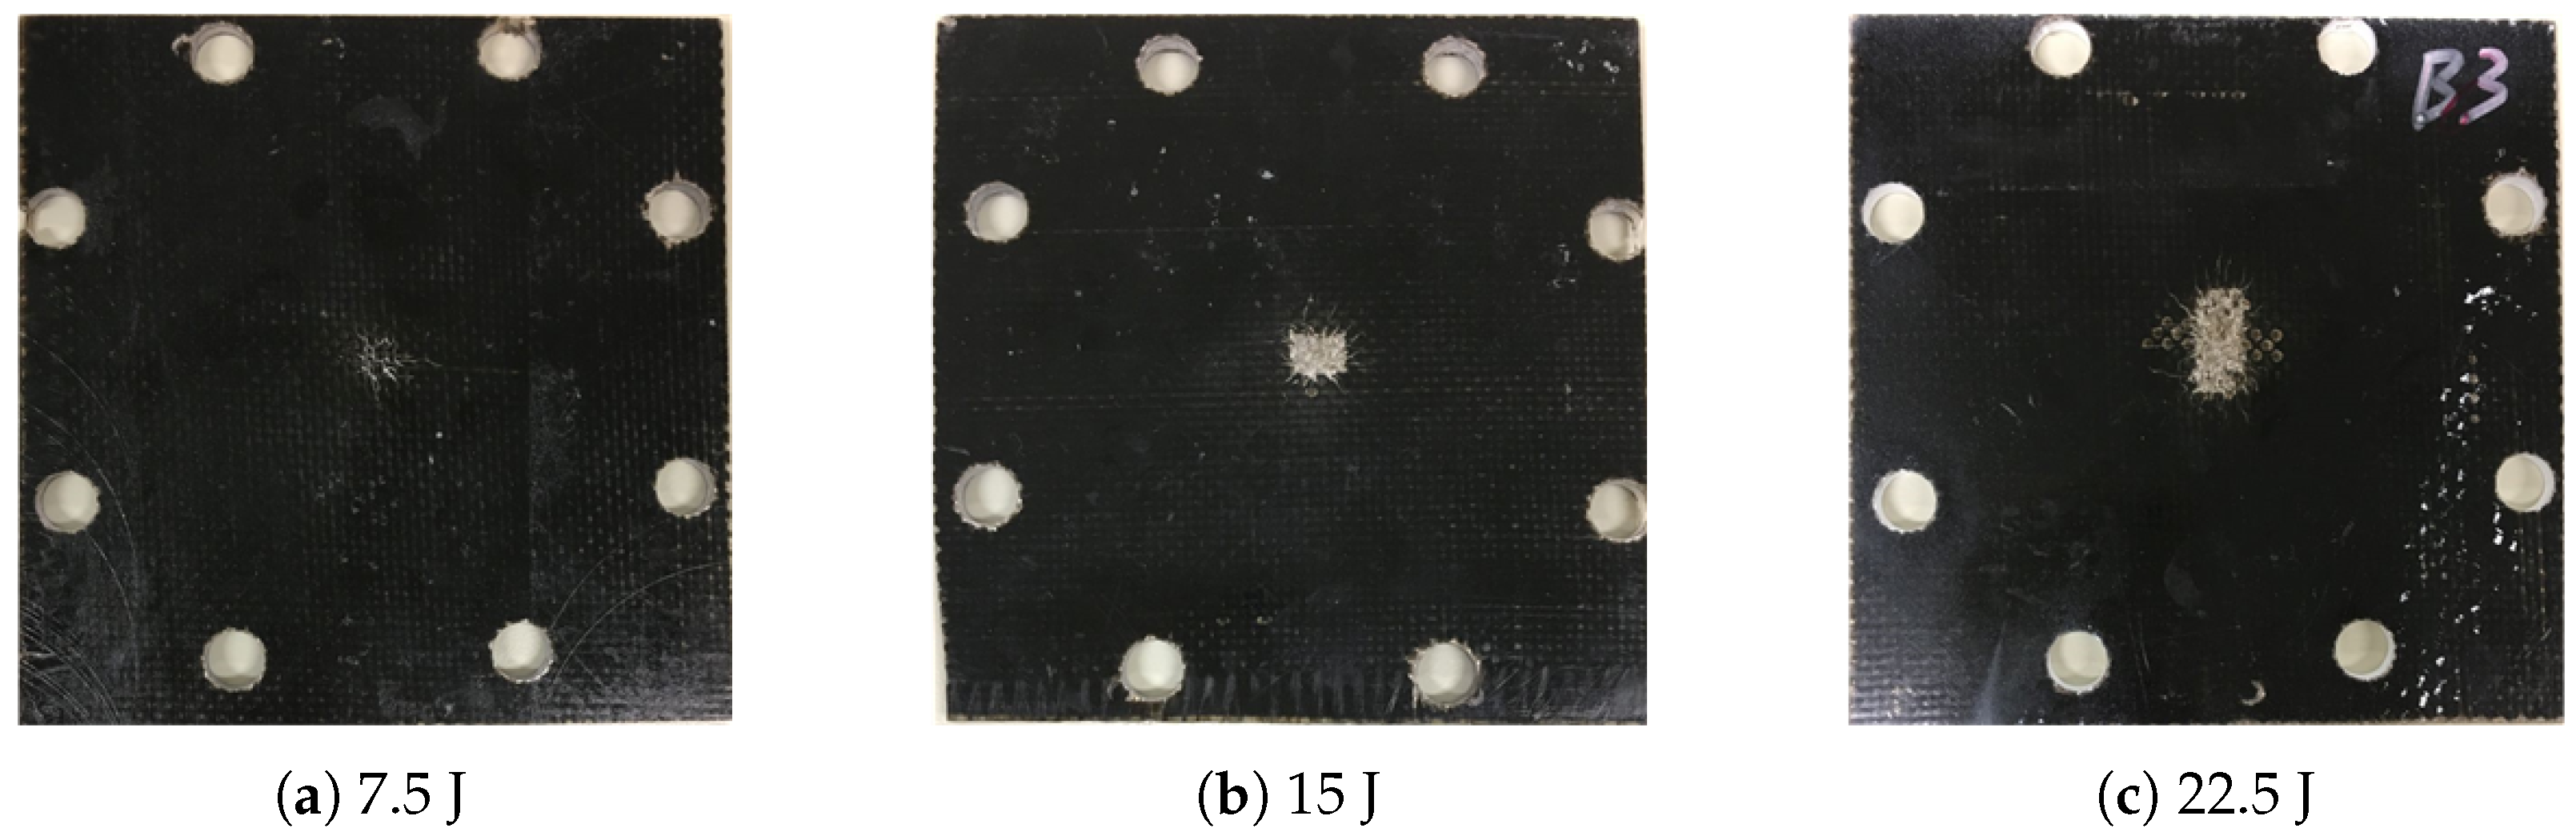
In this paper, IRT was used to evaluate impacted basalt fiber reinforced polymer laminates (BFRP), jute/hemp hybrid fiber-reinforced polymer laminates, and homogeneous particleboards of sugarcane bagasse (SCB). Different types of defects were analyzed in terms of impact damage, delaminations and resin abnormalities. Of particular interest, SCB is a new type of PB made of bagasse fibers and bio-resins derived from castor oil. Pulsed phase thermography (PPT) and principal component thermography (PCT) were used to process the raw data. Ultrasonic C-scan testing (UT) and emerging continuous wave terahertz (CW THz) imaging were used on the mineral fiber laminates for comparative purposes. Finally, an analytical comparison of different thermographic techniques for natural fiber-reinforced polymer composites inspection was given.

2. Specimens

2.1. Basalt Fiber-Reinforced Polymer Laminates

The basalt fabric (BAS 220.1270.P, Basaltex-Flocart NV, Wevelgem, Belgium) was a plain-weave fabric with a surface weight of 220 g/m2. A vinylester resin (DION 9102, Reichhold) was used as the matrix material. The laminates were made using Resin Transfer Molding with a fiber volume fraction of 0.38 ± 0.02, and a final thickness of 3 ± 0.1 mm. A drop-weight impact tower fitted with an anti-rebound device was used for low velocity impact tests. Specifically, a hemispherical impactor with a 12.7 mm diameter tip was used [21] and three impact energies (equal to 7.5, 15 and 22.5 J shown in Figure 1) were used in this study.

2.2. Jute/Hemp Fiber Hybrid Laminates

The jute/hemp fiber hybrid laminates were made using a jute hessian cloth which has an areal weight of 250 g/m2 and hemp fibers (AMCO) which were decorticated and bleached using sodium chlorite in optimized conditions. The composite structure has six layers of jute fabrics placed at 0°/0°/45°/−45°/0°/0° which was sandwiched between two nonwoven hemp mats. The material has 30 (±2) wt. % of jute fiber and 20 (±1.5) wt. % of hemp fiber. The specimens have the dimensions of 140 mm × 220 mm × 2.8 (±0.1) mm. A hemispherical nose of 12.7 mm diameter was used for static indentation tests. Three specimens (see Figure 2) were tested at different loads, which were applied in displacement control with 1 mm/min cross-head speed [22].
Table 2 shows the specific values obtained for the specimens [23].

2.3. Homogeneous Particleboards of Sugarcane Bagasse

The high-density homogeneous particleboards of SCB and polyurethane resin based on castor oil followed the methodology defined in [24], assuming a nominal density of 800 kg/m3 and dimensions of 0.55 × 0.55 × 0.016 m. Initially, the SCB was oven dried at a temperature of 60 °C for 24 h to reduce the moisture content to around 12%. After drying, it was sieved in a sieve shaker. The bagasse particles retained in the sieve mesh with openings greater than 2 mm were milled in a knife mill to produce particles of size up to 8 mm. The particles with a size of less than 2 mm were removed from the manufacturing process because they are not suitable for the step of dispersing the resin. Subsequently, the particles of SCB were introduced in a planetary mixer and the adhesive polyurethane resin based on castor oil was added, in a proportion of 15% by weight of the dry mass of bagasse, for better uniformity in the distribution of the adhesive in particles. After this mixing period, the particles were introduced into a mattress forming mold, with dimensions of 0.55 × 0.55 m and pressed with a pressure of 5 MPa at a temperature of 100 °C, for a period of 10 min. At the end of the pressing process, the complete curing process of the resin required a period of 72 h [25].
Low velocity impact tests at four different energy levels, namely 5, 10, 20 and 30 J (see Figure 3) were carried out using an instrumented drop-weight impact testing machine (CEAST/Instron 9340). A steel mass was attached to the steel impactor with a hemispherical tip of 20 mm diameter for a total weight of 3 kg. The different energy levels were obtained by changing the height of release of the impactor. The specimens were clamped circumferentially along a diameter of 40 mm in a pneumatic-actuated clamping fixture. During the test, the time histories of impact force and the initial impact velocity were recorded. Post-impact, the permanent dent depth of each coupon was measured using a non-contact profilometer (Taylor-Hobson Talyscan 150) with a scanning speed of 10,500 µm/s and a nominal vertical resolution of 1 µm. The dent depth as a function of impact energy is shown in Table 3 [25].

3. Experiments

3.1. Infrared Thermography

Pulsed thermography (PT) and lock-in thermography (LT) are two main optical excitation IRT methods. PT uses high-energy lamps to generate a uniform heating on an object surface. An infrared camera is used to record the surface temperature profile. In PT, a subsurface defect causes a non-uniform cooling, which can be identified in an imaging sequence. As a time-domain sequenced imaging approach, PT allows the application of the advanced imaging processing techniques to obtain more visible imprints of the defects. LT is known as a modulated technique. In LT, the absorption of modulated heating leads to a temperature modulation. LT requires long acquisition time, especially for deep defects (low modulation frequencies). Sinusoidal waves are typically used in LT, which have the following advantages: (1) frequency and shape of the response are preserved, (2) only the amplitude and phase delay of the wave may change [26,27].
Figure 4 shows the schematic and experimental set-up for optical excitation IRT. Two ‘OMNLUX PAR64’ (1000 W) halogen lamps were used to generate pulse or lock-in sinusoidal signals for PT and LT, respectively. A Balcar FX 60 (6.4 KJ, 2 ms duration) producing photographic flashes was used for PT. A mid-wave IR camera ‘FLIR Phoenix’ (see Table 4) with the frame rate of ∼55 fps was used to record the temperature profile. The cooling time for PT is 15 s/20 s for flashes/halogen lamps modality, respectively.
As an ultrasonic excitation thermographic approach, vibrothermography (VT) was also used in this paper. Different from optical excitation IRT, VT uses ultrasonic waves to stimulate a subsurface defect without heating the surface. The stimulation of the subsurface defect causes a complex combination of absorption, scattering, beam spreading and dispersion. The ultrasonic waves spread towards all of the orientations in the form of heat [26,27].
Figure 5 shows the VT set-up. The same IR camera with the frame rate of ∼55 fps was used. The transducer was pressed (200 Pa) against the specimen and two periods of 0.2 Hz (10 s) lock-in ultrasonic waves were delivered.

3.2. Ultrasonic C-Scan

Ultrasonic c-scan (UT) has the ability to detect flaws in either the partial or entire thickness of the materials. In this paper, UT experiments were conducted in reflection mode; water was used as the wedge and the back wall signals were used for imaging. The UT experimental set-up in Figure 6 consists of a ‘Olympus OmniScan MX’, a probe ‘Olympus PANAMETRICS-NDT A310S 5 MHz/0.25″’, a robotic x-y glider scanner ‘IAI Robo Cylinder RCP2’ for raster scanning, and a water tank. The distance between the probe and the specimen is ∼10 mm, and the system resolution is 0.2 mm.

3.3. Continuous Wave Terahertz

The principles of continuous wave (CW) terahertz (THz) and millimetre-wave imaging have been known for several decades. The electromagnetic spectrum of millimetre-wave generally ranges from 30 GHz to 300 GHz, which has a region of overlap between 100 GHz and 300 GHz with THz spectroscopy [28,29,30]. Compared to pulsed THz imaging which can provide depth, frequency-domain or time-domain information of the object, CW THz imaging can only yield intensity data when a fixed frequency source and a single detector are used. However, the CW imaging system is compact, simple, fast and relatively low-cost without a pump–probe system [31,32].
The CW THz system (Figure 7) uses IMPAct ionization Transit Time (IMPATT) diodes to exploit ∼0.1 THz CW imaging, and the system resolution is ∼3 mm. It consists of a detector ‘TeraSense Linear-1024’, a CW emitter ‘TeraSense TS 1603’, and a robot ‘Funac LR Mate 200iD 7L’ to perform a line scanning. The detector has a spectral range of 40 GHz–0.7 THz and a frame rate of ∼8.2 fps. The pixel size of the detector is 1.5 mm × 1.5 mm, and the number of pixels is 1024 (256 × 4). The emitter has an optimized frequency of ∼0.1 THz and 1 µs rise/fall time (TTL Modulation). The detector records 256 × 4 pixels (384 mm × 6 mm) into one frame. The distance from the specimen to the CW emitter/detector was ∼10 cm [32].

4. Infrared Image Processing

Principal component thermography (PCT) [33] has been used as an infrared image processing technique to extract the image features and reduce undesirable signals. Different from classical principal component analysis, PCT relies on singular value decomposition (SVD) which extracts spatial and temporal data from a matrix in a compact manner by projecting original data onto empirical orthogonal functions (EOFs). Original data can often be adequately represented with only a few EOFs. Usually, an infrared sequence of 1000 images can be replaced by 10 or less EOF [34]. Another advantage of PCT is its suitability to be combined with other image processing techniques, e.g., in [35,36,37].
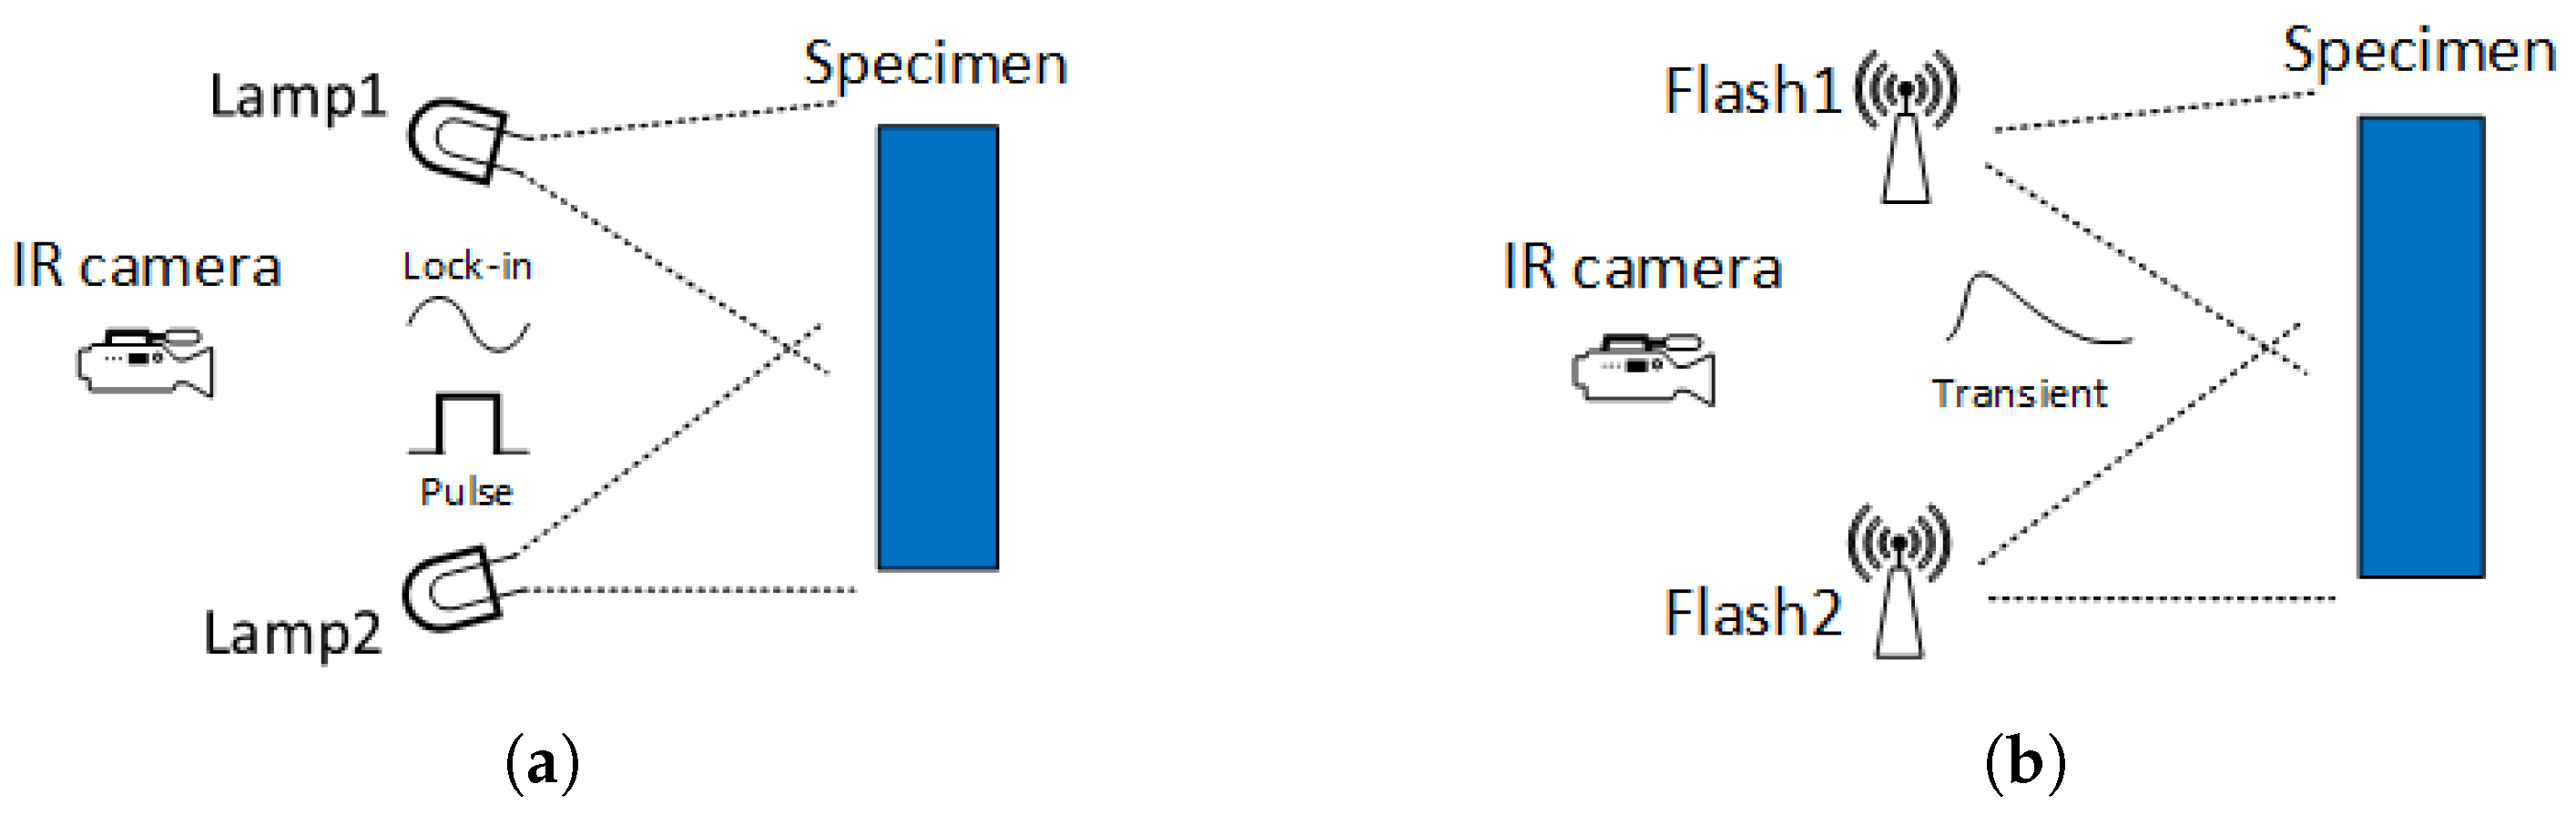
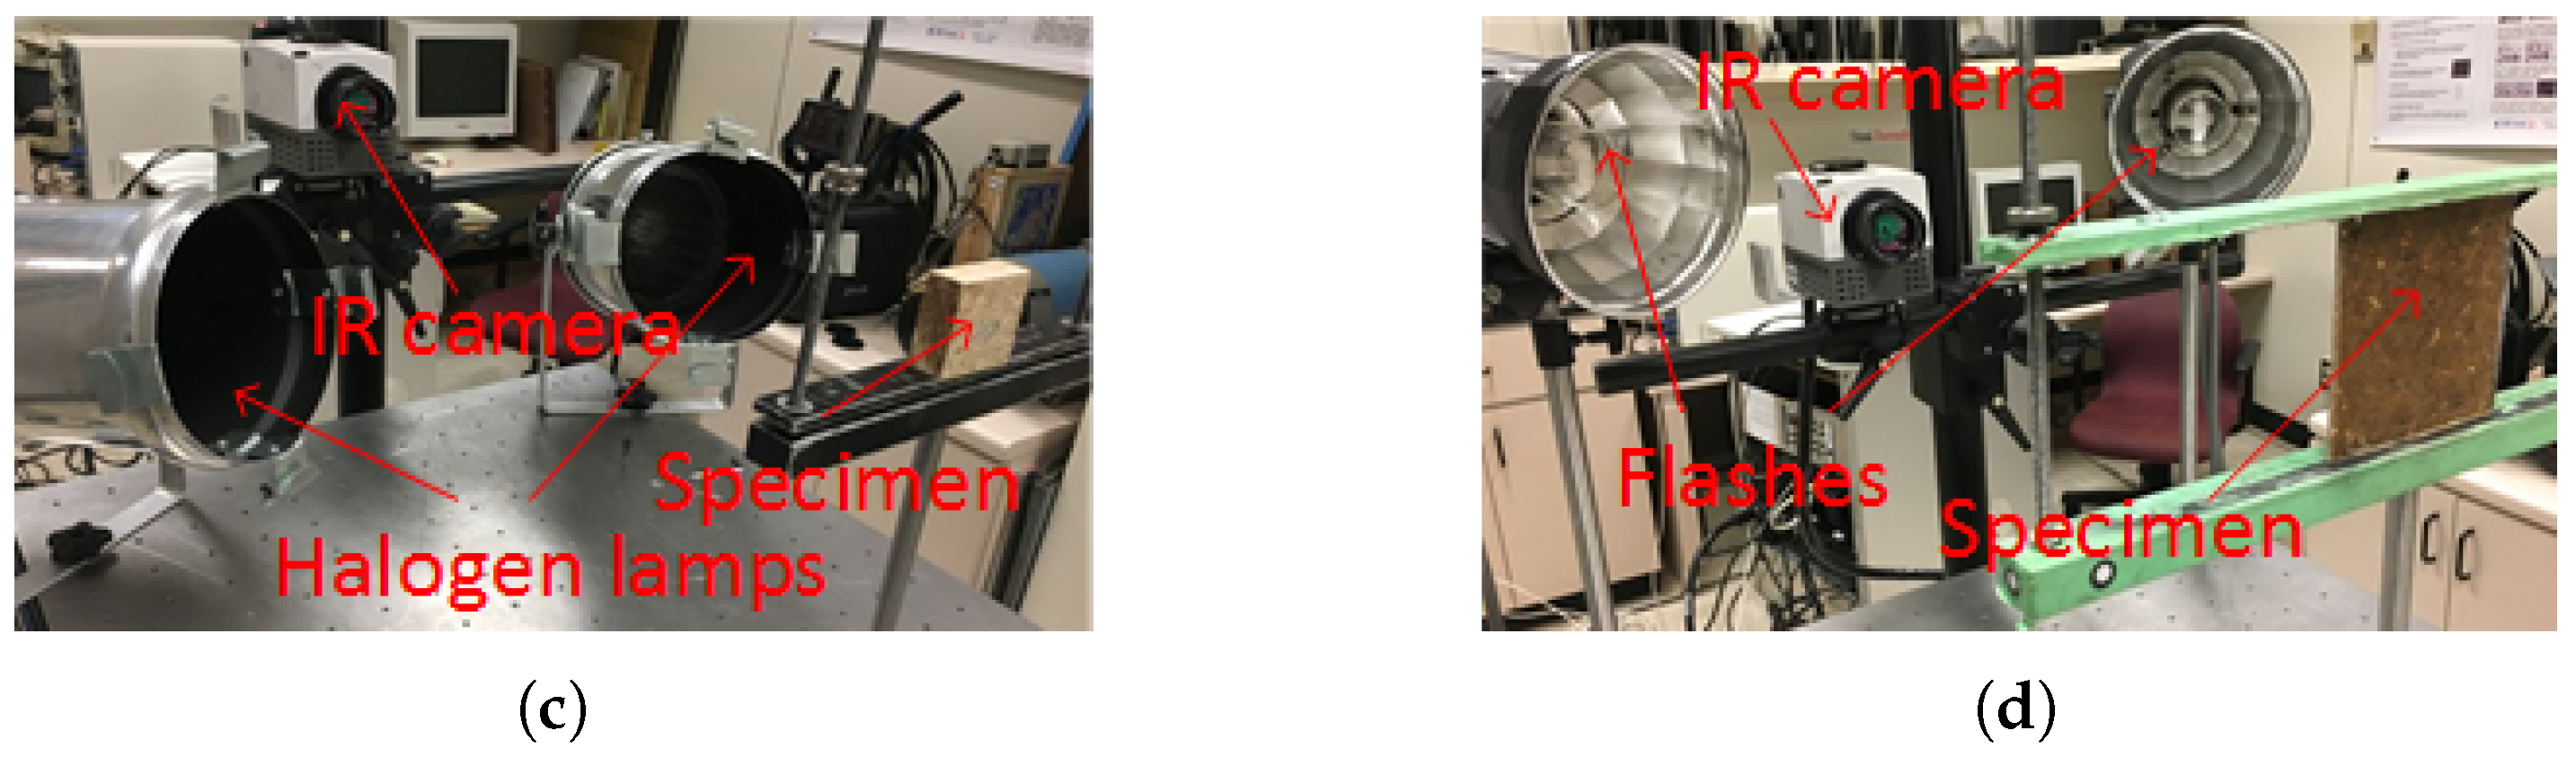
Fast Fourier transform can be used to extract amplitude and phase information from the raw thermal data. It provides the possibility to obtain quantitative results in a straightforward manner. Usually phase is more useful than amplitude because it can retrieve the deeper information. In addition, phase is less affected than raw and amplitude data by environmental reflections, emissivity variations, non-uniform heating, surface geometry and orientation [27]. This method has been used for LT and it is known as phase transform. When used for PT, it is known as pulsed phase thermography (PPT) [38].
The relationship exists between the depth z of a defect and the thermal diffusion length μ . Empirical expressions have been proposed [39]:
z = C 1 · μ = C 1 · α π · f b
where, f b is known as the blind frequency - the frequency at which a given defect has enough (phase or amplitude) contrast to be detected, and C 1 is an empirical constant.
It has been observed that C 1 1 for amplitude transform [40], while reported values for phase transform are in the range of 1.5 to 2 [40], with C 1 = 1.82 typically adopted [41]. Therefore, phase transform is more important than amplitude because it can access the deeper information [27].
According to Equation (1), the thermal diffusivity α is a parameter of particular importance for calculating the depth by PPT. α can be expressed as follows:
α = k ρ c p
where c p (J/kgK) is the specific heat at constant pressure, ρ (kg/m3) is the density, and k (W/mK) is the thermal conductivity.
For composite materials, α can be calculated by:
α c o m p o s i t e = 1 N ( w e i g h t f r a c t i o n m a t e r i a l · α m a t e r i a l ) N
where N is the number of constituent materials in the composites.
Therefore, the thermal diffusivity α can be obtained by calculating c p , ρ and k in Table 5.
In this paper, recursive median filter (RMF) and cold image subtraction (CIS) [42] were used as the pre-processing methods. Table 6 shows the applied experimental and image processing methods for different specimens.

5. Experimental Results and Analysis

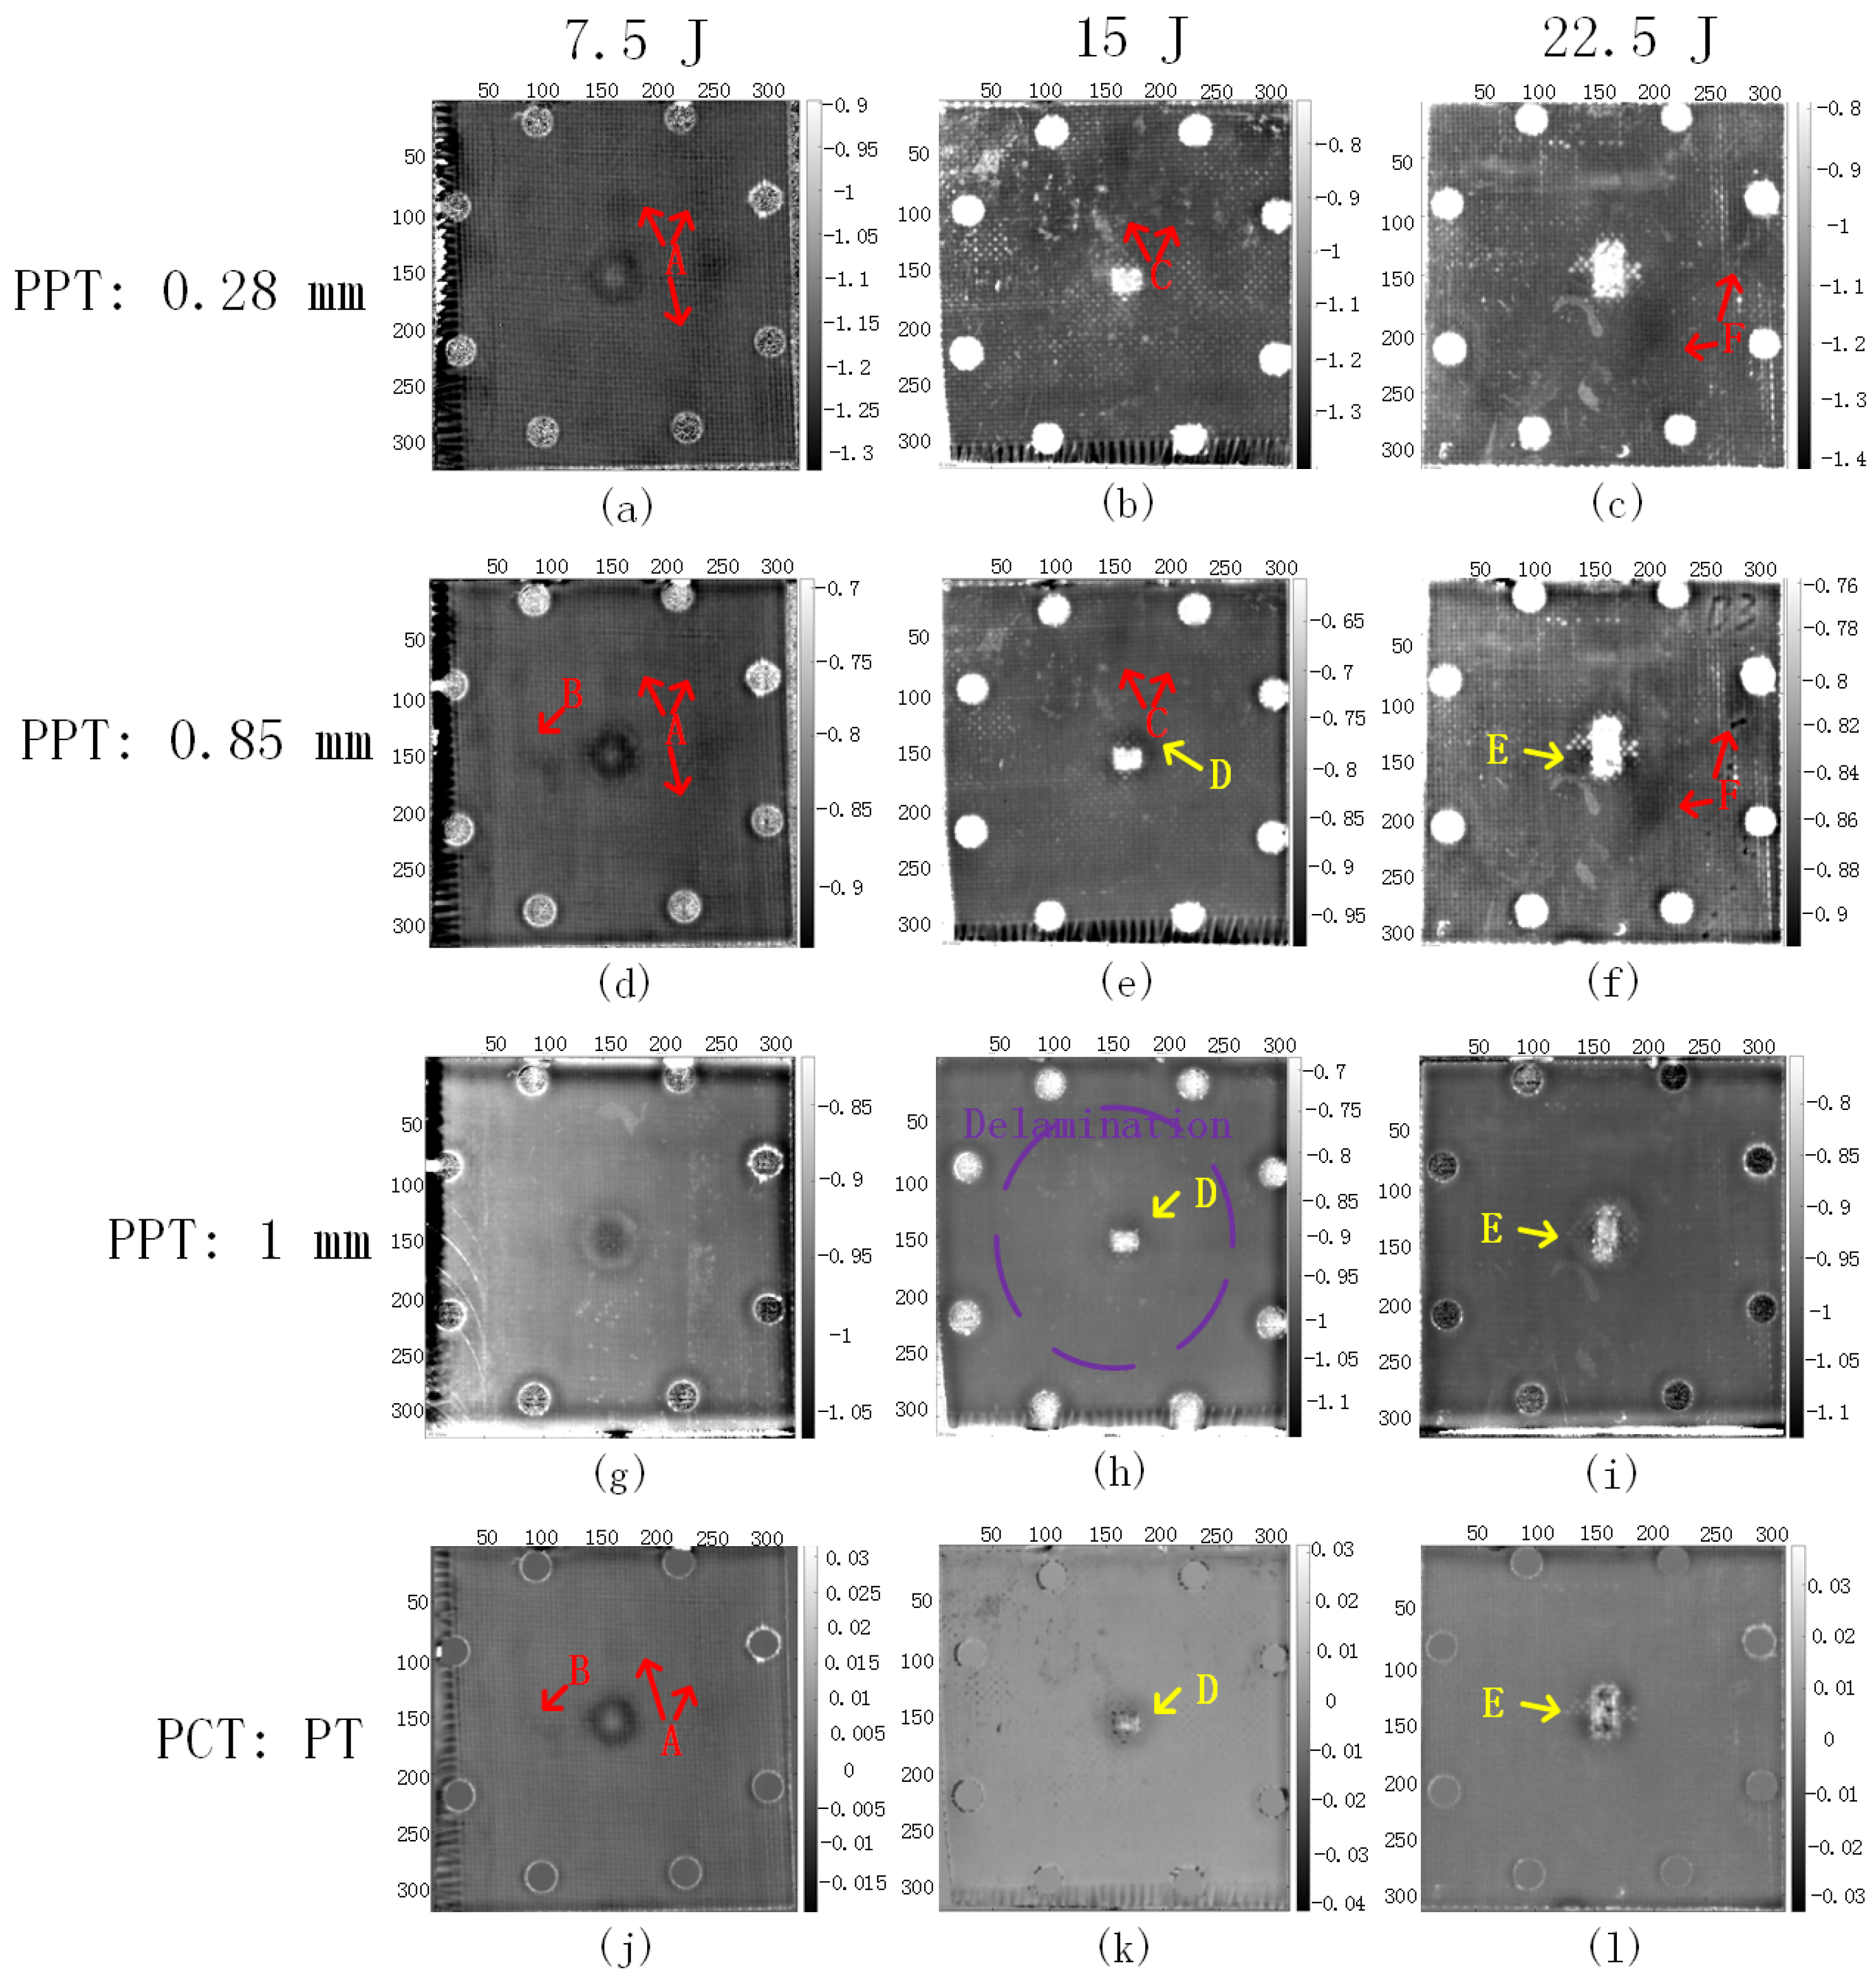
Figure 8 shows the PT results of BFRP. PPT was performed and then the depth information was obtained by Equations (1) and (2) using the physical properties in Table 5. The images from the depths of 0.28 mm (0.6 Hz), 0.85 mm (0.065 Hz) and 1 mm (0.048 Hz) were obtained in flashes and halogen lamps modalities, respectively.
In Figure 8a,b, the resin-rich areas A and C were detected at the depth of 0.28 mm, and were barely detected at the depths of 0.85 mm (Figure 8d,e), then were not detected at all at the depth of 1 mm (Figure 8g,h). The resin-rich areas B and F were detected at the depth of 0.85 mm (Figure 8d,f) in the clearest view; they were not detected at the depth of 1 mm (Figure 8g,i). The delamination in Figure 8h (marked in purple) was detected at the depth of 1 mm, which suggests its depth. The impact damage (marked in yellow) grew along with the depth increase. Overall, flashes modality provided clearer results than halogen lamps modality, and PPT can provide the additional information. In particular, it can provide the depth information via frequencies for quantitative analysis, which is advantageous.
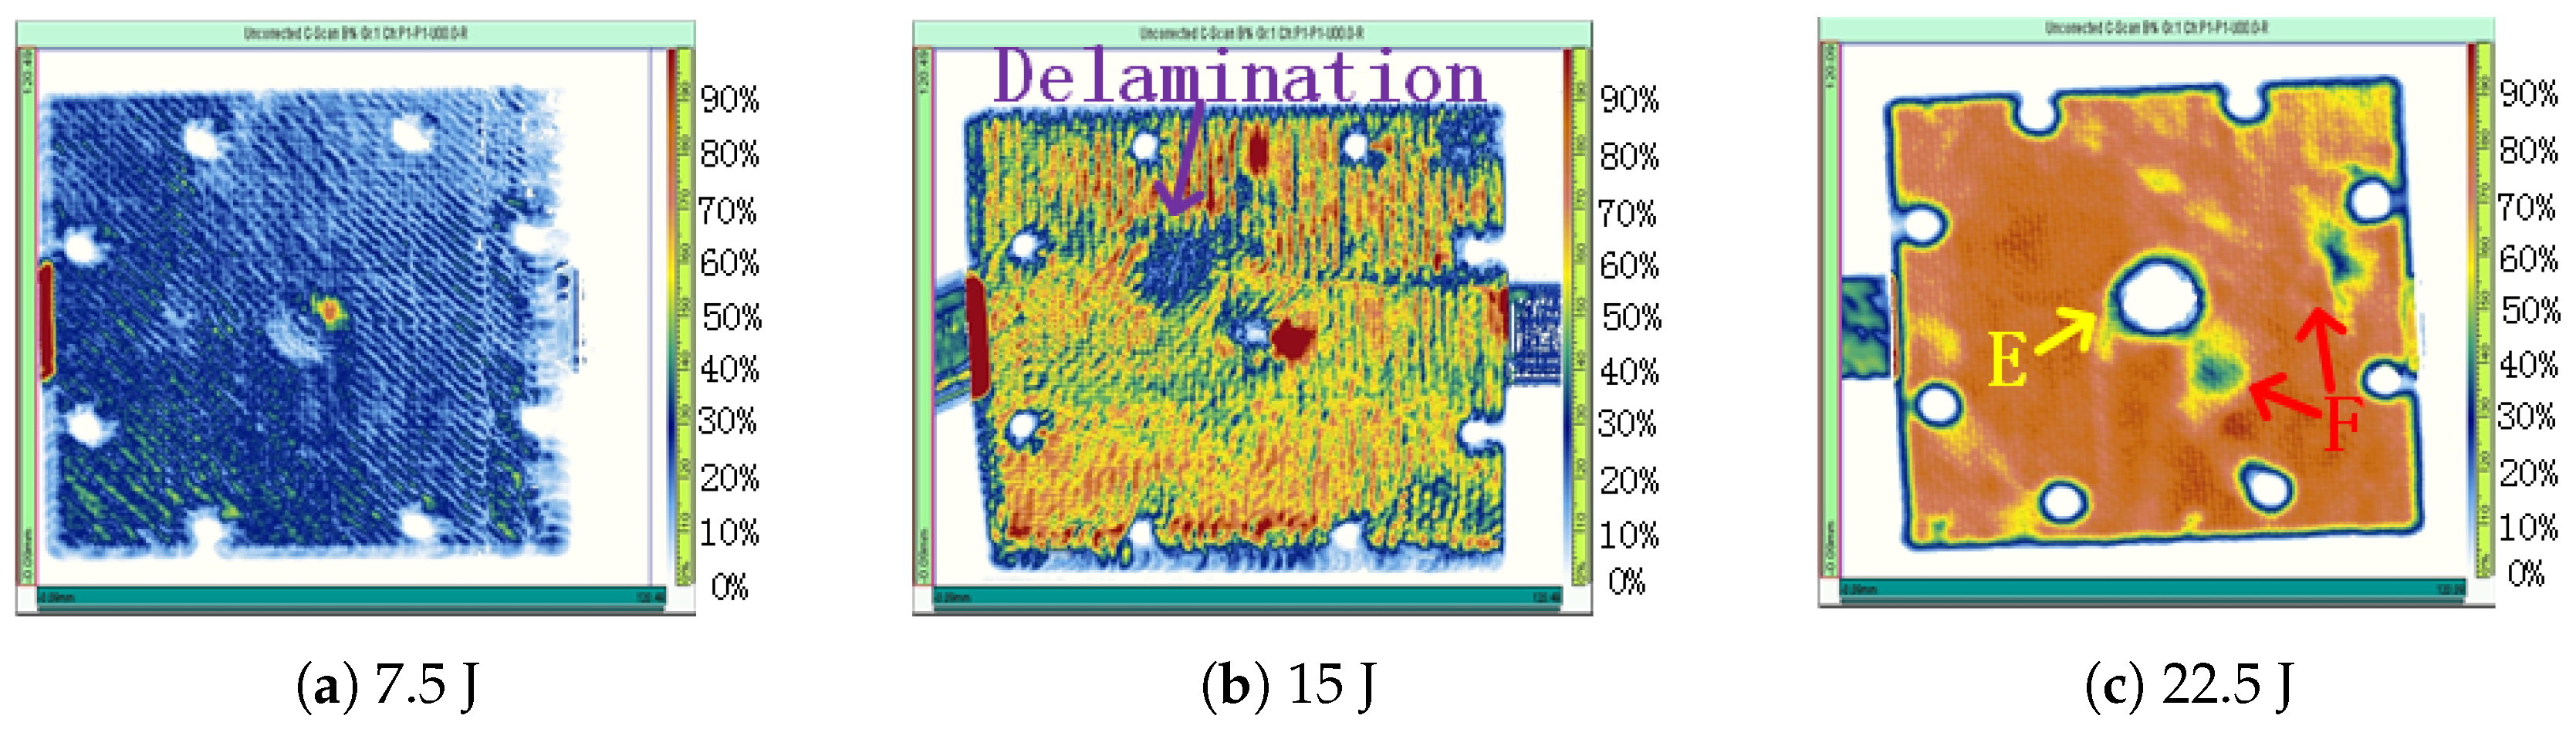
Taking into account the UT results in 
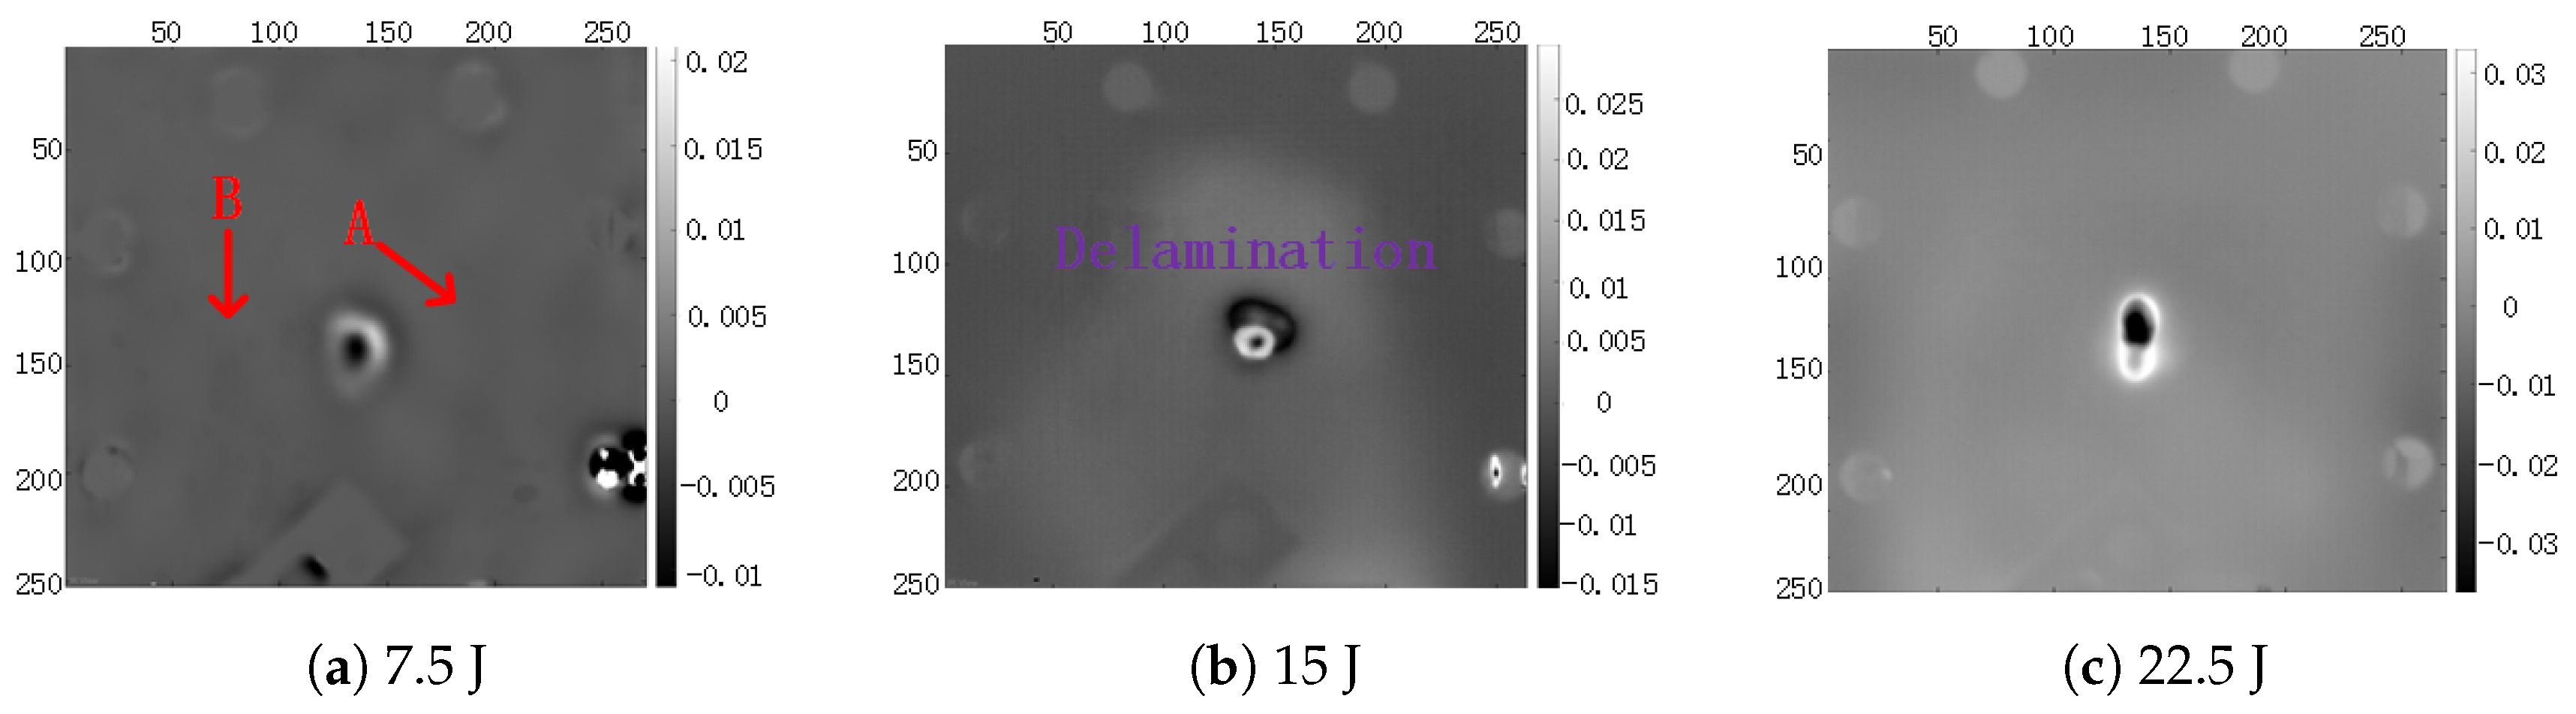
Figure 9, the PT results evidently provided more information, especially for resin-rich areas (marked in red). The VT results in Figure 10 only showed clear identification for delamination, but not for resin-rich and impact damage areas.
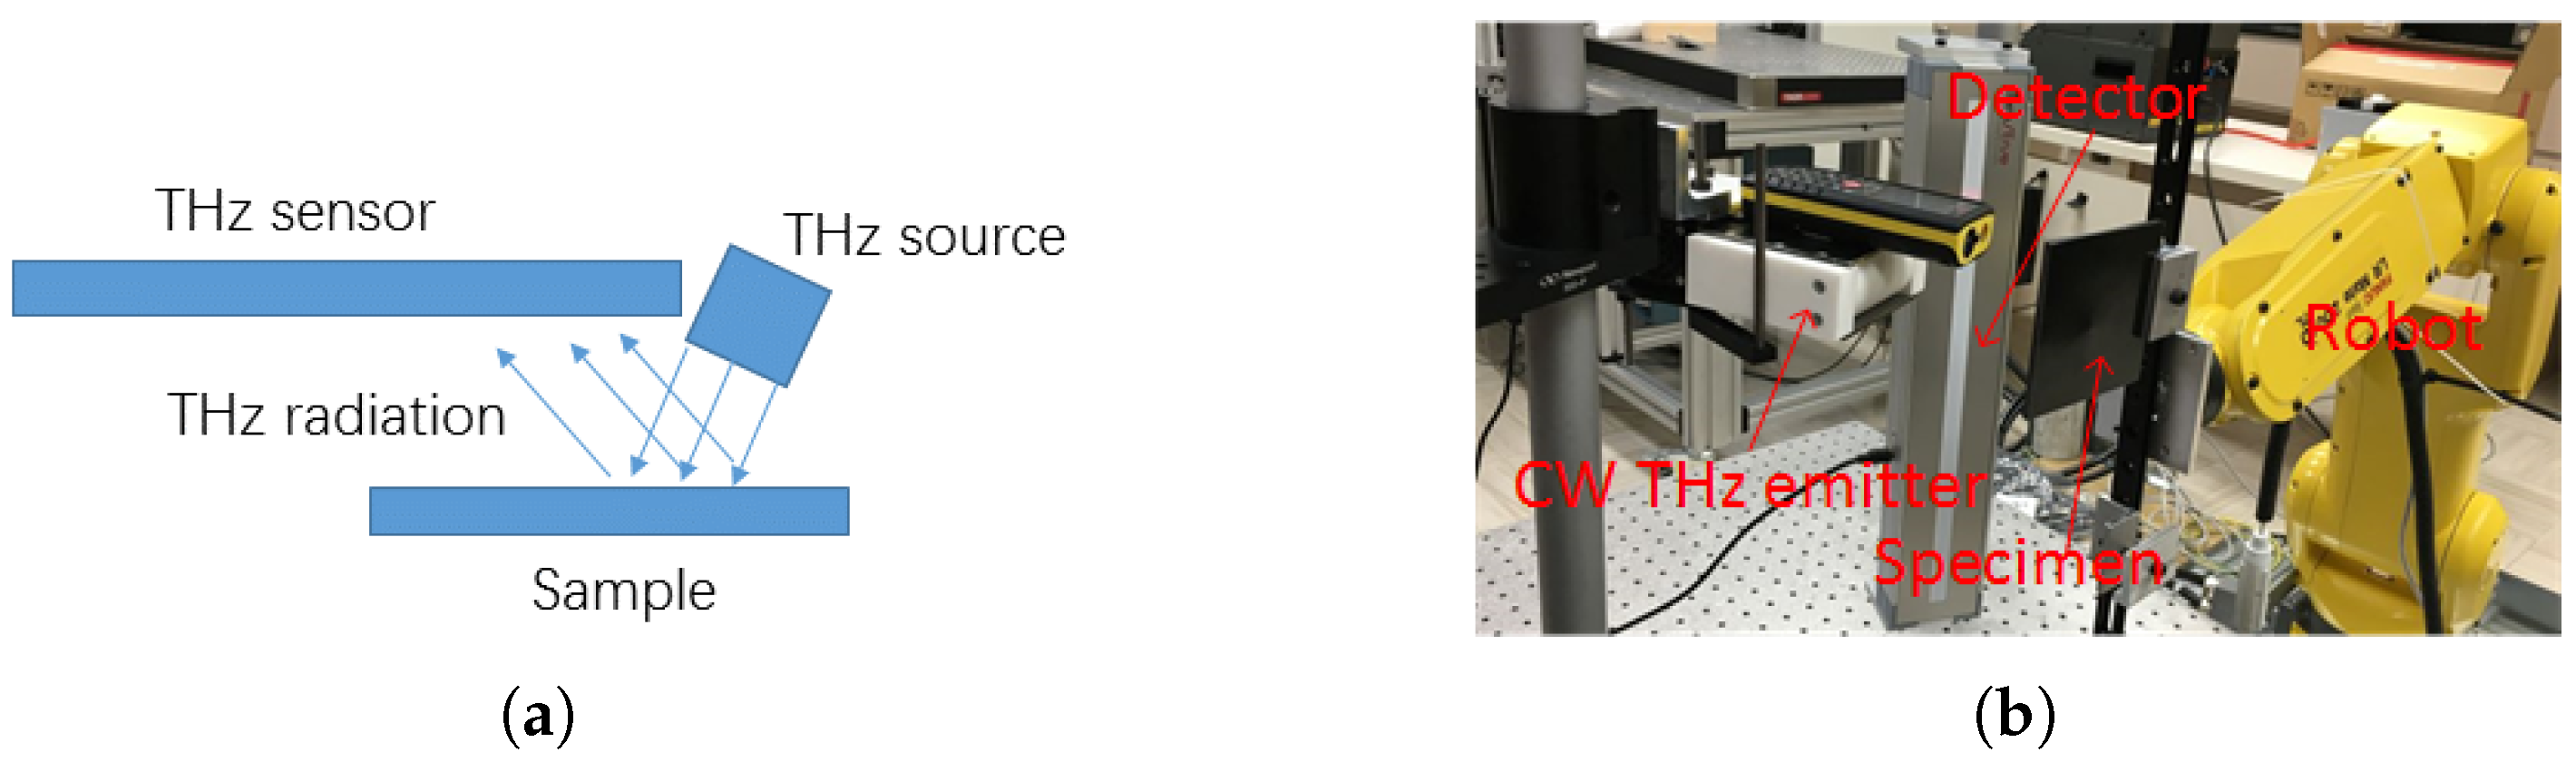
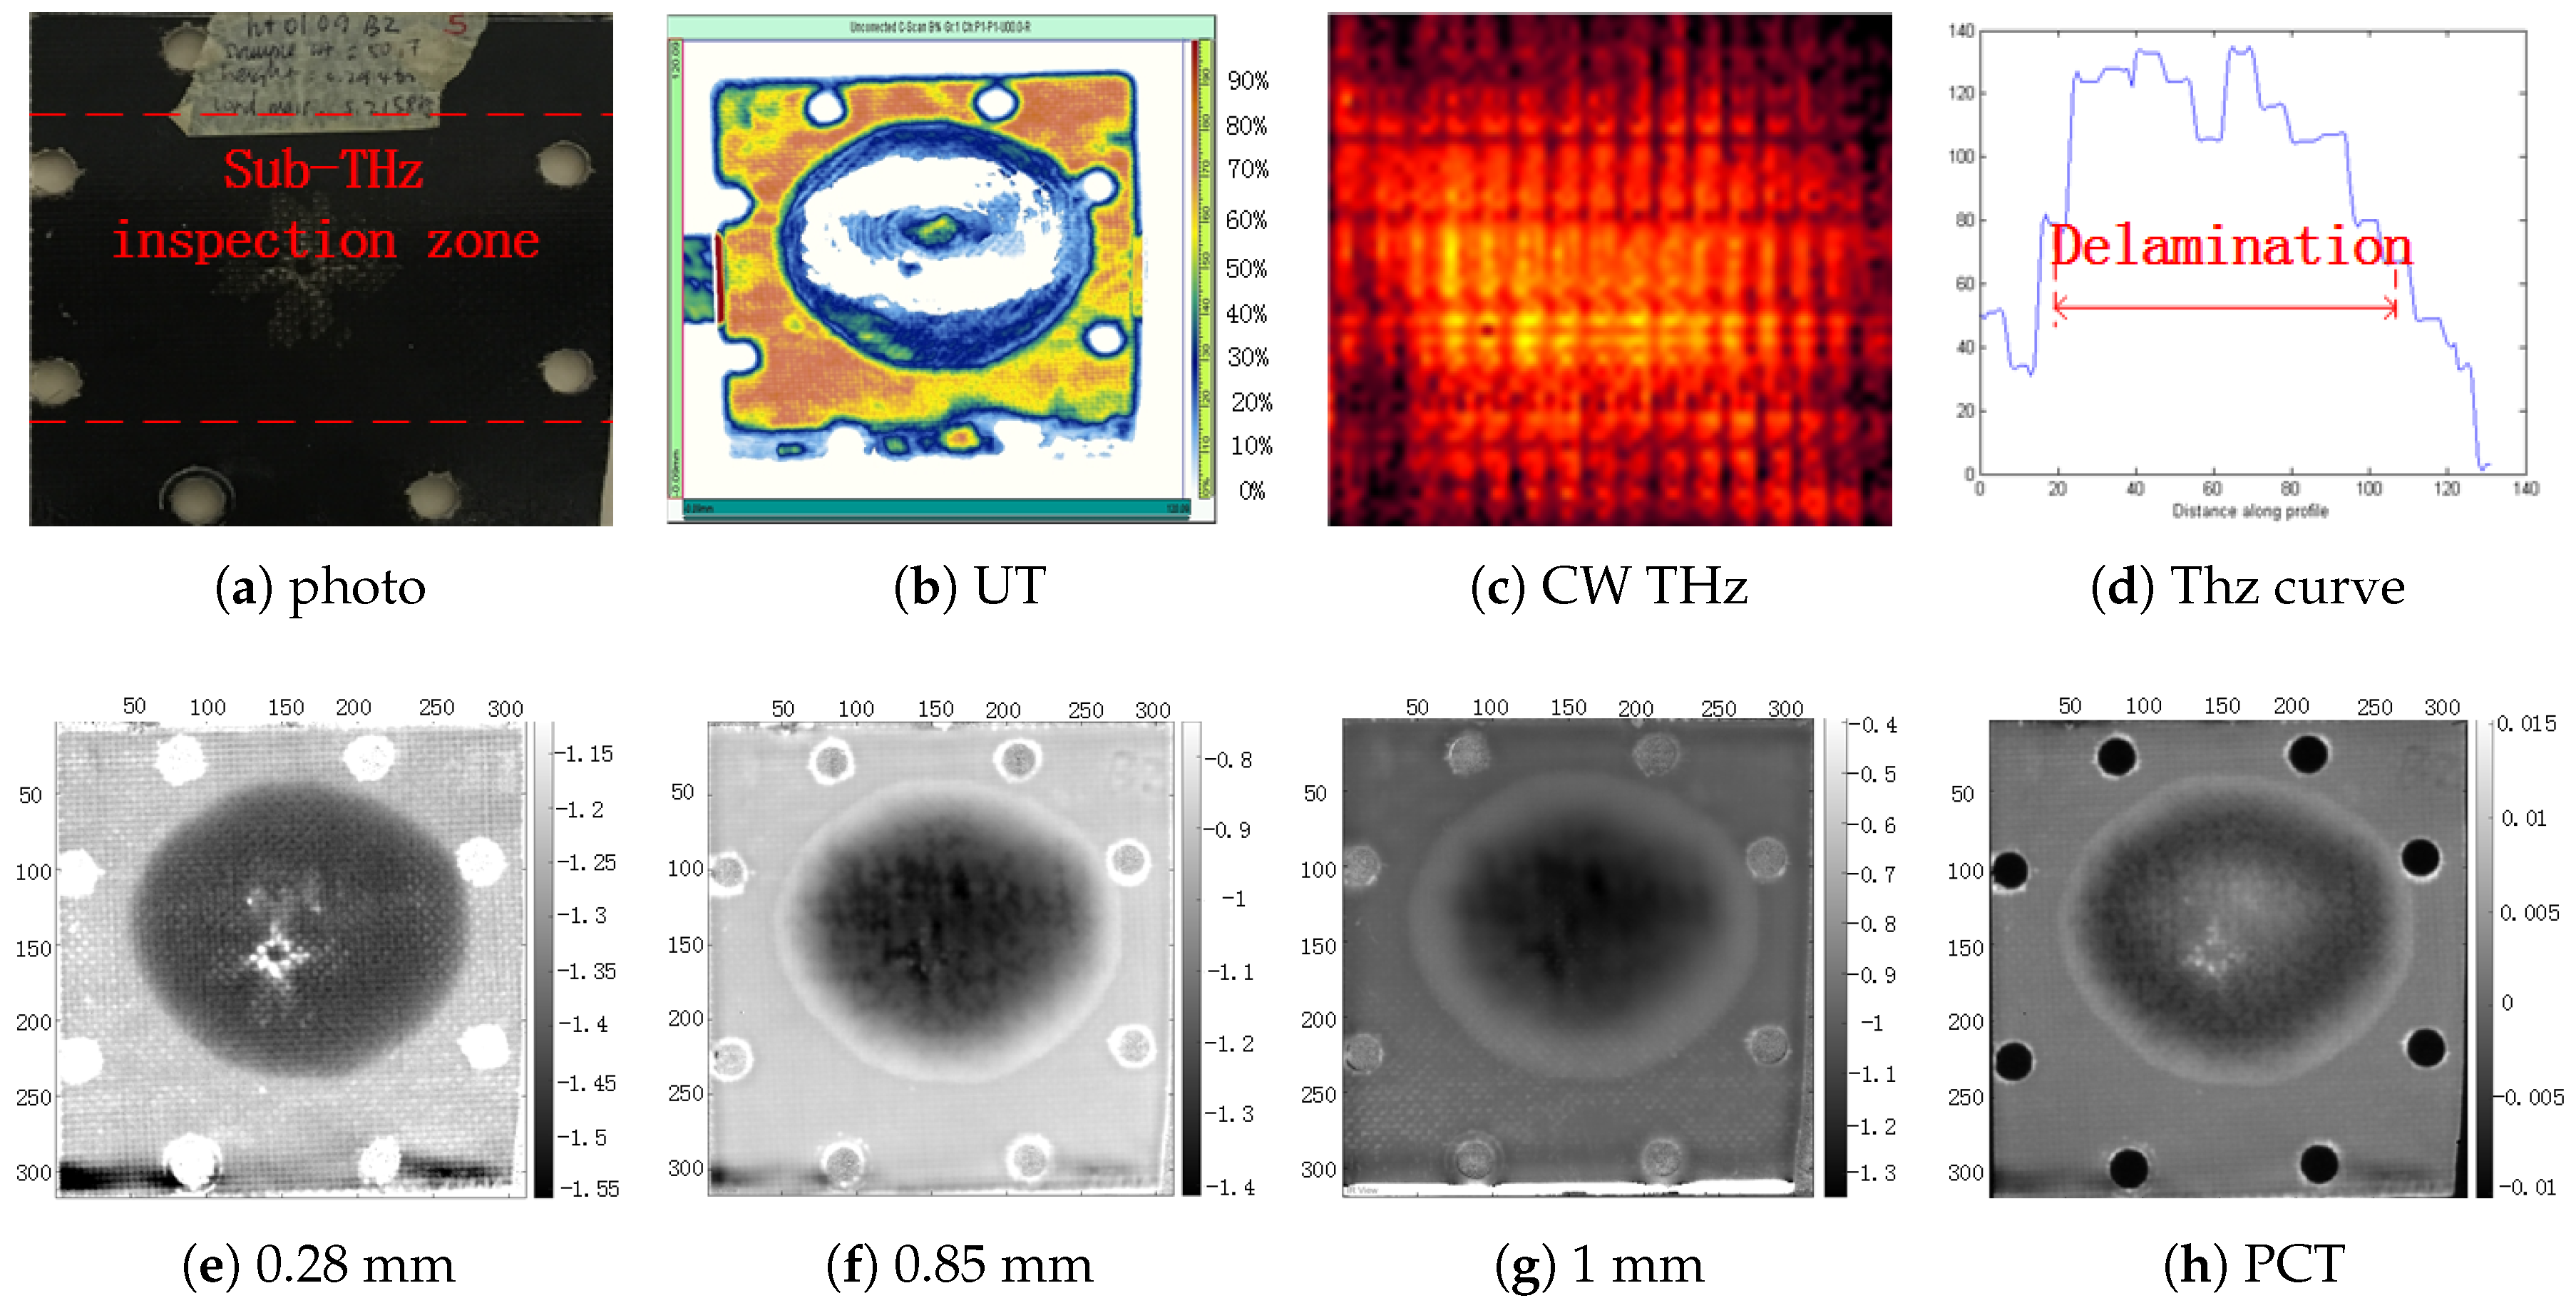
The delamination was shown more clearly in the front-side inspection in Figure 11. PPT provided additional information (Figure 11e–g, in which the delamination shrinked along with the depth increase. CW sub-THz can detect the delamination, but showed a rough result (Figure 11c). This may be caused by the low resolution (∼3 mm) linked to its low radiation frequency (∼0.1 THz). The depth information in CW inspection is inaccessible. The intensity curve of the CW sub-THz result in Figure 11d showed the delamination feature, which is deepest in the central zone. The fiber information was not detected in BFRP.
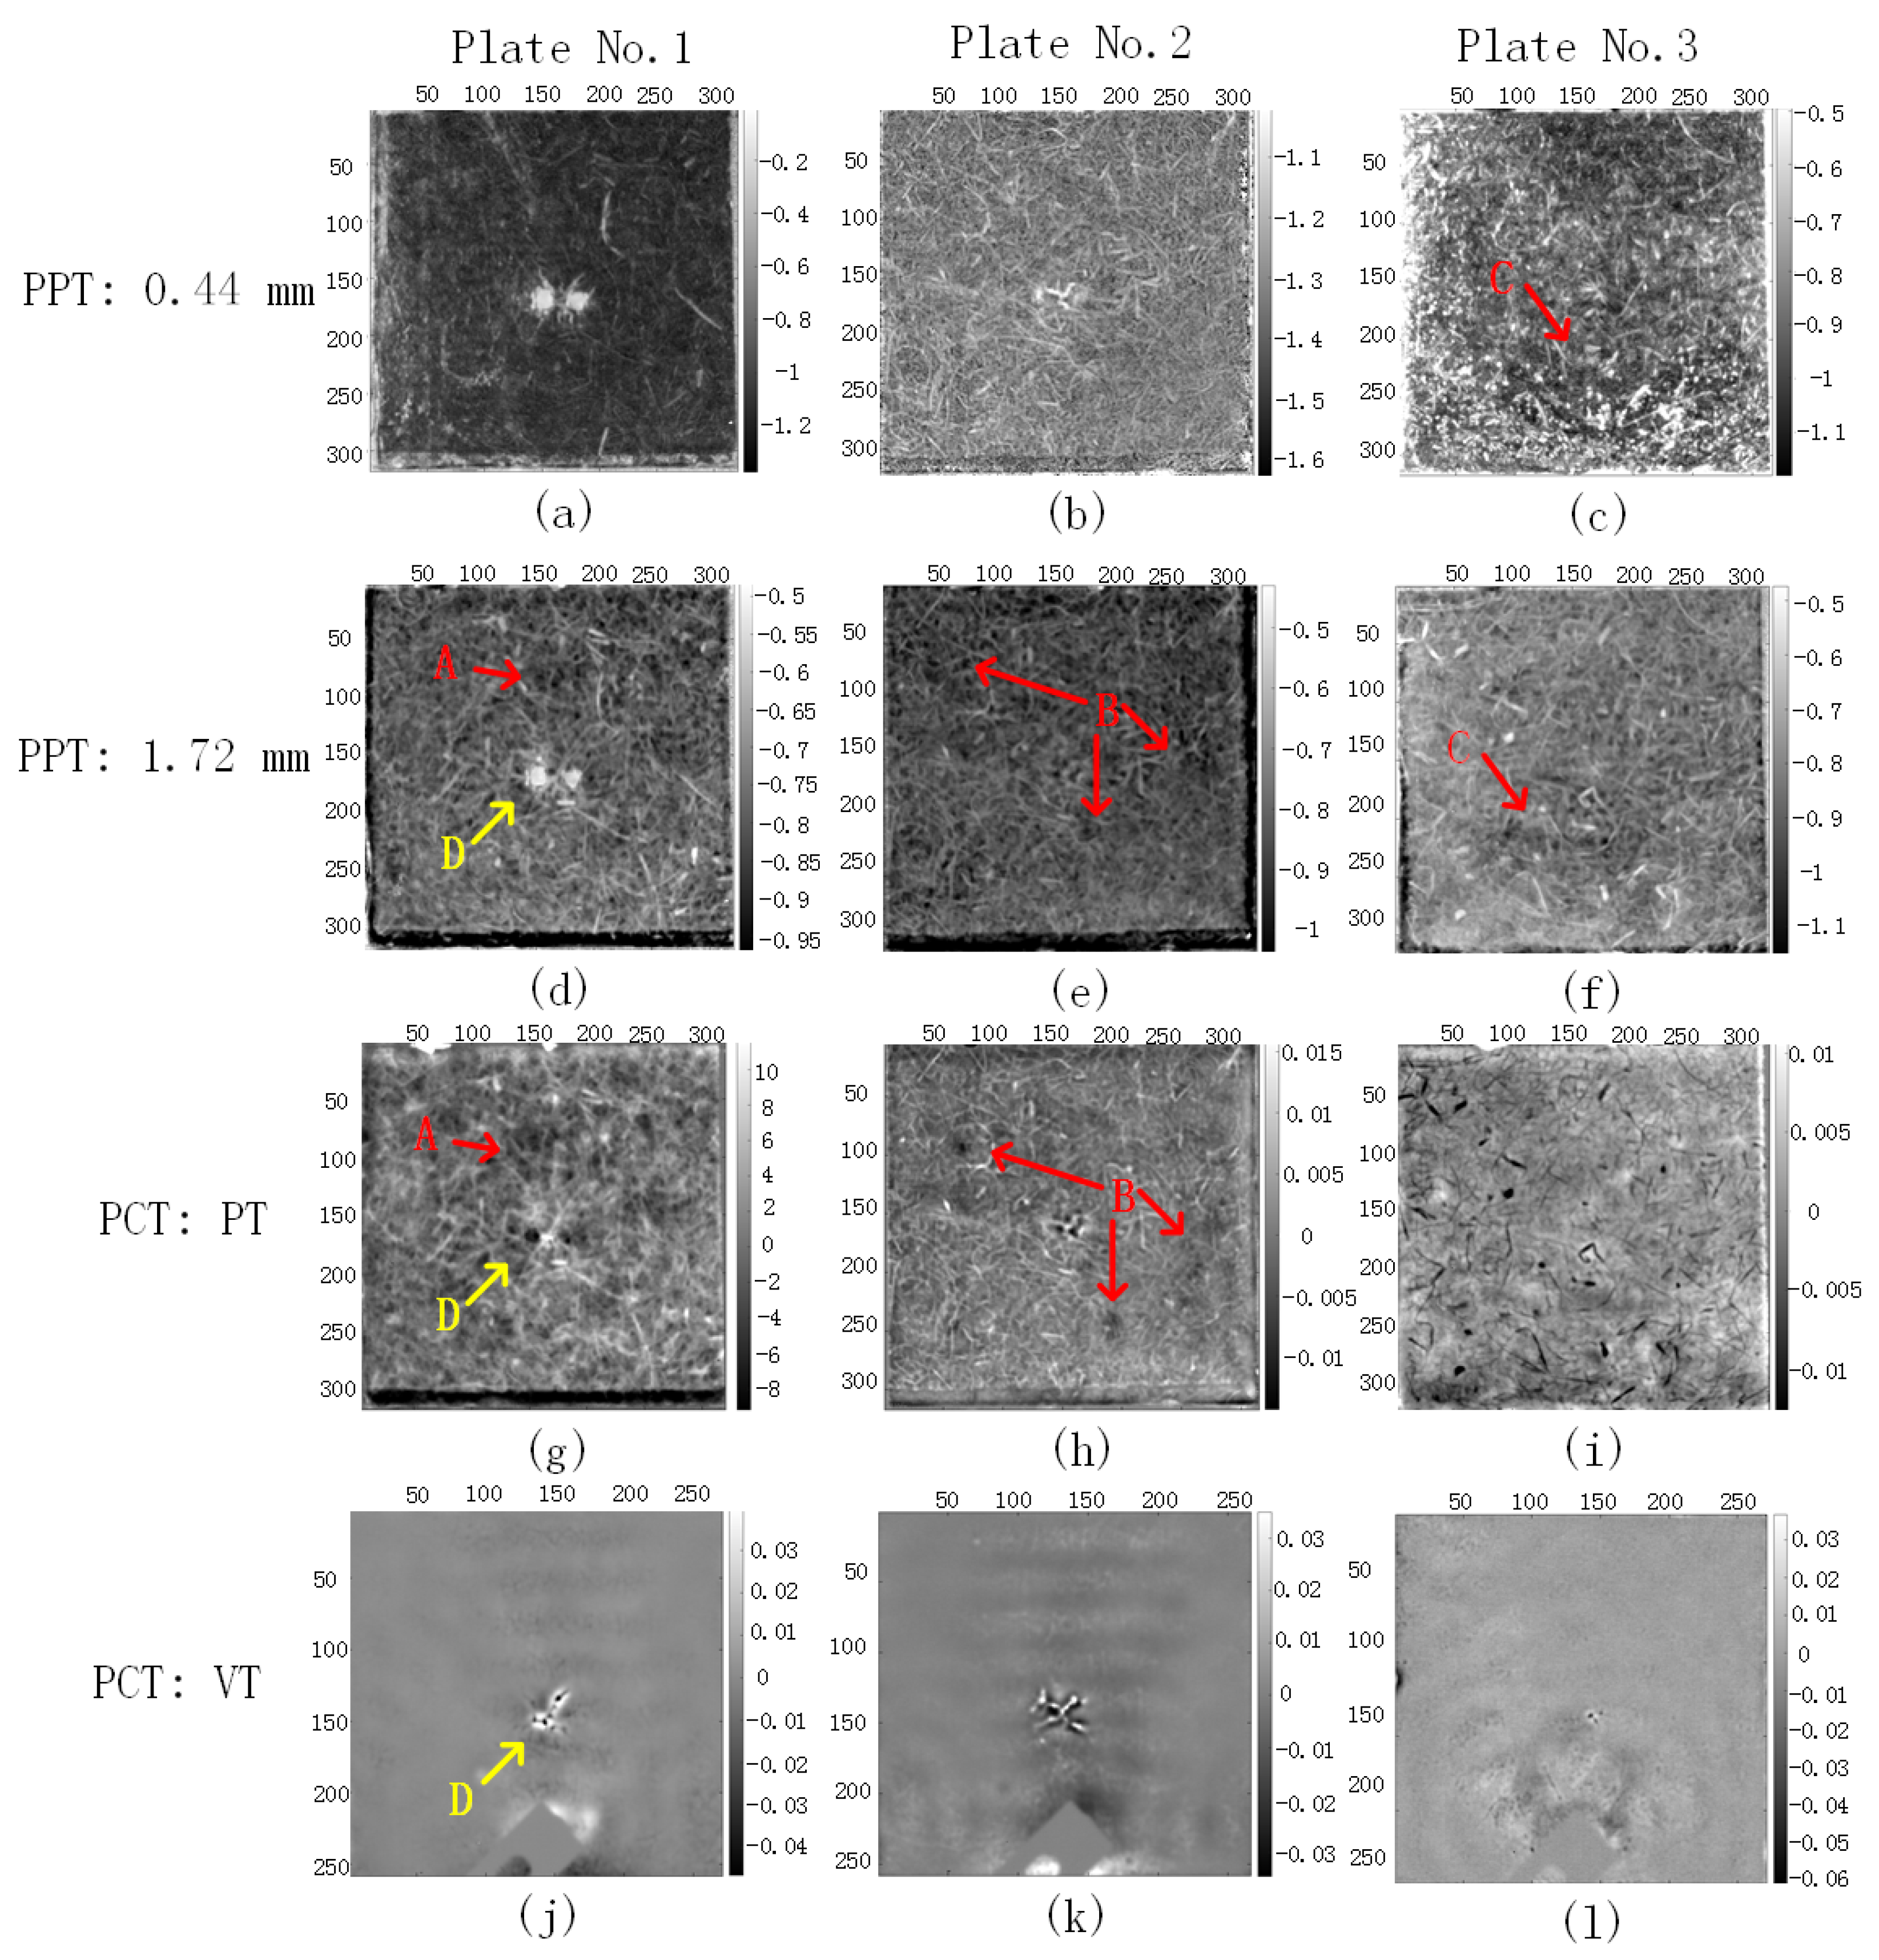
Figure 12 shows the thermographic results of jute/hemp hybrid laminates. The results are linked to the flashes modality because it provides clearer results, and the full thickness can be detected due to the higher thermal diffusivity α . The images from the depths of 0.44 mm (1 Hz) and 1.72 mm (0.066 Hz) were obtained by PPT. Impact damage areas (marked in yellow) other than the visible zones were detected, but not as clear as that in BFRP. The resin-rich areas (marked in red) were clearly detected. The fibers can be identified very clearly, which provides the possibility for the evaluation of fiber orientation. PPT (Figure 12a–f) provided more information than PCT (Figure 12g–i) and VT (Figure 12j–l), especially for the identification of the flaws by means of defect depth retrieval via frequencies. PCT showed the clear identification for both resin-rich and impact damage areas, but the impossibility to perform a quantitative analysis is the disadvantage. VT only showed the impact damage areas, although additional information of resin-rich areas and fibers can be visualized.
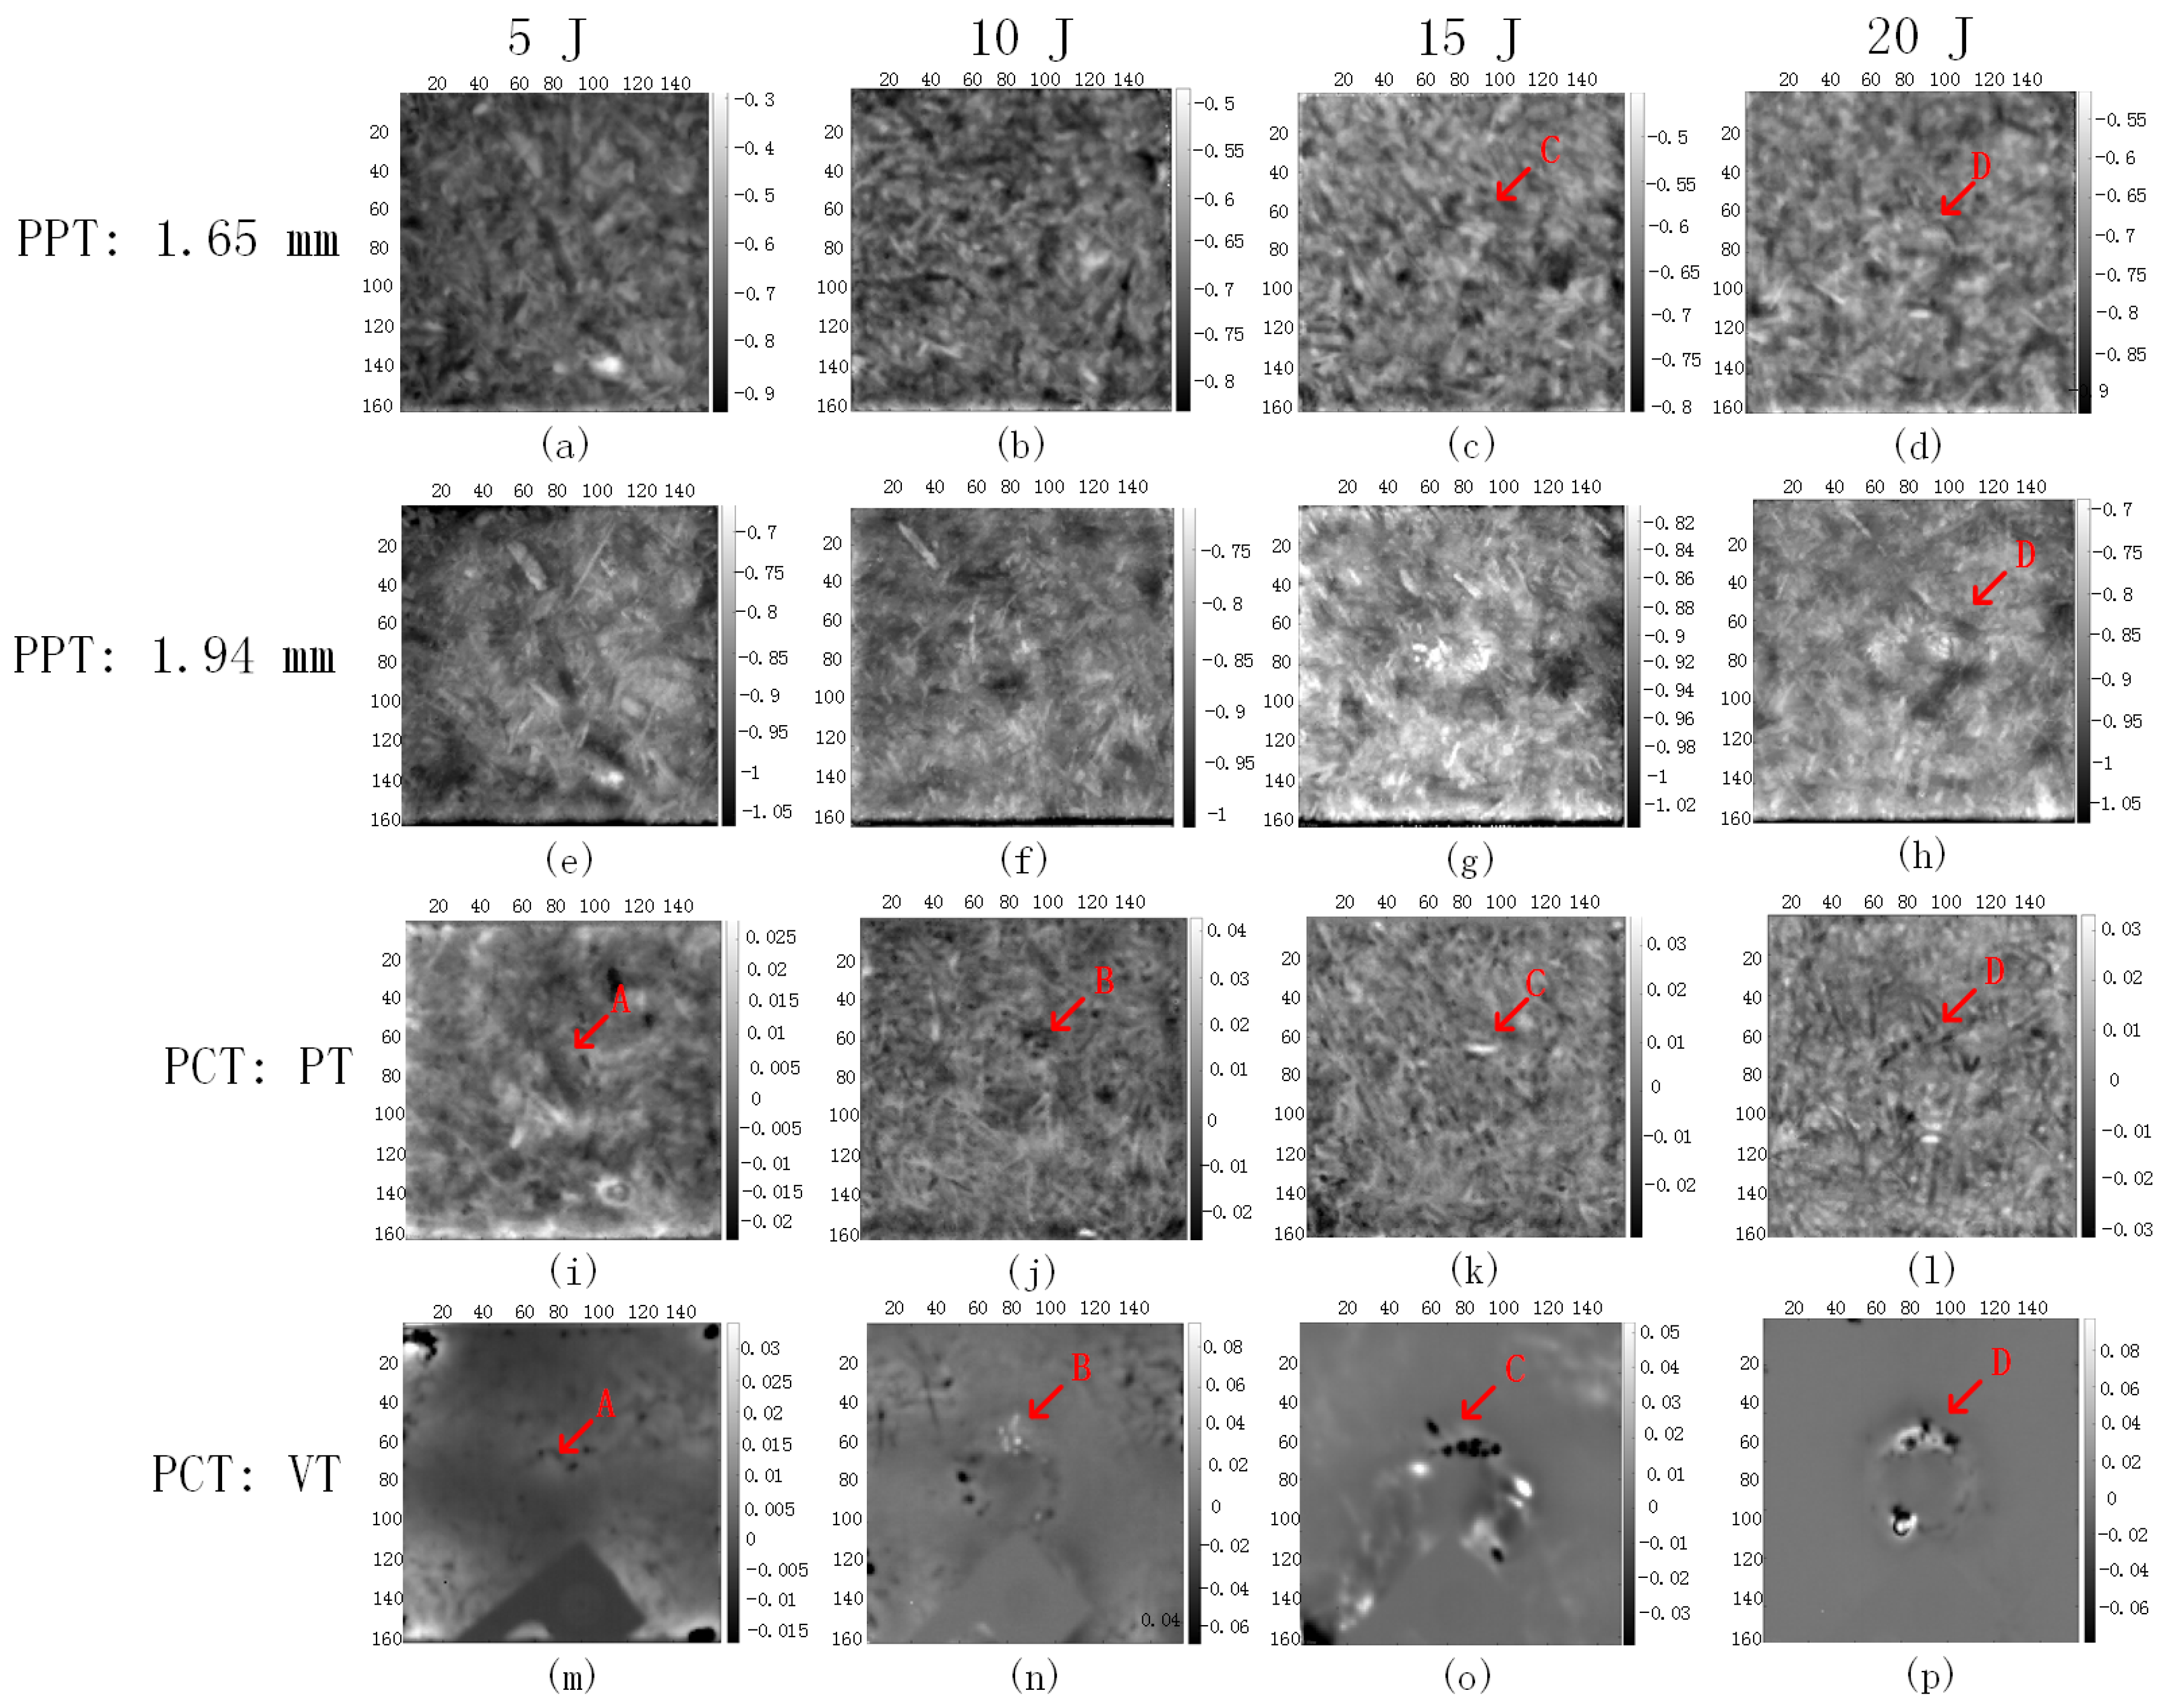
Figure 13 shows the thermographic results of SCB. The images from the depths of 1.65 mm (0.066 Hz) and 1.94 mm (0.048 Hz) were obtained. The resin-rich areas were detected, and the fibers can be identified. The fiber orientation evaluation is more difficult in the case of SCB due to the thermal characteristics. The impact damage areas A and B in Figure 13a,b,e,f were not detected at the depths of 1.65 mm and 1.94 mm because they are too close to the surface. The impact damage area C was detected at the depth of 1.65 mm in Figure 13c, and the impact damage area D was detected at depths of both 1.65 mm and 1.94 mm in Figure 13d,h. The depth information is a little bit deeper than the mechanical measurement because the thermal diffusivity α value was calculated using similar and reasonable data present in the scientific literature. Nevertheless, the growing trend of the impact damage areas coincides with the theoretical estimation. The impact damage areas in the four specimens can be detected by PCT. Of interest, VT showed the clearest results for the impact damage inspection of SCB.
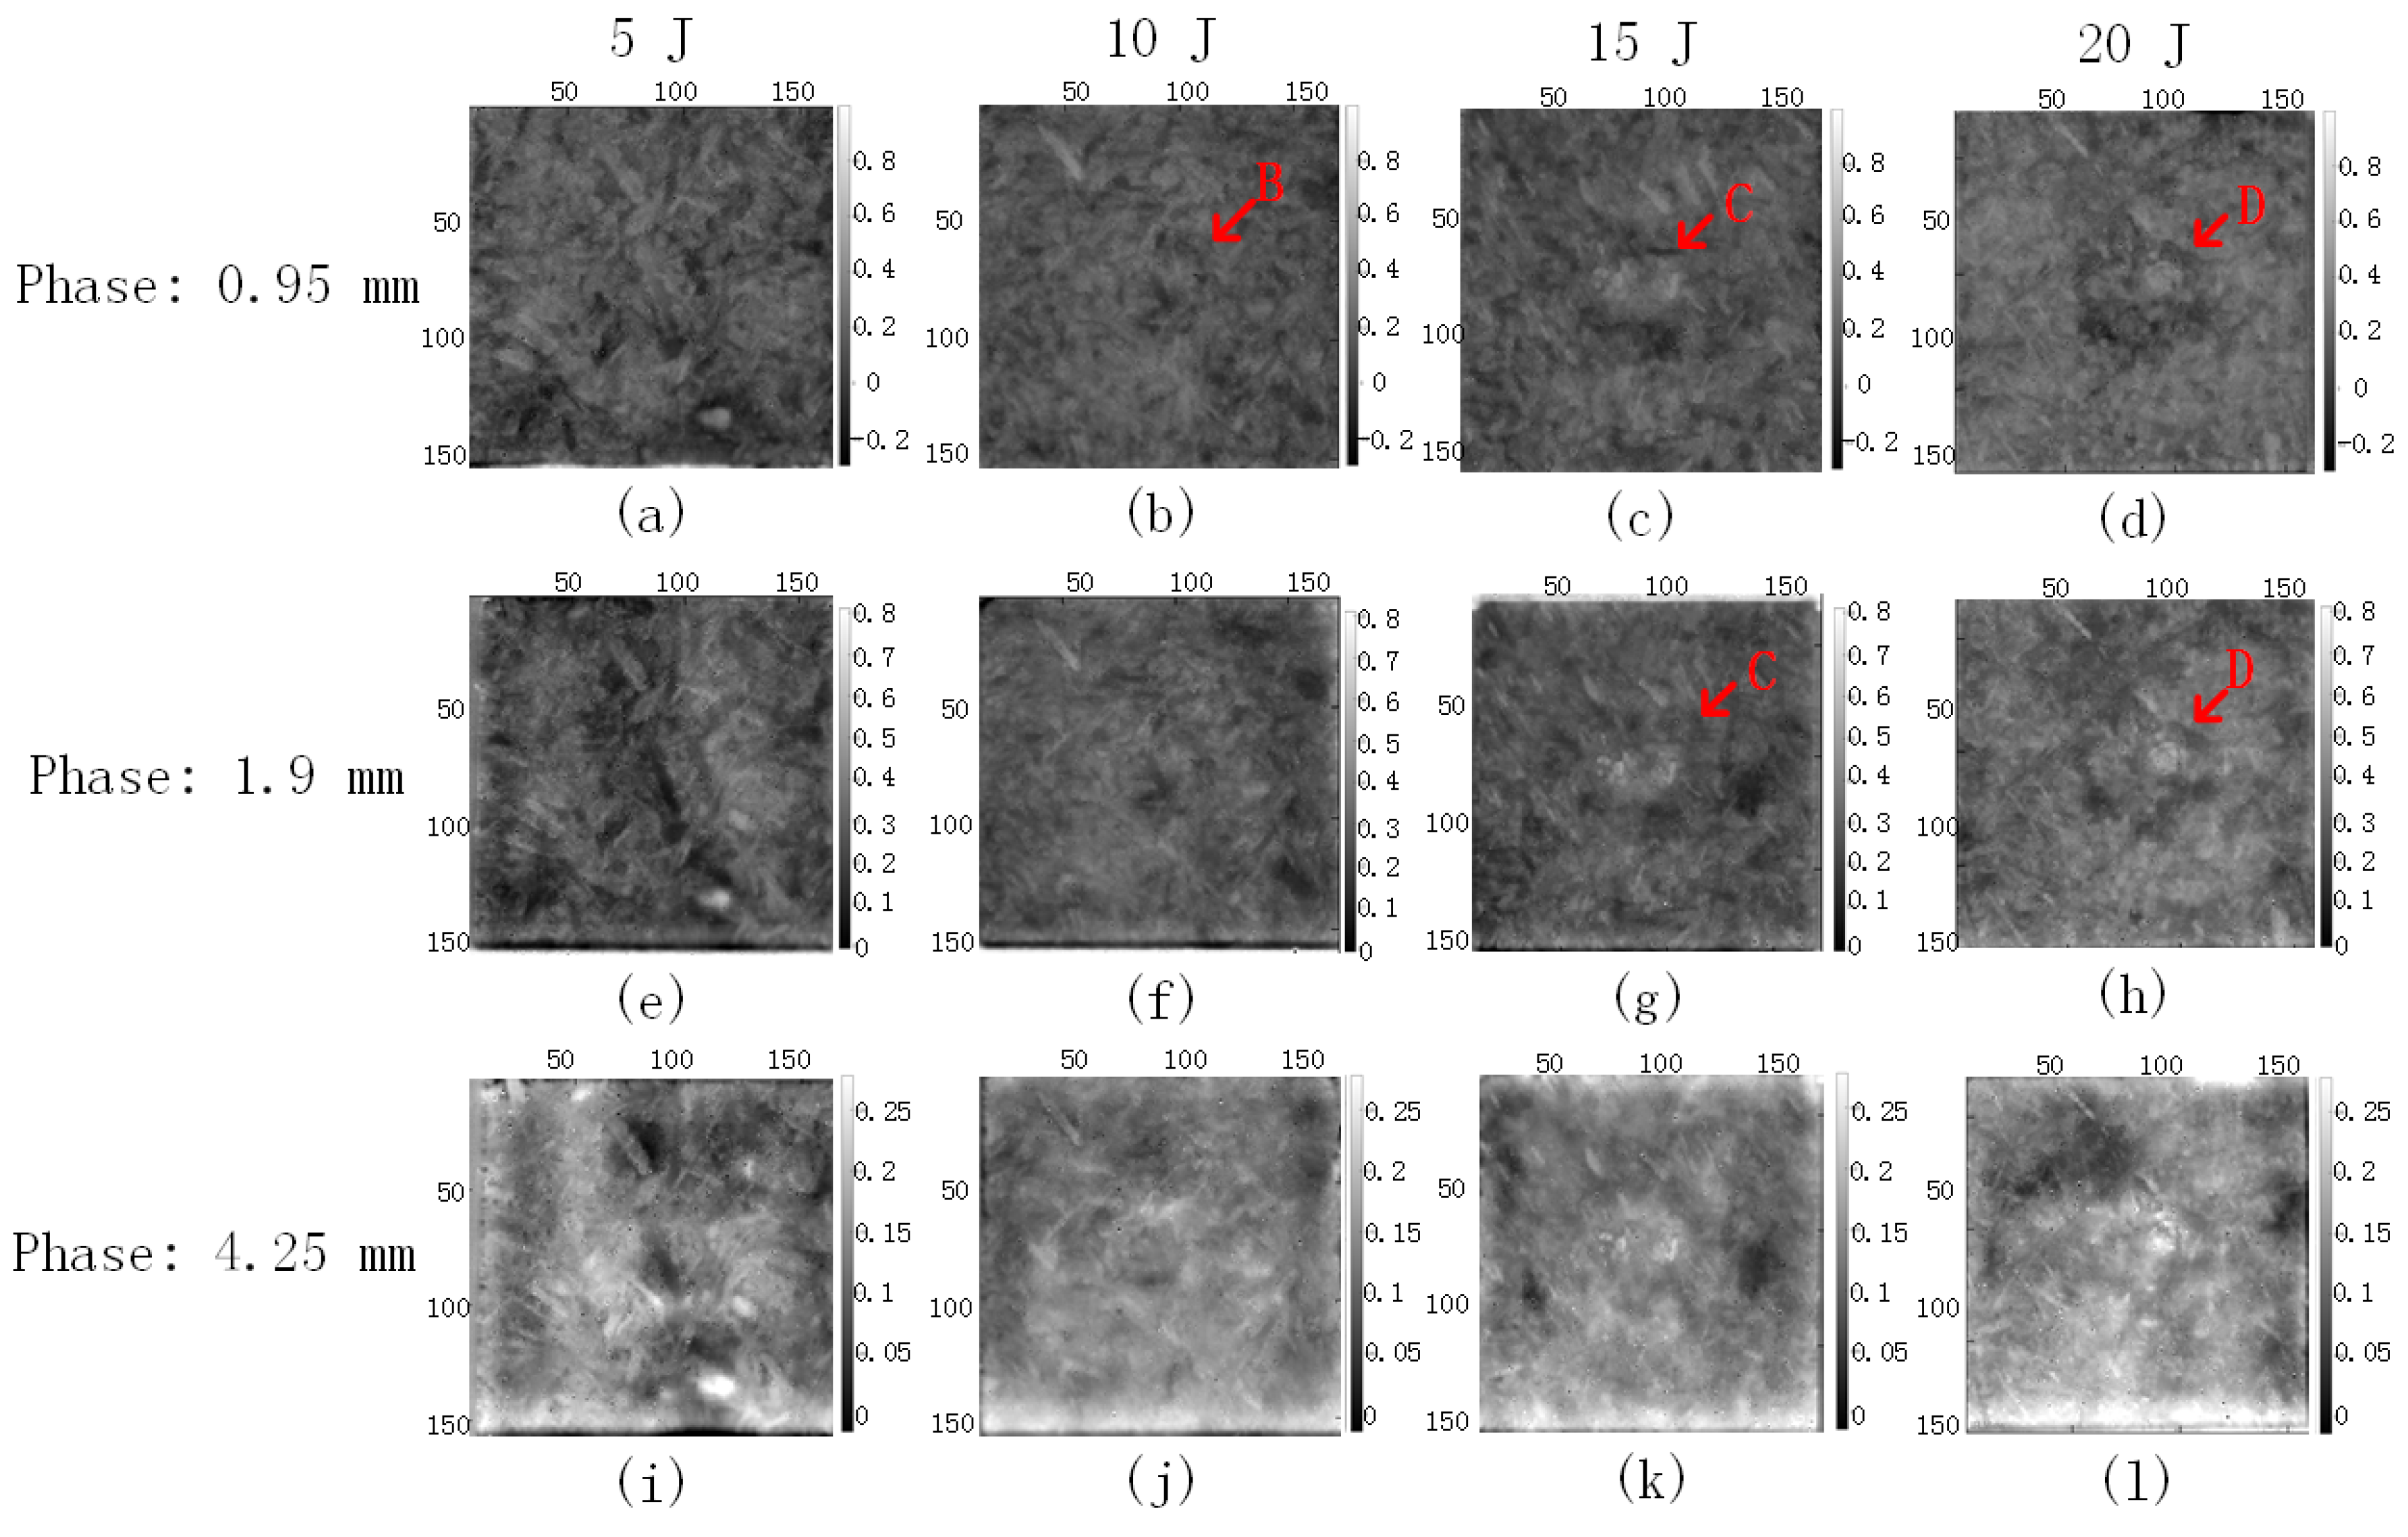
Table 7 shows the relationship between modulated frequency f b and depth z according to Equation (1) for phase-based LT. Figure 14 shows the LT (phase) results of SCB at depths of 0.95 mm, 1.9 mm and 4.25 mm. The impact damage area A was not detected at the depths of 0.95 mm and 1.9 mm in Figure 14a,e because it is located so close to the surface. The impact damage area B was detected at the depth of 0.95 mm in Figure 14b, but not at the depth of 1.9 mm in Figure 14f, which coincides with the mechanical measurement. The impact damage areas C and D were detected at the depths of 0.95 mm (Figure 14c,d) and 1.9 mm (Figure 14g,h) which is due to the calculation of the thermal diffusivity α from literature data. All the impact damage areas were not detected at the depth of 4.25 mm. The growing trend of impact damage in SCB coincides with the theoretical estimation. The resin-rich areas were also detected by phase-based LT, which showed clearer results, but the longer inspection time is the disadvantage.

6. Conclusions

Table 8 shows the capabilities of the thermographic techniques applied on the natural fiber-reinforced polymer composites. Overall, IRT shows clearer results than UT and CW THz. Phase-based PT and LT can provide depth information and clearer results for more features than PCT and VT. VT can only show clearer results for the delamination in BFRP and the impact damage detection in SCB. The flashes modality can provide clearer results than halogen lamps modality, but the latter can detect deep-defects. On the contrary, quantitative analysis for shallow-defects is available in the flashes modality because a higher frequency could be reached. The fiber identification is difficult for BFRP, but feasible for jute/hemp hybrid laminates and SCB. In addition, the delamination was not found in the two vegetable fiber laminates, which may be caused by the different structures compared to BFRP—the mineral fiber composite.

Acknowledgments

The authors would like to acknowledge the financial support provided by the Natural Sciences and Engineering Research Council (NSERC) of Canada and the Canada Research Chair in Multipolar Infrared Vision (MiViM).

Author Contributions

H.Z. conceived of, designed and performed the experiments, analysed the data and wrote the paper; S.S. provided the project and the graphical abstract as well as helped in performing the experiments, F.S. and C.S. provided the testing specimens; C.I.-C. provided the research guidance; H.F. and N.P.A. provided the assistance to the research; X.P.V.M. is the research supervisor; The manuscript was discussed by all the coauthors.

Conflicts of Interest

The authors declare no conflict of interest. The funding sponsors had no role in the design of the study; in the collection, analyses or interpretation of data; in the writing of the manuscript; and in the decision to publish the results.

Abbreviations

The following abbreviations are used in this manuscript:
BFRPBasalt fiber-reinforced polymer
SCBHomogeneous particleboards of sugarcane bagasse
NDTNon-destructive testing
IRTInfrared thermography
UTUltrasonic C-scan testing
CWContinuous wave
THzTerahertz
PTPulsed thermography
LTLock-in thermography
VTVibrothermography
RMFRecursive median filter
CISCold image subtraction
PCTPrincipal component thermography
PPTPulsed phase thermography
EOFEmpirical orthogonal function

References

  1. Fiore, V.; Scalici, T.; Di Bella, G.; Valenza, A. A review on basalt fibre and its composites. Compos. Part B Eng. 2015, 74, 74–94. [Google Scholar] [CrossRef]
  2. Morova, N. Investigation of usability of basalt fibers in hot mix asphalt concrete. Constr. Build. Mater. 2013, 47, 175–180. [Google Scholar] [CrossRef]
  3. Sim, J.; Park, C.; Moon, D.Y. Characteristics of basalt fiber as a strengthening material for concrete structures. Compos. Part B Eng. 2005, 36, 504–512. [Google Scholar] [CrossRef]
  4. Novitskii, A. High-temperature heat-insulating materials based on fibers from basalt-type rock materials. Refract. Ind. Ceram. 2004, 45, 144–146. [Google Scholar] [CrossRef]
  5. Quagliarini, E.; Monni, F.; Lenci, S.; Bondioli, F. Tensile characterization of basalt fiber rods and ropes: A first contribution. Constr. Build. Mater. 2012, 34, 372–380. [Google Scholar] [CrossRef]
  6. Kogan, F.; Nikitina, O. Solubility of chrysotile asbestos and basalt fibers in relation to their fibrogenic and carcinogenic action. Environ. Health Perspect. 1994, 102, 205–206. [Google Scholar] [CrossRef] [PubMed]
  7. McConnell, E.; Kamstrup, O.; Musselman, R.; Hesterberg, T.; Chevalier, J.; Miiller, W.; Thevenaz, P. Chronic inhalation study of size-separated rock and slag wool insulation fibers in Fischer 344/N rats. Inhal. Toxicol. 1994, 6, 571–614. [Google Scholar] [CrossRef]
  8. Fiore, V.; Di Bella, G.; Valenza, A. Glass-basalt/epoxy hybrid composites for marine applications. Mater. Des. 2011, 32, 2091–2099. [Google Scholar] [CrossRef]
  9. Tabarsi, E.; Kozak, R.; Cohen, D.; Gaston, C. A market assessment of the potential for OSB products in the North American office furniture and door manufacturing industries. For. Prod. J. 2003, 53, 19–27. [Google Scholar]
  10. Madurwar, M.V.; Ralegaonkar, R.V.; Mandavgane, S.A. Application of agro-waste for sustainable construction materials: A review. Constr. Build. Mater. 2013, 38, 872–878. [Google Scholar] [CrossRef]
  11. Hernándezsalas, J.M.; Villaramírez, M.S.; Velozrendón, J.S.; Riverahernández, K.N.; Gonzálezcésar, R.A.; Plascenciaespinosa, M.A.; Trejoestrada, S.R. Comparative hydrolysis and fermentation of sugarcane and agave bagasse. Bioresour. Technol. 2009, 100, 1238–1245. [Google Scholar] [CrossRef] [PubMed]
  12. Zhang, H.; Hassler, U.; Genest, M.; Fernandes, H.; Robitaille, F.; Ibarra-Castanedo, C.; Joncas, S.; Maldague, X. Comparative study on submillimeter flaws in stitched T-joint carbon fiber reinforced polymer by infrared thermography, microcomputed tomography, ultrasonic c-scan and microscopic inspection. Opt. Eng. 2015, 54, 104109. [Google Scholar] [CrossRef]
  13. Florez-Ospina, J.F.; Ospina-Borras, J.E.; Benitez-Restrepo, H.D. Non-Destructive Infrared Evaluation of Thermo-Physical Parameters in Bamboo Specimens. Appl. Sci. 2017, 7, 1253. [Google Scholar]
  14. Wan, M.; Ren, K.; Gu, G.; Zhang, X.; Qian, W.; Chen, Q.; Yu, S. Infrared Small Moving Target Detection via Saliency Histogram and Geometrical Invariability. Appl. Sci. 2017, 7, 569. [Google Scholar] [CrossRef]
  15. Mercuri, F.; Orazi, N.; Paoloni, S.; Cicero, C.; Zammit, U. Pulsed Thermography Applied to the Study of Cultural Heritage. Appl. Sci. 2017, 7, 1010. [Google Scholar] [CrossRef]
  16. Zhang, H.; Yu, L.; Hassler, U.; Fernandes, H.; Genest, M.; Robitaille, F.; Joncas, S.; Holub, W.; Sheng, Y.; Maldague, X. An experimental and analytical study of micro-laser line thermography on micro-sized flaws in stitched carbon fiber reinforced polymer composites. Compos. Sci. Technol. 2016, 126, 17–26. [Google Scholar] [CrossRef]
  17. Yousefi, B.; Fleuret, J.; Zhang, H.; Maldague, X.P.; Watt, R.; Klein, M. Automated assessment and tracking of human body thermal variations using unsupervised clustering. Appl. Opt. 2016, 55, D162–D172. [Google Scholar] [CrossRef] [PubMed]
  18. Yousefi, B.; Mirhassani, S.M.; AhmadiFard, A.; Hosseini, M. Hierarchical segmentation of urban satellite imagery. Int. J. Appl. Earth Obs. Geoinform. 2014, 30, 158–166. [Google Scholar] [CrossRef]
  19. Zhang, H.; Sfarra, S.; Sarasini, F.; Ibarra-Castanedo, C.; Perilli, S.; Fernandes, H.; Duan, Y.; Peeters, J.; Avelidis, N.P.; Maldague, X. Optical and Mechanical Excitation Thermography for Impact Response in Basalt-Carbon Hybrid Fiber-Reinforced Composite Laminates. IEEE Trans. Ind. Inform. 2018, 14, 514–522. [Google Scholar] [CrossRef]
  20. Zhang, H.; Robitaille, F.; Grosse, C.U.; Ibarra-Castanedo, C.; Martins, J.O.; Sfarra, S.; Maldague, X. Optical excitation thermography for twill/plain weaves and stitched fabric dry carbon fibre preform inspection. Compos. Part A Appl. S. 2018. [Google Scholar] [CrossRef]
  21. Sfarra, S.; Ibarra-Castanedo, C.; Sarasini, F.; Santulli, C.; Maldague, X. Basalt Fibre Laminates Non-Destructively Inspected After Low-Velocity Impacts. FME Trans. 2016, 44, 380–385. [Google Scholar] [CrossRef]
  22. Sfarra, S.; Ibarra-Castanedo, C.; Santulli, C.; Paoletti, D.; Maldague, X. Monitoring of jute/hemp fiber hybrid laminates by nondestructive testing techniques. Sci. Eng. Compos. Mater. 2016, 23, 283–300. [Google Scholar] [CrossRef]
  23. Sfarra, S.; Ibarra-Castanedo, C.; Santulli, C.; Sarasini, F.; Ambrosini, D.; Paoletti, D.; Maldague, X. Eco-Friendly Laminates: From the Indentation to Non-Destructive Evaluation by Optical and Infrared Monitoring Techniques. Strain 2013, 49, 175–189. [Google Scholar] [CrossRef]
  24. Fiorelli, J.; Curtolo, D.D.; Barrero, N.G.; Savastano, H.; Pallone, E.M.D.J.A.; Johnson, R. Particulate composite based on coconut fiber and castor oil polyurethane adhesive: An eco-efficient product. Ind. Crops Prod. 2012, 40, 69–75. [Google Scholar] [CrossRef]
  25. Zhang, H.; Sfarra, S.; Sarasini, F.; Fiorelli, J.; Peeters, J.; Avdelidis, N.P.; de Lucca Sartori, D.; Ibarra-Castanedo, C.; Perilli, S.; Mokhtari, Y.; et al. Impact Modelling and A Posteriori Non-destructive Evaluation of Homogeneous Particleboards of Sugarcane Bagasse. J. Nondestruct. Eval. 2018, 37, 6. [Google Scholar] [CrossRef]
  26. Maldague, X. Theory and Practice of Infrared Technology for Nondestructive Testing; Wiley: Hoboken, NJ, USA, 2001. [Google Scholar]
  27. Ibarra-Castanedo, C.; Maldague, X.P. Infrared thermography. In Handbook of Technical Diagnostics; Czichos, H., Ed.; Springer: Berlin/Heidelberg, Germany, 2013; pp. 175–220. [Google Scholar]
  28. Ahi, K.; Shahbazmohamadi, S.; Asadizanjani, N. Quality control and authentication of packaged integrated circuits using enhanced-spatial-resolution terahertz time-domain spectroscopy and imaging. Opt. Lasers Eng. 2017. [Google Scholar] [CrossRef]
  29. Ahi, K. Mathematical modeling of THz point spread function and simulation of THz imaging systems. IEEE Trans. Terahertz Sci. Technol. 2017, 7, 747–754. [Google Scholar] [CrossRef]
  30. Ahi, K. Review of GaN-based devices for terahertz operation. Opt. Eng. 2017, 56, 090901. [Google Scholar] [CrossRef]
  31. Karpowicz, N.; Zhong, H.; Xu, J.; Lin, K.I.; Hwang, J.S.; Zhang, X. Comparison between pulsed terahertz time-domain imaging and continuous wave terahertz imaging. Semicond. Sci. Technol. 2005, 20, S293. [Google Scholar] [CrossRef]
  32. Zhang, H.; Sfarra, S.; Saluja, K.; Peeters, J.; Fleuret, J.; Duan, Y.; Fernandes, H.; Avdelidis, N.; Ibarra-Castanedo, C.; Maldague, X. Non-destructive Investigation of Paintings on Canvas by Continuous Wave Terahertz Imaging and Flash Thermography. J. Nondestruct. Eval. 2017, 36, 34. [Google Scholar] [CrossRef]
  33. Rajic, N. Principal component thermography for flaw contrast enhancement and flaw depth characterisation in composite structures. Compos. Struct. 2002, 58, 521–528. [Google Scholar] [CrossRef]
  34. Fernandes, H.; Zhang, H.; Ibarra-Castanedo, C.; Maldague, X. Fiber orientation assessment on randomly-oriented strand composites by means of infrared thermography. Compos. Sci. Technol. 2015, 121, 25–33. [Google Scholar] [CrossRef]
  35. Yousefi, B.; Sfarra, S.; Ibarra Castanedo, C.; Maldague, X.P. Comparative analysis on thermal non-destructive testing imagery applying Candid Covariance-Free Incremental Principal Component Thermography (CCIPCT). Infrared Phys. Technol. 2017, 85, 163–169. [Google Scholar] [CrossRef]
  36. Yousefi, B.; Sfarra, S.; Castanedo, C.I.; Maldague, X.P. Thermal NDT applying candid covariance-free incremental principal component thermography (CCIPCT). In Proceedings of the International Society for Optics and Photonics, Thermosense: Thermal Infrared Applications XXXIX, Anaheim, CA, USA, 5 May 2017; Volume 10214, p. 102141I. [Google Scholar]
  37. Yousefi, B.; Sharifipour, H.M.; Castanedo, C.I.; Maldague, X.P. Automatic IRNDT inspection applying sparse PCA-based clustering. In Proceedings of the 2017 IEEE 30th Canadian Conference on Electrical and Computer Engineering (CCECE), Windsor, ON, Canada, 30 April–34 May 2017; pp. 1–4. [Google Scholar]
  38. Maldague, X.; Marinetti, S. Pulse phase infrared thermography. J. Appl. Phys. 1996, 79, 2694–2698. [Google Scholar] [CrossRef]
  39. Cooley, J.W.; Tukey, J.W. An algorithm for the machine calculation of complex Fourier series. Math. Comput. 1965, 19, 297–301. [Google Scholar] [CrossRef]
  40. Dillenz, A.; Zweschper, T.; Busse, G. Progress in ultrasound phase thermography. In Proceedings of the International Society for Optics and Photonics, Aerospace/Defense Sensing, Simulation, and Controls, Orlando, FL, USA, 23 March 2001; pp. 574–579. [Google Scholar]
  41. Busse, G. Nondestructive evaluation of polymer materials. NDT E Int. 1994, 27, 253–262. [Google Scholar] [CrossRef]
  42. Zhang, H.; Fernandes, H.; Dizeu, F.B.D.; Hassler, U.; Fleuret, J.; Genest, M.; Ibarra-Castanedo, C.; Robitaille, F.; Joncas, S.; Maldague, X. Pulsed micro-laser line thermography on submillimeter porosity in carbon fiber reinforced polymer composites: experimental and numerical analyses for the capability of detection. Appl. Opt. 2016, 55, D1–D10. [Google Scholar] [CrossRef] [PubMed]
Figure 1. Photographs of the BFRP laminates from the back side.
Applsci 08 00240 g001
Figure 2. Photographs of the jute/hemp fiber hybrid specimens from the back side.
Applsci 08 00240 g002
Figure 3. Photographs of the SCB laminates from the front side.
Applsci 08 00240 g003
Figure 4. LT and PT configurations: (a) schematic set-up for LT; (b) schematic set-up for PT (flashes); (c) experimental set-up for LT and PT (halogen lamps); (d) experimental set-up for PT (flashes).
Applsci 08 00240 g004aApplsci 08 00240 g004b
Figure 5. VT configurations: (a) schematic set-up; (b) experimental set-up.
Applsci 08 00240 g005
Figure 6. UT experimental set-up.
Applsci 08 00240 g006
Figure 7. CW THz configuration in reflection mode: (a) schematic set-up; (b) experimental set-up.
Applsci 08 00240 g007
Figure 8. PT for the BFRP laminates after PPT and PCT processing.
Applsci 08 00240 g008
Figure 9. UT amplitude images of the BFRP laminates.
Applsci 08 00240 g009
Figure 10. VT for the BFRP laminates after PCT processing.
Applsci 08 00240 g010
Figure 11. Front-side inspection for the BFRP laminate subjected to 15 J impact loading after PPT (eg) and PCT processing.
Applsci 08 00240 g011
Figure 12. IRT for the jute/hemp fiber hybrid laminates after PPT and PCT processing.
Applsci 08 00240 g012
Figure 13. IRT for the SCB laminates after PPT and PCT processing.
Applsci 08 00240 g013
Figure 14. Phase-based LT for the SCB laminates.
Applsci 08 00240 g014
Table 1. E-glass and basalt fiber properties [8].
Density (g/cm3)Elastic Modulus (GPa)Tensile Strength (GPa)Elongation to Fracture (%)Specific E Modulus (GPa per g/cm3)Specific Tensile Strength (GPa per g/cm3)
E-glass fiber2.56761.4–2.51.8–3.2300.5–1
Basalt fiber2.8892.83.1531.781
Table 2. Indentation test on jute/hemp fiber hybrid laminates.
Plate No.Max Load (N)Displacement at Maximum Load (mm)Final Displacement (mm)
123393.885.25
221413.735.14
318433.185.15
Table 3. Dent depth as a function of impact energy.
Impact energy (J)5102030
Dent depth (µm)592112814691545
Table 4. Flir Phoenix (MWIR) technical specifications.
Technical SpecificationExplanation/Value
Detector typeIndium Antimonide (InSb)
Cold filte bandpass3.0–5.0 µm standard
Pixel resolution640 (H) × 512 (V) pixels
Spec performance<25 milliKelvin
Table 5. Physical properties of materials.
Basalt Fiber (63%)Vinyl Ester Resin (37%)BFRP
k (W/mK)0.0310.2290.104
ρ (kg/m3)263012202108.3
C p (J/kgK)86010001083.8
α (m2/s)//4.5514 × 10−8
June (30%)/Hemp (20%) FibersEpoxy Resin I-SX10 (50%)Jute/Hemp Hybrid Laminate
k (W/mK)0.365/0.040.2290.232
ρ (kg/m3)1460/251100993
C p (J/kgK)1360/180010001268
α (m2/s)//1.8425 × 10−7
Bagasse Fiber (60%)Polyurethane Resin (40%)SCB
k (W/mK)0.4750.2090.369
ρ (kg/m3)5201200792
C p (J/kgK)3601.814002720.6
α (m2/s)//1.7125 × 10−7
Table 6. Applied experimental and image processing methods.
SpecimenExperimental MethodImage Processing Modality
BFRPPTRMF→CIS→PCT/PPT
VTRMF→PCT
UTAmplitude image
CW THzAmplitude image→Median filter
Jute/hemp hybrid laminatePTRMF→CIS→PCT/PPT
VTRMF→PCT
SCBPTRMF→CIS→PCT/PPT
VTRMF→PCT
LTRMF→Phase transform
Table 7. Relationship between modulated frequency f b and depth z.
Frequency f b (Hz)0.20.10.080.050.020.01
Depth z (mm)BFRP0.490.690.770.981.552.19
Jute/hemp hybrid0.991.391.561.973.124.41
SCB0.951.341.501.903.004.25
Table 8. Capabilities of different thermographic techniques.
Type of MaterialsBFRPJute/Hemp Hybrid LaminatesSCB
DefectResin-richLT (phase) > PT (phase) > PT (PCT) > VT (PCT)LT (phase) > PT (phase) > PT (PCT)LT (phase) > PT (phase) > PT (PCT)
Impact damageLT (phase) > PT (phase) > PT (PCT) > VT (PCT)LT (phase) > PT (phase) > PT (PCT) > VT (PCT)VT (PCT) > LT (phase) > PT (phase) > PT (PCT)
Fiber identificationUnavailableLT (phase) > PT (phase) > PT (PCT)LT (phase) > PT (phase) > PT (PCT)
DelaminationVT (PCT) > LT (phase) > PT (phase) > PT (PCT)No dataNo data
DepthShallow-defectPT (phase)1 > LT (phase)PT (phase)1 > LT (phase)PT (phase)1 > LT (phase)
Deep-defectLT (phase) > PT (phase)2LT (phase) > PT (phase)2LT (phase) > PT (phase)2
PT (phase)1: flashes modality; PT (phase)2: halogen lamps modality.

