Estimation of Mental Distress from Photoplethysmography
by
 , , , and
Roberto Zangróniz
1 ,
,
Arturo Martínez-Rodrigo
1,
María T. López
2,
José Manuel Pastor
1 and
Antonio Fernández-Caballero
2,3,*
1
Instituto de Tecnologías Audiovisuales, Universidad de Castilla-La Mancha, 16071 Cuenca, Spain
2
Instituto de Investigación en Informática, Universidad de Castilla-La Mancha, 02071 Albacete, Spain
3
Centro de Investigación Biomédica en Red de Salud Mental (CIBERSAM), 28029 Madrid, Spain
*
Author to whom correspondence should be addressed.
Appl. Sci. 2018, 8(1), 69; https://doi.org/10.3390/app8010069
Submission received: 11 November 2017
/
Revised: 20 December 2017
/
Accepted: 3 January 2018
/
Published: 5 January 2018
(This article belongs to the Special Issue Socio-Cognitive and Affective Computing)
Abstract
:This paper introduces the design of a new wearable photoplethysmography (PPG) sensor and its assessment for mental distress estimation. In our design, a PPG sensor obtains blood volume information by means of an optical plethysmogram technique. A number of temporal, morphological and frequency markers are computed using time intervals between adjacent normal cardiac cycles to characterize pulse rate variability (PRV). In order to test the efficiency of the developed wearable for classifying distress versus calmness, the well-known International Affective Picture System has been used to induce different levels of arousal in forty-five healthy participants. The obtained results have shown that temporal features present a single discriminant power between emotional states of calm and stress, ranging from 67 to 72%. Moreover, a discriminant tree-based model is used to assess the possible underlying relationship among parameters. In this case, the combination of temporal parameters reaches 82.35% accuracy. Considering the low difficulty of metrics and methods used in this work, the algorithms are prepared to be embedded into a micro-controller device to work in real-time and in a long-term fashion.

1. Introduction
Mental distress (or psychological distress) is a general term used to describe unpleasant feelings or emotions that impact your level of functioning. In other words, it is psychological discomfort that interferes with your activities of daily living. Mental distress can result in negative views of the environment, others, and the self. This is why it is important to investigate on devices and environments capable of recognizing and/or regulating negative emotions [1,2,3,4,5]. Sadness, anxiety, distraction, and symptoms of mental illness are manifestations of psychological distress.
Mental stress is accompanied by dynamic changes in activity of the autonomic nervous system (ANS). Although mental stress cannot be measured directly, the physiological response can be interpreted to assess the level of mental stress. Several physiological parameters (like electroencephalograph, heart rate variability, blood pressure, event-related potentials, and electromyography, among others) have been found sensitive toward any changes occurring in mental stress level [6]. Moreover, heart rate variability (HRV), the quantification of beat-to-beat variability in cardiac cycle over time, is one of the most determinant measures of ANS status [7,8].
The heart rate (HR) represents successive heart polarization and depolarization caused by the electrical impulses generated on the sinoatrial node and transmitted to the ventricles [9]. The sympathetic nervous system increases HR in response to stress, exercise or heart disease by acting on the accelerans nerve [10]. On the contrary, the parasympathetic nervous system decreases HR through acting on the vagus nerve [11]. During ventricular polarization, blood is pumped into the cells throughout the circulatory system. This process is reflected in an electrocardiogram as the QRS complex, where R-peaks are the most significant points within this wave. Accordingly, R-peaks are used as reference for computing HR. Indeed, HR is defined as a time series sequence of non-uniform RR intervals [12].
One of the most extended methodologies to measure HR consists in quantifying blood volume changes caused by the circulatory system functioning in veins or capillaries [13,14,15]. This technique is based in photoplethysmography (PPG), which consists of a low-cost optical technique capable of measuring small variations in reflected/transmitted light intensity, associated with changes in blood pumping function [16]. Technology has enabled to measure HR using inexpensive PPG sensors. By using robust software running a good algorithm it is possible to measure HR and HR related parameters like HRV, and in turn stress [17,18,19]. In this respect, blood movement in vessels goes from heart to fingertips in a wave-like motion, generating a lag by the time required for transmission of the pulse wave between heart pumping, depicted in EEG as QRS complex, and maximum blood volume in the vessels, depicted in PPG signals as PPG-peak (systolic peak). Although there is no time synchronization between R-peak and PPG-peak due to time lag, some authors have used peak-to-peak PPG signal interval instead of R-R interval in ECG signal. The use of pulse cycle interval is often called pulse rate variability (PRV) for this purpose. While there are many studies that analyze the use of PRV as an estimation of HRV, it is difficult to obtain quantitative conclusions due to the differences among experiments and methodologies. However, a high correlation between both metrics has been reported for subjects at rest [20].
Our research team has decided to design, build, and assess its own wearable photoplethysmography sensor aimed at exploiting HRV for the sake of estimating mental distress. In this case, estimating mental distress it is not conceived at this point of the design to be used in clinical applications. Although some commercial/research wearables support the possibility to calculate distress (e.g., Apple Watch (https://www.apple.com/watch/), Fitbit Ionic (https://www.fitbit.com/ionic); Garmin Forerunner (https://www.garmin.com/en-US), there are at least three reasons that support the decision to design our own wearable. The first one is that some commercial wearables (e.g., watches) stop being marketed after a short time, which prevents their use in future applications. The second justification is that virtually no commercial wearables allow access to their sensors’ raw data [21], which is necessary for any further statistical analysis. The last rationale is that an own implementation provides enough freedom to extend the hardware with additional sensors in future implementations. Besides, this article gives constructive details of the wearable for reproducing the experiments. On the contrary, most wearables are commercial and closed.
The remainder of the paper is as follows. Section 2 introduces the design of the HR monitoring device, the experimental methodology employed, how photoplethysmogram data is processed in this proposal, which features have been selected for estimating mental distress and, finally, a description of statistical analysis. Then, Section 3 offers the most important results obtained in our work and the performance of the system. Lastly, Section 4 discusses the more relevant aspects of the design presented, and Section 5 the conclusions of the proposal.
2. Materials and Methods
2.1. Monitoring Pulse Rate Variability
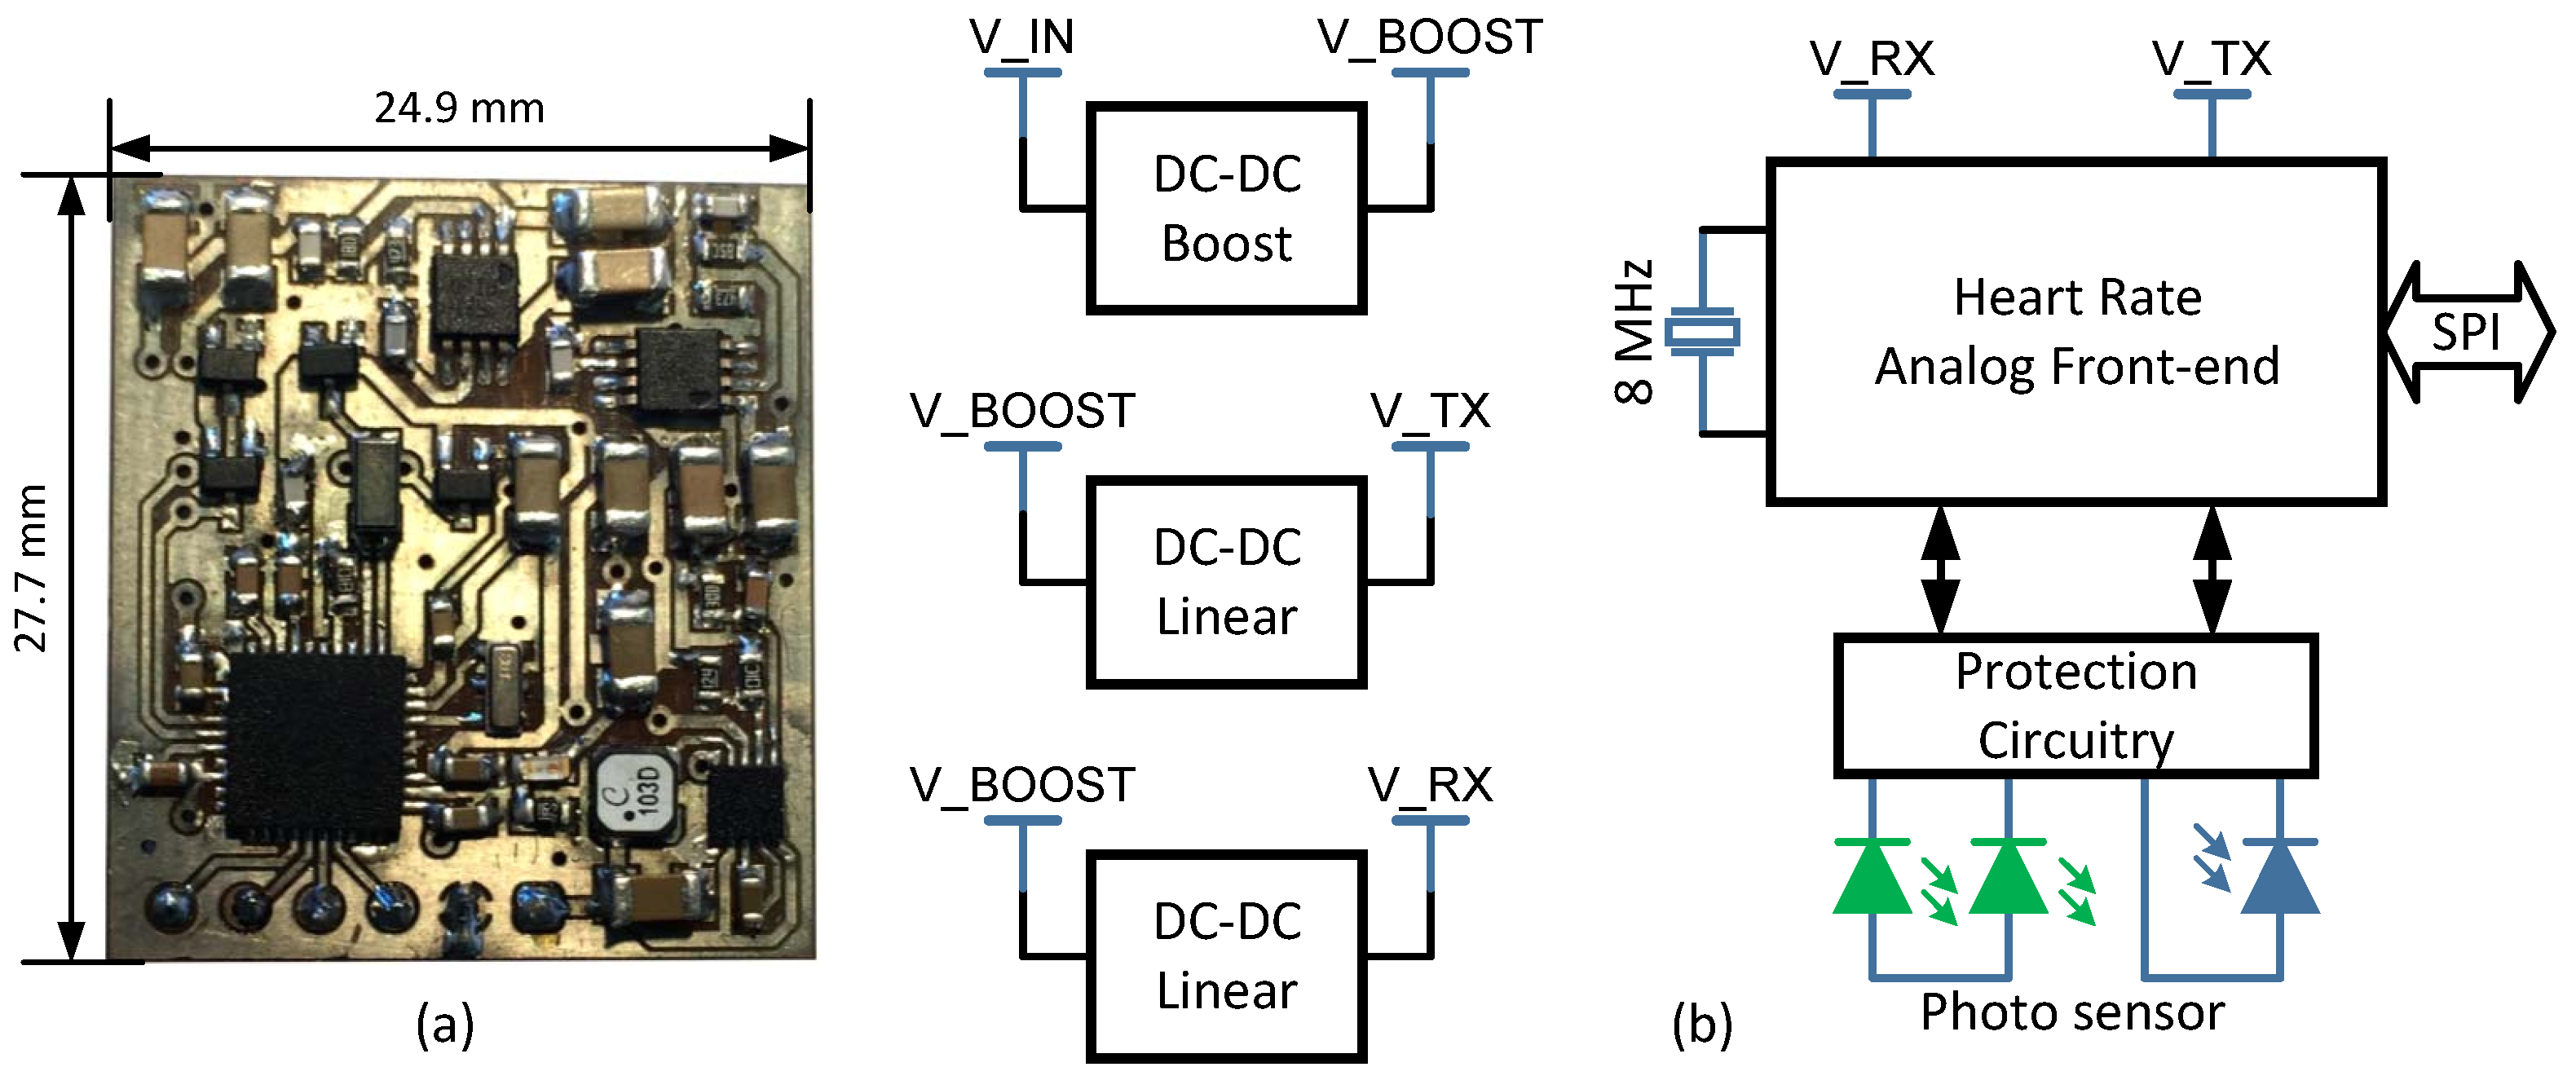
In the proposed design, an optical plethysmogram technique is used to obtain blood volume information by means of a PPG sensor. In a PPG acquisition and signal conditioning circuit there are several key elements: light emitting diode (LED), LED driver circuitry, photo-detector (PD), and PD signal conditioning circuitry [22]. Although it is possible to address the development of these elements from scratch, nowadays there are commercial fully-integrated analog front-ends and optical sensors suitable for PPG signals. In this regard, an analog front-end AFE4400 (Texas Instruments Incorporated, Dallas, TX, U.S.A.) and an optical sensor NJL5310R (New Japan Radio Corporation Ltd., San Jose, CA, U.S.A.) have been selected. The AFE4400 integrates a LED driver and a PD signal conditioning circuitries, and a timing control module in a single package. The NJL5310R consists of two green LEDs and a high sensitivity PD. Hence, they are suitable to build a circuit capable of measuring blood volume through reflective photometry.
According to the manufacturer, the NJL5310R has been designed with an optimal LEDs and PD separation to get a high-quality PPG signal. In our design, the green LEDs have been connected front-to-front, so that they light up and off simultaneously. In reflective photometry, LEDs and PD are placed in the same plane as the body part, and the PD receives the reflected light from different depths under the skin (such as blood, tissue, and so forth).
Furthermore, the AFE4400 has two clearly differentiated stages. On the one hand, the transmit stage is divided into LED driver and LED current control. The LED driver sets a reference current of each LED and has been configured in push-pull mode to turn both LEDs on and off simultaneously (since LEDs in the optical sensor have been wired in common anode). LED current control regulates and ensures that LED current follows its reference. On the other hand, the receiver stage is split into transimpedance amplifier (TIA), conditioning section and analog-to-digital converter (ADC). The differential current-to-voltage TIA converts PD input current into a voltage. The differential voltage at the output of the TIA includes the component from ambient light. So, after TIA a programmable digital-to-analog converter (DAC) provides the current to cancel the ambient component. Then, the resulting signal is amplified, passed through a low-pass filter, and, finally, buffered before driving the 22-bit sigma-delta analog-to-digital converter (ADC).
In addition, power needs are different for transmit and receiver stages. For transmit stage, the supply voltage depends upon voltage drop in the photo sensor’s LEDs and the transmit stage reference voltage (set as a compromise between low-power and better dynamic range). For these reasons, a supply voltage of 4.3 V has been selected for transmit stage. For receiver stage, the supply voltage is not so strongly warped by external elements, rather for the admissible analog front-end (AFE) supply voltage. Accordingly, a supply voltage of 3 V has been chosen for receiver stage.
As shown in Figure 1, a low-input DC-DC boost switching converter, TPS61093 (Texas Instruments Incorporated, Dallas, TX, U.S.A.), steps up incoming voltage to 6.5 V. The converter’s input voltage range allows to power the design by two alkaline batteries, a single Li-ion battery or through a traditional 3.3 V and 5 V regulated power supply. A couple of 150 mA ultra-low-noise linear regulators, TPS7A4901 (Texas Instruments Incorporated, Dallas, TX, U.S.A.), generate 4.3 V and 3 V supply for transmit and receiver stages, respectively. The choice of a linear regulator as power supply final stage allows filtering out the output voltage ripple inherent to DC-DC switching conversion.
An 8 MHz external crystal feeds the AFE internal crystal oscillator that generates a 4 MHz internal master clock signal by means of a divide-by-2 block. AFE timer module uses this master clock to settle raising and falling edges of the different control signals. Lastly, the protection circuitry for the photo sensor consists of clamping diodes for each line in transmit and receiver stages (DC voltage restoration). Also, LED and PD tracks on the PCB (printed circuit board) are routed by means of differential pairs, because RF noise can attenuate photo sensor signals. Likewise, PD tracks have been guarded with the common-mode voltage signal from AFE, and common mode choke coils have been used.
The complete schematics of the design are attached as supplementary material.
2.2. Experimental Methodology
In order to classify distress versus calm condition we have used the well-known International Affective Picture System (IAPS) [23]. IAPS consists of a standard and categorized database of color photographs created to provide a wide range of affective stimuli. Moreover, the two primary dimensions recorded in the database are valence (ranging from pleasant to unpleasant) and arousal (from calm to excited). So, for each IAPS picture the mean and standard deviation of arousal and valence is provided in four different tables constructed from responses of men, women and children who responded to the emotion felt when exposed to pictures by means of the Self-Assessment Manikin (SAM), an affective rating system [24]. Thus, the idea is to use IAPS database to show a series of images to some volunteer participants. Each image used in the experiment should belong to one of two classes “high arousal-low valence” and “low arousal-high valence”, corresponding to distress and calm, respectively.
Fifty healthy participants (twenty-eight men and twenty-two women; 20 to 28 years old) not suffering from evident mental pathologies were recruited to participate in the experiment. Moreover, the participants who agreed did not present cardiovascular or anatomic nervous system diseases that could alter their PRV. All participants were informed on the high emotional content of some pictures that they will be shown. All participants were students from Technical School at Cuenca, Spain. The students had to pass the PHQ-9 Depression Test Questionnaire to be accepted in the experiment. The exclusion criteria used to discard subjects from the experimental section were mainly based on the results of PHQ-9. In this regard, the exclusion threshold was fixed at scores greater than eight. Considering this prerequisite, four students were not welcomed, and one experiment was not valid due to technical problems. Thus, the number of valid experiments was forty-five (twenty-five males and twenty females). This study was approved by Universidad de Castilla-La Mancha institutional committee on human experimentation. All participants gave written informed consent in accordance with the Declaration of Helsinki.
The procedure for performing the experiment is described next (see Figure 2). The participant sits in front of the experimentation monitor to keep his/her movement minimal. The developed wearable sensor, described in Section 2.1, is put on his/her right wrist. In this regard, the experimentation monitor consists of a high resolution 28 inches screen. When the technician verifies the proper functioning of the wearable and its communication with the software, the experiment starts. Firstly, the participant has to carefully read the general instructions of the experiment. Next, ten pictures randomly chosen from a set of pictures that fulfill the condition to belong to negative stress (or distress) are shown consecutively to the participant during 6 s each. Silences consisting of blank images with a fixed duration of 1 s are inserted between two consecutive images. Afterwards, a distracting task is presented to the participant so that his/her emotional state comes to neutral. Next, the experiment continues by showing randomly another set of ten IAPS images that fulfill the condition to belong to calmness. Again, silences are used between each pair of images. Lastly, the distracting task is offered again.
Pictures were classified into calm and stress subsets depending on their score of arousal and valence reported in IAPS database. Thus, the inclusion criterion for a picture to be added to the stress subset was that the picture rated an arousal level higher than 5 and a valence level lower than 3. Similarly, the inclusion criterion for a picture to be inserted into the calm subset was that it rated an arousal level lower than 4 and a valence level higher than 4 and lower than 6. Several studies have reported these ranges as those corresponding to negative stress and calmness, respectively [25].
Finally, and in agreement with Figure 2, the useful information extracted for each participant consists on two segments lasting 70 s for each stress and calm condition, respectively. Although a distracting task is deployed at the end of each image sequence, the PPG signal recorded in those segments is discarded for further analysis, since they are used exclusively to lead the participant to a neutral emotional state. Therefore, after experimentation, a total number of 90 PPG segments lasting 70 s were used in the subsequent analysis, where 45 belong to stress and 45 to calm condition.
2.3. Photoplethysmography Processing
The signal acquisition was held using the wearable PPG sensor at a sampling rate of 60 Hz and a 22-bit resolution. This sampling rate was chosen as minimum sampling frequency to prevent PPG signal distortion, since useful PPG information is located between 0 and 30 Hz [26]. However, in order to increase the reliability of the subsequent validation analysis and accuracy of PRV series computation, the acquired PPG was interpolated by using a cubic splines algorithm, increasing time resolution up to an equivalent sampling frequency of 1000 Hz. This type of interpolation has been used previously to increase the sampling rate in similar contexts [27].
Moreover, several factors, such as sensor location, electrical sources, ambient lights, skin properties or temperature, may affect quality of PPG signals [28]. These factors add different artifacts and noisy components to the waveform, which augments difficulty in signal characterization. Therefore, different filtering and processing techniques are applied to eliminate possible interferences and enhance the waveform before characterizing the signal. In this regard, power line interference is one of the most common noise sources. Indeed, ambient electromagnetic signals are present everywhere, modulating PPG signal over a sinusoidal component at its fundamental frequency. Moreover, variation in temperature or poor contact of photo sensor are only some of the causes of baseline in PPG signal [28]. Hence, baseline wander, high-frequency noise and power-line interference are removed by computing a forward/backward filtering approach. More concretely, baseline drift is removed by applying a 0.5 Hz cut-off high-pass, linear-phase FIR filter. Similarly, a 30 Hz cut-off low-pass, linear-phase FIR filter is applied to remove high-frequency noise and power-line interferences.
In this regard, approaches based on adaptive threshold have been extensively employed to detect peaks on PPG signals [29]. Nevertheless, PPG signals contain inherent noise (Gaussian noise), sudden amplitude changes or different morphologies caused by premature ventricular contractions or movements. Therefore, the use of a robust and reliable PPG peak detection algorithm is a key factor to face these difficulties. The algorithm has to deal with the detection of beats and artifacts while operating with a minimum computational burden in real-time. Considering all these premises, in this work an incremental-merge segmentation algorithm was used for PPG peak detection [30]. This algorithm extracts morphological features of PPG signal that are used as line segments. Next, these segments are classified as pulse or artifacts through using adaptive thresholds. More precisely, a PPG signal is converted into line segments by connecting the first and the last point of the line, depending of a tuning parameter m (length of line segments) which depends directly on the sampling rate. Then, line segments are classified such that pulse peaks are identified as endpoints of the validated up-slopes. On the other hand, horizontal lines are labeled as clipping or disconnection, so that up-slopes preceding and succeeding a horizontal line are labeled as artifacts. In this way, pulses from PPG corresponding to artifacts are identified and suppressed from beat-to-beat computation. Finally, PRV is estimated by measuring the time variation in consecutive PPG peaks.
2.4. Feature Extraction
Considering the short duration of each segment of analysis (70 s long), no additional windowing was set for the analysis, and the entire segment was used to extract the characteristics from the signal. It is important to highlight that all metrics were calculated retrospectively from PPG signals, rather than in real-time, as this work firstly intends to validate the proposed model. Similarly to other studies using short-term analysis of heart variability, classical time domain, frequency domain and morphological characteristics are computed from PRV and for both conditions (calm and stress) [31]. Table 1 shows the complete list of features used in the study.
Concretely, adjacent normal cardiac cycles (NN) are computed and then, the mean of NN intervals (MNN), standard deviation of NN intervals (SDNN), standard error of successive differences of adjacent NN intervals (SENN) and the difference between the longest and shortest NN interval, that is the dynamic range, (DRNN) are calculated. Additionally, the ratio of pairs of successive NN intervals differing more than 50 ms (pNN50) are calculated by taking into consideration the total number of analyzed cardiac cycles. Finally, the first derivative (FD) of successive differences of adjacent NN intervals is computed and standard deviation (SDFD) and root mean square (RMSFD) are estimated.
Moreover, it has been reported that frequency parameters extracted from PRV may contribute with significant information that is not present in time-based methods [12]. Therefore, power spectral density (PSD) of the PRV is estimated in this work to obtain how power variance distributes as a function of frequency. A non-parametric method based on Fast Fourier Transform (FFT) is used. FFT is characterized by the simplicity of the algorithm and a high processing speed which are desirable specifications to be implemented in our design. According to the literature, three main spectral components are commonly used to assess PSD, namely very low frequency (VLF), low frequency (LF) and high frequency (HF), respectively [32]. The physiological meaning of VLF is quite diffuse, specially in short-term recordings and, consequently, it is out of this study [33]. On the contrary, LF and HF represent the control and balance of parasympathetic and sympathetic components [33]. More concretely, LF component ranges from 0.04 Hz up to 0.15 Hz and its increase is generally associated with a sympathetic activation [32]. On the other hand, LF component ranges between 0.15 Hz and 0.4 Hz and it is associated with parasympathetic modulation [32]. Finally, the relationship between the power found in LF and HF components is usually estimated, because it assess the sympatho-vagal balanve controlling the heart rate [34]. Thus, absolute values of potency (LF and HF), as well as relationship of LF and HF (NHF) regarding the total power (excluding VLF component) are calculated in this study.
With regard to morphological markers, HRV Triangular Index (HRNN) and Triangular Interpolation (TINN) are estimated. Morphological features are based on the fact that NN interval durations can be converted into a geometric pattern, such that NN density distribution is assessed by a simple equation to measure variability. In this work, the density distribution function () is constructed through assigning the number of equally long NN intervals to each value of their lengths. Then, the most frequent value of the distribution is calculated, i.e., . HRNN is obtained by performing the ratio between the area integral of by its maximum value. Similarly, TINN is computed by calculating the width of , this way establishing the distribution boundaries, A and B, respectively. For the sake of performing this operation, is transformed into a multi-linear function q, such that for and . So basically, the function with the best fit to the NN density distribution defines or identifies A and B boundaries. Then, TINN is calculated as temporal difference between A and B, that define the vertexes of the base of the triangle. Finally, the third and fourth moment of successive NN intervals, as well known as skewness (SKNN) and kurtosis (KUNN) from a distribution, were computed. Both parameters evaluate the asymmetry from PRV distribution caused by outliers or atypical pulse values within the series around the sample mean, thus assessing the shape of data distribution. Equation (1) shows the computation of SKNN, and Formula (2) represents the KUNN computation, where is the mean of successive NN intervals, is the standard deviation of successive NN intervals, and E(t) corresponds to the expected value of quantity t.
2.5. Statistical Analysis
Shaphiro-Wilks and Levene tests have proved that distributions are normal and homoscedastic for all features studied. Consequently, the results are expressed in terms of mean ± standard deviation for all samples belonging to a same group. The statistical differences between both groups, calm and distress, are assessed by a t-Student test. A value of statistical significance 0.05 has been considered as significant.
Moreover, a ten-fold stratified cross-validation is used to assess the discriminant ability of each feature. This kind of cross-validation allows to obtain a highly reliable performance generalization of the metric under study [35]. Indeed, this approach makes use of all available data both for training and testing. This avoids the possibility of classification results to be highly dependent on the choice of a given training-test segmentation. Thus, the database is firstly partitioned into 10 equally sized folds, rearranging data to ensure that each fold is a good representative of the whole. Then, 10 training and validation iterations are performed, such that a fold of the data is held out for test, whereas the other ones are used for learning within each iteration. A receiver operating characteristic (ROC) curve is used to obtain the optimal discriminant threshold between calmness and distress for each learning set. The ROC curve is created by plotting true positive (TP) rate against false positive (FP) rate at various threshold settings. Here, TP rate (or sensitivity) is considered as the percentage of distress condition correctly classified. On the other hand, FP rate (or 1-specificity) corresponds to the rate of calm condition identified improperly. The optimal threshold is selected as the value which provides the highest accuracy, i.e., highest number of conditions correctly classified. Finally, global accuracy is obtained by averaging this procedure 5 times.
A decision tree (DT) classifier is used in order to assess the possible relationships among the different temporal, morphological and frequency features. This methodology is chosen due to its easy implementation and low computation burden when addressing a binary classification problem. Indeed, DT is based in consecutive if-else decisions. Regarding the DT configuration, each split is performed after considering the best optimization criterion, based on the Gini diversity index. Moreover, some rules are programmed to prevent an uncontrolled three overgrowth. Thus, the growth of every tree is always stopped when any node only contains samples from the same group (pure node) or less than 20% of all samples.
3. Results
Table 2 shows mean and standard deviation of the features under study. All characteristics calculated are shown, regardless of their statistical significance Only 4 out of 14 parameters show statistical differences when PRV is analyzed; and, all of them correspond to the time domain. More precisely, standard deviation (SDNN), dynamic range (DRNN) and standard error (SENN) of PRV series, as well as standard deviation of PRV derivative (SDSD), show statistical significance. In this regard, DRNN achieves the highest discriminatory power. It is worth noting that all significant parameters report an increasing temporal value when participants are elicited with stressing stimuli.
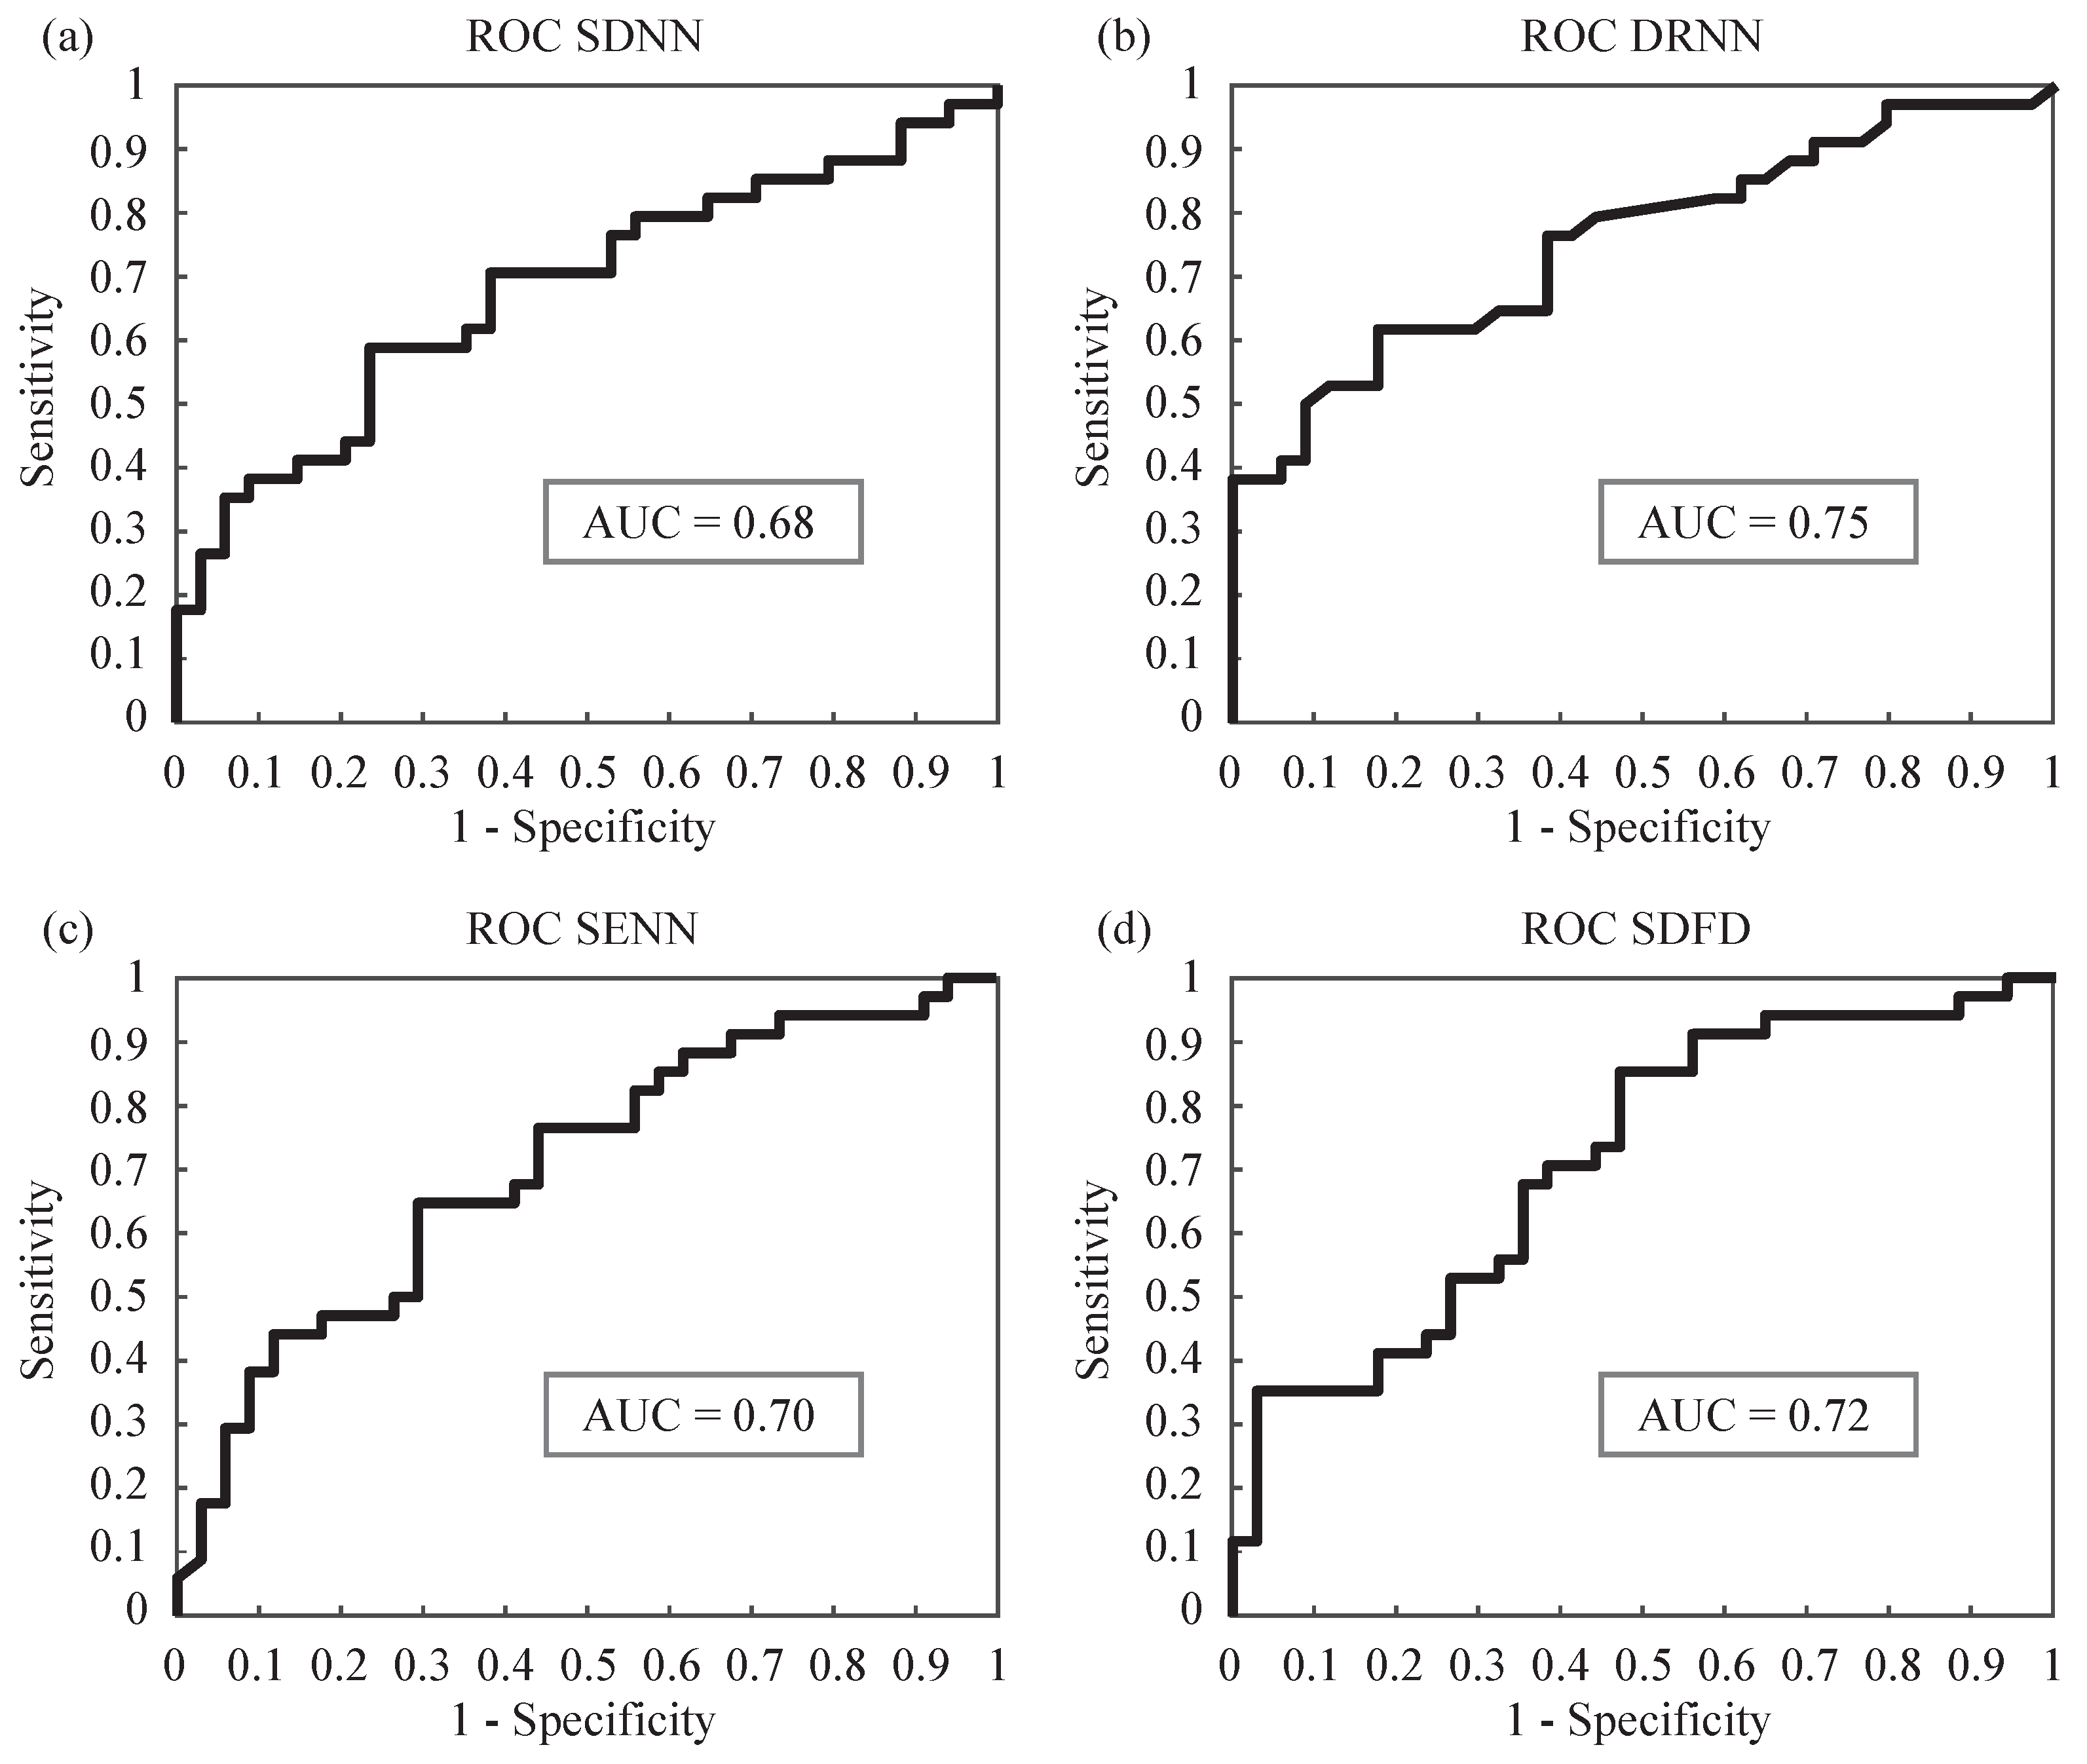
In order to estimate a reliable and robust power classification for each single parameter, a stratified 10-fold cross-validation is run five times. Figure 3 shows the ROC curves at a random iteration, together with the sensitivity (Se), specificity (Sp) and area under curve (AUC) for the four parameters that reported statistical significance. Additionally, average values of Se, Sp and accuracy (Ac), for both training and test subsets iterations, are shown in Table 3.
The single classification results are in agreement with the discriminatory power obtained previously. DRNN achieves the highest accuracy, correctly classifying 72.06% conditions. The rest of markers reach poorer performances, ranging from 66.18 to 67.65%. It is worth noting that features report a higher capability in discriminating true negatives, i.e., calmness than discriminating stress. In this regard, SDNN and DRNN achieve specificity values 76.47 and 82.35%, respectively.
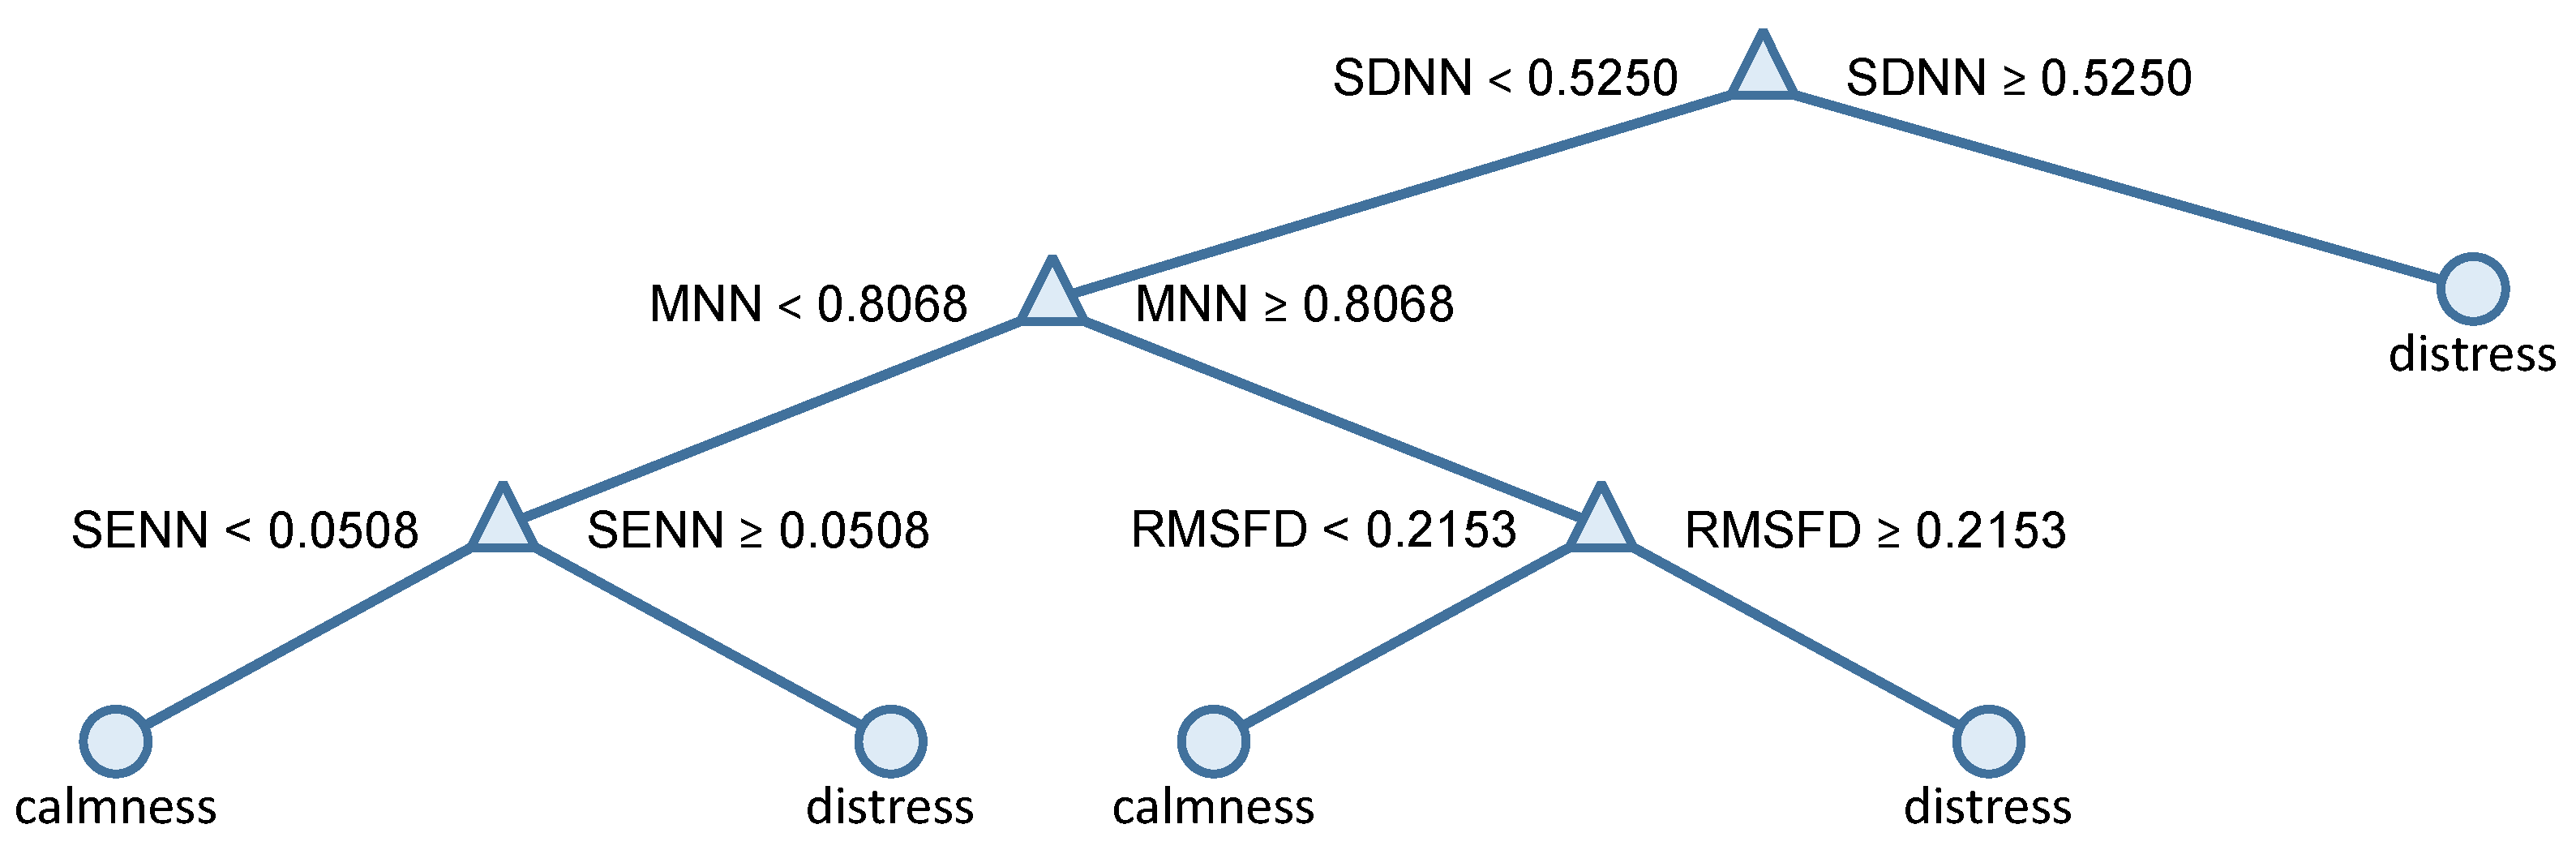
Additionally, a series of tree-based classification models are calculated in order to study the potential relations among the different parameters. It is worth noting that all the parameters calculated are included in this analysis, regardless if they show statistical relevance, as there might exist underlying complementaries not revealed yet. Figure 4 shows the structure and the parameters composing the tree-based discriminant model more frequently obtained among the different iterations. As can be observed, the model is formed exclusively of temporal PRV parameters . Thus, the SDNN parameter is chosen as the most relevant in the model and a threshold of 0.5250 serves to divide the sample into two subgroups, calmness and stress.
In the next step, the samples labeled as calmness are newly partitioned into two subgroups using MNN and a threshold of 0.8068. Finally, in each remaining subgroup, SENN and SDFD are chosen to distribute the rest of samples by using thresholds 0.0508 and 0.2153, respectively. No further ramifications are formed with the criteria imposed. This tree-based model achieves a sensitivity, specificity and accuracy of 79.49, 85.29 and 82.35%, respectively. In this regard, the model improves global correctness more than 10% regarding the best single accuracy reported by DRNN. Finally, it is relevant to note that, while the single parameter with higher discriminatory power showed a limited sensitivity (i.e., ability to detect stress), when the parameters were combined by means of a tree-based classifier, sensibility increased more than 17%, achieving a more balanced discriminatory model.
4. Discussion
Negative stress (or distress) is one of the most important mental states due to its significant effects in health [1,2,3]. Distress is considered cause and consequence of failure and difficulties in a wide variety of daily situations. Thus, continuous monitoring of distress levels may prevent related health problems as well as unnecessary risks caused by suffering from stress. However, stress is a very complex subject and measuring it is not an easy task, as clearly stated recently [36]. Considering the increasing popularity of wearables such as continuous monitoring devices, photoplethysmography sensors have emerged as a reliable alternative to measure PRV. Although a number of works assessing stress condition are found in the literature, the most outstanding aspect of our contribution is the development of the necessary hardware and signal processing, as well as individual and global performance of the considered features. This enables deploying a wearable device with a high ability to discriminate between the two considered distress and calmness states. The lightness of our signal processing approach permits to work in real-time and in a long-term fashion.
In this work, stress and calmness conditions have been assessed by using temporal, frequency and morphological markers extracted from PRV. Interestingly, most of the temporal features reported statistical differences discriminating both conditions, while the rest of markers achieved low or no ability to differentiate between calmness and distress. In this respect, all classical metrics considered in this work have previously reported the ability to quantify changes in the ANS, responsible for regulating cardiac activity [32]. Moreover, they have been used before as good stress indicators [37]. However, only a few studies have evaluated this phenomenon from a short-time series viewpoint, which may lead to the described discrepancies in their performance achieved. Thus, temporal features like MENN or SENN have resulted statistically significant in the same context of stress when using ultra-short term analysis of HRV [31].
However, results from frequency parameters may variate considerably depending on the methodology used to perform PSD and length of the signals. Thus, some studies have reported that frequency analysis tend to produce better results for parametric instead of non-parametric methods when data length of the available signal is relatively short [38]. Moreover, non-parametric calculation (like FFT used in this study) is based in mathematical assumptions that severely limit frequency resolution. In this regard, considering the narrow bandwidth where the frequency parameters are computed, the quality of the calculated power spectrum could be affected. Furthermore, morphological parameters are based on the geometrical shape of NN time intervals distribution. Similarly, short time series may affect the shape of distribution, substantially altering the results. Indeed, some parameters like TINN have already been evaluated in the same context of stress and short-time series, and no statistical significance was found [31]
In recent works, it has been demonstrated that different ways to induce stress uses to trigger distinct cognitive processes [12]. This is why, comparison among approaches using stress detection should be discussed with caution. Nevertheless, it is interesting to note that the present study has reached better than, or comparable classification outcomes to, other similar analysis research. Firstly, it is worth noting that there are hardly any recent studies using short-term PRV analysis for assessing stress in the literature [39]. However, considering the correlation between HRV and PRV stated in this study, some comparison among works using short-term HRV series and mental stress can be provided.
In this regard, a combination of time, frequency and non-linear parameters computed over HRV signals using a wide range of classification algorithms has been studied very recently [40]. In the study, a global accuracy of 81.16% using Naive Bayes classifier was reported. Similarly, temporal, frequency and non-linear parameters on short-time HRV series, achieving a global performance of 64% using a support vector machine classifier, have been presented [41]. The same author reported an improved performance of 79% using additional non-lineal features using a complex tree classifier [42]. A global accuracy of 84.6% using exclusively RMSSD of ultra-short time HRV series and using a combination of binary tree classifiers has been reported [43]. It is mandatory to underline that these discriminant rates have been reached by combining parameters computed from different domains through advanced classifiers. Finally, there is also a number of recent works that have evaluated stress detection by using HRV in the context of long-term analysis, reporting stress detection classification rates ranging from 70 to 78% [36,44,45,46,47].
In view of these outcomes, our algorithm achieved a notably global accuracy of 82.35% using exclusively classical temporal parameters and a binary-tree classifier. Although all features were included in a multi-parametric analysis, only SDNN, MNN, SENN and RMSFD were chosen, showing an underlying complementarity of temporal features to classify stress patients. This interconnection is in agreement with other works previously published. Thus, a recent approach, proposed a methodology for stress detection based exclusively in the combination of time-domain features (MNN, RMSSD and pNN50) achieving global classification of 74.6% [36]. Just as in our approach, the authors state that it can be efficiently implemented on mobile devices, since the proposed method only uses time-domain features. In the same line, the arousal level has been assessed on patients, reporting that temporal parameters RMSSD, PNN12 and PNN20 showed statistical significance on ultra-short temporal series of 15 s length [48]. No global precision was reported in this study.
It is also interesting to notice that some recent works are exploring new areas and methodologies to enhance mental stress estimation. In this regard, some authors are computing standard and advanced non-linear analysis of HRV to recognize stress, among other emotions [49]. Unfortunately, some non-linear methodologies require a heavy computation cost, which makes the implementation of algorithms in real-time systems not viable. Furthermore, other authors have recently explored multivariate analysis to enhance distress classification. In these studies, some physiological variables like electro-dermal activity (EDA), electromyography (EMG) or skin temperature (SKT) are also combined with heart functioning to detect mental stress. Thus, multiple parameters, extracted from HRV, SKT and EDA with a support vector machine algorithm and K-means clustering to classify the obtained training data and index the user’s stress level, which resulted in an overall 91.26% accuracy, were combined [44]. In the same line, a myriad of sensors, such as foot EDA, respiration, hand EDA, HR and EMG to improve the stress classification have been used [45]. Although our design is much easier and gets reasonable performance results with one single sensor, the aforementioned potential areas of research may benefit from the occurrence of new metrics and methodologies for mental distress estimation.
Finally, some comments about the suitability of PRV metric as substitute of HRV deserve consideration. At this point, several works have been published during last years, discussing if PRV series computed from PPG signals can be used instead of HRV computed from ECG recordings. Throughout the last years, some studies have claimed that PRV is a surrogate for HRV [50,51,52]. Furthermore, some recent works deserve a special mention, as they not only claim that PRV is suitable for HRV analysis, but they also provide details about which parameters extracted from HRV are most prone to show errors comparing both ECG and PPG methodologies. For instance, nineteen healthy subjects were enrolled in a recent study [50], where ECG and PPG signals were simultaneously recorded for each individual. ECG and PPG signals were recorded with sampling rate of 250 Hz and 500 Hz, respectively. Then HRV was computed from R-R and P-P series, and most typical parameters were extracted from both series. The results reported that the error for all PRV parameters was less than 6%, except for pNN50, which achieved a global error around 30% [50]. This could be the reason why PNN50 showed no relevance in our study. Similarly, ten healthy subjects were enrolled in another experiment [51], where ECG and PPG signals were recorded simultaneously at 1000 Hz. The results demonstrated an excellent correspondence between HRV parameters derived by ECG- and PPG-based methods. HRV was computed using R-R series and PP intervals, calculated from systolic peak of PPG waveform [51].
5. Conclusions
This paper has introduced a new wearable photoplethysmography sensor to be used in the domain of mental distress condition estimation. The International Affective Picture System database for inducing controlled arousal and valence has been applied to forty-five volunteers for the sake of assessing the proposal. The paper has introduced a complete description of the device capable of acquiring blood volume of a subject. The signals have been processed, a series of features have been extracted and it has been possible to classify calm and stress with a notably accuracy.
Although classical time, frequency and morphological analysis parameters are evaluated, our final proposal uses only time-domain PRV features. More concretely the mean, standard deviation and standard error of consecutive normal cardiac beats, and the root means square of the first derivative of consecutive normal cardiac beats are used. Moreover, these temporal metrics showed significant differences and acceptable single classification in the pulse variability generated by both emotional states. Nonetheless, in accordance with previous studies, their combination by means of a simple tree-based classifier revealed underlying complementarity that enhances the global accuracy of the discriminatory model up to 82.35%. This result outperforms or is comparable with other published works that use many parameters combined with complex classification algorithms.
It is also important to consider that all mathematical algorithms and processes used in this work can be embedded into a micro-controller. Thus, PPG peaks have been detected by using a real-time peak-detection algorithm [30]. The PRV-related features are defined in time-domain, extracted from short-time PPG signals, and the operations are based exclusively in sums and divisions. This fact opens the door for algorithms to work in real-time and in a long-term fashion.
Supplementary Materials
The following are available online at https://www.mdpi.com/2076-3417/8/1/69/s1. The complete schematics of the PPG sensor design are attached as supplementary material. Sheet 1: Cover page, Sheet 2: Analog front-end, Sheet 3: Power supply.
Acknowledgments
This work was partially supported by Spanish Ministerio de Economía, Industria y Competitividad, Agencia Estatal de Investigación (AEI) / European Regional Development Fund (FEDER, UE) under DPI2016-80894-R grant, and by the Centro de Investigación Biomédica en Red de Salud Mental (CIBERSAM) of the Instituto de Salud Carlos III. Arturo Martínez-Rodrigo holds an EPC 2016-2017 research fund from Escuela Politécnica de Cuenca, Universidad de Castilla-La Mancha.
Author Contributions
Roberto Zangróniz and Arturo Martínez-Rodrigo conceived and designed the study, programmed the experiments and drafted the manuscript. María T. López and José Manuel Pastor helped to interpret the results and reviewed the manuscript. Finally, Antonio Fernández-Caballero supervised the experiments, reviewed the manuscript and contributed to the final version. All authors have read and approved the final version of the manuscript.
Conflicts of Interest
The authors declare no conflict of interest.
Abbreviations
The following abbreviations are used in this manuscript:
| ADC | analog-to-digital converter |
| AFE | analog front-end |
| ANS | autonomic nervous system |
| DAC | digital-to-analog converter |
| HF | high frequency |
| HR | heart rate |
| IAPS | international affective picture system |
| LED | light emitting diode |
| LF | low frequency |
| PCB | printed circuit board |
| PD | photo-detector |
| PPG | photoplethysmography |
| PRV | pulse rate variability |
| PSD | power spectral density |
| ROC | receiver operating characteristic |
| SAM | self-assessment manikin |
| SPI | serial peripheral interface |
| TIA | transimpedance amplifier |
| VLF | very low frequency |
References
- Zangróniz, R.; Martínez-Rodrigo, A.; Pastor, J.M.; López, M.T.; Fernández-Caballero, A. Electrodermal Activity Sensor for Classification of Calm/Distress Condition. Sensors 2017, 17, 2324. [Google Scholar] [CrossRef] [PubMed]
- Fernández-Caballero, A.; Martínez-Rodrigo, A.; Pastor, J.M.; Castillo, J.C.; Lozano-Monasor, E.; López, M.T.; Zangróniz, R.; Latorre, J.M.; Fernández-Sotos, A. Smart environment architecture for emotion recognition and regulation. J. Biomed. Inform. 2016, 64, 55–73. [Google Scholar] [CrossRef] [PubMed]
- Castillo, J.C.; Castro-González, A.; Fernández-Caballero, A.; Latorre, J.M.; Pastor, J.M.; Fernández-Sotos, A.; Salichs, M.A. Software architecture for smart emotion recognition and regulation of the ageing adult. Cogn. Comput. 2016, 8, 357–367. [Google Scholar] [CrossRef]
- Sokolova, M.V.; Fernández-Caballero, A. A review on the role of color and light in affective computing. Appl. Sci. 2015, 5, 275–293. [Google Scholar] [CrossRef]
- Fernández-Caballero, A.; Latorre, J.M.; Pastor, J.M.; Fernández-Sotos, A. Improvement of the elderly quality of life and care through smart emotion regulation. In Ambient Assisted Living and Daily Activities; Pecchia, L., Chen, L., Nugent, C., Bravo, J., Eds.; Springer: New York, NY, USA, 2014; pp. 348–355. [Google Scholar]
- Yoo, K.-S.; Lee, W.-H. Mental stress assessment based on pulse photoplethysmography. In Proceedings of the 2011 IEEE 15th International Symposium on Consumer Electronics, Singapore, 14–17 June 2011; pp. 323–326. [Google Scholar]
- Khan, N.A.; Jönsson, P.; Sandsten, M. Performance comparison of time-frequency distributions for estimation of instantaneous frequency of heart rate variability signals. Appl. Sci. 2017, 7, 221. [Google Scholar] [CrossRef]
- Heathers, J.A.J. Smartphone-enabled pulse rate variability: An alternative methodology for the collection of heart rate variability in psychophysiological research. Int. J. Psychophysiol. 2013, 89, 297–304. [Google Scholar] [CrossRef] [PubMed]
- Malik, M.; Bigger, J.T.; Camm, A.J.; Kleiger, R.E.; Malliani, A.; Moss, A.J.; Schwartz, P.J. Heart rate variability standards of measurement, physiological interpretation, and clinical use. Eur. Heart J. 1996, 17, 354–381. [Google Scholar] [CrossRef]
- Acharya, U.R.; Joseph, K.P.; Kannathal, N.; Lim, C.M.; Suri, J.S. Heart rate variability: A review. Med. Biol. Eng. Comput. 2006, 44, 1031–1051. [Google Scholar] [CrossRef] [PubMed]
- Schmidt-Nielsen, K. Animal Physiology: Adaptation and Environment; Cambridge University Press: Cambridge, UK, 1997. [Google Scholar]
- Valenza, G.; Lanata, A.; Scilingo, E.P. The role of nonlinear dynamics in affective valence and arousal recognition. IEEE Trans. Affect. Comput. 2012, 3, 237–249. [Google Scholar] [CrossRef]
- Sun, Y.; Thakor, N. Photoplethysmography revisited: From contact to noncontact, from point to imaging. IEEE Trans. Biomed. Eng. 2016, 63, 463–477. [Google Scholar] [CrossRef] [PubMed]
- Kumar, M.; Pachori, R.B.; Acharya, U.R. An efficient automated technique for CAD diagnosis using flexible analytic wavelet transform and entropy features extracted from HRV signals. Expert Syst. Appl. 2016, 63, 165–172. [Google Scholar] [CrossRef]
- Merone, M.; Soda, P.; Sansone, M.; Sansone, C. ECG databases for biometric systems: A systematic review. Expert Syst. Appl. 2017, 67, 189–202. [Google Scholar] [CrossRef]
- Allen, J. Photoplethysmography and its application in clinical physiological measurement. Physiol. Meas. 2007, 28, R1–R39. [Google Scholar] [CrossRef] [PubMed]
- Martínez-Rodrigo, A.; Pastor, J.M.; Zangróniz, R.; Sánchez-Meléndez, C.; Fernández-Caballero, A. ARISTARKO: A software framework for physiological data acquisition. In Ambient Intelligence-Software and Applications; Springer: New York, NY, USA, 2016; pp. 215–223. [Google Scholar]
- Mohan, P.M.; Nagarajan, V.; Das, S.R. Stress measurement from wearable photoplethysmographic sensor using heart rate variability data. In Proceedings of the International Conference on Communication and Signal Processing, Melmaruvathur, India, 6–8 April 2016; pp. 1141–1144. [Google Scholar]
- Sokolova, M.V.; Fernández-Caballero, A.; López, M.T.; Martínez-Rodrigo, A.; Zangróniz, R.; Pastor, J.M. A distributed architecture for multimodal emotion identification. In Trends in Practical Applications of Agents, Multi-Agent Systems and Sustainability; Springer: New York, NY, USA, 2015; pp. 125–132. [Google Scholar]
- Schäfer, A.; Vagedes, J. How accurate is pulse rate variability as an estimate of heart rate variability?: A review on studies comparing photoplethysmographic technology with an electrocardiogram. Int. J. Cardiol. 2013, 166, 15–29. [Google Scholar] [CrossRef] [PubMed]
- Bonnici, T.; Orphanidou, C.; Vallance, D.; Darrell, A.; Tarassenko, L. Testing of Wearable Monitors in a Real-World Hospital Environment: What Lessons Can Be Learnt? In Proceedings of the 9th International Conference on Wearable and Implantable Body Sensor Networks, London, UK, 9–12 May 2012; pp. 79–84. [Google Scholar]
- Kim, J.; Kim, J.; Ko, H. Low-power photoplethysmogram acquisition integrated circuit with robust light interference compensation. Sensors 2015, 16, 46. [Google Scholar] [CrossRef] [PubMed]
- Lang, P.J.; Bradley, M.M.; Cuthbert, B.N. International Affective Picture System (IAPS): Technical Manual and Affective Ratings; NIMH Center for the Study of Emotion and Attention: Gainesville, FL, USA, 1997. [Google Scholar]
- Morris, J.D. Observations: Sam: The self-assessment manikin; an efficient cross-cultural measurement of emotional response. J. Advert. Res. 1995, 35, 63–68. [Google Scholar]
- Hosseini, S.A.; Khalilzadeh, M.A.; Changiz, S. Emotional stress recognition system for affective computing based on bio-signals. J. Biol. Syst. 2010, 18, 101–114. [Google Scholar] [CrossRef]
- Nitzan, M.; Babchenko, A.; Khanokh, B. Very low frequency variability in arterial blood pressure and blood volume pulse. Med. Biol. Eng. Comput. 1999, 37, 54–58. [Google Scholar] [CrossRef] [PubMed]
- Gil, E.; Orini, M.; Bailón, R.; Vergara, J.M.; Mainardi, L.; Laguna, P. Photoplethysmography pulse rate variability as a surrogate measurement of heart rate variability during non-stationary conditions. Physiol. Meast. 2010, 31, 1271–1290. [Google Scholar] [CrossRef] [PubMed]
- Elgendi, M. On the analysis of fingertip photoplethysmogram signals. Curr. Cardiol. Rev. 2012, 8, 14–25. [Google Scholar] [CrossRef] [PubMed]
- Shin, H.S.; Lee, C.; Lee, M. Adaptive threshold method for the peak detection of photoplethysmographic waveform. Comput. Biol. Med. 2009, 39, 1145–1152. [Google Scholar] [CrossRef] [PubMed]
- Karlen, W.; Ansermino, J.M.; Dumont, G. Adaptive Pulse Segmentation and Artifact Detection in Photoplethysmography for Mobile Applications. In Proceedings of the 34th Annual International Conference of the IEEE EMBS, San Diego, CA, USA, 28 August–1 September 2012; pp. 3131–3134. [Google Scholar]
- Lizawati, S.; Jaegeol, C.; Myeong, G.J.; Desok, K. Ultra Short Term Analysis of Heart Rate Variability for Monitoring Mental Stress in Mobile Settings. In Proceedings of the 29th Annual International Conference of the IEEE EMBS, Lyon, France, 22–26 August 2007; pp. 4656–4659. [Google Scholar]
- Acharya, U.; Joseph, K.; Kannathal, N.; Min, C.; Suri, S. Heart rate variability: A review. Med. Biol. Eng. Comput. 2006, 12, 1031–1051. [Google Scholar] [CrossRef] [PubMed]
- Malik, M.; Xia, R.; Odemuyiwa, O.; Staunton, A.; Poloniecki, J.; Camm, A.J. Influence of the recognition artefact in automatic analysis of long-term electrocardiograms on time-domain measurement of heart rate variability. Med. Biol. Eng. Comput. 1993, 31, 539–544. [Google Scholar] [CrossRef] [PubMed]
- Malliani, A.; Pagani, M.; Lombardi, F.; Cerutti, S. Cardiovascular neural regulation explored in the frequency domain. Circulation 1991, 84, 482–492. [Google Scholar] [CrossRef] [PubMed]
- Jung, Y.; Jianhua, H. A k-fold averaging cross-validation procedure. J. Nonparametr. Stat. 2015, 27, 167–179. [Google Scholar] [CrossRef] [PubMed] [Green Version]
- Salai, M.; Vassányi, I.; Kósa, I. Stress detection using low cost heart rate sensors. J. Healthc. Eng. 2016, 2016, 5136705. [Google Scholar] [CrossRef] [PubMed]
- Mikuckas, A.; Mikuckiene, I.; Venckauskas, A.; Kazanavicius, E.; Lukas, R.; Plauska, I. Emotion Recognition in Human Computer Interaction Systems. Elektron. Elektrotech. 2014, 10, 51–56. [Google Scholar] [CrossRef]
- Sandhya, D. Parametric method for power spectrum estimation of HRV. In Proceedings of the International conference on Signal and Image Processing (ICSIP), Chennai, India, 15–17 December 2010; pp. 334–338. [Google Scholar]
- Ham, J.; Cho, D.; Oh, J.; Lee, B. Discrimination of multiple stress levels in virtual reality environments using heart rate variability. In Proceedings of the Annual International Conference of the IEEE Engineering in Medicine and Biology Society (EMBS), Seogwipo, Korea, 11–15 July 2017; pp. 3989–3992. [Google Scholar]
- Hwang, B.; Ryu, J.W.; Park, C.; Zhang, B. A novel method to monitor human stress states using ultra-short-term ECG spectral feature. In Proceedings of the Annual International Conference of the IEEE Engineering in Medicine and Biology Society (EMBS), Seogwipo, Korea, 11–15 July 2017; pp. 2381–2384. [Google Scholar]
- Castaldo, R.; Montesinos, L.; Melillo, P.; Massaro, S.; Pecchia, L. To what extent can we shorten HRV analysis in wearable sensing? A case study on mental stress detection. In IFMBE Proceedings; Springer: New York, NY, USA, 2017; Volume 65, pp. 643–646. [Google Scholar]
- Castaldo, R.; Xu, W.; Melillo, P.; Pecchia, L.; Santamaria, L.; James, C. Detection of mental stress due to oral academic examination via ultra-short-term HRV analysis. In Proceedings of the Annual International Conference of the IEEE Engineering in Medicine and Biology Society (EMBS), Orlando, FL, USA, 16–20 August 2016. [Google Scholar]
- Mayya, S.; Jilla, V.; Tiwari, V.N.; Nayak, M.M.; Narayanan, R. Continuous monitoring of stress on smartphone using heart rate variability. In Proceedings of the IEEE 15th International Conference on Bioinformatics and Bioengineering (BIBE), Belgrade, Serbia, 2–4 November 2015. [Google Scholar]
- Salafi, T.; Kah, J.C.Y. Design of unobtrusive wearable mental stress monitoring device using physiological sensor. In Proceedings of the 7th WACBE World Congress on Bioengineering, Singapore, 6–8 July 2015; pp. 11–14. [Google Scholar]
- Haouij, E.I.N.; Poggi, J.-M.; Ghozi, R.; Sevestre-Ghalila, S.; Jaïdane, M. Random forest-based approach for physiological functional variable selection for driver’s stress level classification. In Proceedings of the Conference of the Italian Statistical Society, Florence, Italy, 28–30 June 2017; pp. 393–398. [Google Scholar]
- Zenonos, A.; Khan, A.; Kalogridis, G.; Vatsikas, S.; Lewis, T.; Sooriyabandara, M. HealthyOffice: Mood recognition at work using smartphones and wearable sensors. In Proceedings of the The Second IEEE International Workshop on Sensing Systems and Applications Using Wrist Worn Smart Devices, Sydney, Australia, 14–18 March 2016; pp. 1–6. [Google Scholar]
- Sandulescu, V.; Andrews, S.; Ellis, D.; Bellotto, N.; Mozos, O.M. Stress detection using wearable physiological sensors. In Artificial Computation in Biology and Medicine; Ferrández, J.M., Álvarez-Sánchez, J., de la Paz López, F., Toledo-Moreo, F., Adeli, H., Eds.; Springer: New York, NY, USA, 2015; pp. 526–532. [Google Scholar]
- Schaaff, K.; Adam, M.T.P. Measuring emotional arousal for online applications: Evaluation of ultra-short term heart rate variability measures. In Proceedings of the Humaine Association Conference on Affective Computing and Intelligent Interaction (ACII), Geneva, Switzerland, 2–5 September 2013; pp. 362–368. [Google Scholar]
- Nardelli, M.; Valenza, G.; Greco, A.; Lanata, A.; Pasquale, E. Recognizing Emotions Induced by Affective Sounds through Heart Rate Variability. IEEE Trans. Affect. Comput. 2015, 6, 385–394. [Google Scholar] [CrossRef]
- Jeyhani, V.; Mahdiani, S.; Peltokangas, M.; Vehkaoja, A. Comparison of HRV parameters derived from photoplethysmography and electrocardiography signals. In Proceedings of the 37th Annual International Conference of the IEEE Engineering in Medicine and Biology Society, Milan, Italy, 25–29 August 2015; pp. 5952–5955. [Google Scholar]
- Selvaraj, N.; Jaryal, A.; Santhosh, J.; Deepak, K.K.; Anand, S. Assessment of heart rate variability derived from finger-tip photoplethysmography as compared to electrocardiography. J. Med. Eng. Technol. 2008, 32, 479–484. [Google Scholar]
- Lu, S.; Zhao, H.; Ju, K.; Shin, K.; Lee, M.; Shelley, K.; Chon, K.H. Can photoplethysmography variability serve as an alternative approach to obtain heart rate variability information? J. Clin. Monit. Comput. 2008, 22, 23–29. [Google Scholar]
Figure 1.
(a) Photoplethysmogram sensor, and (b) major building blocks: analog front-end, power rails, clock, and protection circuitry. DC: direct current; SPI: serial peripheral interface.
Figure 1.
(a) Photoplethysmogram sensor, and (b) major building blocks: analog front-end, power rails, clock, and protection circuitry. DC: direct current; SPI: serial peripheral interface.

Figure 2.
Experimentation time-line. IAPS: International Affective Picture System.

Figure 3.
Receiver operating characteristic (ROC) curves for the four statistical significant parameters: (a) SDNN (standard deviation of NN intervals), (b) DRNN (dynamic range of NN intervals), (c) SENN (standard error of successive differences of adjacent NN intervals), (d) SDFD (the first derivative of standard deviation). AUC: area under curve.

Figure 4.
Tree-based discriminant models obtained by considering SDNN, MNN, SENN and RMSFD (the first derivative of root mean square) values from all PRV (pulse rate variability) signals.
Figure 4.
Tree-based discriminant models obtained by considering SDNN, MNN, SENN and RMSFD (the first derivative of root mean square) values from all PRV (pulse rate variability) signals.


Table 1.
Temporal, frequency and morphological features computed for pulse rate variability (PRV) signals.
Table 1.
Temporal, frequency and morphological features computed for pulse rate variability (PRV) signals.
| Signal | Analysis | Features |
|---|---|---|
| PRV | Temporal | MNN, SDNN, SENN, DRNN, SDFD, RMSFD, pNN50 |
| Morphological | HRNN, TINN, SKNN, KUNN | |
| Frequency | LF, HF, NHF |
Table 2.
Results obtained. Mean and std values for emotional states of calm and distress and statistical significance (), for all parameters are presented.
Table 2.
Results obtained. Mean and std values for emotional states of calm and distress and statistical significance (), for all parameters are presented.
| Physiological | Feature | Calmness | Distress | |
|---|---|---|---|---|
| Analysis | Acronym | Mean ± Std | Mean ± Std | |
| Temporal | MNN | 0.7941± 0.1021 | 0.7765± 0.1064 | 0.4890 |
| Temporal | SDNN | 0.0596 ± 0.0243 | 0.1064 ± 0.0527 | 0.0046 |
| Temporal | DRNN | 0.2652 ± 0.1025 | 0.4522 ± 0.2453 | 1.15 |
| Temporal | SENN | 0.0634 ± 0.0294 | 0.0934 ± 0.0500 | 0.0036 |
| Temporal | SDFD | 0.0589 ± 0.0361 | 0.1039 ± 0.0723 | 0.0018 |
| Temporal | RMSFD | 0.0853 ± 0.0570 | 0.1140 ± 0.0712 | 0.075 |
| Temporal | PNN50 | 0.9997 ± 0.0018 | 0.9986 ± 0.0039 | 0.1495 |
| Morphological | HRNN | 5.2802 ± 1.4449 | 5.6542 ± 1.8026 | 0.3487 |
| Morphological | TINN | 0.3606 ± 0.1960 | 0.4894 ± 0.2373 | 0.053 |
| Morphological | SKNN | −0.1009 ± 1.2990 | −0.1335 ± 1.0867 | 0.9107 |
| Morphological | KUNN | 5.9136 ±6.8703 | 4.9149 ± 3.9008 | 0.4637 |
| Frequency | LF | 0.0032 ± 7.5112 | 0.0031 ± 8.5693 | 0.5710 |
| Frequency | HF | 0.0073 ± 0.0017 | 0.0071 ± 0.0019 | 0.5711 |
| Frequency | NHF | 0.4401 ± 1.7377 | 0.4401 ± 1.7022 | 0.9107 |
Table 3.
Sensitivity (Se), specificity (Sp) and accuracy (Ac) of significant parameters using ROC (receiver operating characteristic) analysis for training and test subsets.
Table 3.
Sensitivity (Se), specificity (Sp) and accuracy (Ac) of significant parameters using ROC (receiver operating characteristic) analysis for training and test subsets.
| Physiological Analysis | Feature Acronym | Learning | Test | ||||
|---|---|---|---|---|---|---|---|
| Se (%) | Sp (%) | Ac (%) | Se (%) | Sp (%) | Ac (%) | ||
| Temporal | SDNN | 61.30 | 84.02 | 72.34 | 58.82 | 76.47 | 67.41 |
| Temporal | DRNN | 69.57 | 85.10 | 77.32 | 61.76 | 82.35 | 72.06 |
| Temporal | SENN | 68.23 | 75.12 | 71.42 | 64.61 | 70.59 | 67.65 |
| Temporal | SDSD | 66.73 | 75.20 | 70.54 | 67.65 | 64.71 | 66.18 |
© 2018 by the authors. Licensee MDPI, Basel, Switzerland. This article is an open access article distributed under the terms and conditions of the Creative Commons Attribution (CC BY) license (http://creativecommons.org/licenses/by/4.0/).
Share and Cite
MDPI and ACS Style
Zangróniz, R.; Martínez-Rodrigo, A.; López, M.T.; Pastor, J.M.; Fernández-Caballero, A. Estimation of Mental Distress from Photoplethysmography. Appl. Sci. 2018, 8, 69. https://doi.org/10.3390/app8010069
AMA Style
Zangróniz R, Martínez-Rodrigo A, López MT, Pastor JM, Fernández-Caballero A. Estimation of Mental Distress from Photoplethysmography. Applied Sciences. 2018; 8(1):69. https://doi.org/10.3390/app8010069
Chicago/Turabian StyleZangróniz, Roberto, Arturo Martínez-Rodrigo, María T. López, José Manuel Pastor, and Antonio Fernández-Caballero. 2018. "Estimation of Mental Distress from Photoplethysmography" Applied Sciences 8, no. 1: 69. https://doi.org/10.3390/app8010069
Note that from the first issue of 2016, this journal uses article numbers instead of page numbers. See further details here.