A Game Player Expertise Level Classification System Using Electroencephalography (EEG)
by
 , ,
, ,
Syed Muhammad Anwar
1,* ,
,
Sanay Muhammad Umar Saeed
2,
Muhammad Majid
2,
Saeeda Usman
3,
Chaudhry Arshad Mehmood
4 and
Wei Liu
5 1
Department of Software Engineering, University of Engineering and Technology, Taxila 47050, Pakistan
2
Department of Computer Engineering, University of Engineering and Technology, Taxila 47050, Pakistan
3
Department of Electrical Engineering, COMSATS Institute of Information Technology, Sahiwal 54700, Pakistan
4
Department of Electrical Engineering, COMSATS Institute of Information Technology, Abbotabad 22060, Pakistan
5
Electronic and Electrical Engineering, University of Sheffield, Sheffield S1 4DE, UK
*
Author to whom correspondence should be addressed.
Appl. Sci. 2018, 8(1), 18; https://doi.org/10.3390/app8010018
Submission received: 30 October 2017
/
Revised: 11 December 2017
/
Accepted: 19 December 2017
/
Published: 23 December 2017
Abstract
:The success and wider adaptability of smart phones has given a new dimension to the gaming industry. Due to the wide spectrum of video games, the success of a particular game depends on how efficiently it is able to capture the end users’ attention. This leads to the need to analyse the cognitive aspects of the end user, that is the game player, during game play. A direct window to see how an end user responds to a stimuli is to look at their brain activity. In this study, electroencephalography (EEG) is used to record human brain activity during game play. A commercially available EEG headset is used for this purpose giving fourteen channels of recorded EEG brain activity. The aim is to classify a player as expert or novice using the brain activity as the player indulges in the game play. Three different machine learning classifiers have been used to train and test the system. Among the classifiers, naive Bayes has outperformed others with an accuracy of , when data from all fourteen EEG channels are used. Furthermore, the activity observed on electrodes is statistically analysed and mapped for brain visualizations. The analysis has shown that out of the available fourteen channels, only four channels in the frontal and occipital brain regions show significant activity. Features of these four channels are then used, and the performance parameters of the four-channel classification are compared to the results of the fourteen-channel classification. It has been observed that support vector machine and the naive Bayes give good classification accuracy and processing time, well suited for real-time applications.
1. Introduction
The video game industry is one of the major industries that incorporates many sub-disciplines. The target audience of this industry has grown from a more narrow clientele base to the main stream in recent years. The biggest catalyst has been the availability and accessibility of computer systems. Gaming has been a major part of the entertainment industry and is now becoming a way of life in learning, task management and simulation activities. A positive effect is seen on the gaming industry with an advancement in computing capabilities. The user experience with games is improved by the advanced computing graphics due to the availability of more computing power. At the same time, the game industry is going through a transformation due to a wider availability of smart phones and tablet devices. Games for smart devices now compete with classical console- and computer-based games and have attracted the attention of people from all walks of life. This renewed interest is mostly seen in mobile- and handheld device-based games as compared to console games [1]. The focus of recent development in the gaming industry covers both entertainment and educational purposes [2].
In the last few years, different methods have been proposed to assess the cognitive aspect of human response to video games [3,4]. For instance, electroencephalography (EEG) has been employed to analyse stress in computer game players [5]. Physiological signals are employed to analyse the learning outcome of digital games [6]. It has also been observed that video game training enhances cognitive control in older adults [7]. EEG-based experiments have been conducted in healthy, as well as diseased persons [8]. A neuro-feedback game has been used to enhance the attention in players [9]. EEG has also been used to enhance the game play experience of players [10]. The classification of the expertise level of a mobile game player during earlier stages of the game play can be fed back to the user. This would further entice players’ interest in the game and allow assessing the cognitive aspects, as well.
Brain computer interfaces (BCIs) have already been used in game development [11]. Automated controls within the game play that come from human brain signals can be the next big thing in the gaming industry. This would also increase the spectrum of game users to those people who have some physical impairment and are not able to perform game controls by physical movements. The time and money spent on mobile games has increased considerably. This fact becomes obvious by looking at the application download patterns on various mobile-based platforms [12]. This directly translates into a massive increase in the number of mobile game players, and hence, their analysis and cognitive assessment have gained significant importance. In [13], an analysis of the mobile game players’ experience was performed based on different BCI controls. Electrophysiological measurements have been used to examine the players’ response to games [14,15]. EEG has also been used to measure the cognitive state of the brain such as stress [16]. In [17], field experts discussed the methodological advancements within player experience and playability research considering EEG as a good measure for cognitive processing. In [18], several methods were proposed to extract useful information from the observed human EEG activities. These methods involve three common operational steps. In the first step, data are preprocessed for noise reduction. Secondly, useful features are extracted from the preprocessed data. In the third step, classification is performed using the extracted features. The motivational states have been predicted based on brain activity for game play [19]. A non-EEG-based method to classify expert and novice levels of a game player is presented in [20], where objective-based action sequences are used. However, the approach only measures how certain objectives are achieved during game play for classification, which is a subjective measure. In [21], an analysis of the experience of a video game player is presented based on recorded EEG signals and shows that wearable EEG devices can be used for game analytics and to differentiate various cognitive processes.
In summary, there are various EEG-based methods presented in literature for game analytics and the evaluation of human response, as well as non-EEG-based methods for the classification of video game player expertise level. To the best of our knowledge, the same task has not been achieved using EEG and is presented in this study by using a method that classifies the expertise level of a game player into two classes, i.e., expert and novice. The aim is to explore whether, EEG can be used to tell how good a player is in a video game just by looking at the brain activity recorded during the game play and how certain brain areas play a more significant role than others. Game analytics and the human psychological response comprise a very interesting field of research as seen from the literature and the increasing use of mobile games in different fields of life. Video game play holds exciting promise as an activity that may provide generalized enhancement to a wide range of perceptual and cognitive abilities. Looking at these patterns, this study is conducted with a wider perspective of advancing research applications in psychology, BCI and the human cognition process. The study expands on the pilot study in [22] where initial data were recorded and the hypothesis of predicting the expertise of a game player was tested. In this study, data have been collected more rigorously to avoid artefacts and gender bias by adding more data to the experimental design. After noise reduction, features are extracted in the time domain from fourteen, as well as four selected EEG channels showing significant brain activity. Multiple classification algorithms are used to predict the expert-novice level of the player, and the results are evaluated using multiple performance metrics. The major contributions of this study are,
- EEG-based data are recorded from multiple participants during the play of a mobile game to automatically classify the player as expert or novice on the basis of brain activity.
- Those significant brain areas are highlighted and selected as being affected during the game play after a careful statistical analysis.
- Thirteen morphological features are extracted in the time domain for classification purposes.
2. Proposed Methodology
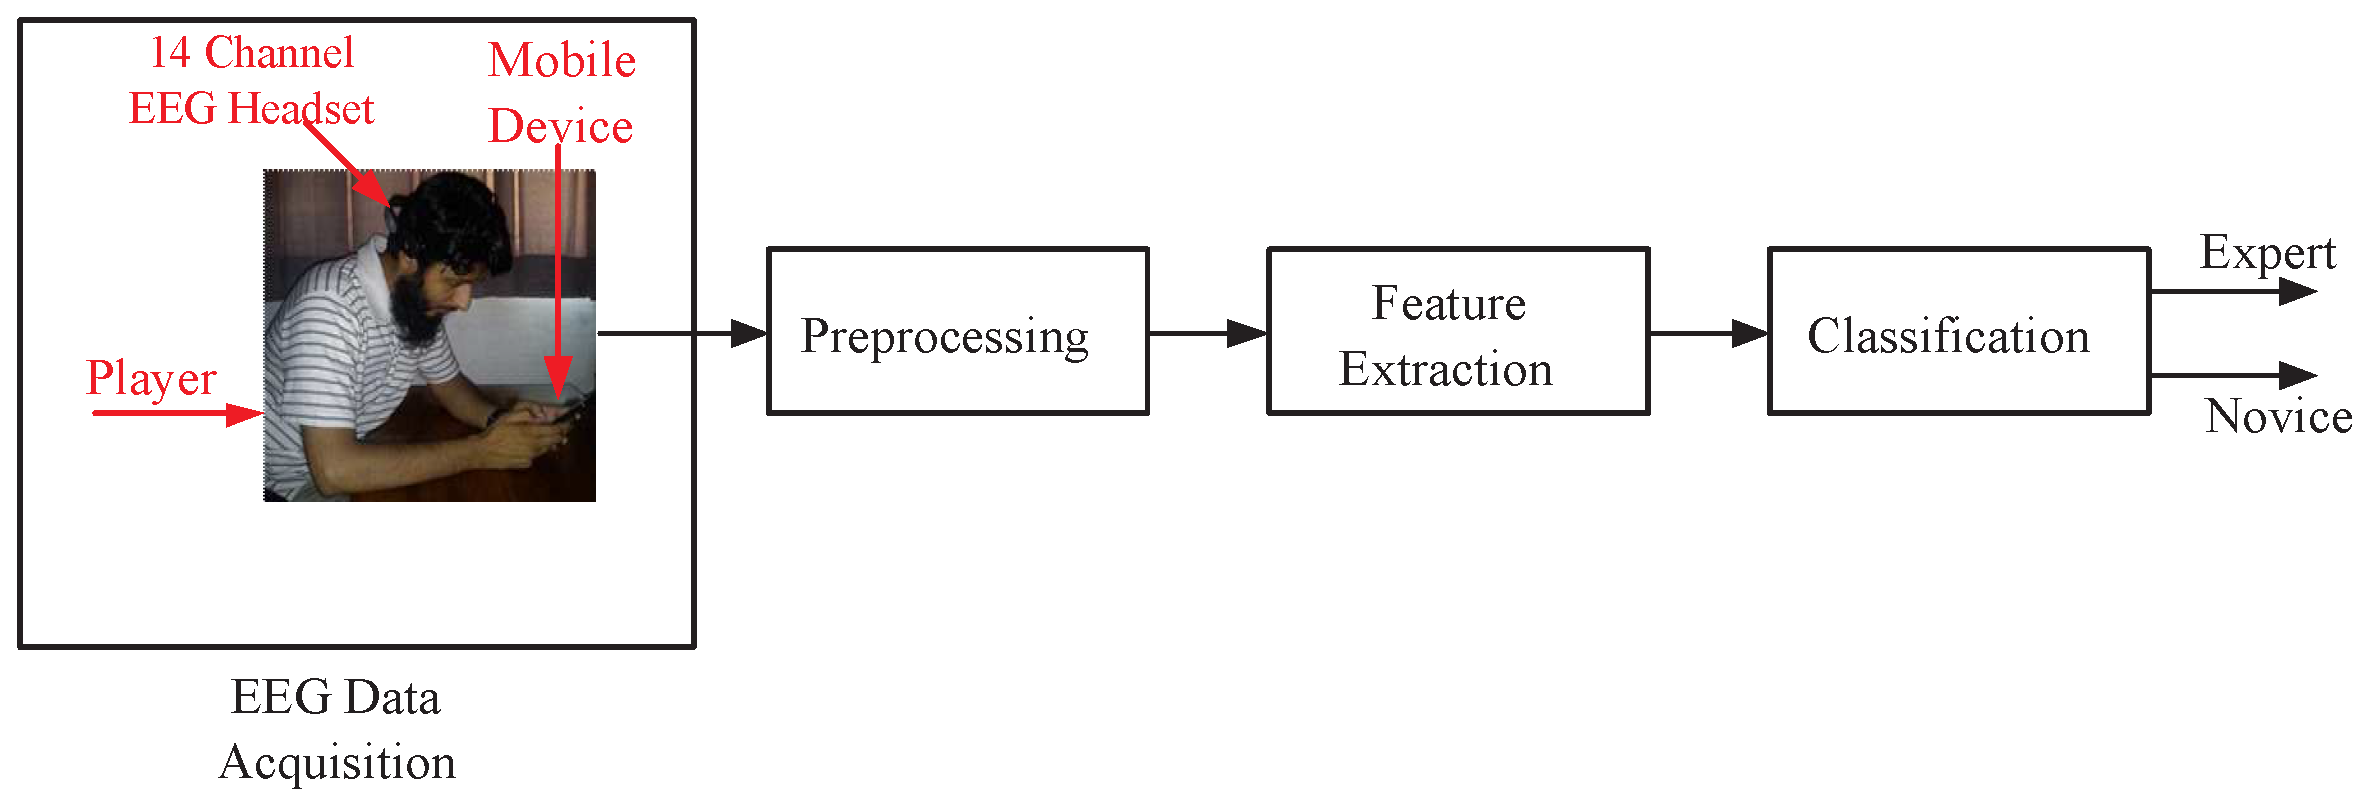
The steps involved in analysing the brain signals recorded using wearable EEG for the expert-novice classification of a game player are shown in Figure 1. The detail of each step is as follows.
2.1. EEG Data Acquisition
The electrical activity of the brain is recorded using EEG by electrodes placed on the human scalp. The recorded brain activity is represented as waves with varying frequencies and amplitudes. The frequency variation of the signal is measured in hertz (Hz), whereas the amplitude variation is in the micro-volt range and represents the electrical activity of the brain. The frequency behaviour of the EEG signals is generally classified into five different bands i.e., alpha, beta, theta, gamma and delta, where each band could signify different physiological states of mind. A particular state of mind can be activated by using different stimuli such as audio and video [23]. The details of stimuli, participants and procedures used in this study are presented as follows.
2.1.1. Stimuli
In most EEG-based studies, a stimulus is required to activate the desired response. The game named is selected as a stimulus for this study. The game has been widely downloaded and played and is selected due to its popularity among smart phone and tablet device users. Temple Run is a never-ending game developed by IMANGI studios http://imangistudios.com/. In this game, a character that runs in the temple after stealing the treasure is controlled by the mobile game player. The character is followed by “demonic monkeys” that can eat the character. The game ends in the case of character death either by falling from the temple or being eaten by the monkey. The player can manoeuvre the character in left and right directions, jump and slide to avoid obstacles. The direction of the character can also be controlled by tilting the smart phone and hand-held devices.
2.1.2. Participants
The EEG data are recorded using a wearable device for 20 healthy subjects including male and female participants. The age of these participants ranged between 18 and 23 years, with a mean age of years. The participants are selected from a relatively younger age group, since this age group is most likely to engage in mobile game play. All participants belonged to the Asian Pacific ethnicity, having a similar educational background with no self-reported mental illness. The participants involved in this experiment used to play mobile games with an average frequency of four days per week. This frequency of game play is self-reported by the participants and is recorded to analyse the expertise level. Informed consent was taken from all participants for using the recorded brain signals for the purpose of this research.
2.1.3. Apparatus
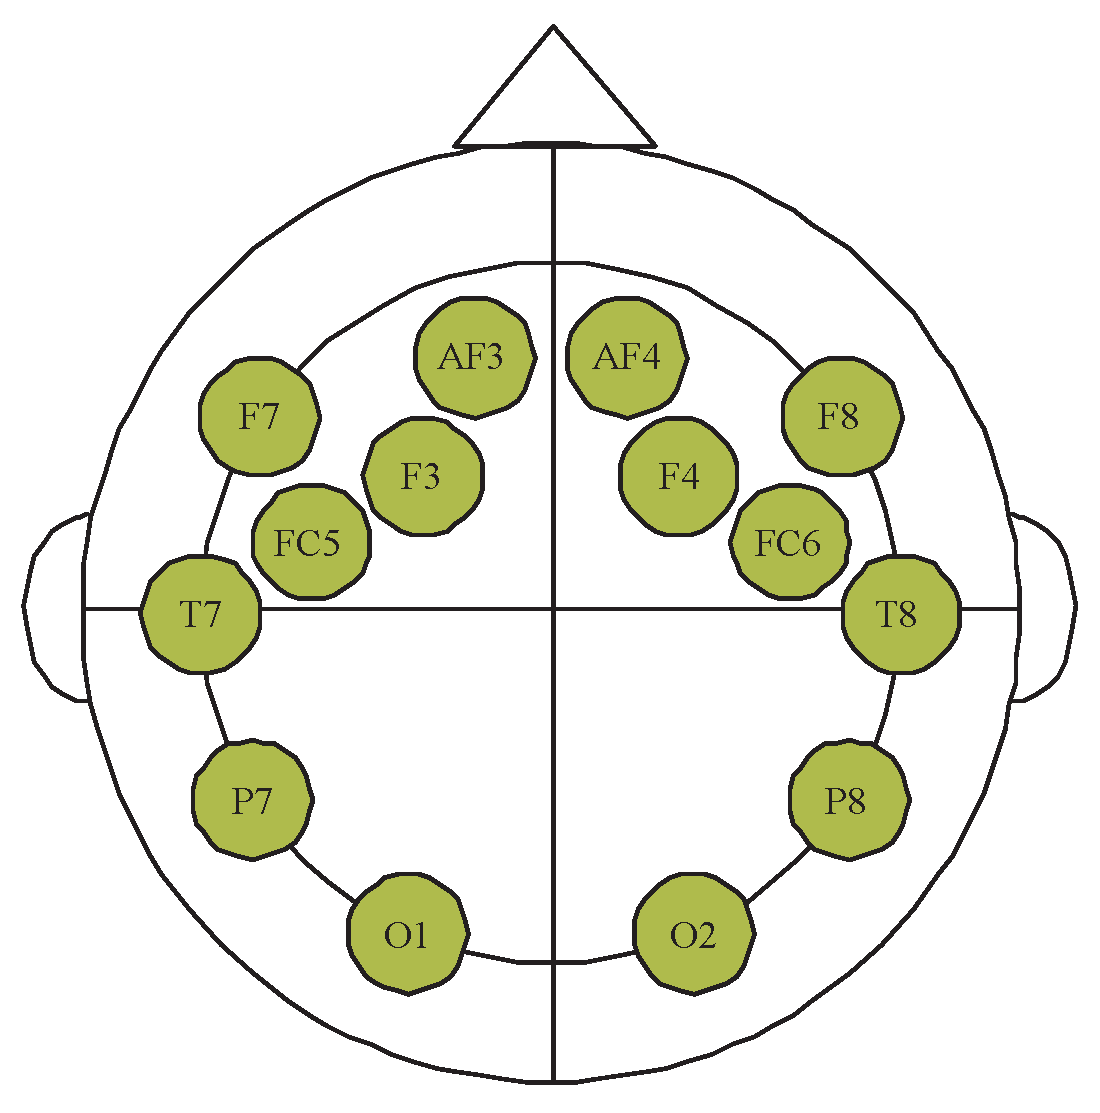
The raw EEG data are recorded using a commercially-available EMOTIV (San Francisco, CA, USA) EPOC EEG headset with the EMOTIV Premium SDK software development kit (SDK) v 3.3.3, San Francisco, CA, USA. The observed data are stored in the European data format (EDF). The headset provides fourteen micro-electrodes for recording EEG activity including F3, F4, F7, F8, AF3, AF4, P7, P8, T7, T8, FC5, FC6, O1 and O2. The even- and odd-numbered channels represent electrodes for the right and left hemispheres of the brain, respectively. In addition to the fourteen channels, there are two additional electrodes that act as the reference for each hemisphere of the head. Saline liquid is used to hydrate the electrodes to reduce the resistance of connection between electrode and skull. Figure 2 shows the reference location of electrodes on the player’s scalp providing coverage in the frontal, temporal, parietal and occipital regions of the brain. The spatial placement of electrodes of the EMOTIV EPOCH EEG fourteen-channel headset follows the international 10–20electrode positioning system [24]. The exact location of these channels can vary depending on the head size and hair length of participants. The EMOTIV headset is made flexible to adjust to all head sizes. The recorded brain waves represent the activity in a local brain region, and with the sparse placement of electrodes, it is not effected by slight displacement in location. The recorded data are transmitted over a wireless Bluetooth interface using a proprietary dongle that is connected through a USB connection to a computer system running the EMOTIV SDK.
2.1.4. Procedure
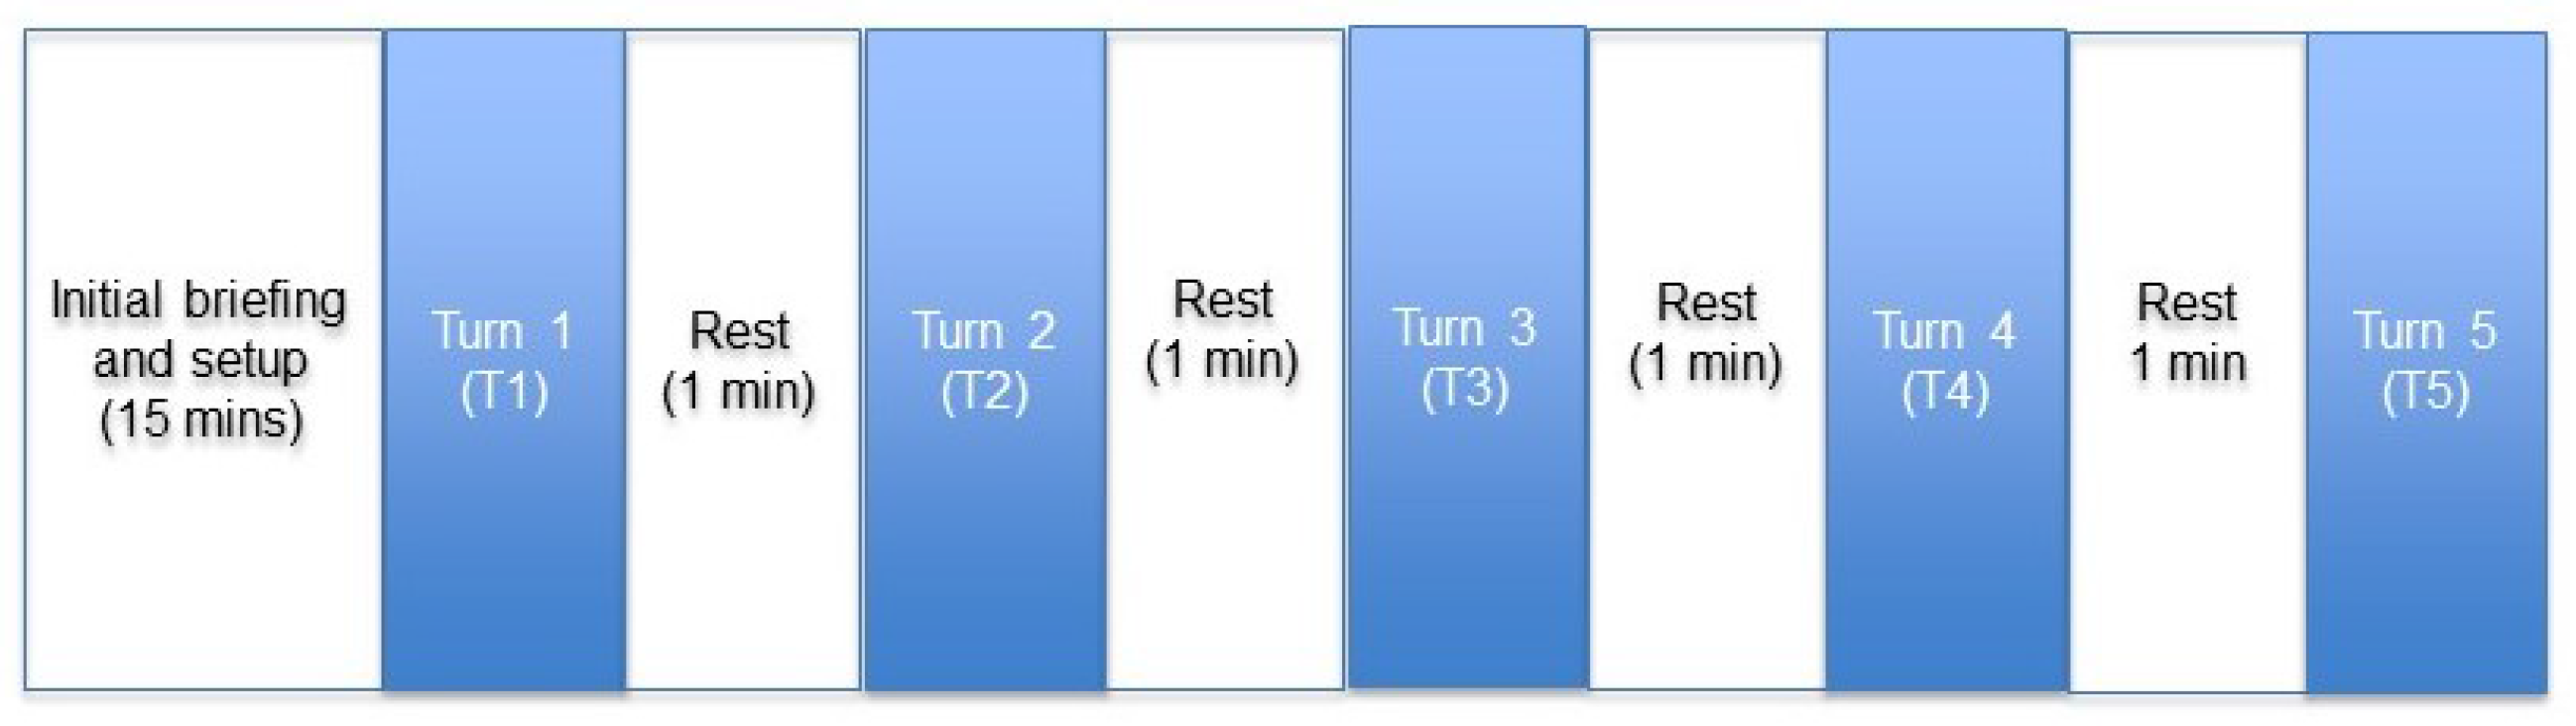
The data were recorded in a room where participants were provided with a comfortable environment and a smart phone for game play. The sources of environmental noise were kept to a minimum by avoiding electric cabling near the setup. The wireless headset and the SDK were properly synchronised to avoid any error in EEG signal acquisition during the game play. The sequence of steps, including the setup, game play and rest durations, is shown in Figure 3. Each participant was given a briefing on the sequence of steps, and the device was properly placed on the participant’s head. For each individual, five turns of playing temple run were used for the purpose of data recording separated by a rest time of one minute. The time for each turn varied for each participant and was represented by T1, T2, T3, T4 and T5. The average time taken to record the complete data for five turns for a single participant was minutes with a total of 286 minutes of EEG recording used in this study. Since the expertise level cannot be reliably judged with a single turn, to be more rational, five turns were used.The number of turns was selected after careful experimentation, where the average scores were able to differentiate between an expert and novice player in the training set. For supervised learning, each player was assigned a novice or expert label based on a threshold, Z, calculated by adding and averaging the scores as,
where U is the number of users, R is the number of turns and is the score for the j-th turn by the i-th player. The assigned labels corresponded to the self-reported expertise level of players. Participant average scores and the threshold value are shown in Figure 4. This resulted in 8 players classified as expert and 12 players classified as novice and are shown by blue and orange bars, respectively. The time taken by each participant in all turns is presented in Table 1, where and represent the time for five turns, and and represent the rest time. The rest time between each turn is 60 seconds.
2.2. Preprocessing
The EEG data recorded by the wireless EMOTIV headset are affected by different kinds of artefacts and need to be preprocessed to improve the quality of signals. These artefacts include noise from electrical lines, muscle movement, heart beat, sweating, electrode movement, and so on. The EEG signals have a bandwidth between and 100 Hz and are recorded with 128 samples per second. In order to remove the DC offset, the mean value is subtracted from the entire data. For noise removal, a two-step process is applied including filtering and independent component analysis (ICA). The artefacts caused by physical movements such as heart beat and eye blink appear in the frequency range between 1.2 Hz and 5 Hz. The muscular movements effect the EEG oscillations above 45 Hz. The high gamma band is shown to have the highest correlation with motor-evoked potentials (MEPs) [25]. A first-order band-pass Butterworth filter with a pass-band of 5–45 Hz is used to remove artefacts caused by biological movements. The filtering process removes part of the delta and gamma waves, but the experimental procedure does not include any audio source. The selected game for this study does not rely on memory, as the game play is random for each turn. The filtering process is also useful in removing the power interference that occurs at 50 Hz. The proposed method also finds the significant channels that can be used for classification of player expertise level. It is a known fact that EEG recordings from multiple channels represent information that is a mixture of underlying sources from different brain areas. Hence, ICA is used to estimate independent sources from highly correlated EEG data [26]. ICA is a blind source separation technique, which statistically separates uncorrelated signals. ICA is performed using EEG lab [27] on the raw EEG data, and the separate components are used for feature extraction.
2.3. Feature Extraction
The important information contained in the data can be retained using features that are significant and uncorrelated. In the feature extraction stage, thirteen morphological features in the time domain are extracted from all the recorded EEG data. The features represent the underlying structure of the EEG signal that is expected to vary with the expertise level of game players. The mathematical details of the features are as follows and are reported in [28].
- Maximum value ():
- Maximum value time ():where is the signal maximum value.
- Minimum value ():
- Minimum value time ():where is the signal minimum value.
- Maximum absolute value ():
- Peak to peak signal value ():
- Latency to maximum value ratio ():
- Latency to minimum value ratio ():
- Peak to peak time window ():
- Sum of values (S):where the summation is performed over a period of time.
- Mean ():where N is the total number of samples.
- Signal power (P):where T is the time period.
- Signal energy (E):
2.4. Classification
The features are separated into different classes using different machine learning methods, which are generally categorized into supervised and unsupervised techniques. Different classification techniques have been successfully applied to EEG signal analysis such as K-nearest neighbour (KNN) [29], Bayesian classifier [30], multi-layer perceptron (MLP) [31], linear discriminant analysis (LDA) [32] and support vector machine (SVM) [33]. The following is a brief description of the supervised classification algorithms used in this study.
2.4.1. Support Vector Machine
A hyperplane is used in support vector machine to discriminate between different classes. This hyperplane is selected on the basis of margin maximization. The generalization capability of SVM is increased by maximizing the margins, that is the distance between the nearest training points. It is generally considered insensitive to problems such as over-fitting and the curse of dimensionality. This fact makes SVM suitable for the classification of expert-novice player classification. Linear, as well as non-linear analysis can be used for the EEG data [34]. The SVM algorithm uses the kernel trick to create non-linear decision boundaries, in which data are mapped to higher dimensional space by using a kernel function.
2.4.2. Naive Bayes Classifier
Naive Bayes is one of the simplest and easiest to implement statistical algorithms. It calculates the probability of each class member to assign them the best suited class. The method is based on the assumption that the attributes used are not dependent on each other, which helps in reducing the computational cost. A good classification performance has been observed with this underlying assumption [29]. The naive Bayes classifier assumes that the samples are contained in a training set , having k class labels. For game player classification, there are two classes to be identified, including and . represents the samples, and represents the n measured values of attributes represented by,
where , , ⋯, are the probabilities calculated from the training data.
2.4.3. Multilayer Perceptron
Neural network-based algorithms are widely used in data classification studies. A multi-layer perceptron has a three-layered structure, consisting of an input layer, a hidden layer and an output layer. The hidden layer could have multiple layers. In each layer, neurons are connected to the output of neurons from the immediately preceding layer. The neurons in the input and output layers only have outgoing and ingoing connections, respectively. The MLP algorithm is considered to be adaptable to a large variety of problems, but is sensitive to the problem of overfitting for noisy data. The inputs of neurons are mapped to the output using transfer functions such as sigmoid, rectified linear unit and hyperbolic tangent [35]. In this case, a sigmoid function has been used to determine the activity with the help of a function of the total weighted input given as,
The total weighted input of a unit is computed as,
where the level of activity and the weight between the and connection are represented by and , respectively.
3. Experimental Results
The details about the experimental settings and performance analysis are presented in this section.
3.1. Configuration and Parameter Settings
The data are divided with a 70–30 ratio, where of the data is used for training purpose and the remaining data to test the proposed system. The experiments are performed on a core i5 system with 6 GB RAM. To classify the recorded EEG data into expert-novice level based on extracted features from the fourteen-channel headset, three different classification algorithms were trained, including naive Bayes, SVM and MLP. The MLP used in this study consists of a hidden layer with 15 neurons, and the network is fully connected such that all neurons in each layer have a connection with all neurons in the following layer. The network is trained using the back-propagation algorithm, and cross entropy is used as the cost function. The weights are initialized randomly from a zero mean Gaussian distribution. The learning follows the stochastic gradient descent (SGD) algorithm and selects the optimized weights for the neuronal connections giving an accurate classification of game player expertise level. The network hyper-parameters including the learning rate are selected using grid search. For the SVM classifier, a linear kernel is used.
3.2. Channel Selection
A statistical analysis is performed to select the most significant channels for classifying the expertise level. A box-plot for the normalized power spectral densities (PSDs) of the fourteen EEG channel recordings for expert and novice players is shown in Figure 5. The + symbol indicates the outliers, and the red lines within the box represent the median value. The rectangular box lies in between the first and third quartile of the data values. The results show that on average, expert players have more brain activity as compared to novice players. A t-test is applied on the PSD values of expert and novice players. A t-test is used to compare the averages of two results, and the resulting t-score and p-value are a measure of the significance of the results. A p-value of less than indicates that the difference between averages is significant and not by chance. The results show that only channels , , and are significant for the purpose of player classification with a p-value .
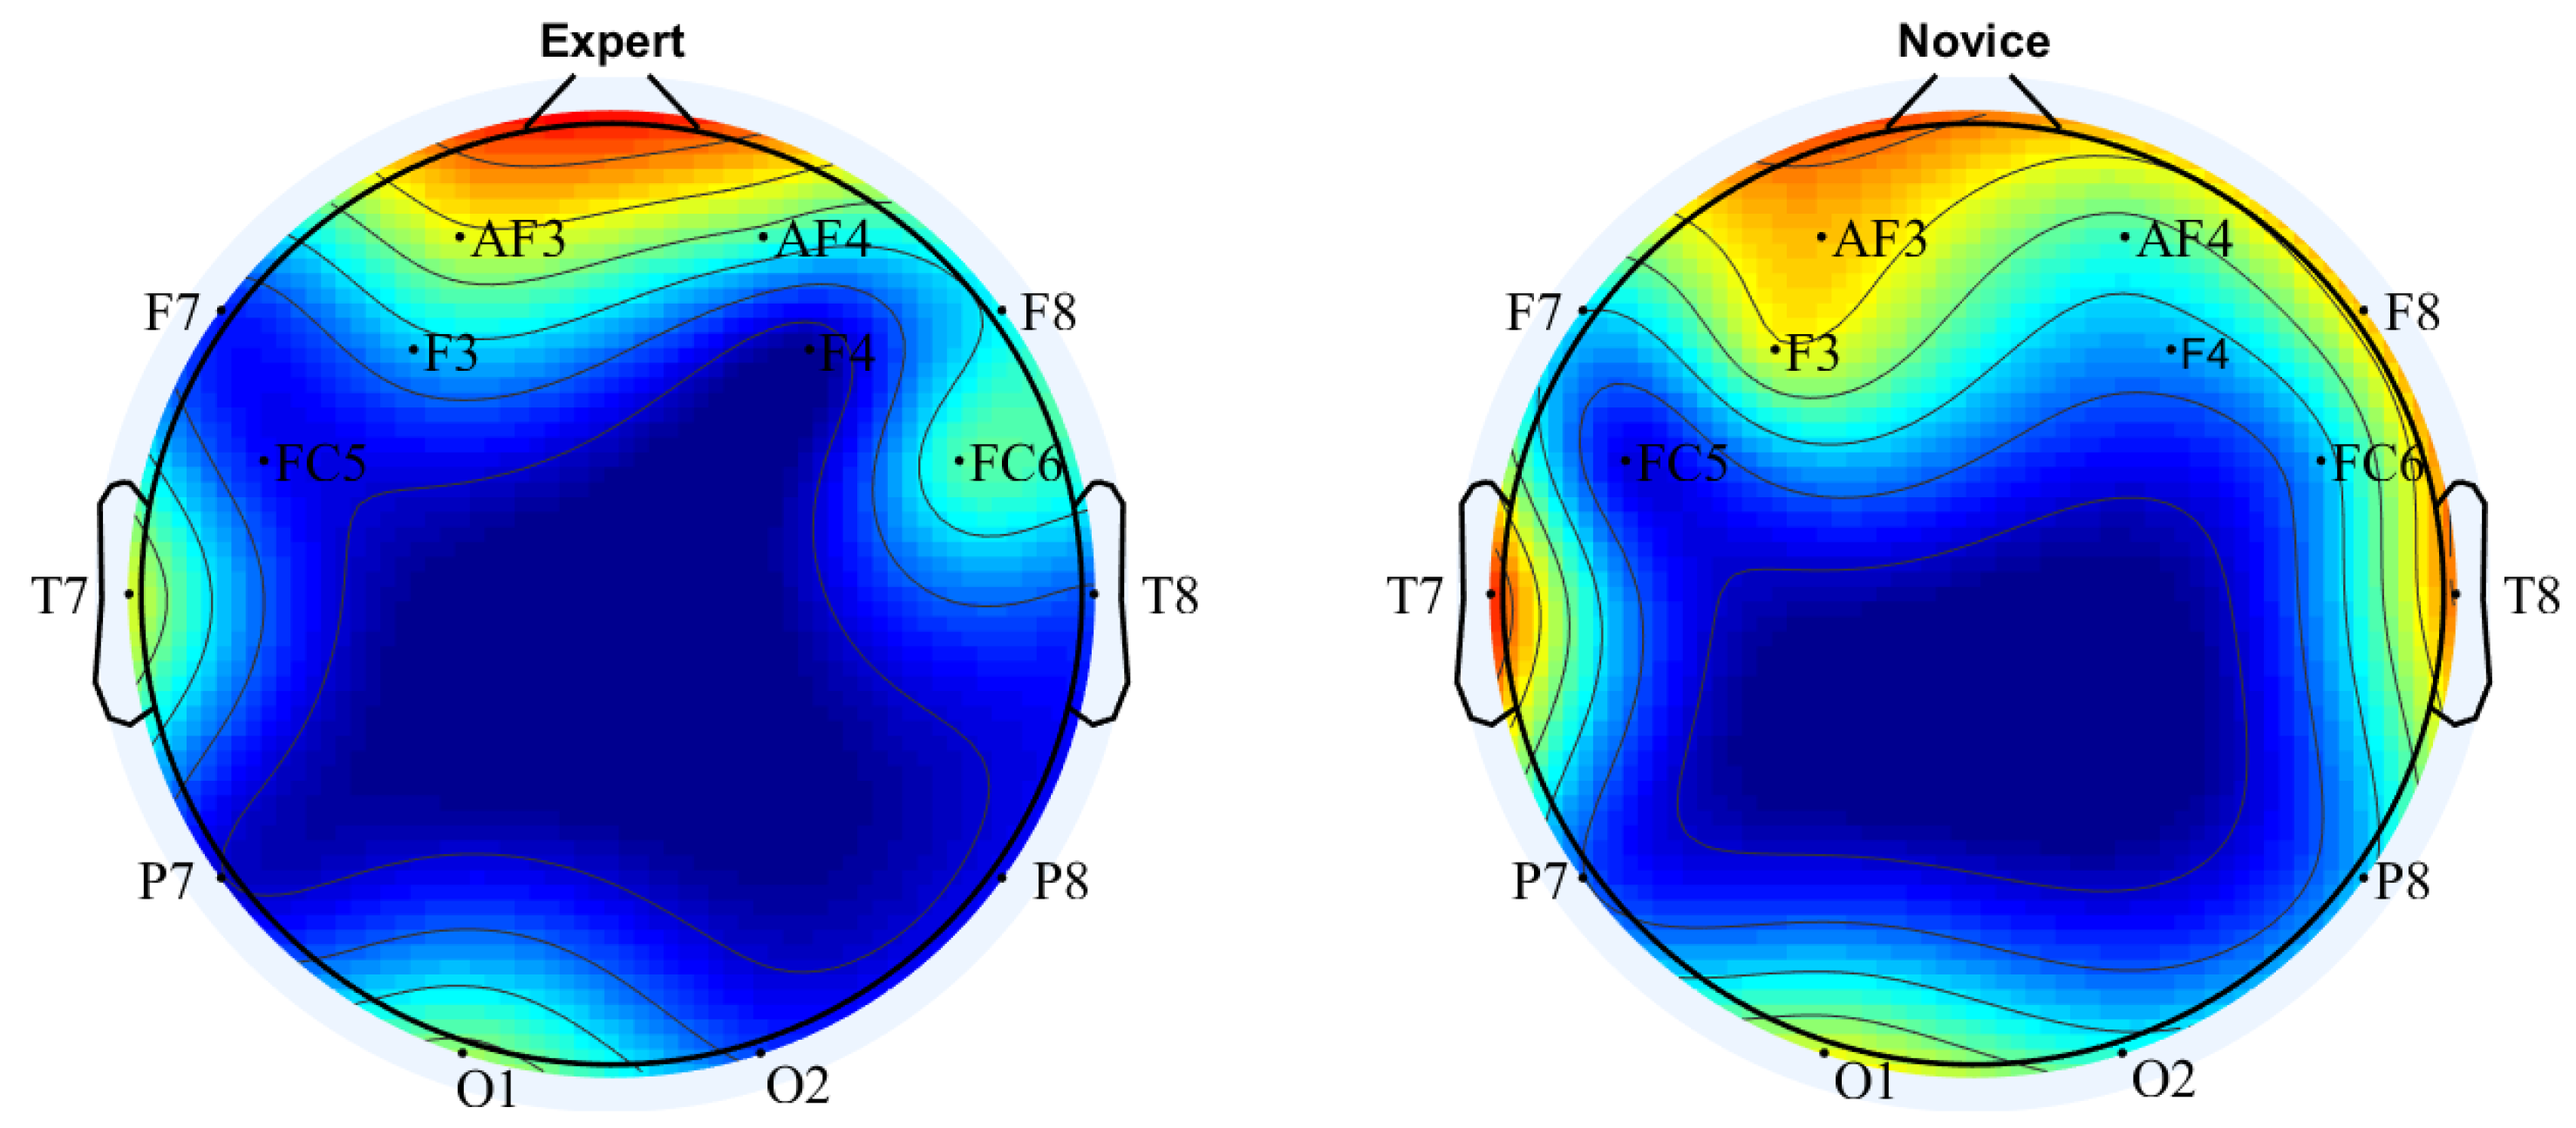
The data of fourteen channels are also analysed on the basis of their activity using brain visualizations. Figure 6 shows the brain activity maps of the average power spectral densities for each channel of an expert and novice player. The colours in the figure represent brain activity as depicted using the PSD, where shades of blue show no or lesser activity, which increases as the colour turns red. It is evident that channels , , and are most active during game play of the expert player and do not show a significant activity in the case of the novice player. This further adds credence to the statistical analysis for which the results were presented earlier. This clearly shows that the activities of the frontal and occipital regions are responsible for determining the expertise level in video game play. The frontal lobe is involved in cognitive aspects and decision making. The major portion of the occipital lobe deals with visual functions. The features mentioned in Equation (2)–Equation (14) are used for the selected channels, which are then used to train the set of classifiers as is done for the fourteen channels.
The brain maps are also visualized for the expert and novice player during the resting state. The results are shown in Figure 7. During resting periods, players were instructed to relax, and no mental task was performed. The baseline EEG is recorded with eyes open, and the brain maps show the corresponding activity on the frontal and occipital regions.
3.3. Performance Analysis
The performance of these algorithms is evaluated using different performance metrics for both cases, i.e., by using data from all fourteen EEG electrodes and those selected channels that give higher activity. The performance parameters include classification accuracy, computation time, kappa statistic, precision, recall and area under the curve (AUC) of the receiving operator characteristic (ROC) curve. Cohen’s kappa statistic is used to measure the inter-observer agreement and has a value that ranges between zero and one. A value close to zero represents agreement by chance, and a value closer or equal to one represents near perfect or perfect agreement. For a classification task, precision is defined as,
where and represent the true positive and false positive values, respectively. The recall value is calculated as,
where represents the false negative values. The AUC of the ROC curve represents the classification performance of a classifier. A value closer to one shows that the classifier has a good performance.
The results are presented in Table 2 and show an accuracy of for the naive Bayes classification when data from all fourteen available channels are used. Moreover, the naive Bayes algorithm classified the data in seconds. The kappa statistic of is achieved by both the SVM and MLP, which is greater than the naive Bayes classifier. On the other hand, MLP takes the longest time to build when the fourteen channel data are used. Table 2 also shows the results for the selected performance parameters when four significant channels are selected. It is evident that the performance parameters of the four-channel classification have a slight difference as compared to the fourteen-channel case. In particular, the classification accuracy improves for SVM and MLP and is slightly reduced for naive Bayes. The time taken for all algorithms is now reduced to acceptable levels for real-time applications except for MLP, which is still comparatively higher. SVM gives the best classification accuracy of with a classification time of s with four channels. This shows that by selecting the significant channels, both SVM and naive Bayes can be reliably used for player classification in less time.
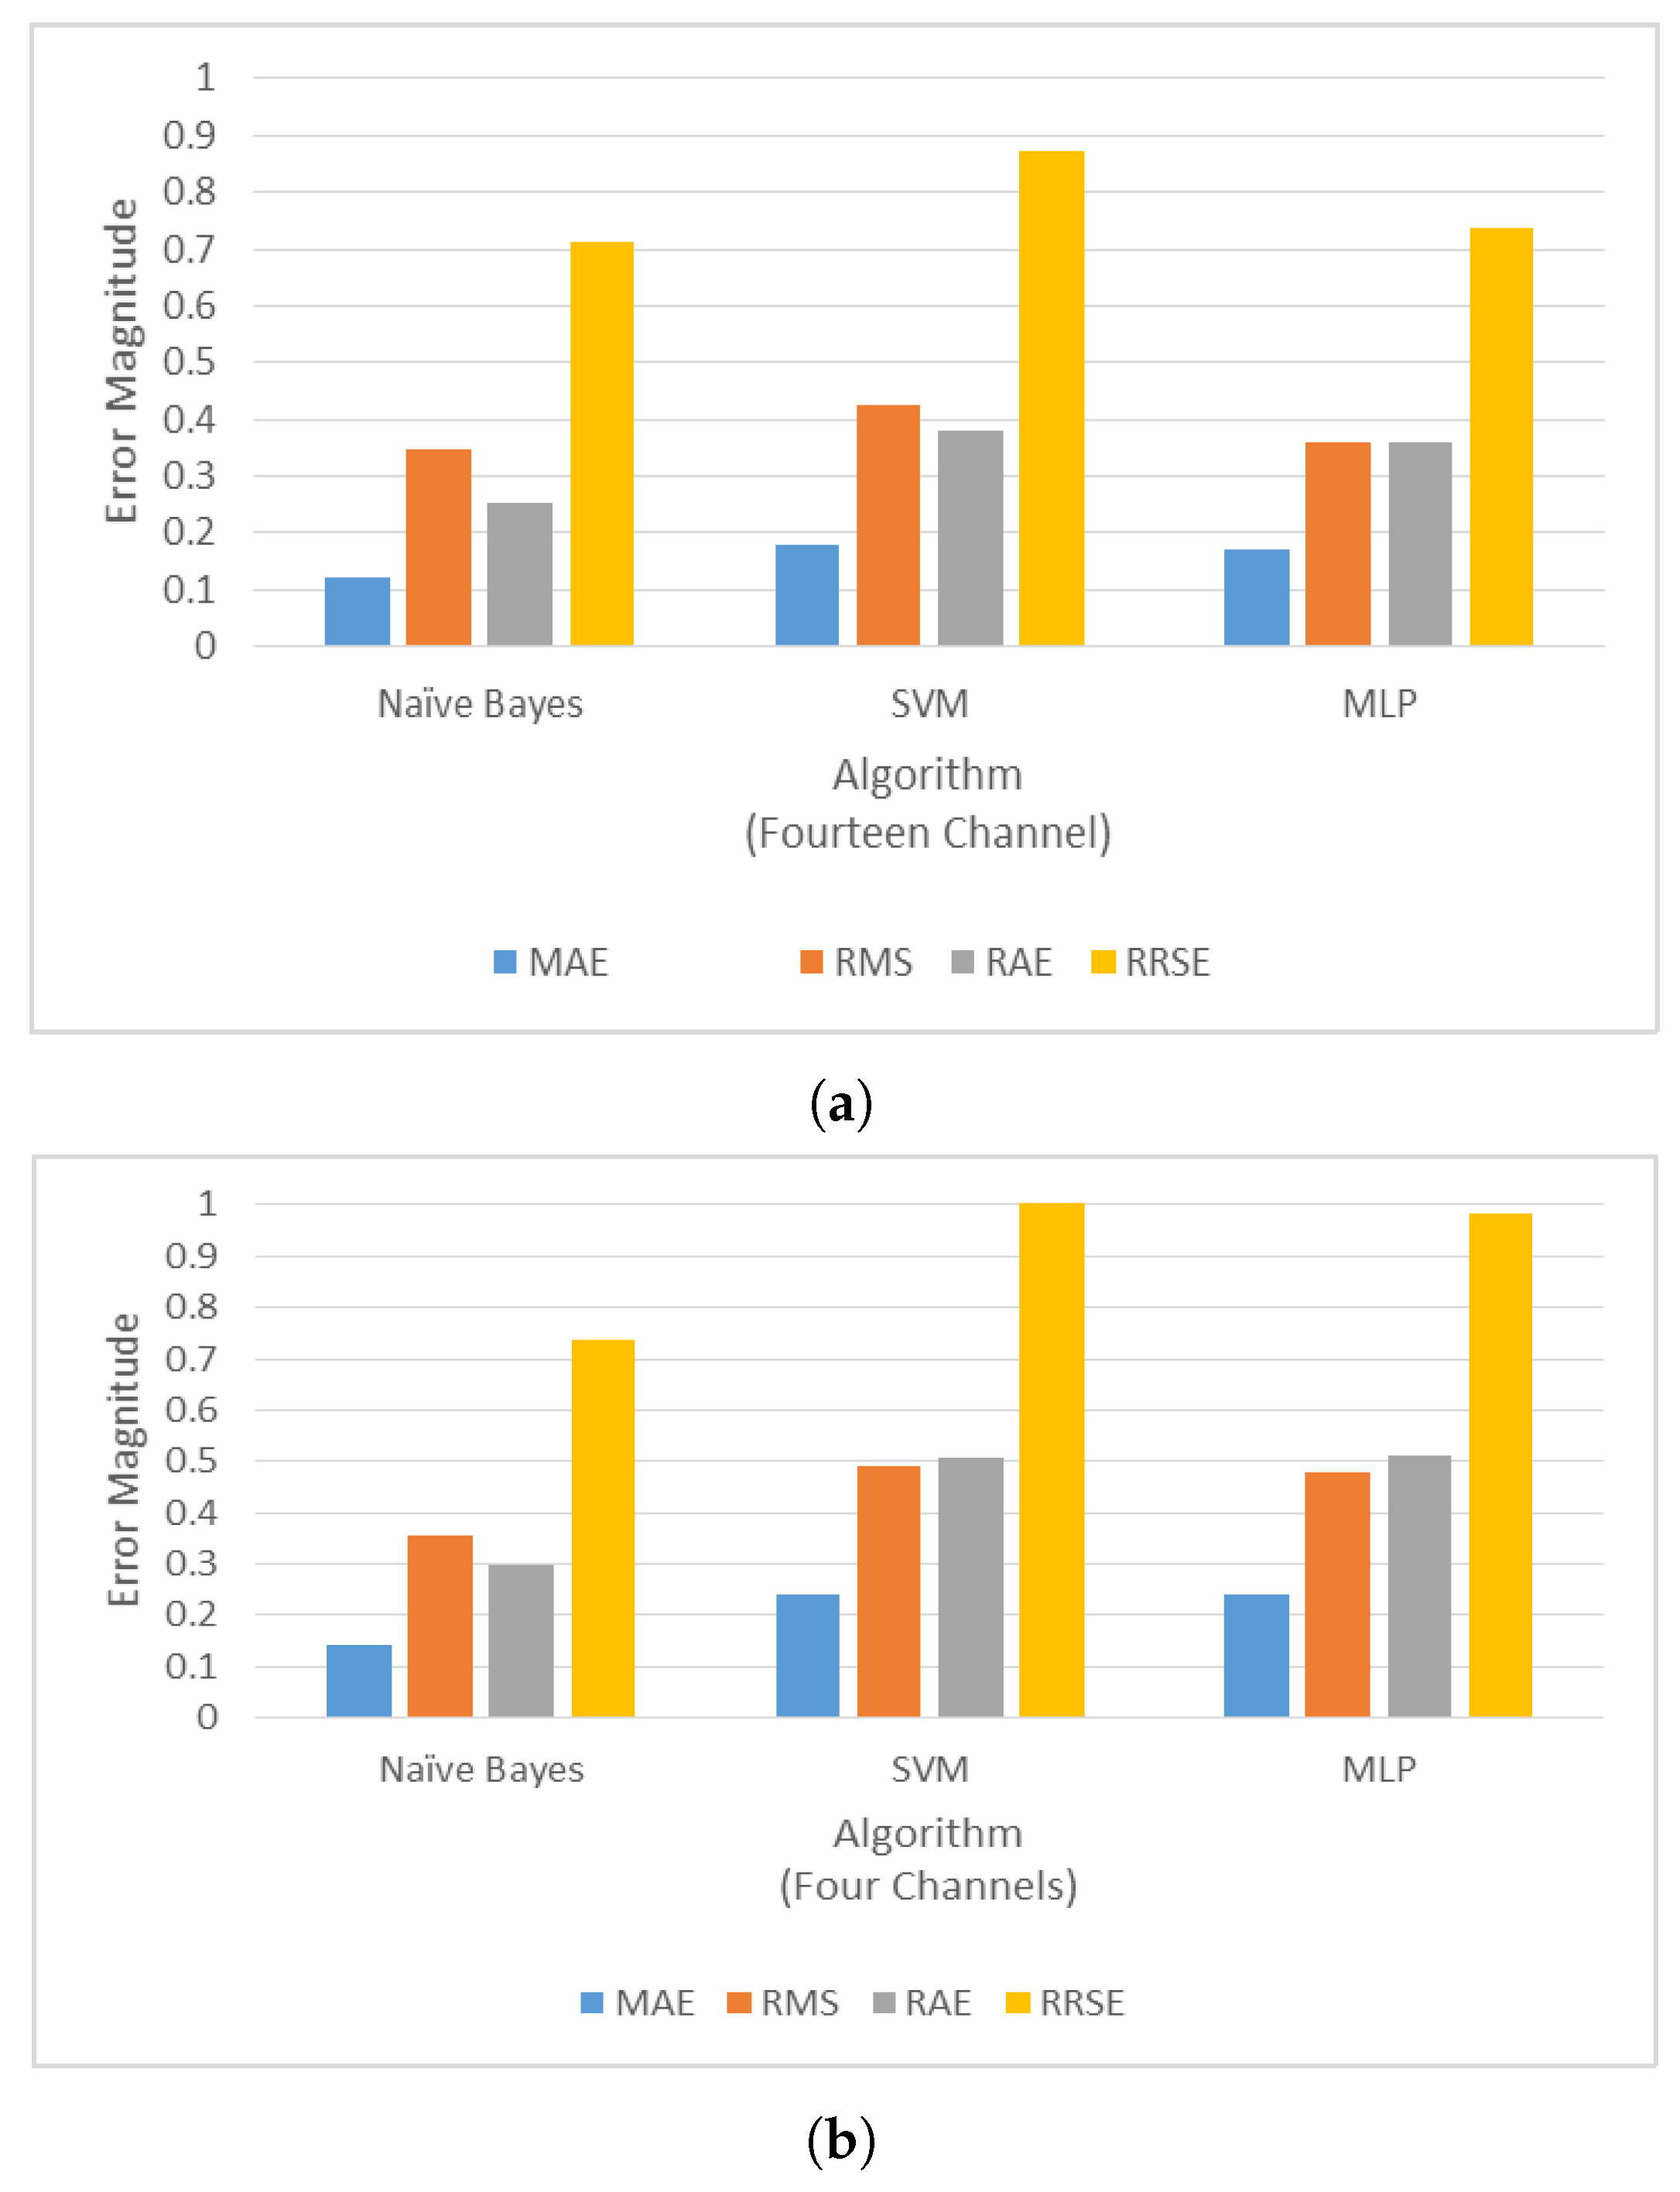
Figure 8 shows the performance of the algorithms used in terms of mean absolute error (MAE), root mean squared error (RMSE), relative absolute error (RAE) and root relative squared error (RRSE) using fourteen and four channels. The MAE is calculated using,
where n is the number of observations and and are the observed and actual values, respectively. The RMSE is calculated using,
The RAE is calculated using,
where is the mean of . The value of RRSE is calculated using,
It is clear from Figure 8a that the naive Bayes classifier gives the minimum error magnitude for all the error measuring parameters as compared to other classifying algorithms. Figure 8b shows the error performance of the algorithms used in four-channel classification. It can be observed that error performance in the case of fourteen channels is slightly better, but in the four-channel case, the computational cost has been reduced. Feature vector reduction has resulted in the reduction of the time taken by each classifier. Moreover, there is not much difference in terms of the kappa statistic.
4. Conclusions
The expertise level of a game player on a consumer-based gaming device has been classified using EEG recordings, where the classification is based on the brain activity recorded using a wearable EEG device. Multiple classifiers are used to classify the player’s expertise level during game play on a smart phone, by extracting thirteen morphological features from the recorded EEG data. Among the classifiers, the naive Bayes algorithm has given the best error performance, as well as accuracy, computation time and kappa statistic for both fourteen- and four-channel classifications, although SVM also gave good accuracy and computation time for four-channel classification. These results show that the naive Bayes and SVM classifier have the potential to be used in gaming applications, which can suggest the player’s expertise level from EEG data recordings. On the basis of brain activity maps, four significantly active channels are identified for classification instead of all fourteen channels. A small difference is observed between the two cases in terms of performance and error parameters, whereas using four channels has reduced the computational cost. In combination with only a minor difference in the kappa statistic, we can say that the four-channel approach is a more suitable candidate with a good balance between performance and complexity. In future, we plan to predict the score of the mobile game player by recording his/her EEG activities and applying regression-based techniques. This can be applied to make mobile games more attractive for users and also used to assess the effectiveness of training a subject in educational applications and game analytics. The number of subjects will also be increased in future studies, and players will be analysed for multiple game genres.
Acknowledgments
We would like to thank all volunteers who participated in the study during the experimental data collection.
Author Contributions
Syed Muhammad Anwar and Sanay Muhammad Umar Saeed conceived of and designed the experiments. Syed Muhammad Anwar, Sanay Mhammad Umar Saeed and Muhammad Majid performed the experiments. Saeeda Usman, Sanay Muhammad Umar Saeed and Chaudhry Arshad Mehmood analysed the data. Syed Muhammad Anwar, Wei Liu and Muhammad Majid wrote the paper.
Conflicts of Interest
The authors declare no conflict of interest.
References
- Foehr, U.G.; Rideout, V.; Roberts, D.F. Generation M: Media in the Lives of 8–18 Year-Olds. 2005. Available online: https://kaiserfamilyfoundation.files.wordpress.com/2013/01/generation-m-media-in-the-lives-of-8-18-year-olds-report.pdf (accessed on 30 October 2017).
- Sourina, O.; Wortley, D.; Kim, S. Subconscious Learning via Games and Social Media; Springer: Singapore, Singapore, 2015. [Google Scholar]
- Cain, M.S.; Landau, A.N.; Shimamura, A.P. Action video game experience reduces the cost of switching tasks. Atten. Percept. Psychophys. 2012, 74, 641–647. [Google Scholar] [CrossRef] [PubMed]
- Irons, J.L.; Remington, R.W.; McLean, J.P. Not so fast: Rethinking the effects of action video games on attentional capacity. Aust. J. Psychol. 2011, 63, 224–231. [Google Scholar] [CrossRef]
- Abhishek, A.M.; Suma, H. Stress analysis of a computer game player using electroencephalogram. In Proceedings of the 2014 IEEE International Conference on Circuits, Communication, Control and Computing (I4C), Bangalore, India, 21–22 November 2014; pp. 25–28. [Google Scholar]
- Wu, C.H.; Tzeng, Y.L.; Huang, Y.M. Understanding the relationship between physiological signals and digital game-based learning outcome. J. Comput. Educ. 2014, 1, 81–97. [Google Scholar] [CrossRef]
- Anguera, J.A.; Boccanfuso, J.; Rintoul, J.L.; Al-Hashimi, O.; Faraji, F.; Janowich, J.; Kong, E.; Larraburo, Y.; Rolle, C.; Johnston, E.; et al. Video game training enhances cognitive control in older adults. Nature 2013, 501, 97–101. [Google Scholar] [CrossRef] [PubMed]
- Hisham, S.; Rahman, A.W.A. Lesson Learnt from an EEG-Based Experiment with ADHD Children in Malaysia. In Proceedings of the International Conference on Universal Access in Human-Computer Interaction, Toronto, ON, Canada, 17–22 July 2016; Springer: Berlin, Germany, 2016; pp. 73–81. [Google Scholar]
- Thomas, K.P.; Vinod, A.; Guan, C. Enhancement of attention and cognitive skills using EEG based neurofeedback game. In Proceedings of the 2013 6th IEEE International IEEE/EMBS Conference on Neural Engineering (NER), San Diego, CA, USA, 6–8 November 2013; pp. 21–24. [Google Scholar]
- Li, M.; Jiang, Q.; Tan, C.H.; Wei, K.K. Enhancing user-game engagement through software gaming elements. J. Manag. Inf. Syst. 2014, 30, 115–150. [Google Scholar] [CrossRef]
- Nijholt, A.; Bos, D.P.O.; Reuderink, B. Turning shortcomings into challenges: Brain–computer interfaces for games. Entertain. Comput. 2009, 1, 85–94. [Google Scholar] [CrossRef]
- Perez, S. U.S. Consumers Now Spend 5 Hours Per Day on Mobile Devices. 2017. Available online: https://techcrunch.com/2017/03/03/u-s-consumers-now-spend-5-hours-per-day-on-mobile-devices/ (accessed on 30 October 2017).
- Van de Laar, B.; Gürkök, H.; Bos, D.P.O.; Poel, M.; Nijholt, A. Experiencing BCI control in a popular computer game. IEEE Trans. Comput. Intell. AI Games 2013, 5, 176–184. [Google Scholar] [CrossRef]
- Salminen, M.; Ravaja, N. Oscillatory brain responses evoked by video game events: The case of Super Monkey Ball 2. CyberPsychol. Behav. 2007, 10, 330–338. [Google Scholar] [CrossRef] [PubMed]
- Sheikholeslami, C.; Yuan, H.; He, E.J.; Bai, X.; Yang, L.; He, B. A high resolution EEG study of dynamic brain activity during video game play. In Proceedings of the 29th IEEE EMBS 2007 Annual International Conference of the IEEE Engineering in Medicine and Biology Society, Lyon, France, 23–26 August 2007; pp. 2489–2491. [Google Scholar]
- Saeed, S.M.; Anwar, S.M.; Majid, M. Quantification of Human Stress using Commercially Available Single Channel EEG Headset. IEICE Trans. Inf. Syst. 2017, E100D. [Google Scholar] [CrossRef]
- Nacke, L. Affective Ludology: Scientific Measurement of User Experience in Interactive Entertainment. Ph.D. Thesis, Blekinge Institute of Technology, Karlskrona, Sweden, 2009. [Google Scholar]
- Wolpaw, J.R.; Birbaumer, N.; Heetderks, W.J.; McFarland, D.J.; Peckham, P.H.; Schalk, G.; Donchin, E.; Quatrano, L.A.; Robinson, C.J.; Vaughan, T.M.; et al. Brain-computer interface technology: A review of the first international meeting. IEEE Trans. Rehabil. Eng. 2000, 8, 164–173. [Google Scholar] [CrossRef] [PubMed]
- Derbali, L.; Frasson, C. Prediction of players motivational states using electrophysiological measures during serious game play. In Proceedings of the 2010 IEEE 10th International Conference on Advanced Learning Technologies (ICALT), Sousse, Tunisia, 5–7 July 2010; pp. 498–502. [Google Scholar]
- Loh, C.S.; Sheng, Y.; Li, I.H. Predicting expert–novice performance as serious games analytics with objective-oriented and navigational action sequences. Comput. Hum. Behav. 2015, 49, 147–155. [Google Scholar] [CrossRef]
- McMahan, T.; Parberry, I.; Parsons, T.D. Modality specific assessment of video game player’s experience using the Emotiv. Entertain. Comput. 2015, 7, 1–6. [Google Scholar] [CrossRef]
- Anwar, S.M.; Saeed, S.M.U.; Majid, M. Classification of Expert-Novice Level of Mobile Game Players Using Electroencephalography. In Proceedings of the 2016 International Conference on IEEE Frontiers of Information Technology (FIT), Islamabad, Pakistan, 19–21 December 2016; pp. 315–318. [Google Scholar]
- Bhatti, A.M.; Majid, M.; Anwar, S.M.; Khan, B. Human emotion recognition and analysis in response to audio music using brain signals. Comput. Hum. Behav. 2016, 65, 267–275. [Google Scholar] [CrossRef]
- Anwar, S.M.; Majid, M.; Haq, M.E.; Khan, B. Mapping brain activity using wearable eeg sensors for mobile applications. In Proceedings of the 2nd International Conference on Multimedia and Human-Computer Interaction, Prague, Czech Republic, 14–15 August 2014; Volume 1415. [Google Scholar]
- Zarkowski, P.; Shin, C.; Dang, T.; Russo, J.; Avery, D. EEG and the variance of motor evoked potential amplitude. Clin. EEG Neurosci. 2006, 37, 247–251. [Google Scholar] [CrossRef] [PubMed]
- Jung, T.P.; Makeig, S.; Humphries, C.; Lee, T.W.; Mckeown, M.J.; Iragui, V.; Sejnowski, T.J. Removing electroencephalographic artefacts by blind source separation. Psychophysiology 2000, 37, 163–178. [Google Scholar] [CrossRef] [PubMed]
- Delorme, A.; Makeig, S. EEGLAB: an open source toolbox for analysis of single-trial EEG dynamics including independent component analysis. J. Neurosci. Methods 2004, 134, 9–21. [Google Scholar] [CrossRef] [PubMed]
- Abootalebi, V.; Moradi, M.H.; Khalilzadeh, M.A. A new approach for EEG feature extraction in P300-based lie detection. Comput. Methods Programs Biomed. 2009, 94, 48–57. [Google Scholar] [CrossRef] [PubMed]
- Bashashati, A.; Fatourechi, M.; Ward, R.K.; Birch, G.E. A survey of signal processing algorithms in brain–computer interfaces based on electrical brain signals. J. Neural Eng. 2007, 4, R32. [Google Scholar] [CrossRef] [PubMed]
- Shenoy, P.; Rao, R.P. Dynamic Bayesian Networks for Brain-Computer Interfaces. In Proceedings of the 17th International Conference on Advances in neural information processing systems, Vancouver, BC, Canada, 2005; pp. 1265–1272. [Google Scholar]
- Lotte, F.; Congedo, M.; Lécuyer, A.; Lamarche, F.; Arnaldi, B. A review of classification algorithms for EEG-based brain–computer interfaces. J. Neural Eng. 2007, 4, R1. [Google Scholar] [CrossRef] [PubMed]
- Del R Millan, J.; Mouriño, J.; Franzé, M.; Cincotti, F.; Varsta, M.; Heikkonen, J.; Babiloni, F. A local neural classifier for the recognition of EEG patterns associated to mental tasks. IEEE Trans. Neural Netw. 2002, 13, 678–686. [Google Scholar] [CrossRef] [PubMed]
- Suykens, J.A.; Vandewalle, J. Least squares support vector machine classifiers. Neural Process. Lett. 1999, 9, 293–300. [Google Scholar] [CrossRef]
- Acharya, R.; Faust, O.; Kannathal, N.; Chua, T.; Laxminarayan, S. Non-linear analysis of EEG signals at various sleep stages. Comput. Methods Programs Biomed. 2005, 80, 37–45. [Google Scholar] [CrossRef] [PubMed]
- Thenmozhi, M. Forecasting stock index returns using neural networks. Delhi Bus. Rev. 2006, 7, 59–69. [Google Scholar]
Figure 1.
Block diagram of various processing steps used in this study for the purpose of expert-novice classification of game players on a consumer gaming machine using electroencephalography (EEG).
Figure 1.
Block diagram of various processing steps used in this study for the purpose of expert-novice classification of game players on a consumer gaming machine using electroencephalography (EEG).
Figure 2.
The 10–20 electrode positioning supported by EMOTIV [24].
Figure 2.
The 10–20 electrode positioning supported by EMOTIV [24].
Figure 3.
The experimental procedure used to record the data of game players.

Figure 4.
The average score of players and the threshold value for the players as novice or expert. The horizontal solid line shows the threshold value calculated using Equation (1).
Figure 4.
The average score of players and the threshold value for the players as novice or expert. The horizontal solid line shows the threshold value calculated using Equation (1).
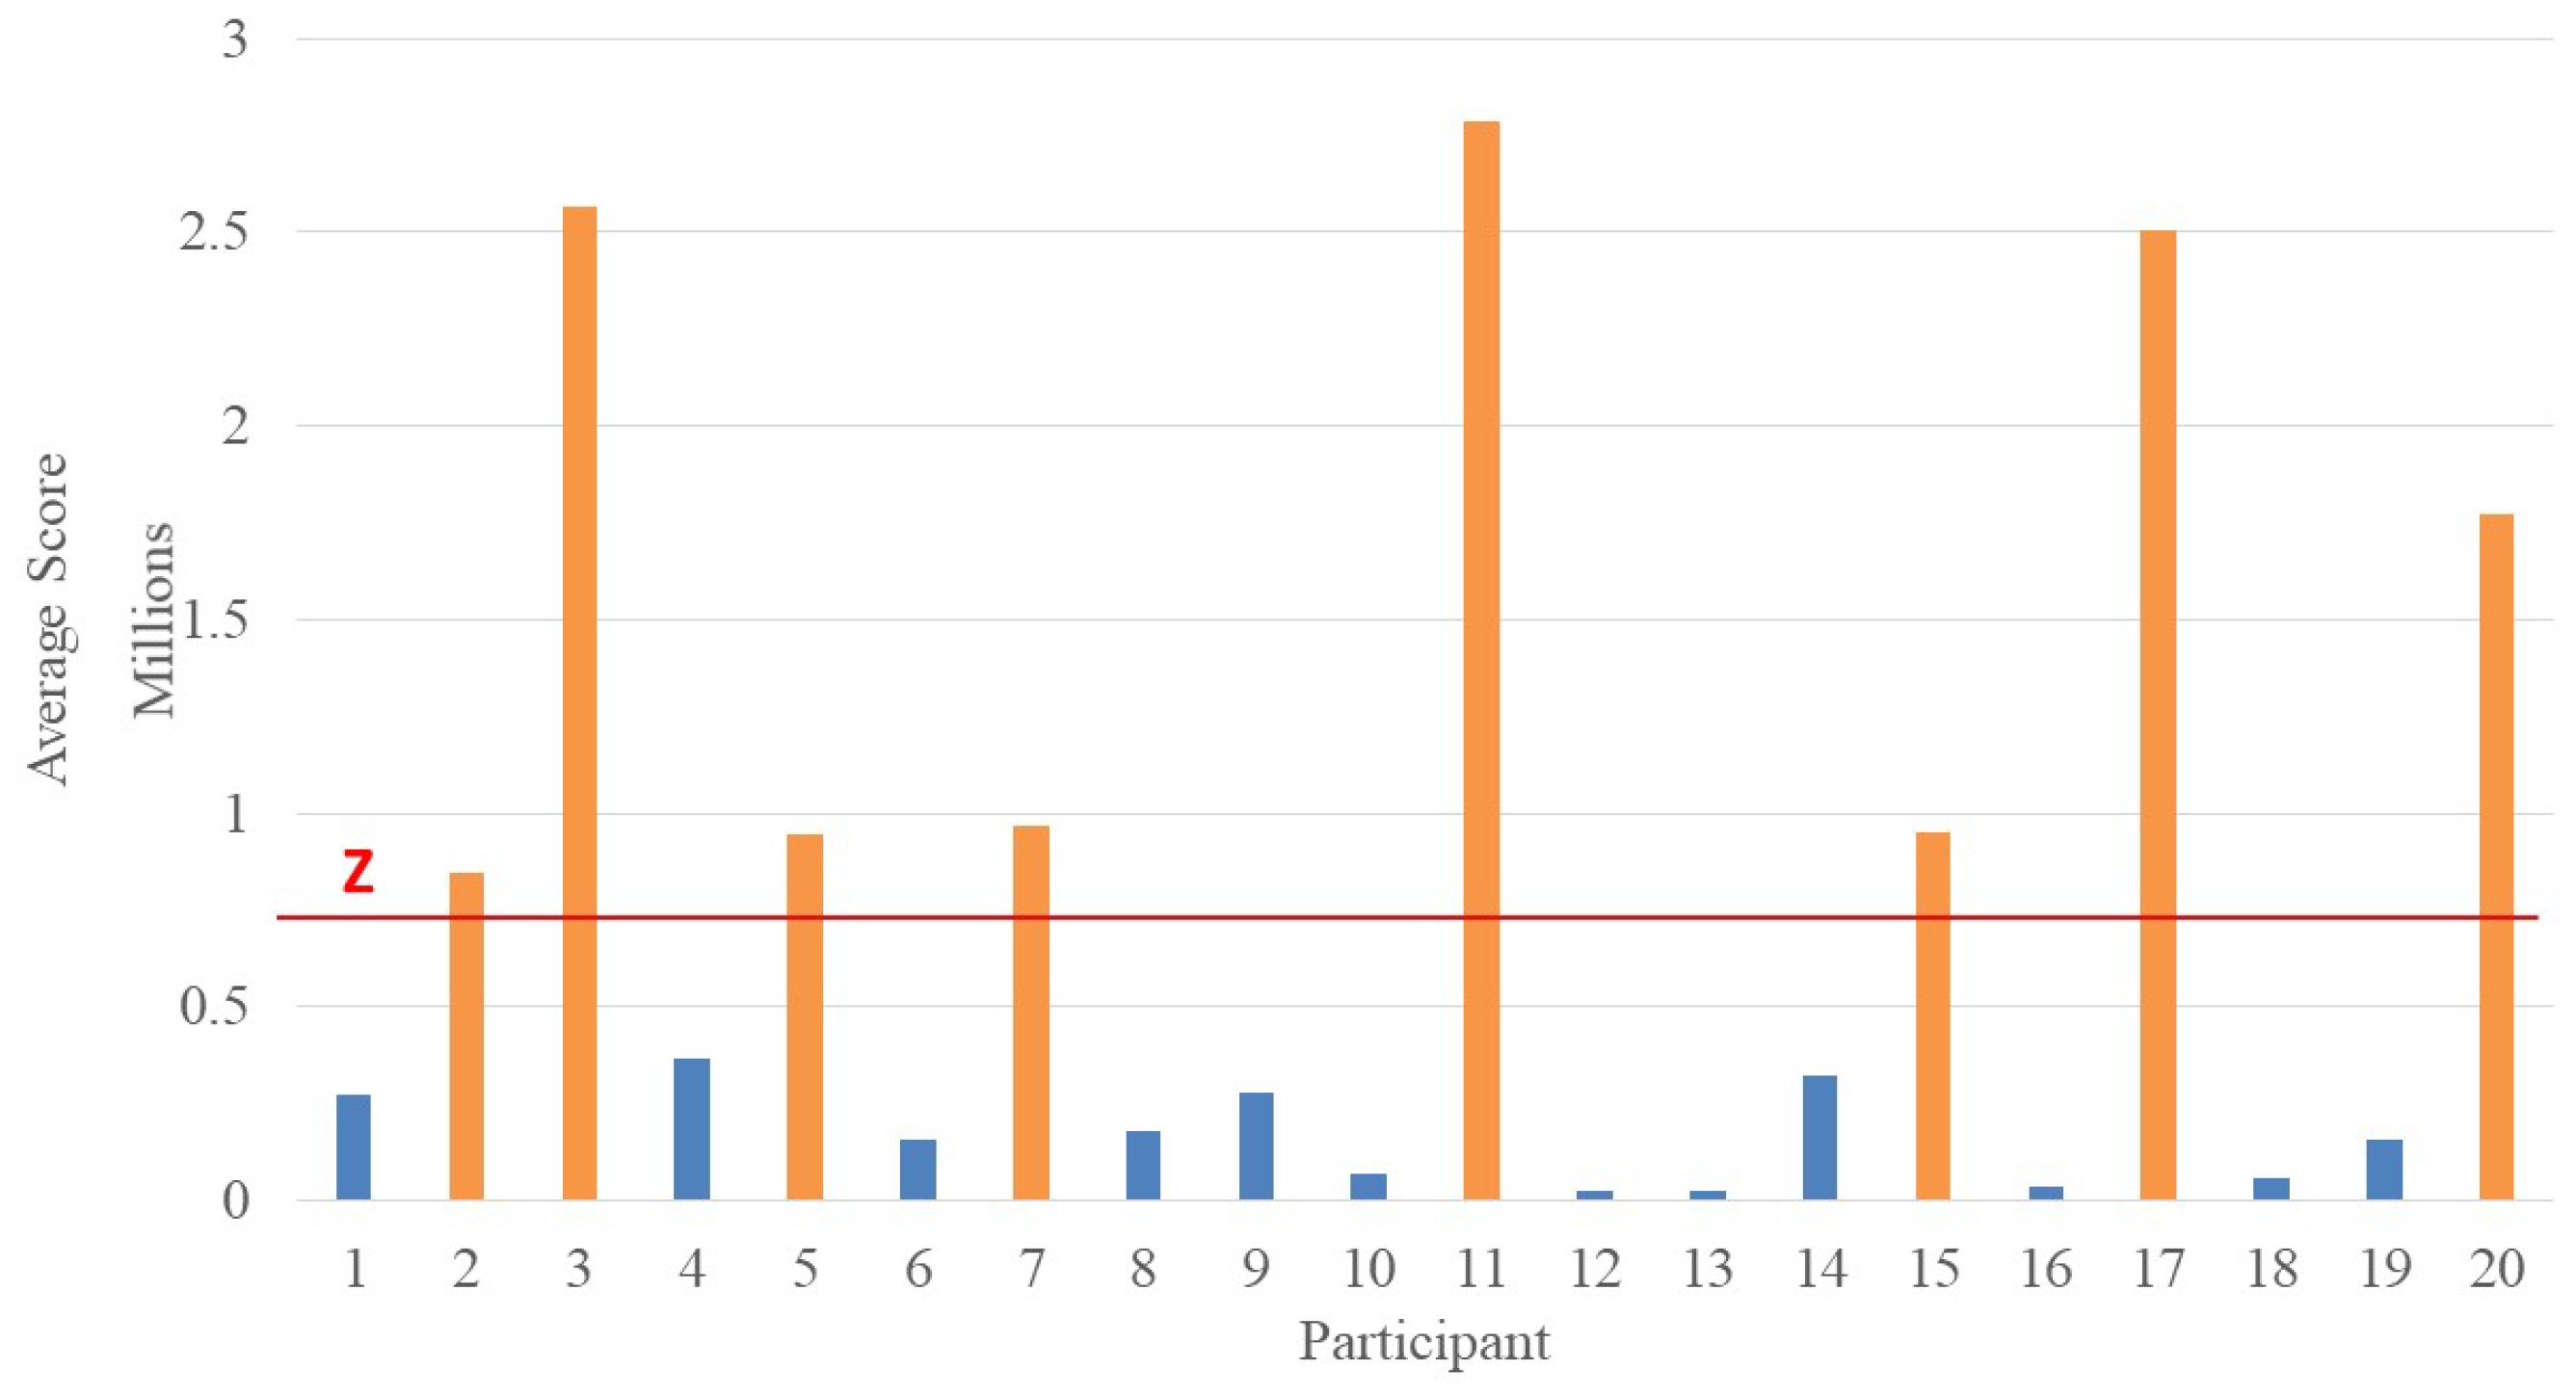
Figure 5.
Box-plot for the normalized power spectral densities of fourteen EEG channels for (a) expert players and (b) novice players. The + symbol represents the outliers; the rectangular box shows the region between the first and third quartile; and the red line shoes the median values.
Figure 5.
Box-plot for the normalized power spectral densities of fourteen EEG channels for (a) expert players and (b) novice players. The + symbol represents the outliers; the rectangular box shows the region between the first and third quartile; and the red line shoes the median values.
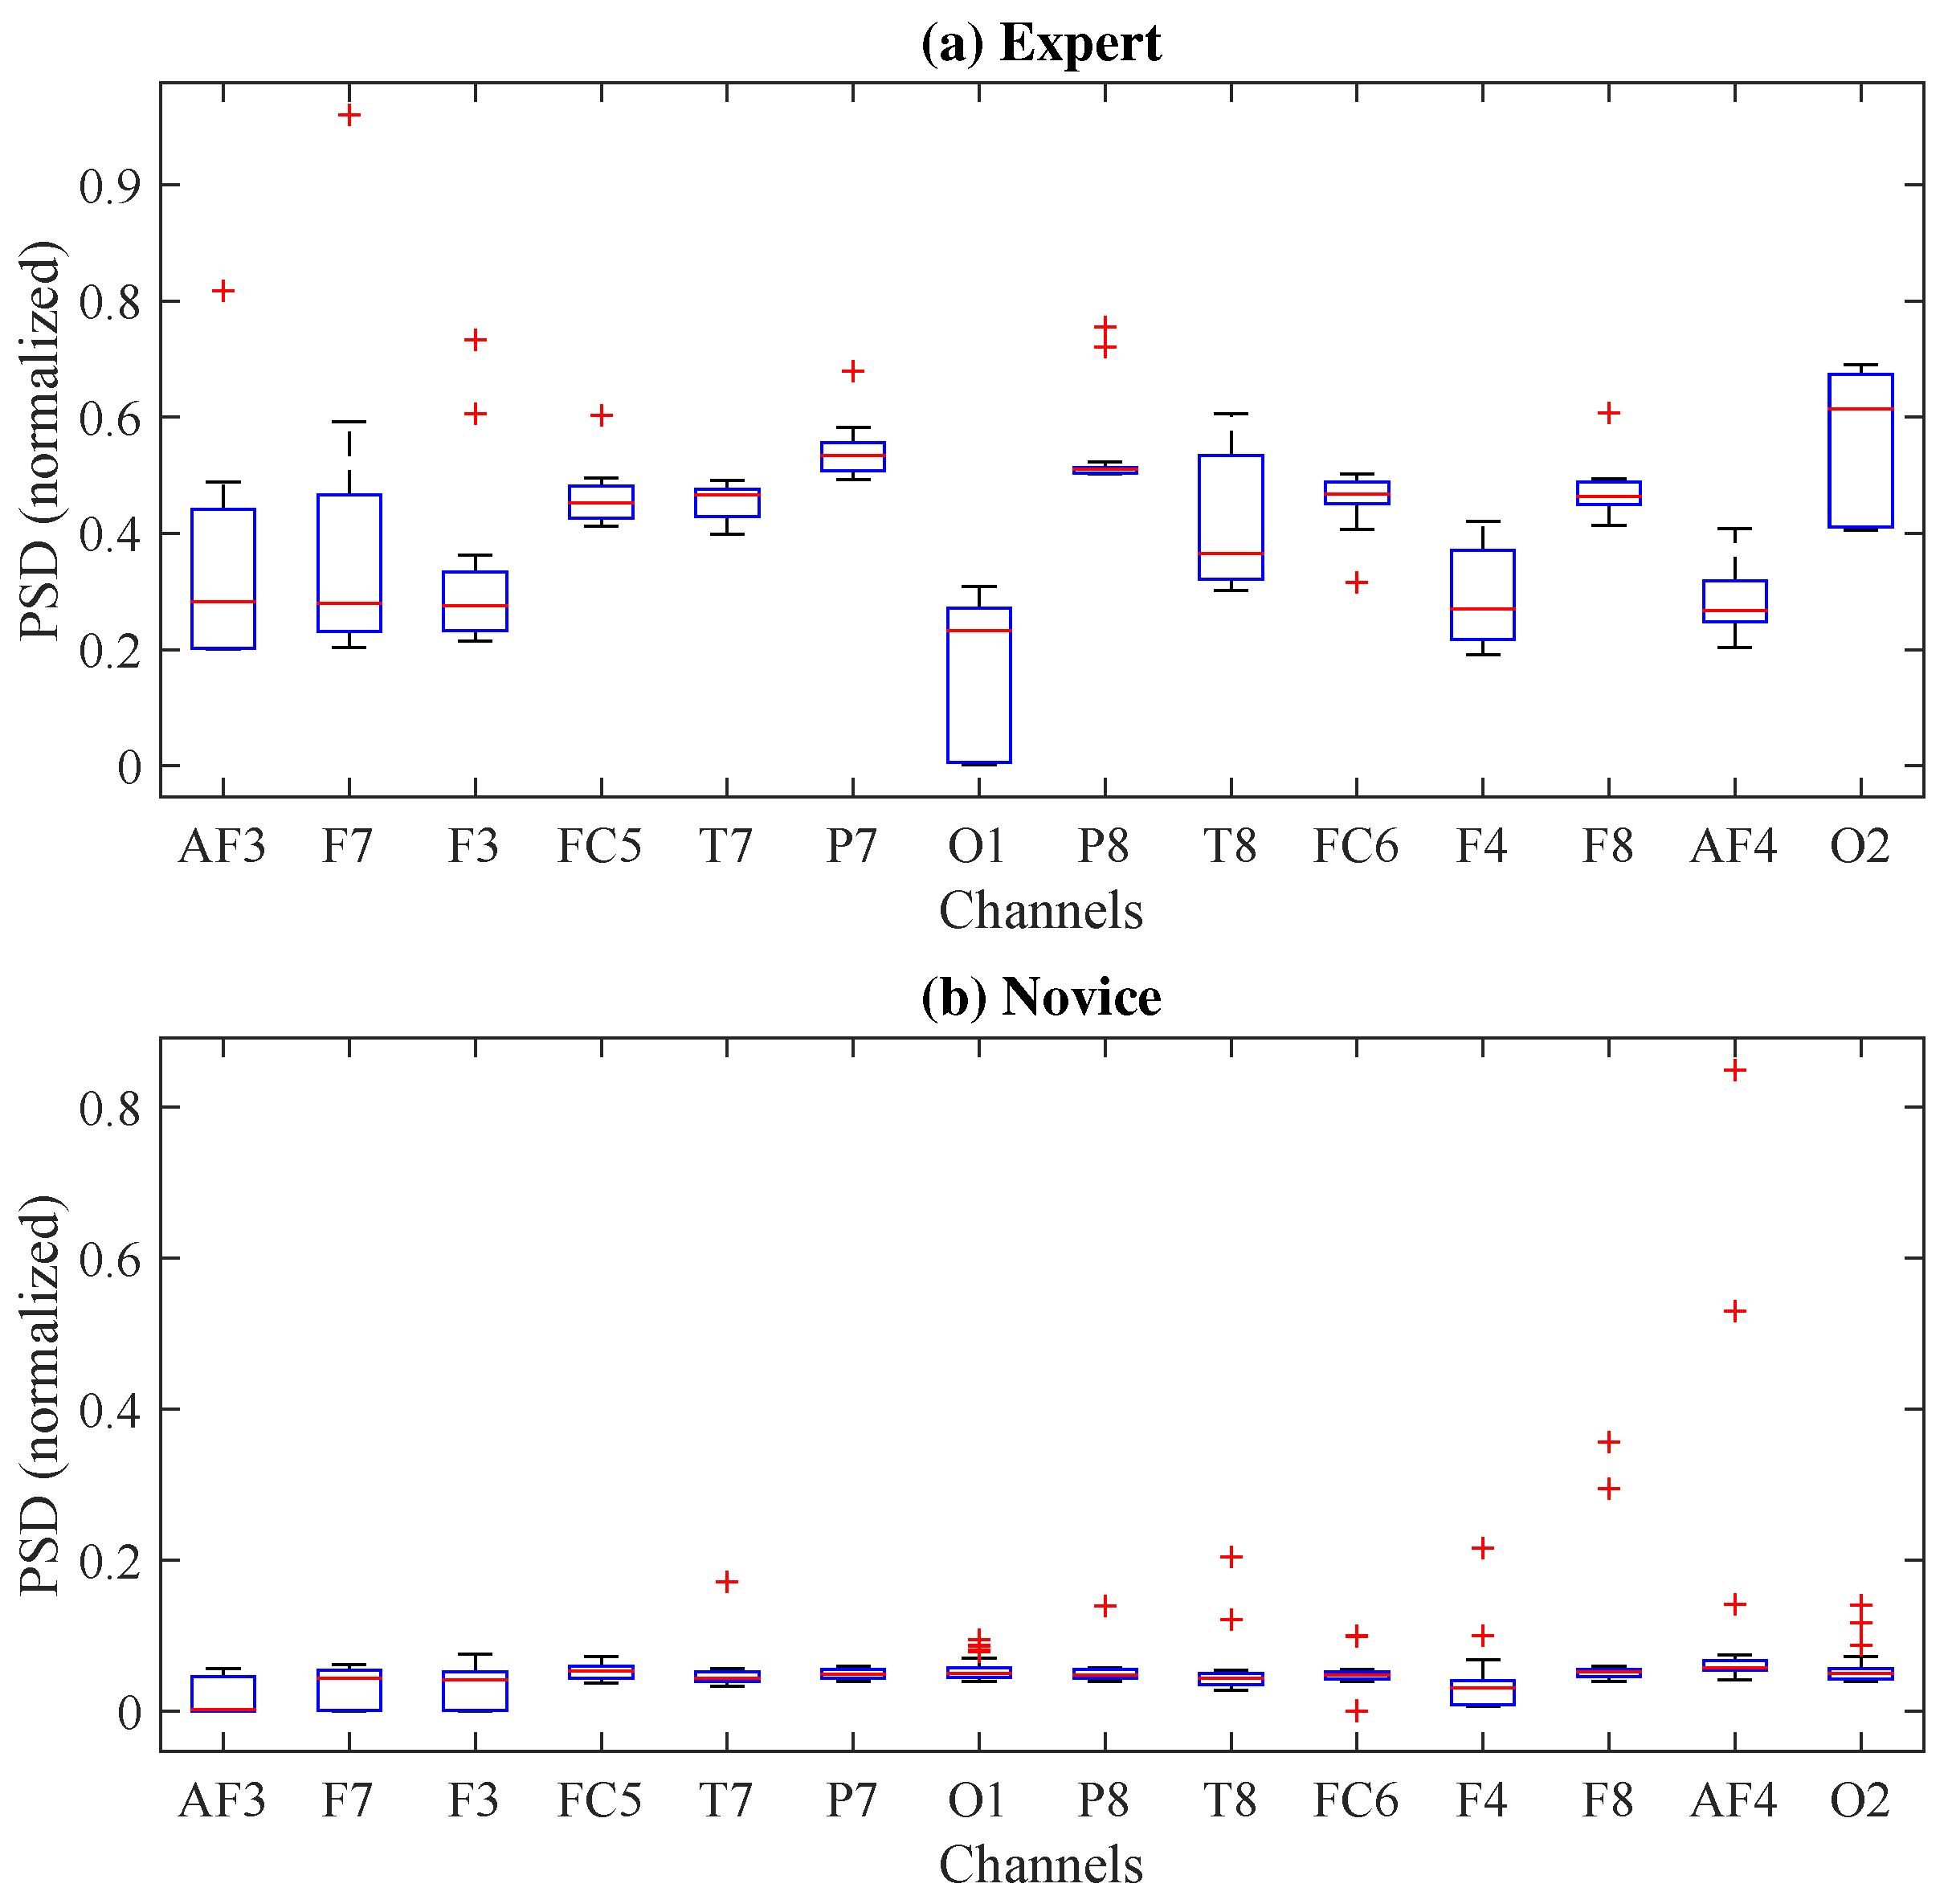
Figure 6.
Brain visualization using the average power spectral density for an expert and a novice player.
Figure 6.
Brain visualization using the average power spectral density for an expert and a novice player.
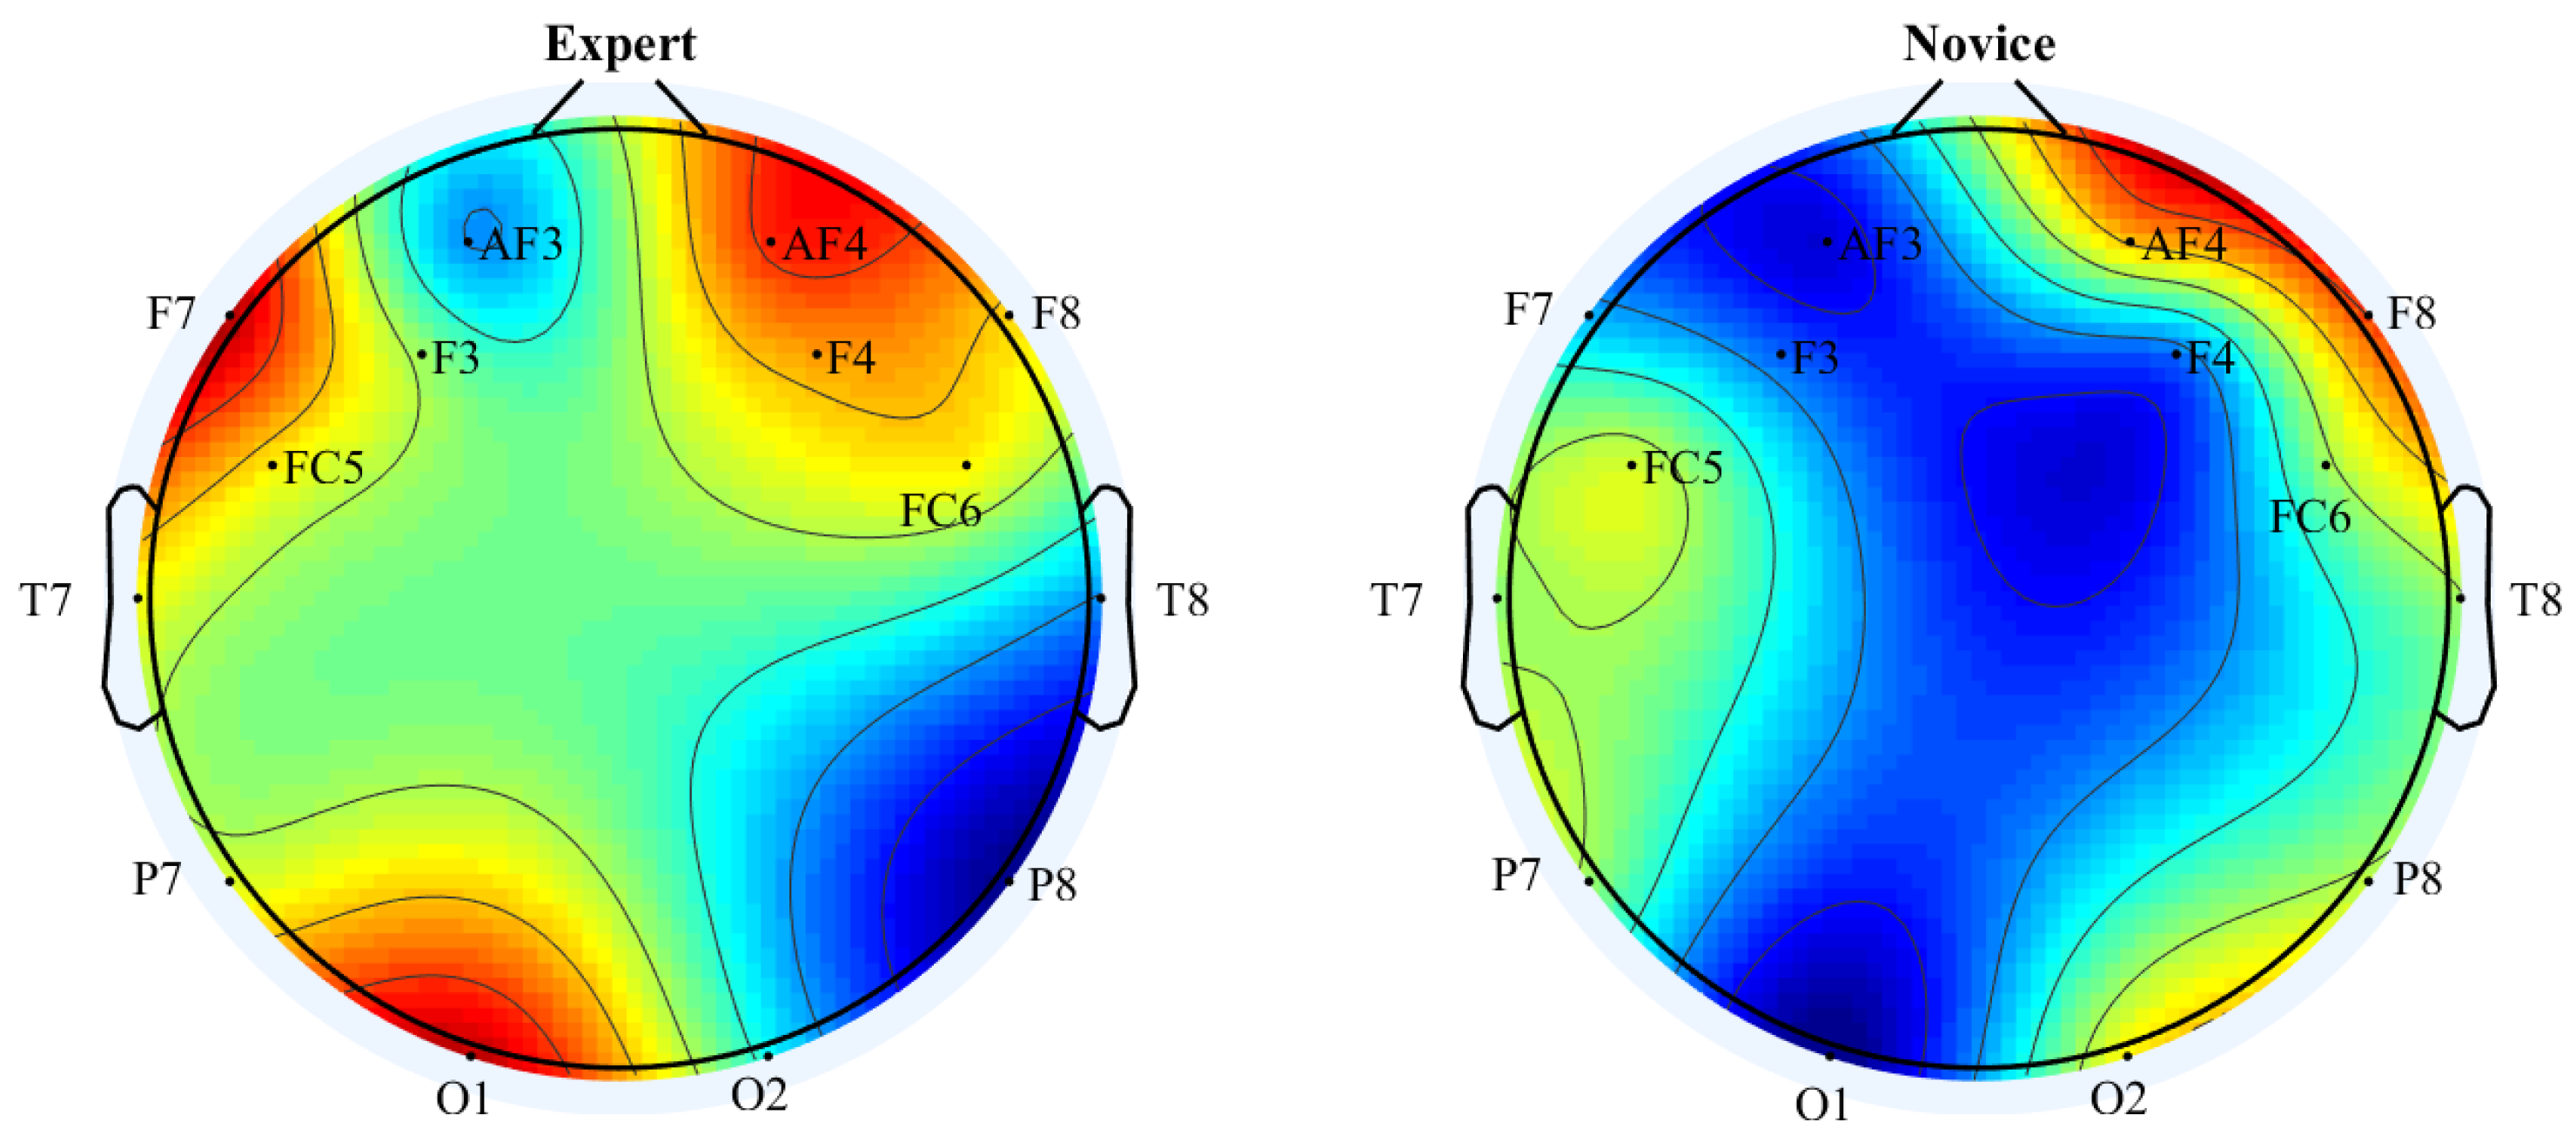
Figure 7.
Brain visualization for baseline activity using the average power spectral density for an expert and novice player.
Figure 7.
Brain visualization for baseline activity using the average power spectral density for an expert and novice player.
Figure 8.
Error magnitudes of different algorithms used: (a) fourteen channels; (b) four selected channels with higher activity.
Figure 8.
Error magnitudes of different algorithms used: (a) fourteen channels; (b) four selected channels with higher activity.


Table 1.
The time taken for different turns by all users involved in the study (times for T1, T2, T3, T4, T5, R1, R2, R3 and R4 are in minutes).
Table 1.
The time taken for different turns by all users involved in the study (times for T1, T2, T3, T4, T5, R1, R2, R3 and R4 are in minutes).
| Player | T1 | R1 | T2 | R2 | T3 | R3 | T4 | R4 | T5 | Total Time (Minutes) |
|---|---|---|---|---|---|---|---|---|---|---|
| 1 | 0.70 | 1 | 0.90 | 1 | 0.60 | 1 | 0.50 | 1 | 1.30 | 8 |
| 2 | 1.60 | 1 | 1.80 | 1 | 2.20 | 1 | 2.05 | 1 | 2.42 | 14.07 |
| 3 | 7.60 | 1 | 5.40 | 1 | 6.00 | 1 | 5.95 | 1 | 6.80 | 35.75 |
| 4 | 1.20 | 1 | 1.40 | 1 | 1.20 | 1 | 1.70 | 1 | 1.80 | 11.30 |
| 5 | 2.45 | 1 | 2.68 | 1 | 2.20 | 1 | 2.90 | 1 | 2.10 | 16.33 |
| 6 | 0.84 | 1 | 0.64 | 1 | 0.76 | 1 | 0.90 | 1 | 0.54 | 7.68 |
| 7 | 2.60 | 1 | 3.30 | 1 | 1.10 | 1 | 2.47 | 1 | 2.33 | 15.83 |
| 8 | 0.61 | 1 | 0.72 | 1 | 0.90 | 1 | 0.40 | 1 | 0.80 | 7.44 |
| 9 | 0.95 | 1 | 0.89 | 1 | 0.84 | 1 | 0.87 | 1 | 0.80 | 8.35 |
| 10 | 0.50 | 1 | 0.70 | 1 | 0.70 | 1 | 0.80 | 1 | 0.30 | 7.00 |
| 11 | 7.30 | 1 | 6.70 | 1 | 3.20 | 1 | 8.10 | 1 | 7.70 | 37.00 |
| 12 | 0.40 | 1 | 0.80 | 1 | 0.60 | 1 | 0.25 | 1 | 1.10 | 7.15 |
| 13 | 0.25 | 1 | 0.45 | 1 | 0.70 | 1 | 0.40 | 1 | 0.80 | 6.60 |
| 14 | 2.10 | 1 | 0.60 | 1 | 1.50 | 1 | 1.02 | 1 | 0.90 | 10.12 |
| 15 | 3.20 | 1 | 2.20 | 1 | 1.50 | 1 | 2.65 | 1 | 2.10 | 15.65 |
| 16 | 0.80 | 1 | 0.70 | 1 | 0.50 | 1 | 0.40 | 1 | 1.20 | 7.60 |
| 17 | 6.40 | 1 | 3.00 | 1 | 6.80 | 1 | 5.20 | 1 | 5.90 | 31.30 |
| 18 | 0.50 | 1 | 0.60 | 1 | 0.80 | 1 | 0.90 | 1 | 0.65 | 7.45 |
| 19 | 0.30 | 1 | 0.45 | 1 | 0.60 | 1 | 0.45 | 1 | 0.89 | 6.69 |
| 20 | 3.30 | 1 | 2.40 | 1 | 5.80 | 1 | 4.80 | 1 | 4.40 | 24.70 |
Table 2.
Performance parameters of classification algorithms using the four selected channels and all fourteen available channels.
Table 2.
Performance parameters of classification algorithms using the four selected channels and all fourteen available channels.
| Number of Channels | Classification Algorithm | Correctly Classified | Incorrectly Classified | Time Taken (s) | kappa Statistics | Precision | Recall | ROC |
|---|---|---|---|---|---|---|---|---|
| 4 channels | Naive Bayes | 84 | 16 | |||||
| SVM | 86 | 14 | ||||||
| MLP | 84 | 16 | ||||||
| 14- channels | Naive Bayes | 88 | 12 | |||||
| SVM | 82 | 18 | ||||||
| MLP | 82 | 18 |
© 2017 by the authors. Licensee MDPI, Basel, Switzerland. This article is an open access article distributed under the terms and conditions of the Creative Commons Attribution (CC BY) license (http://creativecommons.org/licenses/by/4.0/).
Share and Cite
MDPI and ACS Style
Anwar, S.M.; Saeed, S.M.U.; Majid, M.; Usman, S.; Mehmood, C.A.; Liu, W. A Game Player Expertise Level Classification System Using Electroencephalography (EEG). Appl. Sci. 2018, 8, 18. https://doi.org/10.3390/app8010018
AMA Style
Anwar SM, Saeed SMU, Majid M, Usman S, Mehmood CA, Liu W. A Game Player Expertise Level Classification System Using Electroencephalography (EEG). Applied Sciences. 2018; 8(1):18. https://doi.org/10.3390/app8010018
Chicago/Turabian StyleAnwar, Syed Muhammad, Sanay Muhammad Umar Saeed, Muhammad Majid, Saeeda Usman, Chaudhry Arshad Mehmood, and Wei Liu. 2018. "A Game Player Expertise Level Classification System Using Electroencephalography (EEG)" Applied Sciences 8, no. 1: 18. https://doi.org/10.3390/app8010018
Note that from the first issue of 2016, this journal uses article numbers instead of page numbers. See further details here.