Precision Irrigation System (PIS) Using Sensor Network Technology Integrated with IOS/Android Application
by
 ,
,
Mehmet Fatih Işık
1,* ,
,
Yusuf Sönmez
2,
Cemal Yılmaz
3,
Veysel Özdemir
4 and
Ercan Nurcan Yılmaz
3 1
Electric-Electronics Engineering, Hitit University Faculty of Engineering, Çorum 19030, Turkey
2
Electrical Department, Technical Sciences Vocational College, Gazi University, Ankara 06560, Turkey
3
Department of Electrical Engineering, Technology Faculty, Gazi University, Ankara 06560, Turkey
4
Department of Industrial Design Engineering, Technology Faculty, Gazi University, Ankara 06560, Turkey
*
Author to whom correspondence should be addressed.
Appl. Sci. 2017, 7(9), 891; https://doi.org/10.3390/app7090891
Submission received: 18 July 2017
/
Revised: 22 August 2017
/
Accepted: 25 August 2017
/
Published: 1 September 2017
Abstract
:One of the most important factors for successful agricultural production is the irrigation system in place. In this study, a precision irrigation system, which takes advantage of the various phases of plant growth, was developed and implemented using the sensor network technology integrated with IOS/Android. The amount of water in the soil was measured via sensors that were placed on certain points of the area to be irrigated. These sensors were placed near the root of the product. Data from sensors was transmitted via Wi-Fi in real-time to a mobile phone based on IOS/Android. In the light of obtained data, the seasonal precision irrigation system was created depending on the amount of water required by the plants at each stage of their growth stage. The required energy of the system was provided by solar energy. The system can be controlled by smart phones, which increases the usability of the system. When design performance was analyzed, it was observed that some important advantages such as obtaining high efficiency with water, time and energy saving and reducing the workforce were ensured. Five separate laterals were used for the irrigation system. There were valves on each lateral, which realized the opening and closing process depending on the water need. A total of 16 humidity sensors were used in the irrigation system and the data from these sensors was transferred to the IOS/Android server via the programmable controller (PLC). The basic electrical equipment in the irrigation system was monitored and controlled via mobile devices. Control parameters were obtained by comparing the real values and reference values by a closed-loop system and determine the new working status of the irrigation system.
1. Introduction
Turkey is an agricultural country. Turkey and many similarly agricultural countries have great problems in the irrigation process due to a scarcity of water resources. Although major changes and improvements have been seen in Turkey’s agricultural policies, the overconsumption of water resources exacerbates the problem. The export situation resulting from the plants grown and influencing the quality directly reveals the importance of water consumption [1]. The agriculture in Turkey needs more assistance for farms and farmers, more advanced research in recent available agricultural technologies, more automation, and more testing and applying new methods of study, analysis, and mechanization.
The soil moisture sensor measures the amount of moisture in the soil. The measurement is done by immersing probes on the sensor. The depth of measurement may vary depending on the plant species. This means that the probes are close to the root of the plant. The working principle of the soil moisture sensors is that there is a voltage difference between the tips of the probes due to the resistance of the soil. Increasing the amount of moisture (wetness) in the ground increases its conductivity. Thus, the amount of moisture is measured according to the magnitude of the voltage difference.
The requests to use information technology to a larger extent in irrigation systems are increasing by the day. Many technological methods are used in irrigation systems [2,3,4,5,6]. When these methods are considered, using smart phones and tablets has become widespread. Becoming a small computer system, wireless and portable structure, operating fast and having the wide memory capacity are important factors to spread the use of these devices. These factors make the use of mobile devices attractive for many applications such as environmental controls, health service monitoring, security, transportation and automation [7,8,9,10,11,12,13,14,15,16,17,18,19,20,21,22,23,24,25].
This paper studies the application of Precision Irrigation (PI) using sensor network technology (SNT), which emerged as a management practice with the potential to increase profits by utilizing more precise information about agricultural resources through sensing and communication technology in Turkey and takes the crops as a specific example for investigating a possible PI solution using Sensor Network Technology (SNT) integrated with IOS/Android application.
The application is an automated agricultural irrigation system, which is controlled on mobile devices based on IOS/Android and is capable of monitoring the irrigation levels. The mobile device software was defined as agRapp. The system measures the water quantity of the soil via sensors placed at different points near the roots of products and transmits the data via PLC to mobile devices. Thus, the operating status of the irrigation system is defined according to the water level inside the soil.
The most important property of this study, which differentiates it from previous studies, is defining the required water level by product depending on growth stages. Initially, during crop development, mid-season and late season stages, the system defines the required water level through developed software. Moreover, alternative energy resources are used to meet the required energy level. It has already been known that solar power reduces the energy cost [26,27,28,29,30,31,32], therefore solar power was used in this study.
Today, using water efficiently in agricultural irrigation systems is very important. Although this situation may lead to the development of different irrigation systems, it is still necessary to increase the efficiency. For this reason, the development of an irrigation system that takes into consideration the periodic water needs of the plants as well as the water condition of the soil gains great importance. In addition, the plant’s water need should be monitored continuously, not instantaneously. In this study, an automatic irrigation system was developed which can be monitored and controlled via mobile devices. In this system, in addition to the seasonal water needs of plants, irrigation is carried out by taking into account the continuous values taken from the humidity sensors.
2. Irrigation System
The amount of water that needs to be used should be calculated as accurately as possible in order to make irrigation projects more effective. Essential for calculating the irrigation water requirement is knowledge of evapotranspiration [33,34]. The storage and capacity of the system transmission structure are projected and constructed according to this knowledge. The healthy way for calculating of evapotranspiration is to use one of the direct measurement methods. However, researchers have developed analytical equations that can be used to estimate the evapotranspiration due to the high cost and time demands of the direct measurement method.
The United Nations Food and Agriculture Organization (FAO) recommends the Penman Monteith method to determine the crop water requirement for assisting the sizing of the irrigation projects in developing countries. It is aimed to calculate the healthy evapotranspiration with the crop coefficient (kc) determined by the climate and soil data of the irrigation area. The reference evapotranspiration (ETo) has been used, and required climate data has been obtained from the website of the Turkish State Meteorological Service (www.mgm.gov.tr) in order to use the FAO Penman Monteith method [33].
Here, ETo: Reference evapotranspiration (mm day−1), Rn: Net radiation (MJ m−2 day−1), G: Soil temperature flux density (MJ m−2 day−1), T: The average daily air temperature (°C), u2: 2 m height wind speed (m s−1), es: Saturated vapor pressure (kPa), ea: Actual steam pressure (kPa), Δ: The slope of the vapor pressure curve (kPa/°C−1), γ: Psychometric constant (kPa).
Climate data obtained from the meteorological station 17084 belongs to Çorum/Center and is shown in Table 1 and Table 2. This data is used to define the water requirement necessary for crops to be grown.
The reference plant is walnut for FAO Penman Monteith method. Evapotranspiration values for walnut have been calculated as follows [33,34];
Etc = kc × ETo
The kc value varies from plant to plant and refers to the plant’s water needs. The characteristics that determine the value of kc are plant species, height, growth phases, light reflectance value of the soil, and plant surfaces, climate and soil. In addition, while each plant’s kc values vary, the kc value in each phase of a plant’s growth process varies. Seasonal kc values obtained for walnuts are shown in Figure 1. As seen in Figure 1, if the planned date is chosen as 11 April, the product is harvested approximately 173 days later.
Determination of seasonal plant water needs as well as physical properties of the soil in the cultivated areas are important. The values of soil type Red Sandy determined as a working area in this study are given in Figure 2.
Obtained climate data and the value of crop water requirements, depending on seasonal development and land property, are shown in Table 3. According to Table 3, the total water demand in the process of growing the product has been identified as 197 mm/dec. The cultivated plant is an adult walnut tree. The seasonal irrigation information of the walnut is shown in Figure 1. According to Figure 1, the product irrigation was started on 11 April 2016 and the harvest was done on 30 September 2016. Figure 3 shows the need for seasonal water of walnut.
3. System Architecture
The experiment was conducted in the walnut land with 600 m2 in Çorum. Water that was transferred from the well to the water tank with 5000 L by the booster was connected to irrigation laterals via a filter. Valves that were positioned in front of each lateral were the basis of the control field. Energy requirements of the system were met when the solar panels had 2.2 kW total power. The block diagram of the irrigation control system is presented in Figure 3. According to Figure 3, moisture values obtained from the sensors were transferred to the PLC via input components. This data received from the PLC was transferred to the smart phone via the IOS/Andriod server for monitoring and control purposes. In the system operation, the current water requirement of the plant was determined depending on the seasonal water requirement in previous years. If the water ratio is less than necessary, the water tank was operated via the PLC output, ensuring that the valves remain open until the desired amount of water is supplied. When the data from the sensors indicated that the required amount of water was reached, irrigation automatically ended. If the amount of water was excessive due to rainfall or other reasons, irrigation was not carried out. All numerical values of the above-mentioned operations can also be monitored via the mobile device.
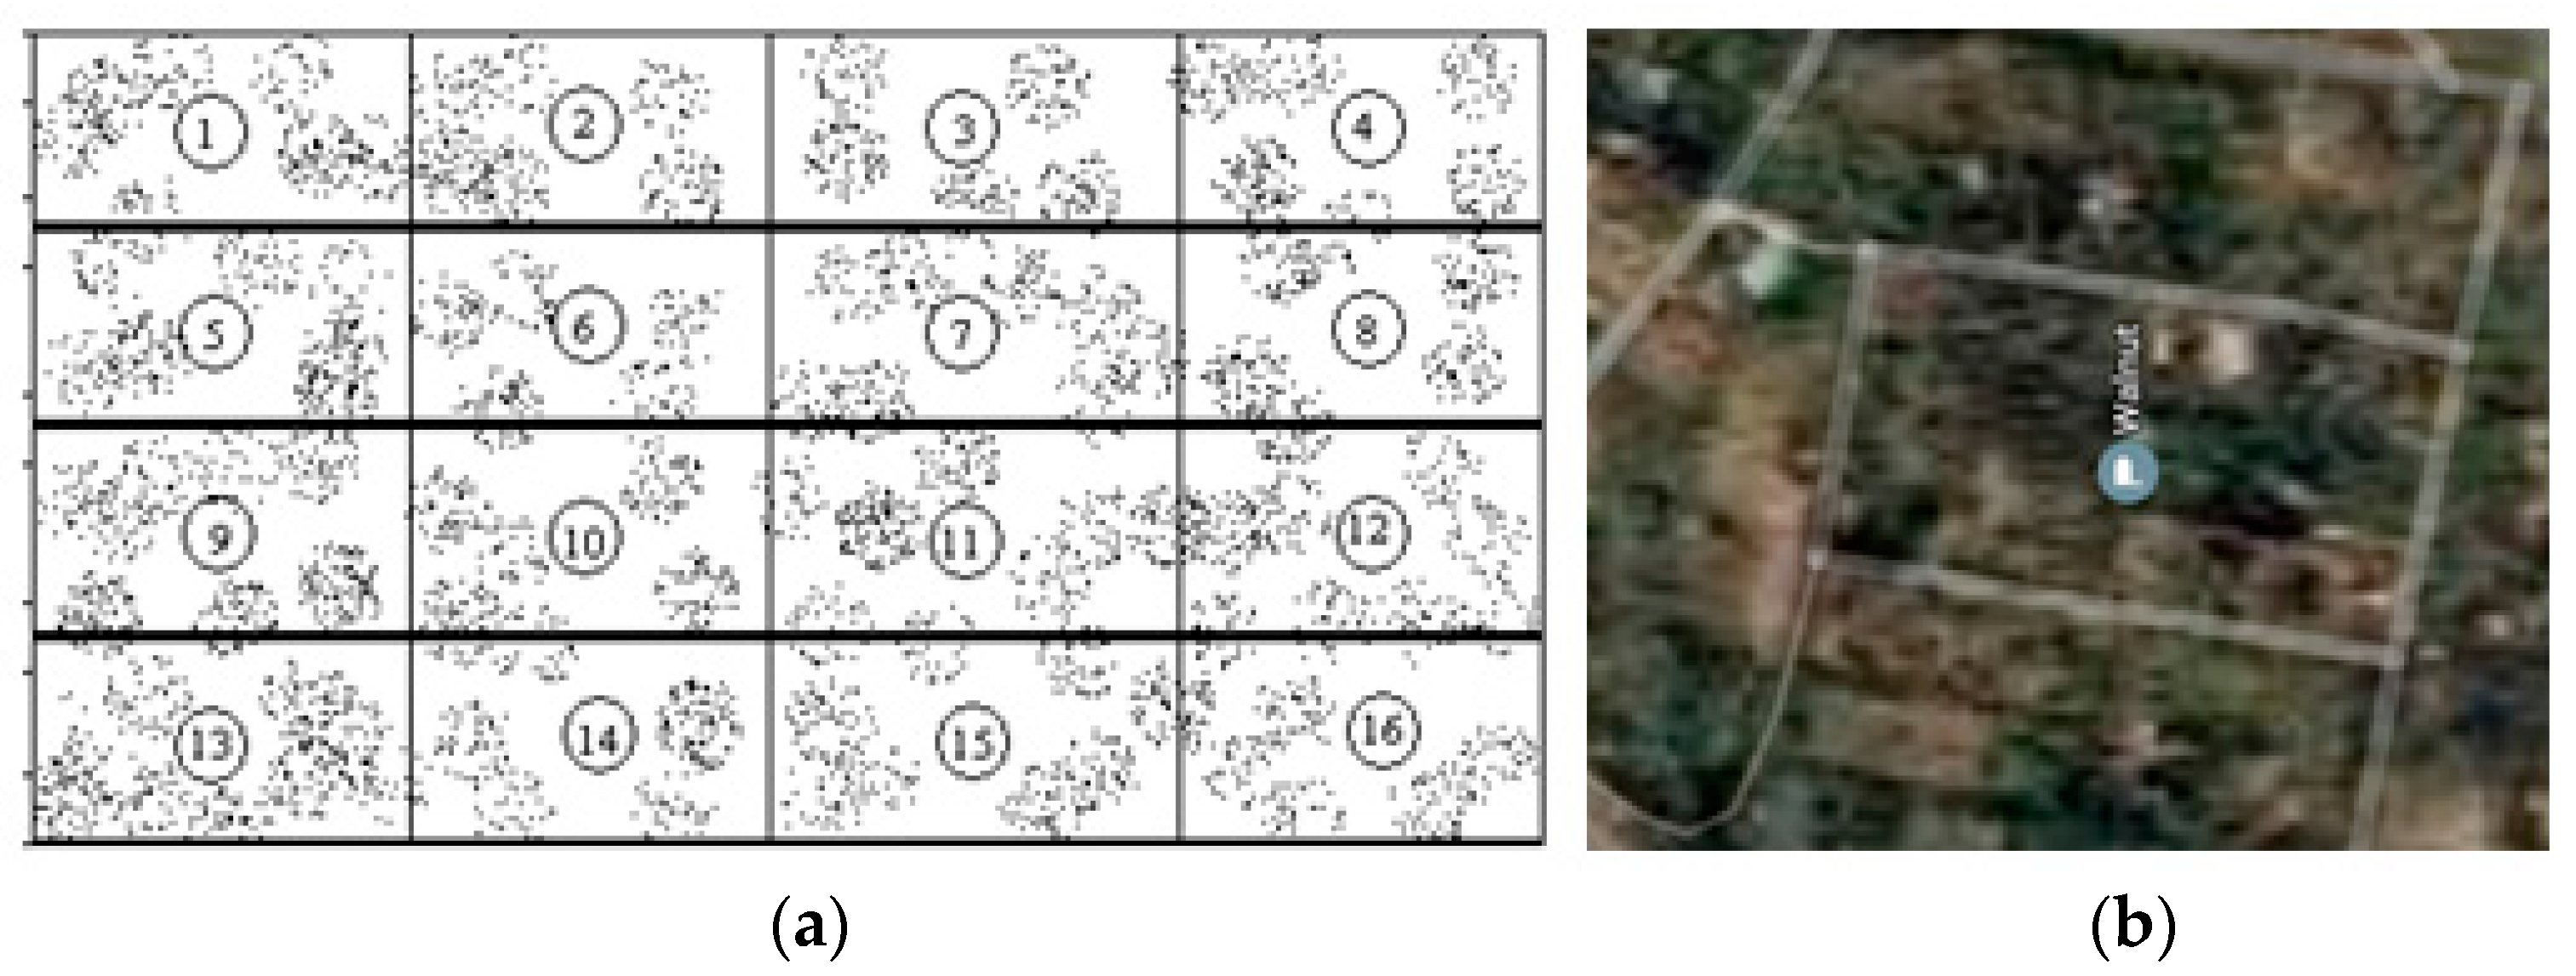
The irrigation system consists of five parallel side pipes with 20 m length connecting to the main pipe (Figure 4). The control of parallel pipes was separately ensured by valves that were placed in front of the side pipes. The amount of water in the soil was defined by sensors that were placed in regions close to the root portion of the product. This digital data was transferred to the PLC (control unit). Opening and closing conditions of valves on each lateral were set according to defined data. At this point, data was automatically saved to database columns consisting of the lateral number, sensor number, date and time. Also, a column was created in the database for adjusting the water requirement of cultivated plants depending on their stage. Device usage and their properties were given as follows
Five different laterals used in irrigation systems were 20 m long each and there were valves at their ends to provide irrigation. The most important disadvantage of these laterals is congestion caused by the accumulation of stones or sand. A filter system was used to remove this congestion and obtain more healthy data.
3.1. Water Booster
The power of the booster (Sumak Pump Corporation ltd., Istanbul, Turkey) is 2.2 Kw monophonic. It has 4–5 bar working pressure and 5–6 m3/h water pumping.
3.2. Water Tank
The water tank with 5 tons was used for storing and resting of the water taken from water wells.
3.3. Filter
The appropriate filter (Kalyon Filter Corporation Ltd., Izmir, Turkey), which is in the plastic filter groups from ¾′′ to 3′′ and 50 m3/s, was chosen to eliminate bottlenecks that can occur in the pipe system. The main features of this filter are easily removable for rinsing and there is a semi-automatic cleaning feature.
3.4. Valves
Electro-valves were used for controlling the water amount going into the lateral drip system. Five laterals that normally have closed contacts and operate with 12 Vdc were used separately.
3.5. Soil Moisture Sensor
Sixteen units DS 200 soil moisture sensor (Bejing Dingtek Tehnology Corporation Ltd., Beijing, China), were used to measure the amount of water in the soil. The Ht-1 type sensor has some advantages such as high stability, easy operation, and maintenance, and it can measure soil moisture and temperature at the same time. Also, it can be calibrated. Moreover, it has Tr-3100 type of tightness and protection rank ip68. It operates with 5–24 Vdc source. The output signal is 0–1 Vdc, 0–2.5 Vdc, 0–5 Vdc, 0–10 Vdc, 4–20 ma and rs485.
The DS200 humidity sensor is preferred because it is economical, leak-proof, long-term use, corrosion protection, and high transmission distance. The reason for our discussion of calibration is the presence of trimpot on some sensors and sensitivity adjustment here. However, the DS200 humidity sensor has an accuracy of ±2% which is a very good value. The reason we discuss this here is that we would advise to be careful when choosing a sensor for such work.
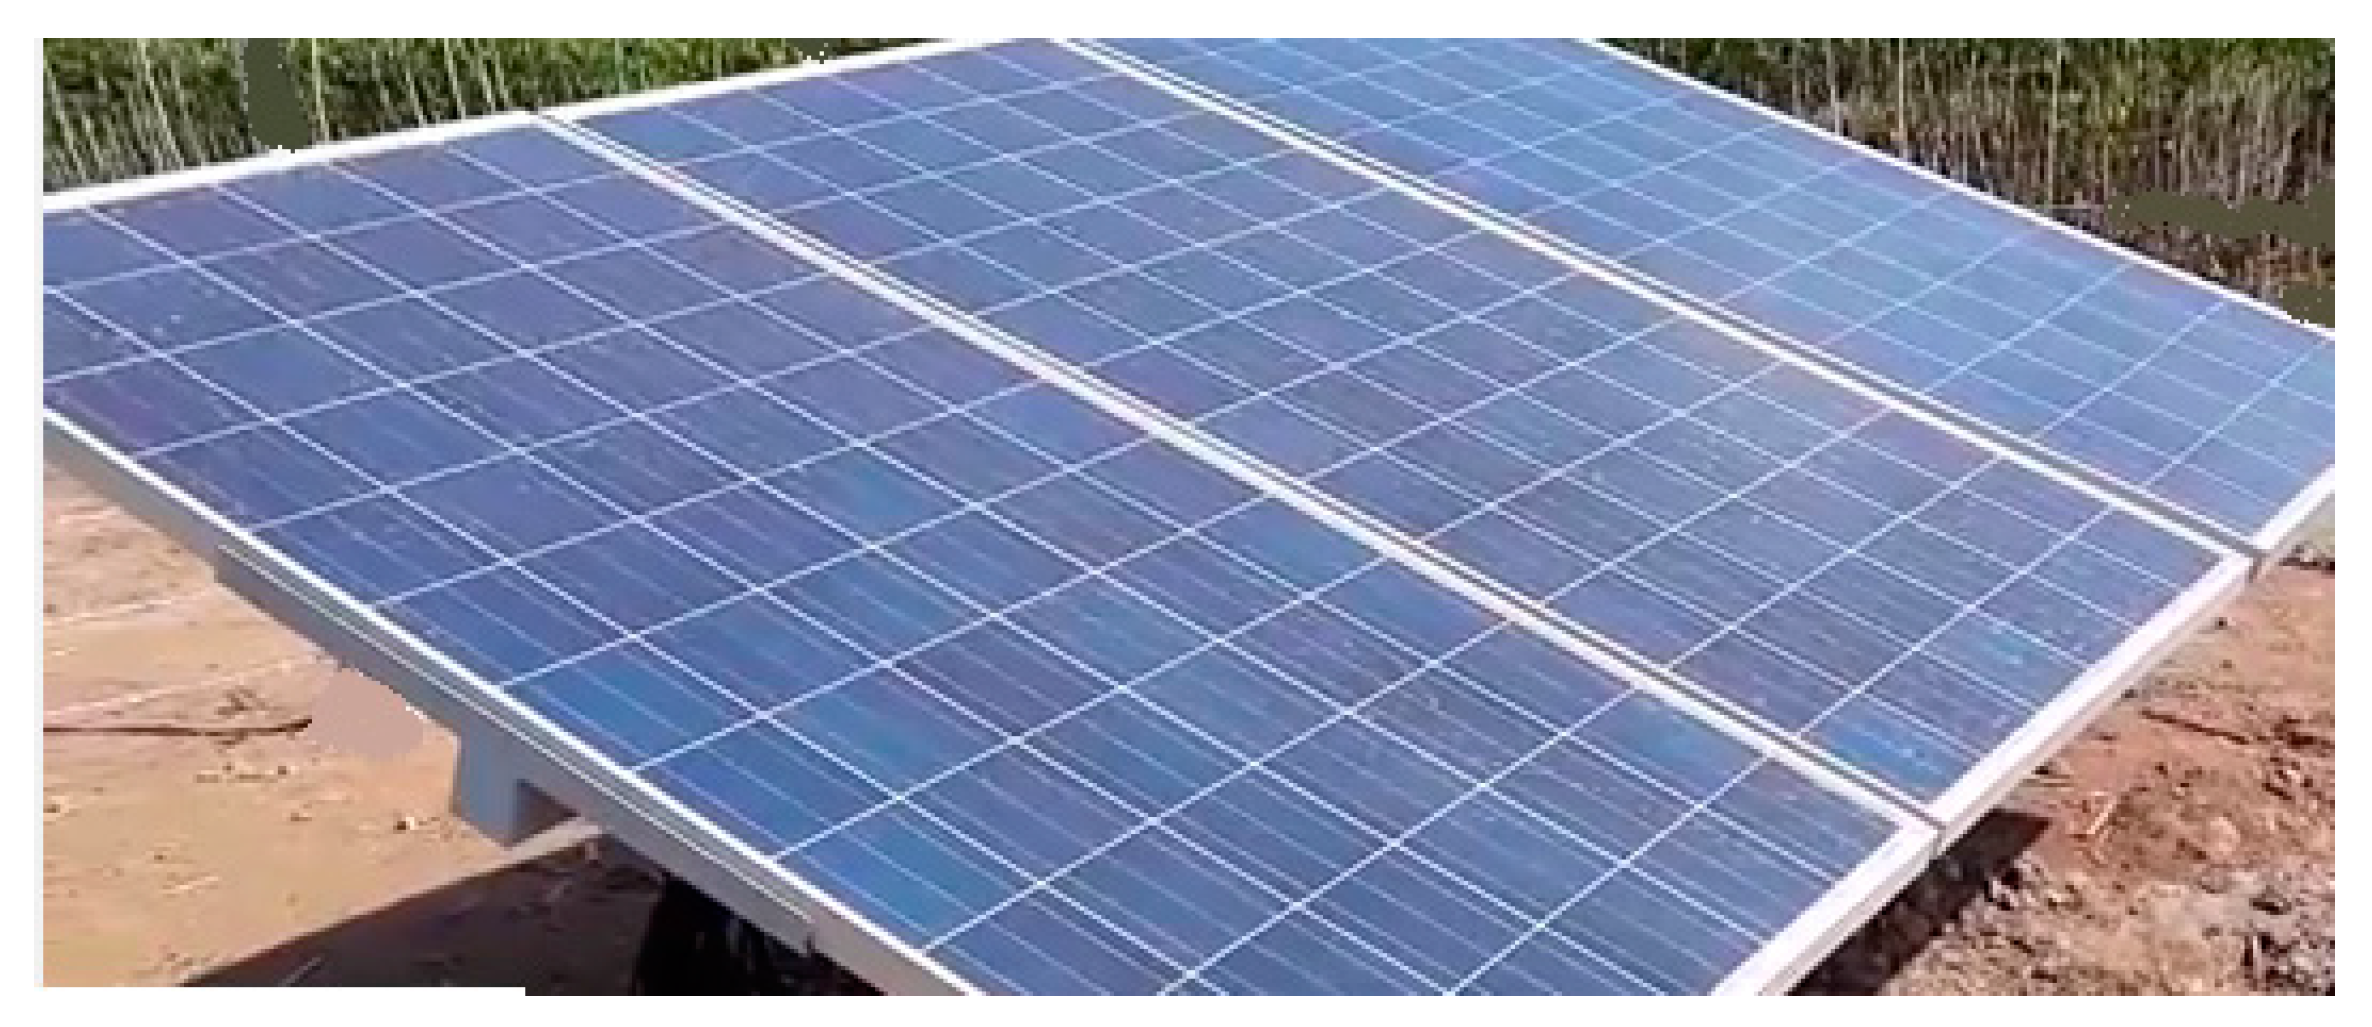
3.6. Solar Panel and Setup
Solar panels have been used to meet AC and DC energy system requirements. The figure of established panels is given in Figure 5.
3.7. Control Unit
The power unit was formed into two separate sections—AC and DC—considering the amount of energy taken from solar panels. The block diagram of the power supply that is used in DC systems is given in Figure 6.
The infrastructure system was generated by bringing together hardware components to use the precision irrigation system in IOS/Android-based operating systems. A view of the developed infrastructure is illustrated in Figure 7.
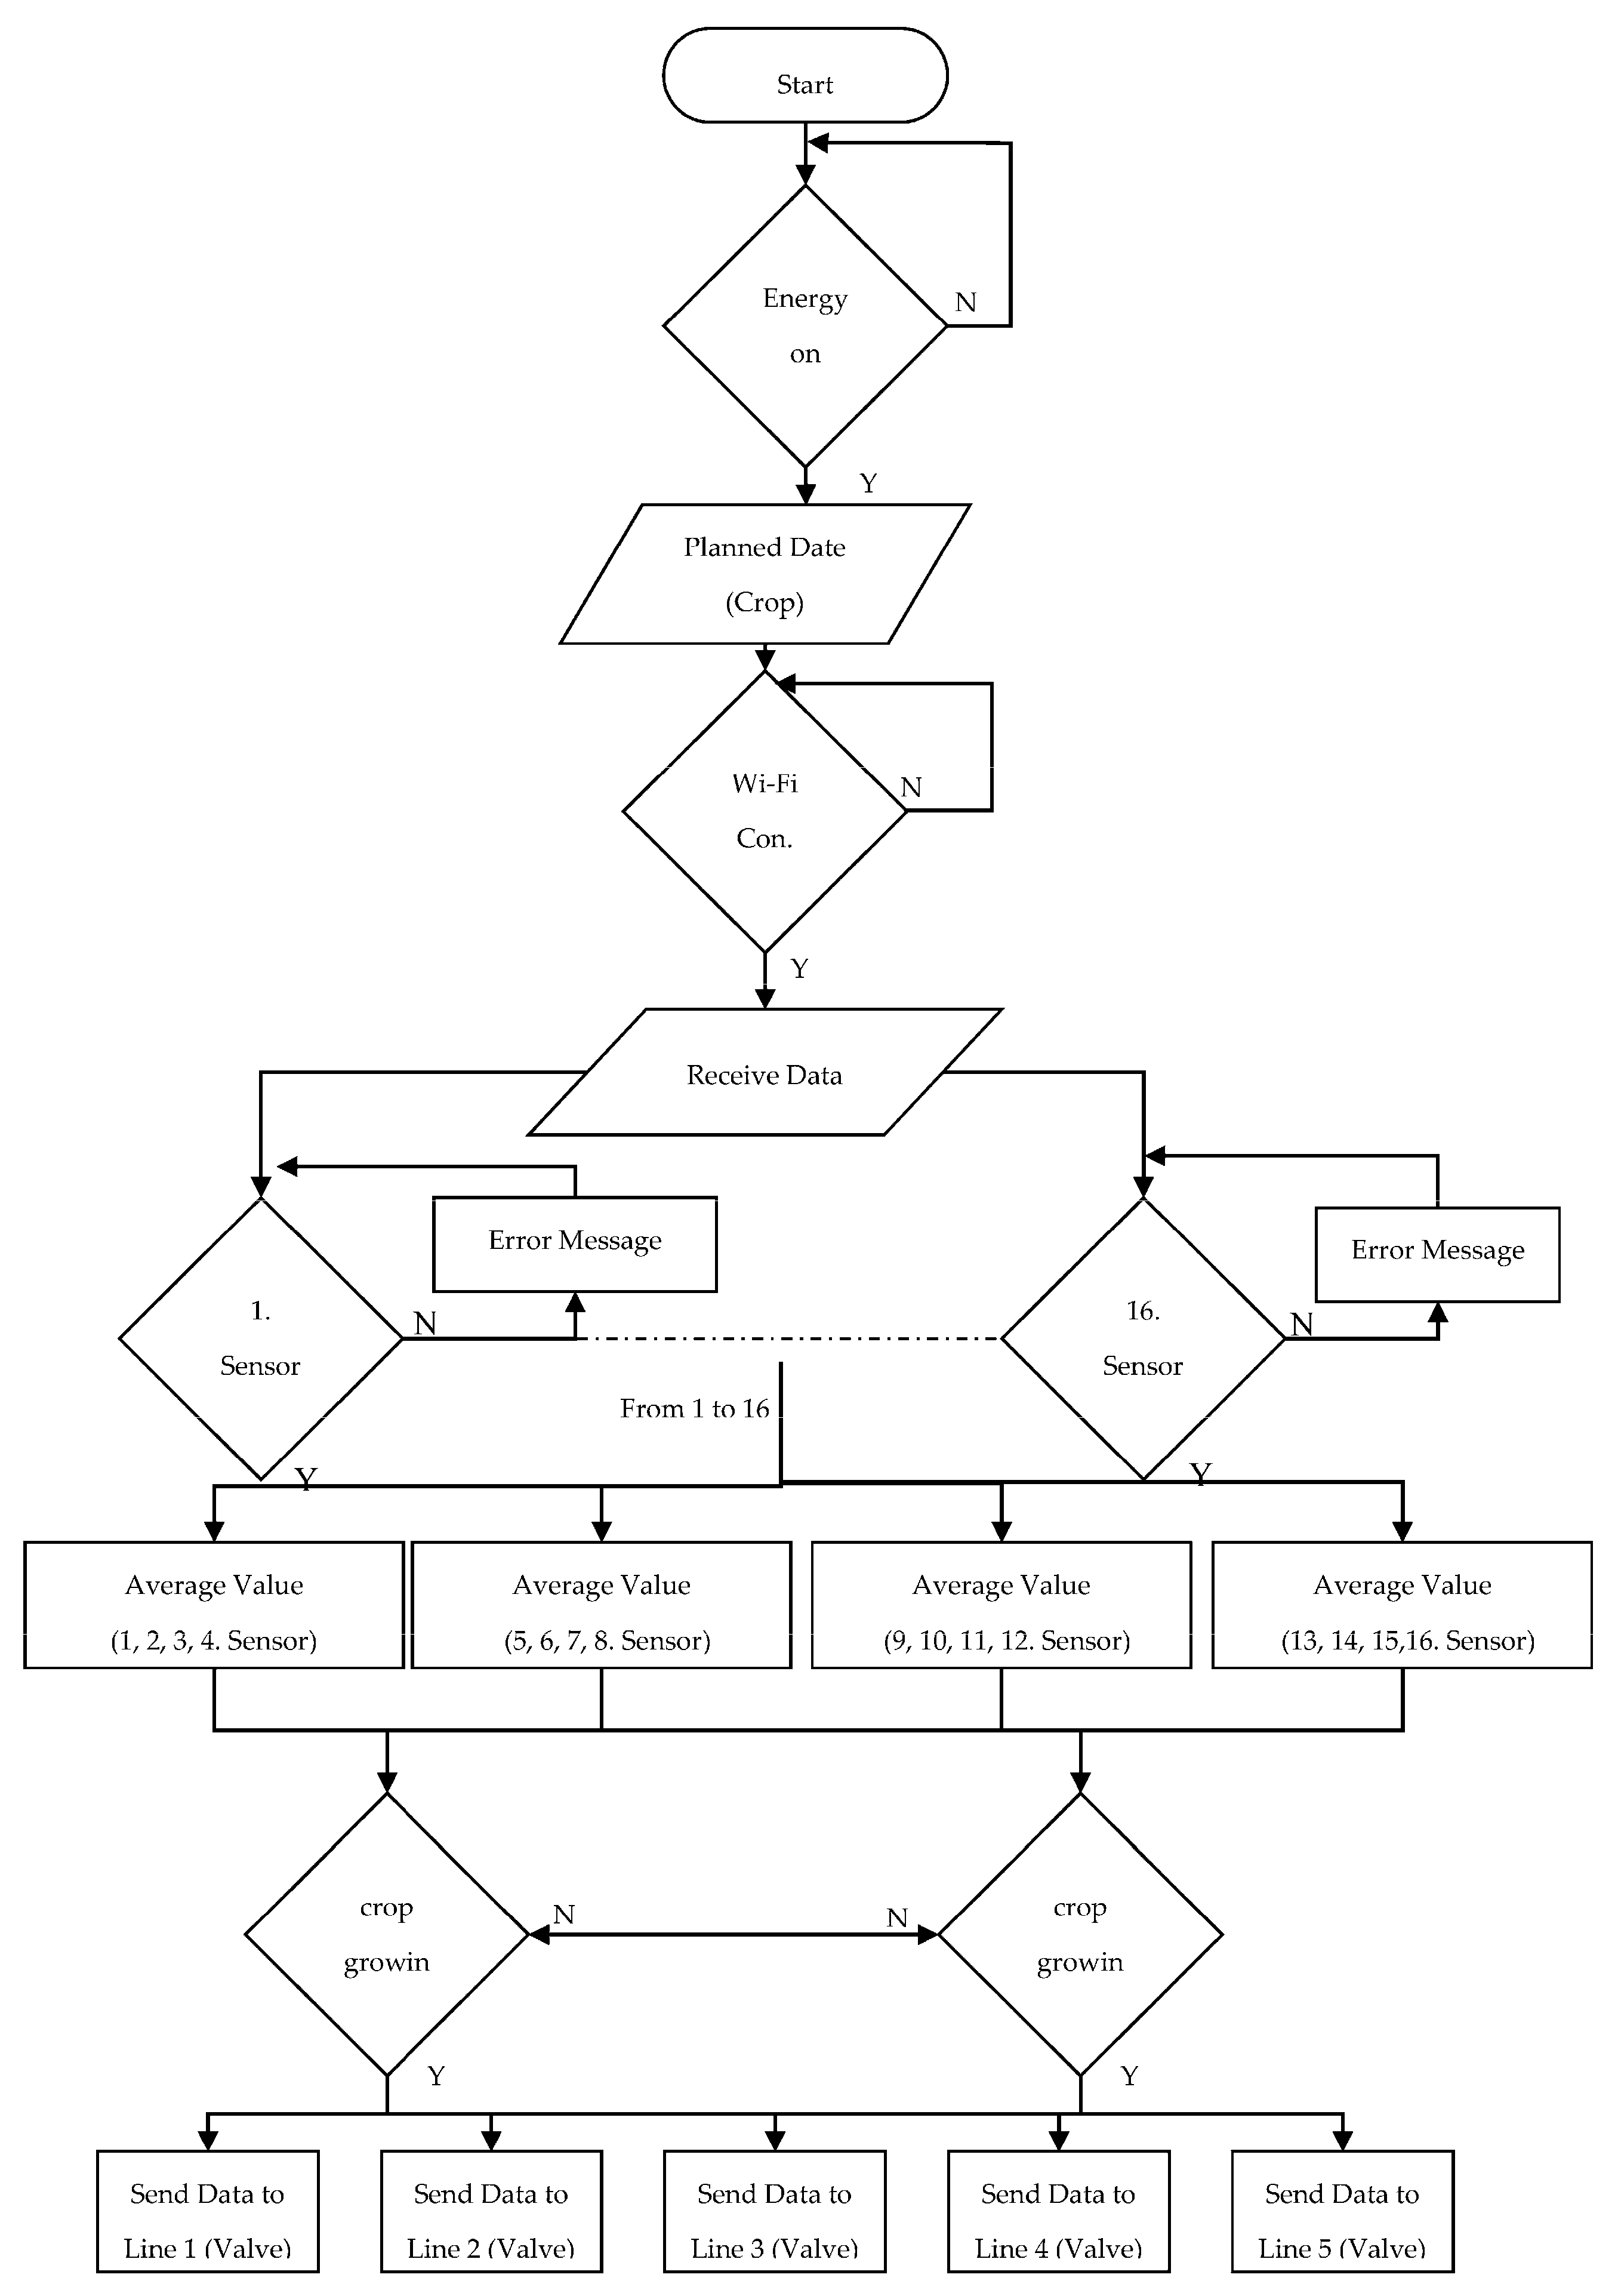
3.8. Irrigation System Operation
The flowchart of the software is given in Figure 8.
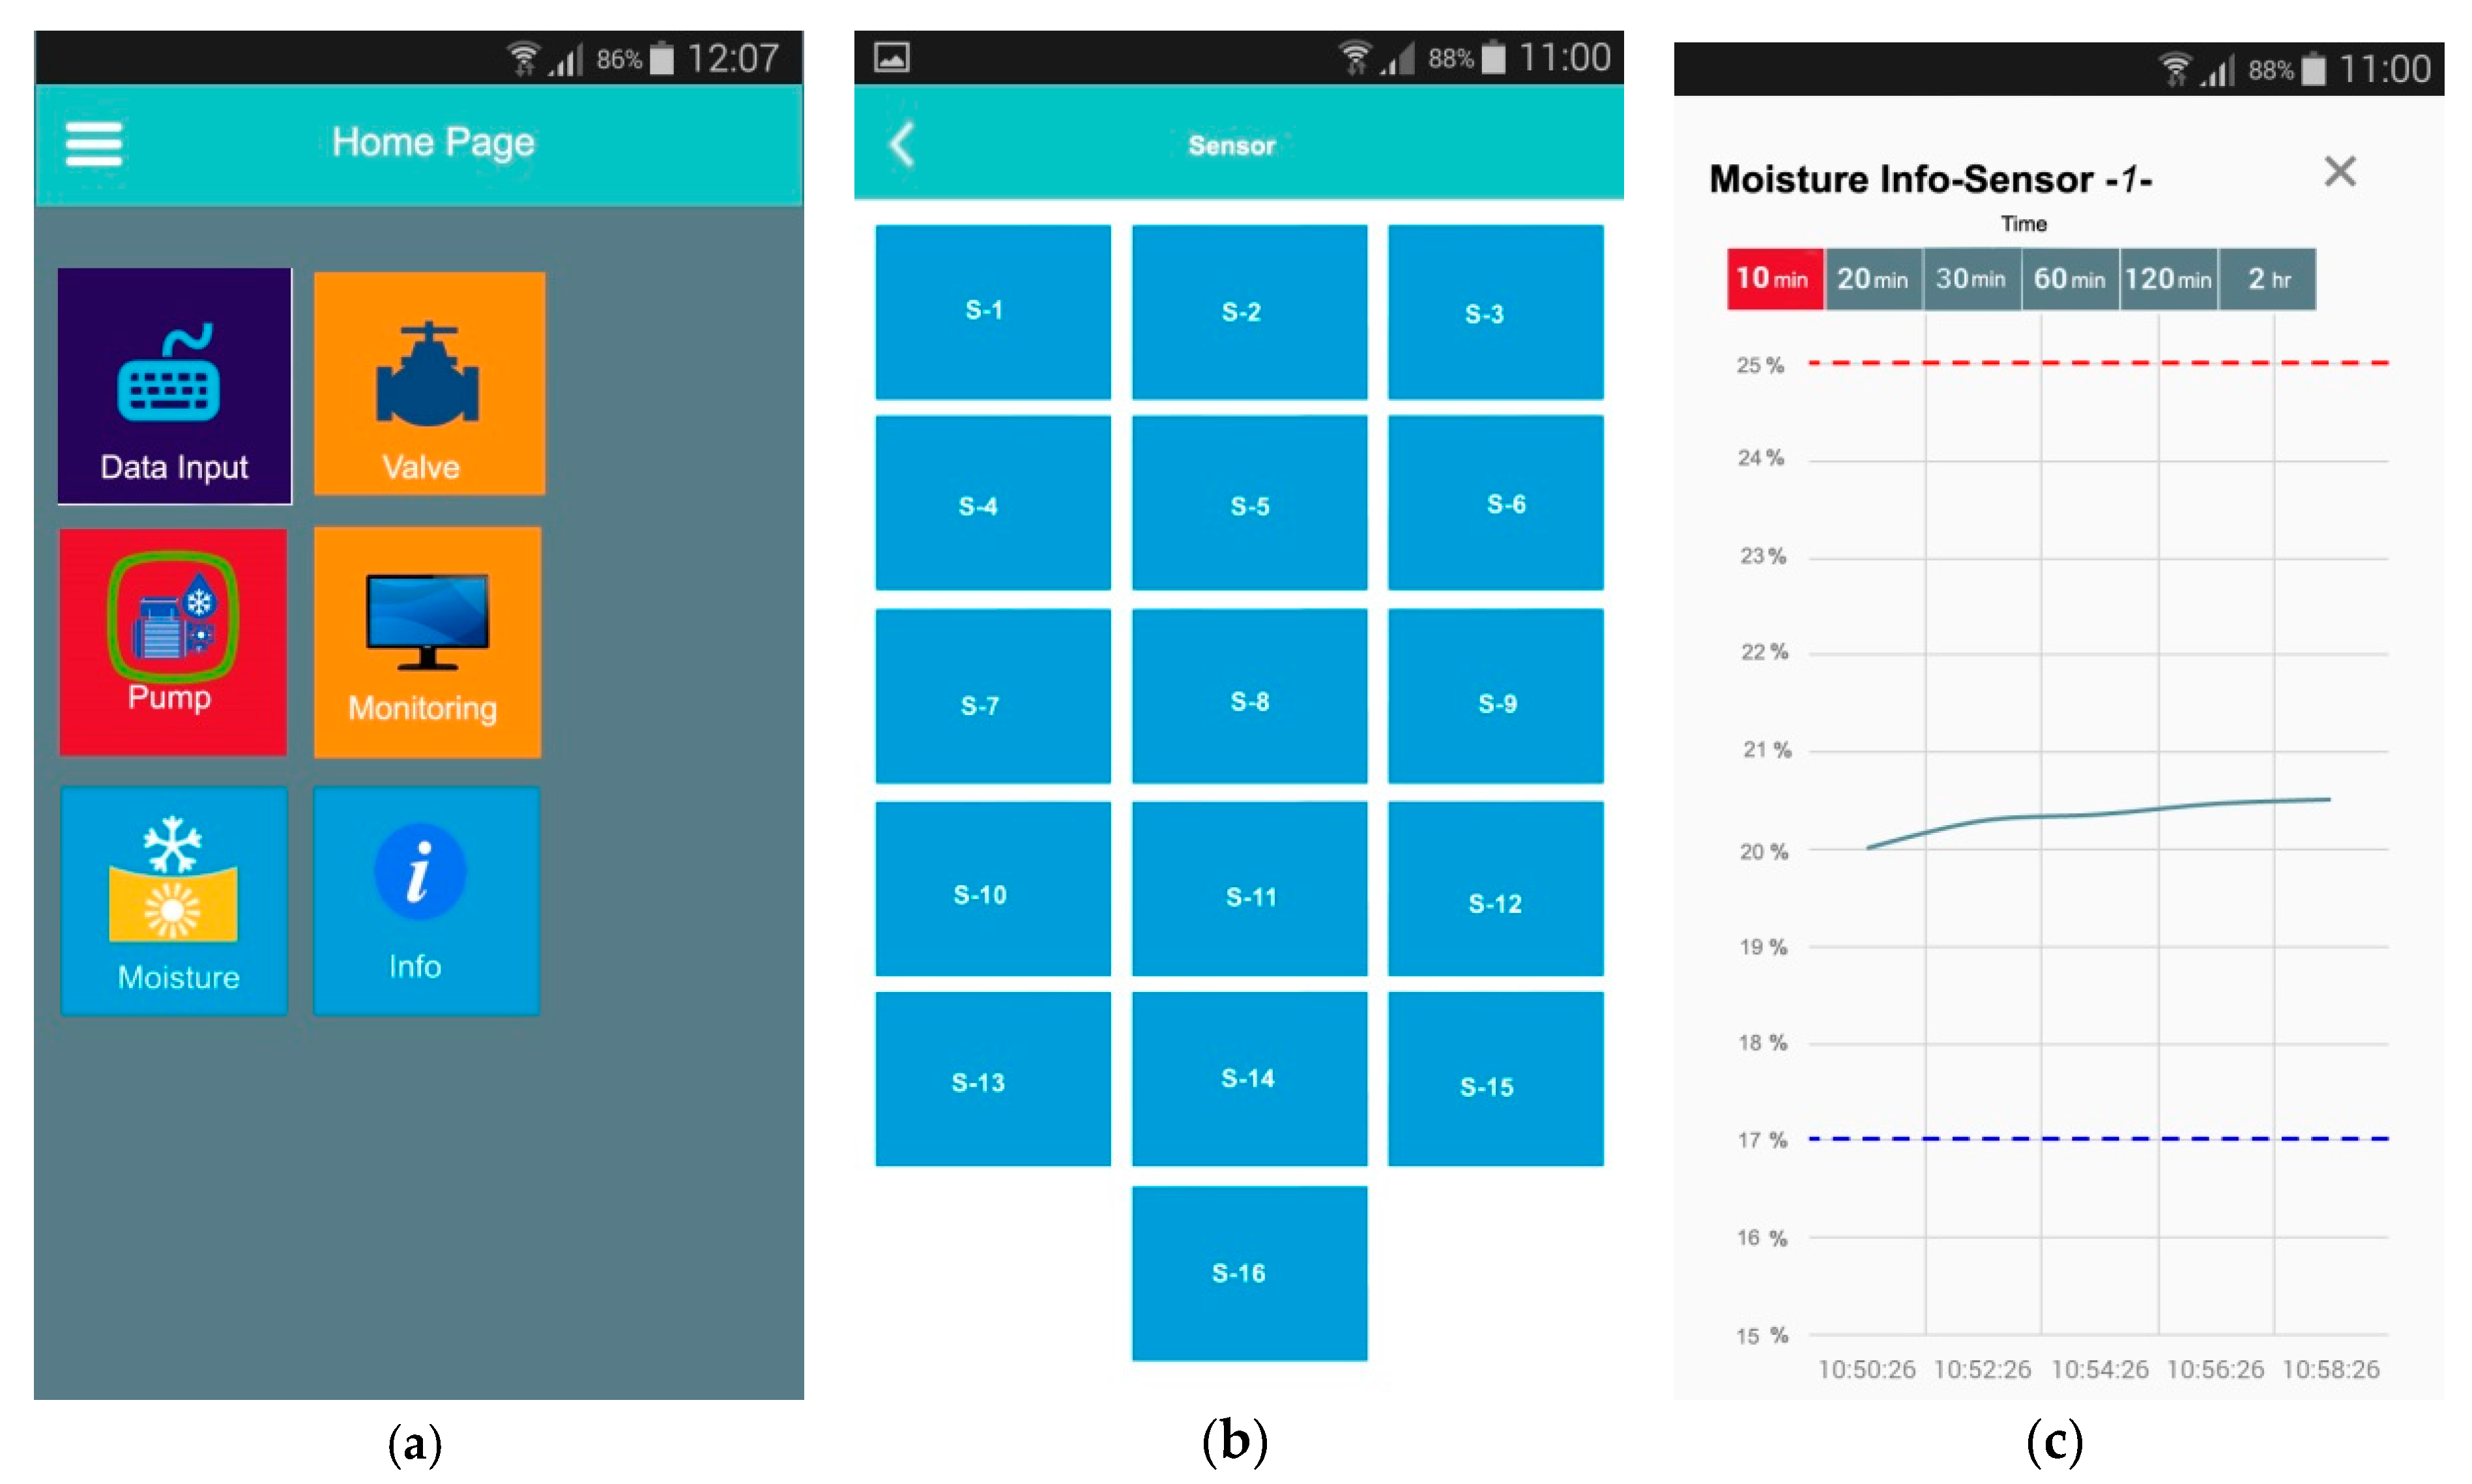
In the software that can operate in IOS/Android based systems, information belonging to sensors or lateral is given; at the same time, operating information belonging to the desired sensor appears on the screen. The main screen view is given in Figure 9, and the user should use the data input section to perform data entry belonging to the product. The pump menu should be used to control the pumps, the moisture menu should be used for sensor information, and the valve menu should be used for controlling the valves. Moreover, values depending on the stage of plant growth and water requirements could be watched in monitoring menu and software information could be followed in information menu.
4. Discussion
The precision irrigation system was designed as a closed-loop control system. In the designed control system, the data obtained with the reference data were compared and thus real-time monitoring is provided in addition to the water efficiency. Reference values in the study were determined according to Equations (1) and (2). This data indicates the seasonal water needs of the walnut tree. The amount of rainfall in previous years was used as data when water demand was determined. This data was taken from Turkish State Meteorological Center. At the same time, daily water needs were determined at a lower level. The obtained data were arranged in an algorithmic way into the PLC program. The data obtained from the sensors were compared with the periodical water requirement table and the working status of the system was revealed. While studies reported before in the literature mostly focus on the opening and closing operations of drip irrigation system, in this study, the opening and closing operations were determined according to the seasonal water need. In the studies shown in the references, especially those related to the drip irrigation system, only water irrigation was done from the sensors based on the humidity condition of the soil.
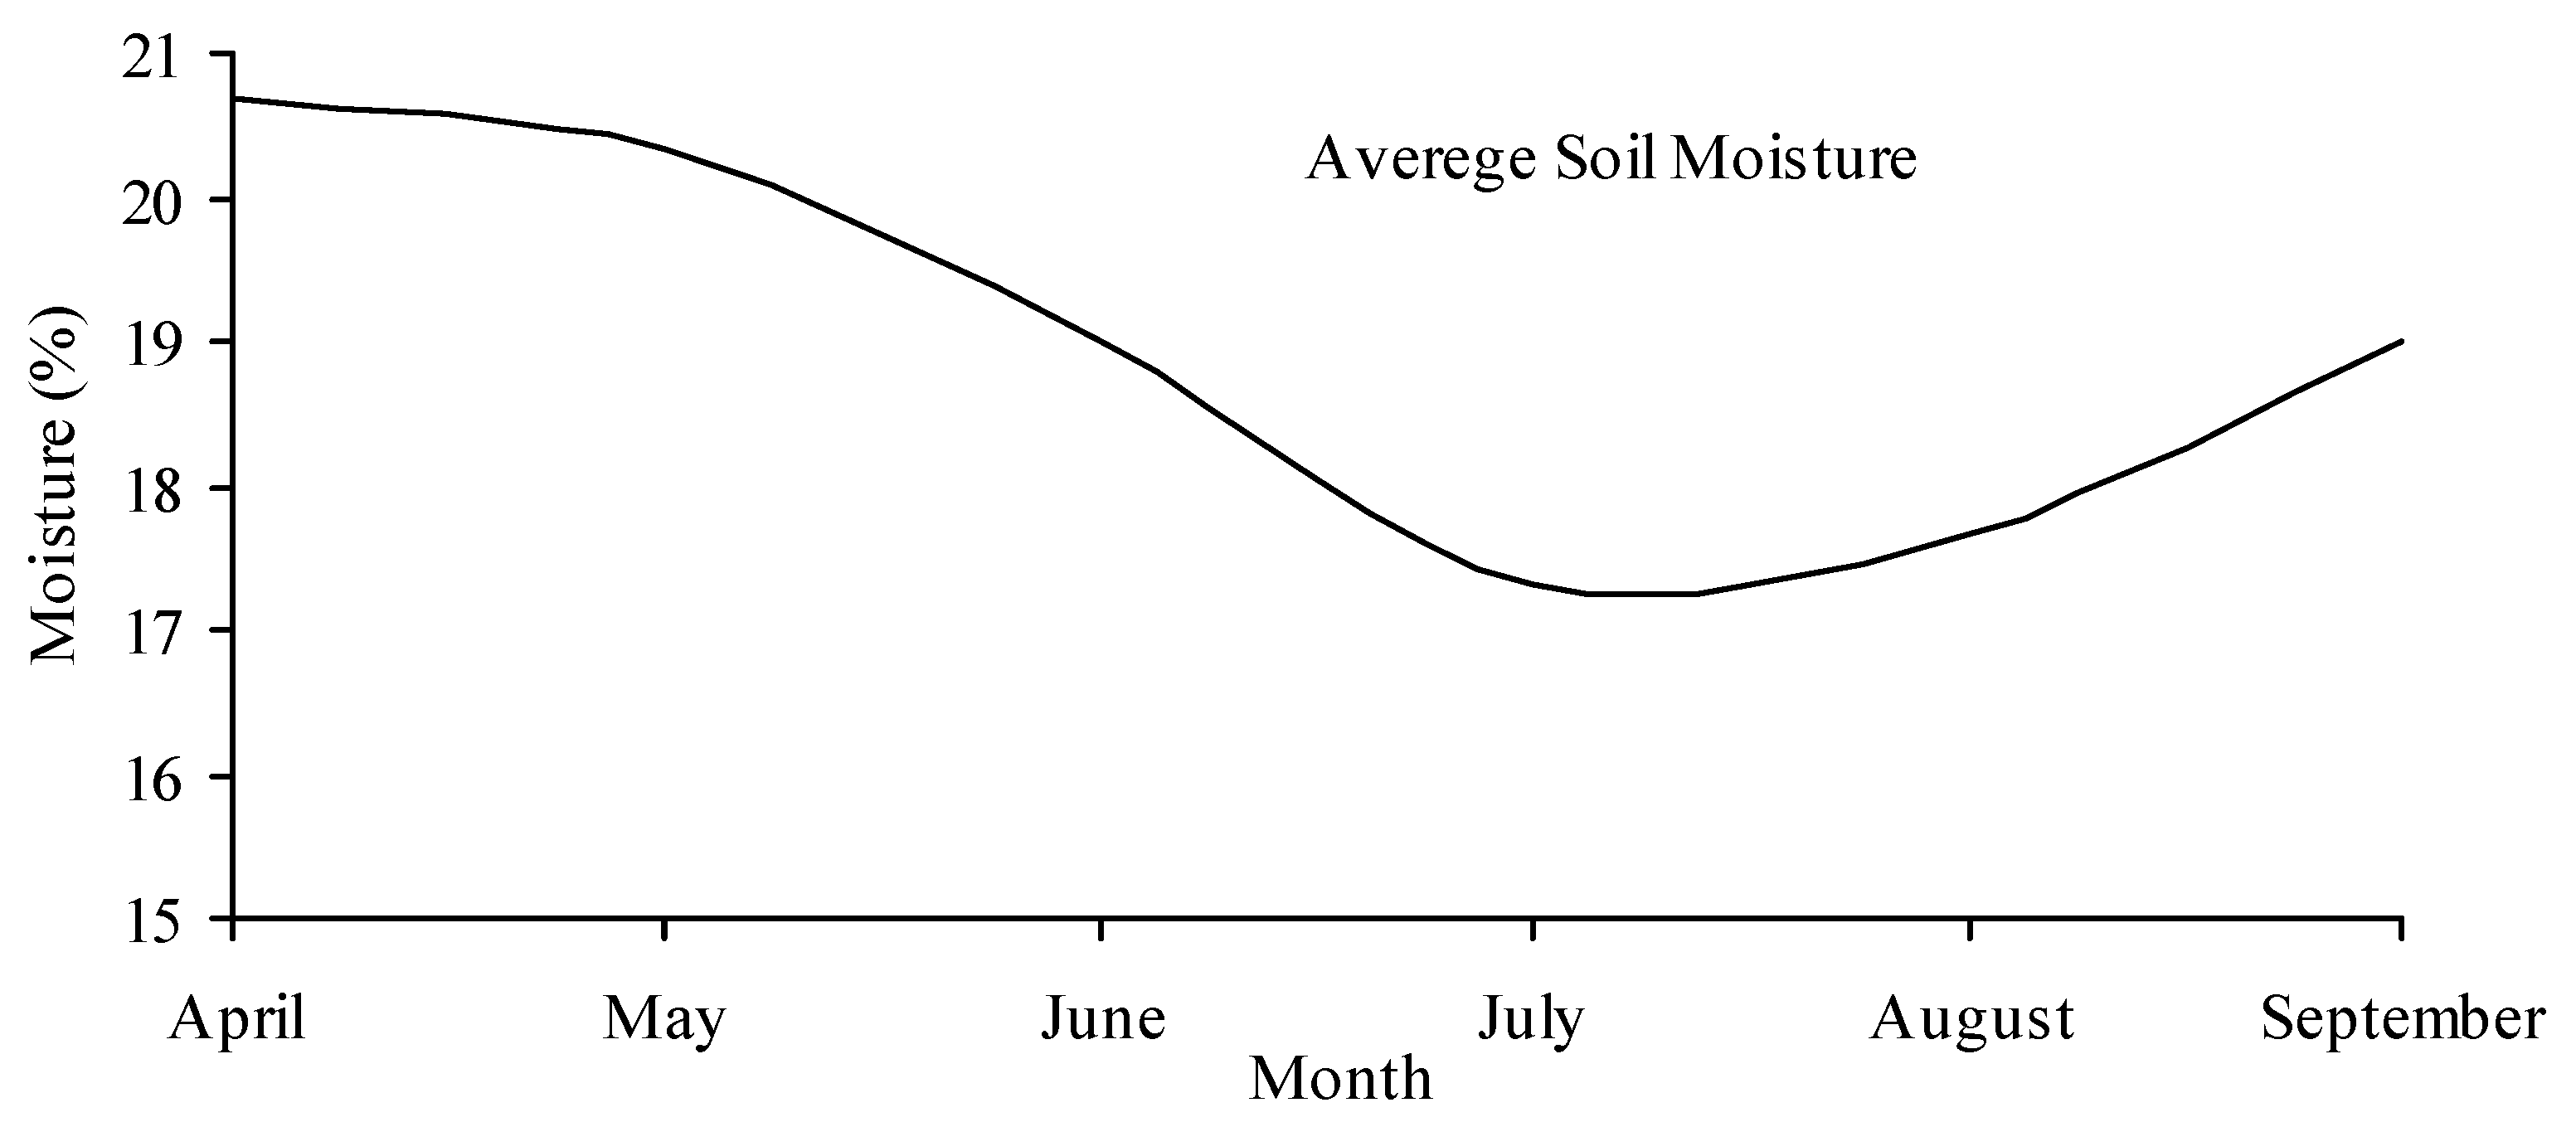
Dating from October to harvest, average monthly moisture results obtained from 16 sensors in five different laterals are given in Figure 10. As can be seen in Figure 10, the moisture rate decreases especially during the summer season. When this situation is compared with climatic data, it is shown that these results are close to average values.
Moisture values that were obtained from sensors during the day and depend on four separate stages are given in Figure 11.
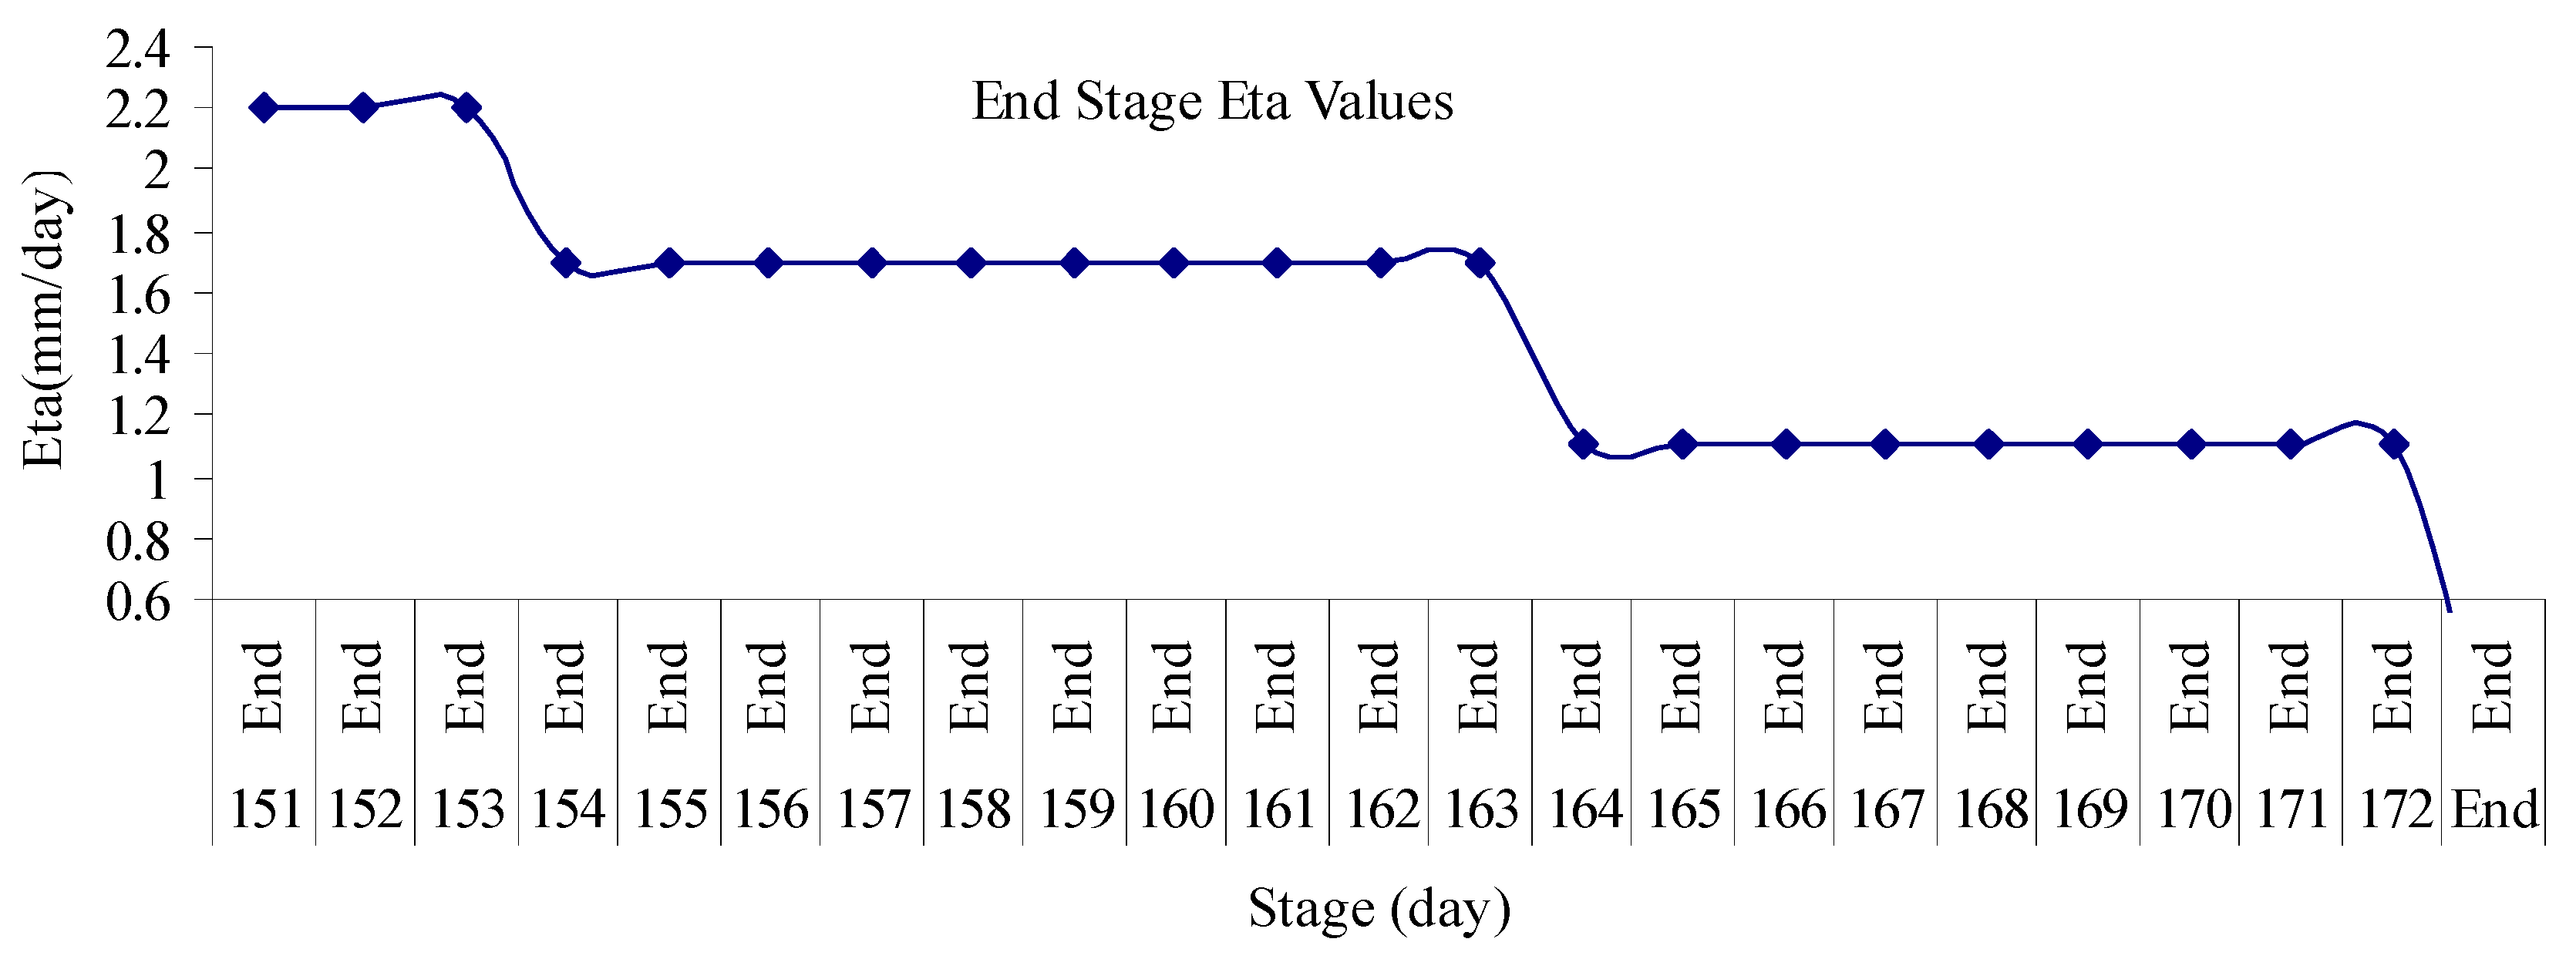
Values were obtained from equalities, which were used to define the amount of water needed in the product growth stage, and given daily in Figure 12, Figure 13, Figure 14 and Figure 15 respectively.
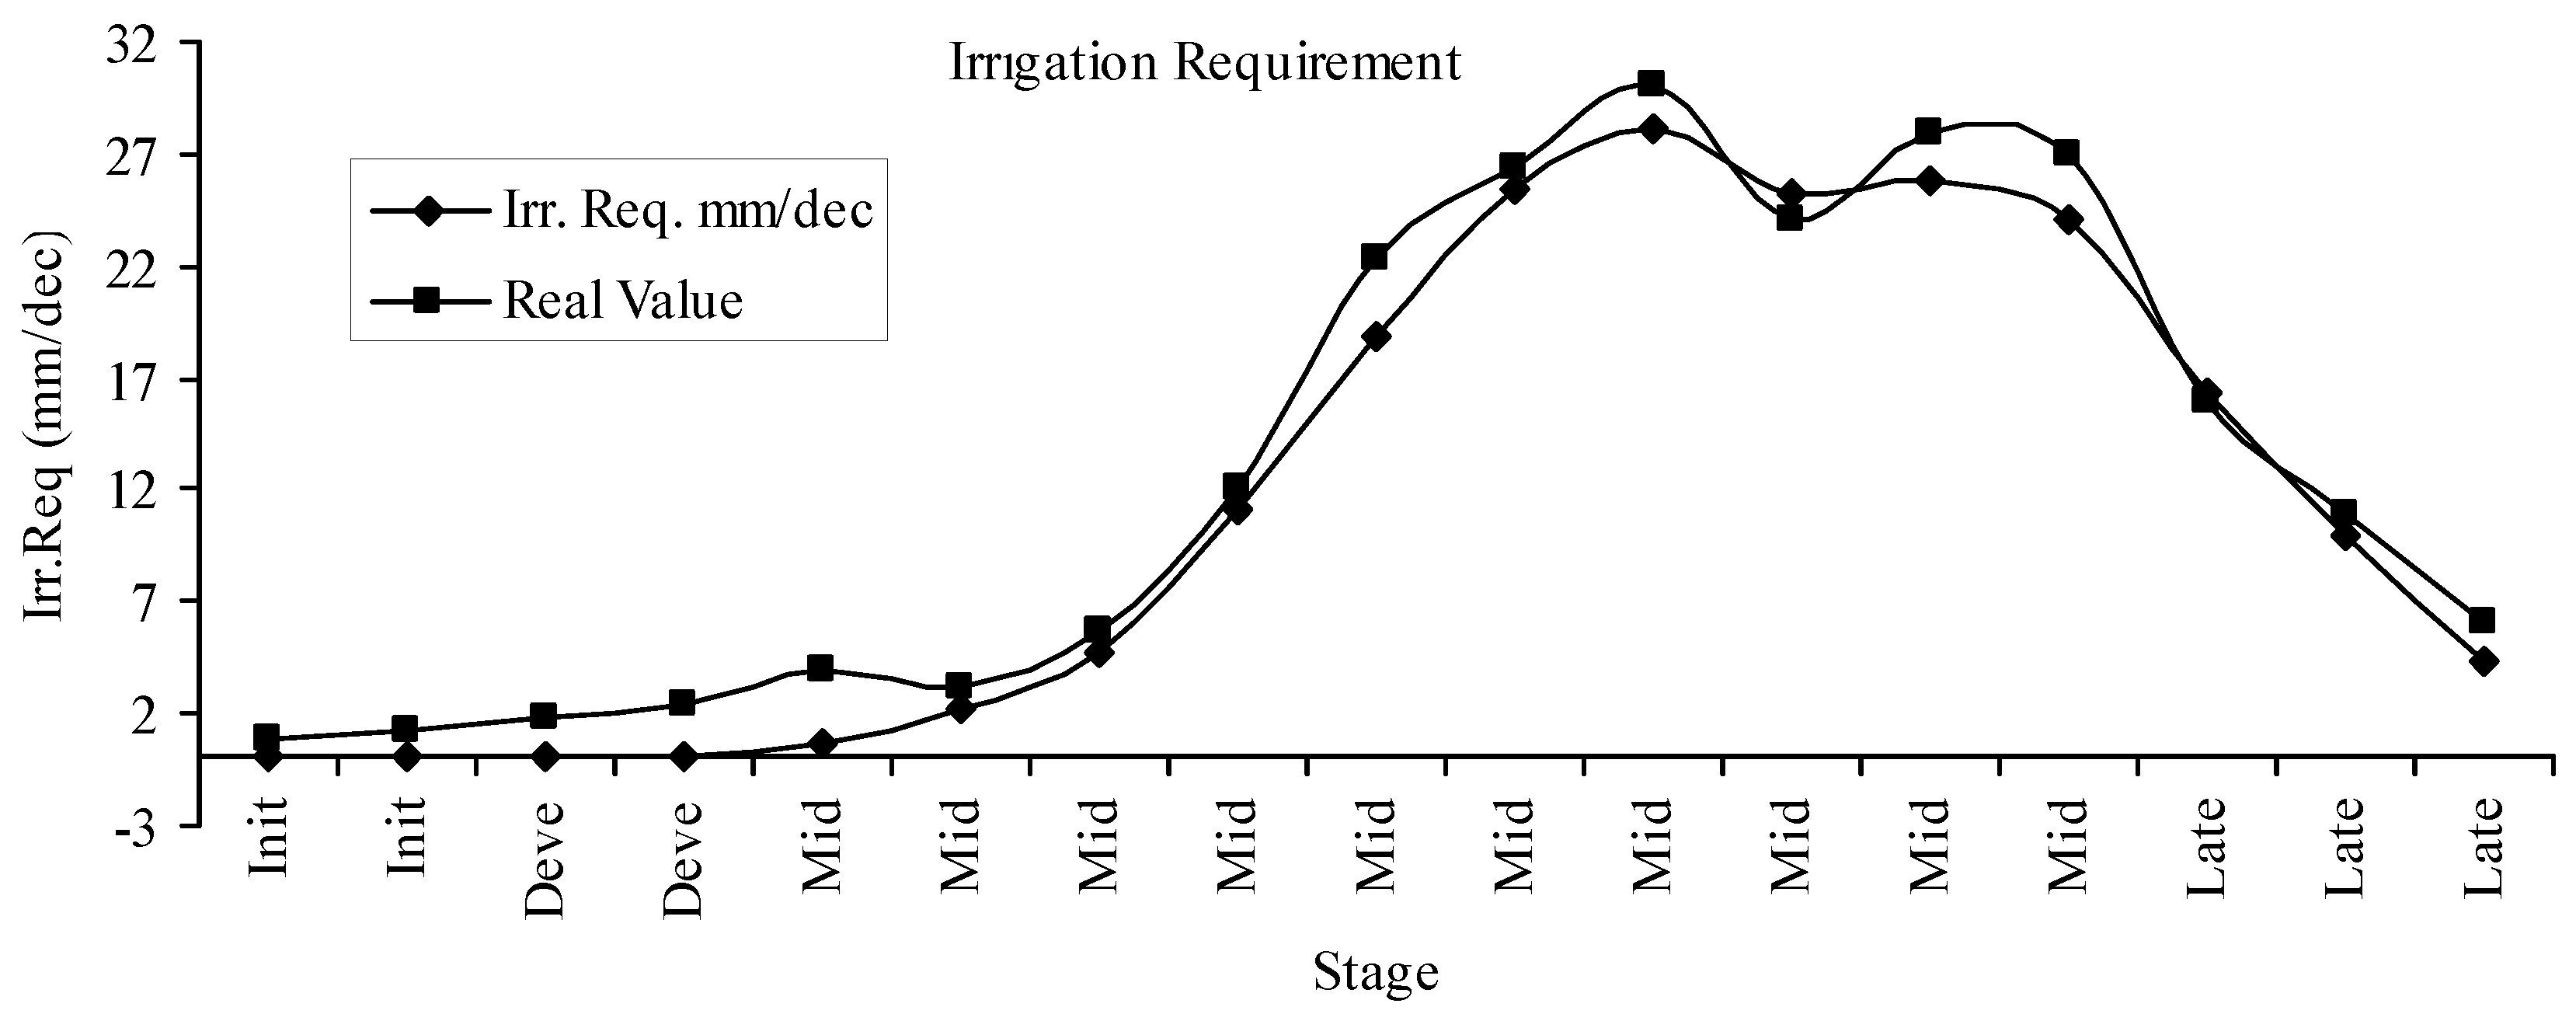
In Figure 16, a comparison was done between the total amount of water to be supplied and that which was actually supplied to plants. It can be seen in Figure 16 that plants’ water requirement especially increases after the development stage. Moreover, it is clear that calculated values and real values are close to each other and a precision irrigation process is achieved.
Resulting from the leveling of product growth area, it can be seen that average moisture values in each lateral are close together. This situation was effective in reducing energy and water consumption.
5. Conclusions
This study shows that precision irrigation systems with moisture sensors are extremely advantageous for growing crops in agricultural systems. In the study, when equations used to determine the amount of water required in the plant growth stages and obtained climatic data are considered, it is identified that appropriately meeting the amount of water determined for each period is effective for agriculture growth. Thus, an important advantage is obtained by adjusting the amount of water needed in the plant growth stages and by consuming the water depending on the soil moisture with classic drip irrigation systems. When the total water demand is calculated as 197 mm/dec, it actualizes as 211 mm/dec in the application. This value can be obtained only with software changes in the system.
Nowadays, important savings have been achieved in energy costs by using solar energy. When the installation costs are considered, it can be understood that the installation costs can be met in three harvest periods. When the technological point of view is taken into account, the system can be operated through integration with smart phones. Thence, all system can be controlled and tracked by these devices. Especially if one considers that smart phones are widely used, it is obvious that the system is highly accessible. Moreover, there is about a 60% decrease in the labor force with the precision irrigation system. A farmer’s daily work time in the field is taken into account while this value is calculated and is dramatically reduced by the methods illustrated above.
Author Contributions
Mehmet Fatih Işık, Cemal Yılmaz and Yusuf Sönmez conceived and designed the experiments; Mehmet Fatih Işık and Ercan Nurcan Yılmaz performed the experiments; Mehmet Fatih Işık and Veysel Özdemir analyzed the data.
Conflicts of Interest
The authors declare no conflict of interest.
References
- Dursun, M.; Özden, S. Control of soil moisture with radio frequency in a photovoltaic-powered drip irrigation system. Turk. J. Electr. Eng. Comput. Sci. 2015, 23, 447–458. [Google Scholar] [CrossRef]
- Weng, Q. (Ed.) Advances in Environmental Remote Sensing: Sensors, Algorithms, and Applications; CRC Press: Boca Raton, FL, USA, 2011. [Google Scholar]
- Committee on the Earth System Science for Decisions about Human Welfare: Contributions of Remote Sensing. Contributions of Land Remote Sensing for Decisions about Food Security and Human Health; Workshop Report; National Academies Press: Washington, DC, USA, 2007. [Google Scholar]
- Xu, G. GPS: Theory, Algorithms and Applications; Springer Science & Business Media: London, UK, 2007. [Google Scholar]
- Pierce, F.J.; Clay, D. (Eds.) GIS Applications in Agriculture; CRC Press: Boca Raton, FL, USA, 2007. [Google Scholar]
- El-Kader, S.M.A.; El-Basioni, B.M.M. Precision farming solution in Egypt using the wireless sensor network technology. Egypt. Inf. J. 2013, 14, 221–233. [Google Scholar] [CrossRef]
- Topp, G.C.; Davis, J.L.; Annan, A.P. Electromagnetic determination of soil water content: Measurements in coaxial transmission lines. Water Resour. Res. 1980, 16, 574–582. [Google Scholar] [CrossRef]
- Broeders, J.; Croux, D.; Peeters, M.; Beyens, T.; Duchateau, S.; Cleij, J.T.; Wagner, P.; Thoelen, R.; De Ceuninck, W. Mobile Application for Impedance-Based Biomimetic Sensor Readout. IEEE Sens. J. 2013, 13, 2659–2665. [Google Scholar] [CrossRef]
- Lee, B.G.; Chung, W. Driver alertness monitoring using the fusion of facial features and bio-signals. IEEE Sens. J. 2012, 12, 2416–2422. [Google Scholar] [CrossRef]
- Ishigaki, Y.; Matsumoto, Y.; Ichimiya, R.; Tanaka, K. Development of mobile radiation monitoring system utilizing smartphone and its field tests in Fukushima. IEEE Sens. J. 2013, 13, 3520–3526. [Google Scholar] [CrossRef]
- Lee, J.; Reyes, B.; McManus, D.D.; Mathias, O.; Chon, K.H. Atrial fibrillation detection using an iPhone 4S. IEEE Trans. Biomed. Eng. 2013, 60, 203–206. [Google Scholar] [CrossRef] [PubMed]
- Koukoumidis, E.; Martonosi, M.; Peh, L.S. Leveraging smartphone cameras for collaborative road advisories. IEEE Trans. Mob. Comput. 2012, 11, 707–723. [Google Scholar] [CrossRef]
- Qin, C.; Bao, X.; Choudhury, R.R.; Nelakuditi, S. Tagsense: Leveraging smartphones for automatic image tagging. IEEE Trans. Mob. Comput. 2014, 13, 61–74. [Google Scholar] [CrossRef]
- Lehmann, R.J.; Reiche, R.; Schiefer, G. Future internet and the agri-food sector: State-of-the-art in literature and research. Comput. Electron. Agric. 2012, 89, 158–174. [Google Scholar] [CrossRef]
- Li, M.; Qian, J.P.; Yang, X.T.; Sun, C.H.; Ji, Z.T. A PDA-based record-keeping and decision-support system for traceability in cucumber production. Comput. Electron. Agric. 2010, 70, 69–77. [Google Scholar] [CrossRef]
- Car, N.J.; Christen, E.W.; Hornbuckle, J.W.; Moore, G.A. Using a mobile phone Short Messaging Service (SMS) for irrigation scheduling in Australia–Farmers’ participation and utility evaluation. Comput. Electron. Agric. 2012, 84, 132–143. [Google Scholar] [CrossRef]
- Sallabi, F.; Fadel, M.; Hussein, A.; Jaffar, A.; El Khatib, H. Design and implementation of an electronic mobile poultry production documentation system. Comput. Electron. Agric. 2011, 76, 28–37. [Google Scholar] [CrossRef]
- Arroqui, M.; Mateos, C.; Machado, C.; Zunino, A. RESTful Web Services improve the efficiency of data transfer of a whole-farm simulator accessed by Android smartphones. Comput. Electron. Agric. 2012, 87, 14–18. [Google Scholar] [CrossRef]
- Delgado, J.A.; Kowalski, K.; Tebbe, C. The first Nitrogen Index app for mobile devices: Using portable technology for smart agricultural management. Comput. Electron. Agric. 2013, 91, 121–123. [Google Scholar] [CrossRef]
- Cunha, C.R.; Peres, E.; Morais, R.; Oliveira, A.A.; Matos, S.G.; Fernandes, M.A.; Ferreira, P.J.S.G.; Reis, M.J.C.S. The use of mobile devices with multi-tag technologies for an overall contextualized vineyard management. Comput. Electron. Agric. 2010, 73, 154–164. [Google Scholar] [CrossRef]
- Gong, A.; Wu, X.; Qiu, Z.; He, Y. A handheld device for leaf area measurement. Comput. Electron. Agric. 2012, 98, 74–80. [Google Scholar] [CrossRef]
- Confalonieri, R.; Foi, M.; Casa, R.; Aquaro, S.; Tona, E.; Peterle, M.; Boldini, A.; de Carli, G.; Ferrari, A.; Finotto, G.; et al. Development of an app for estimating leaf area index using a smartphone. Trueness and precision determination and comparison with other indirect methods. Comput. Electron. Agric. 2013, 96, 67–74. [Google Scholar] [CrossRef]
- Montoya, F.G.; Gómez, J.; Cama, A.; Zapata, A.; Martínez, F.; de la Cruz, J.; Manzano, F. A monitoring system for intensive agriculture based on mesh networks and the android system. Comput. Electron. Agric. 2013, 99, 14–20. [Google Scholar] [CrossRef]
- Gómez-Robledo, L.; López-Ruiz, N.; Melgosa, M.; Palma, A.J.; Capitán-Vallvey, L.F.; Sánchez-Marañón, M. Using the mobile phone as Munsell soil-colour sensor: An experiment under controlled illumination conditions. Comput. Electron. Agric. 2013, 99, 200–208. [Google Scholar] [CrossRef]
- Sumriddetchkajorn, S.; Somboonkaew, A.; Chanhorm, S. Mobile device-based digital microscopy for education, healthcare, and agriculture. In Proceedings of the 2012 9th International Conference on Electrical Engineering/Electronics, Computer, Telecommunications and Information Technology (ECTI-CON), Phetchaburi, Thailand, 16–18 May 2012; pp. 1–4. [Google Scholar]
- Lajara, R.; Alberola, J.; Pelegrí-Sebastiá, J. A solar energy powered autonomous wireless actuator node for irrigation systems. Sensors 2010, 11, 329–340. [Google Scholar] [CrossRef] [PubMed]
- Li, Z.; Wang, N.; Hong, T.; Franzen, A.; Li, J. Closed-loop drip irrigation control using a hybrid wireless sensor and actuator network. Sci. China Inf. Sci. 2011, 54, 577–588. [Google Scholar] [CrossRef]
- Cardenas-Lailhacar, B.; Dukes, M.D. Precision of soil moisture sensor irrigation controllers under field conditions. Agric. Water Manag. 2010, 97, 666–672. [Google Scholar] [CrossRef]
- Cardenas-Lailhacar, B.; Dukes, M.D.; Miller, G.L. Sensor-based automation of irrigation on bermudagrass during dry weather conditions. J. Irrig. Drain. Eng. 2010, 136, 184–193. [Google Scholar] [CrossRef]
- Pardossi, A.; Incrocci, L.; Incrocci, G.; Malorgio, F.; Battista, P.; Bacci, L.; Rapi, B.; Marzialetti, P.; Hemming, J.; Balendonck, J.; et al. Root zone sensors for irrigation management in intensive agriculture. Sensors 2009, 9, 2809–2835. [Google Scholar] [CrossRef] [PubMed]
- Chávez, J.L.; Varble, J.L.; Andales, A.A. Performance evaluation of selected soil moisture sensors. In Proceedings of the 23rd Annual Central Plains Irrigation Conference, Burlington, CO, USA, 22–23 February 2011; pp. 29–38. [Google Scholar]
- Sudha, M.N.; Valarmathi, M.L.; Babu, A.S. Energy efficient data transmission in automatic irrigation system using wireless sensor networks. Comput. Electron. Agric. 2011, 78, 215–221. [Google Scholar] [CrossRef]
- Tahsimcioğlu, M.S.T.C.; Ministry of Forestry and Water Affairs General Directorate of State Hydraulic Works. Plant Water Consumption Studies in Turkey; Directorate of Survey, Planning and Allocation: Istanbul, Turkey, March 2015.
- Uytun, A.; Pekey, B.; Kalemci, M. Soil Moisture Measurements, 8rd ed.; National Measurement Science Congress: Gebze-Kocaeli, Turkey, 2013; pp. 1–9. [Google Scholar]
Figure 1.
Çorum/Center crop kc values.
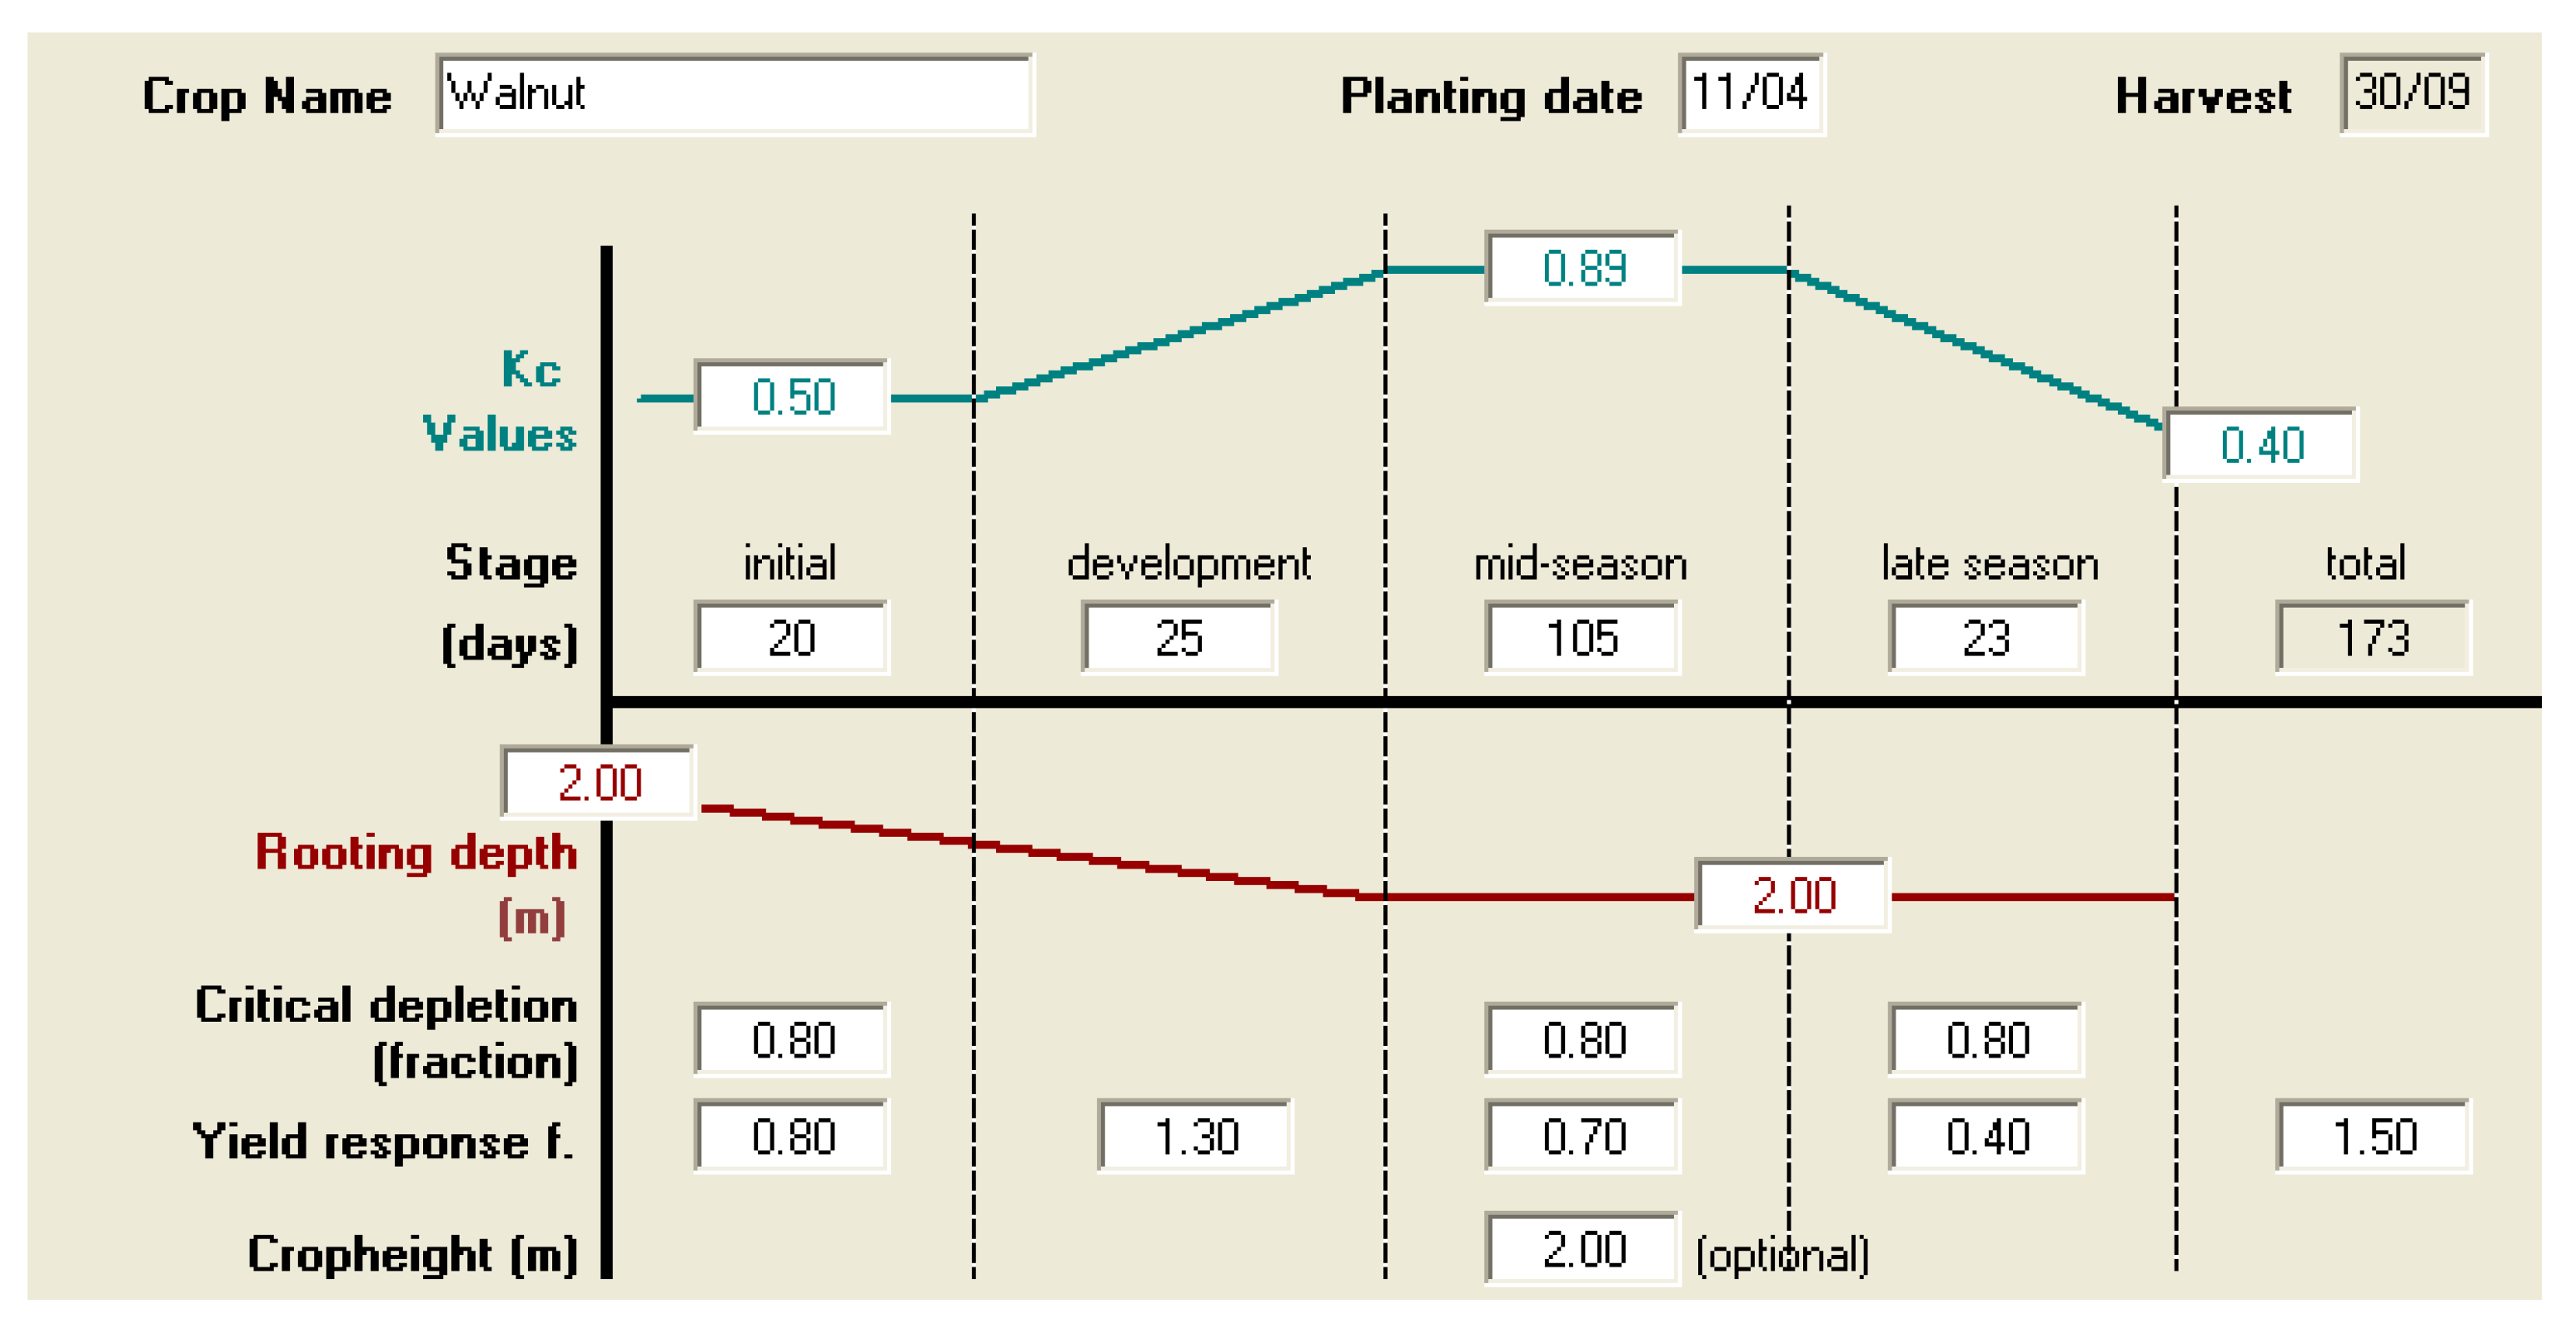
Figure 2.
Soil information belonging to area.
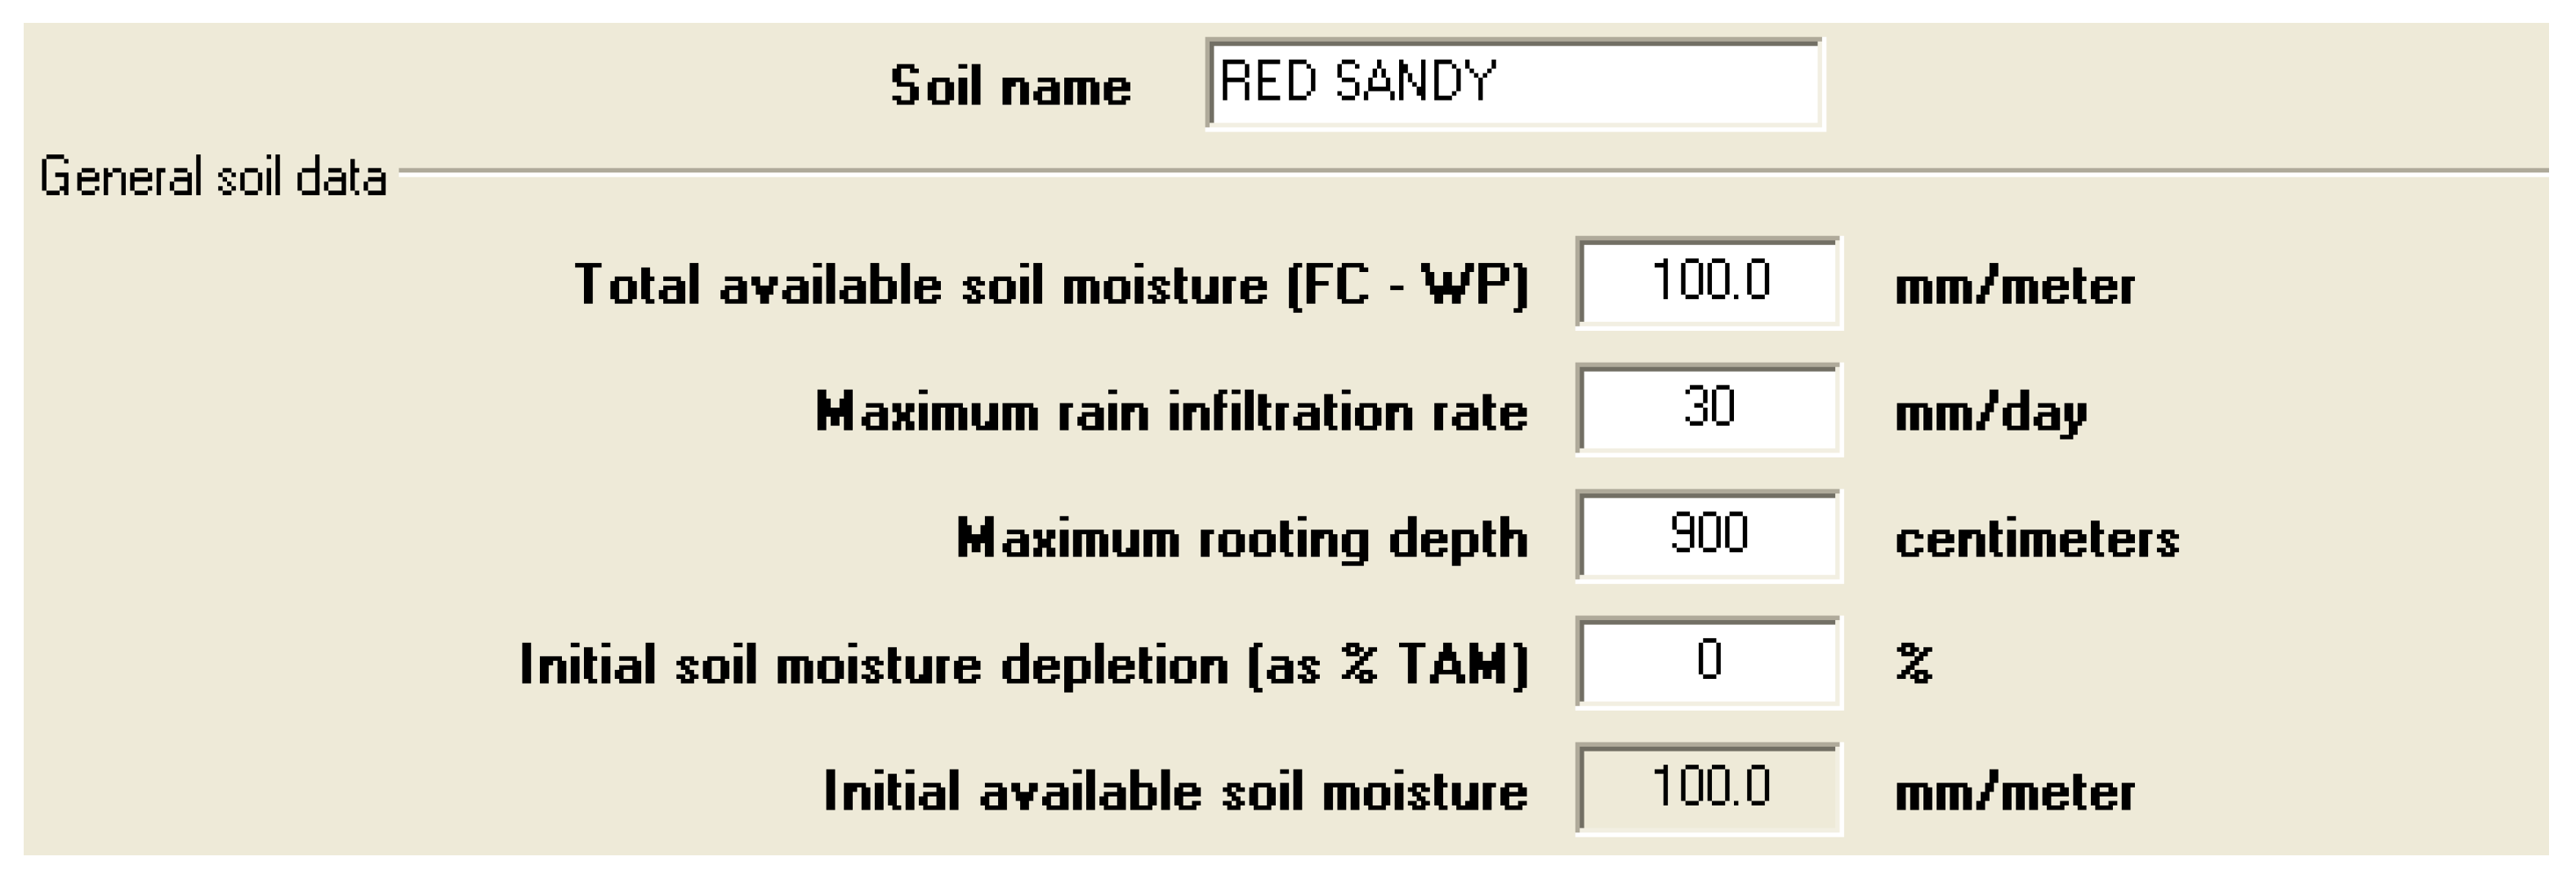
Figure 3.
Control system diagram.
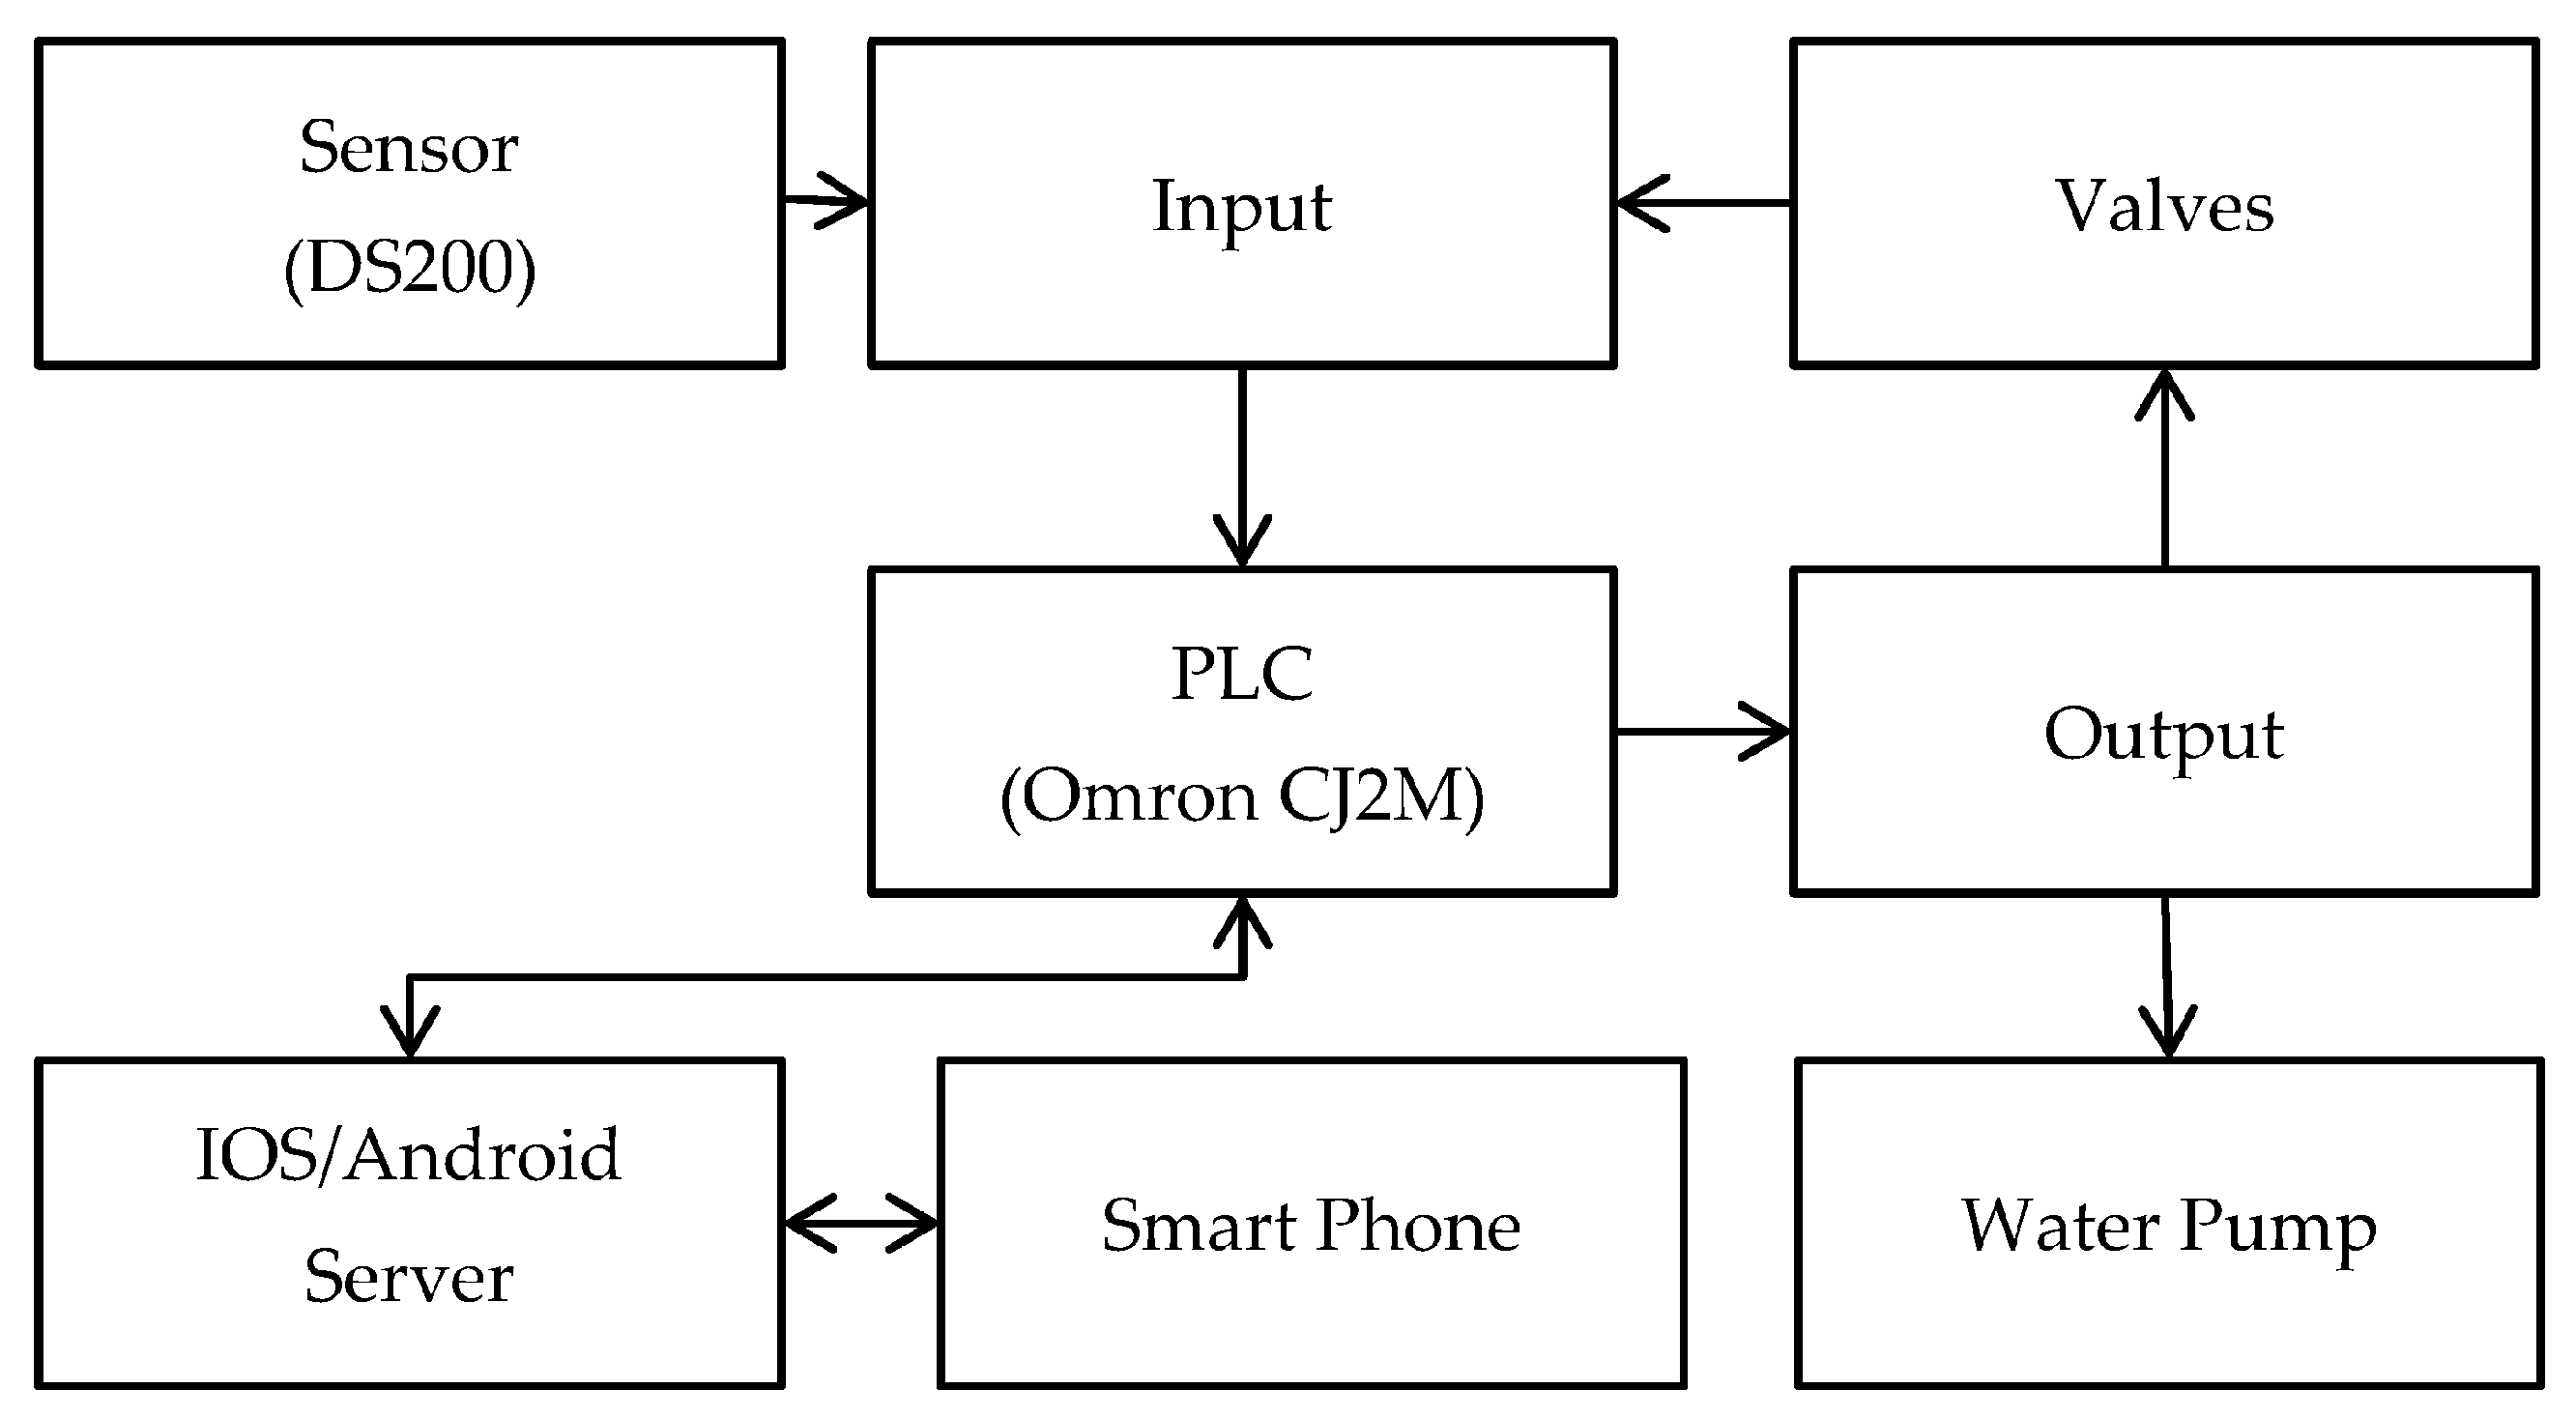
Figure 4.
(a) Sensors placement in the land; (b) Sensors map in the irrigation system.

Figure 5.
Established solar panels.

Figure 6.
Power supply block diagram.
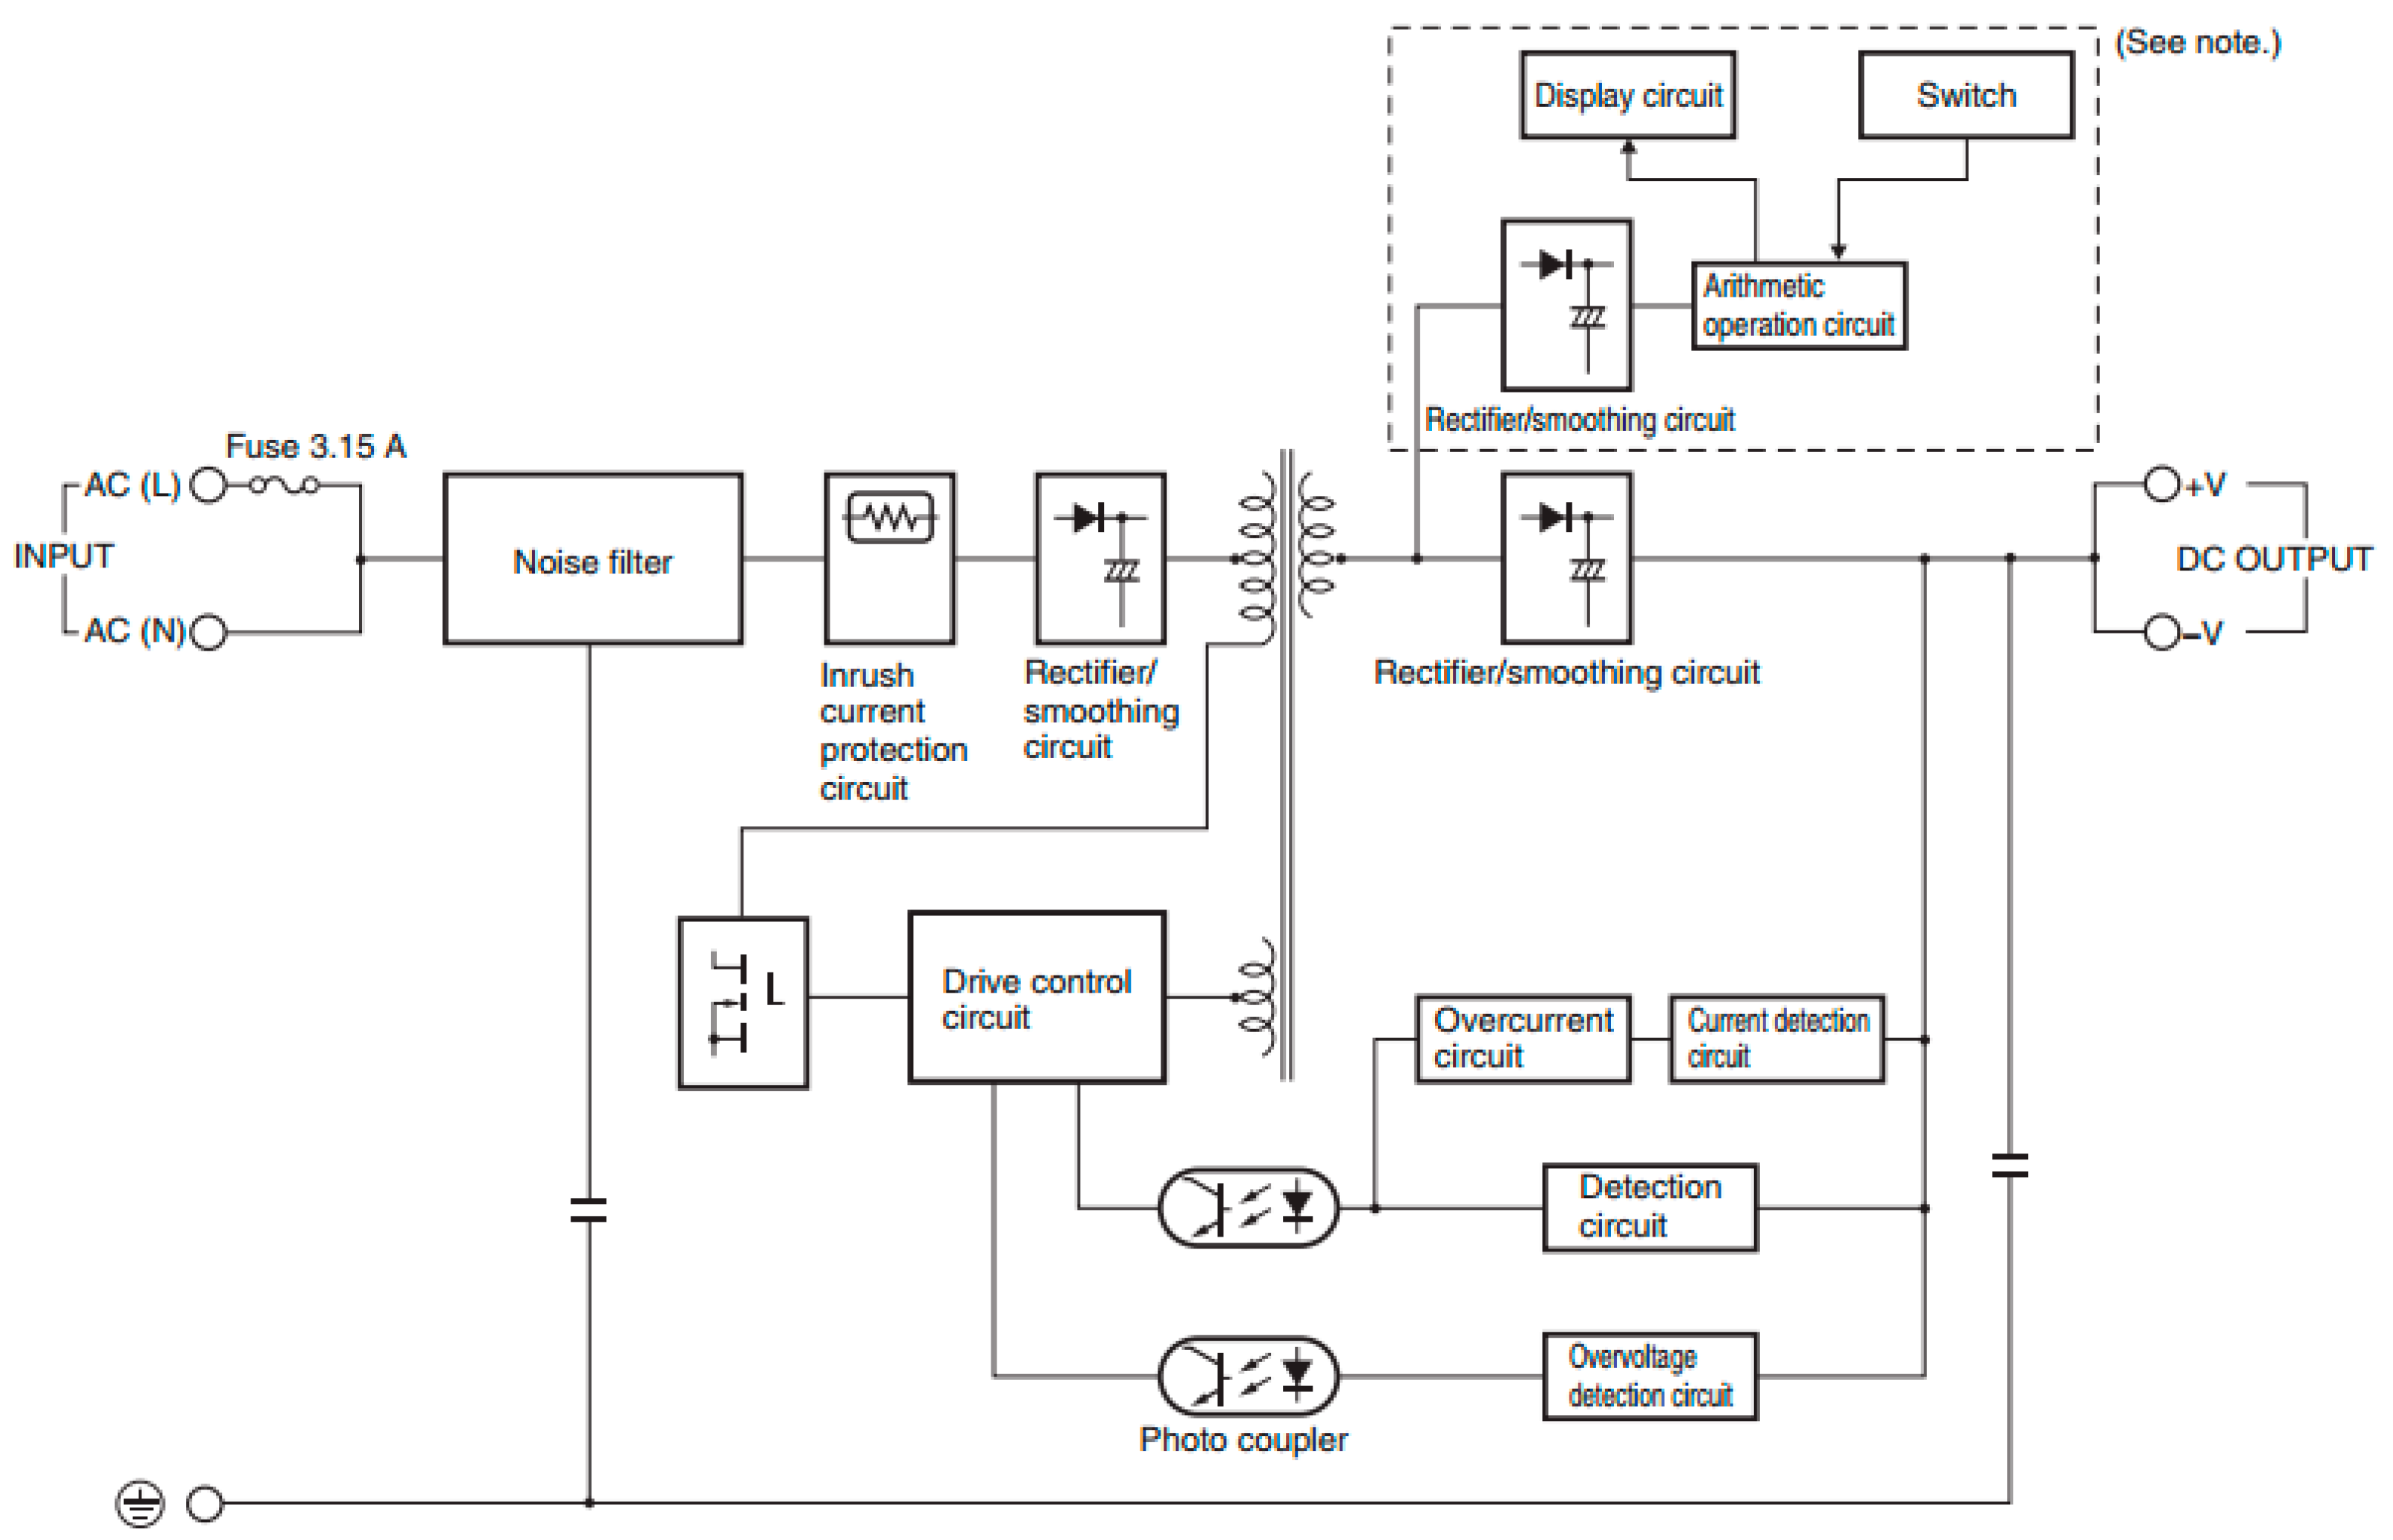
Figure 7.
Block diagram of IOS/Android controlling unit.
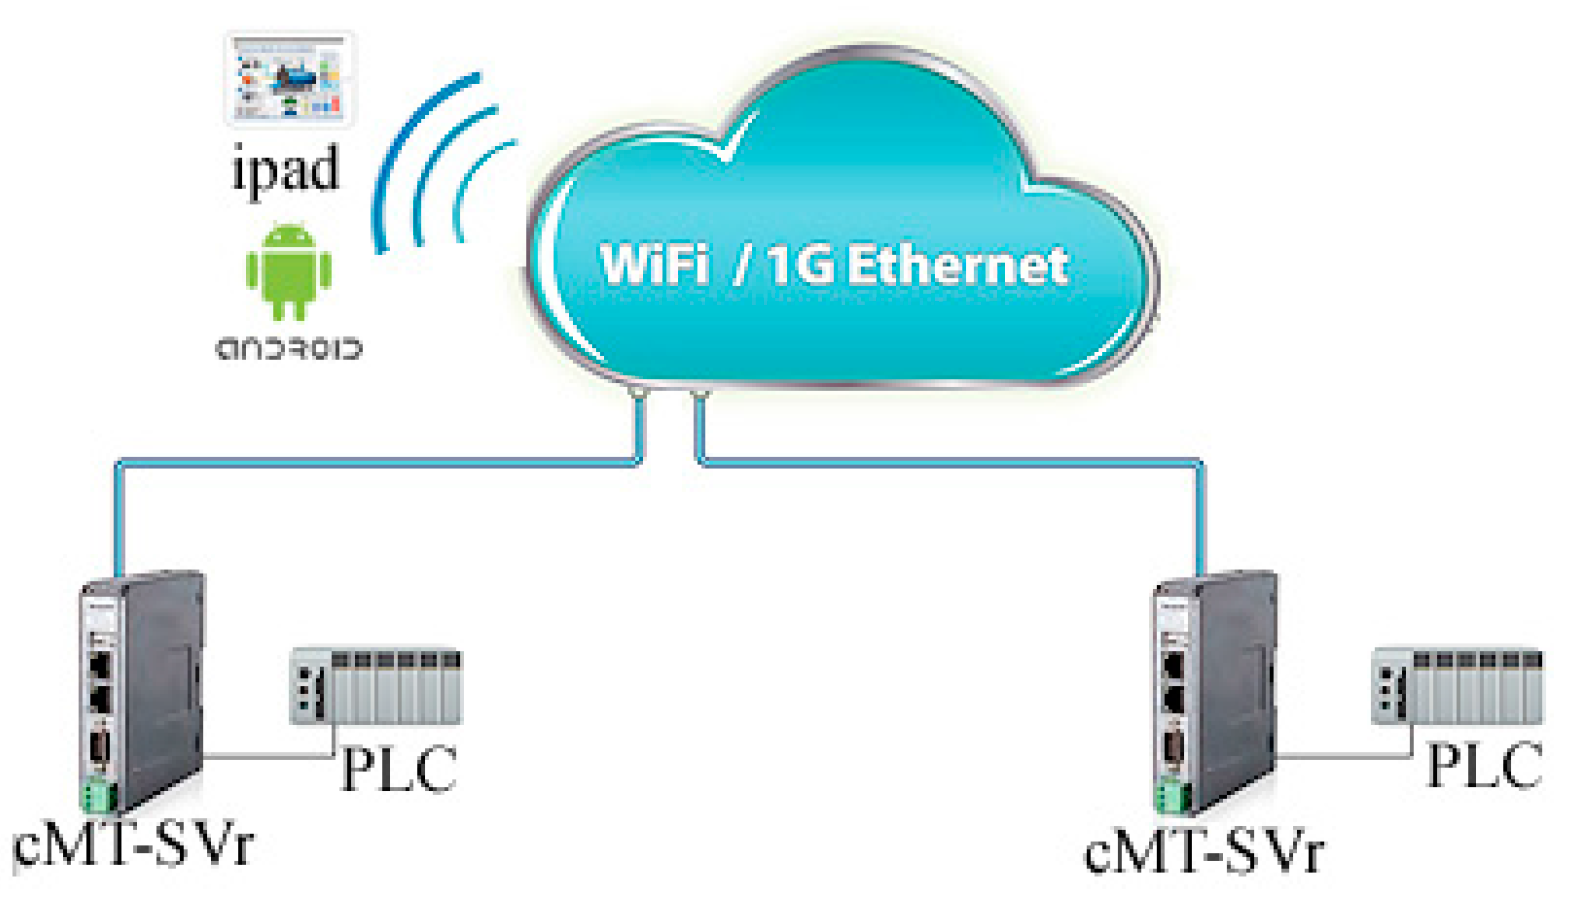
Figure 8.
The flowchart of the software.

Figure 9.
Smart phone monitoring page. (a) Home screen, (b) Sensor Menu, (c) Sensor 1’ e moisture value.
Figure 9.
Smart phone monitoring page. (a) Home screen, (b) Sensor Menu, (c) Sensor 1’ e moisture value.

Figure 10.
Monthly average moisture.

Figure 11.
The average moisture values are occurring in the sensor during the day (Mid. Stage).
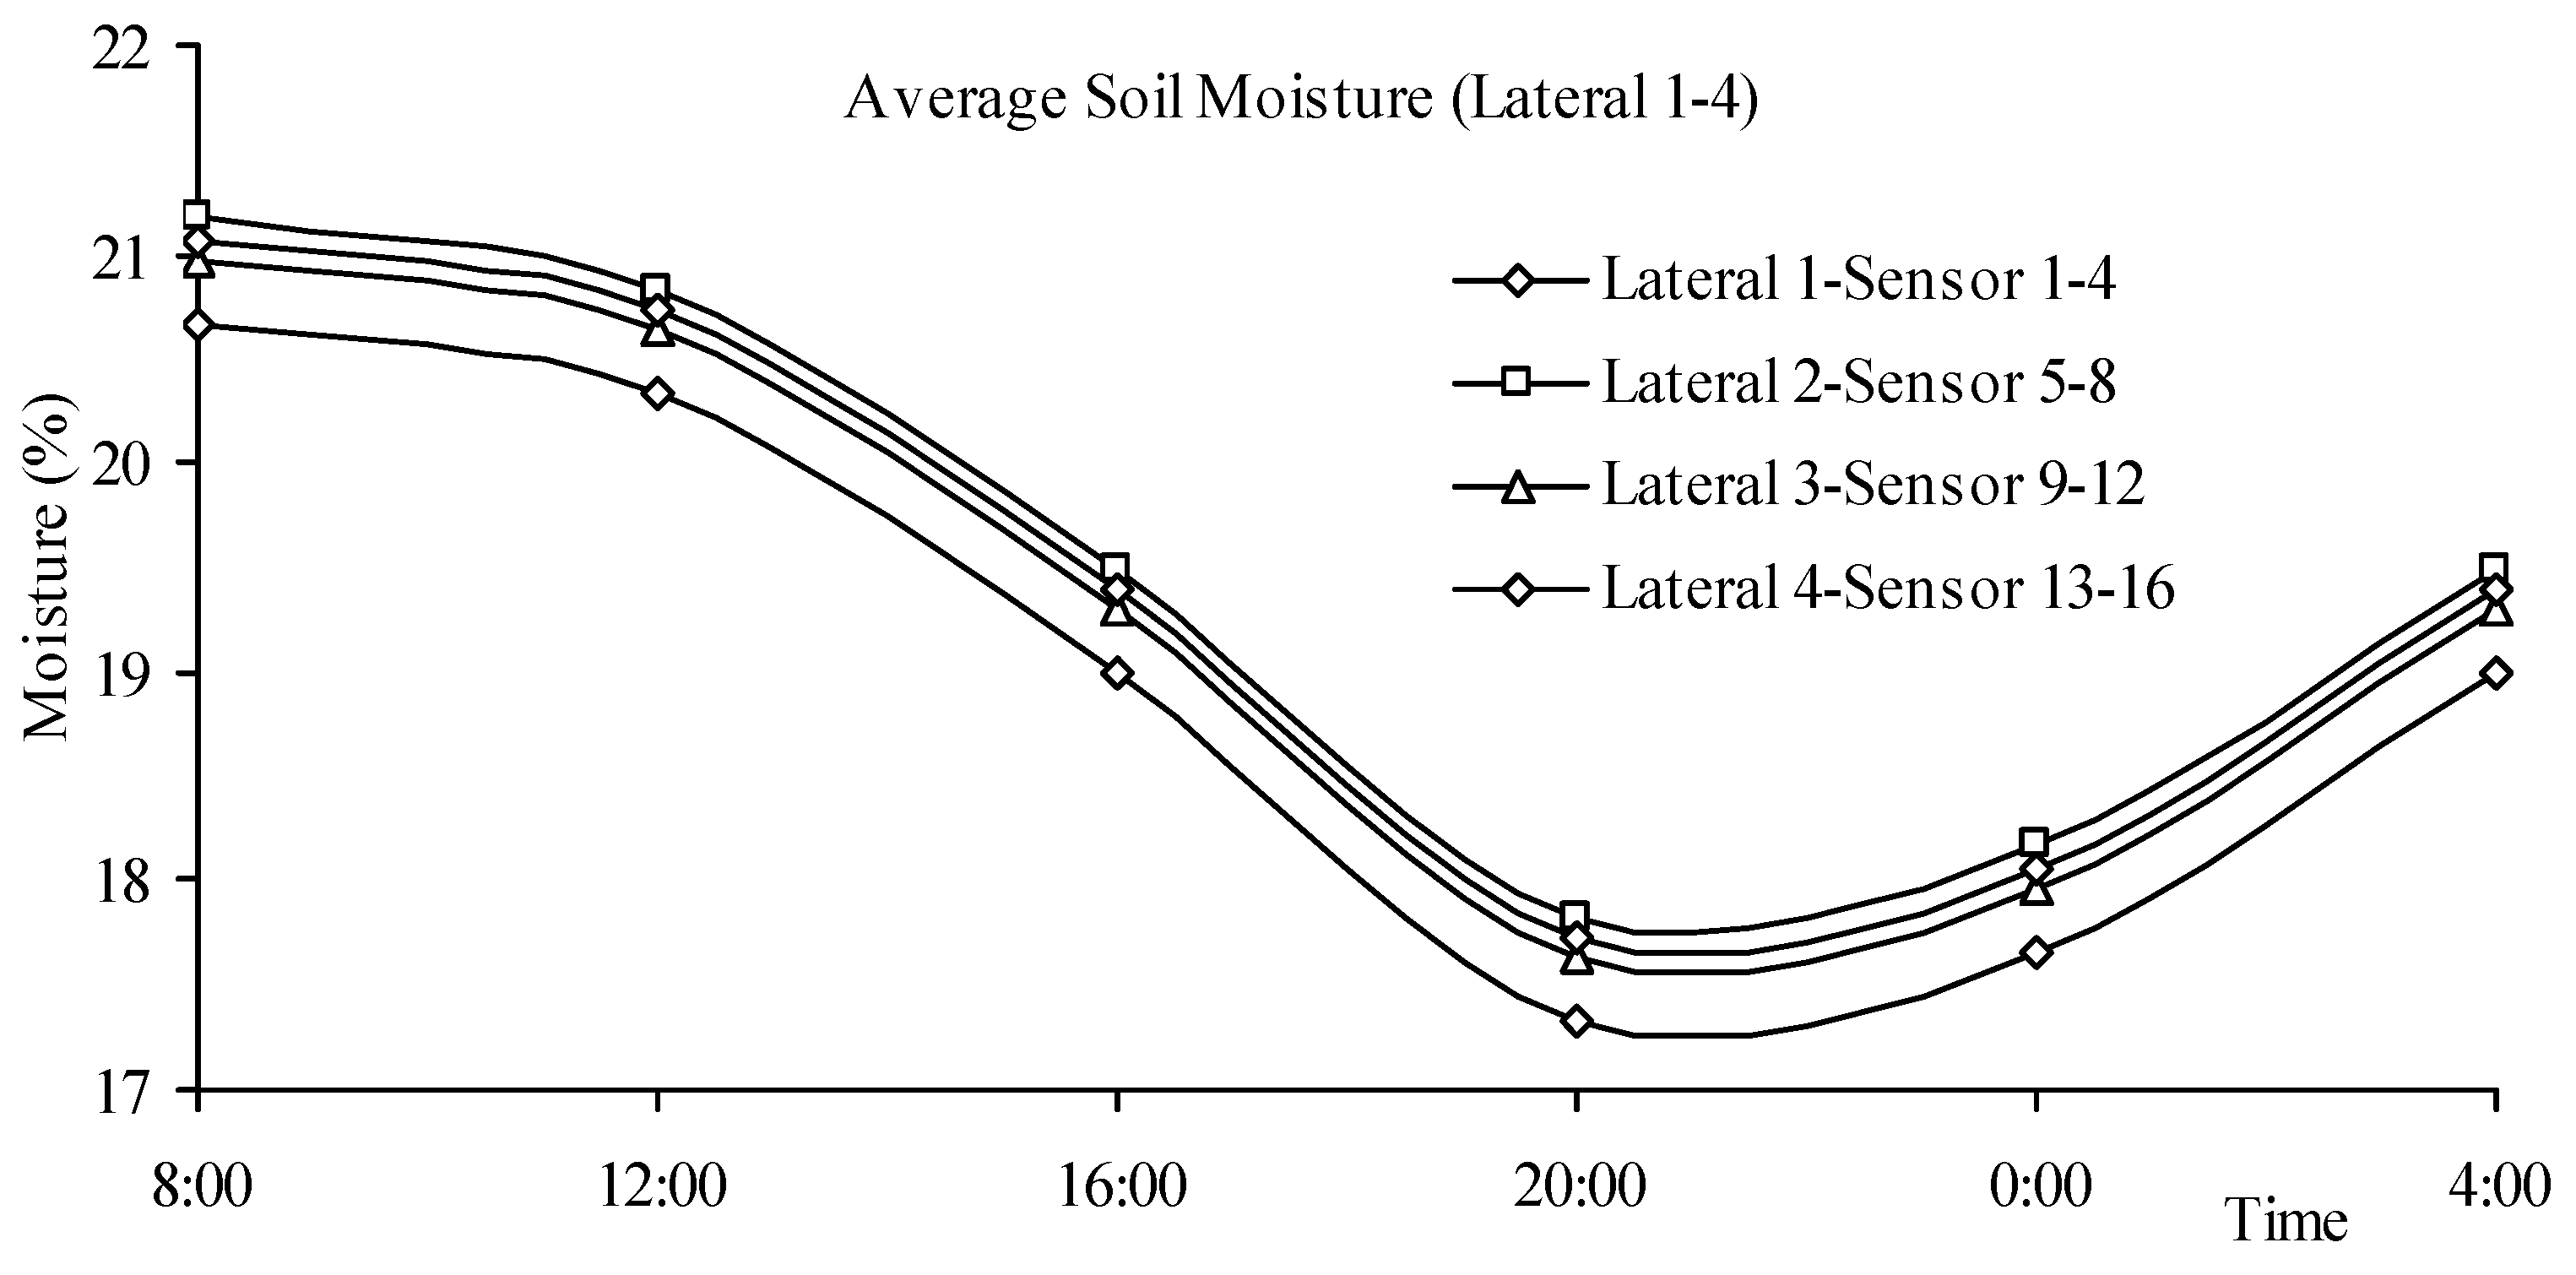
Figure 12.
Int. Stage water requirement.

Figure 13.
Dev. Stage water requirement.

Figure 14.
Mid. Stage water requirement.
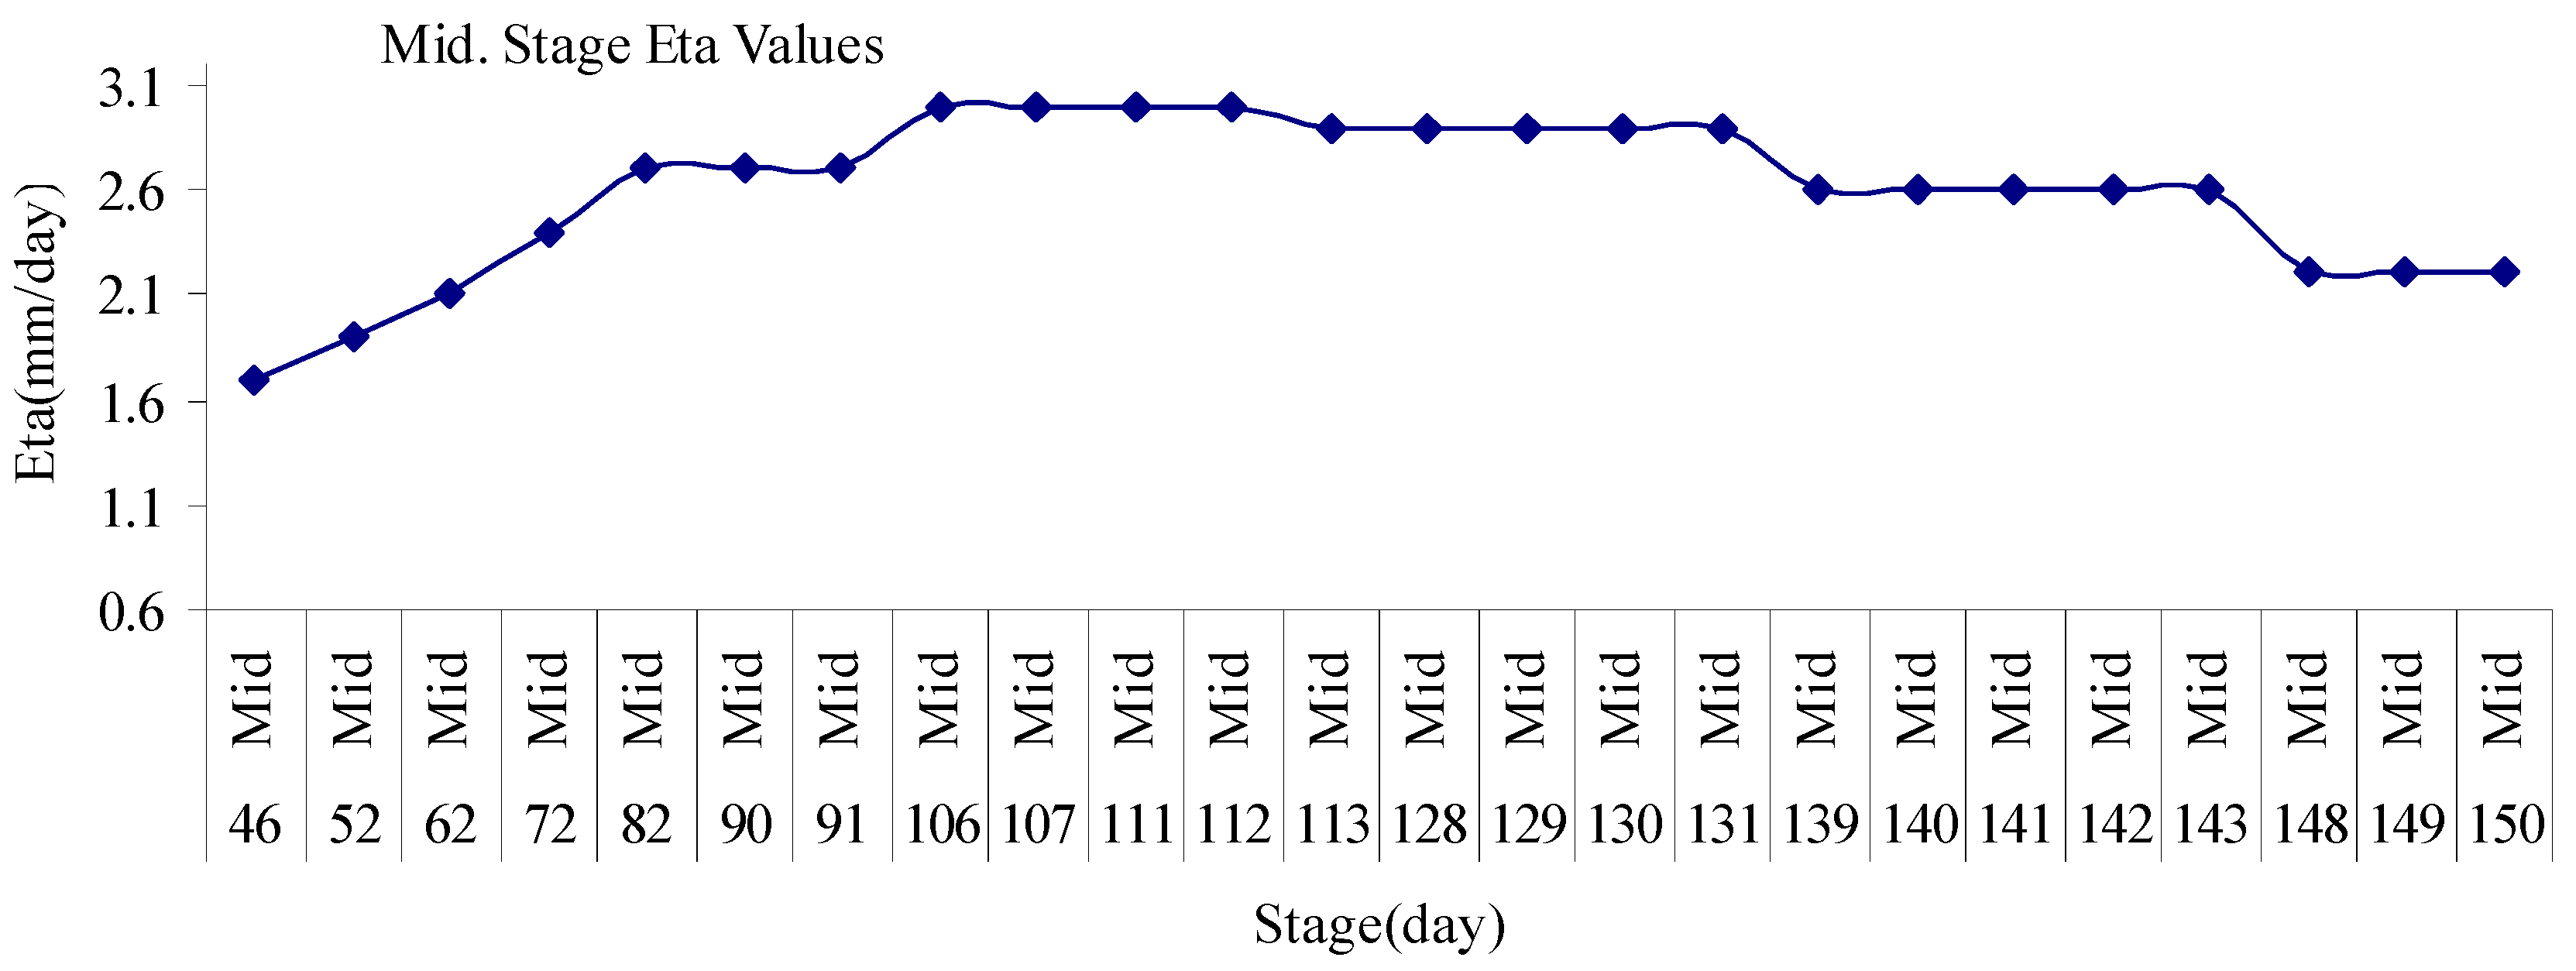
Figure 15.
End stage water requirement.

Figure 16.
Amount of water depending on the stage of plant growth and used amount of water.

Table 1.
Çorum/Center climate/ evapotranspiration (ETo) data.
| Country | Çorum | Latitude | 40.37 °N | Longitude | Station | Merkez |
|---|---|---|---|---|---|---|
| Altitude | 840 m | 34.53 °E | ||||
| Month | Avg. Temp °C | Humidity % | Wind km/day | Sun Hours | Rad MJ/mm2/day | ETo mm/day |
| January | −0.6 | 76 | 1 | 1.9 | 5.3 | 0.39 |
| February | 1.1 | 74 | 2 | 1.9 | 6.9 | 0.58 |
| March | 4.9 | 67 | 2 | 3.4 | 10.8 | 1.08 |
| April | 10.5 | 62 | 2 | 3.2 | 12.9 | 1.70 |
| May | 14.9 | 61 | 2 | 4.1 | 15.6 | 2.41 |
| June | 18.4 | 57 | 2 | 7.0 | 20.3 | 3.32 |
| July | 21.0 | 52 | 2 | 13.5 | 29.0 | 4.72 |
| August | 20.8 | 53 | 2 | 14.9 | 29.0 | 4.56 |
| September | 17.0 | 57 | 2 | 12.2 | 22.2 | 3.06 |
| October | 11.8 | 62 | 2 | 8.8 | 14.5 | 1.57 |
| November | 6.6 | 70 | 2 | 4.5 | 7.7 | 0.71 |
| December | 1.8 | 77 | 2 | 2.0 | 4.8 | 0.44 |
| Average | 10.7 | 64 | 2 | 6.5 | 14.9 | 2.05 |
Table 2.
Çorum/Center rain data.
| Station Çorum-Merkez | Meteorological Data | Effect Rain Method USDA S.C. Method |
|---|---|---|
| Month | Rain | Effect Rain |
| mm | mm | |
| January | 39.5 | 37.0 |
| February | 30.3 | 28.8 |
| March | 37.8 | 35.5 |
| April | 45.9 | 42.5 |
| May | 60.8 | 54.9 |
| June | 49.2 | 45.3 |
| July | 17.4 | 16.9 |
| August | 11.9 | 11.7 |
| September | 20.3 | 19.6 |
| October | 25.0 | 24.0 |
| November | 30.9 | 29.4 |
| December | 43.4 | 40.4 |
| Total | 412.4 | 386.1 |
Table 3.
Crop water requirements.
| ETo Station | Merkez | Plant Factor | Plant Water Consumption | Crop | Walnut | ||
|---|---|---|---|---|---|---|---|
| Rain Station | Çorum-Merkez | Planting Date | 11/04 | ||||
| Month | Decade | Stage | Kc coeff | Etc mm/day | Etc mm/dec | Effect Rain mm/dec | Irrigation Requirement mm/dec |
| April | 2 | Init. | 0.50 | 0.85 | 8.5 | 14.0 | 0.0 |
| April | 3 | Init. | 0.50 | 0.97 | 9.7 | 15.4 | 0.0 |
| May | 1 | Deve. | 0.53 | 1.15 | 11.5 | 17.6 | 0.0 |
| May | 2 | Deve. | 0.58 | 1.39 | 13.9 | 19.3 | 0.0 |
| May | 3 | Mid. | 0.62 | 1.69 | 18.6 | 17.9 | 0.7 |
| June | 1 | Mid. | 0.63 | 1.89 | 18.9 | 16.7 | 2.2 |
| June | 2 | Mid. | 0.63 | 2.08 | 20.8 | 16.0 | 4.8 |
| June | 3 | Mid. | 0.63 | 2.37 | 23.7 | 12.5 | 11.2 |
| July | 1 | Mid. | 0.63 | 2.70 | 27.0 | 8.1 | 18.9 |
| July | 2 | Mid. | 0.63 | 3.01 | 30.1 | 4.6 | 25.5 |
| July | 3 | Mid. | 0.63 | 2.96 | 32.5 | 4.4 | 28.2 |
| August | 1 | Mid. | 0.63 | 2.93 | 29.3 | 4.1 | 25.2 |
| August | 2 | Mid. | 0.63 | 2.92 | 29.2 | 3.3 | 25.9 |
| August | 3 | Mid. | 0.63 | 2.58 | 28.4 | 4.4 | 24.0 |
| September | 1 | Late | 0.62 | 2.21 | 22.1 | 5.8 | 16.3 |
| September | 2 | Late | 0.54 | 1.66 | 16.6 | 6.7 | 9.9 |
| September | 3 | Late | 0.44 | 1.14 | 31.4 | 7.1 | 4.3 |
| 352.1 | 177.8 | 197.0 | |||||
© 2017 by the authors. Licensee MDPI, Basel, Switzerland. This article is an open access article distributed under the terms and conditions of the Creative Commons Attribution (CC BY) license (http://creativecommons.org/licenses/by/4.0/).
Share and Cite
MDPI and ACS Style
Işık, M.F.; Sönmez, Y.; Yılmaz, C.; Özdemir, V.; Yılmaz, E.N. Precision Irrigation System (PIS) Using Sensor Network Technology Integrated with IOS/Android Application. Appl. Sci. 2017, 7, 891. https://doi.org/10.3390/app7090891
AMA Style
Işık MF, Sönmez Y, Yılmaz C, Özdemir V, Yılmaz EN. Precision Irrigation System (PIS) Using Sensor Network Technology Integrated with IOS/Android Application. Applied Sciences. 2017; 7(9):891. https://doi.org/10.3390/app7090891
Chicago/Turabian StyleIşık, Mehmet Fatih, Yusuf Sönmez, Cemal Yılmaz, Veysel Özdemir, and Ercan Nurcan Yılmaz. 2017. "Precision Irrigation System (PIS) Using Sensor Network Technology Integrated with IOS/Android Application" Applied Sciences 7, no. 9: 891. https://doi.org/10.3390/app7090891
Note that from the first issue of 2016, this journal uses article numbers instead of page numbers. See further details here.