1. Introduction
In exploding wire experiments, a large current on the order of
A flows through a metallic wire, typically with a diameter of micrometers and centimeters length, causing the transformation of the metal into liquid, gas, and finally plasma by the fast heating due to the Joule effect [
1]. It is a phenomenon long-known to science [
2], and has subsequently been used in multiple scientific investigations [
3,
4,
5]. Electrical energy absorbed by the exploding wire system until its transformation into plasma is a key characteristic in the further development of the phenomenon, as it influences the initial plasma state, prior to its last expansion [
6] . Indeed, the state of an expanding wire in vacuum and its homogeneity are determined by the absorbed electrical energy [
7] and the current rate [
8]. Shortly after the beginning of the current discharge, when part of the wire material has become gas, its electrical conductivity is so small that the current is almost halted until further gas heating allows for the plasma formation [
3,
9], provided that the wire is surrounded by a non-conducting medium, in order to avoid coronal plasma formation [
10]. This current interruption is commonly known as dark pause. In experiments with a small current rate (under 20 A/ns) and with a wire of large enough mass, the dark pause becomes a very noticeable feature of the wire explosion.
Plasma constitutive properties can be measured indirectly through the appropriate treatment of the electrical signals, for example, as in [
11]. Among these properties, plasma electrical conductivity has been measured with an exploding wire setup for different materials and plasma conditions [
12,
13,
14,
15].
Exploding wire setups had previously been used to confirm theoretical models of the conductivity in warm dense matter (WDM) studies [
16], and to improve previous models [
17]. Both models and experimental works have large error factors (at least a factor of two in the case of Lee [
18]) due to the difficulty of obtaining matter in clear and defined reproducible conditions, and due also to the problem of performing the measurements. These difficulties can be overcome with the use of more direct methods, such as the short pulsed laser used for the measurement of the resistivity of aluminum under solid density conditions and a broad range of temperatures [
19].
As all those measurements and calculations are made in WDM conditions, more classical phases (e.g., a metallic neutral gas) have not been addressed. Specifically, in the classical limit, during the evolution from solid to plasma the wire must previously pass through a gas state that is reached during the dark pause. Usually, this pause is short and difficult to analyze, and therefore the measurement of the resistivity of the metallic gas—the main state during the dark pause—has not previously been conducted. Here we present the first measurements for the limits of neutral copper gas resistivity, using an exploding wire configuration, tailored such that the dark pause is long enough to allow for the measurement of the gas phase characteristics.
Experimental parameters were chosen in order to explore the classical states of matter, in contrast with more usual exploding wire experiments that explore WDM conditions. The adequate conditions to this purpose requires: (a) a skin depth larger than the wire diameter; (b) a dark pause duration larger than 1
s; (c) a uniform discharge along the wire length without re-strikes or large instabilities; (d) a sufficient amount of mass so that the heating rate is not so fast; and (d) that the wire impedance is large enough to control the current discharge until the plasma formation. To meet these conditions, the carefully adjusted experimental parameters were: the wire diameter (50
m) and wire length (5.1 cm) to provide an adequate amount of mass, a slow current ratio of a maximum of 10 A/ns or less (to be compared with values higher than 50 A/ns in other exploding wire experiments [
8]), and the low value for the high voltage, with a maximum of 25 kV.
2. Experiment and Physical Model Description
Experiments were performed with the ALEX (
ALambre EXplosivo, exploding wire in Spanish) system, shown schematically in
Figure 1.
ALEX is formed by two capacitors in parallel, 1.1 F each, connected to a high voltage source, maximum charging voltage 60 kV, which discharges the capacitors through a metallic wire surrounded by open air when the spark gap is closed by a high-voltage trigger pulse.
In order to perform the measurements of the resistivity limits described here, it is necessary to know the radial expansion of the metallic gas. In this work, the radial expansion was obtained from direct shadowgraphy images recorded with a streak camera, a Hamamtsu C7700. Voltages from probes 2 and 3 and the Rogowski coil signal, along with the photodiode signal, were also recorded in an oscilloscope enclosed in a Faraday cage room. Voltage and Rogowski coil probes were designed, mounted, and calibrated (3% error) in the laboratory to the frequencies of interest in these experiments. The high-voltage trigger pulse was synchronized with the streak camera unit as depicted in
Figure 1 with the use of a DG-535 delay generator. The photodiode signal was used to synchronize the streak camera photographs with the electrical signals with a precision of ± 20 ns. Copper wires with fixed length of 5.1 cm and diameter of 50
m were used in these experiments. As was already written, these parameters were chosen to ensure a long dark pause, ≈1
s, which allows for a better study of the metallic gas produced by the exploding wire.
A typical result of the shadowgraphy streak images of the exploding wire with the associated voltage and current traces is shown in
Figure 2, where the dark pause is clearly visible in either the image or the electrical traces. The first small peak of the current at 2
s corresponds to the transformation of the solid wire into liquid due to the Joule heating. The dark pause that begins when the current reduces its value is the next step of the exploding wire process in our experiments, and the moment when the gas forms from the liquid central core and expands is evidenced in the streak image by a dark radial expansion (the metallic gas absorbs the backlight). The later appearance of the plasma by neutral gas heating due to the electrical current is marked in the voltage signal by the negative slope; meanwhile, the presence of plasma at the expansion outer surface is marked by the maximum in the current signal. This plasma presence in the outer expansion surface is also in coincidence with the maximum illumination in the shadowgraphy image, as can be observed in
Figure 2.
Notice that the streak image is not able to resolve the structure of the gas expansion and its central liquid core, as only the external surface of the expansion is visible. Therefore, as is explained in the next section, only data of this external surface can be measured, independently of the initial energy of the exploding wire system.
Different charging voltages—10, 15, 18, 21 and 25 kV—were employed to ensure that measurements of the resistivity limits (later explained in this section) were independent of the initial electrical energies, and therefore of the dynamical behavior of the metallic wire [
5].
The voltage across the wire,
, was measured by means of the mentioned two voltage dividers, as shown in
Figure 1. Probe 2 measures the voltage drop,
, which includes part of the anode, the wire, the cathode, and the returning path to ground. Instead, probe 3 measures the voltage drop,
, that only includes the cathode and the returning path to ground. Therefore, the measured voltage difference,
, is
where
is the voltage drop in the part of the anode included in the voltage measured by probe 2.
During calibration, the wire was removed and the electrodes were displaced until they were in electrical contact, in which case the measured voltage difference corresponds only to the anode. Voltage on the anode can be modeled by a lumped element model; that is
where the current derivative
is measured with the Rogowski coil and its numerical integration gives the current
I, while the lumped parameters
and
are obtained using a multiple linear regression analysis of the dependent variable
and the independent variables
I and
.
Note that during the last stage of the exploding wire discharge, after the plasma is formed, it holds that due to the high conductivity of the plasma. Therefore, the measured signal during the last part of the discharge corresponds to the voltage drop in the anode, as in the short circuit configuration. This means that this last part of the signals can also be used to determine the lumped parameters of the anode.
Once the lumped parameters of the anode are known, the voltage drop across the wire is obtained from the measurements of voltage, current, and its derivative as
The voltage across the wire is composed of resistive and inductive parts. Integrating the Faraday law of induction using a loop through the lumped elements of the circuit and the border of the wire, indicated by subindex
b, we get
where
is the magnetic flux and
the electric field in a system locally fixed to the wire.
Since the magnetic flux is calculated over the area enclosed by the whole circuit, and taking into account that there is no electrical current circulating by the atmospheric air beyond the border of the expanded wire, the first term on the right side in (
4) can be written as
where
is a geometrical function equivalent to an inductance. In our circuit, the returning conductor is a plane plate placed at a distance
d from the wire, much smaller than the distance to the rest of the circuit; therefore,
can be approximated by
with
l being the length of the wire and
its radius (which varies with time).
Then, according to (
3)–(
6), the integral of the electric field along the border can be obtained from measurements as
Assuming an Ohm’s law for the wire,
, being
the electrical resistivity and
the current density, we can define the resistive voltage drop in the boundary layer of the wire as
3. Resistivity Limit Values
Although the resistive voltage
may be obtained experimentally, it is not simple to calculate the resistivity of the wire from (
8), unless the current density is known. Unfortunately, there are no simple probes that are able to measure the current density inside radially expanding wires. Therefore, we will discuss what valuable information can be extracted when the electrical current density distribution is unknown.
If the whole current is circulating through the wire, the integration of
across a section of the wire,
, gives the total current
So, it is possible to define a mean current density as
where
S is the section of the wire. Assuming a uniform current density in the radial direction, a naive estimate of the mean resistivity is obtained from (
8) as
where
is obtained from the electrical signals (
7).
This value will represent the resistivity of the wire, and
R its resistance, as long as a relatively uniform current density flows in the wire, which is not always the case in the dark pause—for example, during the transient stage at the very beginning of the discharge or when different states coexist [
20].
When diffusion of the current is the dominating phenomenon inside the wire, a large variation of the current density can be produced. This can also be seen by using an integration loop that goes by the border and returns by another different path inside the wire (e.g., path
a). According to Faraday’s law of induction, the variation of the enclosed magnetic flux inside the wire,
, is
This means that even in a region of uniform resistivity, the current density may vary considerably depending on the time derivative of the magnetic flux in that region. This occurs in a time interval smaller than diffusion time, or when the skin depth is smaller than the radius of the wire.
In the case in which the variation of the magnetic flux inside the wire is negligible (usually expected in time scales larger than the diffusion time), that is
the ohmic voltage drop becomes independent of the path
Such is the case of the experiments here presented for most of the dark pause, because its duration is much larger than the diffusion time, and the skin depth value for copper at the circuit frequency is on the order of 120
m—more than two times the wire radius. In order to use (
14) in a general case, care should be taken in identifying the period of time where the magnetic flux variation inside the system is negligible.
When two states coexist in the wire system, although the voltage drop is the same in both states, the current density will be larger in the state of smaller resistivity. This fact is observed in the numerical simulations mentioned below, where a liquid inner core surrounded by a gaseous outer layer is present during the dark pause, and the current density is not uniformly distributed between the gas and liquid states.
Using cylindrical symmetry, i.e., only dependence on radius
r, as it is was observed during the dark pause, from (
14) we can write
where the constant in space varies with time. Evaluating the constant at the boundary, the variation of the current density along the radius depends on the resistivity as
From this, the current is obtained by integrating on the cross-section of the wire
Again, considering cylindrical symmetry, (
8) can be written as
then, from (
17) and using
we can write
Assuming that the inner liquid and outer neutral metallic gas regions have uniform—although different—resistivity values, the above becomes
or in a more compact form,
where
and
are the resistance of each phase defined as in (
19). Notice that the total resistance of the wire corresponds to a parallel of the resistance of the liquid and the gas phases, but from the electrical signals it is not possible to determine the relative contribution of each state to the total resistance. Anyway, the total resistivity represents a limit to each individual resistance:
Then, a mean resistivity for each state,
, is defined as
where
is the cross-section of the inner core, and
the cross-section of the outer core. According to (
22), a lower limit for the resistivity can be determined as
for the liquid, and
in the case of the neutral metallic gas.
Note that the gas expands much more than the liquid, then its cross section is much larger than the one of the liquid. Therefore, the section of the gas can be taken as the total section of the expanded wire; that is
By measuring the dependence of the boundary radius,
, with time and also the electrical signals, the lower bound of the mean gas resistivity is given as
In principle, a similar procedure may be used to obtain a lower bound for the resistivity of the metallic liquid. The problem is that, from the measurements, there is no simple way to determine the physical limit between liquid and gas phases, and therefore the section of this region, , cannot be estimated in our present experiments.
In order to estimate an upper limit for the gas resistivity, it is necessary to consider the energy transfer from the electrical circuit to the exploding wire during the dark pause.
During the dark pause, which starts when the neutral gas is formed in the outer layer and lasts until the ionization begins, the metallic neutral gas is heated from the boiling point to the ionizing point by Joule heating. Because the gas resistance limits the current in the circuit, Joule heating in the gas state will be larger than in the liquid phase. In such a case, vaporization of the liquid will progress from the liquid/gas interface to the center of the liquid cylinder, creating a vaporization wave. This process is similar to the one described in [
21] for the liquefaction of a solid metallic wire. So, the energy received by the gas due to Joule heating also provides the energy for vaporization of the inner liquid core by means of this vaporization wave.
The power for the Joule heating of the gas is
which—again using the cylindrical symmetry of the wire expansion and (
18)—can be rewritten as
In our geometry,
, and recalling the definition of
, the above becomes
The energy provided to the gas up to a given time
t should be at least the difference of enthalpy between the gas at that temperature and the same amount of mass in liquid state at boiling temperature; that is,
where
T is the gas temperature at time
t,
n the number of moles in the gas state,
the molar heat capacity at constant pressure,
the boiling temperature, and
is the latent heat of vaporization. Note that the last term on the right side of the equation accounts for the liquid vaporization in the interface.
As a matter of fact, from the experiments we find that
during the dark pause, except for a few hundred of nanoseconds at the beginning of the discharge. On the other hand, the gas resistance is expected to be relatively constant, because as the wire is heated, the resistivity increases but the section also increases because of the expansion. Therefore, the integration in time of the joule power from the instant when the boiling starts,
, up to a given time instant
t, can be estimated as
where
is a mean value of the resistance of the gas. This relationship provides an upper limit for the gas resistance as a function of time up to the beginning of the ionization phase,
(e.g.,
s in
Figure 2). Using (
24), this upper limit for the resistivity is obtained as
In order to evaluate this limit, and considering that both temperature and gas number of moles increase monotonically with time, a first approach is to use a linear dependence with time of both number of moles and temperature:
where
is the total number of moles, and
is the gas temperature at the beginning of the ionization. This relation was confirmed, within 20%, by simulations explained below. Although Equation (
34) represents a limit, it should be used carefully at the beginning of the discharge, because the current density is not uniform due to its diffusion, and (
15) is not valid.
In the electrical signals, it is possible to identify the time when the boil starts and that of the ionization. Therefore, (
34) can be evaluated in these extreme points (extreme in the sense of the start and end of the dark pause). Because the duration of the dark pause depends on the initial voltage, in order to compare different experimental measurements at different voltages, we decided to measure the resistivity limits as a function of the absorbed energy, rather than the time coordinate.
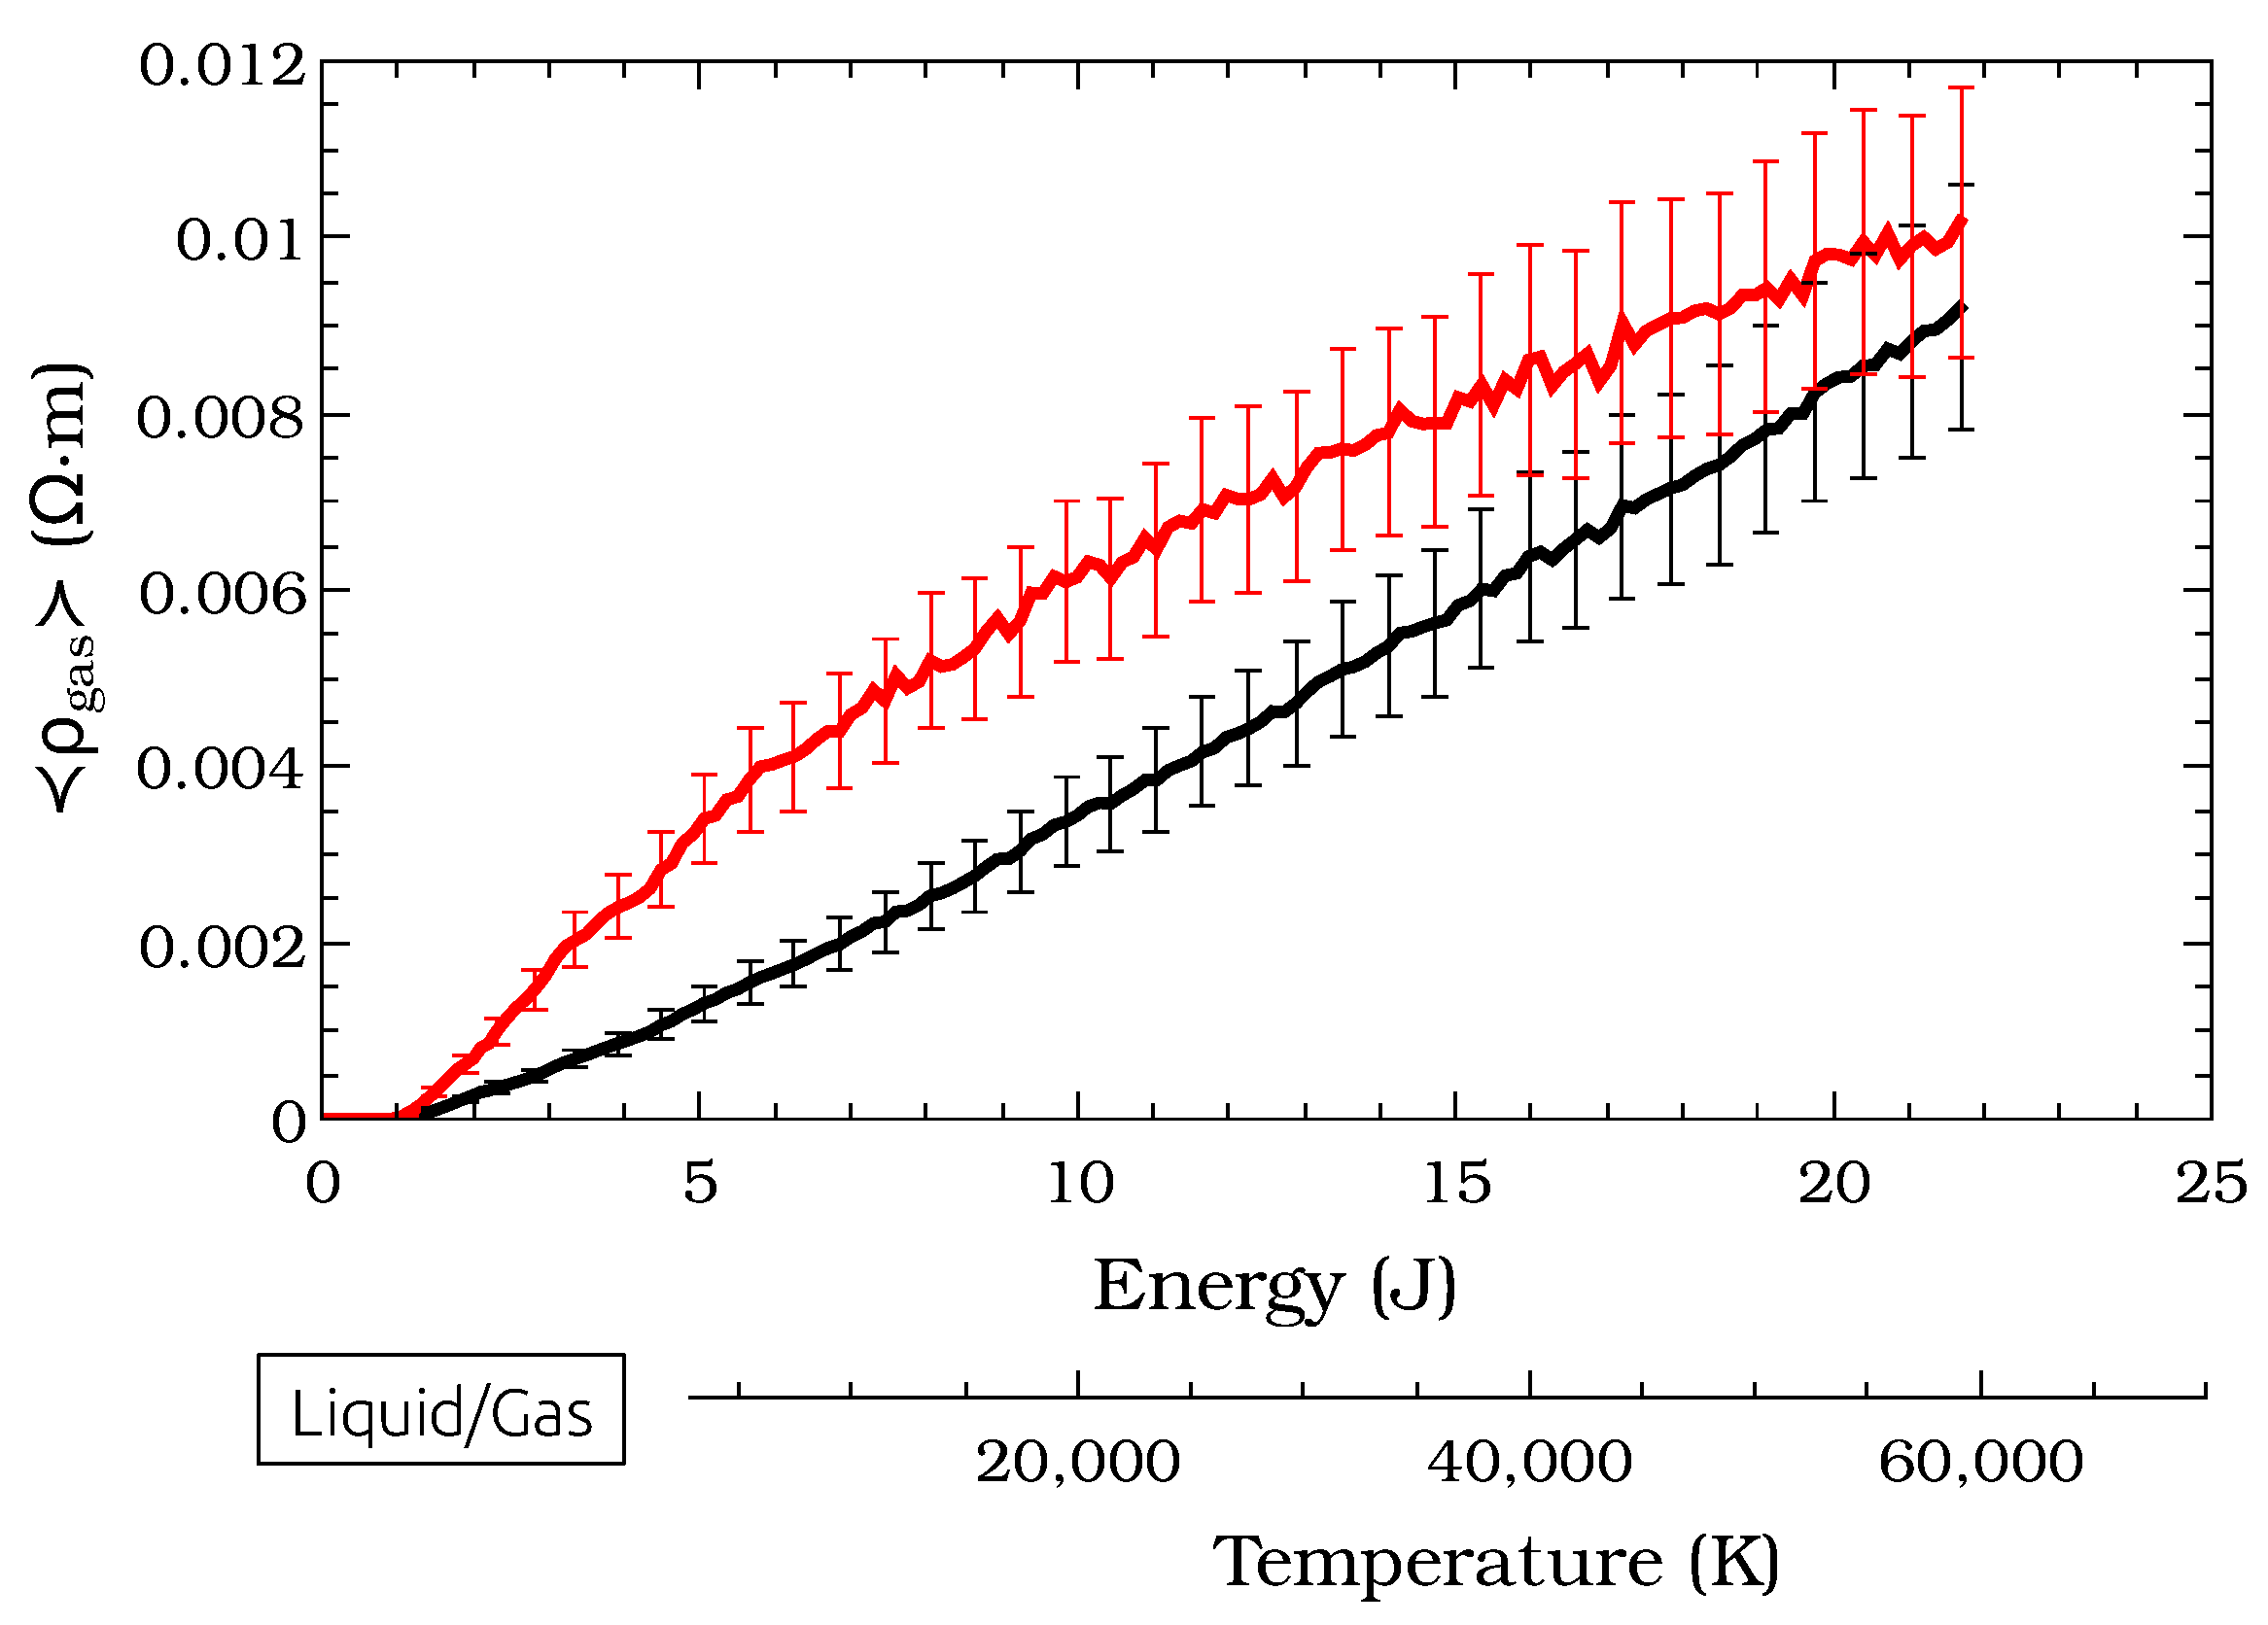
In
Figure 3, the values of the two previously deduced limits, (
28) and (
34), averaged over all different voltages are plotted as a function of absorbed energy. Measurement error is statistical, mainly due to the oscillations in the radial expansion along the longitudinal coordinate. Since only an axial slice of the radial expansion is visible with the streak camera, results are sensible to small variations produced from shot to shot in the longitudinal coordinate.
From the radial expansion of the gas obtained with the streak camera, it is possible to estimate the pressure and the density in the gas. Using the Rankine–Hugoniot relationship for the shock into the air at atmospheric pressure and ambient temperature, the pressure ranges between 10 and 100 atm. From the radius of the expanded gas at the end of the dark pause, a density of cm is estimated for the metallic gas. The absence of radiation coming from the expanding gas is also noticeable, indicating a very low or null degree of ionization. These values show that the metallic gas can be considered as a classic gas.
In order to check the hypotheses and the values of the limits of the resistivity presented here, the experiment was simulated using a simplified 1D version of a full 3D multi-component (neutrals, ions, and electrons), two temperature, arbitrary, Lagrangian–Eulerian, finite volume code [
22]. The coupling with the exploding wire experiment is described in [
23].
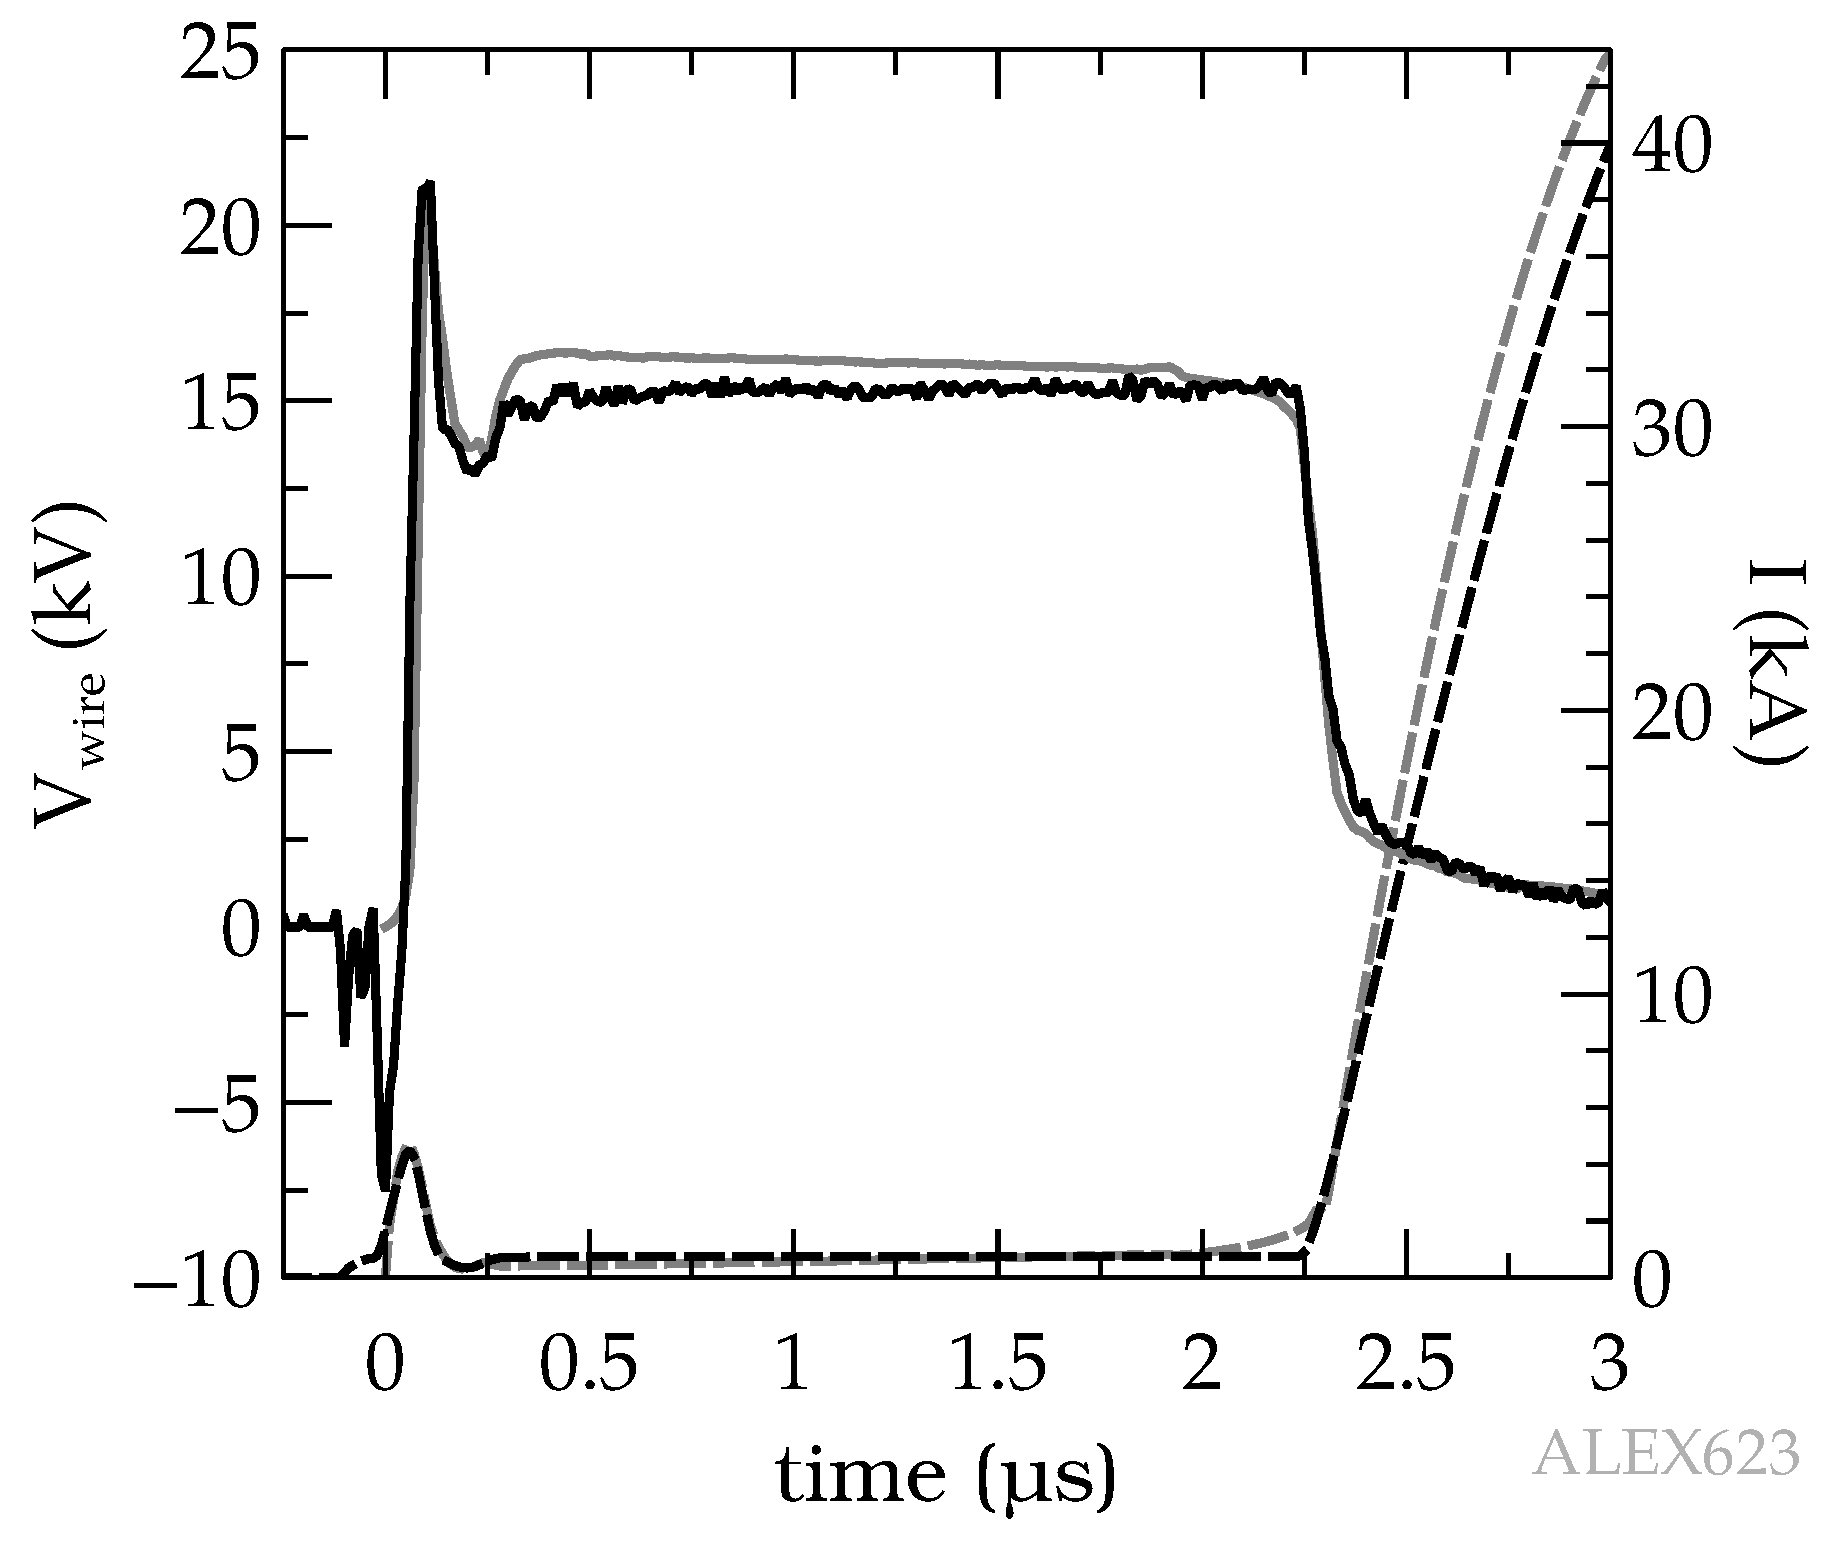
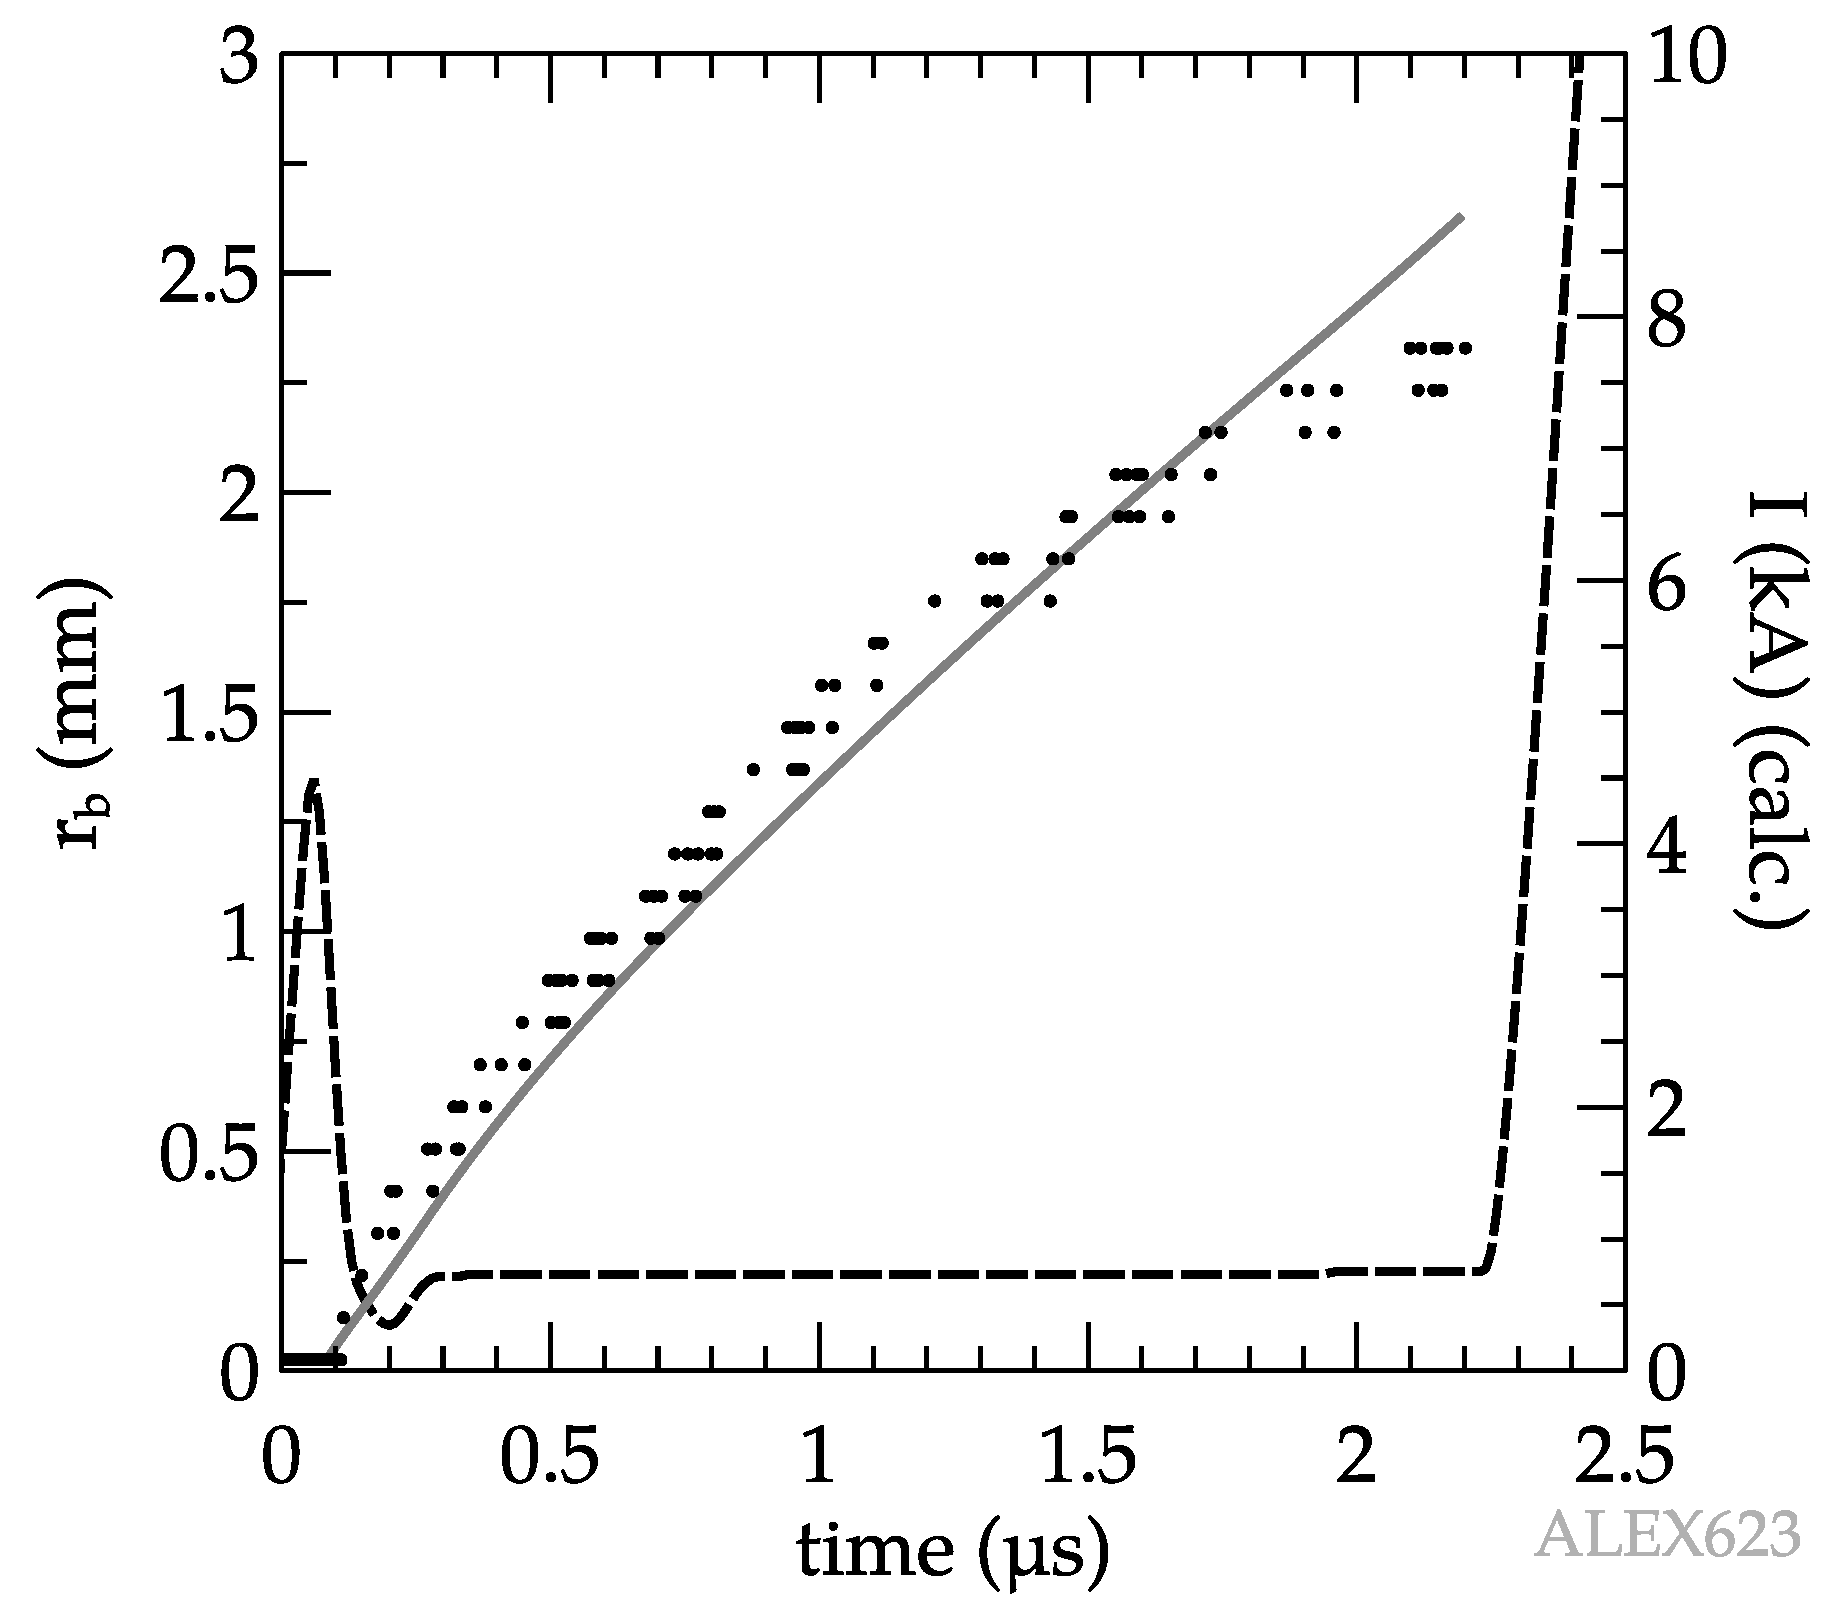
Using a mean value between the upper and lower resistivity limits, many features of the electrical signals are well reproduced. As
Figure 4 shows, simulated and experimental values of the initial peak of the voltage are in very good agreement. Time length of the dark pause—marked both by the voltage and current plateau and the slope of rise up (down) of the current (voltage) at the end of the dark pause—is also very well reproduced by the calculations. Similar observations can be made about the values of the radial border of the plasma expansion, as shown in
Figure 5. It is worth mentioning that changes in the mean resistivity value used in the code as small as 10% lead to durations of the dark pause which are noticeably different from those experimentally registered. Additionally, changes of similar magnitude in the slope of the resistivity meant different peak shapes as compared to those observed in the electrical signals.


