Article

Investigation of Depth and Injection Pressure Effects on Breakdown Pressure and Fracture Permeability of Shale Reservoirs: An Experimental Study

by
Wanniarachchillage Ayal Maneth Wanniarachchi
1,
Ranjith Pathegama Gamage
1,*,
Mandadige Samintha Anne Perera
1,2,
Tharaka Dilanka Rathnaweera
1,
Mingzhong Gao
3 and
Eswaran Padmanabhan
4
1
Deep Earth Energy Laboratory, Department of Civil Engineering, Monash University, Building 60, Melbourne, VIC 3800, Australia
2
Department of Infrastructure Engineering, The University of Melbourne, Building 175, Melbourne, VIC 3010, Australia
3
State Key Laboratory of Hydraulics and Mountain River Engineering, Sichuan University, Chengdu 610000, China
4
Petroleum Engineering Department, University of Technology Petronas, Teronoh 32610, Malaysia
*
Author to whom correspondence should be addressed.
Appl. Sci. 2017, 7(7), 664; https://doi.org/10.3390/app7070664
Submission received: 23 April 2017 / Revised: 19 June 2017 / Accepted: 19 June 2017 / Published: 28 June 2017
(This article belongs to the Section Energy Science and Technology)

Abstract

:
The aim of this study was to identify the influence of reservoir depth on reservoir rock mass breakdown pressure and the influence of reservoir depth and injecting fluid pressure on the flow ability of reservoirs before and after the hydraulic fracturing process. A series of fracturing tests was conducted under a range of confining pressures (1, 3, 5 and 7 MPa) to simulate various depths. In addition, permeability tests were conducted on intact and fractured samples under 1 and 7 MPa confining pressures to determine the flow characteristic variations upon fracturing of the reservoir, depending on the reservoir depth and injecting fluid pressure. N2 permeability was tested under a series of confining pressures (5, 10, 15, 20 and 25 MPa) and injection pressures (1–10 MPa). According to the results, shale reservoir flow ability for gas movement may reduce with increasing injection pressure and reservoir depth, due to the Klinkenberg phenomenon and pore structure shrinkage, respectively. The breakdown pressure of the reservoir rock linearly increases with increasing reservoir depth (confining pressure). Interestingly, 81% permeability reduction was observed in the fractured rock mass due to high (25 MPa) confinement, which shows the importance of proppants in the fracturing process.

Graphical Abstract

1. Introduction

Hydraulic fracturing has become a well-known process to induce and propagate fractures in rock formations to extract unconventional natural gas, including shale gas. During this fracturing process, a pressurized fluid is injected through a wellbore to generate fractures in the rock formation to eventually improve the reservoir permeability, resulting in greater production rates [1,2,3]. The application of hydraulic fracturing for commercial shale gas production has been successful in the USA, and shale gas currently contributes about 17% of the total U.S. natural gas production [4]. The success of shale gas extraction through hydraulic fracturing in the USA has encouraged other countries, including Canada, China and Australia, to investigate the potential application of this technique for shale gas extraction.
However, the key challenge in hydraulic fracturing is the selection of the most suitable working parameters, including the fracturing fluid, injection flow rate and number of fracturing stages, to obtain greater gas production. To maximize the production rate while minimizing the production cost, it is necessary to have a comprehensive knowledge of each phase of the hydraulic fracturing process, including breakdown pressure (the pressure at which the rock matrix fractures), extensiveness, size and width of the fracture network generated, the direction of the major fracture and corresponding permeability enhancement [5,6]. For example, precise knowledge of breakdown pressure is required prior to deciding on the reservoir treatment parameters, because fracturing pressure should exceed the breakdown pressure to initiate fractures. Therefore, matrix stimulation treatments (to improve permeability by using acids, chemicals and solvents) are always conducted before reaching the breakdown pressure. Researchers have therefore attempted to investigate and quantify the parameters influencing the hydraulic fracturing process. According to past studies, some reservoir properties, including overburden stress, confining stress, mechanical properties, and the mineral composition of the rock formation, and injecting fluid properties, such as injection fluid type and flow rate, have been identified as governing parameters for hydraulic fracturing [7,8,9,10].
In order to achieve efficient gas extraction using the hydraulic fracturing process, two main conditions must be met: (1) the selected reservoir should be hydraulically fractured to produce a broad fracture network that is well interconnected; and (2) the generated fracture network should have the ability to improve the reservoir’s permeability to enable the extraction of a sufficient amount of gas from the reservoir. Both of the above criteria depend on the reservoir properties, especially the brittleness characteristics and stress conditions. Currently, hydraulic fracturing and the associated permeability improvement are studied using both laboratory experiments [11,12,13,14,15] and numerical simulation [6,16,17,18,19]. Among the numerical studies, Fatahi et al. [19], has developed a model based on the distinct element method to study the fracture initiation and breakdown pressure. However, in light of the associated high computational costs, meshing and re-meshing difficulties, difficulties in incorporating the heterogeneities and the anisotropy of the rock mass, and calibration of the models used in numerical modelling, laboratory experiments can play a vital role in the study of the hydraulic fracturing process in deep gas reservoirs, including shaley plays. For example, Deng et al. [7] conducted fracturing experiments using 300 × 300 × 300 mm cement mortar blocks and found that the direction of the hydraulic fracture is always along the direction of the maximum principle stress, and the injection rate of the fracturing fluid has an obvious influence on the breakdown pressure (higher injection rates cause faster hydraulic fracture propagation). They also noted a clear reduction in breakdown pressure when a notch exists at the end of the wellbore, due to stress concentration [7]. Similarly, Fallahzadeh et al. [15] conducted experiments using 100 and 150 mm mortar samples (cubes) and found that the fracture initiation and breakdown pressure is depend on the orientation of the perforations in perforated wellbore. According to Lhomme and De Pater [20], based on the model initially developed by the CSIRO, fracture initiation and breakdown pressures are not necessarily the same, and breakdown pressure can be equal to or greater than the initiation pressure. However, these two pressures can be clearly distinguished using a pressure vs. time plot, in which after the initiation pressure the plot deviates from the linear trend to a non-linear trend until the breakdown pressure is reached [20]. According to Alpern et al. [21], breakdown pressure and fracture morphology are dependent on the fluid type under identical stress state conditions. In relation to fracture morphology, some fracturing fluids, such as CO2, SF6 and water, consistently create simple fractures and others, as N2 and air, consistently create fractures in a complex helical network [21]. According to the study of Caulk et al. [13] on the fracture aperture and permeability of artificially fractured granite samples, permeability and the fracture aperture start to reduce with time when the applied effective stresses are around 25 and 35 MPa, respectively. According to Yasuhara et al. [22], for low temperature (20 °C) isothermal flow, fractures tend to close monotonically due to the removal of bridging asperities, and around 60% reduction in fracture aperture after two months was observed in their tests. Importantly, some studies were carried out to investigate the accurate methods to perform the hydraulic fracturing tests and Sarmadivaleh et al. [23] documented the steps to conduct a valid hydraulic fracturing test in laboratory conditions.
In most of the existing experimental work, fracturing has been performed using artificial materials such as concrete (or cement mortar), glass and Perspex, and few studies have considered the fracturing of real rock samples. Although in some cases the material properties are the same, other materials may not behave sufficiently like real rocks, which could affect the experimental results. Moreover, to investigate fracture permeability, artificially fractured samples (using the Brazilian tensile method or water-jet cutting, etc.) have been frequently used. However, the fracture surfaces and fracture apertures generated in artificially fractured rocks may vary greatly from those in hydraulically fractured rocks. In fact, in artificially fractured rocks, some of the rock particles may disintegrate from the rock surface, which leads to significant fracture apertures. A knowledge gap therefore exists in terms of the hydraulic fracturing process in real rock samples and also of the fracture permeability of hydraulically fractured rock samples. The aim of this study is to contribute to filling this gap by investigating the influence of confining pressure on the hydraulic fracturing process and the influence of both confining pressure and injection pressure on fracture permeability in hydraulically fractured rocks. Here, intact siltstone samples were used to conduct the fracturing and permeability experiments.

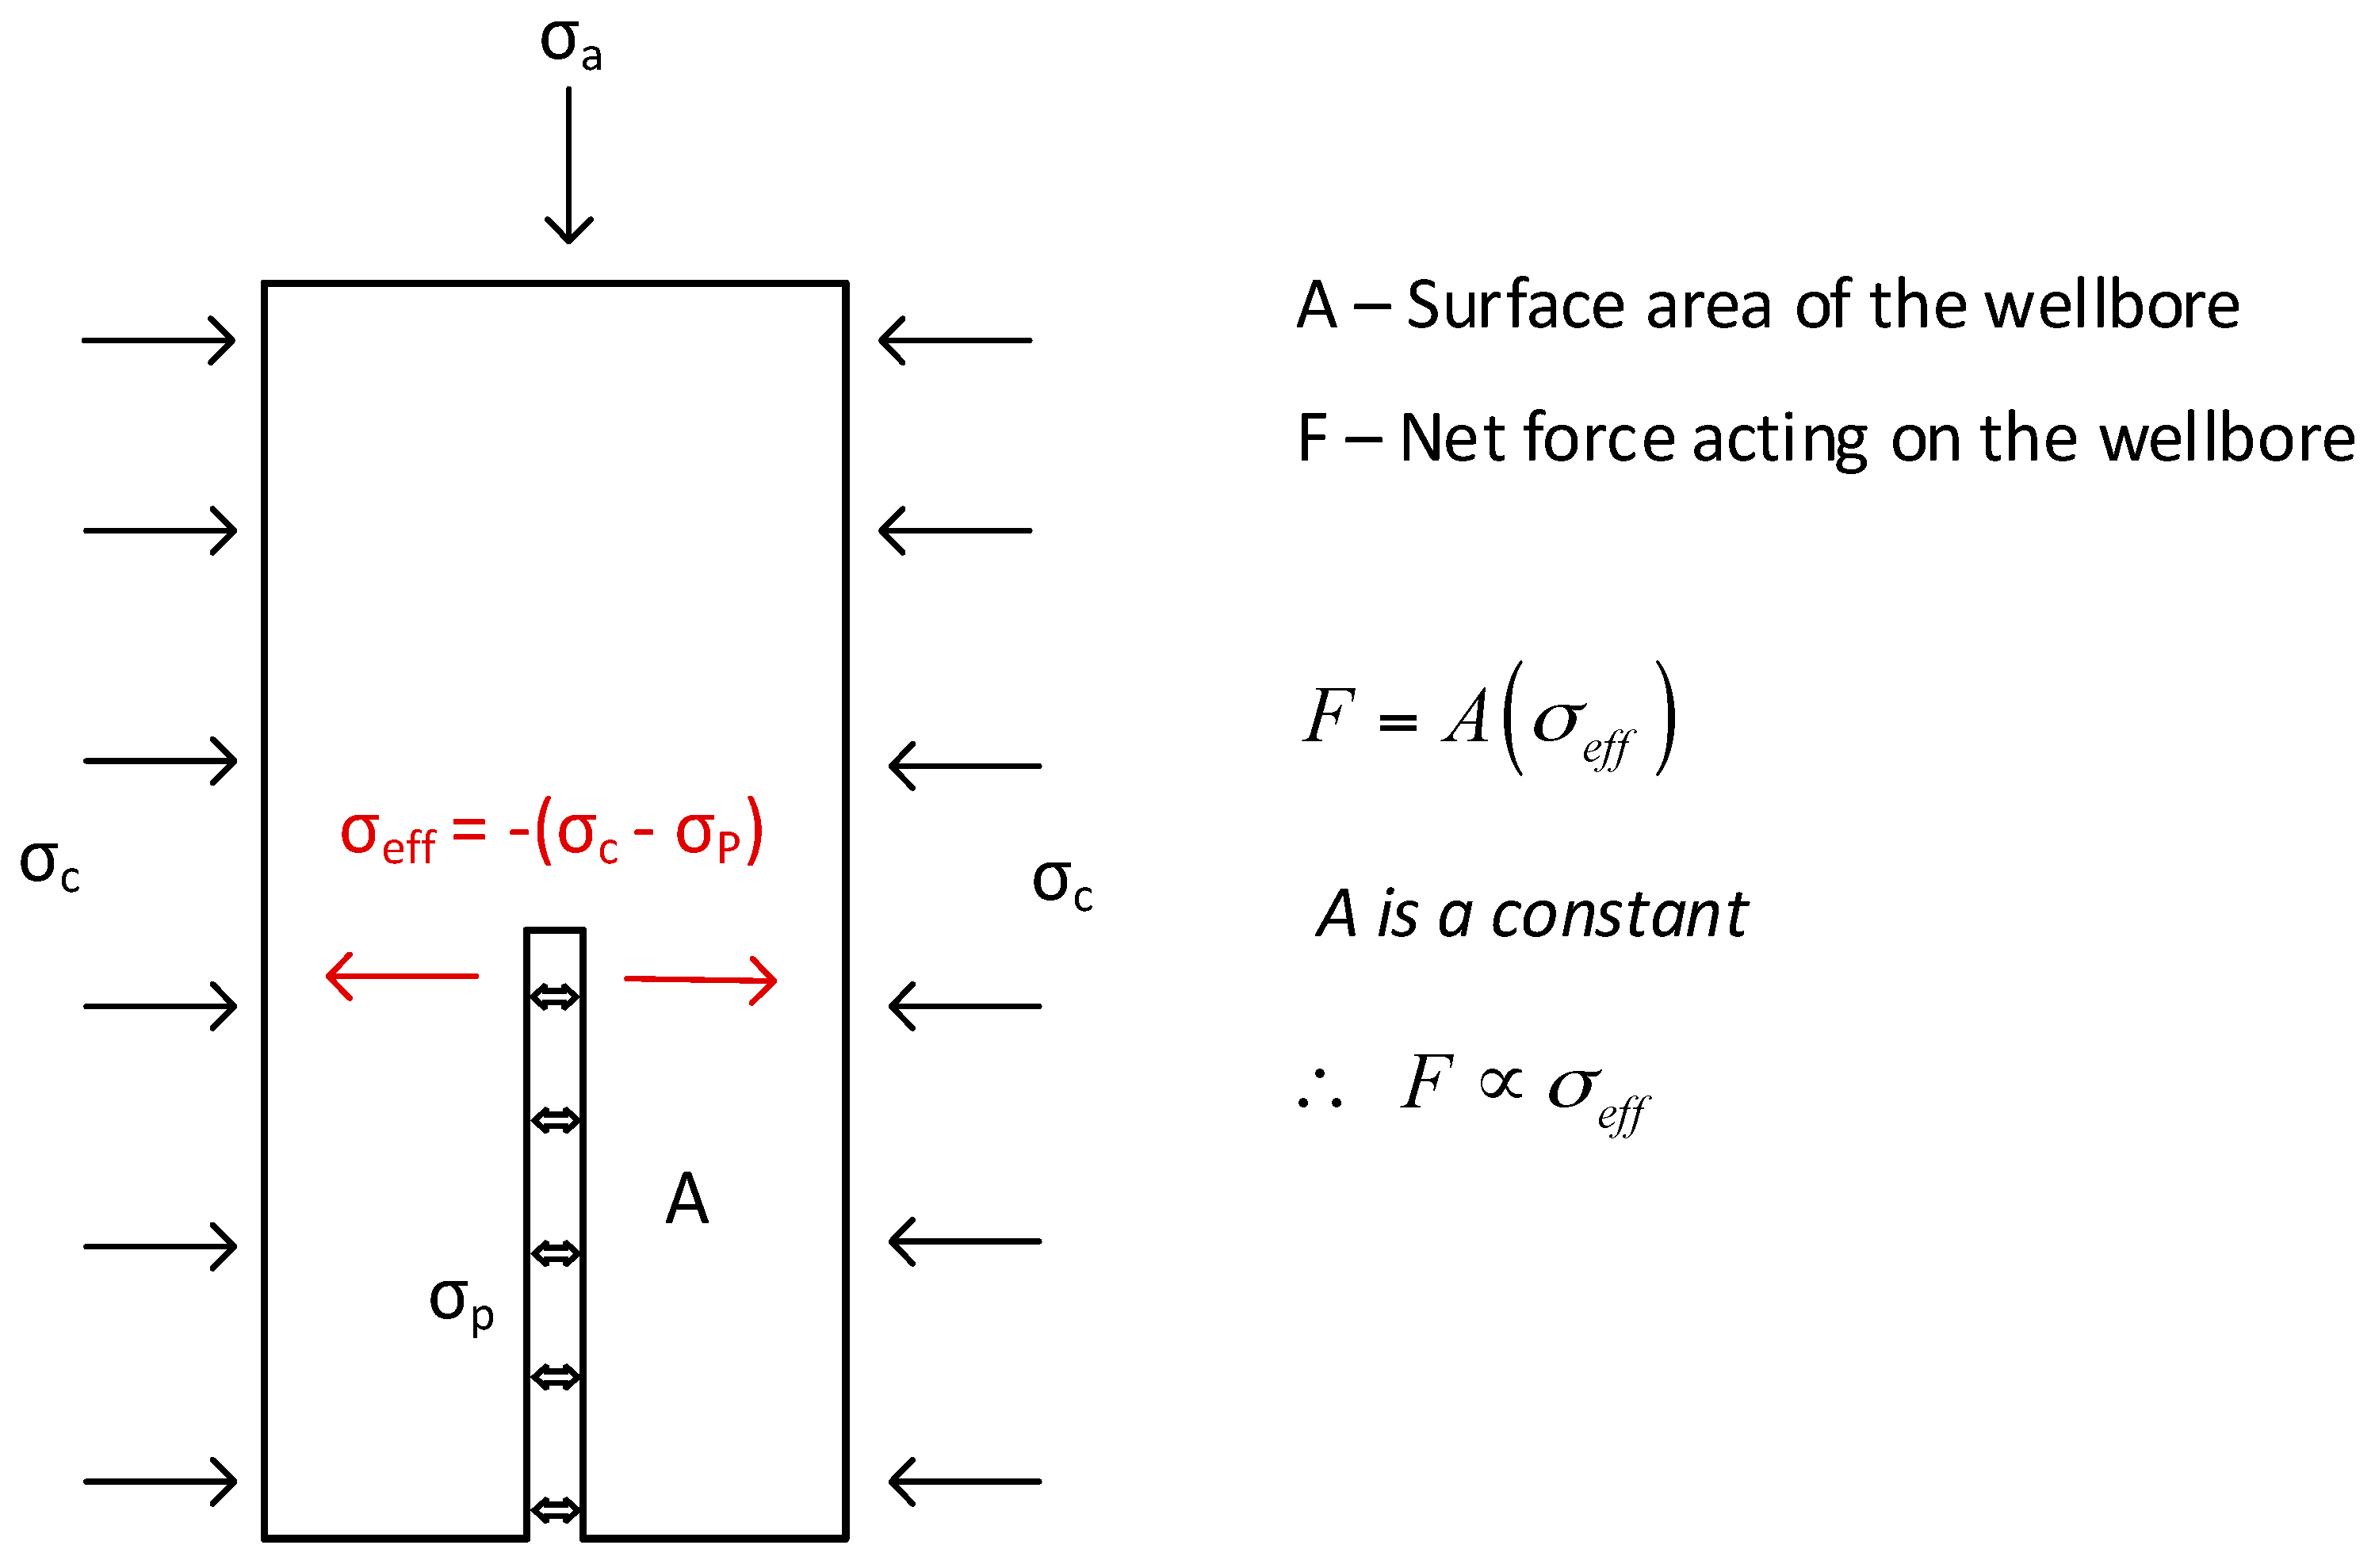
2. Theoretical Background

2.1. Hydraulic Fracturing

The breakdown pressure and morphology of the induced fractures are key parameters in hydraulic fracturing and are dependent on both the fracturing fluid type and the applied stress condition [21,24]. Under triaxial conditions, two main stresses act on the rock sample: axial stress and confining stress, and the fractures created in hydraulic fracturing always propagate perpendicular to the minimum stress direction or in the plane of maximum principle stress. Therefore, under triaxial conditions, hydraulic fracturing can be done in two different ways: (1) when the axial stress is less than the confining stress, the fracture will open across the wellbore (horizontal plane) (Figure 1a); and (2) when the axial stress is greater than the confining stress, fractures will open along the wellbore (vertical plane) (Figure 1b). In this paper, only the fractures along the wellbore (vertical plane) are considered, and in this situation, the breakdown pressure can be estimated using Equation (1) [9], the HW (Hubbert–Willis) criterion).
P b = 3 σ h σ H + σ T
where, Pb is the breakdown pressure, σh is the minimum horizontal stress, σH is the maximum horizontal stress and σT is the tensile strength of the rock.
Here, consideration of tensile strength is important, as failure can occur under tension or shear in the rock mass, rather than under compression. However, under triaxial conditions, the minimum horizontal stress and the maximum horizontal stress are equal to the confining stress (σc). Therefore, Equation (1) can be rearranged to a more simplified form (Equation (2)):
P b = 2 σ c + σ T
According to Equation (2), only the tensile strength and confining stress influence the breakdown pressure of the rock mass under triaxial conditions. However, in real situations in the field, there may be other factors, such as degree of saturation, saturation medium (pore fluid), and the chemical and mineral composition of the rock mass, which may also have a considerable influence on the breakdown pressure relation.

2.2. Fracture Permeability

The permeability of an intact rock specimen is usually calculated using the Darcy equation (Equation (3)):
k = 2 Q P o μ L A ( P i 2 P o 2 )
where Q is the flow rate, µ is the viscosity of the injection fluid, Po is the downstream pressure, Pi is the upstream pressure, A is the cross-sectional area of the specimen, L is the mean specimen length and k is the permeability of the specimen.
However, when the specimen is fractured, fluid will pass through the fractures rather than through the rock matrix, greatly increasing the permeability of the specimen, which is the purpose of fracturing. In intact samples, hydrological, mechanical, thermal and chemical processes affect permeability. However, in fractured samples, chemically facilitated mineral dissolution and stress-facilitated mechanical creep (called stress creep) mainly affect the fracture permeability [25,26]. Moreover, the sample’s cross-sectional area cannot be used to calculate the fracture permeability, since the fluid flow takes place through the fracture, which indicates the importance of using the fracture aperture to find the effective area of the sample for fluid flow in fractured samples. According to Witherspoon et al. [27], the modified cubic law given in Equation (4) can be used to calculate the fracture aperture using pore pressure measurements and downstream flow measurements [27]:
Q = Δ P b 3 d 12 μ L
where Q is the volumetric flow rate, ΔP is the pressure difference along the sample, d is the diameter of the sample, μ is the viscosity of the injection fluid, L is the mean specimen length and b is the theoretical fracture aperture. However, ΔP is equal to the pressure difference between the inlet and outlet. Therefore, Equation (4) can be rewritten as Equation (5):
Q = ( P i P o ) b 3 d 12 μ L
By combining Equations (3) and (5), fracture permeability can be calculated using Equation (6):
k = P o ( P i 2 P o 2 ) 2 ( P i P o ) Q 2 μ 2 L 2 3 d 2 3

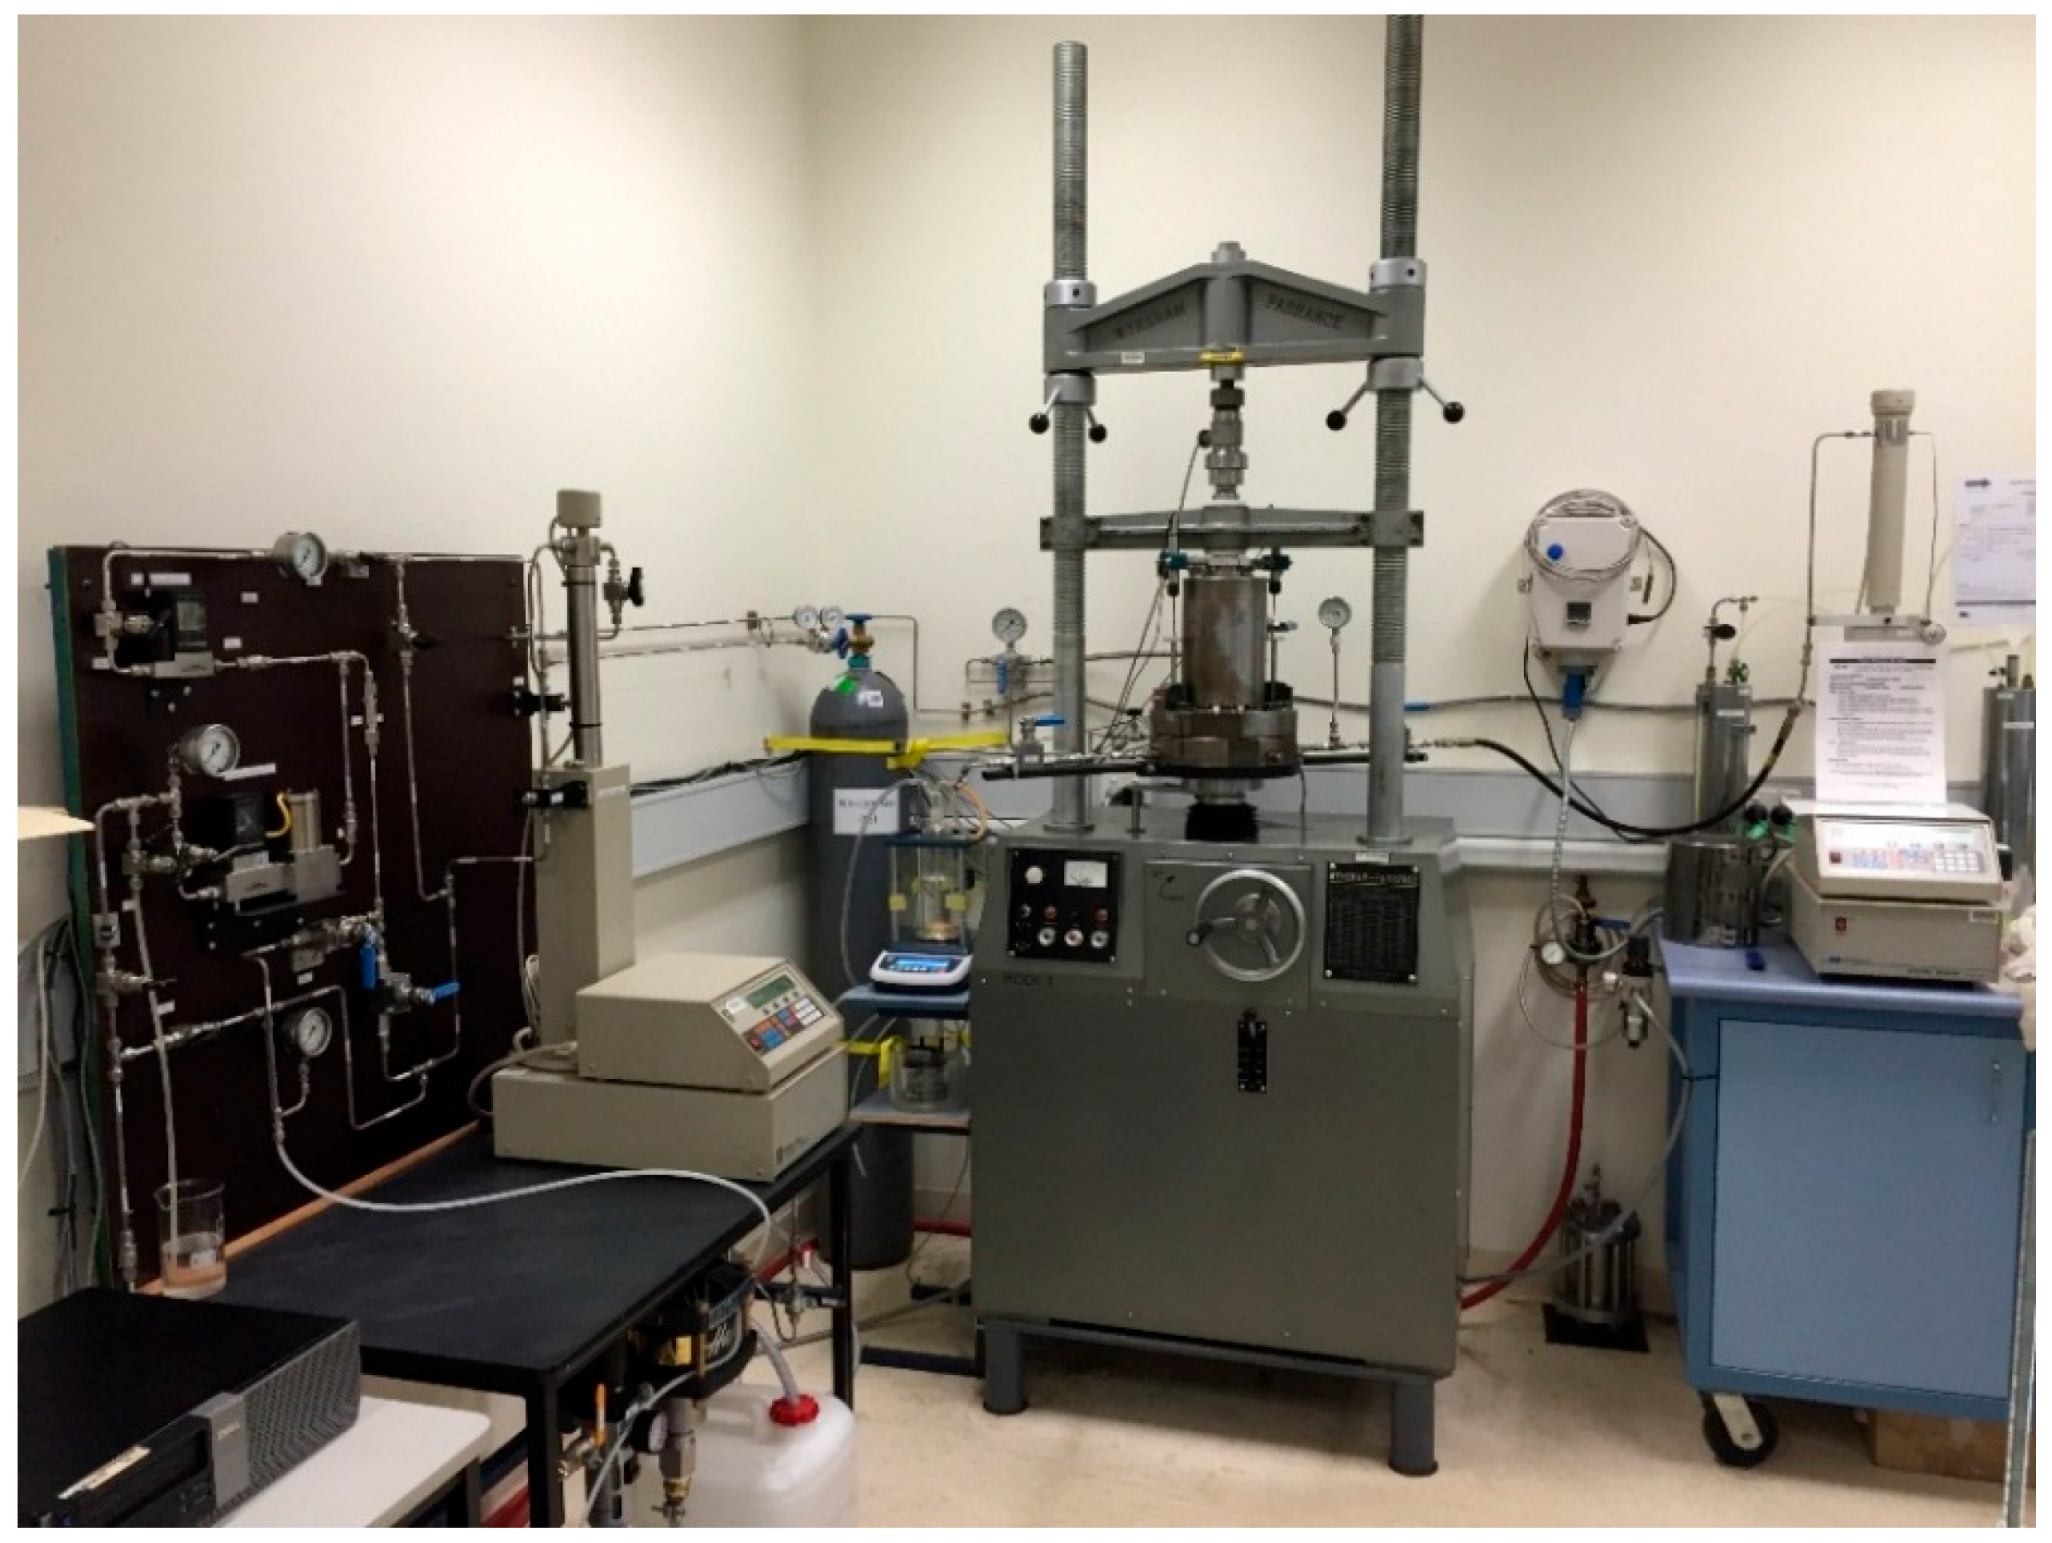
3. Experimental Methodology

3.1. Rock Specimens and Sample Preparation

Siltstone samples from the Eidsvold basin were collected from Queensland, Australia. Based on digital microscope observations, this particular type of siltstone is almost homogeneous. According to X-ray diffraction (XRD) analysis, it consists of 43% quartz and 40% kaolinite, and according to mercury intrusion porosimetry (MIP) tests, its porosity is about 20%. The collected siltstone blocks were first cored to 54 mm diameter samples and then cut to 90 mm lengths. The two end surfaces of the samples were carefully ground to produce parallel surfaces, using the diamond grinding machine available in the Monash University Deep Earth Energy Research Laboratory (DEERL). In order to inject the fracturing fluid and to simulate the wellbore, sample centres were drilled up to mid-depth using a 4-mm drill bit. The drilling was carried out in the Civil Engineering Workshop at Monash University, to make homogeneous holes in all the samples, and the hole dimensions were 45 mm deep and 4 mm in diameter. During the drilling process, lubricant and a very slow drilling speed were used to prevent damage to the samples, which also prevented the initiation of micro-fractures. According to Sarmadivaleh et al. [23] fracture initiation in a homogeneous and smooth borehole wall is quite difficult and therefore the axial notch created by the drill bit at the centre of the sample is kept as it is to promote the fracture initiation. After preparing the drill hole, compressed air was used to clean the hole by removing dust and small particles and the five prepared samples were then washed and stored in an oven at 40 °C for four days to remove moisture. One sample was used for intact permeability testing and the other four for the fracturing tests and fracture permeability tests.

3.2. Fracturing Test Procedure

The oven-dried samples were removed from the oven and allowed to cool for 6 h. A newly-modified high-pressure triaxial setup (Figure 2) was used to carry out the fracturing tests. The bottom pedestal of the triaxial setup was modified for the fracturing test by introducing two O rings into the pedestal. As shown in Figure 3a, the two O rings seal the fluid injection hole at the centre of the pedestal. After placing the sample (Figure 3c), the wellbore and the fluid injection hole were aligned and with the two O rings fluid only entered the wellbore. Since there was a possibility for the fluid to be pressurised at the bottom of the sample, the fluid contact area was minimised using a small O ring.
In this study, water was used as the fracturing fluid and injected at a constant flow rate of 5 mL/min using a syringe pump. This flow rate was selected based on the fluid leak-off during the fracturing test, where, flow rates below 5 mL/min were unable to achieve the breakdown pressure with limited pump volume, due to fluid leak-off and the pressurization of the rubber membrane of the sample. However, higher flow rates (5 mL/min) may cause unstable fracture growth during the fracture initiation; this can be avoided by using a flow restriction device (chock) in the injection line just before the sample. In this study, there is a needle valve (which is slightly opened during the fracturing test) in the injection line, close to the sample, and the injection pressure transducer is located in between the sample and the needle valve. This needle valve was used to control the flow to the sample and pressure transducer after that was used to measure the fluid pressure on the sample, while inbuilt pressure transducer in the syringe pump was used to observe the pump pressure during the experiments. It should be noted that, before starting the water injection, the pipeline was filled with water to remove all the gas bubbles. Fluid injection was then performed until the breakdown pressure of the sample was reached and the process was repeated for four confining pressures: 1, 3, 5 and 7 MPa. In relation to field conditions, 7 MPa confining pressure represents a depth of about 300 m, which is less than the depth of the shale reserves (about 5 km). However, in order to represent 4 km depth in laboratory conditions, the required confining pressure is about 125 MPa, which is far more than the capacity of the test rigs available. Furthermore, in order to fracture the rock specimens at 125 MPa confining pressure, it would require an injection pressure of about 250 MPa, which is also not possible in laboratory conditions. Therefore, low confining pressures were selected for this study considering the experimental facilities available. For all the samples, applied axial stress was maintained at 20 MPa constant value, which is greater than the confining pressure required to obtain a longitudinal fracture along the wellbore. It should be noted that the selected flow rate of 5 mL/min is significantly lower than that in actual field conditions (which is about 0.2 m/s) and fluid viscosity remained almost the same for both experimental and field conditions. This will affect the fracturing time and characteristics, and therefore, the scaling laws should be considered. According to Bunger et al. [28], due to the scaling effect, when the time is short, fractures are characterized by large viscous dissipation and small leak-off, while when the time is significant, fractures are characterized by small viscous dissipation and large leak-off. According to Detournay [29], in field conditions, fracture development can be toughness-dominated or viscous-dominated. However, during the initiation phase, fracture development is toughness-dominated. Interestingly in radial fractures, initially the fracture development is toughness-dominated and then it becomes viscous-dominated and again at the final stage, it becomes toughness-dominated [29]. According to Detournay [29], dimensionless toughness parameter (K) can be used to identify the dominate parameter for the fracture development. For a perfectly impermeable rock, the dimensionless toughness of a penny-shaped fracture can be calculated using Equation (7) [29]:
K = K ( t 2 μ 5 Q 3 E 13 ) 1 / 18
where t is the time of the experiment, Q′ is the flow rate and μ′, E′ and K′ can be calculated using Equations (8)–(10), respectively:
μ = 12 μ
E = E 1 v 2
K = 4 ( 2 π ) 1 / 2 K I C ,
where μ is the viscosity of the fracturing fluid, E is the Young’s modulus of the rock, v is the Poisson’s ratio and KIC is the fracture toughness. In the current study, the permeability of the rock is about 2 μD, which is very low and safe to assume as impermeable. Based on the material and fluid properties: fluid viscosity of 0.9 mPa·s and flow rate of 5 mL/min the dimensionless toughness value can be calculated as 19.2. According to Detournay [29], when the K is greater than or equal to 4, the fracture development regime is toughness dominated as the most of energy dissipated to create new fracture surface. Therefore, in this study, the attention has paid to the toughness-dominated fracture development.

3.3. Permeability Test Procedure

The same high-pressure triaxial setup was used for the permeability tests by changing the bottom pedestal (Figure 3b). The oven-dried sample for intact permeability was removed from the oven and allowed to cool for 6 h, similar to the fracturing samples. Hydraulically fractured samples under 1 and 7 MPa confinement were dried to remove the water from the samples before the permeability tests were performed on them. As shown in Table 1, permeability tests were conducted for a series of confining pressures: 5, 10, 15, 20 and 25 MPa and gas injecting pressures: 1, 2, 4, 6, 8 and 10 MPa. To identify the possibility of enhancement of natural gas extraction by fracturing, N2 gas permeability was tested under drained conditions. The system temperature was maintained at a 24 °C constant value and the downstream flow rate was monitored and recorded at one second intervals for each injection pressure using an XFM digital mass flow meter capable of measuring gas flow up to 5000 mL/min. The permeability tests were stopped when the downstream flow rate became constant. The permeability value for each condition was calculated using Equations (3) and (6).

4. Results and Discussion

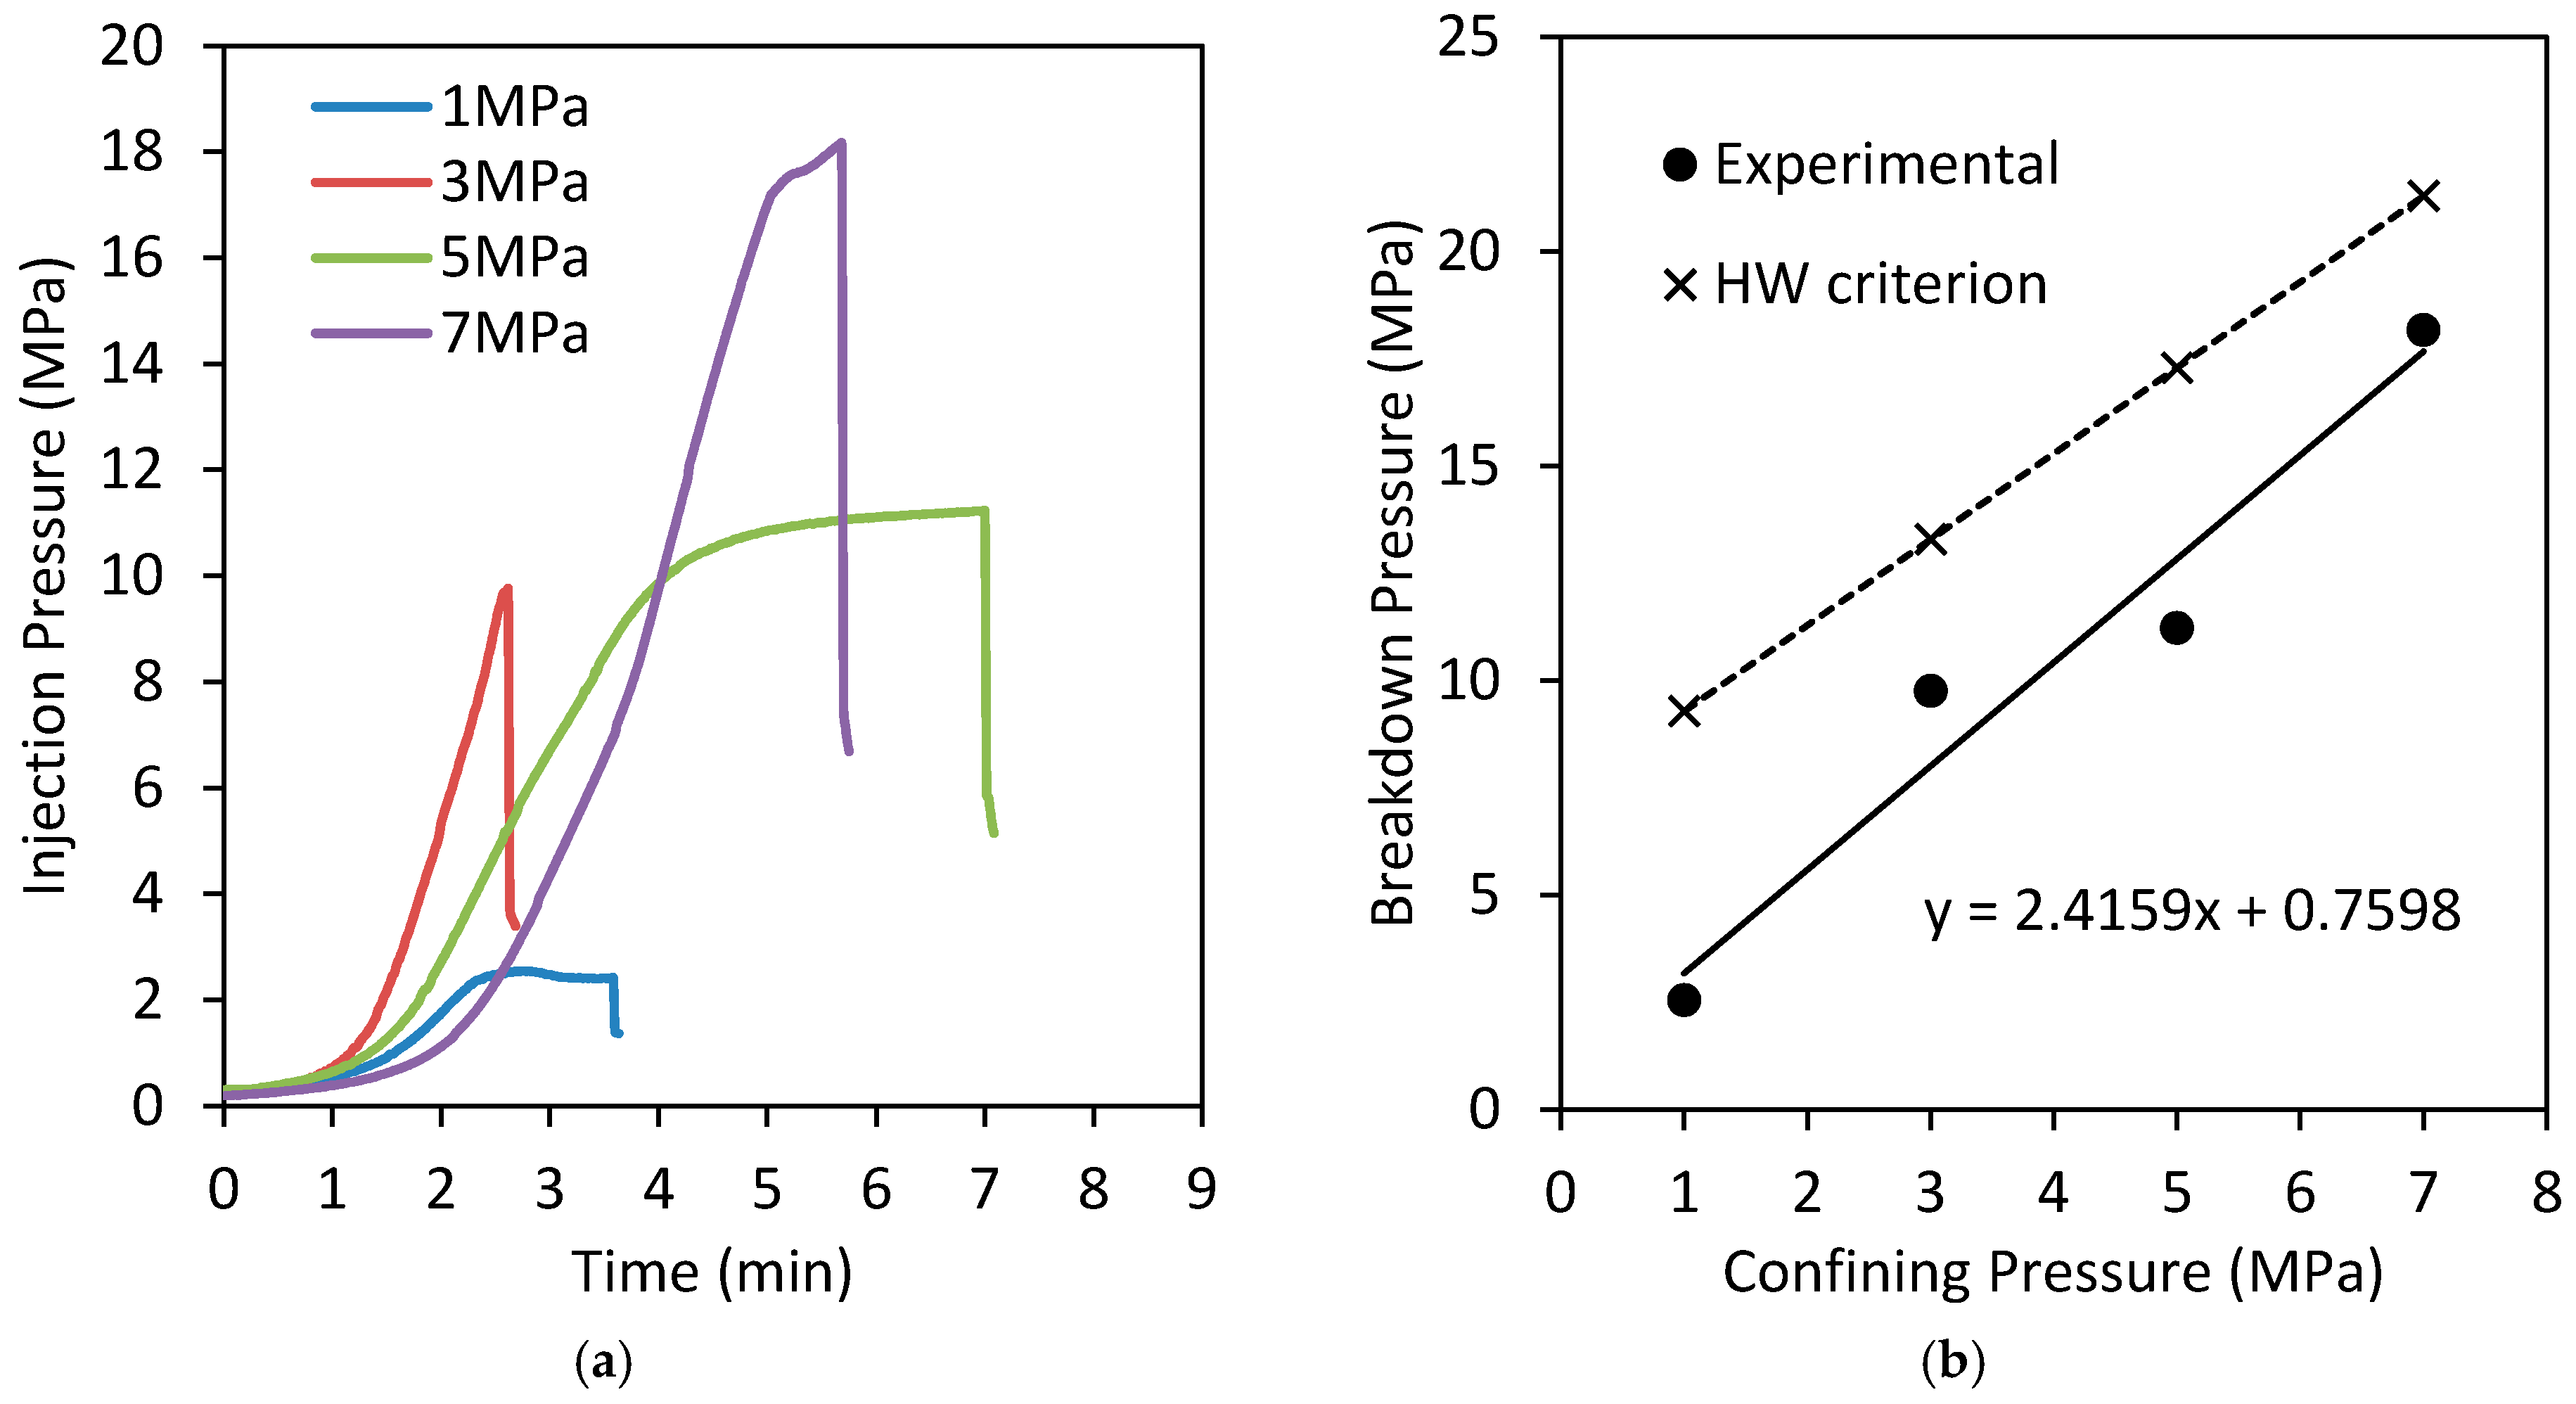
4.1. Effect of Confinement on Breakdown Pressure

The different injection pressures over time in intact siltstone specimens at various confinements, when the flow rate was maintained at a constant rate of 5 mL/min, are shown in Figure 4a. According to the figure, injection pressure generally increases over time until it reaches the breakdown pressure of the sample. This significant pressure development occurred due to the low permeability of siltstone, and the injection flow rate (5 mL/min) was therefore much higher than the flow penetration rate through the rock matrix, which created an injection pressure development until the final failure. Figure 4a exhibits three main regions in the pressure development, regardless of confinement, and these are clearly shown in Figure 5. The first stage is the initial pressure development stage, at which pressure development with time is comparatively small and almost horizontal, because water more easily enters the accessible pores in the sample until they fill, giving only a small chance to fluid remaining in the upstream to undergo pressure development. However, in the second wellbore pressurization stage, most of the nearby pores are already filled and saturated. Therefore, the injected water cannot easily enter the pores and accumulates in the upstream with the developing pressure there. At the final failure stage, the sample breaks, creating a sudden pressure drop, because sample failure occurs, creating many fractures that offer much easier flow paths to the fluid. This is consistent with the similar pressure development trends observed by Deng et al. [7] for concrete specimens.
Figure 4b shows the effect of confinement on the breakdown pressure of the siltstone samples, according to which the breakdown pressure of the siltstone specimens almost linearly increases with increasing confining pressure. This is consistent with the findings of Fialko and Rubin [30], who studied granite specimens. According to Figure 4b, when the confining pressure is increased from 1 to 7 MPa, breakdown pressure increases from 2.5 to 18.2 MPa, (about 7 times increase from 1 MPa). Each breakdown pressure was then cross-calculated according to the HW criterion (using Equation (2) and the tensile strength of the tested siltstone, 7.3 MPa) and the results are shown in Figure 4b. According to this figure, the experimental breakdown pressure values are much lower than the values calculated using the HW criterion, probably due to the water-softening effect, where water molecules weaken the clay mineral and rock bonding, creating reduced tensile strength characteristics and therefore lower breakdown pressures [31]. Moreover, depending on the fracturing method, fluid pressure acts on the entire well surface and induces a high tensile force due to higher surface area. This shows the inapplicability of the HW criterion for wettable fluid injection into siltstone without the well casing. However, the linear relationship between the breakdown pressure and confining pressure seems to remain the same for both experimental and HW results.

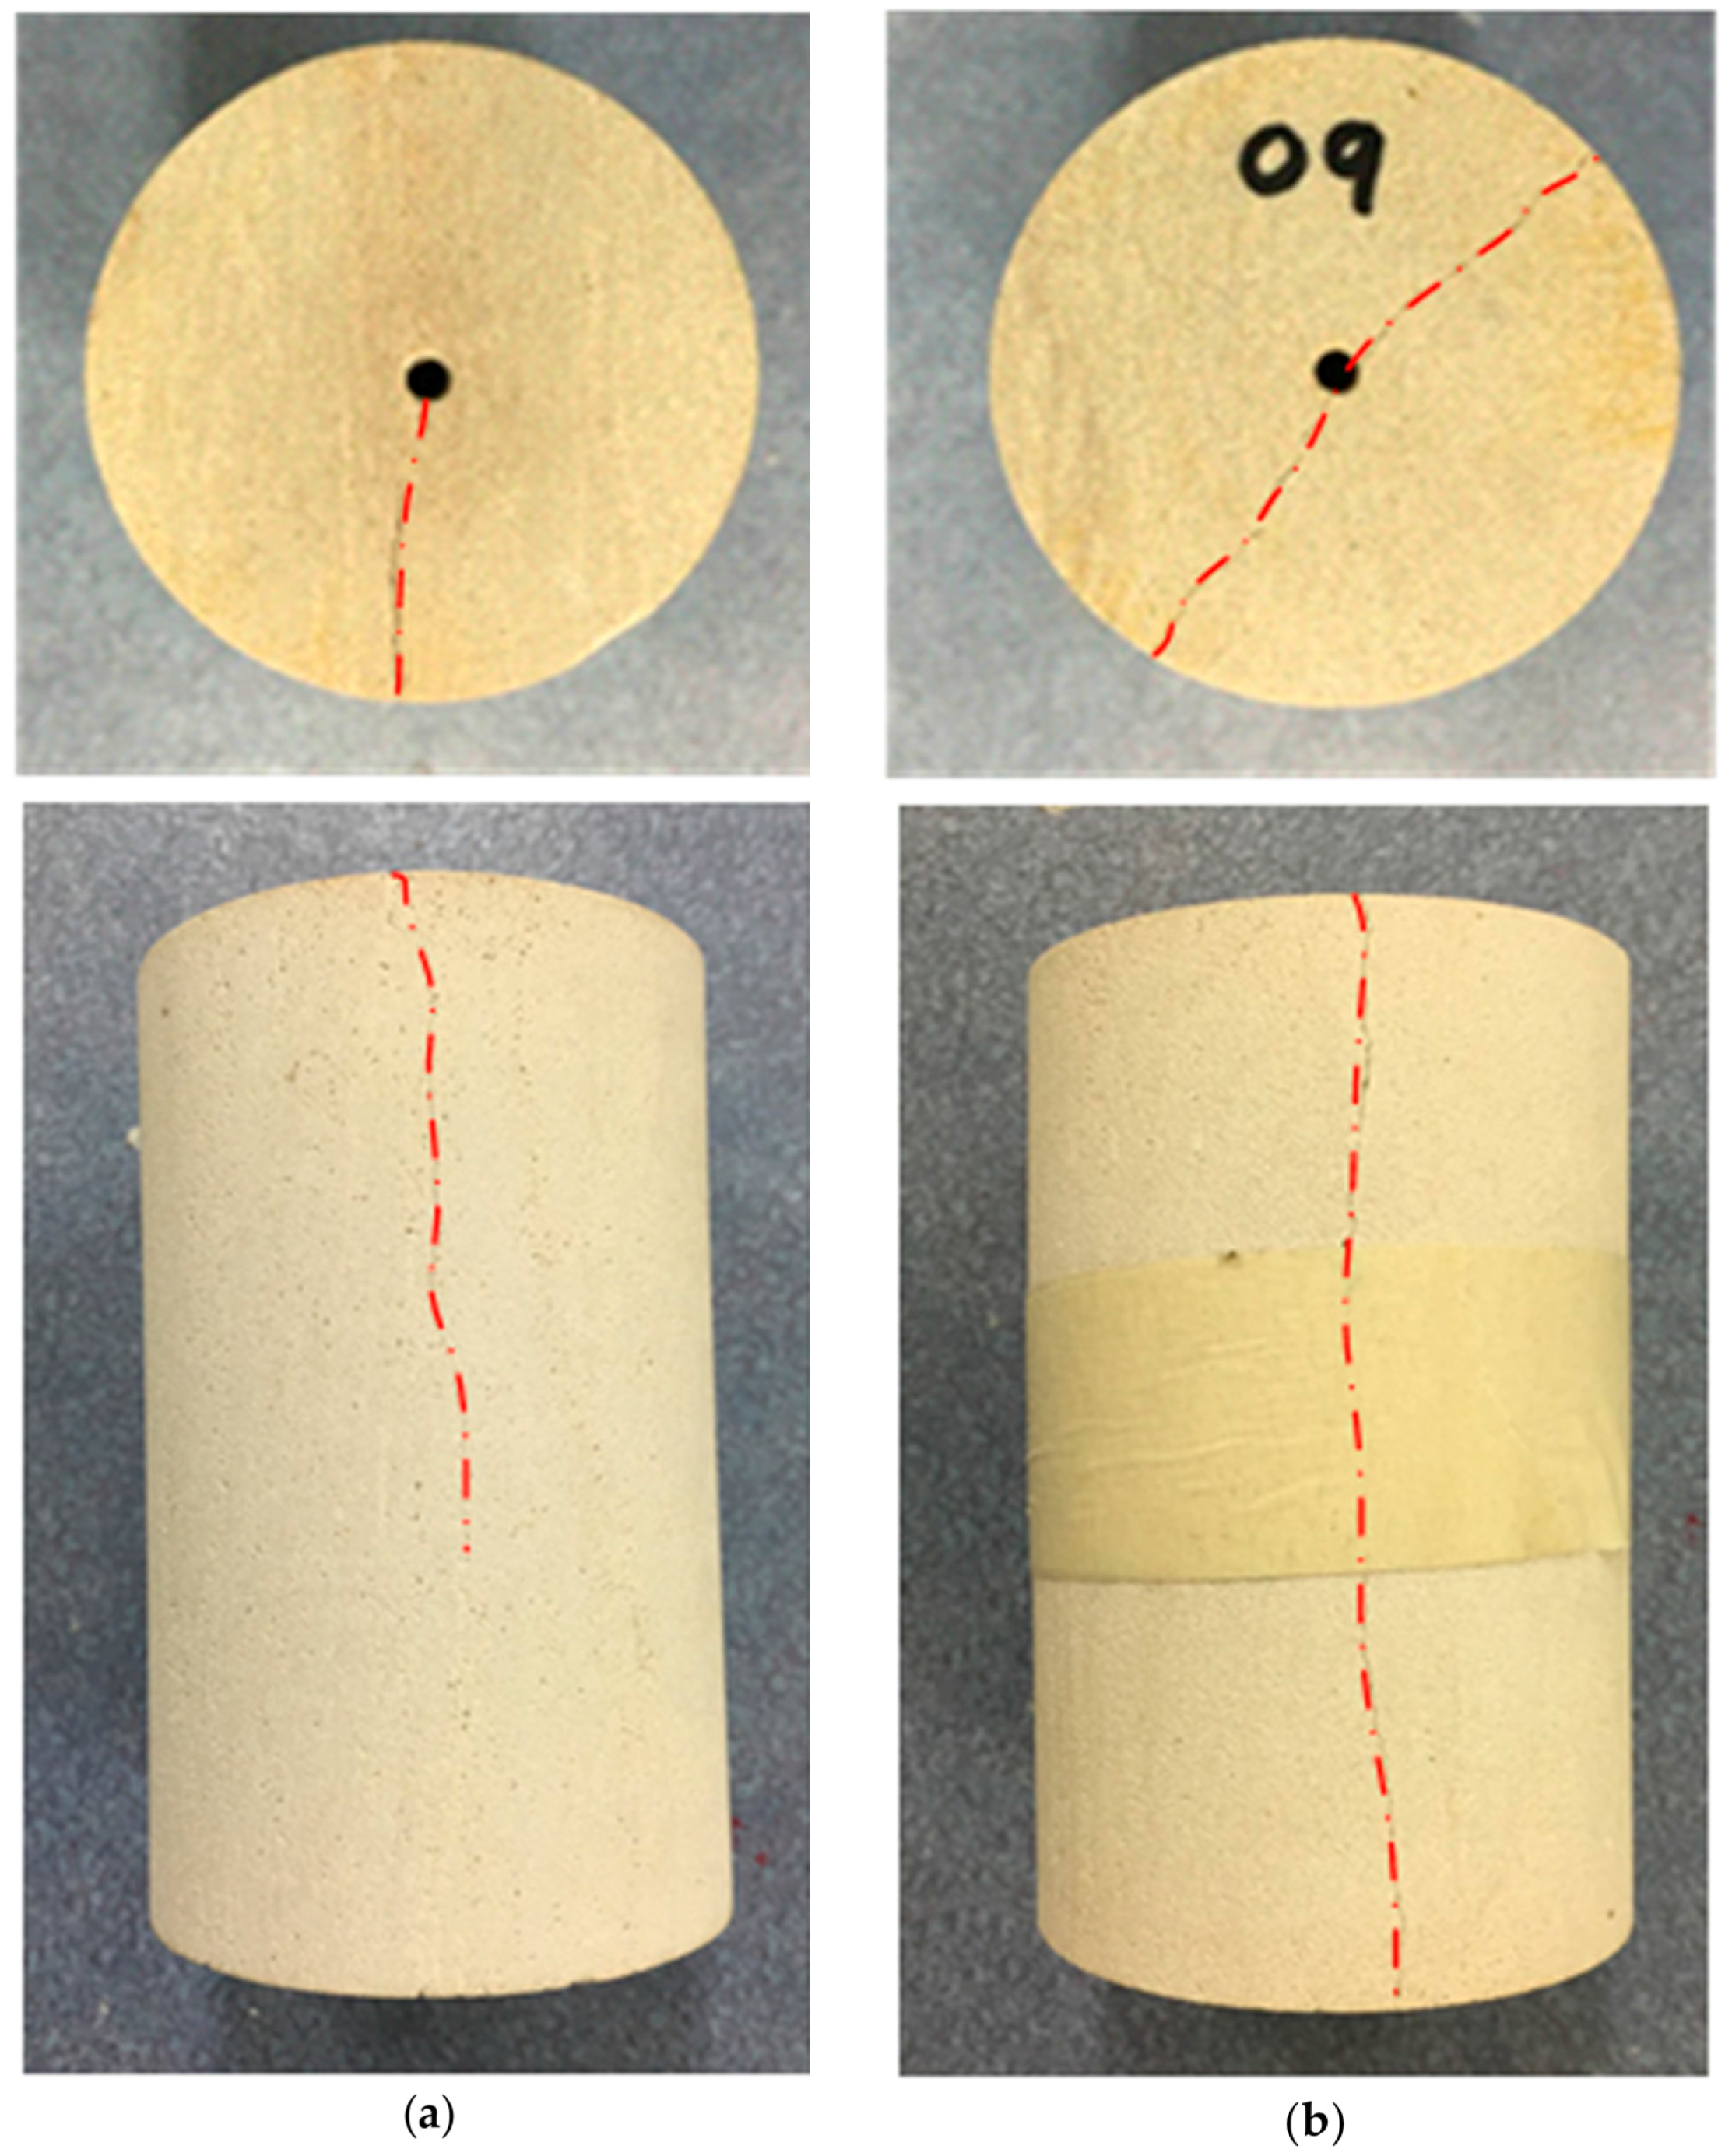
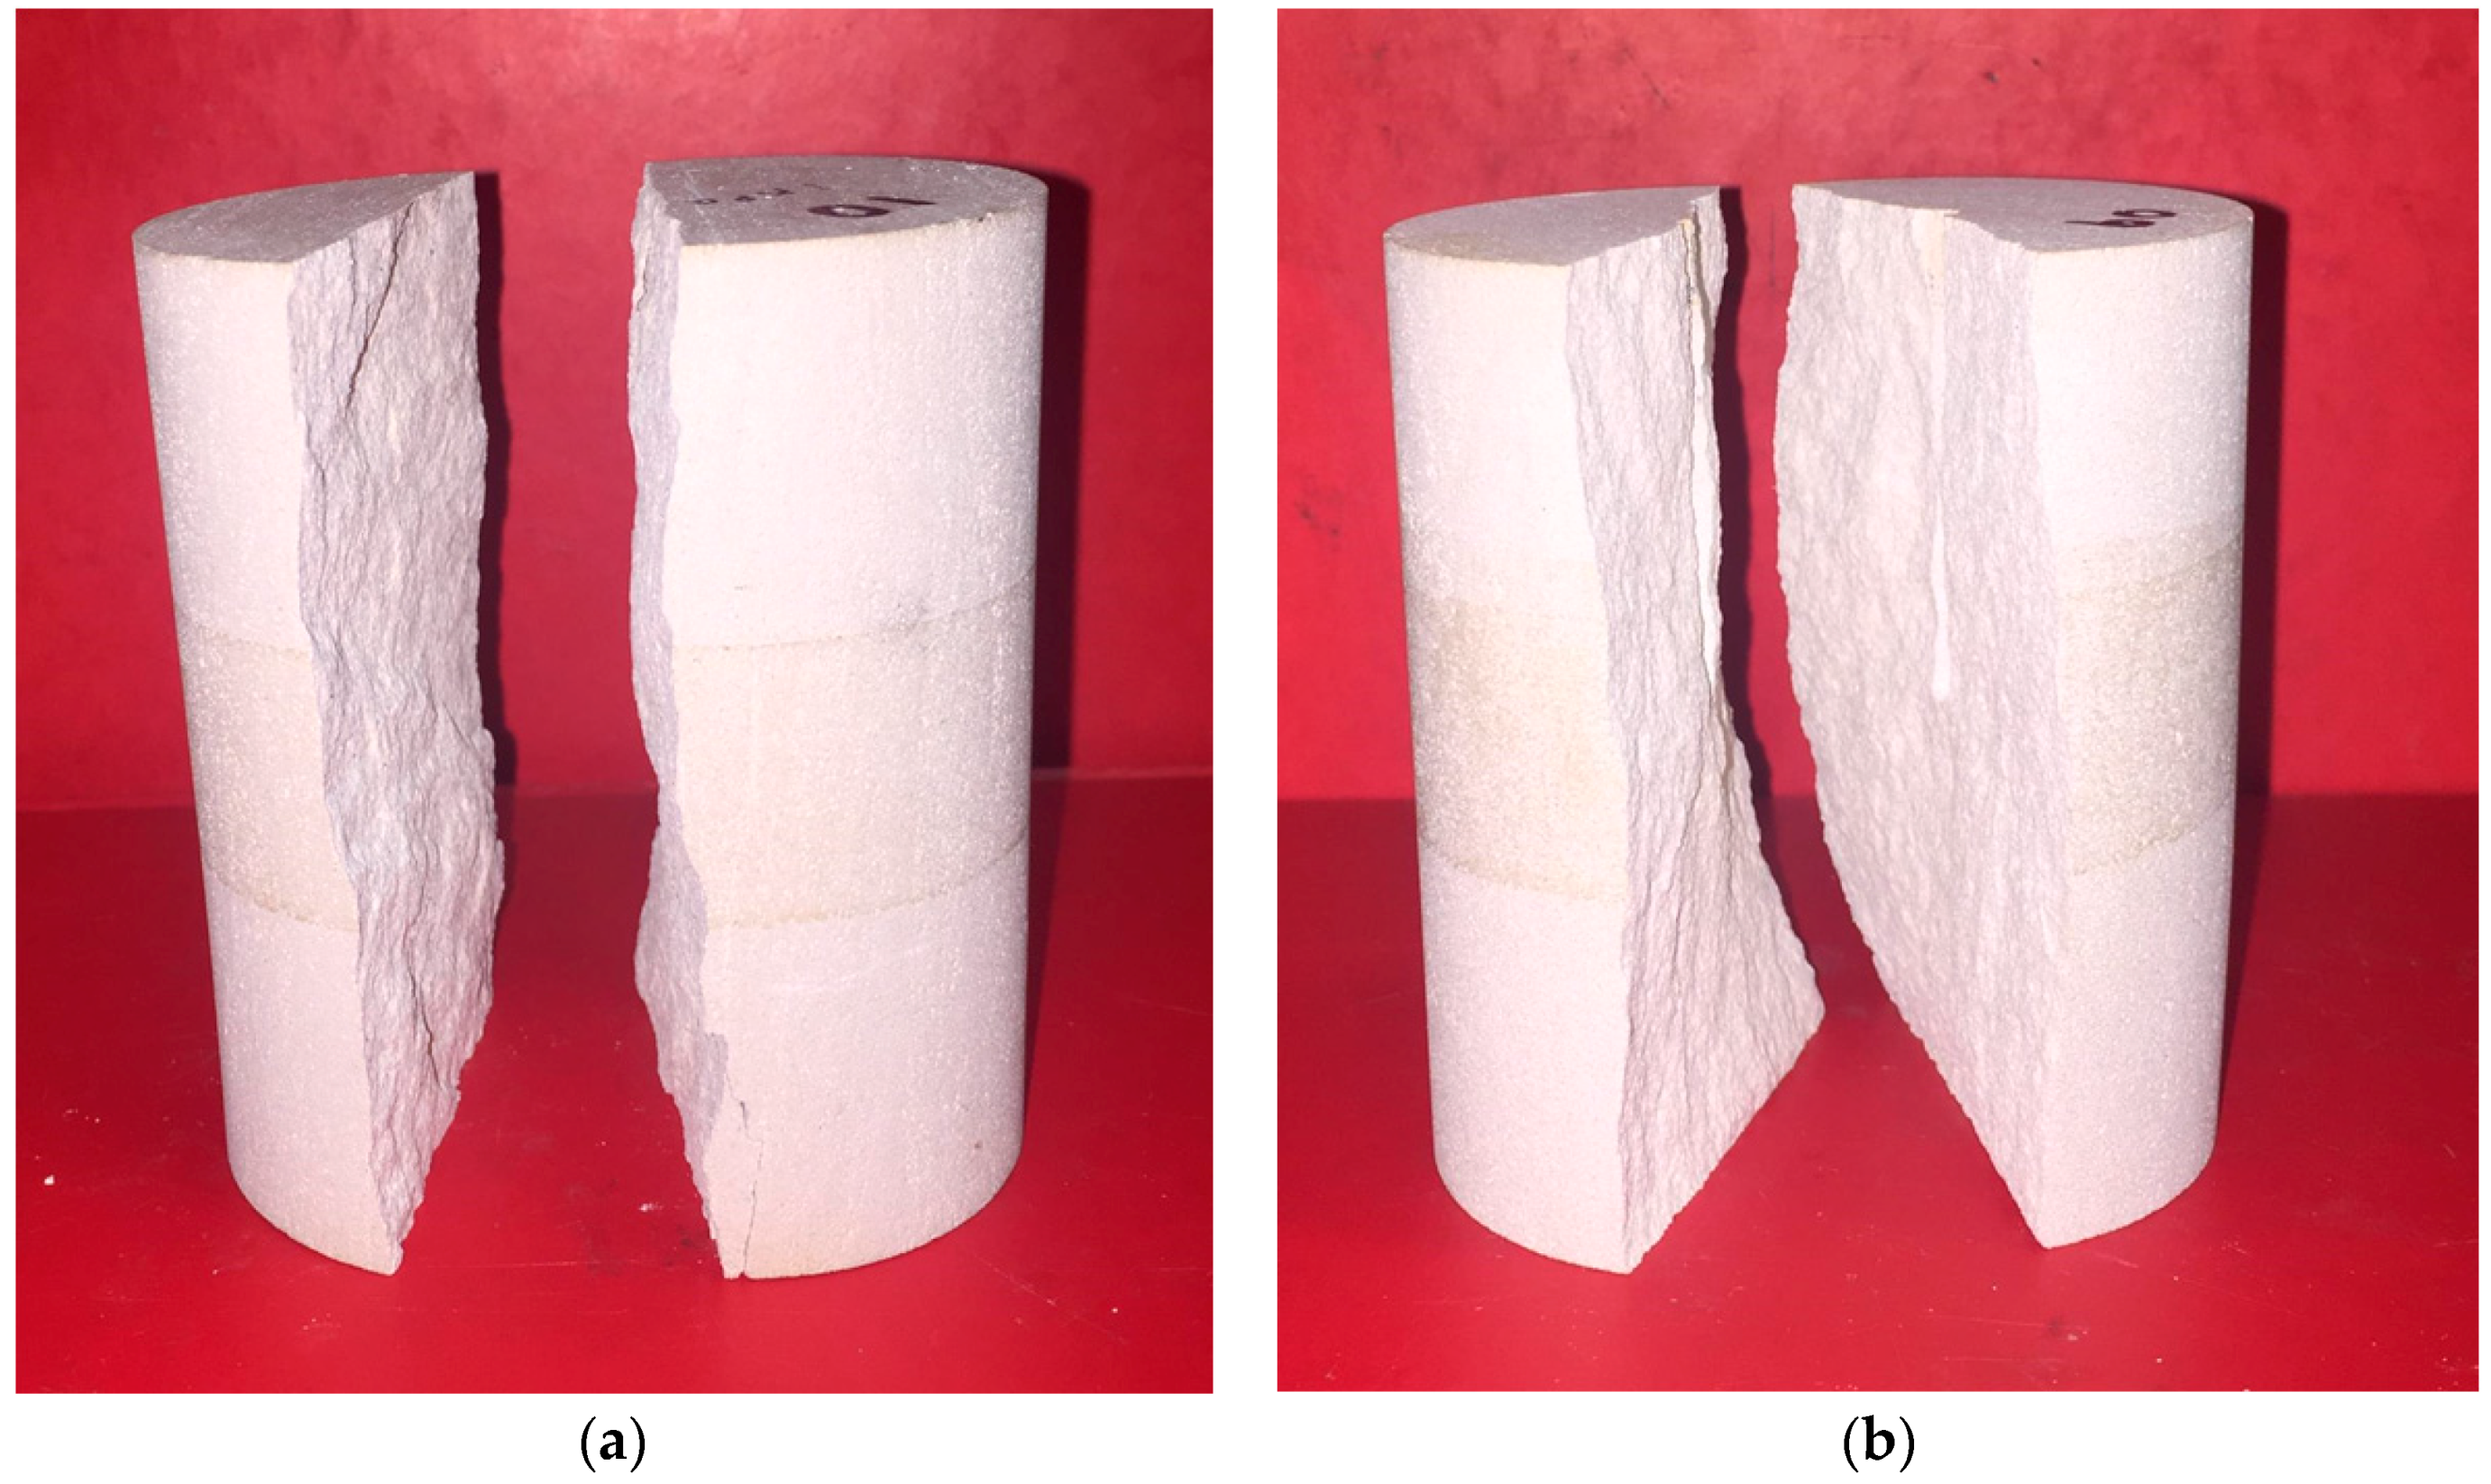
4.2. Effect of Confinement on Fracture Pattern and Failure Surface

The effect of confinement on the fracture pattern and failure surface of water-fractured samples was then analysed, based on the images taken before and after fracturing. According to the failure patterns, when the confining pressure is 1 to 3 MPa, the fracture is radial (the fracture occurs only on one side of the sample) and when the confining pressure is 5 to 7 MPa, the fracture is diametrical (the fracture continues through the diameter of the sample). Figure 6 shows the fracture patterns observed in samples which failed at 1 MPa and 7 MPa confinements. The reason for the different failure patterns under low and high confinements can be explained using the negative effective stress principle. According to Figure 4, the breakdown pressures are around 2.5 and 18.2 MPa at 1 and 7 MPa confining pressures respectively, and the corresponding negative stresses are around 1.5 and 11.2 MPa, respectively. See Equation (11) [32]:
σ e f f = σ c σ p
where σeff is the effective stress, σc is the confining pressure or stress, and σp is the pore pressure of the sample. This equation can only be used based on two main assumptions: the rock grains are incompressible and the yield stress in the grain material is independent of the confining pressure [33], both of which are applicable to siltstone. As shown in Figure 7, the effective net force acting on the surface of the wellbore in the outward direction is always proportional to the negative effective stress, because the surface area of the wellbore remains constant throughout the fracturing process. As previously stated, the negative effective stress is positively correlated with the confining pressure. Therefore, the net force acting on the wellbore surface is high at higher confining pressures. This means that greater force and higher energy can cause a complete diametrical fracture through the wellbore.
Moreover, for all the confining pressures, the fracture is always along the wellbore, along the vertical plane, due to the greater axial stress (20 MPa) applied compared to the confining pressures. Since fractures are always created perpendicular to the minimum stress direction, here the fracture occurs along the vertical plane. Similar results have been shown by other researchers, including Alpern et al. [21], Hossain et al. [8] and Deng et al. [7] for concrete and artificial materials such as polymethyl methacrylate. Moreover, in relation to the fracture width or aperture, fractured samples under 1 and 7 MPa confining pressures exhibited fracture widths of around 12 μm and 29 μm, respectively, upon the release of confinement pressure. This demonstrates that the fracture width increases with increasing confining pressure, which is important for the hydraulic fracturing process. Based on this observation, wider fracture generation can be expected from the hydraulic fracturing process in deeper geological formations compared to shallow reservoirs. However, it should be noted that in the present study the fracture aperture was measured after releasing the confinement, which would be much higher than the fracture aperture in field conditions under the application of great confinements.
Interestingly, not only the fracture width, but also the length was found to be confining pressure-dependent (Figure 6). According to Figure 6, a hydraulically fractured sample at 7 MPa confining pressure splits into two parts along the wellbore. This means that at the final breakdown, the fracture has been propagated throughout the sample, splitting it into two hemi-cylindrical parts. However, in the hydraulically fractured sample at 1 MPa confining pressure, the fracture propagated only up to 58 mm along the sample (13 mm beyond the wellbore), which is only about 64% and 29% compared to the total height of the sample and the sample height without the wellbore, respectively. This can be explained using the same negative effective stress principle described above, where at high confining pressures the fracturing fluid applies a higher force on the wellbore, causing a fracture through the sample. When the confining pressure is as low as 1 MPa, the negative effective stress on the sample is lower, and therefore after the final failure, the effective stress on the sample quickly becomes zero, preventing further fracture propagation throughout the sample. Moreover, according to Figure 8, the fracture surface of the partially fractured sample is approximately in a single plane and the fracture surface of the fully fractured sample has been twisted, creating a larger surface area. However, it should be noted that the partially fractured sample has been mechanically split into two parts to obtain the fracture surface. In field conditions, a greater fracture surface area is one of the ultimate goals to extract a significant amount of gas from the geological formation through the accelerated diffusion process. According to these observations, the fracture width, length, area and fracture surface depend on the confining pressure. This implies that, when fracturing a deep geological formation using water, it is vital to consider the depth of the reservoir to estimate both the breakdown pressure of the reservoir and the characteristics of the fracture network, including the length, width and surface areas of the fractures.

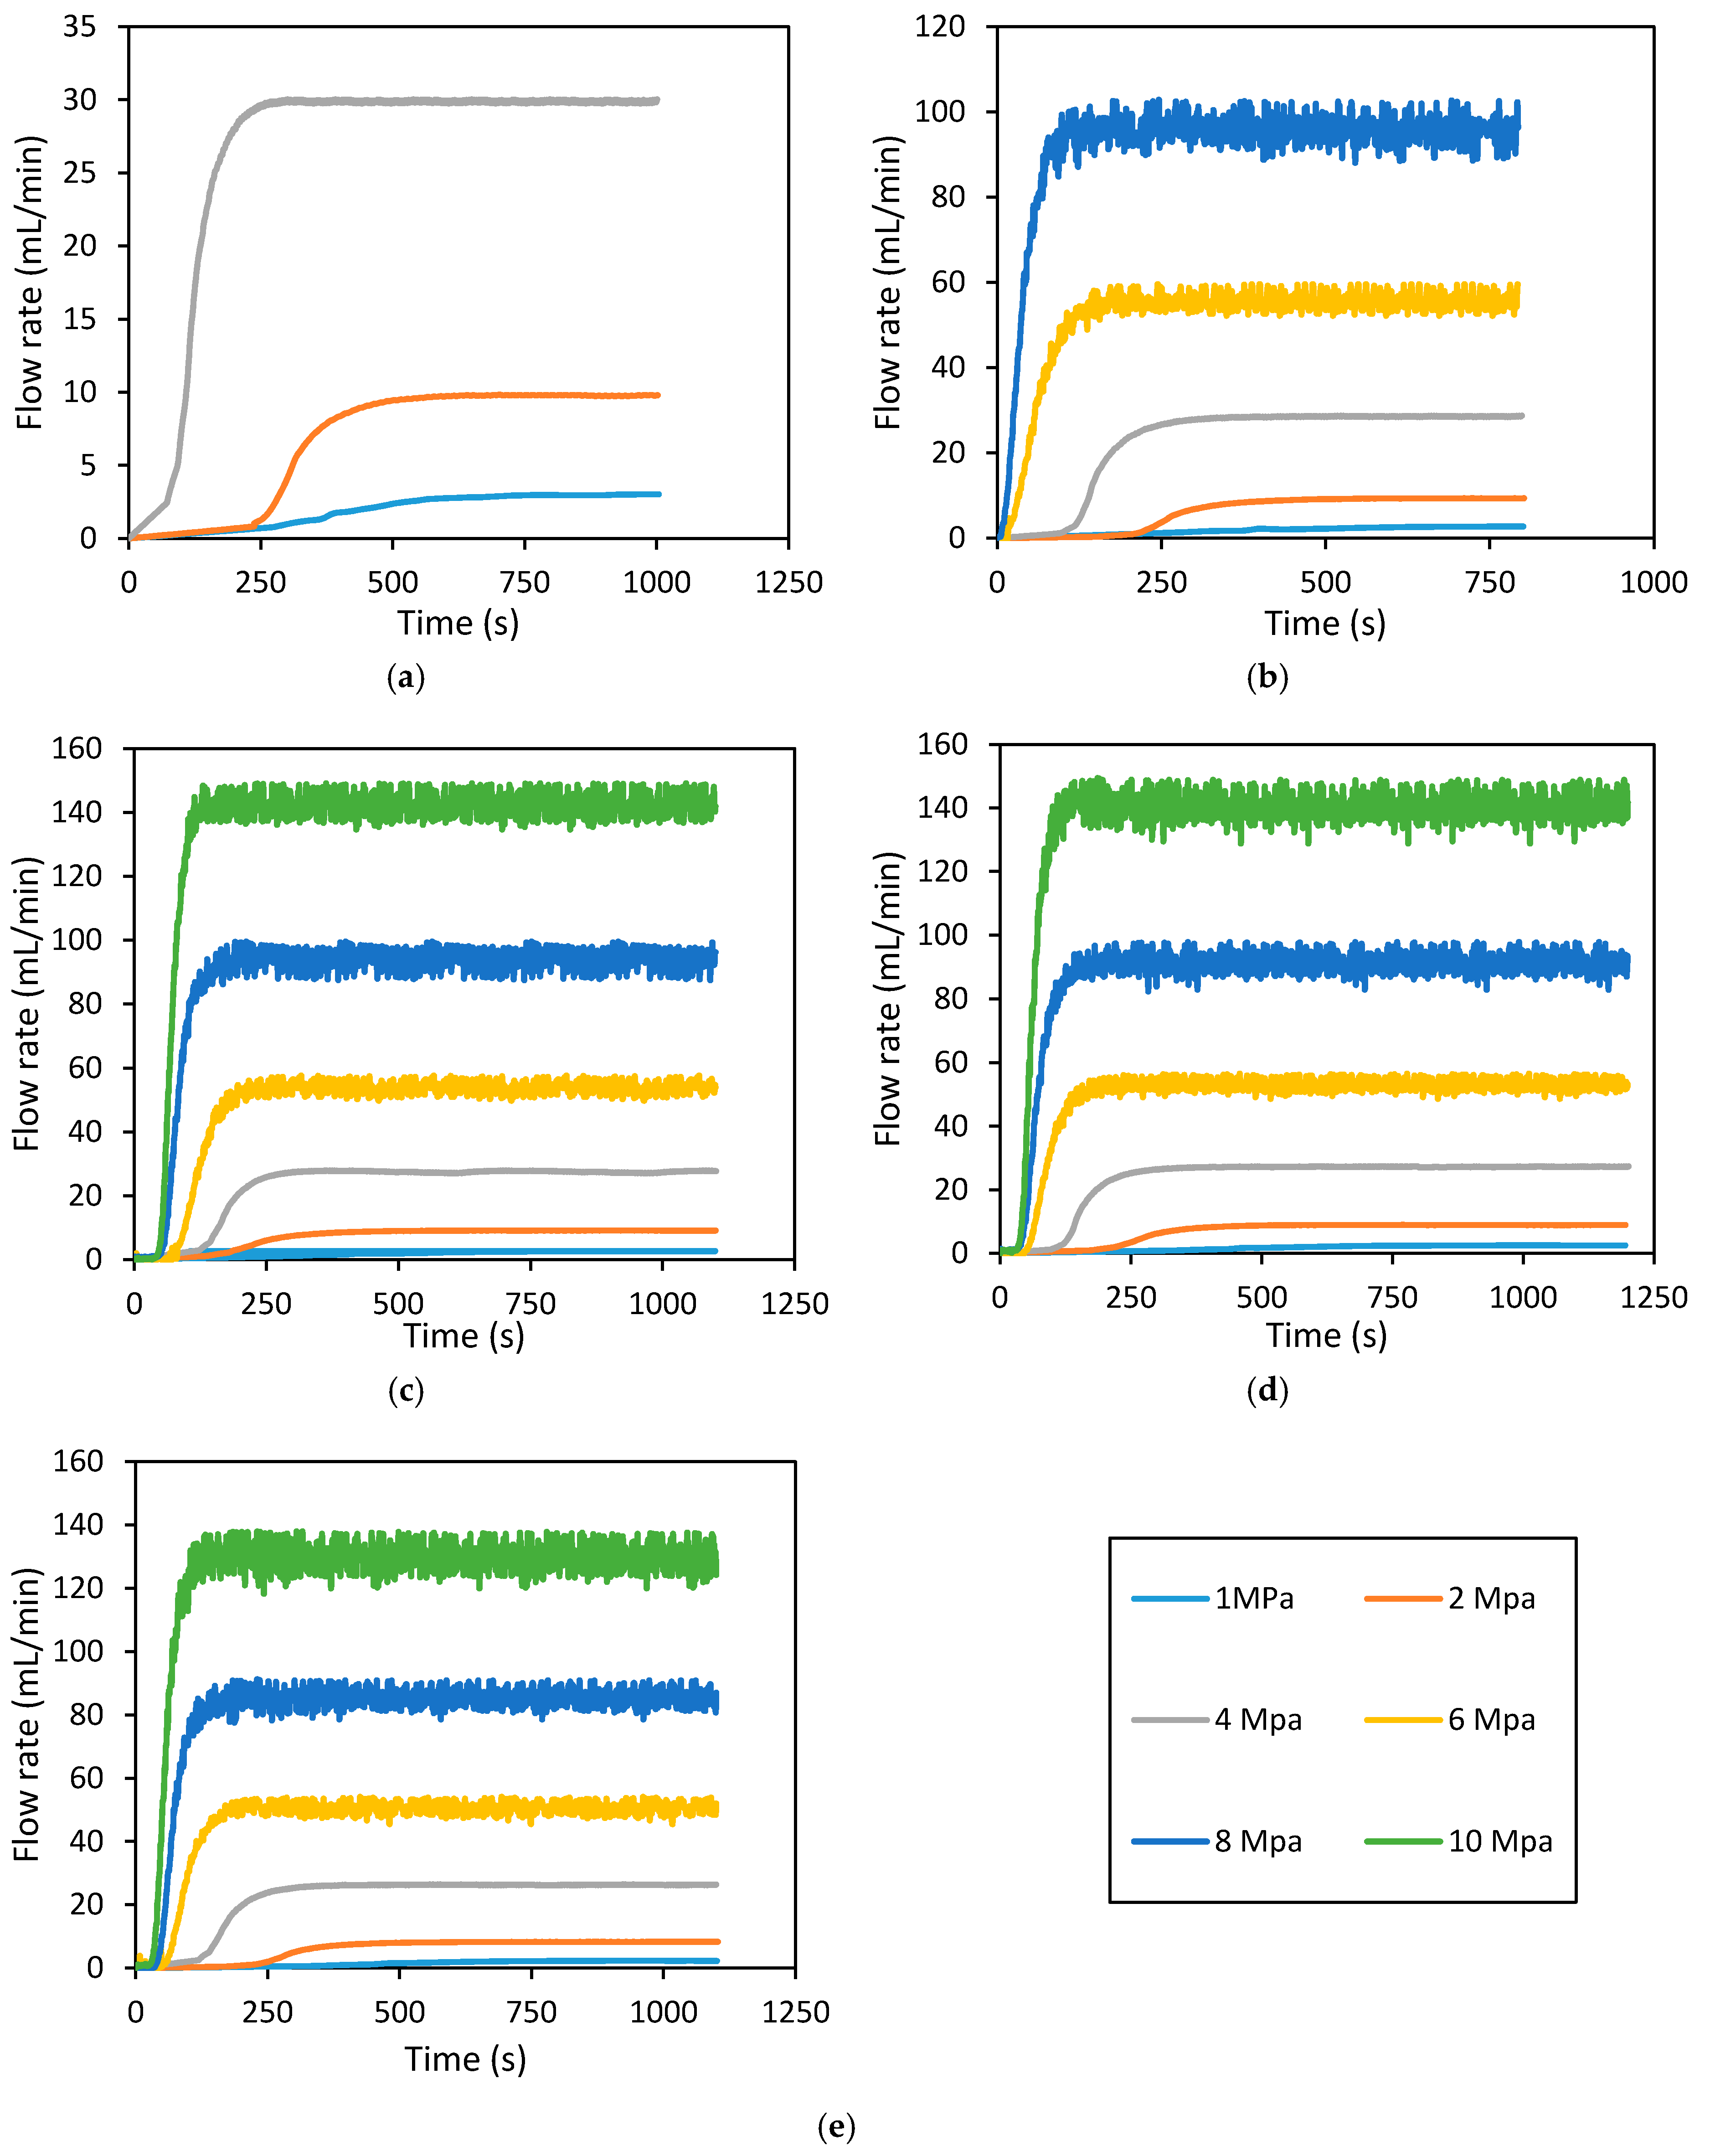
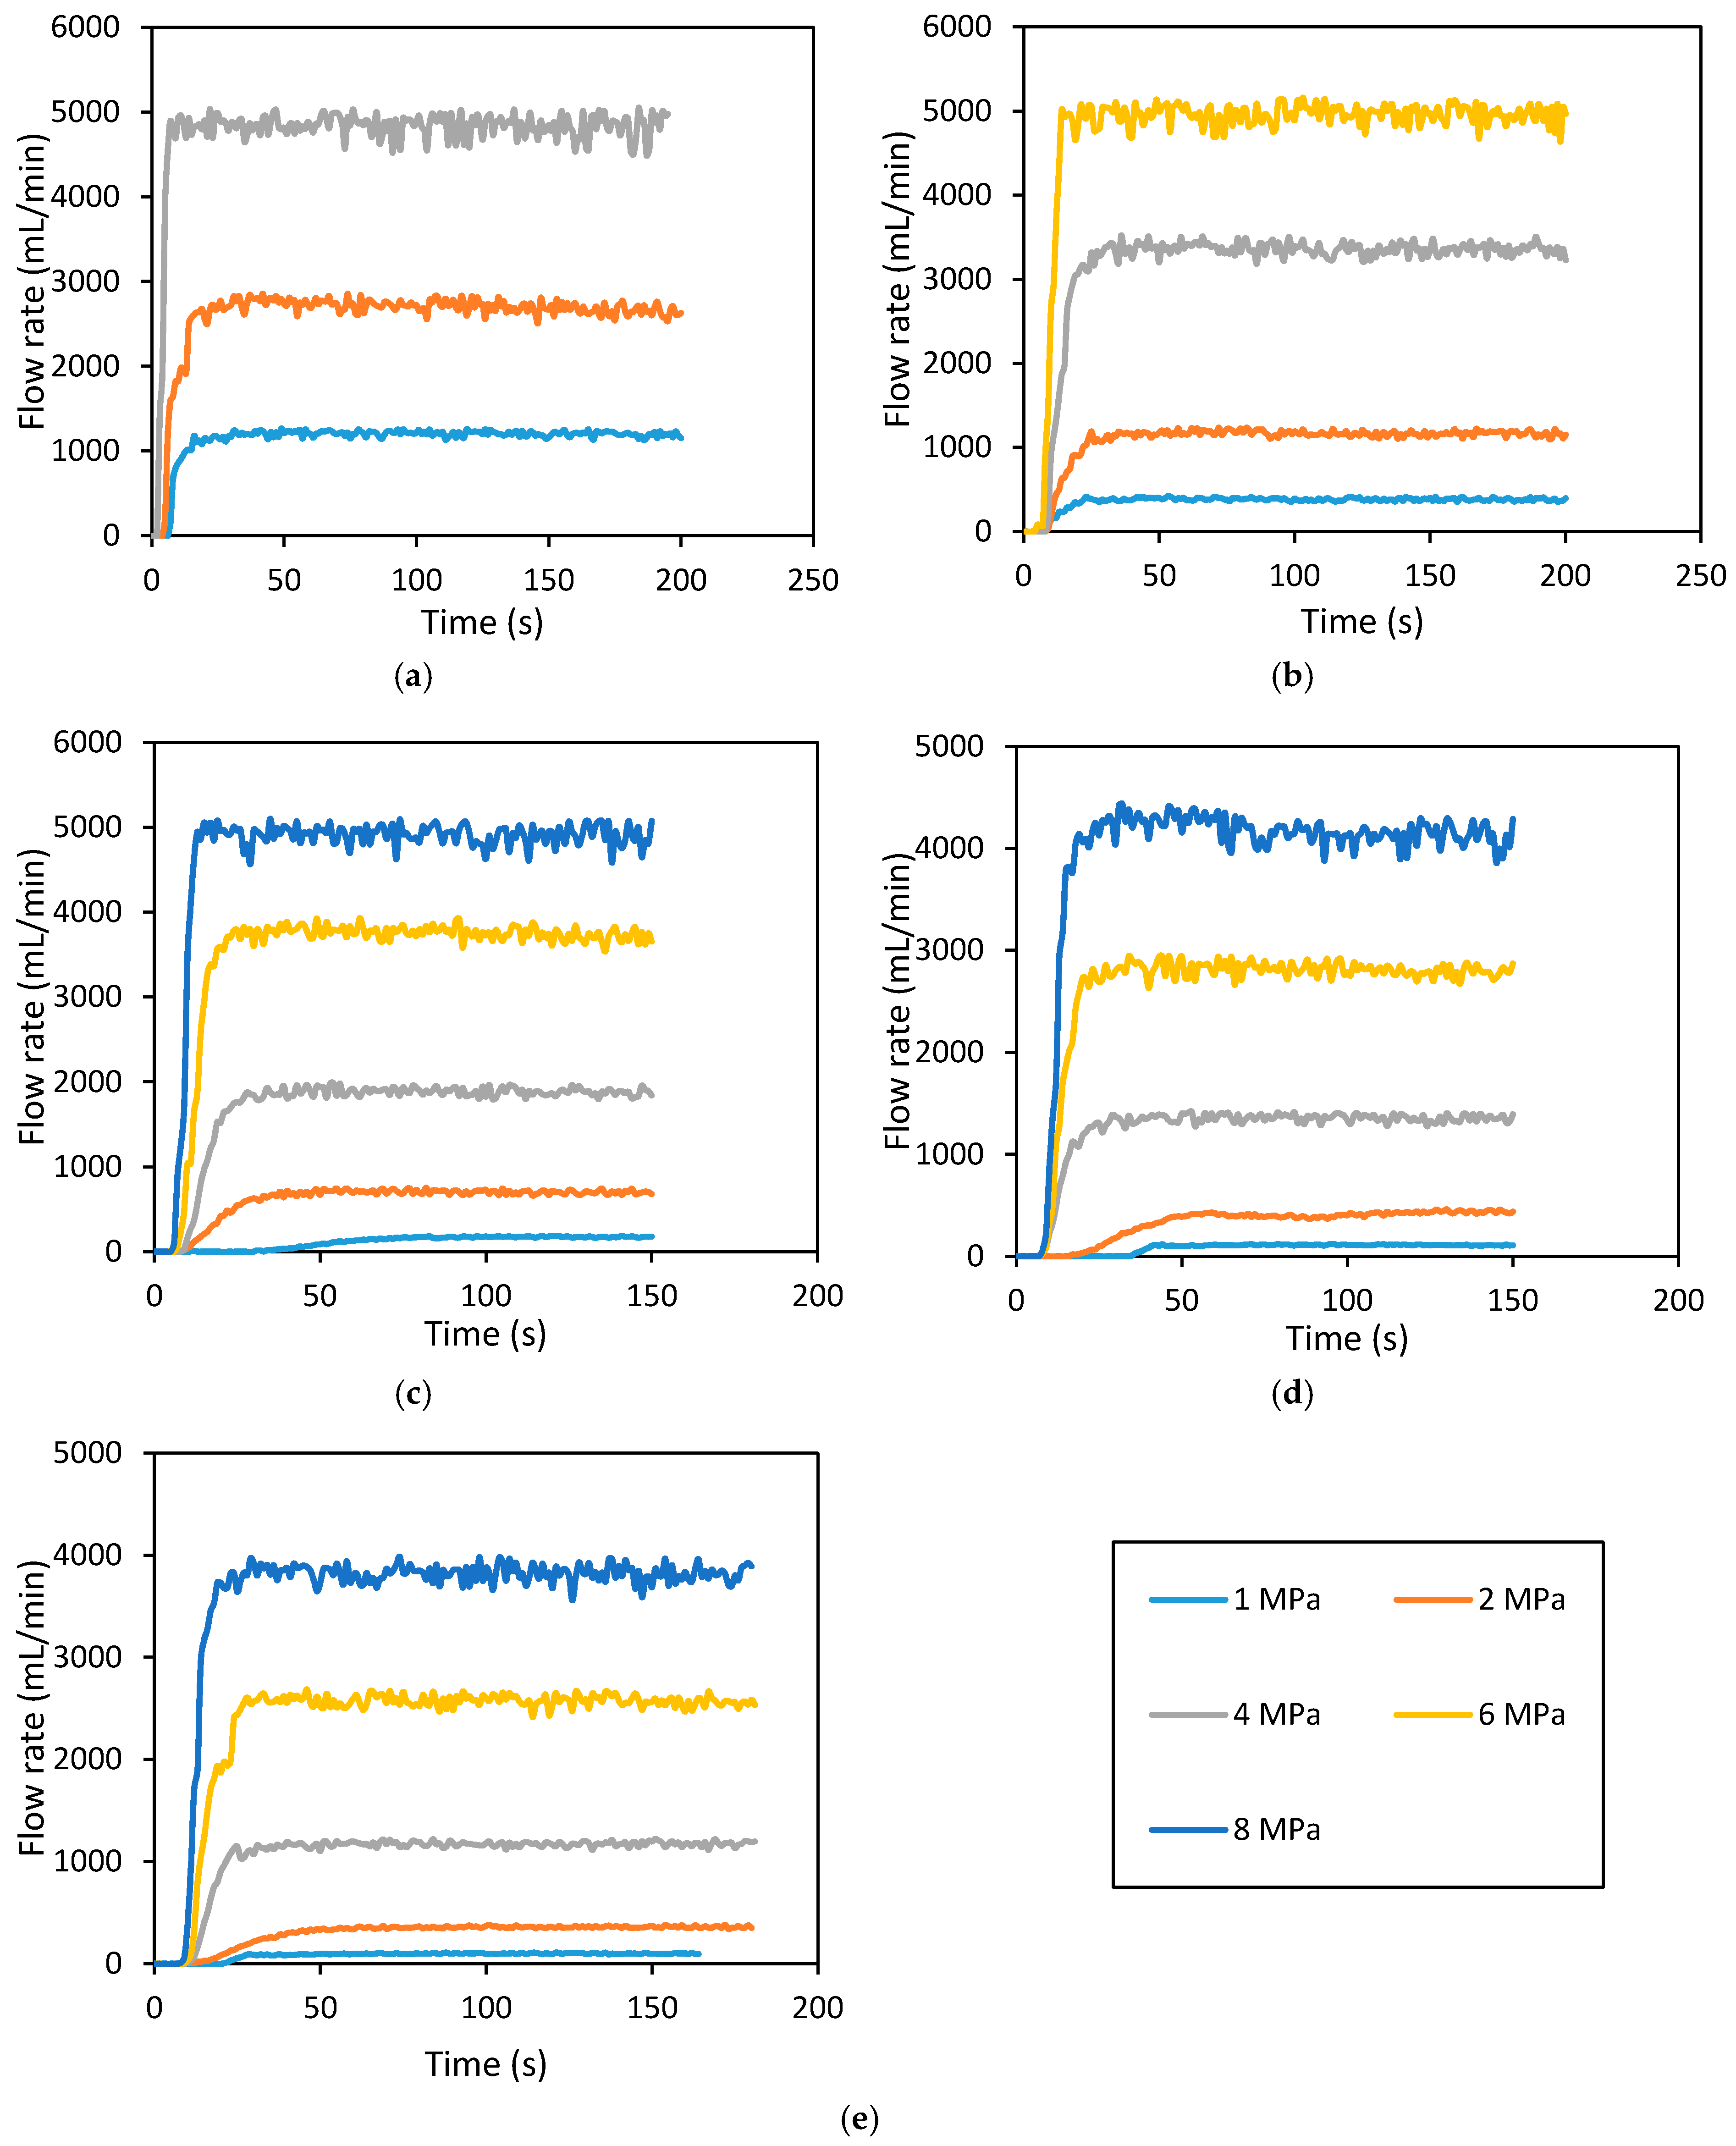
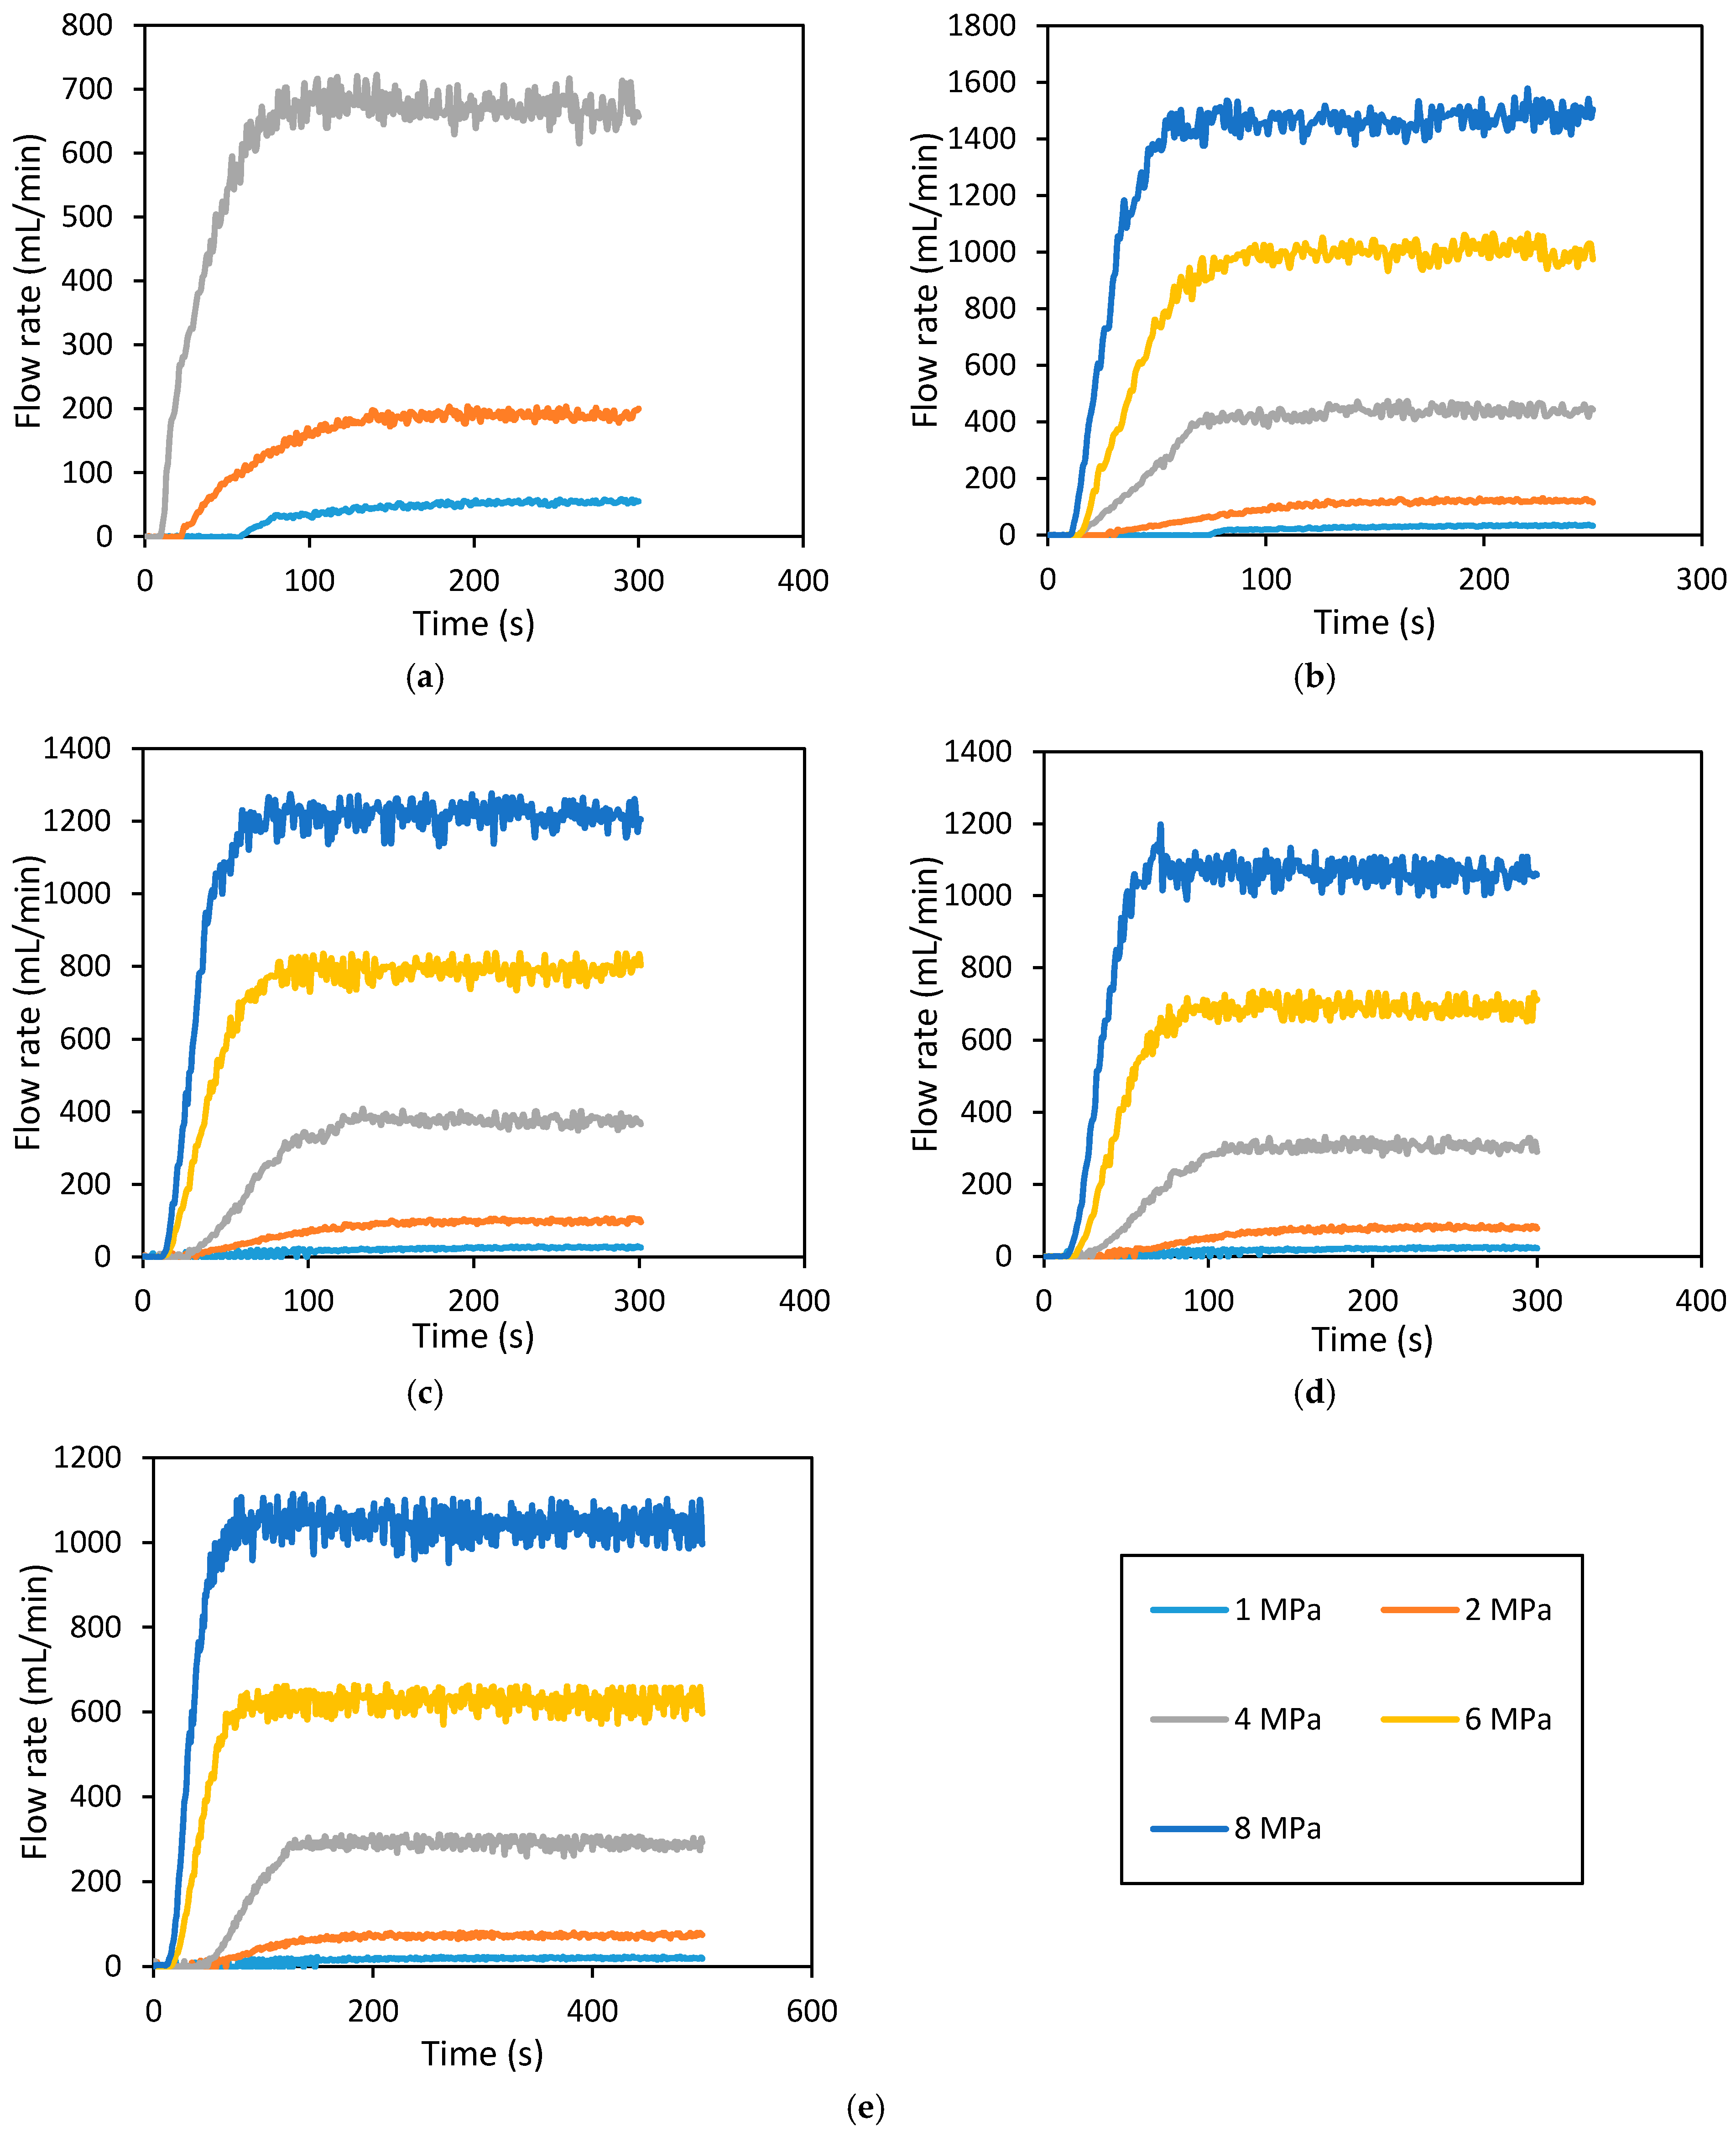
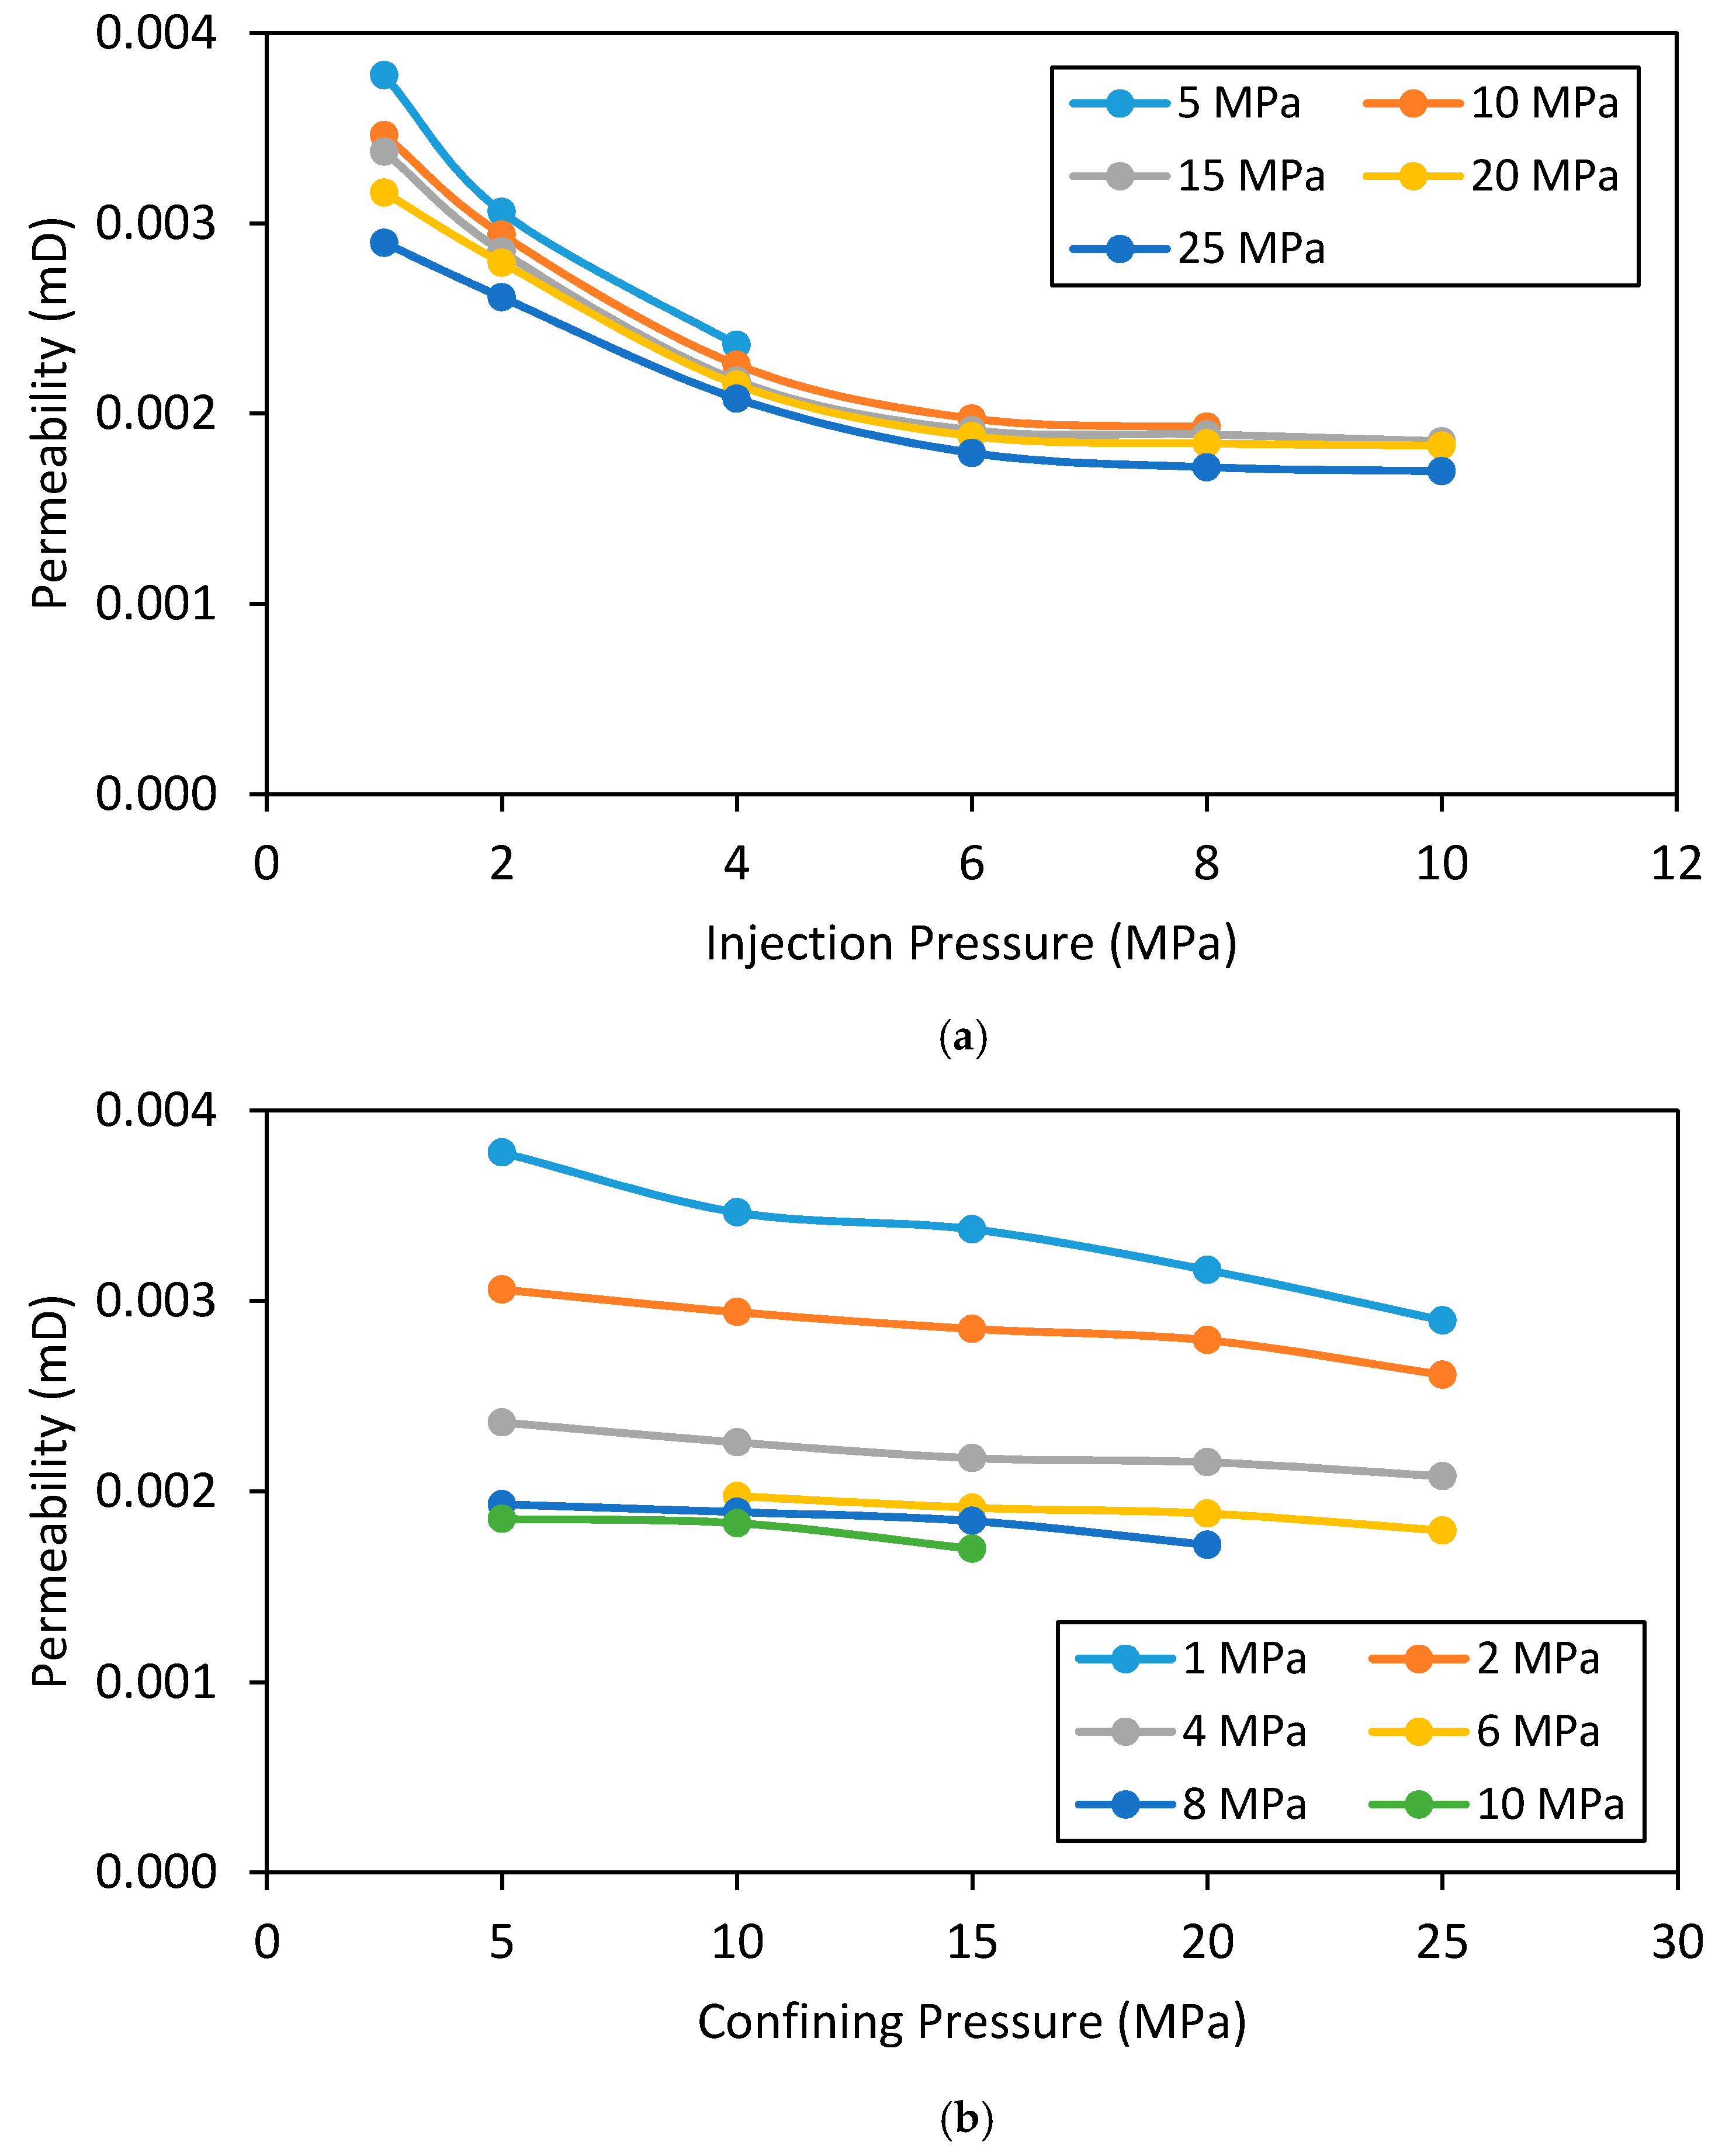
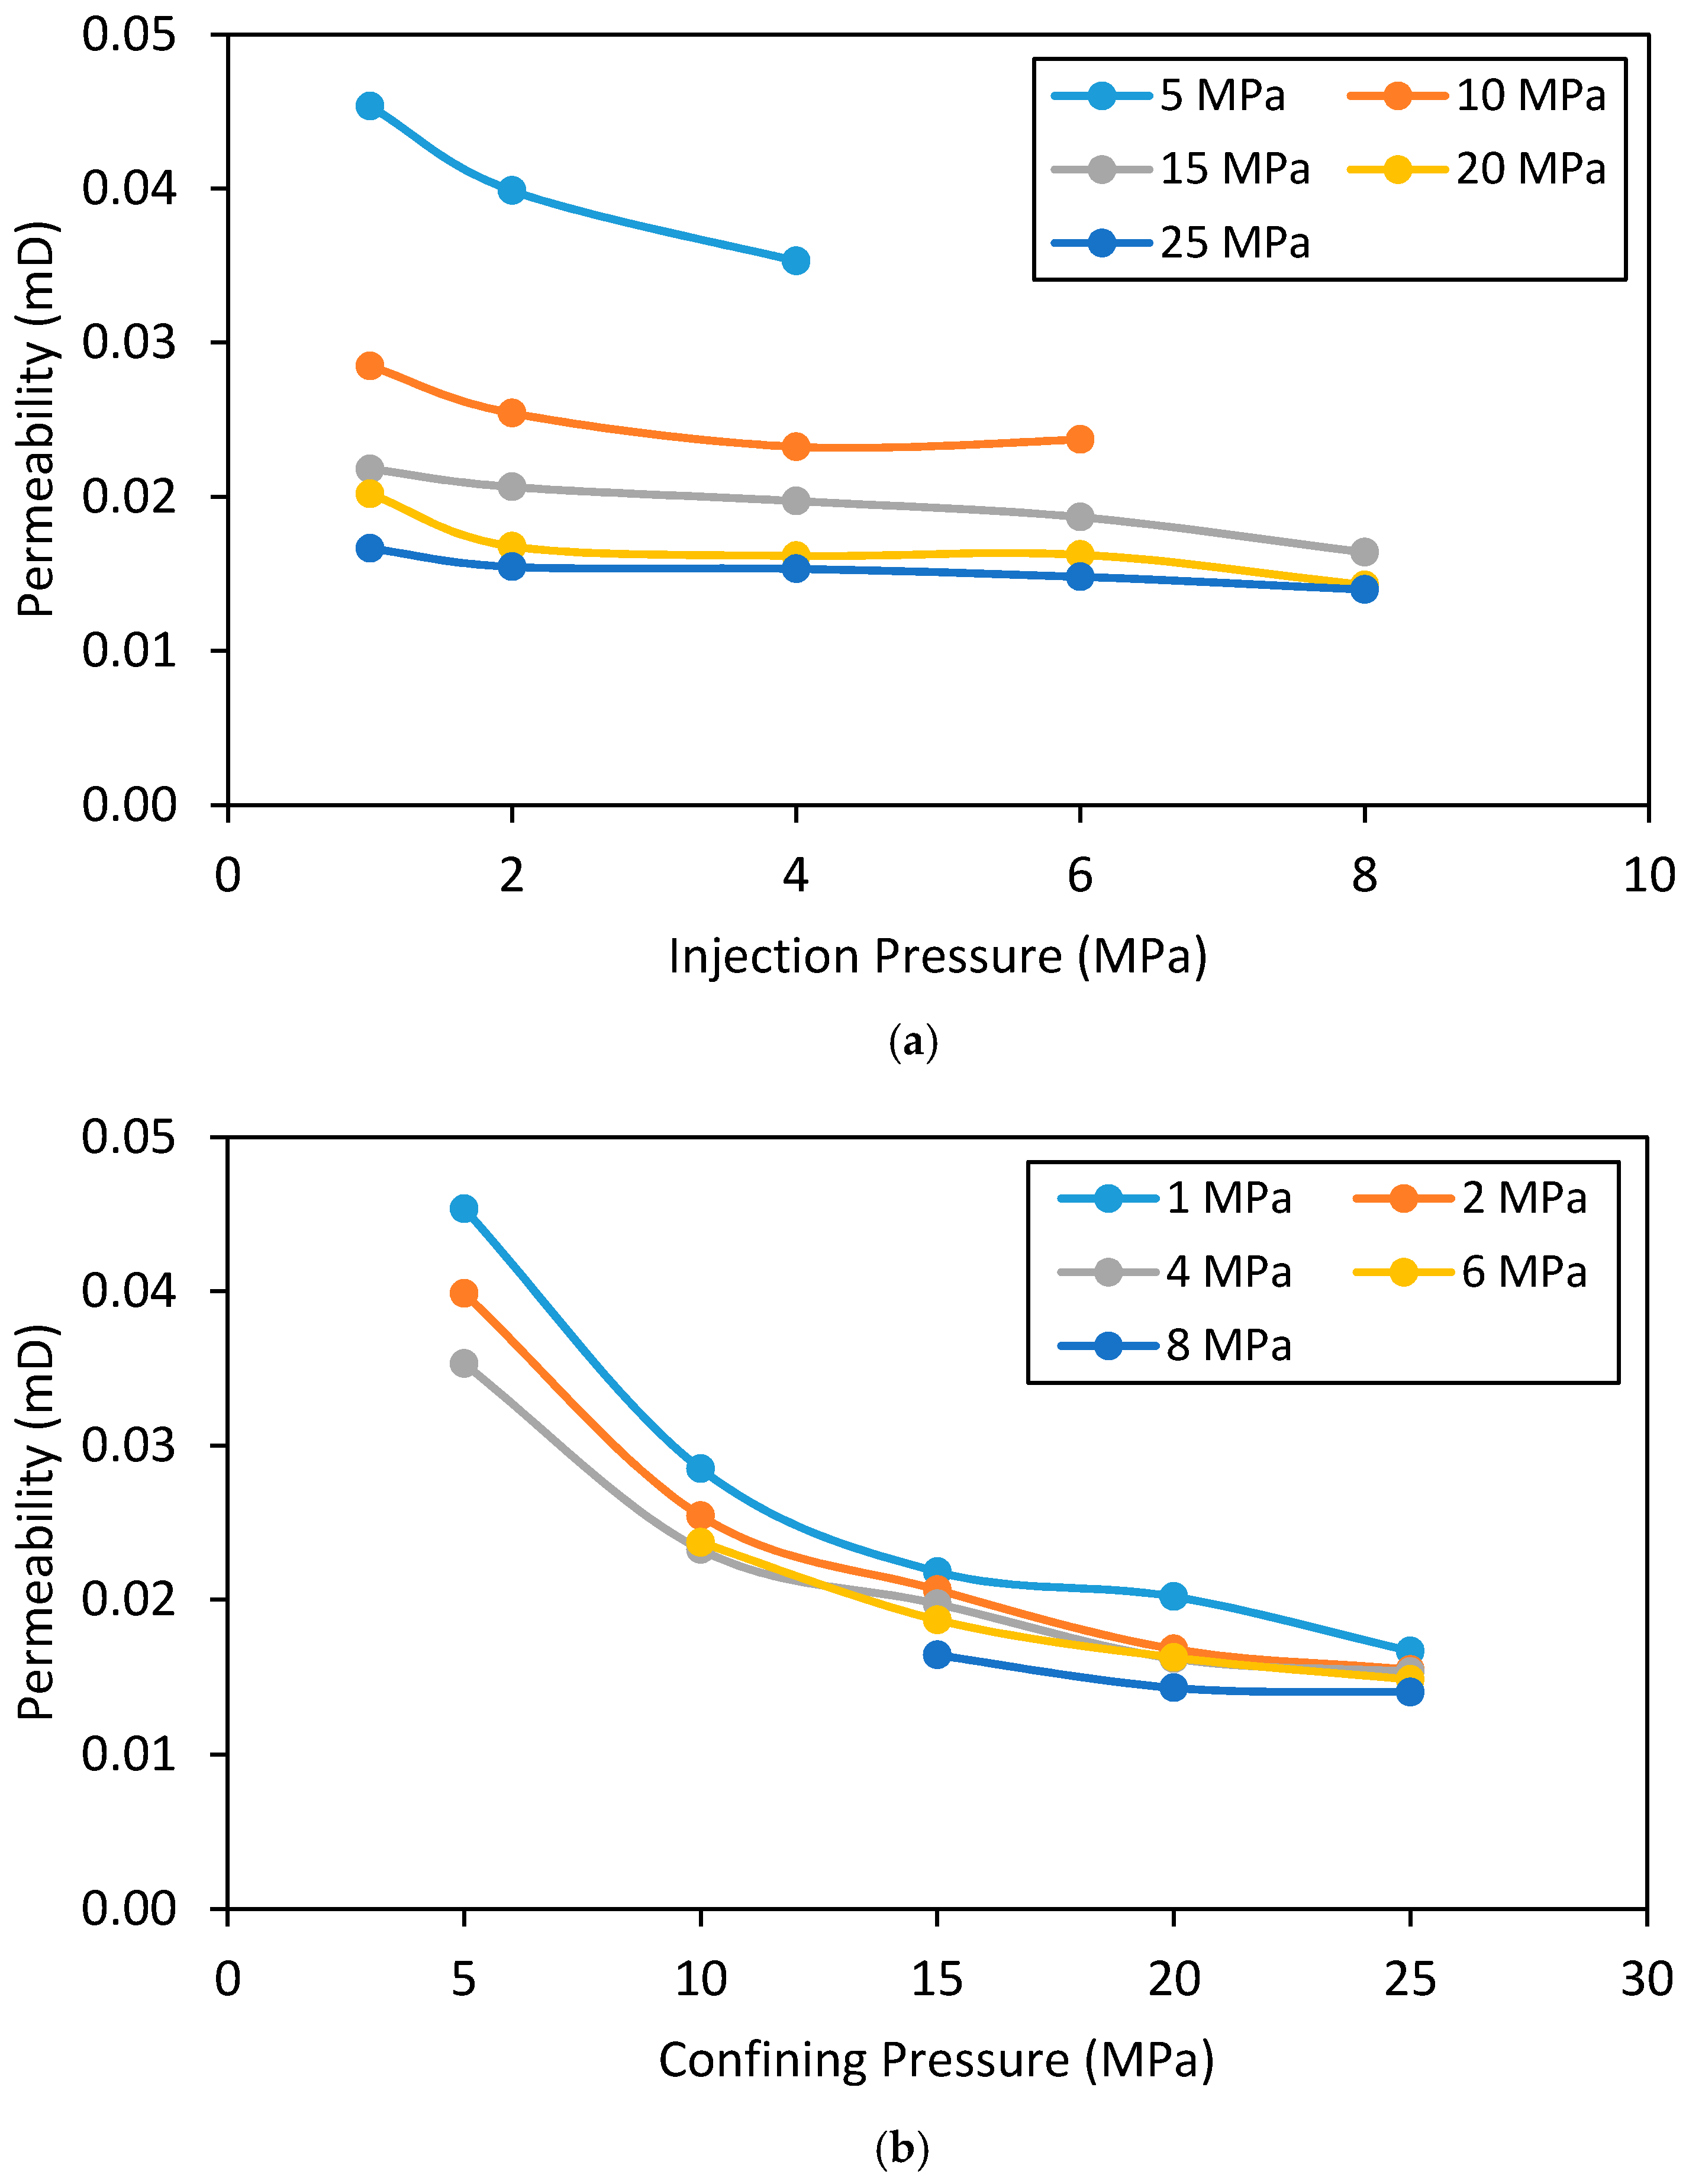
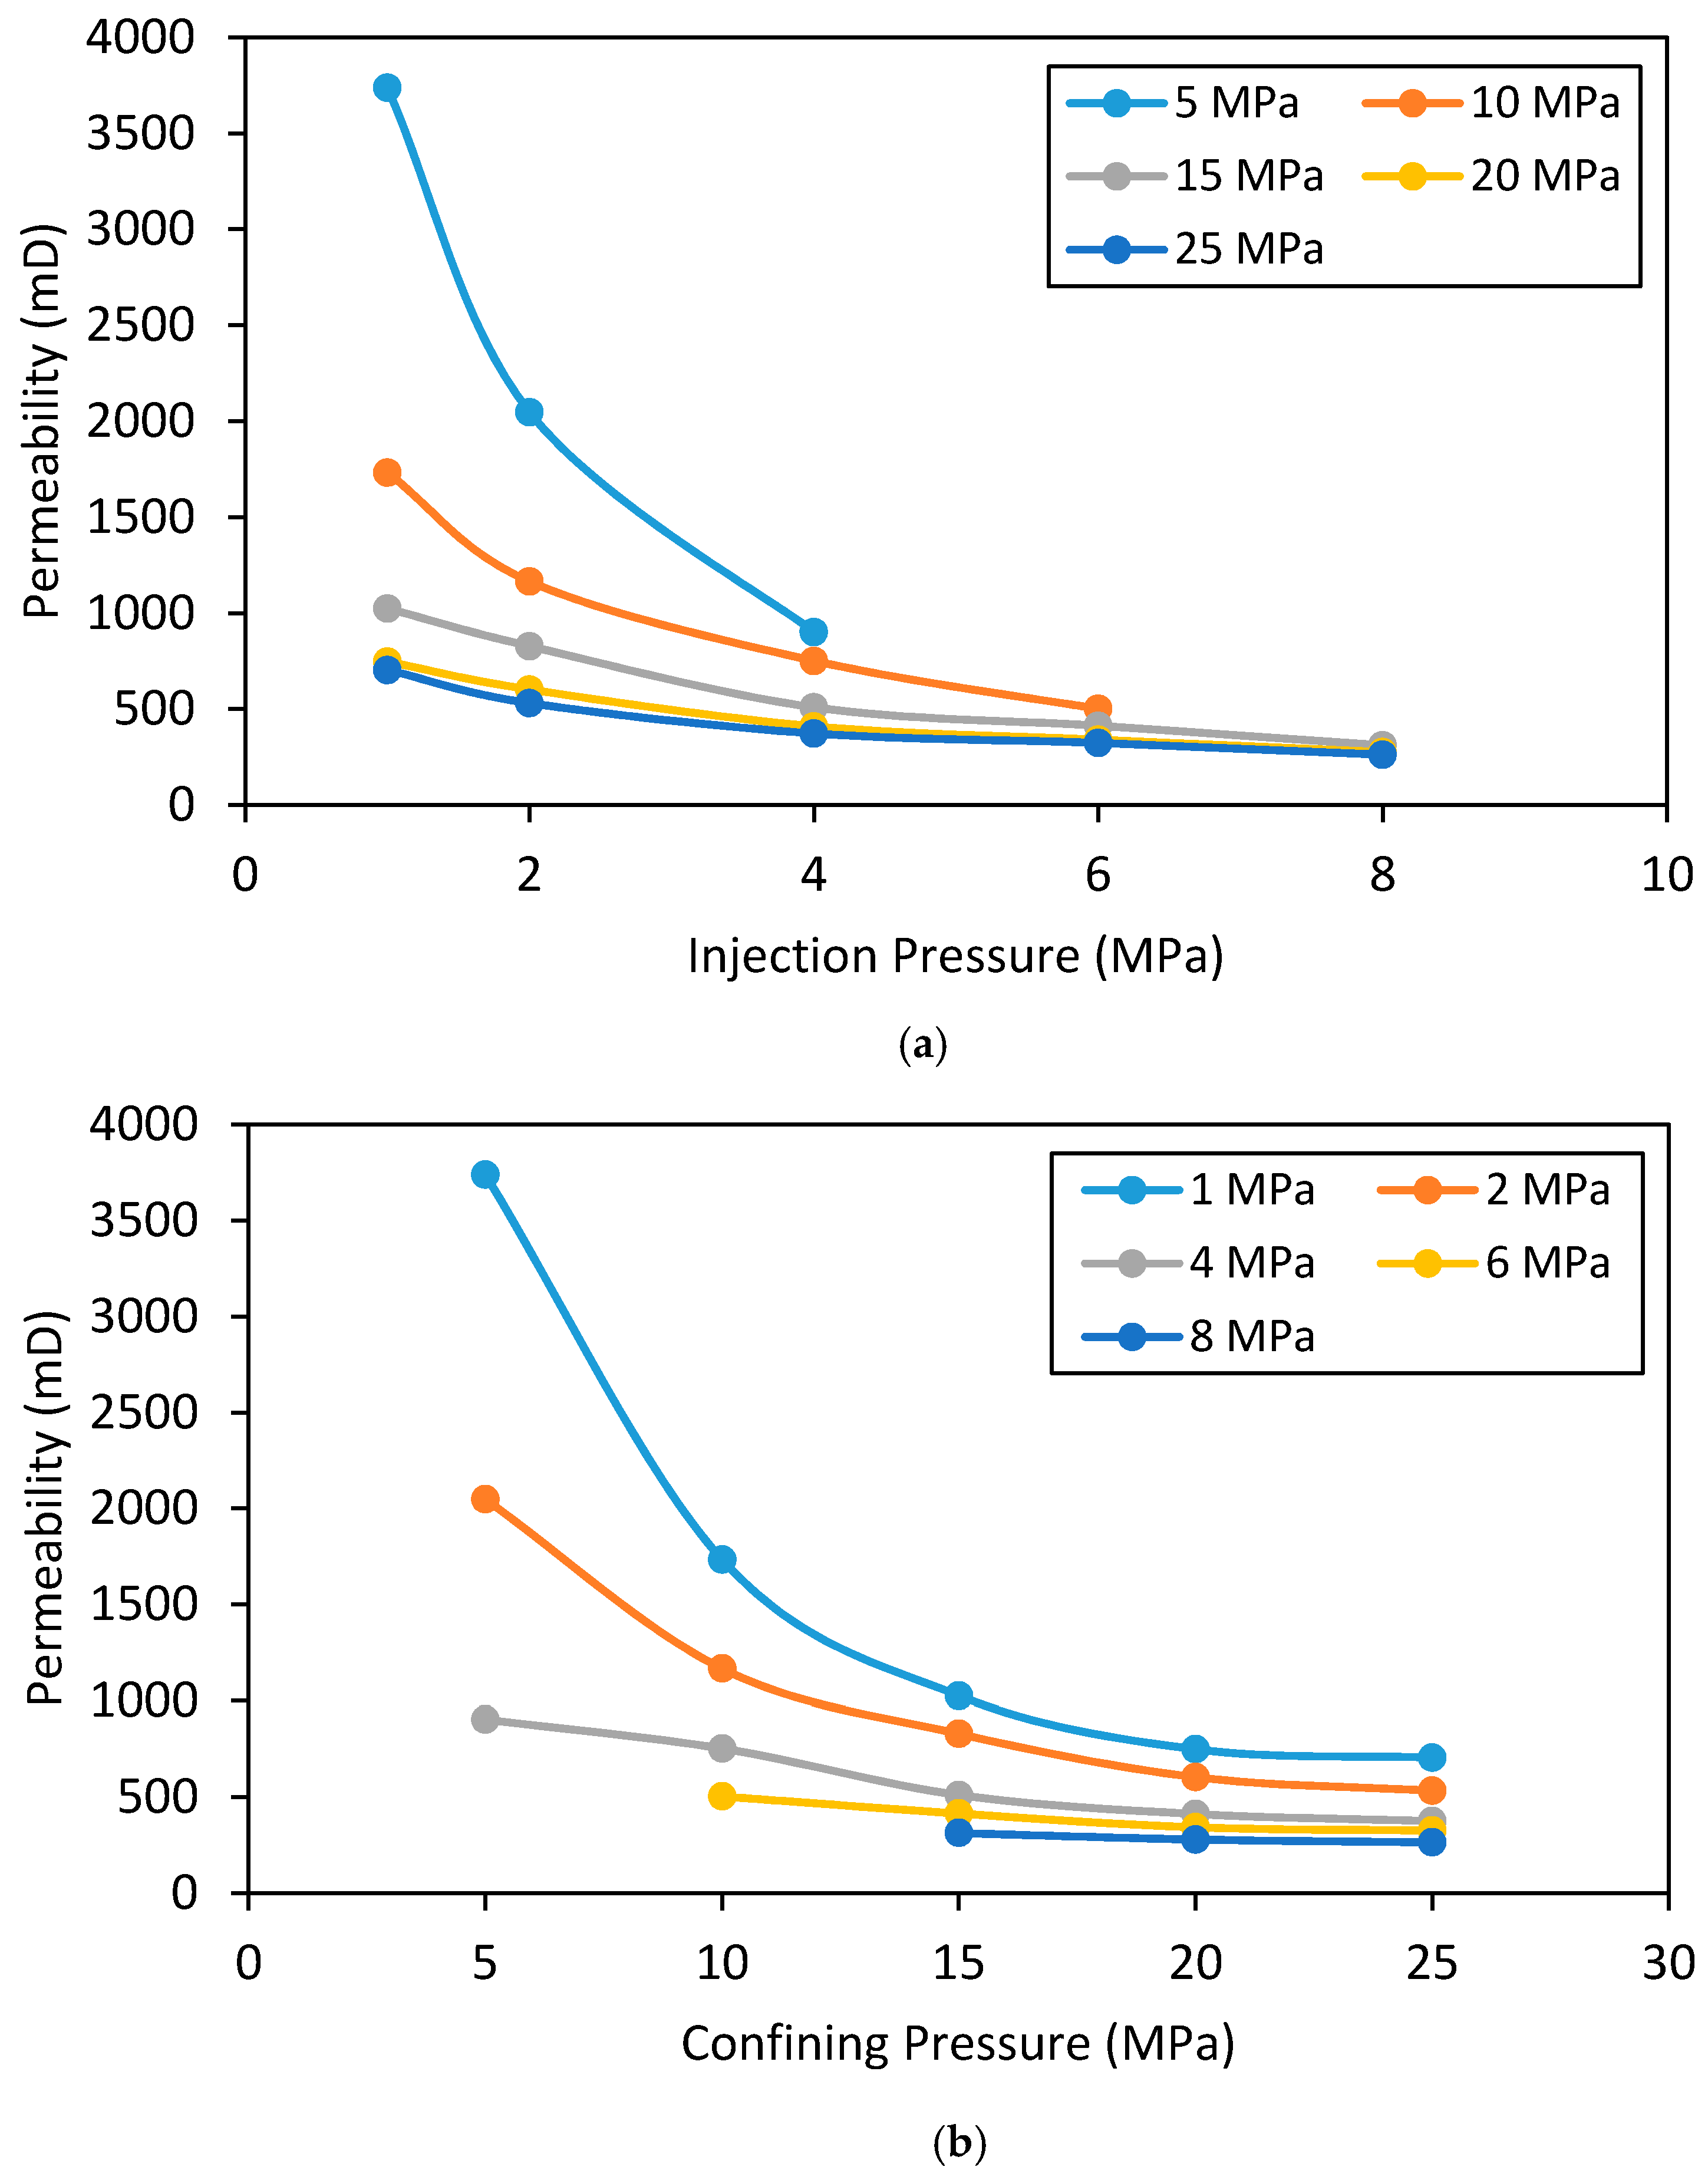
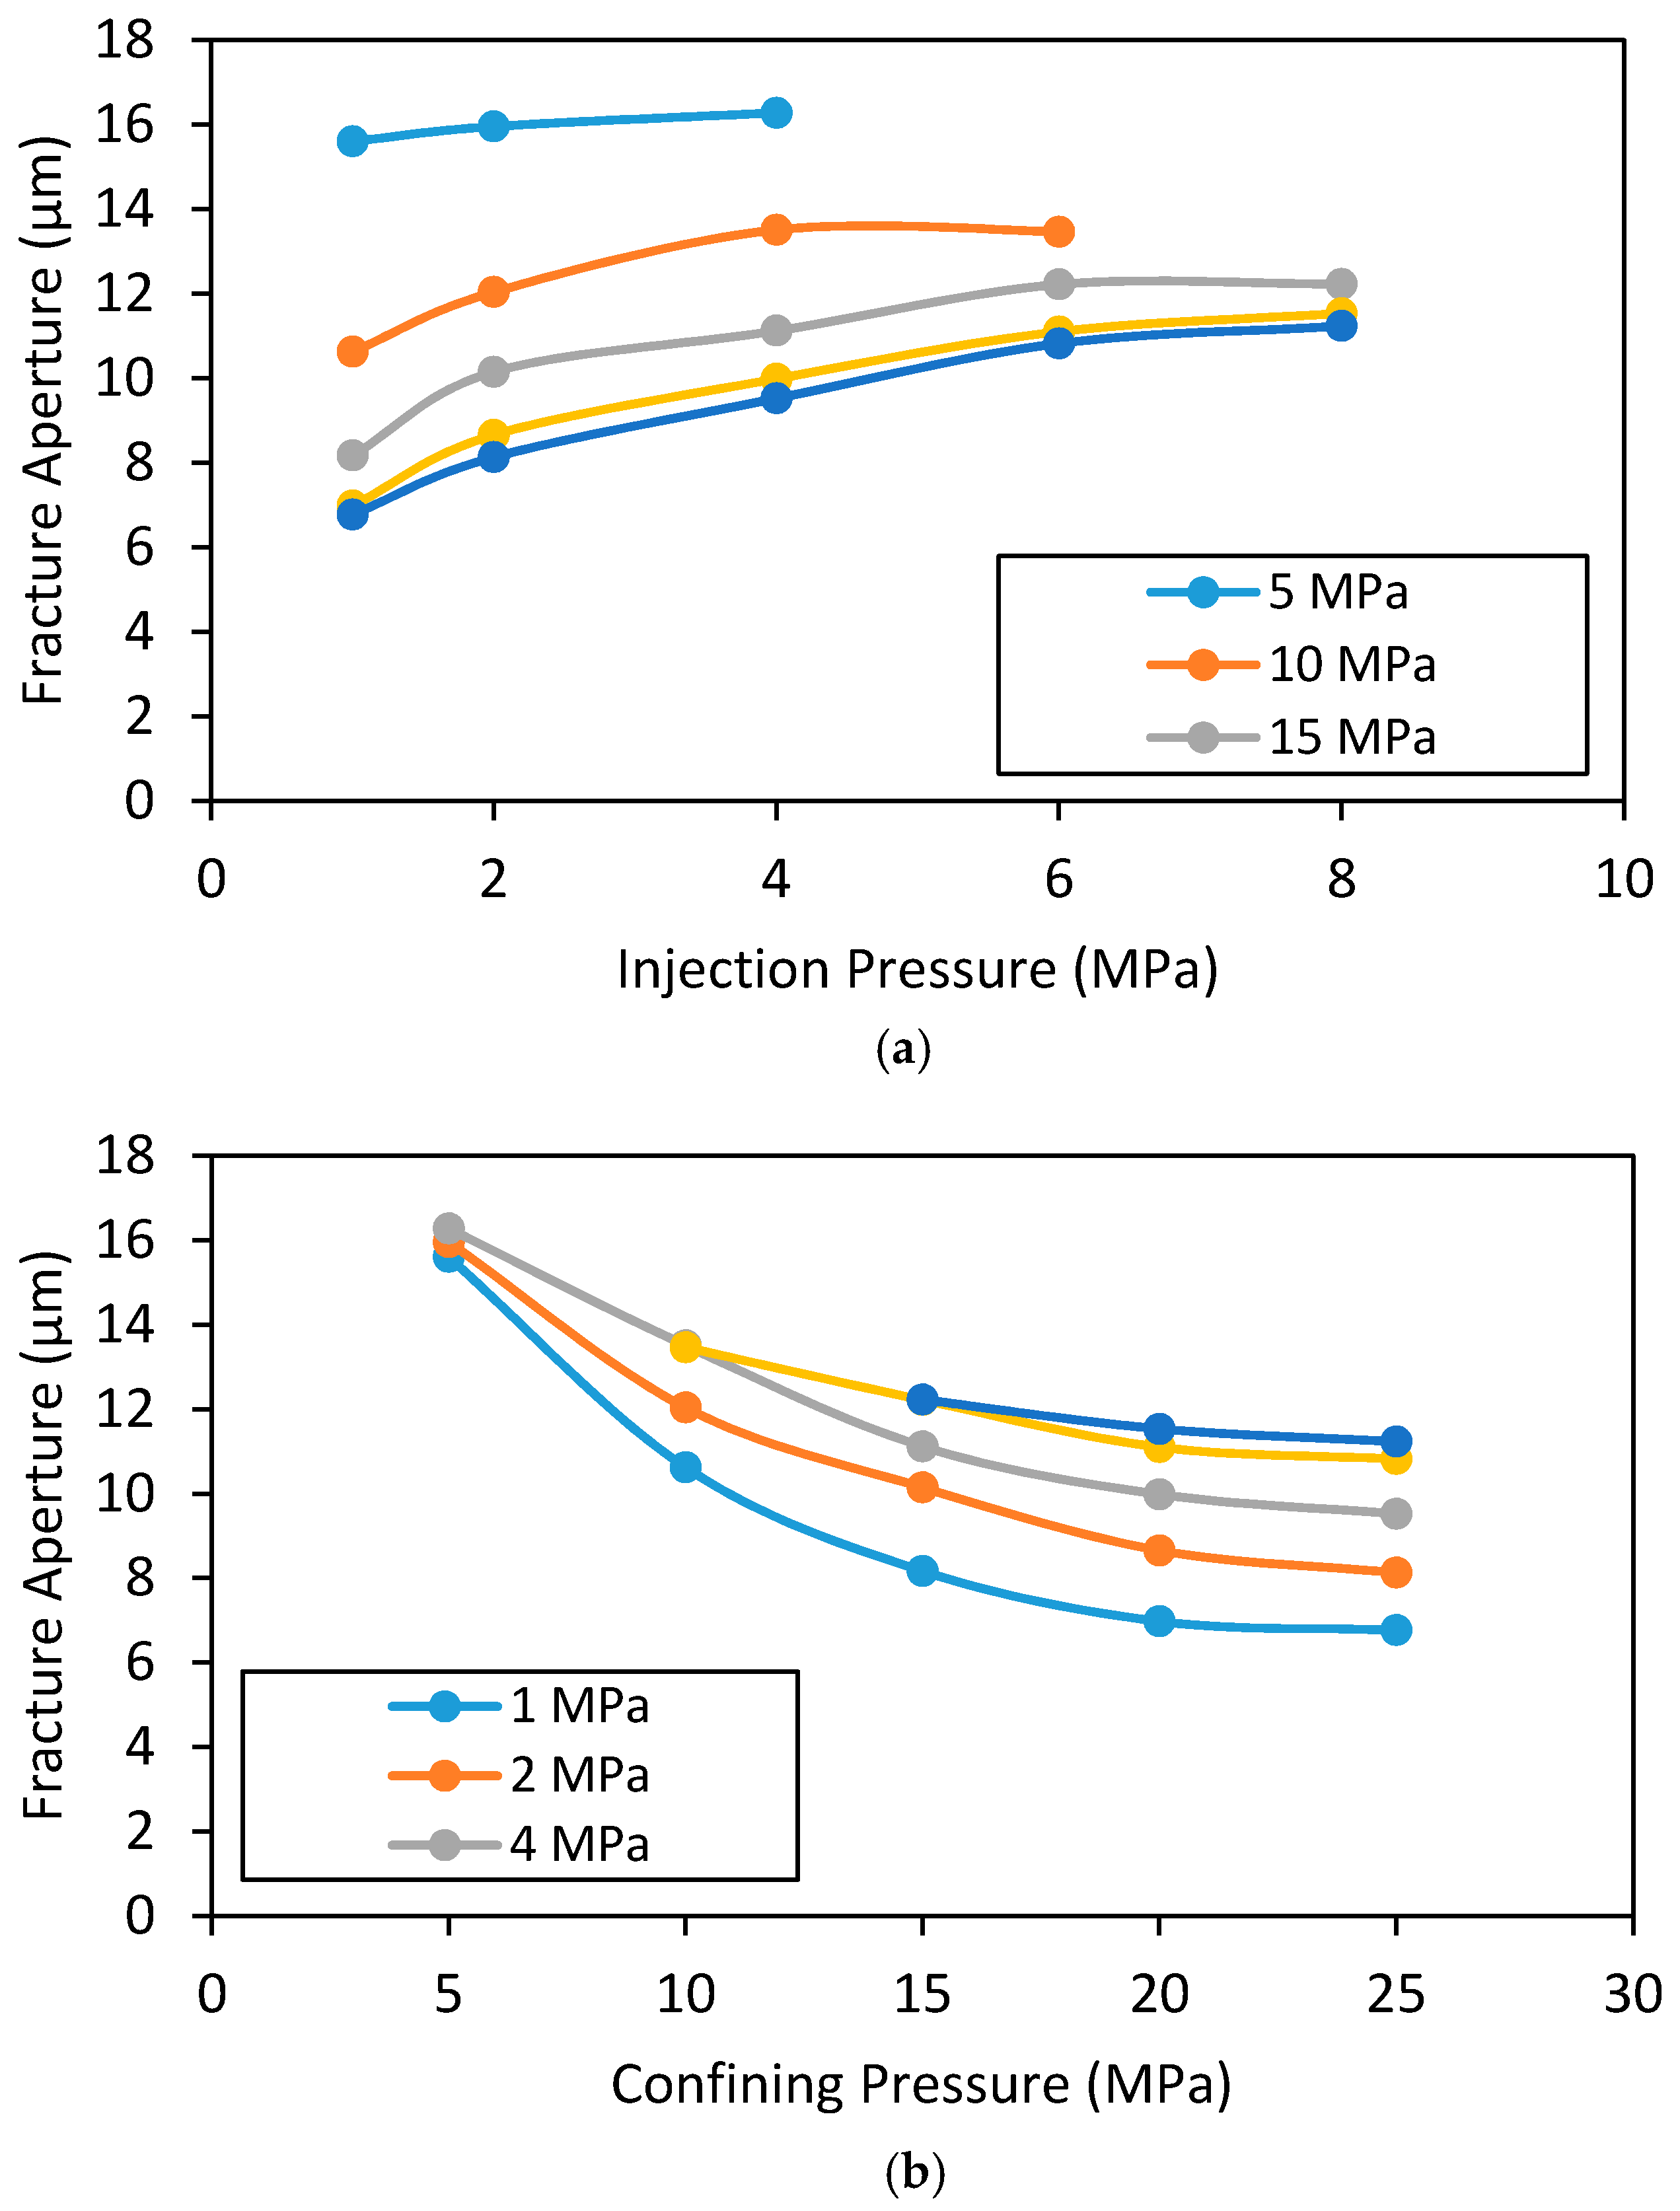
4.3. Effect of Confining and Injection Pressures on Intact and Fracture Permeability

In addition to the breakdown pressure and fracture network, the flow characteristics of the reservoir and its alterations in the fracturing process and the influence of fracturing fluid pressure and reservoir properties such as depth are important for productivity enhancement by hydraulic fracturing. This was studied next, by observing the permeability changes with fracturing by determining the permeability of intact and fractured samples, and permeability variation with confinement and injection pressure. Permeability calculations were carried out based on the downstream flow rates. The observed effects of injection and confining pressures on the downstream N2 flow rate of an intact siltstone rock specimen at 7 MPa confining pressure, a fractured rock specimen at 7 MPa confining pressure, and a fractured rock specimen at 1 MPa confining pressure are shown in Figure 9, Figure 10 and Figure 11, respectively. As the figures show, under all the test conditions the downstream flow rate increases with increasing time and gradually reaches a steady state. The steady state flow rate values were used to calculate the permeability using Equations (3) and (4).
According to Figure 9, Figure 10 and Figure 11, the maximum flow rate for each condition increases with increasing injection pressure, regardless of confinement or fracture (intact or fractured). The effect of injection pressure on flow rate has been observed by many researchers for different reservoir rocks (Rathnaweera et al. [34] and Arsyad et al. [35] for sandstone samples, Nasvi et al. [36] for geopolymer and Perera et al. [37] for coal). This is because, when the injection pressure is high, the pressure gradient through the sample is also high, and this causes a higher advective flow from the downstream. Moreover, according to Figure 9e, at 25 MPa confining pressure, when the injection pressure is increased to 1, 2, 4, 6, 8 and 10 MPa, the time taken to achieve the maximum flow rate reduces to 510, 400, 330, 230, 210 and 120 s, respectively. This can be observed for all the confining pressures in the intact rock specimen (Figure 9). A similar trend was observed for all the confining pressures in the fractured sample that was fractured at 1 MPa confining pressure (Figure 11), and the time taken to achieve the maximum flow rate reduces to 200, 175, 125, 90 and 70 s when the injection pressure increases to 1, 2, 4, 6 and 8 MPa, respectively. However, for the 1 and 8 MPa injection pressures in the intact and 1 MPa fractured samples, this reduction is about 61 and 67%, respectively. Interestingly, this was not observed in the fractured sample that was fractured at 7 MPa confining pressure, and the time reduction to achieve maximum or steady flow rate with increasing injection pressure is negligible compared to the other two cases (the intact sample and the fractured sample at 1 MPa confining pressure). For example, at 25 MPa confining pressure, when the injection pressure was increased to 1, 2, 4, 6 and 8 MPa, the time taken to achieve the maximum flow rate only slightly reduced to 40, 37, 35, 31 and 28 s. When compared with the 1 and 8 MPa injection pressures in the intact rock specimen, this reduction is about 92 and 87%, respectively. According to Figure 9, Figure 10 and Figure 11 show that fractured samples require much less time to achieve the steady state or maximum flow rate compared to the intact sample, because of the presence of fractures in the hydraulically fractured samples. Moreover, in intact and fractured samples at 1 MPa confining pressure, the time lags between the 8 and 1 MPa injection pressures at 25 MPa confining pressure are about 300 and 130 s respectively. However, in the fractured sample at 7 MPa confining pressure the time lag between the 8 and 1 MPa injection pressures at 25 MPa confining pressure is only about 12 s. This is due to the existing rock matrix in the intact rock and fractured specimen at 1 MPa confining pressure, and the time to achieve the maximum flow rate is therefore dependent on the injection pressure. Moreover, flow through a rock matrix is governed by the properties of porous media, including pore size distribution and the interconnectivity of pores. In contrast, in the fractured sample at 7 MPa confining pressure, the time to achieve the maximum flow rate is independent of the injection pressure, and in this case the fracture is throughout the rock specimen. Therefore, the effect of the rock matrix is negligible, because the fluid flows through the generated fracture rather than through the rock matrix [38]. This is very useful in gas extraction, as when the fracture is large enough, the gas can be extracted at higher flow rates and the time to achieve the maximum flow rate is very short. This will directly reduce the maintenance and operating costs of the equipment and other accessories during gas extraction [39].
The effect of injection pressure and confining pressure on the N2 permeability of intact and fractured siltstone permeability was then examined. Figure 12 shows these effects on the permeability of intact siltstone. According to Figure 12a, siltstone permeability first gradually (up to 6 MPa) and then slowly decreases with increasing injection pressure (up to 10 MPa) and eventually comes to a steady state (>10 MPa). For example, at 25 MPa confining pressure, when the injection pressure is increased from 1 to 6 MPa and 6 to 10 MPa, the permeability of the intact siltstone reduces by around 38% and 5%, respectively (Figure 12a). This clearly shows the significant influence of injection pressure on siltstone permeability at low injection pressures (<6 MPa) is greatly reduced at higher injection pressures (>6 MPa). This may be related to the Klinkenberg slip flow effect, which explains the difference between gas and liquid permeability in porous media using the “slip flow” phenomenon [40]. According to Klinkenberg [40], the collisions between gas molecules and solid walls introduce an additional flux to the system when the pore radius is similar to the mean free path of the gas molecules. According to existing studies, gas permeability through various reservoir rocks can be reduced with increasing injection pressure due to this phenomenon [34,41,42,43,44]. This slip flow effect is therefore responsible for the observed gradual reduction in N2 permeability from 1 to 6 MPa, and the observed negligible reduction in N2 permeability after 6 MPa is possibly due to the increased advective flux effect caused by the reduced effective stress, which seems to reduce the slip flow effect.
In relation to the confining pressure or reservoir depth effect on its intact permeability, according to Figure 12b, N2 permeability in siltstone exhibits a reducing trend with increasing confining pressure, regardless of injection pressure. This can be explained using the effective stress phenomenon, where increasing confining pressure causes the effective stress acting on the rock mass to increase, which causes the rock pore space to shrink, resulting in reduced permeability [37]. For example, according to Figure 12b, at 1 MPa injection pressure, when the confining pressure is increased from 5 to 25 MPa, siltstone permeability reduces by about 24%. However, at 4 MPa injection pressure, when the confining pressure is increased from 5 to 25 MPa, the permeability reduces only by around 12.5%. This indicates that the effect of confining pressure on the N2 permeability of intact siltstone is reduced with increasing injection pressure, probably due to the effective stress reduction caused by the greater pore pressure induced by greater injection pressures. However, this is useful in the hydraulic fracturing process, because according to the findings, the intact permeability of the reservoir is little affected by the reservoir depth if a sufficient injection pressure is maintained, which reduces the chance of fluid leakage to the reservoir.
The effect of injection and confining pressures on fractured siltstone permeability was then considered and the results are shown in Figure 13 and Figure 14. The effect on a siltstone sample fractured at low confinement (1 MPa) is shown in Figure 13 and at high confinement (7 MPa) in Figure 14. According to Figure 13, similar to intact siltstone, the permeability of fractured siltstone at 1 MPa confinement reduces with increasing injection pressure. For example, when the injection pressure is increased from 1 to 4 MPa, siltstone permeability reduces by around 22% at 5 MPa confining pressure and around 8% at 25 MPa confining pressure (Figure 13a). The same Klinkenberg slip flow effect is responsible, because the sample which fractured at low confinement had some intact (non-fractured) portion for gas flow, which would have been subjected to the slip flow effect. In relation to the confinement effect on the siltstone sample fractured at low confinement (1 MPa), Figure 13b exhibits the similar influence of confinement on this fractured siltstone at low confinement to that in the intact specimen, as permeability reduces with increasing confining pressure, regardless of injection pressure due to the increased effective stress. As explained earlier, the permeability of the fractured sample at 1 MPa varied similarly to that of the intact sample with changing injection and confining pressures. This is because, in this fractured siltstone at low confinement (1 MPa was considered here), the fracture exists only up to around 58 mm along the length of the sample and the remaining part is the rock matrix. Therefore, the injecting fluid flows through both the fracture and the rock matrix, and their two different porosity systems. As a result, both porosity systems should be considered when analysing the permeability values for this partially fractured rock sample [45]. However, since fracture permeability is always much greater than matrix permeability, due to the easy flow paths through fractures, the final permeability of the partially fractured rock specimen is always governed by the matrix permeability. As a result, the permeability variation with injection and confining pressures for the intact sample and the fractured sample at 1 MPa confining pressure are comparable, because in both samples the final permeability values are governed by the rock matrix.
In respect of the effect of injection and confining pressures on the N2 permeability of fractured siltstone under much high confinement (7 MPa), according to Figure 14a, the permeability also reduces with increasing injection pressure, but at a much greater rate compared to the intact and partially fractured siltstone. However, the rate of reduction seems to be more significant at low confining pressures. For example, when the injection pressure is increased from 1 to 8 MPa, the N2 permeability of the fractured sample reduces by around 74% for 15 MPa confining pressure, 64% for 20 MPa confining pressure, and 62% for 25 MPa confining pressure. This shows that the reduction of fully fractured siltstone permeability with increasing injection pressure reduces with increasing confining pressure. The reduction of permeability with increasing confining pressure observed in the fully fractured sample is related to the alteration of fracture aperture, as shown in Figure 15. According to Figure 15a, when the injection pressure is increased from 1 to 8 MPa, the fracture aperture increases by 49% for 15 MPa confining pressure, 64% for 20 MPa confining pressure and 65% for 25 MPa confining pressure. According to Equation (6), the permeability of fractured rock increases with increasing fracture aperture. This is counter to the observed permeability reduction with increasing injection pressure, because according Figure 15a, the fracture aperture increases with increasing injection pressure. This contradictory behaviour is due to another effective factor that negatively affects fracture permeability. This is believed to be related to the Klinkenberg slip flow effect, which causes permeability to be reduced with increasing gas pressure. It should be noted that the full fractures created have quite low fracture aperture values (<16 μm), and therefore the fracture probably acts as micropores that are subject to the slip flow effect. According to Figure 15b, the fracture aperture considerably reduces with increasing confinement due to the effective stress effect, and this causes some permeability enhancement. This explains the reduction of permeability with increasing confinement. Similar behaviour for fractured permeability has been reported by many researchers for various other reservoir rocks, including Gangi [46], Perera et al. [47], Caulk et al. [13] and Walsh [48]. According to Walsh [48], fluid flow through a fracture is a function of pore fluid pressure and confining pressure, and fracture permeability reduces with increasing effective pressure. Therefore, it is apparent that under higher confining conditions such as 20 or 25 MPa, the fracture aperture can be small as 6 µm and this can greatly influence the permeability of the reservoir, regardless of the fractures generated. Therefore, it is necessary to use proppants (small particles such as ceramic or sand) in field conditions to prop open the fractures generated after releasing the fracturing fluid pressure. Otherwise, the confining stress will reduce the fracture aperture, resulting in reduced permeability and low gas production. It should be noted that the observed fracture aperture is based on 54 mm diametrical specimens and this could change with the sample size and under field conditions. For example, under field conditions, there is no specific boundary for the rock mass to limit the fracture and therefore fracture will propagate until it reaches the fracturing stress level in the particular location. This will lead to a greater fracture aperture near the wellbore and a significantly small fracture aperture at the tip (end) of the fracture, which could not be observed in laboratory conditions with small specimens. However, the observed trends such as reduction of fracture aperture with increasing confining pressure will still be valid under field conditions.
In the case of intact and fractured rock permeability, partially fractured rock permeability is about 10 times greater than intact rock permeability, and fully fractured rock permeability is about 106 times greater than intact rock permeability. This shows that fracturing can significantly improve the permeability of and hence increase gas production from deep geological formations. It should be noted that, under experimental conditions, the permeability of the fully fractured specimen is significantly higher due to the fact that the fracture is throughout the sample. This could not be observed under field conditions and therefore, permeability enhancement may be less than the experimental values. However, for the partially fractured sample, although the final permeability is governed by the rock matrix, it is 10 times higher than that of the intact rock. This may be due to the reopening of micro-fractures in the matrix portion, and these micro-fractures can reopen at certain pressures and can be fully closed under normal atmospheric conditions. Zhou [49] observed similar behaviour in shale samples fractured using water. However, as explained earlier, although fracture permeability is significantly higher than intact permeability, when the confining pressure is increased from 5 to 25 MPa at 1 MPa injection pressure, the permeability reductions for intact, partially fractured and fully fractured samples are about 24%, 56% and 81%, respectively. This implies that the fractured rock layer may be more significantly affected by reservoir depth than an intact or poorly fractured rock layer, and this needs to be considered in the fracturing process. Furthermore, the permeability of the fractured rock mass may only be high at low depths or confining pressures, and may reduce drastically with increasing depth, due to the associated crack closure. Another aspect related to reservoir depth is the additional driving force for the production gas, which is created by the increased pore pressure gradient due to the increase in reservoir depth. However, in this study, the results show that the Klinkenberg slip flow effect is dominant at low injection pressures and as a result, the fracture closure effect is more significant than the pore pressure gradient with respect to the reservoir depth. These issues can be minimised by using some effective applications. This indicates the importance of further studies on the role of proppants in the permeability enhancement of reservoir rocks.

5. Conclusions

Hydraulic fracturing is a promising technique for the extraction of unconventional natural gases, including shale gas and tight gas, from deep geological formations. However, gas production is entirely dependent on the reservoir’s permeability, which is governed by the fracture network and fracture pattern created by the hydraulic fracturing process. Precise understanding of this fracture network creation is therefore vital for an effective hydraulic fracturing process. This understanding can only be gained based on thorough knowledge of intact and fracture permeability in reservoir rock. Therefore, the aim of this study was to understand the effect of reservoir depth (confining pressure) on the breakdown pressure of reservoir rock while understanding the influences of fluid injection pressure and reservoir depth (confining pressure) on the intact and fracture permeability of the reservoir rock mass. The results enable the following major conclusions to be drawn:
  • The reservoir flow ability for gas movement may reduce with increasing injection pressure and reservoir depth due to the Klinkenberg phenomenon and pore structure shrinkage, respectively. This confirms that, under field conditions, an additional pressure gradient may not directly enhance gas production while depth is a key factor.
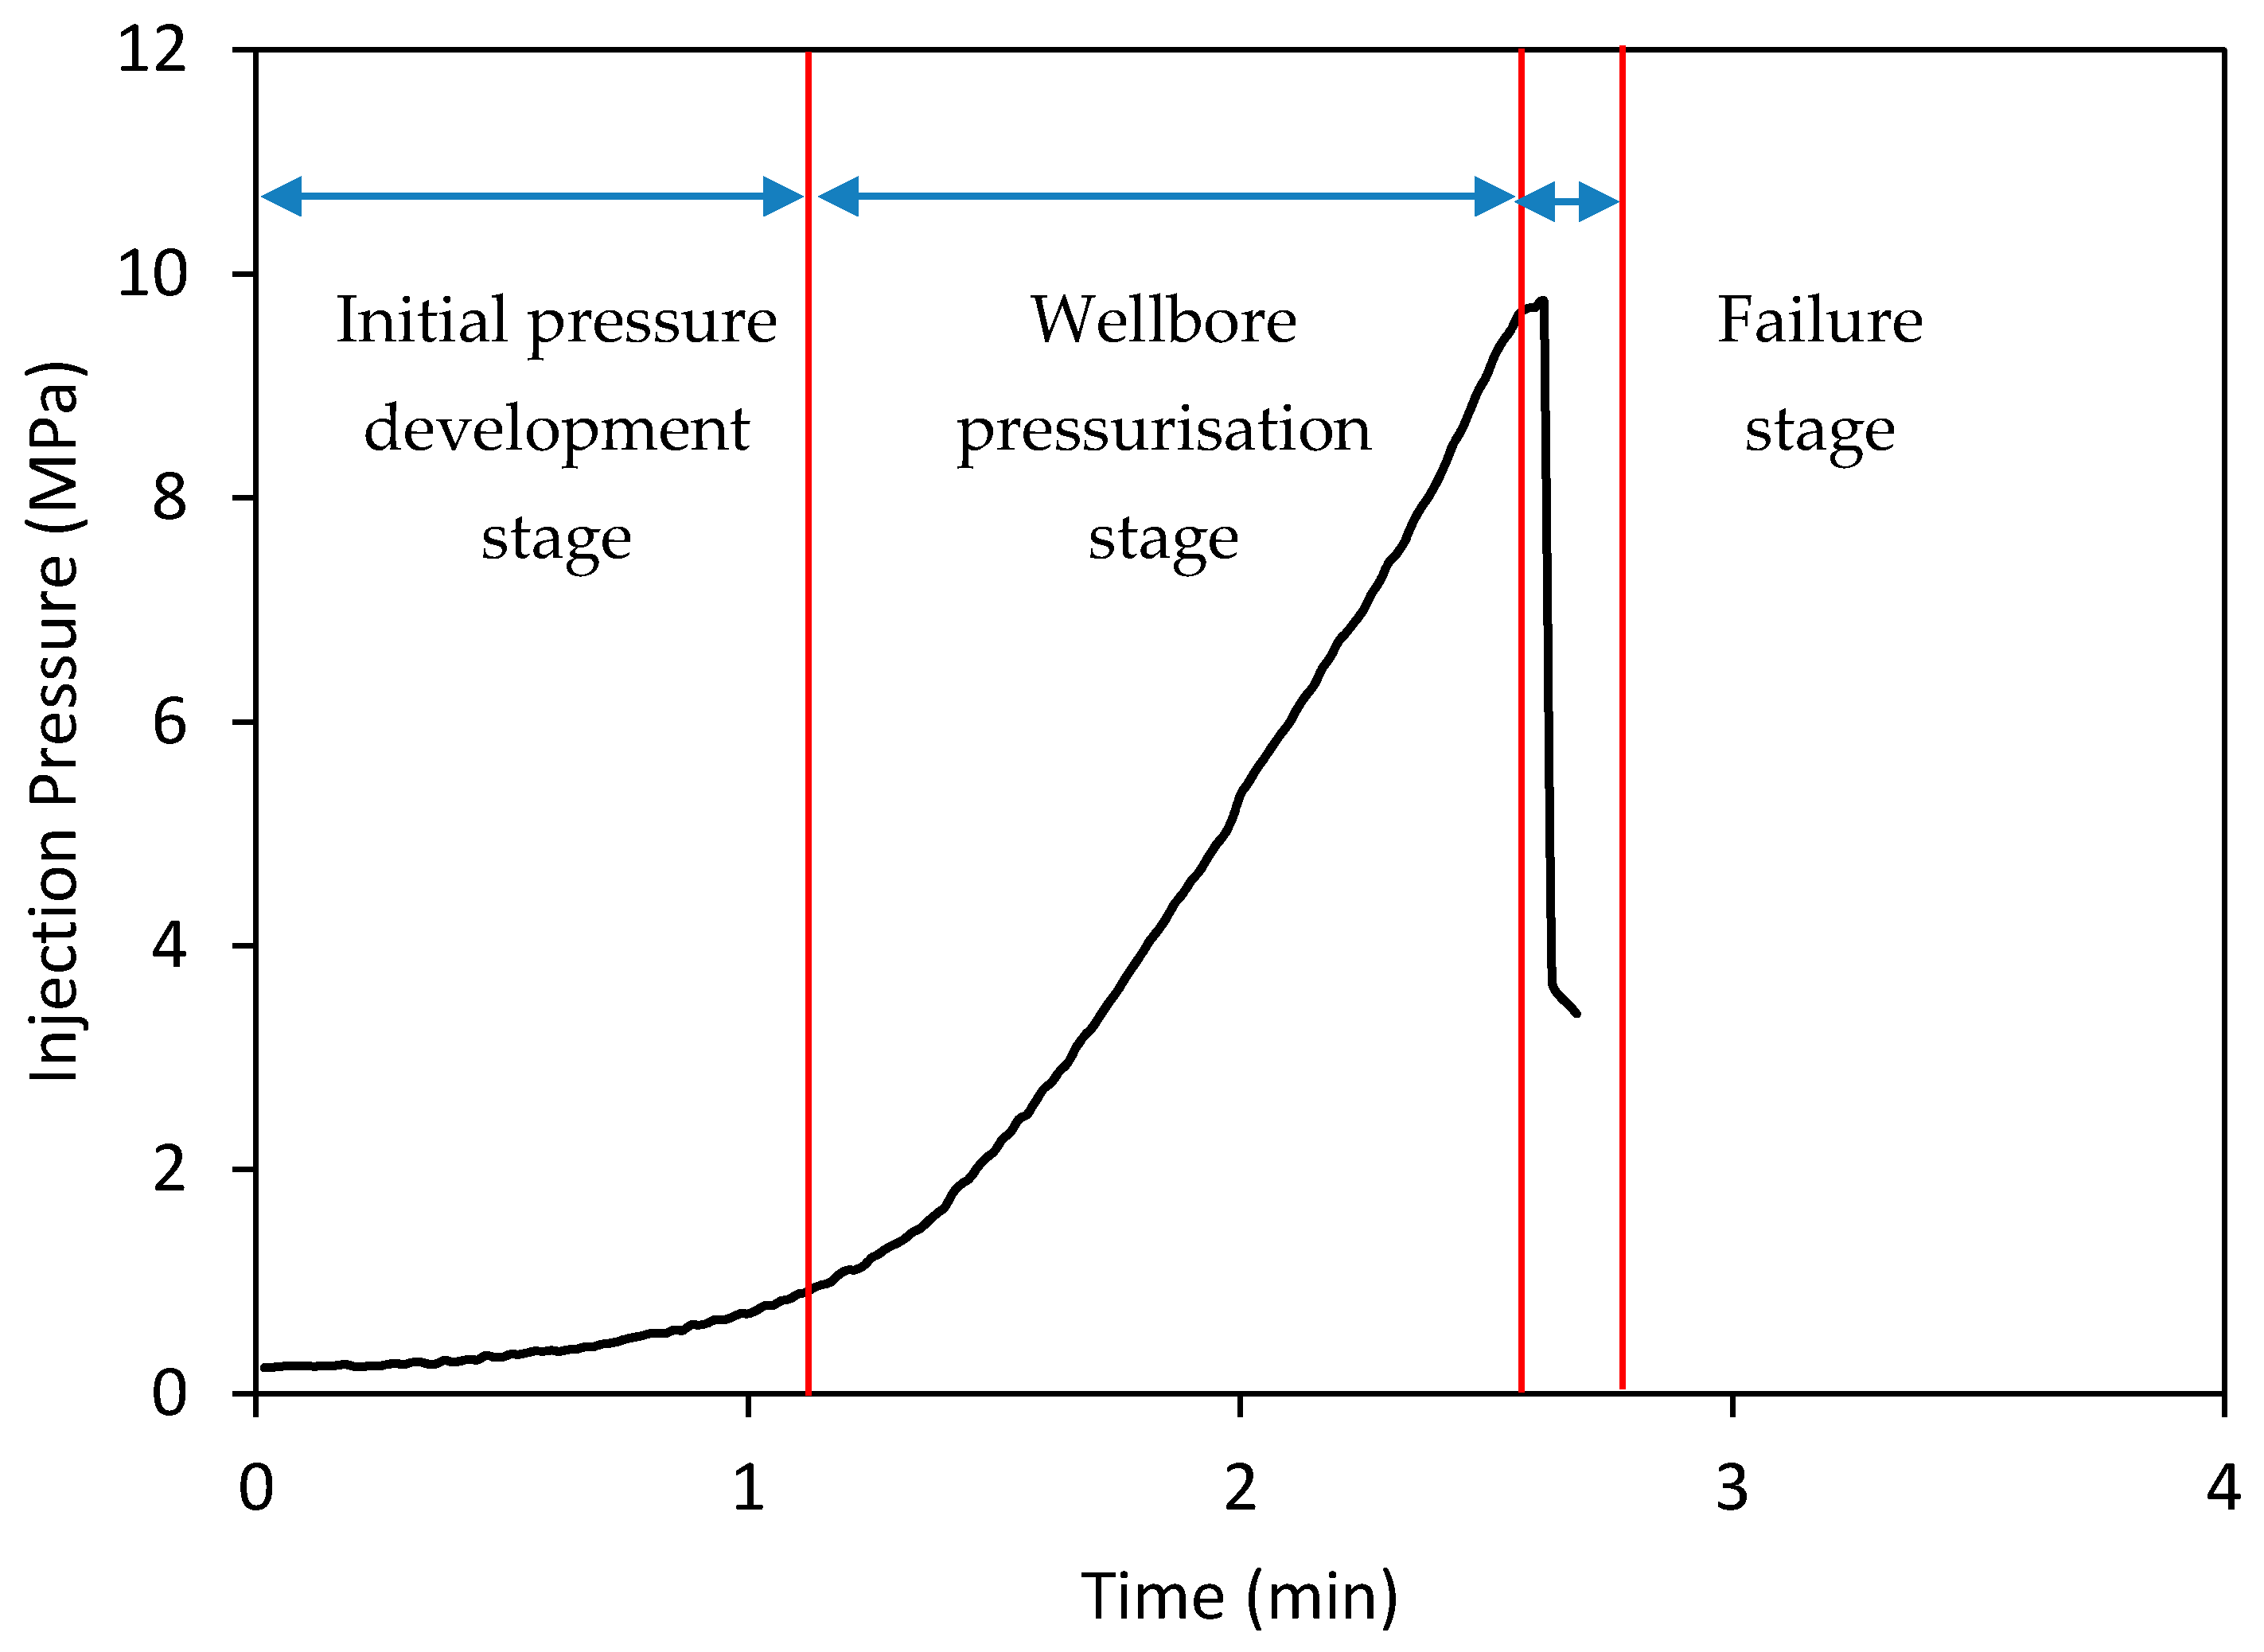
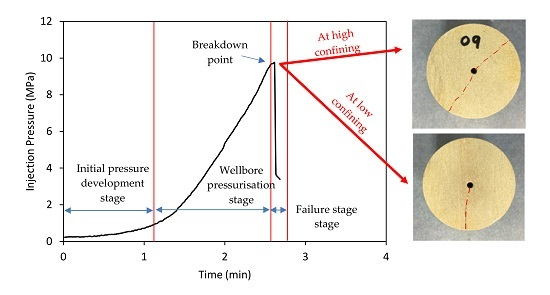
  • During the hydraulic fracturing process, three main pressure development regions can be identified over time; (1) initial pressure development; (2) wellbore pressurization stage; and (3) failure stage. This will be a guide to the identification of final failure in advance, which could help with other investigations such as the monitoring of ground responses in the investigation of micro earthquakes.
  • The breakdown pressure of the reservoir rock linearly increases with increasing reservoir depth (confining pressure). For example, increasing the confining pressure applied on the tested siltstone from 1 to 7 MPa caused the rock mass breakdown pressure to be increased from 2.5 to 18.2 MPa, a large increment compared to the confinement increment. The derived relationship can be used to predict the breakdown pressures in siltstone reservoir rocks at certain depths.
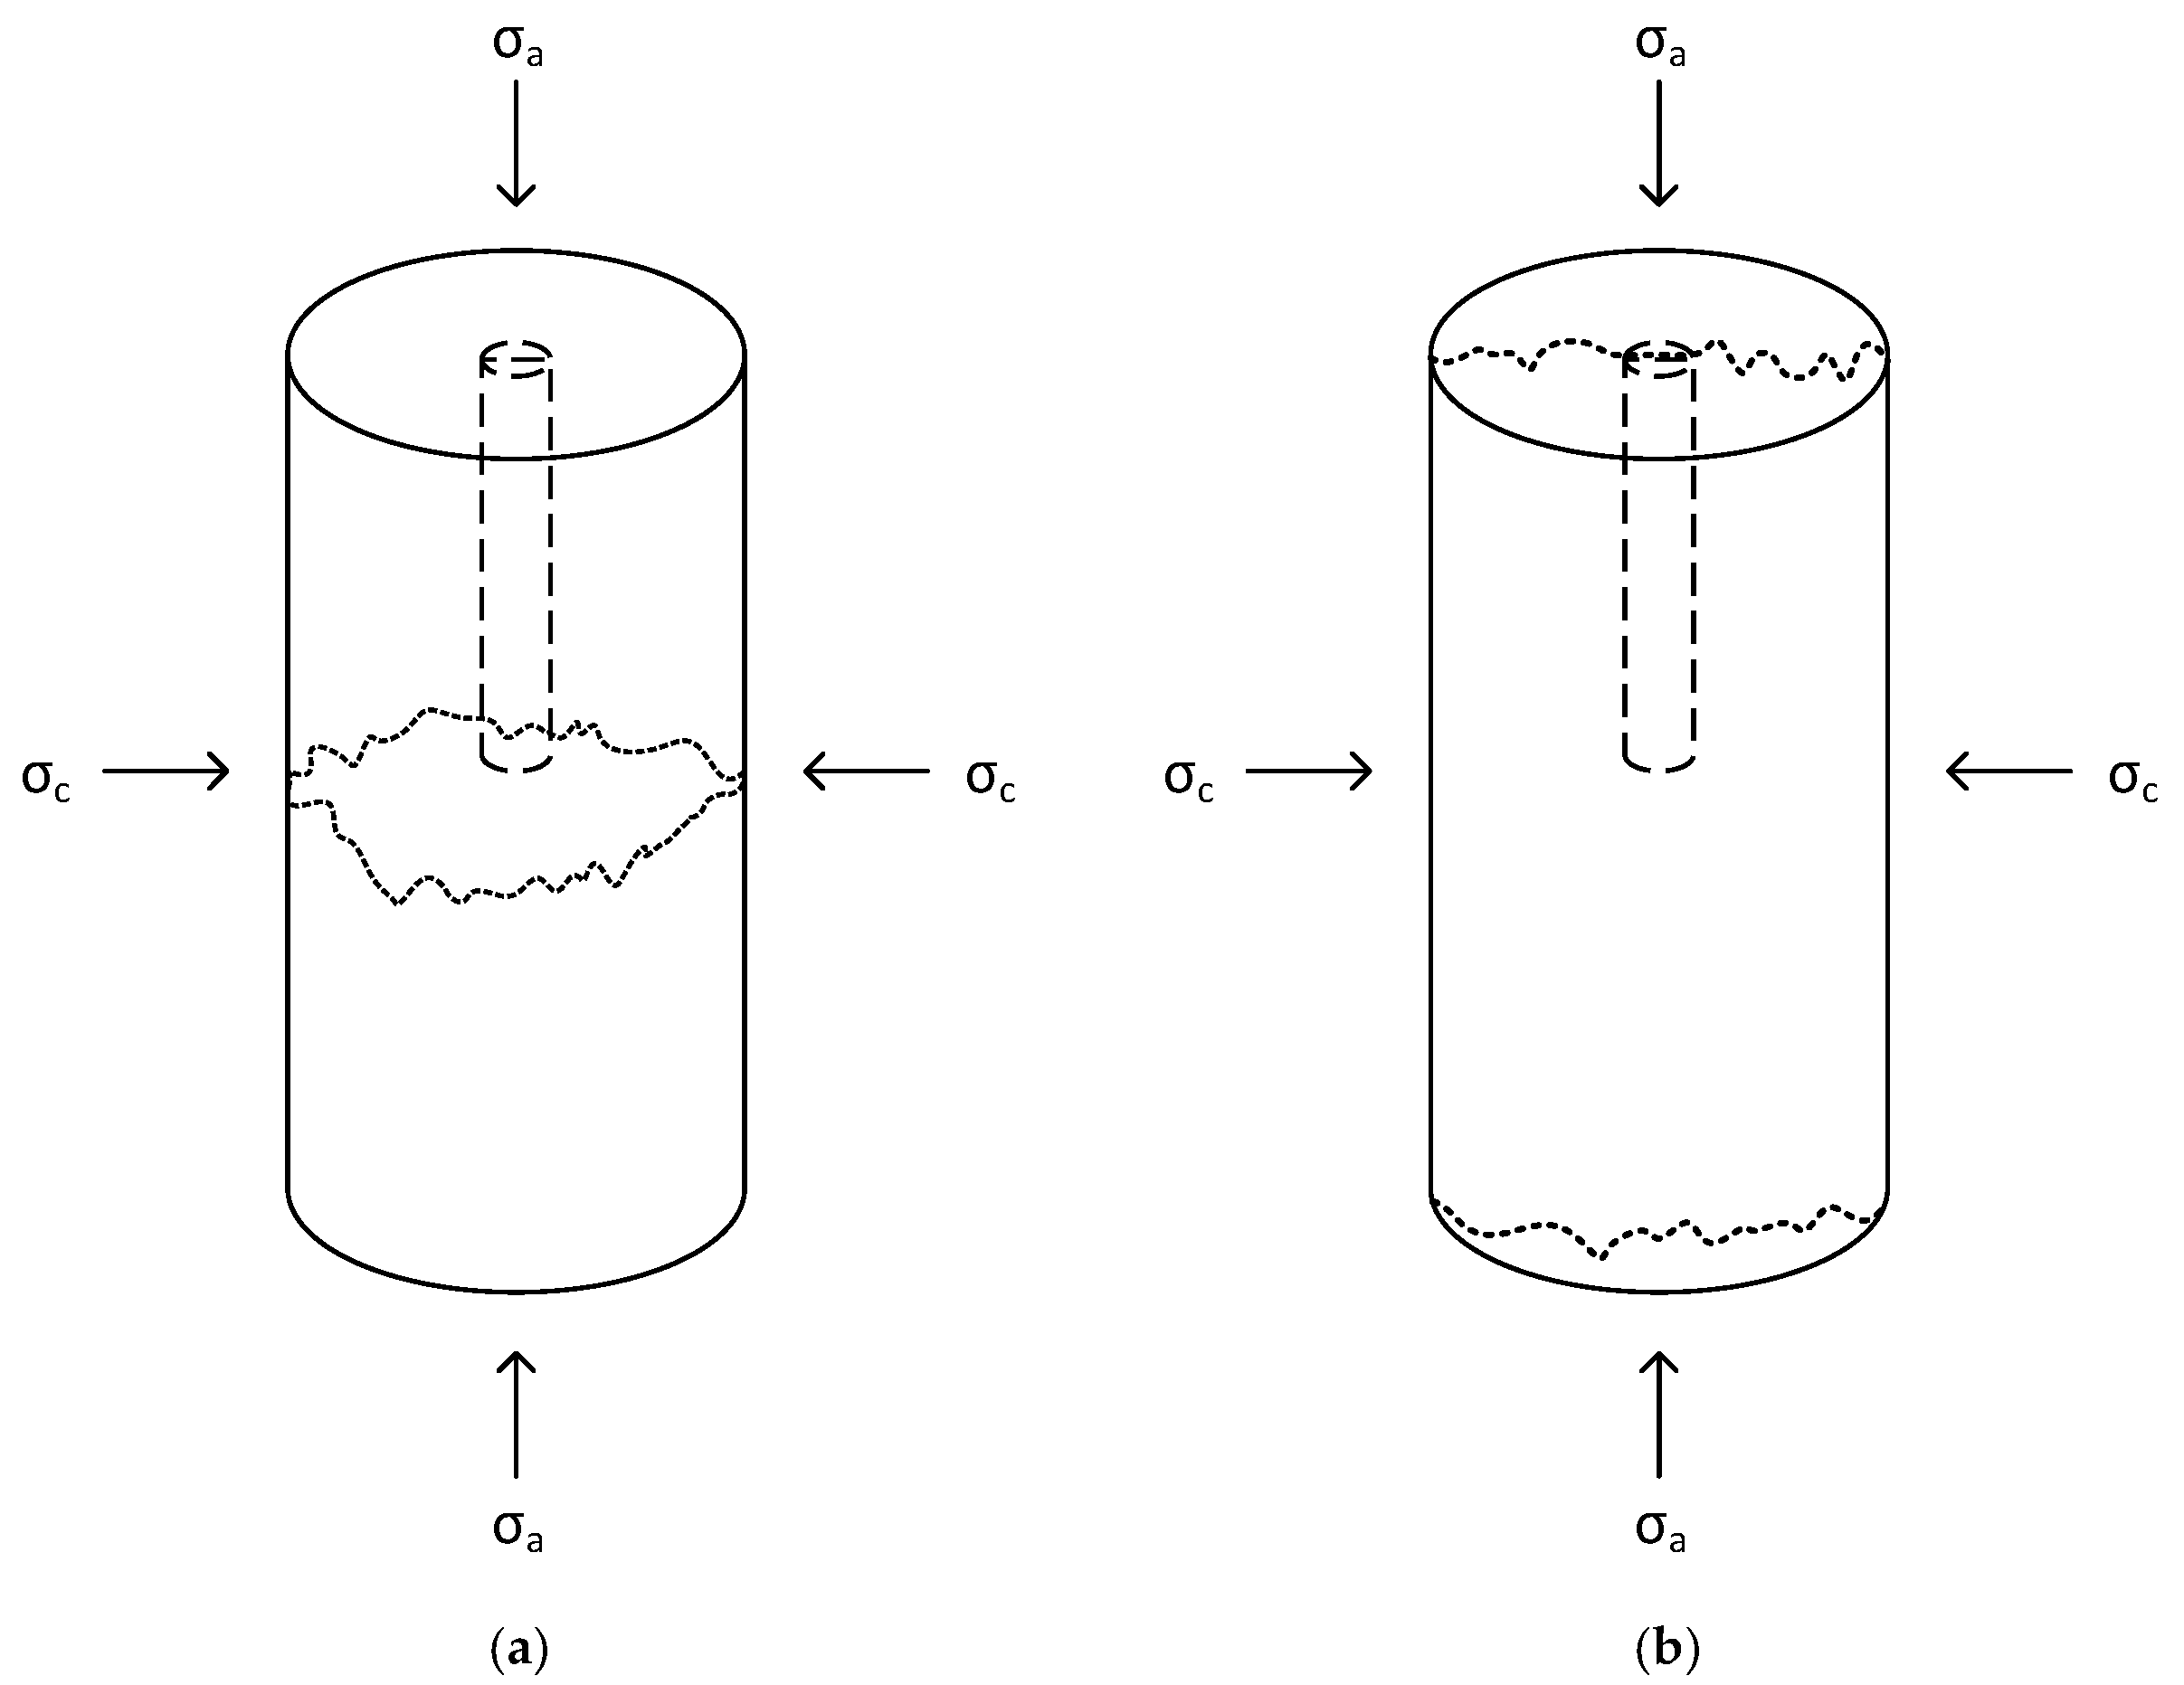
  • Interestingly, hydraulic fracturing seems to occur more often along radial directions in shallow reservoirs and diametrical directions in deep reservoirs. For example, in the hydraulic fracturing experiments, the fracture created was mostly diametrical at greater confinement (7 MPa) and radial at lower confinement pressure (1 MPa), and only a partial fracture could be seen (the fracture length was only up to around 58 mm) under low confinements. This is due to the release of a greater amount of energy at greater confining pressures, resulting in greater breakdown pressures. This shows the effectiveness of deep reservoirs for hydraulic fracturing compared to shallow reservoirs.
  • This full fracturing of the reservoir rock at greater depth offers greater flow characteristics to the reservoir rock, enhancing productivity. For example, in the fracturing tests, the fracture permeability of the partially and fully fractured rock samples compared to an intact rock sample was about 10 times and 106 times, respectively. However, an increase of confining pressure from 5 to 25 MPa at 1 MPa injection pressure caused a permeability reduction of about 24, 56 and 81% for intact, partially fractured and fully fractured samples, respectively. This shows the greater sensitivity of greatly fractured reservoir rock to a change in possible overburden stress caused by many possible activities, including building construction and extraction. However, the possible long-term influence on gas production from fractured reservoirs can be minimised with the use of applications such as proppants in hydraulic fracturing.
Furthermore, based on the results and findings of the current study, some recommendations are summarised in Table 2 in relation to hydraulic fracturing and fracture permeability.

Author Contributions

Wanniarachchillage Ayal Maneth Wanniarachchi conducted the experiments, analysed the results and drafted the manuscript. Ranjith Pathegama Gamage and Mandadige Samintha Anne Perera conceived the experiments. Tharaka Dilanka Rathnaweera conducted the experiments. Mingzhong Gao and Eswaran Padmanabhan reviewed the manuscript. All authors reviewed and approved the final manuscript.

Conflicts of Interest

The authors declare no conflicts of interest.

References

  1. Huang, M.; Kang, Y.; Long, X.; Wang, X.; Hu, Y.; Li, D.; Zhang, M. Effects of a Nano-Silica Additive on the Rock Erosion Characteristics of a SC-CO2 Jet under Various Operating Conditions. Appl. Sci. 2017, 7, 153. [Google Scholar] [CrossRef]
  2. Nehring, D. Natural gas from shale bursts onto the scene. Science 2010, 328, 1624–1626. [Google Scholar]
  3. Vengosh, A.; Warner, N.; Jackson, R.; Darrah, T. The effects of shale gas exploration and hydraulic fracturing on the quality of water resources in the United States. Procedia Earth Planet. Sci. 2013, 7, 863–866. [Google Scholar] [CrossRef]
  4. Bai, B.; Elgmati, M.; Zhang, H.; Wei, M. Rock characterization of Fayetteville shale gas plays. Fuel 2013, 105, 645–652. [Google Scholar] [CrossRef]
  5. Rani, S.; Prusty, B.K.; Pal, S.K. Methane adsorption and pore characterization of Indian shale samples. J. Unconv. Oil Gas Resour. 2015, 11, 1–10. [Google Scholar] [CrossRef]
  6. Wang, H. Numerical investigation of fracture spacing and sequencing effects on multiple hydraulic fracture interference and coalescence in brittle and ductile reservoir rocks. Eng. Fract. Mech. 2016, 157, 107–124. [Google Scholar] [CrossRef]
  7. Deng, J.; Lin, C.; Yang, Q.; Liu, Y.; Tao, Z.; Duan, H. Investigation of directional hydraulic fracturing based on true tri-axial experiment and finite element modeling. Comput. Geotech. 2016, 75, 28–47. [Google Scholar] [CrossRef]
  8. Hossain, M.; Rahman, M.; Rahman, S. Hydraulic fracture initiation and propagation: roles of wellbore trajectory, perforation and stress regimes. J. Pet. Sci. Eng. 2000, 27, 129–149. [Google Scholar] [CrossRef]
  9. Hubbert, M.K.; Willis, D.G. Mechanics of Hydraulic Fracturing; American Association of Petroleum Geologists: Houston, TX, USA, 1972. [Google Scholar]
  10. Rutqvist, J.; Tsang, C.-F.; Stephansson, O. Uncertainty in the maximum principal stress estimated from hydraulic fracturing measurements due to the presence of the induced fracture. Int. J. Rock Mech. Min. Sci. 2000, 37, 107–120. [Google Scholar] [CrossRef]
  11. Blanton, T.L. An Experimental Study of Interaction between Hydraulically Induced and Pre-Existing Fractures. In Proceedings of the SPE Unconventional Gas Recovery Symposium, Pittsburgh, PA, USA, 16–18 May 1982; Society of Petroleum Engineers: London, UK, 1982. [Google Scholar]
  12. Bunger, A.; Jeffrey, R.; Kear, J.; Zhang, X.; Morgan, M. Experimental Investigation of the Interaction among Closely Spaced Hydraulic Fractures. In 45th US Rock Mechanics/Geomechanics Symposium; American Rock Mechanics Association: San Francisco, CA, USA, 2011. [Google Scholar]
  13. Caulk, R.A.; Ghazanfari, E.; Perdrial, J.N.; Perdrial, N. Experimental investigation of fracture aperture and permeability change within Enhanced Geothermal Systems. Geothermics 2016, 62, 12–21. [Google Scholar] [CrossRef]
  14. Olson, J.E.; Bahorich, B.; Holder, J. Examining Hydraulic Fracture: Natural Fracture Interaction in Hydrostone Block Experiments. In Proceedings of the SPE Hydraulic Fracturing Technology Conference, The Woodlands, TX, USA, 6–8 February 2012; Society of Petroleum Engineers: London, UK, 2012. [Google Scholar]
  15. Fallahzadeh, S.; Rasouli, V.; Sarmadivaleh, M. An investigation of hydraulic fracturing initiation and near-wellbore propagation from perforated boreholes in tight formations. Rock Mech. Rock Eng. 2015, 48, 573–584. [Google Scholar] [CrossRef]
  16. Choo, L.Q.; Zhao, Z.; Chen, H.; Tian, Q. Hydraulic fracturing modeling using the discontinuous deformation analysis (DDA) method. Comput. Geotech. 2016, 76, 12–22. [Google Scholar] [CrossRef]
  17. Meyer, B.R.; Bazan, L.W. A Discrete Fracture Network Model for Hydraulically Induced Fractures—Theory, Parametric and Case Studies. In Proceedings of the SPE Hydraulic Fracturing Technology Conference, The Woodlands, TX, USA, 24–26 January 2011; Society of Petroleum Engineers: London, UK, 2011. [Google Scholar]
  18. Zhou, L.; Hou, M.Z. A new numerical 3D-model for simulation of hydraulic fracturing in consideration of hydro-mechanical coupling effects. Int. J. Rock Mech. Min. Sci. 2013, 60, 370–380. [Google Scholar] [CrossRef]
  19. Fatahi, H.; Hossain, M.M.; Fallahzadeh, S.H.; Mostofi, M. Numerical simulation for the determination of hydraulic fracture initiation and breakdown pressure using distinct element method. J. Nat. Gas Sci. Eng. 2016, 33, 1219–1232. [Google Scholar] [CrossRef]
  20. Lhomme, T.; De Pater, C.; Helfferich, P. Experimental Study of Hydraulic Fracture Initiation in Colton Sandstone. In Proceedings of the SPE/ISRM Rock Mechanics Conference, Irving, Texas, USA, 20–23 October 2002; Society of Petroleum Engineers: London, UK, 2002. [Google Scholar]
  21. Alpern, J.; Marone, C.; Elsworth, D.; Belmonte, A.; Connelly, P. Exploring the Physicochemical Processes that Govern Hydraulic Fracture through Laboratory Experiments. In Proceedings of the 46th US Rock Mechanics/Geomechanics Symposium, Chicago, IL, USA, 24–27 June 2012; American Rock Mechanics Association: Alexandria, VA, USA, 2012. [Google Scholar]
  22. Yasuhara, H.; Polak, A.; Mitani, Y.; Grader, A.S.; Halleck, P.M.; Elsworth, D. Evolution of fracture permeability through fluid–rock reaction under hydrothermal conditions. Earth Planet. Sci. Lett. 2006, 244, 186–200. [Google Scholar] [CrossRef]
  23. Sarmadivaleh, M.; Joodi, B.; Nabipour, A.; Rasouli, V. Steps to conducting a valid hydraulic-fracturing laboratory test. APPEA J. 2013, 53, 347–354. [Google Scholar]
  24. Gan, Q.; Elsworth, D.; Alpern, J.; Marone, C.; Connolly, P. Breakdown pressures due to infiltration and exclusion in finite length boreholes. J. Pet. Sci. Eng. 2015, 127, 329–337. [Google Scholar] [CrossRef]
  25. Yasuhara, H.; Elsworth, D. Compaction of a rock fracture moderated by competing roles of stress corrosion and pressure solution. Pure Appl. Geophys. 2008, 165, 1289–1306. [Google Scholar] [CrossRef]
  26. Yasuhara, H.; Elsworth, D.; Polak, A. Evolution of permeability in a natural fracture: Significant role of pressure solution. J. Geophys. Res. Solid Earth 2004, 109. [Google Scholar] [CrossRef]
  27. Witherspoon, P.A.; Wang, J.; Iwai, K.; Gale, J. Validity of cubic law for fluid flow in a deformable rock fracture. Water Resour. Res. 1980, 16, 1016–1024. [Google Scholar] [CrossRef]
  28. Bunger, A.P.; Jeffrey, R.G.; Detournay, E. Application of scaling laws to laboratory-scale hydraulic fractures. In Proceedings of the Alaska Rocks 2005, The 40th US Symposium on Rock Mechanics (USRMS), Anchorage, AK, USA, 25–29 June 2005; American Rock Mechanics Association: Alexandria, VA, USA, 2005. [Google Scholar]
  29. Detournay, E. Propagation regimes of fluid-driven fractures in impermeable rocks. Int. J. Geomech. 2004, 4, 35–45. [Google Scholar] [CrossRef]
  30. Fialko, Y.A.; Rubin, A.M. Numerical simulation of high-pressure rock tensile fracture experiments: Evidence of an increase in fracture energy with pressure? J. Geophys. Res.-All Ser. 1997, 102, 5231–5242. [Google Scholar] [CrossRef]
  31. Brady, B.H.; Brown, E.T. Rock Mechanics: For Underground Mining; Springer Science & Business Media: Berlin, Germany, 2013. [Google Scholar]
  32. Terzaghi, K.V. The Shearing Resistance of Saturated Soils and the Angle between the Planes of Shear. In Proceedings of the 1st International Conference on Soil Mechanics and Foundation Engineering, Held at Harvard University, 1936; Harvard University Press: Cambridge, MA, USA, 1936. [Google Scholar]
  33. Bishop, A.W.; Blight, G. Some aspects of effective stress in saturated and partly saturated soils. Geotechnique 1963, 13, 177–197. [Google Scholar] [CrossRef]
  34. Rathnaweera, T.; Ranjith, P.; Perera, M. Effect of Salinity on Effective CO2 Permeability in Reservoir Rock Determined by Pressure Transient Methods: An Experimental Study on Hawkesbury Sandstone. Rock Mech. Rock Eng. 2015, 48, 2093–2110. [Google Scholar] [CrossRef]
  35. Arsyad, A.; Mitani, Y.; Ikemi, H. Determination of Permeability and Specific Storage of Reservoir Rocks Injected by Supercritical Carbon Dioxide Using Constant Pressure Permeability Method. In Proceedings of the ISRM Regional Symposium-7th Asian Rock Mechanics Symposium, Seoul, Korea, 15–19 October 2012; International Society for Rock Mechanics: Lisbon, Portugal, 2012. [Google Scholar]
  36. Nasvi, M.; Ranjith, P.; Sanjayan, J. The permeability of geopolymer at down-hole stress conditions: Application for carbon dioxide sequestration wells. Appl. Energy 2013, 102, 1391–1398. [Google Scholar] [CrossRef]
  37. Perera, M.; Ranjith, P.; Choi, S.K.; Airey, D. The effects of sub-critical and super-critical carbon dioxide adsorption-induced coal matrix swelling on the permeability of naturally fractured black coal. Energy 2011, 36, 6442–6450. [Google Scholar] [CrossRef]
  38. Brown, S.R. Fluid flow through rock joints: The effect of surface roughness. J. Geophys. Res. Solid Earth 1987, 92, 1337–1347. [Google Scholar] [CrossRef]
  39. Rubin, E.S.; Chen, C.; Rao, A.B. Cost and performance of fossil fuel power plants with CO2 capture and storage. Energy Policy 2007, 35, 4444–4454. [Google Scholar] [CrossRef]
  40. Klinkenberg, L.J. The Permeability of Porous Media to Liquids and Gases. In Proceedings of the Drilling and Production Practice, New York, NY, USA, 1 January 1941; American Petroleum Institute: Washington, DC, USA, 1941. [Google Scholar]
  41. Abbas, A.; Carcasses, M.; Ollivier, J.-P. Gas permeability of concrete in relation to its degree of saturation. Mater. Struct. 1999, 32, 3–8. [Google Scholar] [CrossRef]
  42. Loosveldt, H.; Lafhaj, Z.; Skoczylas, F. Experimental study of gas and liquid permeability of a mortar. Cem. Concr. Res. 2002, 32, 1357–1363. [Google Scholar] [CrossRef]
  43. Perera, M.; Ranjith, P.; Choi, S.K.; Bouazza, A. Parametric study of coal mass and cap rock behaviour and carbon dioxide flow during and after carbon dioxide injection. Fuel 2013, 106, 129–138. [Google Scholar] [CrossRef]
  44. Picandet, V.; Khelidj, A.; Bellegou, H. Crack effects on gas and water permeability of concretes. Cem. Concr. Res. 2009, 39, 537–547. [Google Scholar] [CrossRef]
  45. Gerke, H.; Genuchten, M.V. A dual-porosity model for simulating the preferential movement of water and solutes in structured porous media. Water Resour. Res. 1993, 29, 305–319. [Google Scholar] [CrossRef]
  46. Gangi, A.F. Variation of Whole and Fractured Porous Rock Permeability with Confining Pressure. In International Journal of Rock Mechanics and Mining Sciences & Geomechanics Abstracts; Elsevier: Amsterdam, The Netherlands, 1978. [Google Scholar]
  47. Perera, M.S.A.; Ranjith, P.G.; Choi, S.K.; Airey, D. Numerical simulation of gas flow through porous sandstone and its experimental validation. Fuel 2011, 90, 547–554. [Google Scholar] [CrossRef]
  48. Walsh, J. Effect of Pore Pressure and Confining Pressure on Fracture Permeability. Int. J. Rock Mech. Min. Sci. Geomech. Abstr. 1981, 18, 429–435. [Google Scholar] [CrossRef]
  49. Zhou, Z. The Impact of Capillary Imbibition and Osmosis during Hydraulic Fracturing of Shale Formations; Colorado School of Mines: Golden, CO, USA, 2016. [Google Scholar]
Figure 1. Failure patterns in hydraulic fracturing due to different stress conditions (a) when σa < σc and (b) when σa > σc.
Applsci 07 00664 g001
Figure 2. High-pressure triaxial setup used to conduct fracturing and permeability tests.
Applsci 07 00664 g002
Figure 3. (a) Bottom pedestal for fracturing; (b) bottom pedestal for permeability; and (c) configuration of O rings with sample.
Applsci 07 00664 g003
Figure 4. (a) Variation of injection pressure with time for different confining pressures; (b) variation of breakdown pressure with confining pressure experimentally and HW criterion.
Applsci 07 00664 g004
Figure 5. Three stages in hydraulic fracturing pressure development.
Applsci 07 00664 g005
Figure 6. Fracture pattern for (a) fractured sample at 1 MPa; and (b) fractured sample at 7 MPa confining pressure.
Applsci 07 00664 g006
Figure 7. Diagram of stresses and forces acting on the rock specimen.
Applsci 07 00664 g007
Figure 8. Fracture surface of (a) fractured sample at 1 MPa (this is the partially fractured sample mechanically split into two parts); and (b) fractured sample at 7 MPa confining pressure.
Applsci 07 00664 g008
Figure 9. Downstream flow rate development with time for intact rock specimen, during permeability tests. (a) 5 MPa; (b) 10 MPa; (c) 15 MPa; (d) 20 MPa; and (e) 25 MPa confining pressure.
Applsci 07 00664 g009
Figure 10. Downstream flow rate development with time for hydraulically fractured rock specimen (at 7 MPa confining pressure), during permeability tests. (a) 5 MPa; (b) 10 MPa; (c) 15 MPa; (d) 20 MPa; and (e) 25 MPa confining pressures.
Applsci 07 00664 g010
Figure 11. Downstream flow rate development with time for hydraulically fractured rock specimen (at 1 MPa confining pressure), during permeability tests. (a) 5 MPa; (b) 10 MPa; (c) 15 MPa; (d) 20 MPa; and (e) 25 MPa confining pressure.
Applsci 07 00664 g011
Figure 12. Variation of permeability for intact rock specimen (a) with injection pressure; and (b) with confining pressure.
Applsci 07 00664 g012
Figure 13. Variation of permeability for fractured sample with 1 MPa confining pressure (a) with injection pressure and (b) with confining pressure.
Applsci 07 00664 g013
Figure 14. Variation of permeability for fractured sample with 7 MPa confining pressure (a) with injection pressure and (b) with confining pressure.
Applsci 07 00664 g014
Figure 15. Variation of fracture aperture for hydraulically fractured rock specimen with 7 MPa confining pressure (a) with injection pressure and (b) with confining pressure.
Applsci 07 00664 g015
Table 1. Permeability test conditions with different confining and injection pssures.
Confining Pressure (MPa)N2 Injection Pressure (MPa)
51
2
4
101
2
4
6
8
151
2
4
6
8
10
201
2
4
6
8
10
251
2
4
6
8
10
Table 2. Recommendations for future studies of hydraulic fracturing and fracture permeability.
EffectDescription
Effect of proppantsTo investigate the effect of proppants on fracture permeability in deep geological reservoirs.
Effect of depthTo investigate the effect of depth on intact rock permeability and hence to evaluate leak-off characteristics during hydraulic fracturing.

