
Experimental Study and Numerical Simulation of a Laminated Reinforced Concrete Shear Wall with a Vertical Seam


Research Institute of Structural Engineering and Disaster Reduction, Tongji University, Shanghai 200092, China
*
Author to whom correspondence should be addressed.
Appl. Sci. 2017, 7(6), 629; https://doi.org/10.3390/app7060629
Submission received: 10 April 2017
/
Revised: 2 June 2017
/
Accepted: 13 June 2017
/
Published: 17 June 2017
(This article belongs to the Special Issue The Industrialization of the Building Construction Process)
Abstract
:In this paper, 12 laminated reinforced concrete shear walls are designed for cyclic loading tests. Seismic performance of laminated reinforced concrete shear walls with vertical seams are evaluated by the failure mode, deformability, hysteresis curve, stiffness degradation, and energy dissipation capacity. In addition, two different construction measures and construction techniques are designed to study their influence on the wall behavior, which provides a reference for the construction of laminated reinforced concrete shear walls. The numerical simulation of the specimen is carried out with ABAQUS, which is in good agreement with the experimental results. These results provide a technical basis for the design, application, and construction of the laminated reinforced concrete shear wall structure.
1. Introduction
With the development of society, structures are becoming higher and higher. Due to the safety and comfort requirements, vibration control has been widely used in civil engineering [1,2,3,4,5,6]. The method of vibration control is various, setting dampers on the structure [7,8,9,10,11,12,13,14,15,16,17] and adding shear link elements for wall structures [18,19], for example. On the other hand, with urbanization, large-scale and efficient construction is becoming more and more important in civil engineering. The fundamental way to meet this requirement is industrialization, which is constructing buildings in the form of industrial production. The assembly structure is a kind of structure system whose structural components are prefabricated in the factory, and then assembled on-site. It is widely used by government and real estate developers because of its advantages, e.g., small workload, less pollution, and high quality of the components. It is a green, environmentally-friendly, and broadly-applicable form of residential structures.
The assembly structures originated in Europe, and the construction technology of prefabricated components has been quite mature and widely used in civil engineering in Europe and other industrialized countries. However, compared with the cast-in-place concrete, the overall performance of the assembly structure is often questionable due to the joint part of the old and new concrete, resulting in poor seismic performances, which has become the weakness in terms of its promotion. In order to meet the seismic requirements of high-rise buildings, there have been many studies on the seismic performance of assembly structures.
In the 1950s and 1960s, France first proposed a prefabricated concrete slab structure, which is made from a series of wall panels by fitting joints, and its seismic performance depends on the joint strength and its integrity. To prevent the occurrence of shear slip, the horizontal seam of the large plate structure is generally designed to be strongly connected as infinitely rigid. The vertical joints play the role of the shear wall beam to ensure the effective force transmission between the wall panels. Many researchers have carried out experimental studies and numerical simulations of this structure [20,21,22,23]. It has been found that the elastic deformation of the wall under a strong earthquake is dominated by rocking deformation, and the horizontal seam between the shear wall and the foundation gradually forms a continuous crack. The deformation caused by the earthquake concentrates mainly at the horizontal seam between the large slab and the foundation, while the upper walls damage slightly. The seismic energy is dissipated mainly through the seam at the bottom of the wall, resulting in a large tensile deformation of the vertical reinforcement passing through the cross-section of the seam. Structural measures (such as adding a damper or energy-consuming steel plate) at the seam can enhance the seismic performance.
In order to improve seismic performance of the assembly structural system, the post-tensioned prestressing technology is prevalent in North America, which stretches and anchors steel stranded wires through the prefabricated wallboard and its horizontal seam. Such technology controls deformations and damage of structures under strong earthquakes, resulting in resilient structures [24,25,26,27,28]. The prefabricated component of this structure is “ductile connected”, that is, the bending resistance of the connecting part is lower than that of the prefabricated component itself. The structure shows rocking deformation under seismic action. The plastic deformation mainly concentrates at the horizontal seam, while the upper wall damages slightly, which is easier to repair after the earthquake. As the prestressed reinforcements are unbonded, they still maintain elasticity after large deformation. Consequently, the recovery ability of structures is good, resulting in small residual deformation after the earthquake. Besides, precast concrete columns with grouted splice sleeve have also been proposed and tested, which have good seismic performance [29].
The original purpose of the German superimposed assembly system is to achieve building energy efficiency. The prefabricated floor and the wallboard are semi-manufactured products made in the factory, with longitudinal reinforcement and lattice reinforcement according to the structural requirements. A styrene foam board with high compressive strength, low water absorption, and good insulation is set outside or inside the wall. After the semi-manufactured products are transported to the construction site and lifted in place, concrete is poured between the wallboards which act as templates. Some necessary reinforcements will also be set at the joint. Such systems have the advantages of simple production, low cost and excellent quality, hence, are widely used in Germany and have significant energy saving effect. However, as Germany is not located in an earthquake-prone area, the seismic design of such systems is not considered.
In order to better develop the superimposed technology, it has been improved for some related seismic performance studies. For example, there is a sandwich concrete wall whose middle layer is a polystyrene sheet, and is sprayed with thin concrete layers on its surface during construction [30]. Ricci et al. [31] found that the seismic performance of this structure was comparable to that of cast-in-place concrete, and the stiffness and the strength of the building made of such material under dynamic excitation appears quite superior with respect to those expected from the results of previous pseudo-static cyclic tests conducted on simple specimens [32,33,34,35]. Another superimposed concrete wall is made of prefabricated wall panels and cast-in-place components. Prefabricated wallboard is made of two prefabricated panels and lattice reinforcements. After being installed in place, concrete is poured in the middle of the two layers, bearing the vertical horizontal force together. Through the test [36,37,38,39,40], it can be seen that the prefabricated part of this superimposed wall is well combined with the cast-in-place part, and the energy dissipation capacity is similar to that of the whole cast-in-place wall, which proves that the seismic performance is close to the traditional cast-in-place wall.
In the 1990s, superimposed technology was introduced to Japan, and it was widely used in floor and maintenance wall systems. The finishing can be set on the outer surface of the prefabricated wallboard at the factory. After installation at the construction site, it is used as the wall’s template on the outer side, with reinforcement placed on the inner side. The template is set on the other side of the wall, and such a semi-prefabricated shear wall is completed after pouring the concrete. The prefabricated wallboard works with the cast-in-place part through the reinforcement on the inner side, which can reduce the amount of sand and gravel construction, speed up the construction, improve the construction quality, and greatly reduce the amount of the template used. Japan’s tests, engineering practices, and theoretical analyses have shown that the performance of such semi-prefabricated laminated structures meet safety requirements and are in line with the relevant Japanese regulations.
In recent years, the laminated reinforced concrete shear wall structure has been introduced into China. Although application of the wall structure has been in Japan for more than 20 years, most of it is used as floor and maintenance walls of framed structures. The question of whether it can be used as a load-bearing wall in high-rise shear wall structures is still lacking in adequate research and evidence. In view of this situation, there is an urgent need for a series of targeted experimental research work on the laminated shear wall structure to accumulate information, and gradually develop and improve the corresponding design, construction guidelines, and application standards. Zhang et al. [41] studied the laminated wall, and found that the failure mode and the hysteresis curve of the laminated wall were similar to those of the cast-in-place wall. In the numerical simulation, it was found that when the axial compression ratio was greater than a certain value, the interface incompatibility between the prefabricated and the cast-in-place part would lead to brittle failure [42]. However, these studies are of little concern to the walls with vertical seams, which widely exist in actual projects due to the size limitations of prefabricated components; consequently, it has important research value. At the same time, the corresponding structural measures and construction technology are also rarely reported.
In this paper, 12 laminated reinforced concrete shear walls are designed for cyclic loading tests. Seismic performance of laminated reinforced concrete shear walls with vertical seams are evaluated by the failure mode, deformability, hysteresis curve, stiffness degradation, and energy dissipation capacity. In addition, two different construction measures and construction techniques are designed to study their influence on the wall, which provides a reference for the construction of laminated reinforced concrete shear wall behavior. The numerical simulation of the specimen is carried out with ABAQUS (produced by DASSAULT SYSTEMS in Providence, RI, United States). These results provide the technical basis for the design, application, and construction of the laminated reinforced concrete shear wall structure.
2. Experimental Setup
2.1. Specimens Design
In this experiment, 12 full-scale concrete shear wall specimens are designed and tested. The seismic performance of cast-in-place walls and prefabricated laminated walls are analyzed and compared. The design of the test specimens is divided into two types, namely, the prefabricated whole laminated shear wall (PCF-A) and the prefabricated laminated shear wall with a vertical seam (PCF-C), abbreviated as the whole wall and the seam wall, respectively, in this paper. In the actual construction of the prefabricated structures, an assembly seam is inevitable, because it is impossible to fabricate components in the factory that are as large as the structure needs. Thus assembly seams exist between the prefabricated components. Additionally, the connection treatment is difficult between the reinforcements of prefabricated part and the cast-in-place part of the concrete, resulting in relative weakness in the connection part, such as the place between prefabricated shear wall panels and floor or beams, as well as the seam between shear wall panels, which needs to be strengthened. The corresponding locations in the test are the connection part between the bottom/upper beam and the specimen, as well as the vertical seam in PCF-C.
In order to study the influence of different structural measures, the specimens with vertical seams are subdivided into two groups according to the position of the longitudinal reinforcement of the concealed column, which are labeled as I and II. Part of the longitudinal reinforcement of specimens in class I are embedded in the prefabricated part, and the rest are placed in the cast-in-place part, while longitudinal reinforcement of specimens in class II are all arranged in the cast-in-place part. All laminated specimens are 1500 mm × 1800 mm in size, and the wall thickness is 250 mm (prefabricated 70 mm, cast 180 mm). The concealed column is designed according to edge member requirements in the Code for Design of Concrete Structures (GB50010-2002) [43]. The concealed column is 250 mm × 400 mm in class I, and 180 mm × 400 mm in class II. The axial ratio of the specimen is 0.11. The longitudinal reinforcement of the concealed column is symmetrical in its cross-section. The column stirrup is made of the combination of “U” shaped hoop and “L” shaped closed stirrup, with the stirrup hook of 10d (“d“ represents the diameter of the stirrup), and a bending angle of 135°. The thickness of the concrete covering layer is 25 mm.
In the design and fabrication of these specimens, the connections mentioned above not only meet the requirements about connection and anchorage of reinforcements in Chinese codes, but also learn from the provisions of the Japanese regulations. The HRB400 Φ10 @ 150 strengthening reinforcement are arranged at the seams (including the seam between the wall and the beam, as well as the vertical seam in the wall) and mortar fills them.
To examine the different interface processing on the cooperation performance of the prefabricated part and cast-in-place part, the inner surface of the prefabricated laminated wall panels receive napping treatment in specimens whose tail number is 1 or 3 (such as PCFI-A1, PCFI-A3, PCFI-C1, PCFI-C3, PCFII-C1, and PCFII-C3), while the rest are sprayed with a surface retarder. At the same time, for the comparative study, two ordinary cast-in-place reinforced concrete shear wall specimens (SW) are fabricated in two types (one is the whole cast-in-place wall, and the other has a vertical seam), with thicknesses of 200 mm, to ensure that the effective thickness of the specimen is the same as the laminated specimens. The parameters of all of the walls are shown in Table 1, and the design drawings are shown in Figure 1.
2.2. Sensor Placement
The horizontal displacement of the upper, middle, and lower parts of the wall and the vertical displacement on both sides of the specimen are measured by displacement meters. In the upper, middle, and lower parts of the wall, the displacement meters D1, D2, and D3 are arranged horizontally in the direction of the actuator to measure the horizontal displacement of the specimens. On the left and right sides of the wall, the displacement meters D6 and D7 are arranged vertically to measure the vertical displacement on both sides of the specimen. In the diagonal direction of the wall, two extensometers D4 and D5 are arranged to measure the shear deformation of the whole shearing wall. The displacement meters are shown in Figure 2a,b. Resistance strain gauges are used to measure the key strain of the longitudinal reinforcement and distributing reinforcement, as shown in Figure 2c–f.
2.3. Specimen Fabrication
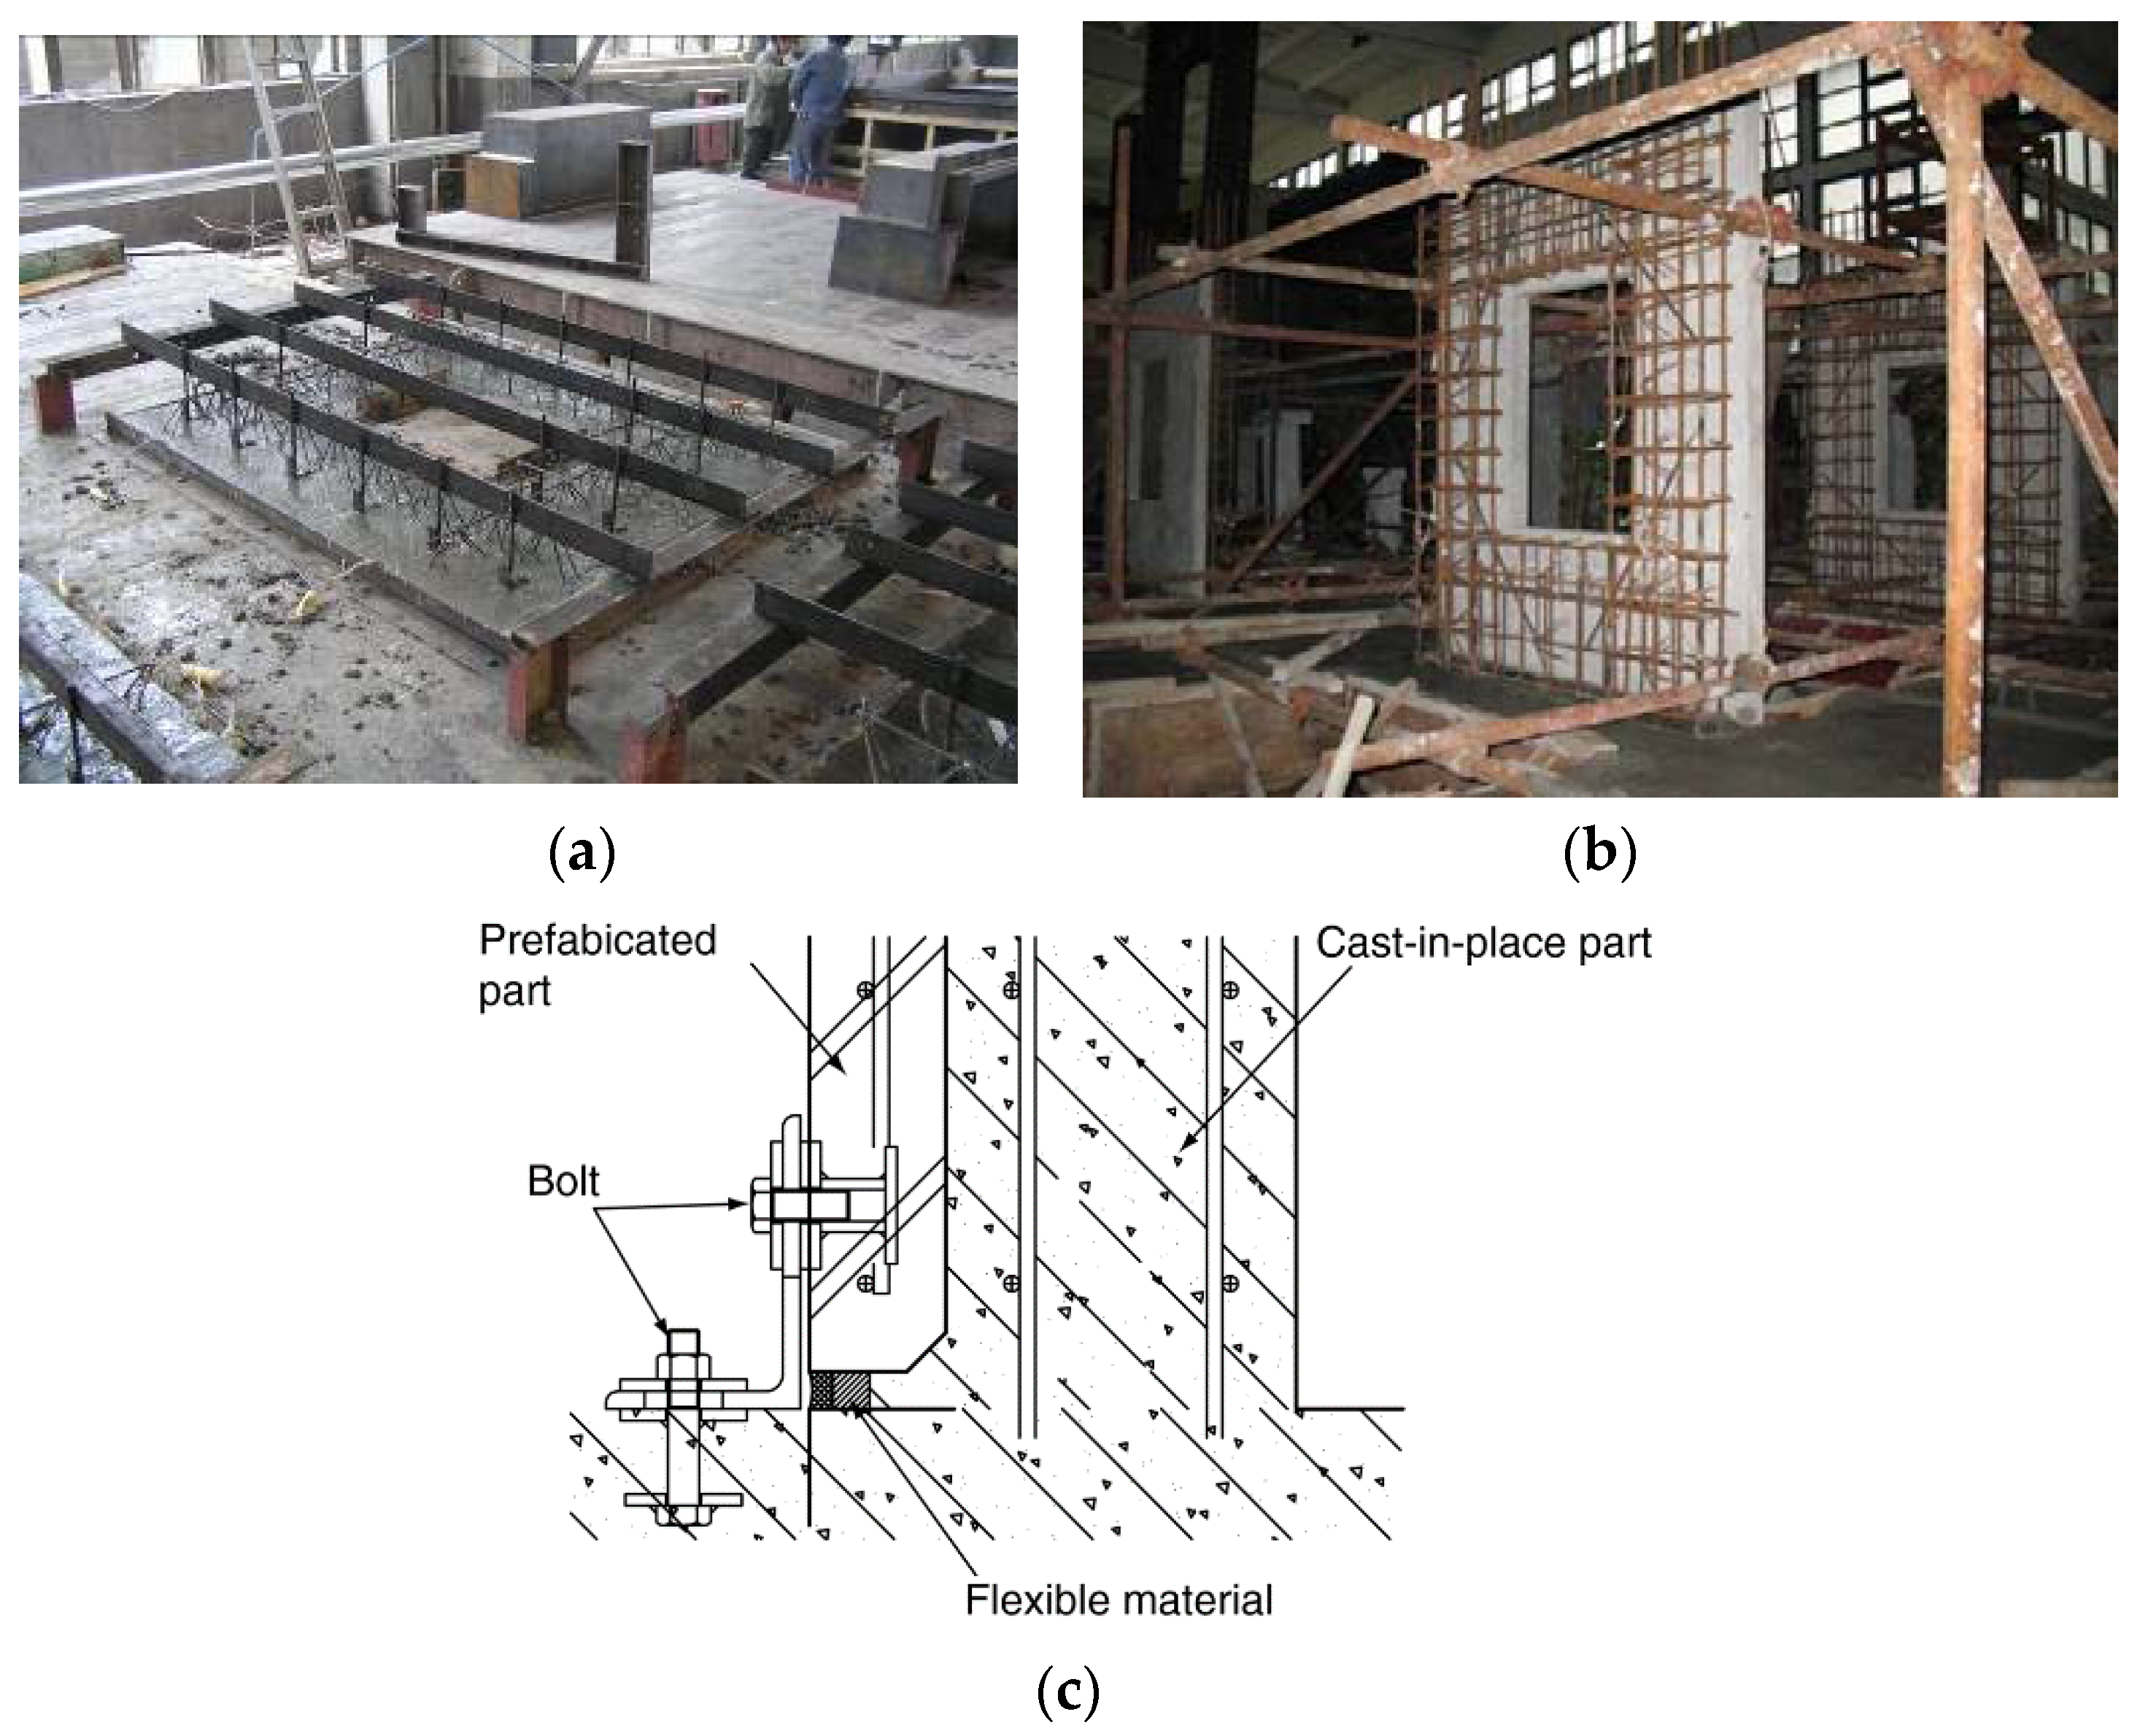
The production of the test specimen is divided into two stages: stage one is the production of the prefabricated concrete board (abbreviated as PC board), i.e., the prefabricated part of the wall. In this stage, the PC board is completed in the factory and transported to the Tongji University Laboratory for the production of the cast-in-place part, which is the second stage (Figure 3a,b). All steel strain gauges in the specimens are fixed before the concrete is poured and protected by epoxy resin.
After the prefabricated part of the specimens arrives at the laboratory, the PC board is first lifted in place, and then a connector between the bottom beam and the specimen is installed (Figure 3c), followed by binding steel bars in the cast-in-place part. After the completion of the reinforcement binding, the bottom beam is poured. When the design strength is reached, the connecting member is fixed in the bottom beam to ensure that the PC part is perpendicular to the bottom beam. After the entire specimen is poured and maintained, the connector is removed to eliminate its effect on the test results.
In order to acquire the actual material strength and physical properties of reinforcements and concrete of the test specimens, three 450 mm-long reinforcements, six 150 × 150 × 150 mm concrete cubes (for measuring the compressive strength of the concrete) and three 100 × 100 × 300 mm prism test blocks (used to measure the axial compressive strength and modulus of elasticity of the concrete) are reserved in the same batch of materials. The results of the material test are shown in Table 2 and Table 3.
2.4. Test Loading Device and Loading Process
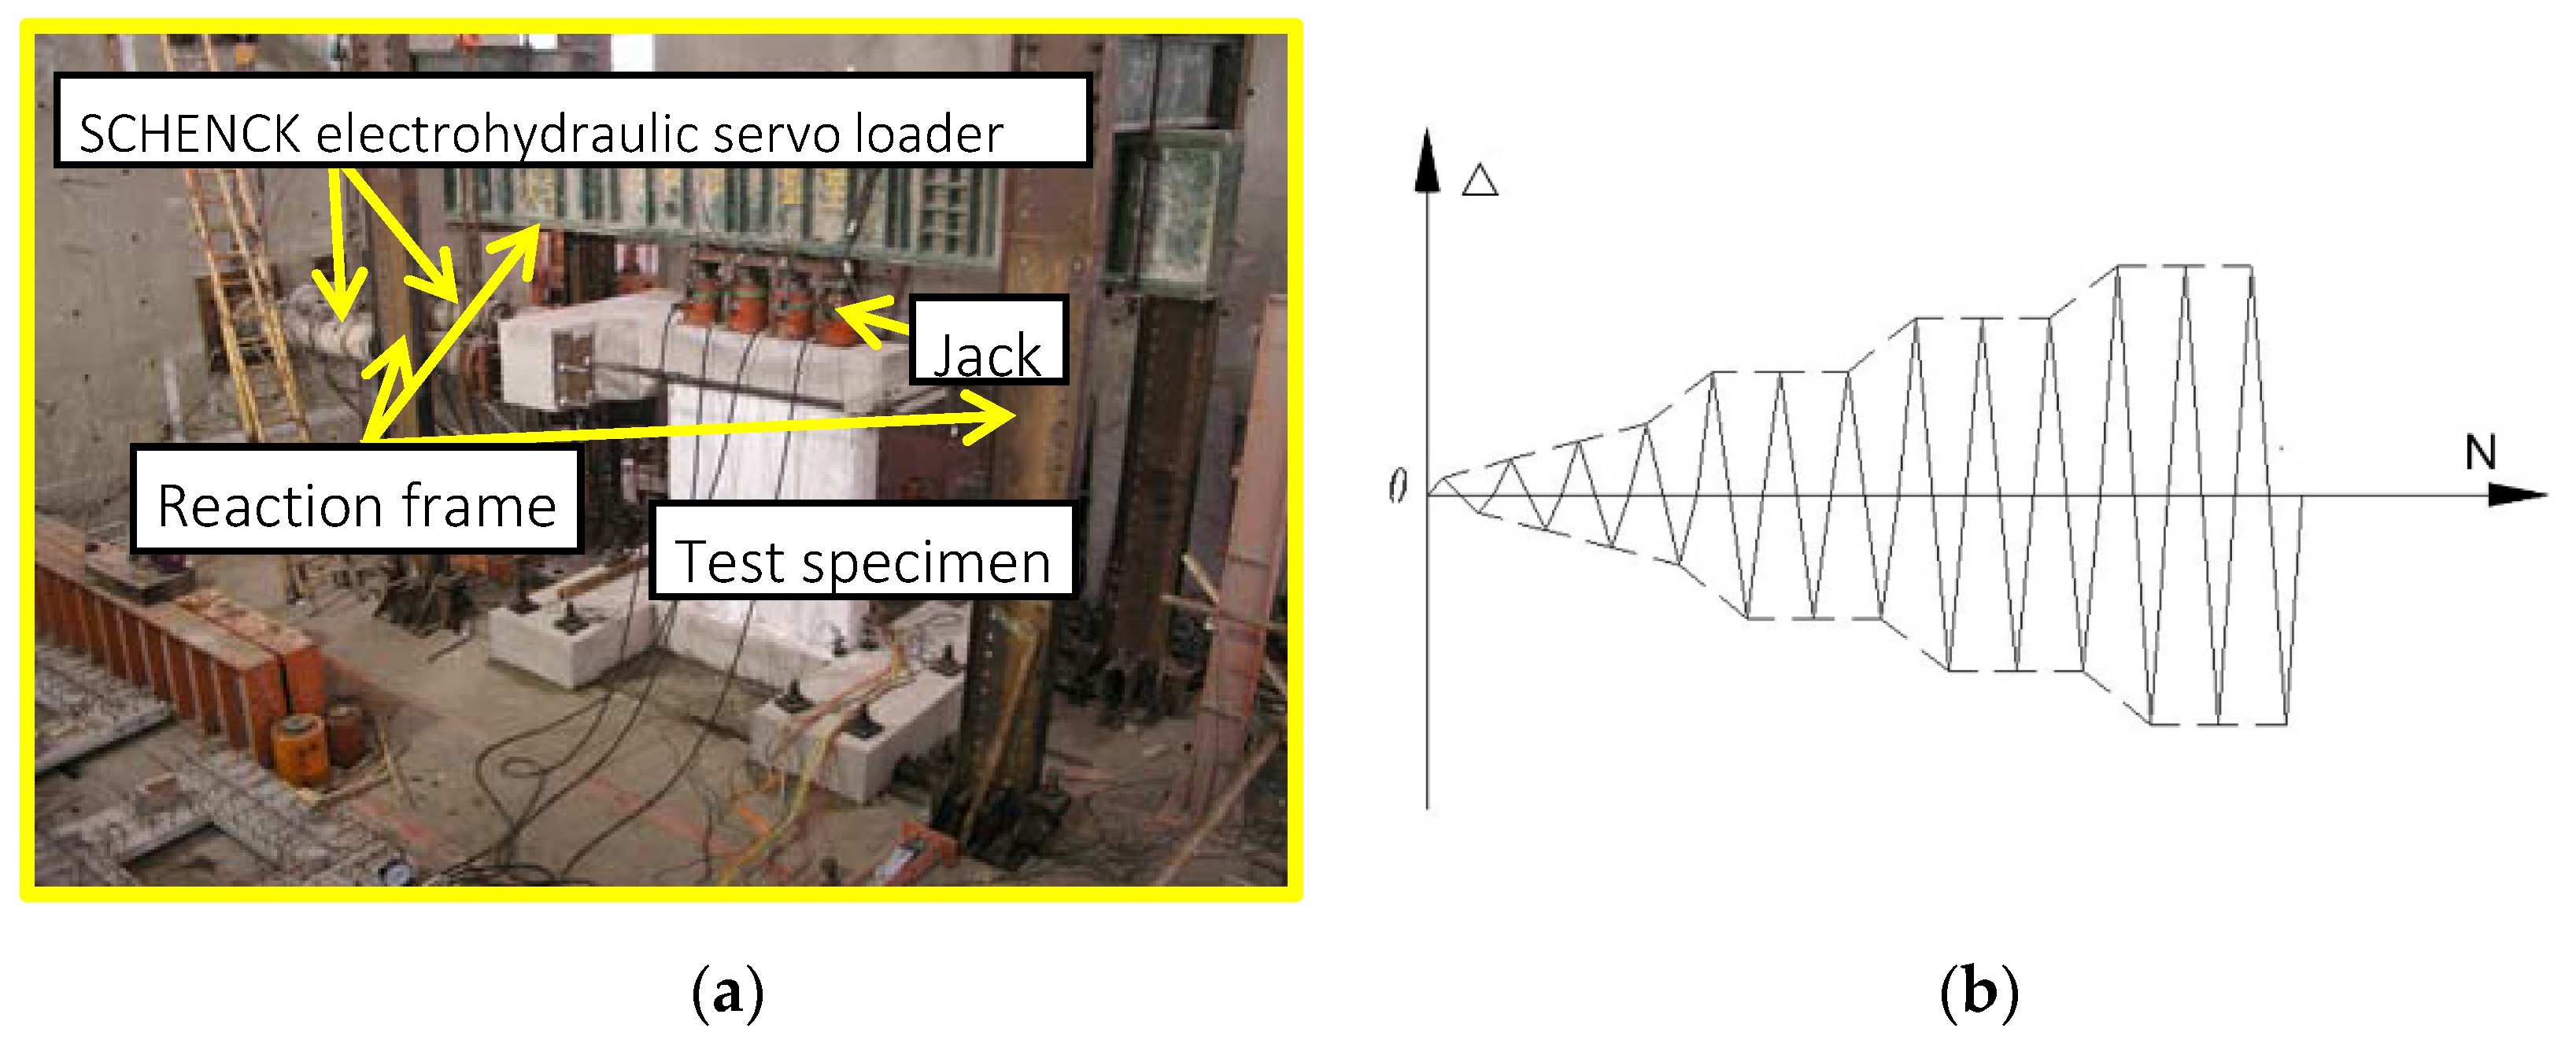
The wall specimen is placed in the reaction frame. The horizontal load of the specimen is applied by the SCHENCK electrohydraulic servo loader, and the vertical load is applied by the jacks at top of the wall. In order to make the vertical load as uniform as possible, a load beam is designed at the top, and the jack is connected to the reaction frame by some rollers to reduce the friction so that the top of the specimen can move freely in the horizontal direction. The test setup is shown in Figure 4a.
A displacement control loading method is used in the test, and the load process is shown in Figure 4b. Before the test, a vertical load is applied to the design value of 1200 kN at the top of the wall and is kept constant throughout the loading process. The loading process is divided into two phases: displacement is increased by 1 mm for each stage in the elastic phase, and each cycle is reloaded for one cycle. After entering the yield stage, displacement is increased by 2 mm for each stage and cycled three times. The test is stopped when the load drops to 85% of the maximum load or when the specimen is destroyed.
3. Experimental Results
3.1. Test Phenomena
The test phenomenon generally shows that the specimens are at the elastic stage first, and then microcracks appear at the corner. With the development of such cracks, the stiffness degrades, the horizontal bearing capacity declines and, finally, the concrete at the corner crushes, leading to the failure of such specimens [41]. Table 4 lists shear bearing capacity calculated according to the specification [43], the measured peak load, and the ductility coefficient of the specimen. The values in parentheses are calculated using the measured strength of concrete and reinforcement. The ductile coefficient is defined as the ultimate displacement versus the yield displacement to measure the deformation capacity of the wall.
Comparing the test phenomena of laminated test specimens PCFI-A1–A3, PCFI-C1–C3, and the corresponding cast-in-place test specimens SWA and SWC, it can be found that the failure modes of the laminated specimen and the cast-in-place specimen are close to each other. In the same group, the degree of damage is similar with the loading going on, and the final bearing capacity is almost the same, hence, it can be concluded that the performance of the laminated member is close to that of the cast-in-place member.
Comparing PCFI-A and PCFI-C, it can be seen that the damage of the seam wall is synchronized with that of the whole wall, and the ultimate bearing capacity is close to it, indicating that the seam can convey the load well and reach a similar effect as the whole wall given the good structural detailing of the seam.
For the two different structural measures, it can be seen from the specimens PCFI-C and PCFII-C that PCFII-C is damaged later than PCFI-C and the final bearing capacity is slightly higher, which may be due to the higher concrete strength of PCFII-C. The different structural measures of scheme I and scheme II have little effect on the performance of the specimen.
Comparing the phenomena of specimens in the same group, it can be found that the damages of the prefabricated part and the cast part are similar and synchronized regardless of the construction technology, indicating that the two parts of the concrete work well together.
In conclusion, the phenomenon and the data of the same group are close to each other and show good stability. The ductility coefficient of the laminated members is slightly lower than that of the cast-in-place walls, but the other properties are not very different from the cast-in-place walls.
3.2. Horizontal Load-Displacement Hysteretic Curve and Skeleton Curve
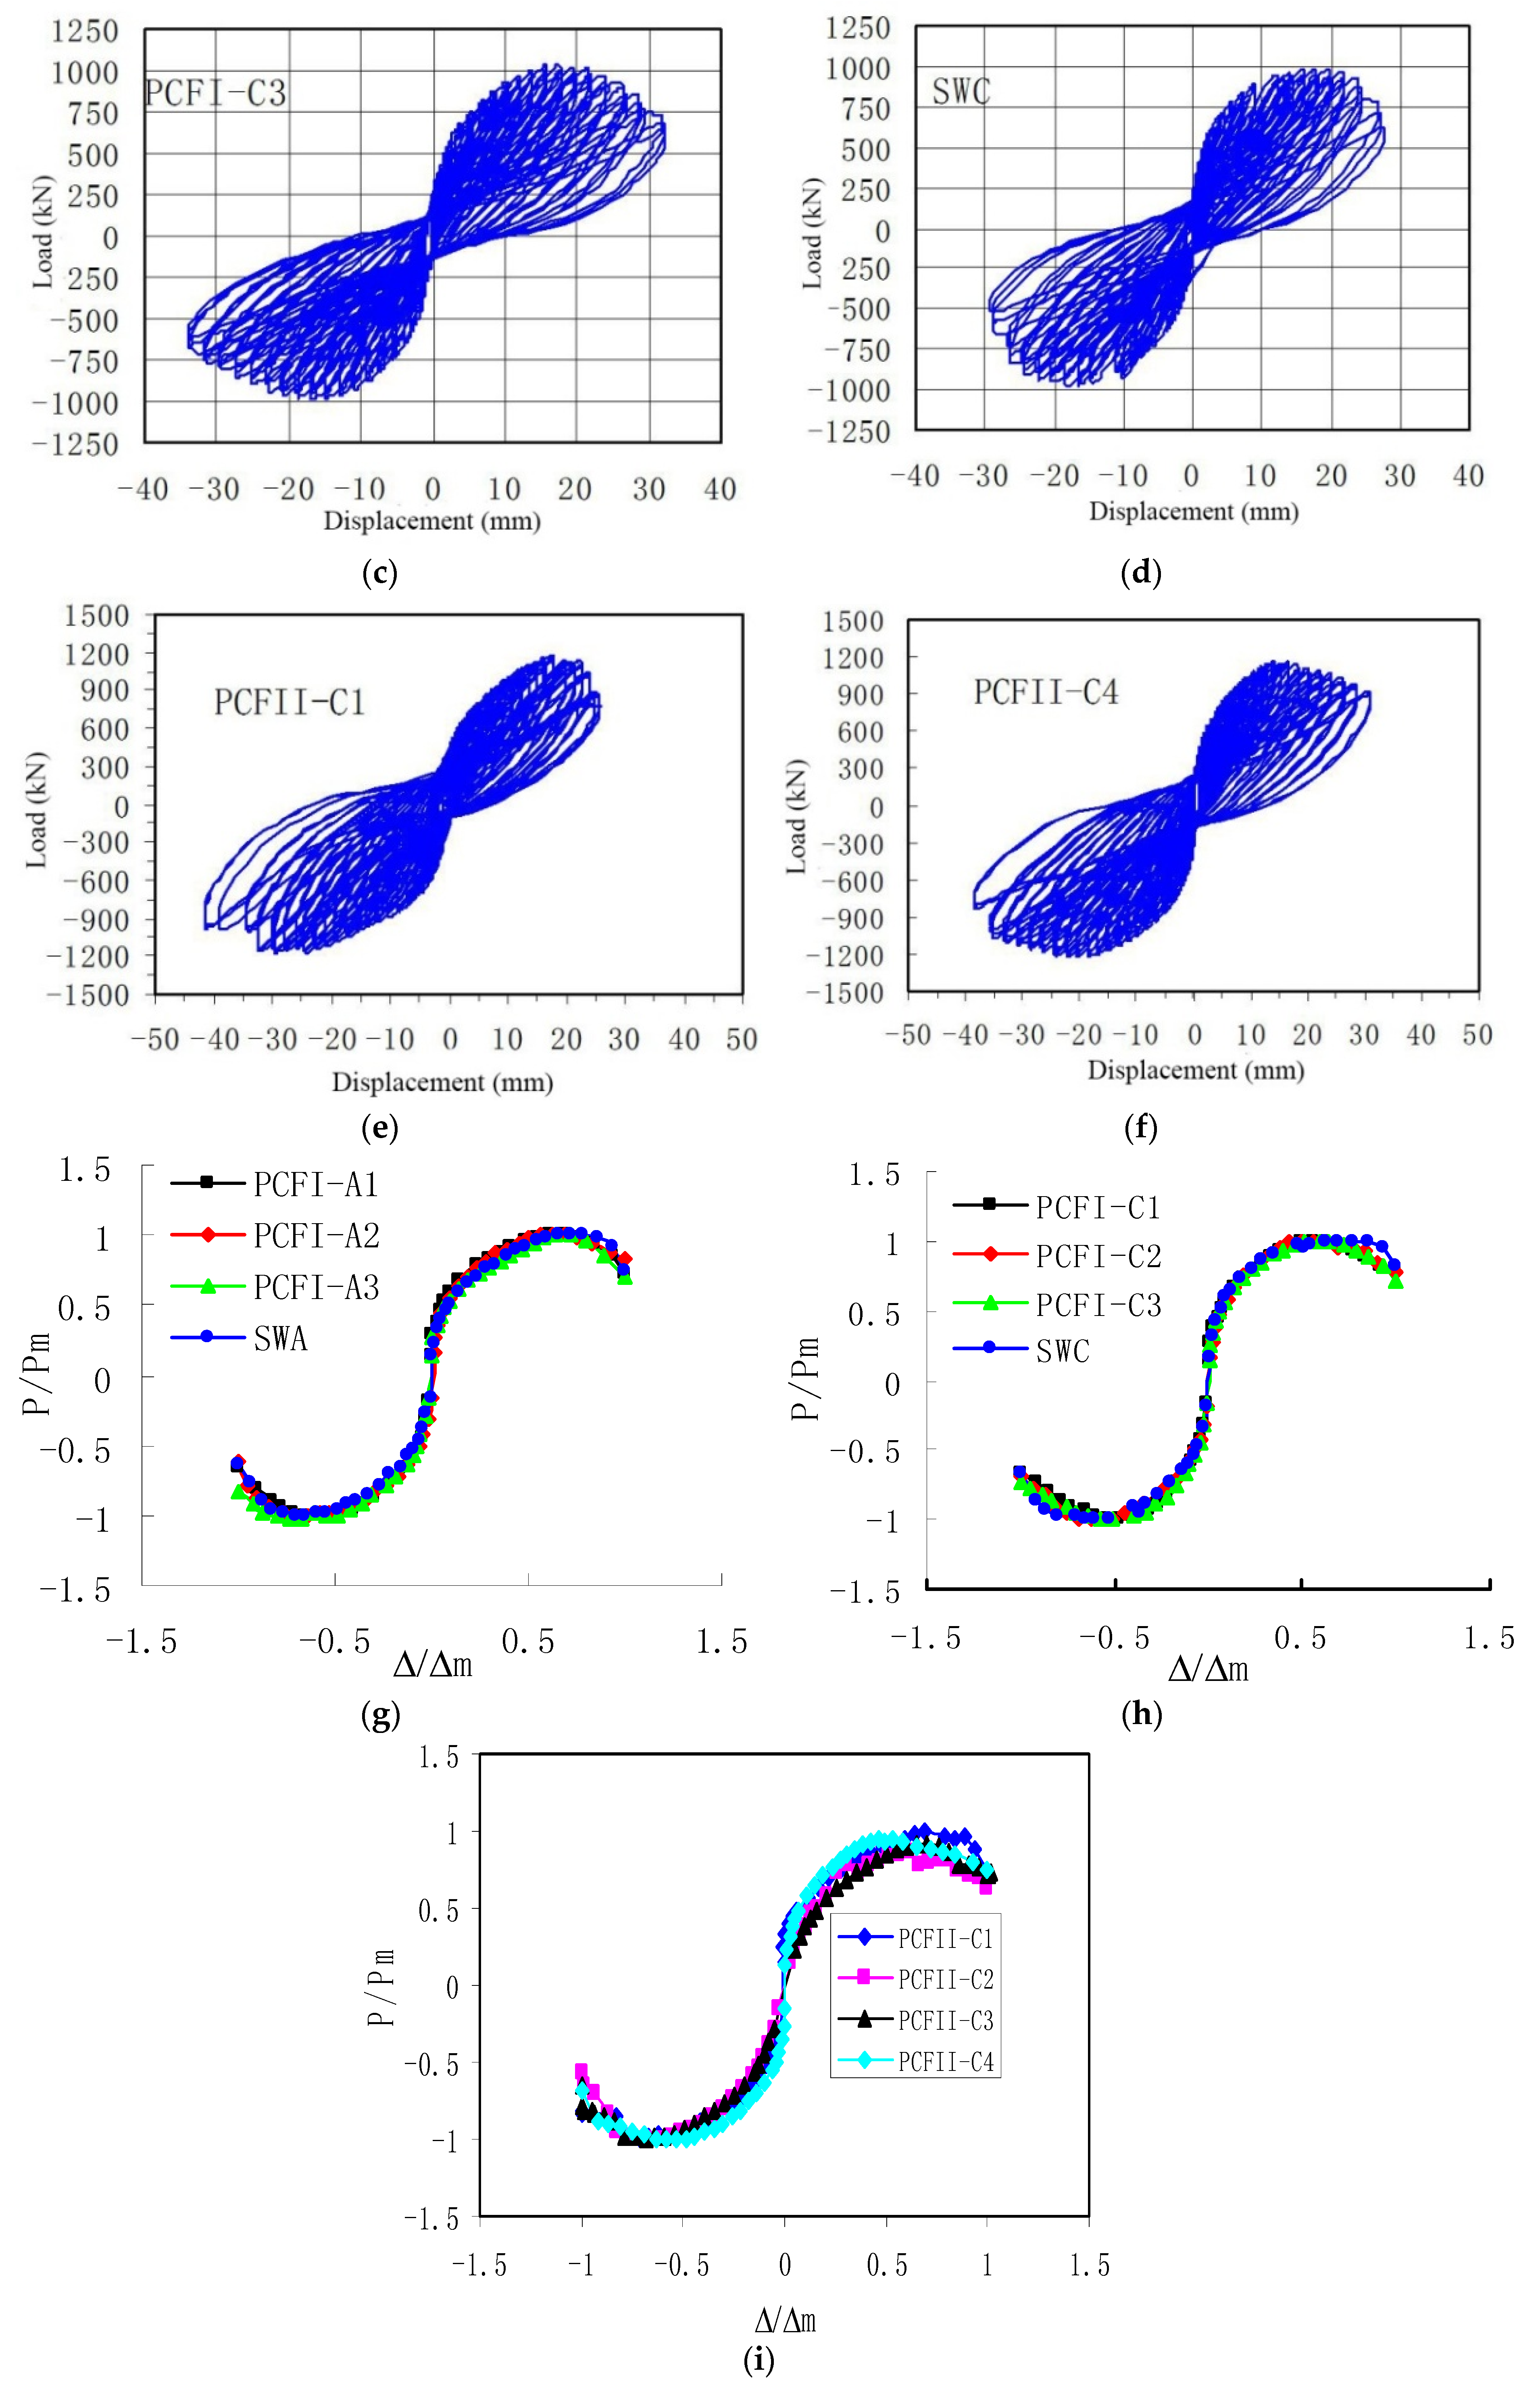
Figure 5 shows the representative hysteretic curves in each group and the standardized skeleton curves for each specimen. The reason for the standardizing skeleton curve is that there are many factors affecting the hysteretic curves, including the axial compression ratio, the aspect ratio, the material properties, etc. If we use the dimensionless coordinates, we can obtain a good regular relationship. In the case of dimensionless analysis, taking into account that the shear wall has no obvious yield point, the limit load point (Pm, Δm) is selected as the reference point.
It can be seen that the hysteretic curves and skeleton curves of the laminated wall and the cast-in-place wall are relatively plump. Before the cracking, the hysteretic curve is basically straight, the area surrounded by the hysteretic loop is approximately zero, and the wall is in the elastic working state. With the increase of displacement, the horizontal load increases, and oblique cracks appear at the lower part of the wall. The cracks can be basically closed when unloading, and the non-linear character is not obvious. As the displacement continues to increase, the number of cracks gradually increases, and the hysteretic loop area gradually expands, with residual deformation after unloading. The hysteretic curve appears to have a good anti-S shape, and the specimen shows good energy dissipation capacity. Compared with the cast-in-place components, the plump part of the hysteretic curve of the laminated wall is similar, and some are even plumper than the cast-in-place components, indicating that the factory can guarantee the quality of the prefabricated components very well. The discussion in the literature [41] also demonstrates similar conclusions. By comparing the structural measures of type I and type II, together with the hysteretic curve and skeleton curve, it can be concluded that the two kinds of construction measures and the joint surface construction technology have little effect on the seismic performance of specimens.
3.3. Energy Dissipation Capacity
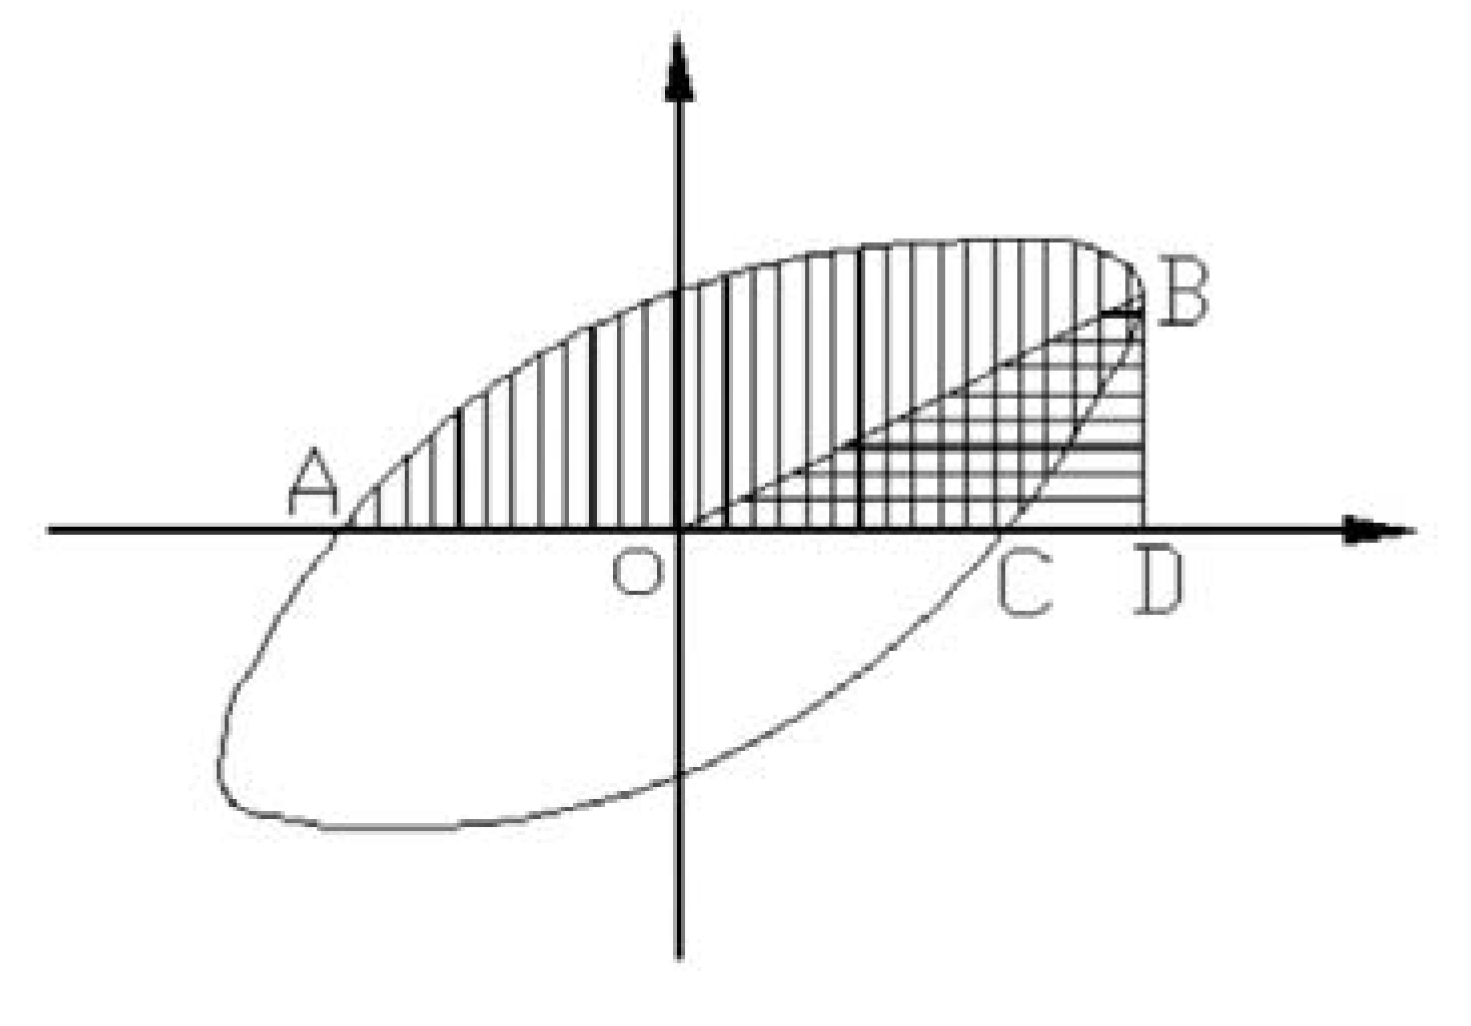
Energy dissipation capacity is an important evaluation index of the seismic performance of a structure. In a destructive earthquake, if the energy cannot be absorbed, it will lead to local or overall structural damage. The energy dissipation capacity of the specimen is evaluated by the equivalent viscous damping coefficient he. The equivalent viscous damping coefficient is the ratio of the energy stored in the specimen to the deformation energy of the specimen in the elastic phase. The formula is as follows:
The calculation diagram is shown in Figure 6. The equivalent viscous coefficients of the specimens are shown in Table 5. By analyzing the data, the following conclusions can be drawn:
- Whether it is the whole wall or a seam wall, the energy dissipation capacity of the laminated wall is no worse than the cast-in-place wall, indicating that the laminated wall has as good a seismic performance as the cast-in-place wall.
- The PCFI-C has a generally higher equivalent viscosity coefficient than PCFI-A, indicating that the energy dissipation of the seam wall is better than that of the whole wall. This may be due to the greater deformation caused by the seam; thus, more energy is dissipated. Such a seam effect is also reported in the literature [44].
- Compared with PCFI, PCFII has a higher equivalent viscous coefficient, which may be due to the fact that the concrete strength of PCFII is larger than PCFI by about 10%. The structural measures have little effect on its energy consumption capacity.
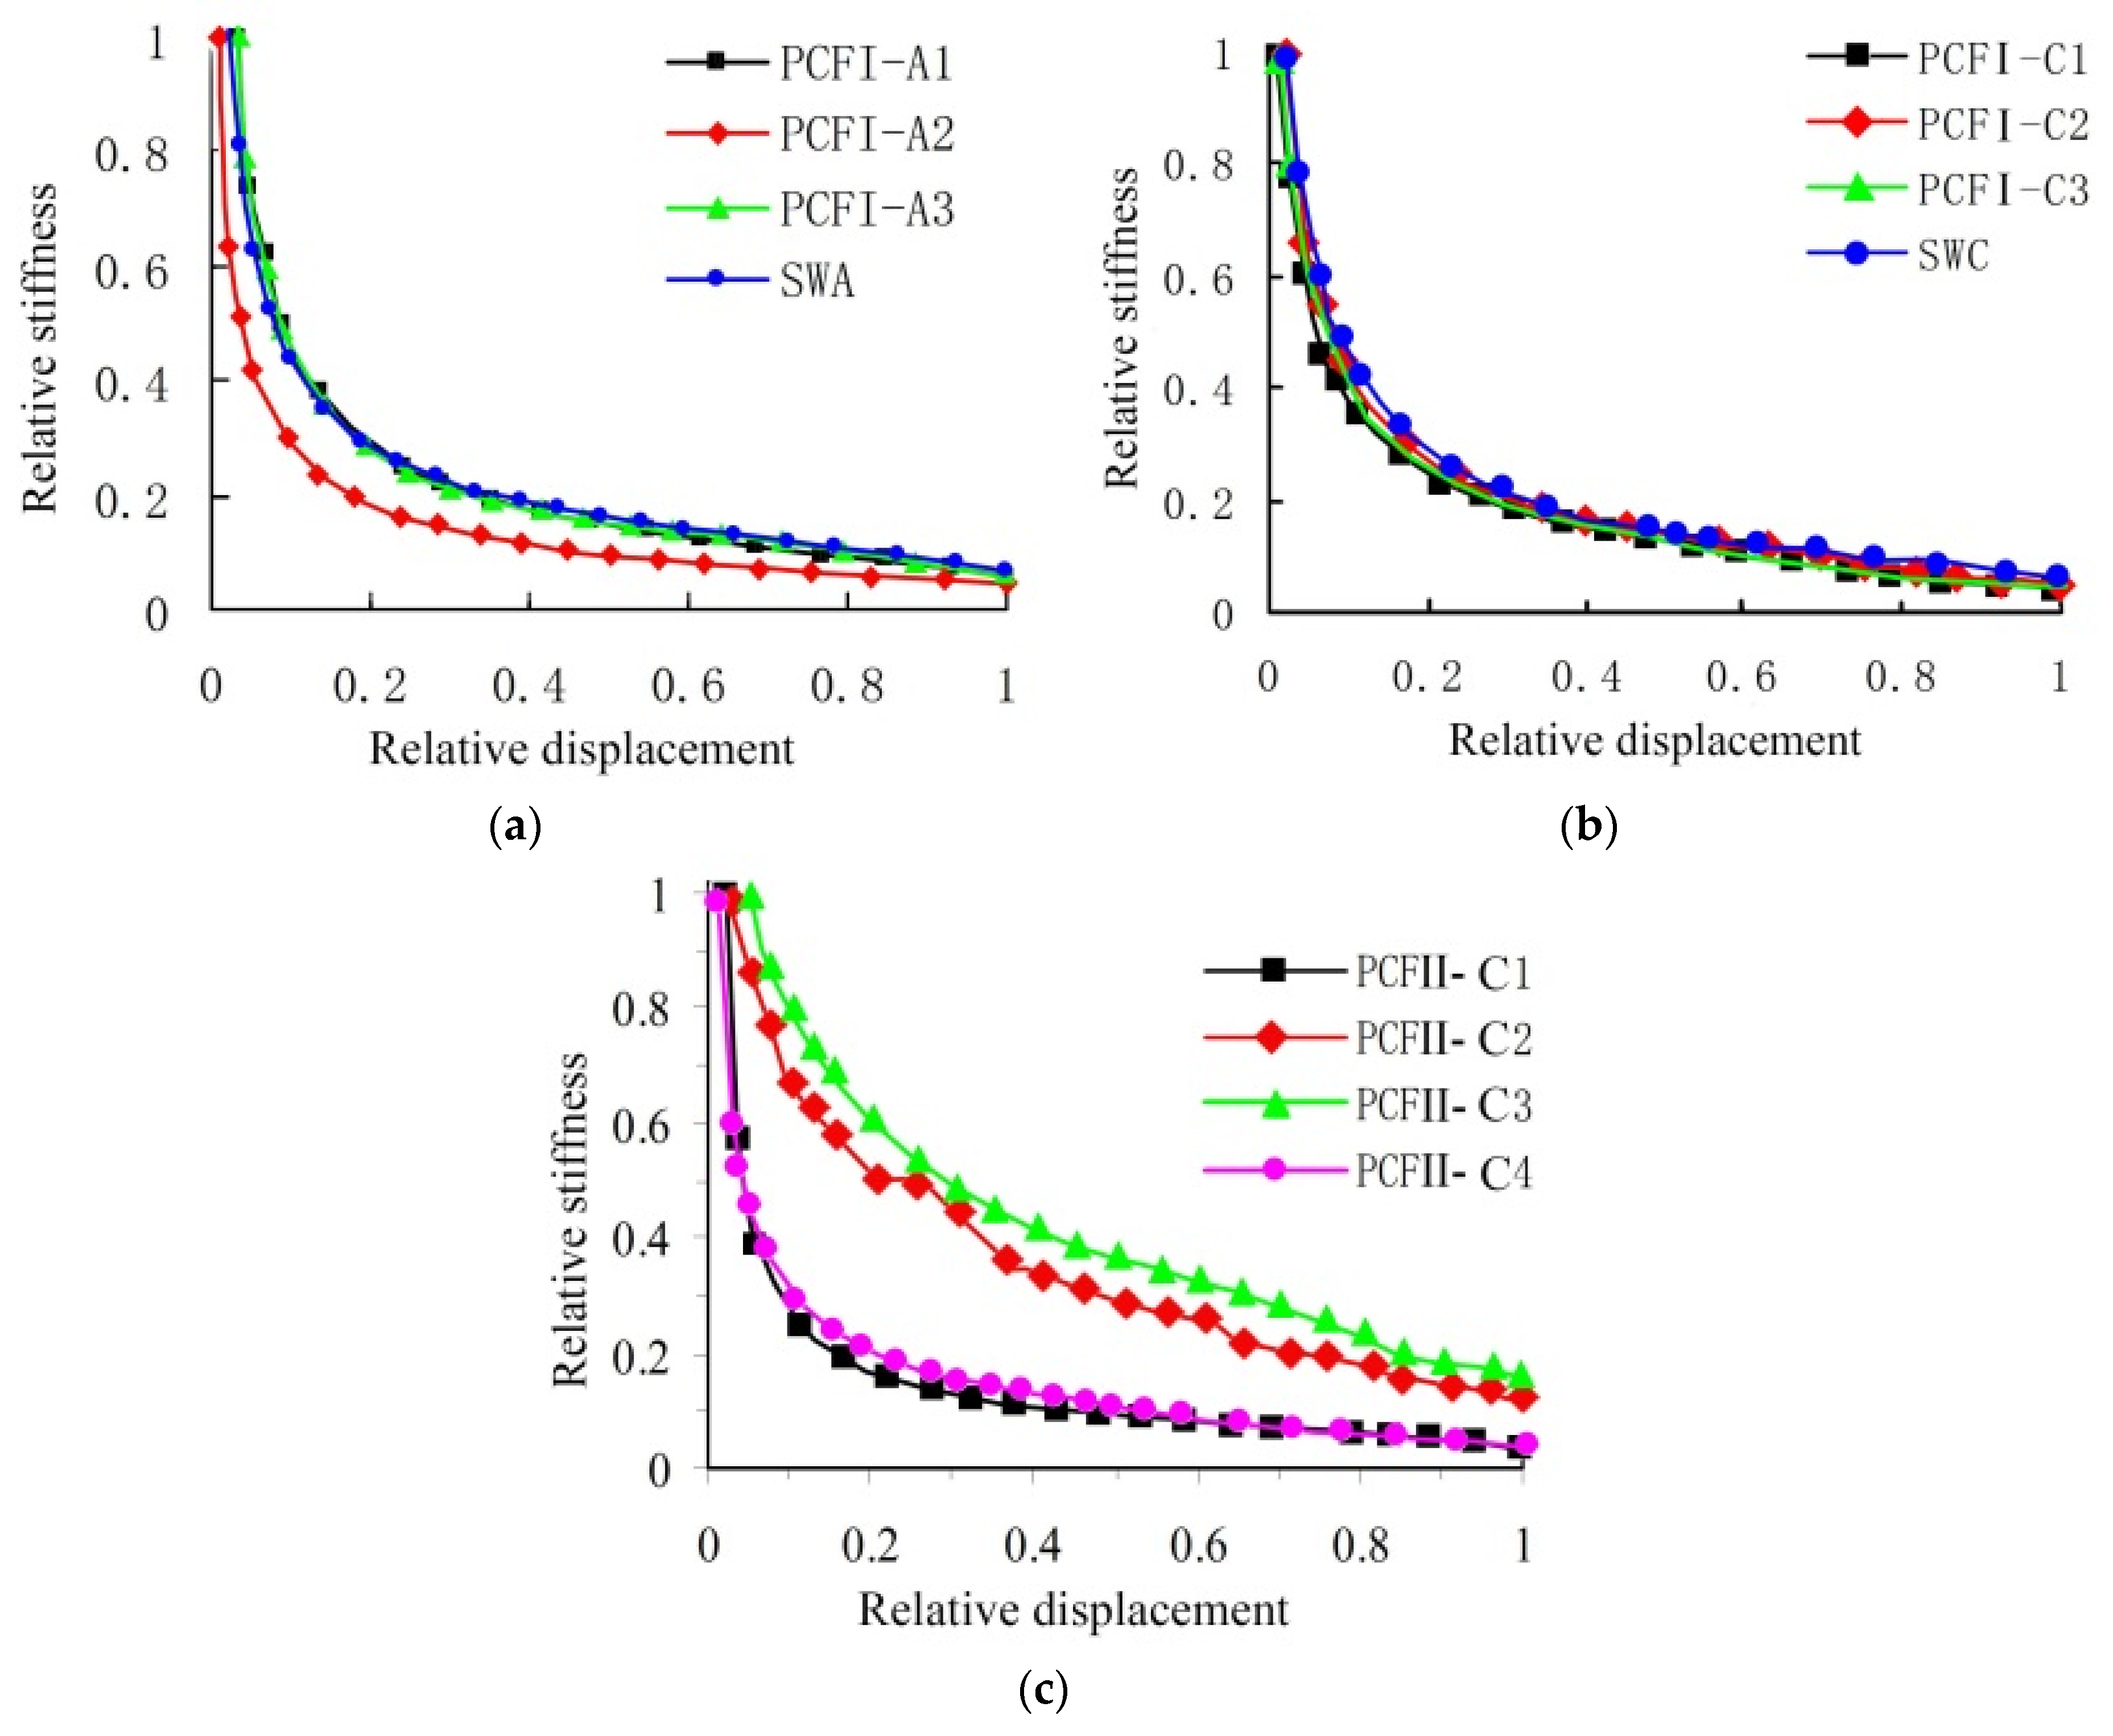
3.4. Stiffness Degradation
When the specimen is subjected to the load, the equivalent stiffness decreases as the number of cycles increases, which is called the stiffness degradation. Stiffness degradation is also an important evaluation index for assessing the seismic behavior of structures. Figure 7 shows the stiffness degradation curves of the 12 specimens.
It is shown that at the initial stage of the test load, stiffness degradation is more obvious compared with the later stage. The whole wall and the seam wall of type I are similar to that of the cast-in-place wall in trend and degree of stiffness degradation. For type II, the stiffness degradation curves of PCF2 and PCF3 are gentler than those of PCF1 and PCF4, and the above differences are related to the local cracking damage of the loading beam in the later stage.
4. Numerical Simulation
4.1. Material Constitutive Model
For reinforcement, the model shown in Figure 8 is used to describe the stress-strain relationship of the steel bars under monotonic load, in which , , .
For concrete, the damaged plasticity concrete model is chosen, as it can better simulate the plastic properties of concrete and the stiffness degradation under the action of cyclic loads. The Kent-Park model is chosen to describe the compressive stress-strain relationship of concrete, and Kang-Lin model is used to describe the tensile curve, where ft is the tensile strength of concrete, and the ultimate tensile strain of concrete is 0.00093, shown in Figure 9.
4.2. Elements
The concrete uses a three-dimensional solid element with an eight-node reduced integral format (C3D8R), and the longitudinal reinforcement and the stirrup uses a three-dimensional linear rod element (T3D2). The bond spring unit is simulated by the Spring 2 unit, and the three-direction bond relation is considered.
4.3. Loading System
In the analysis, the bottom of the shear wall is fixed and the X, Y, and Z directions are constrained. A force load and a displacement load are applied at the top of the wall. The force load is the uniform vertical load whose value is 3.2 × 10⁶ N/m2. The displacement load is a lateral displacement load in the X direction.
4.4. Simulation Results
4.4.1. Strain Distribution
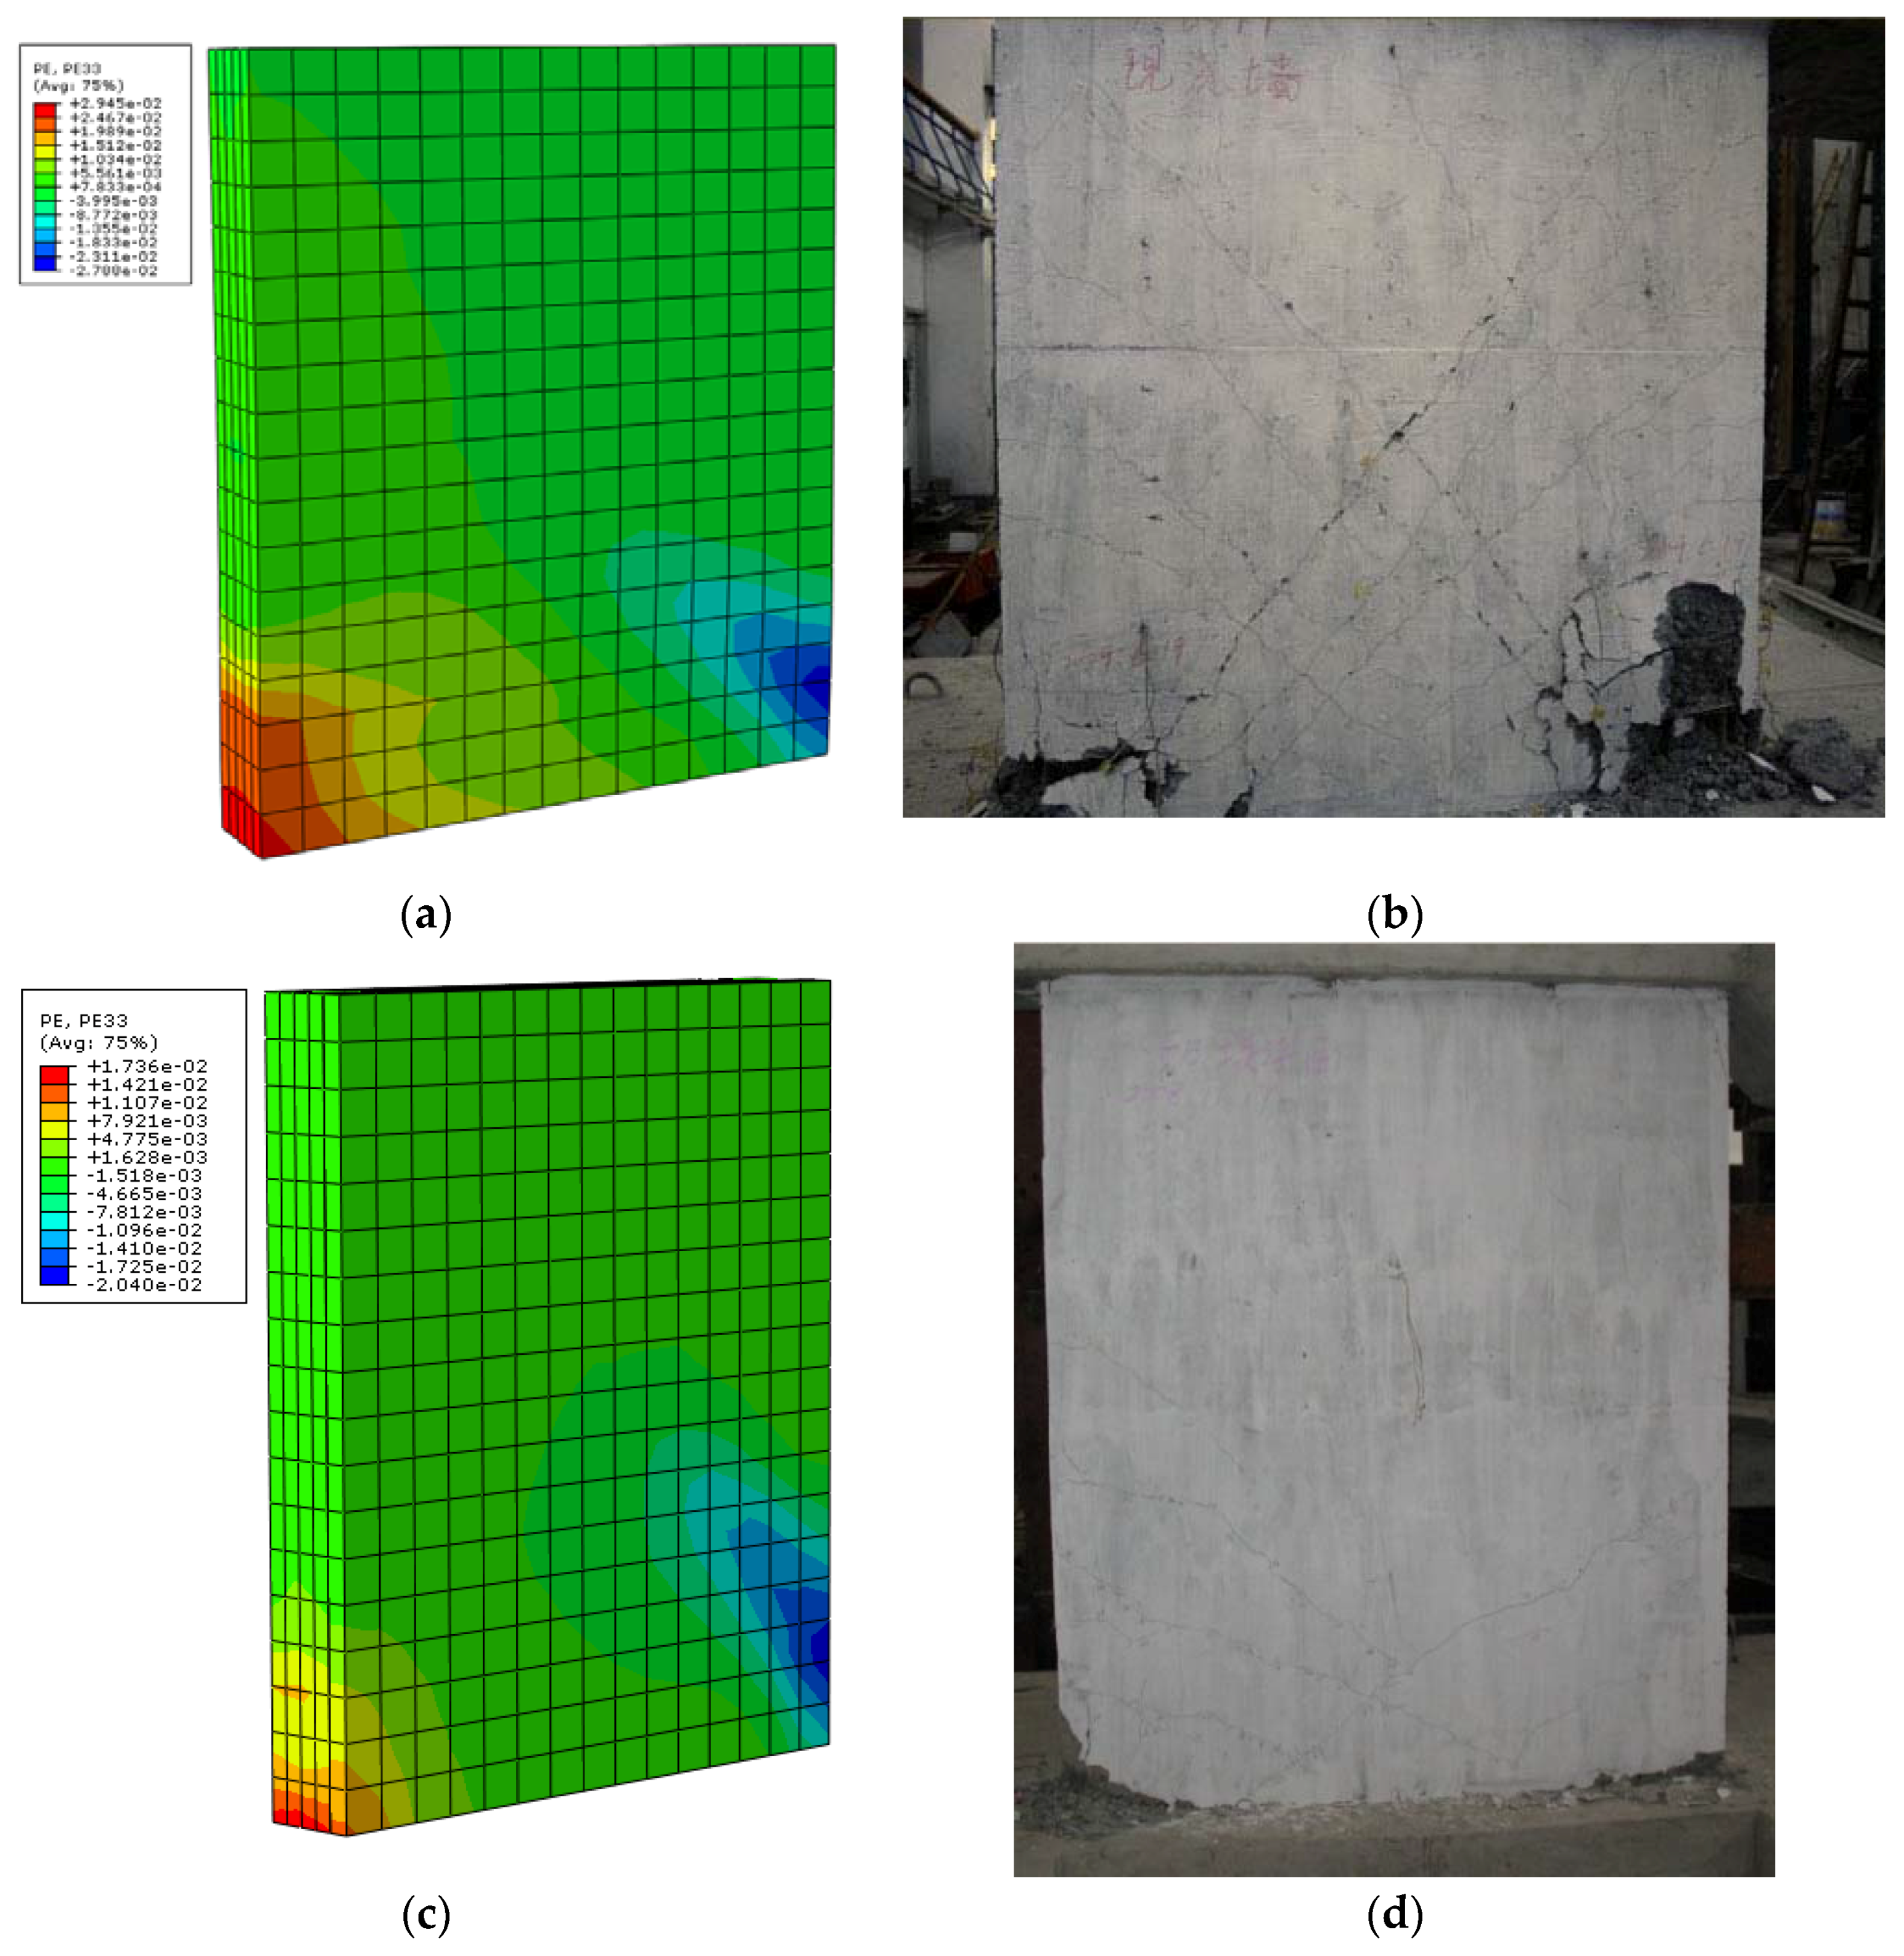
The strain distribution of the specimen under the action of vertical and lateral loads and the corresponding test situation are shown in Figure 10. It can be seen from the strain cloud diagram that the stress of the whole laminated shear wall is concentrated at the bottom of the wall. During the loading process, the strain on the tension side is large and gradually extends to the upper part. The strain distribution of the wall is consistent with that of the traditional cast-in-place shear wall. The strain on the tension and compression side of the laminated shear wall with a vertical seam is similar to that of the whole laminated shear wall. However, there is a sudden strain change in the vertical seam, and the strain will suddenly become smaller after going through the seam, approaching the tension side.
In the above analysis, the calculation results of the cast-in-place and laminated shear wall are similar to those of the actual test failure mode. In the experiment, the specimens are loaded repeatedly, while the numerical analysis is one-way loading. Consequently, destruction of the actual test is basically a symmetrical distribution. The test results and simulation results are almost the same if we only consider loading in one direction.
4.4.2. Displacement-Base Shear Curve
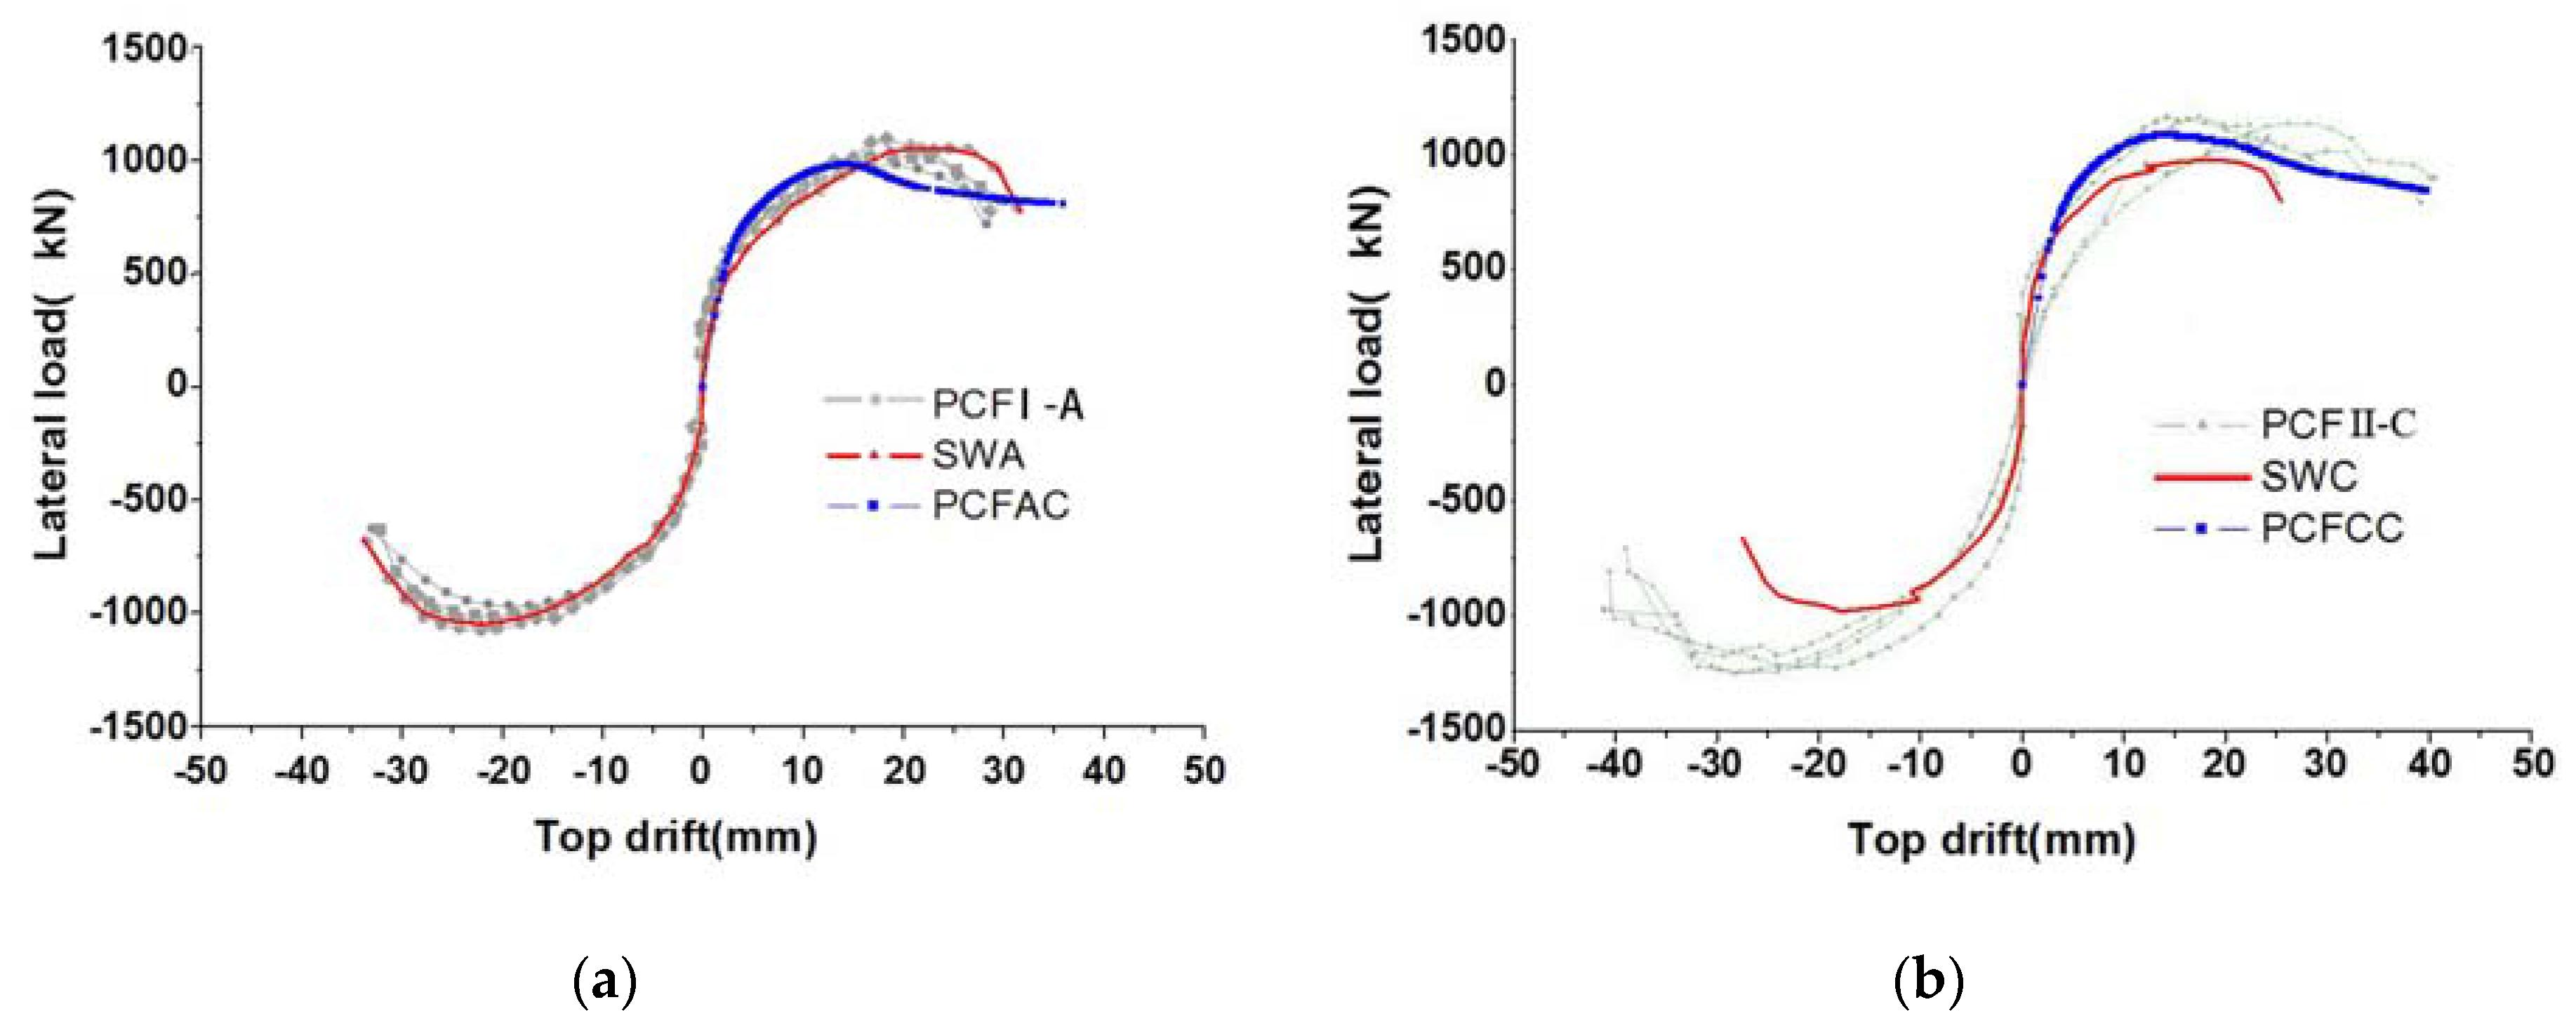
The PCFAs and PCFCs displacement-base shear curves obtained by ABAQUS analysis are shown in Figure 11. PCFI-A represents specimen PCFI-A1, PCFI-A2, and PCFI-A3; PCFII-C represents specimen PCFII-C1–PCFII-C4; SWA represents the whole cast-in-place specimen; SWC represents the cast-in-place specimen with a vertical seam; PCFAC and PCFCC represent the calculated whole laminated shear wall and seam wall. It is shown that the calculated PCF displacement-base shear curve is in good agreement with that obtained by the experiment, and is similar to that of the traditional cast-in-place shear wall specimen, indicating that the laminated shear wall has similar lateral resistance with the cast-in-place specimen.
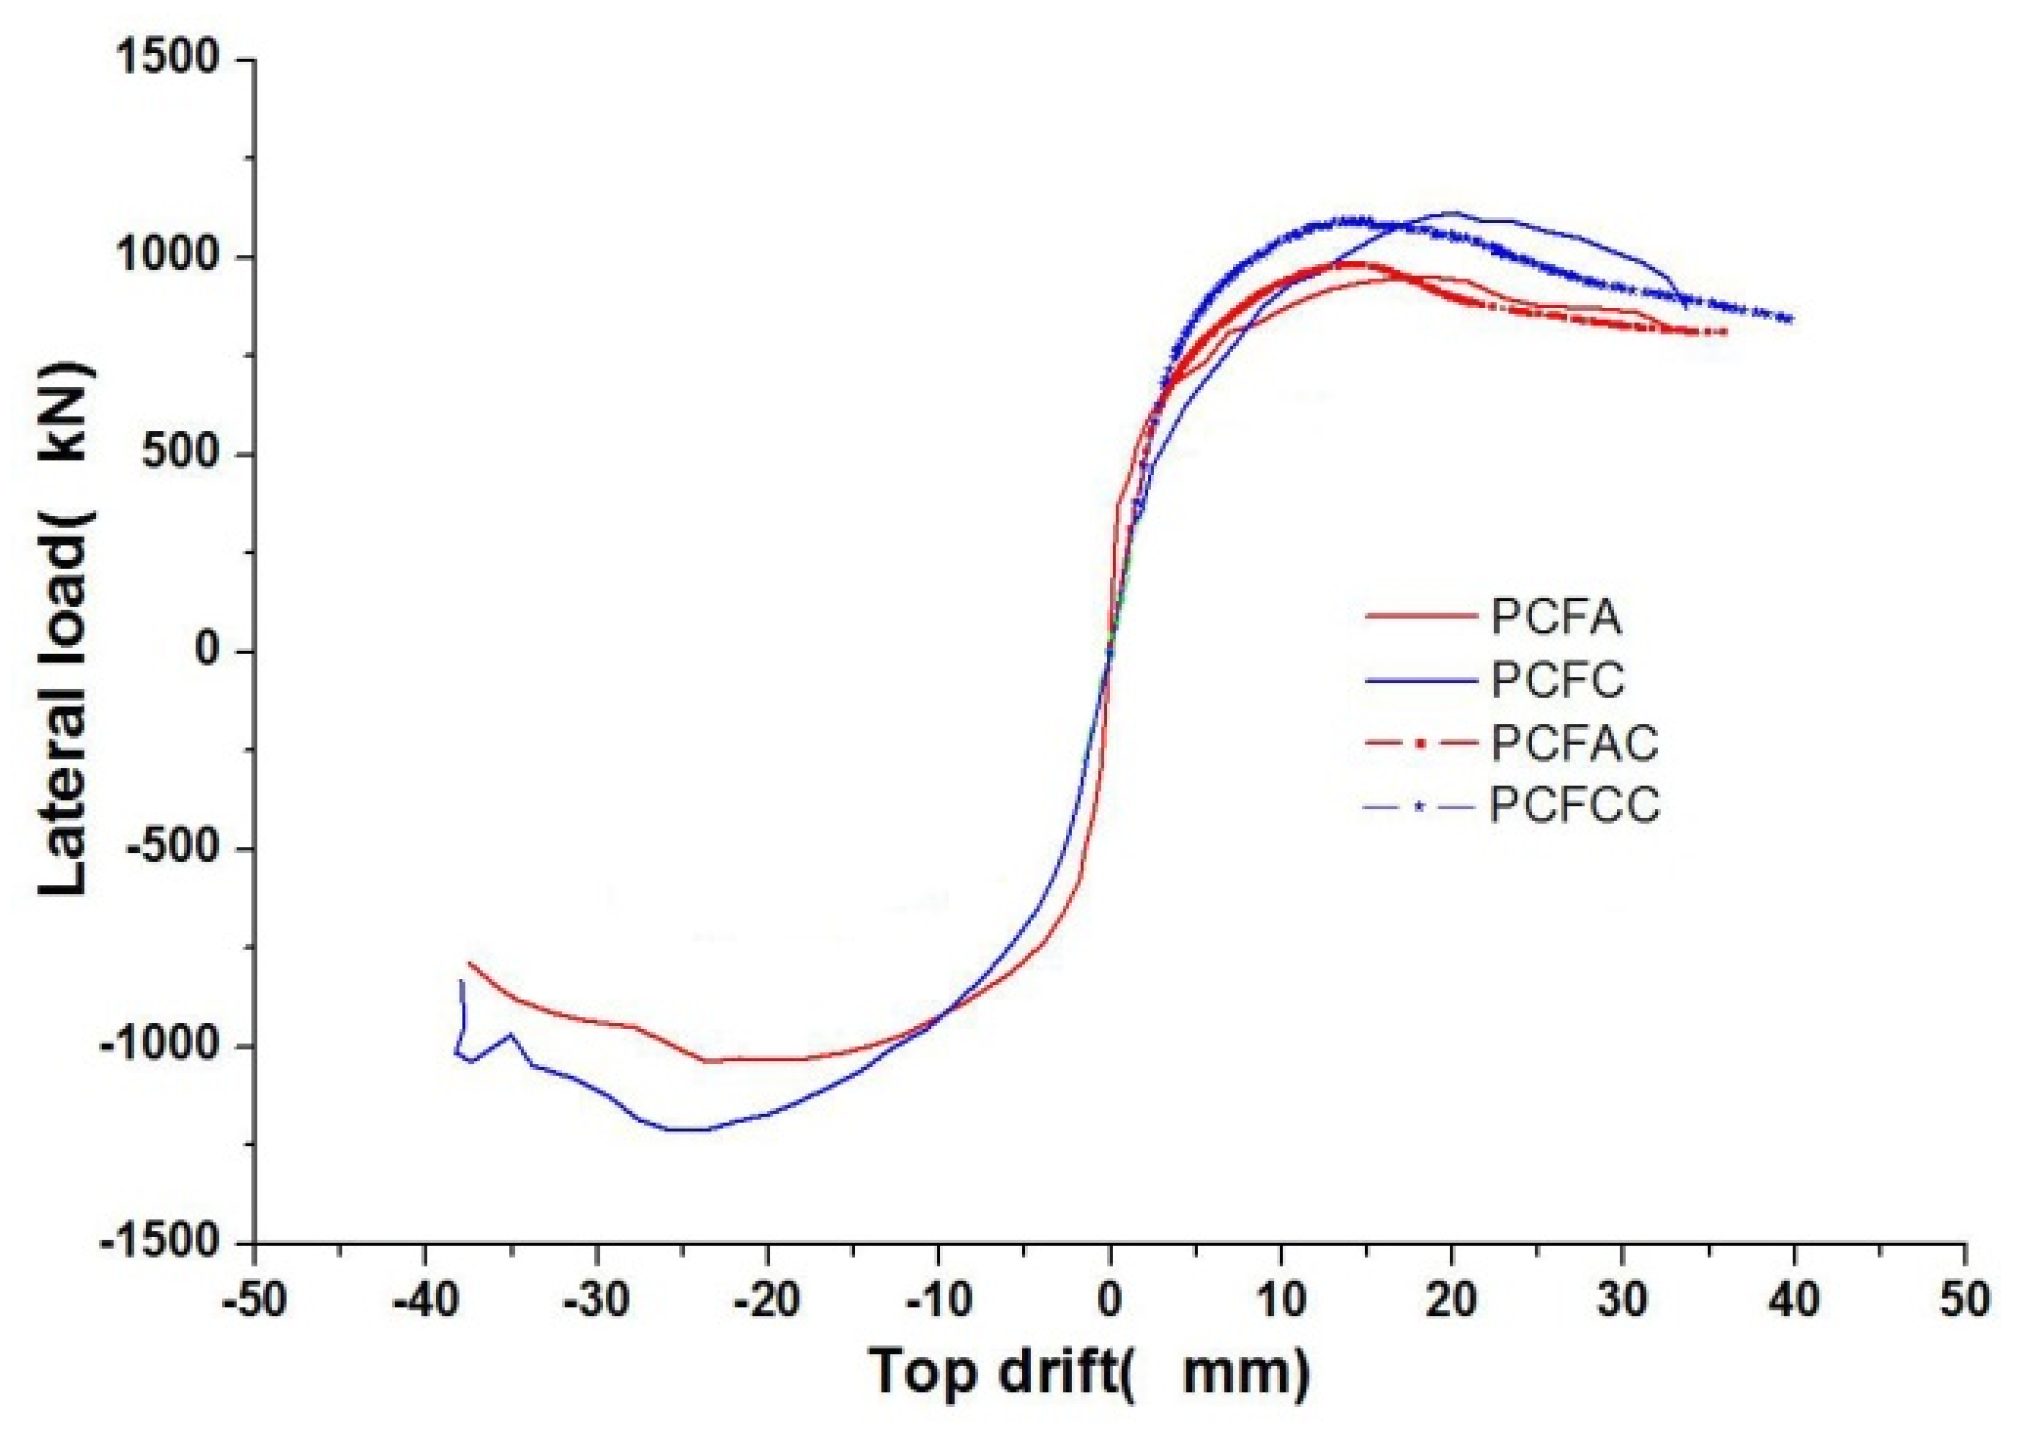
Figure 12 shows the average experimental results and the calculated results of specimens in the two groups. PCFA and PCFC represent the average result of whole wall and seam wall, respectively. It can be seen that the test and calculation results are basically consistent in the distribution of the curve. The seam wall has higher lateral resistance compared with the whole wall. As the vertical seam can consume part of the energy and increase the ductility of the wall, it can delay the destruction of the specimen and increase the lateral bearing capacity.
5. Conclusions
Through the experimental study and numerical simulation of laminated reinforced concrete shear walls, the following conclusions can be drawn:
- The failure mode, the hysteretic curve and the skeleton curve, the stiffness degradation law, the energy dissipation capacity and the bearing capacity of the laminated shear wall are similar to that of the cast-in-place shear wall, indicating that laminated walls have good seismic performance.
- The seam can effectively transfer the load when it is well-constructed, and whose performance is similar to the whole wall. At the same time, due to the greater deformation caused by the seam, the wall’s energy dissipation capacity is slightly better than the whole wall.
- Whether the napping treatment or sprayed surface retarder is applied on the surface between the prefabricated part and the cast-in-place part, the old and new concrete can connect with each other well, and work together with integrity.
- The two structural constructions of the concealed column and the shear wall have little effect on the seismic performance of the shear wall; hence, the appropriate method can be selected according to the actual construction needs.
- The finite element simulation of the laminated reinforced concrete shear wall is in good agreement with the experimental results. The stress cloud is consistent with the final failure phenomena in the experiments. The simulated displacement-the base shear curve is consistent with the experimental results.
In summary, the laminated concrete shear wall with a vertical seam is similar to the cast-in-place shear wall, and has good seismic performance. Using good construction technology and proper construction measures, the vertical seam can effectively transmit seismic forces. For economic consideration, it is recommended that napping treatment and structural construction in class II can be chosen in actual construction, which will, relatively, reduce workload and cost.
Acknowledgments
Financial support from the National Key Research and Development Program of China (2016YFC0701101) is highly appreciated. This work is also supported by the Fundamental Research Funds for the Central Government Supported Universities. The supports from Shanghai Science and Technology Committee, and Shanghai Vanke Real Estate Co. Ltd. are also appreciated.
Author Contributions
Jianbao Li conceived the experiments and wrote the paper; Yan Wang performed the experiments and analyzed the data; Zheng Lu proposed the method, conceived and designed the experiments, and revised the paper; and Junzuo Li helped to analyze the experimental data and revised the paper.
Conflicts of Interest
The authors declare no conflict of interest.
References
- Lu, Z.; Chen, X.Y.; Lu, X.L.; Yang, Z. Shaking table test and numerical simulation of an RC frame-core tube structure for earthquake-induced collapse. Earthq. Eng. Struct. Dyn. 2016, 45, 1537–1556. [Google Scholar] [CrossRef]
- Lu, X.; Liu, Z.; Lu, Z. Optimization design and experimental verification of track nonlinear energy sink for vibration control under seismic excitation. Struct. Control Health Monit. 2017. [Google Scholar] [CrossRef]
- Lu, Z.; He, X.D.; Zhou, Y. Studies on damping behavior of vertically mixed structures with upper steel and lower concrete substructures. Struct. Des. Tall Spec. Build. 2017. [Google Scholar] [CrossRef]
- Dai, K.; Wang, J.; Mao, R.; Lu, Z.; Chen, S.E. Experimental investigation on dynamic characterization and seismic control performance of a TLPD system. Struct. Des. Tall Spec. Build. 2017, 26, e1350. [Google Scholar] [CrossRef]
- Lu, Z.; Chen, X.Y.; Zhang, D.C.; Dai, K.S. Experimental and analytical study on the performance of particle tuned mass dampers under seismic excitation. Earthq. Eng. Struct. Dyn. 2016, 46, 697–714. [Google Scholar] [CrossRef]
- Liu, C.Q.; Wei, X.D.; Lu, Z.; Wu, H.D.; Yang, Y.L.; Chen, L.Y. Studies on passive flexible protection to resist landslides caused by the May 12 2008 Wenchuan earthquake. Struct. Des. Tall Spec. Build. 2017. [Google Scholar] [CrossRef]
- Lu, Z.; Lu, X.L.; Lu, W.S.; Masri, S.F. Shaking table test of the effects of multi-unit particle dampers attached to an MDOF system under earthquake excitation. Earthq. Eng. Struct. Dyn. 2012, 41, 987–1000. [Google Scholar] [CrossRef]
- Lu, Z.; Wang, D.C.; Masri, S.F.; Lu, X.L. An experimental study of vibration control of wind-excited high-rise buildings using particle tuned mass dampers. Smart Struct. Syst. 2016, 18, 93–115. [Google Scholar] [CrossRef]
- Lu, Z.; Lu, X.L.; Jiang, H.J.; Masri, S.F. Discrete element method simulation and experimental validation of particle damper system. Eng. Comput. 2014, 31, 810–823. [Google Scholar] [CrossRef]
- Lu, Z.; Wang, Z.X.; Masri, S.F.; Lu, X.L. Particle Impact Dampers: Past, Present, and Future. Struct. Control Health Monit. 2017. [Google Scholar] [CrossRef]
- Lu, Z.; Chen, X.Y.; Li, X.W.; Li, P.Z. Optimization and application of multiple tuned mass dampers in the vibration control of pedestrian bridges. Struct. Eng. Mech. 2017, 62, 55–64. [Google Scholar]
- Lu, Z.; Wang, D.C.; Zhou, Y. Experimental parametric study on wind-induced vibration control of particle tuned mass damper on a benchmark high-rise building. Struct. Des. Tall Spec. Build. 2017. [Google Scholar] [CrossRef]
- Lu, Z.; Yang, Y.L.; Lu, X.L.; Liu, C.Q. Preliminary study on the damping effect of a lateral damping buffer under a debris flow load. Appl. Sci. 2017, 7, 201. [Google Scholar] [CrossRef]
- Lu, Z.; Lu, X.L.; Masri, S.F. Studies of the performance of particle dampers under dynamic loads. J. Sound Vib. 2010, 26, 5415–5433. [Google Scholar] [CrossRef]
- Lu, Z.; Masri, S.F.; Lu, X.L. Studies of the performance of particle dampers attached to a two-degree-of-freedom system under random excitation. J. Vib. Control 2011, 10, 1454–1471. [Google Scholar]
- Lu, Z.; Lu, X.L.; Lu, W.S.; Masri, S.F. Experimental studies of the effects of buffered particle dampers attached to a multi-degree-of-freedom system under dynamic loads. J. Sound Vib. 2012, 9, 2007–2022. [Google Scholar] [CrossRef]
- Lu, Z.; Masri, S.F.; Lu, X.L. Parametric studies of the performance of particle dampers under harmonic excitation. Struct. Control Health Monit. 2011, 2, 79–98. [Google Scholar] [CrossRef]
- Foti, D.; Diaferio, M.; Nobile, R. Optimal Design of a New Seismic Passive Protection Device Made in Aluminium and Steel. Int. J. Struct. Eng. Mech. 2010, 35, 119–122. [Google Scholar] [CrossRef]
- Foti, D.; Diaferio, M.; Nobile, R. Dynamic Behavior of New Aluminum-Steel Energy Dissipating Devices. Struct. Control Health Monit. 2013, 20, 1106–1119. [Google Scholar] [CrossRef]
- Oliva, M.G.; Clough, R.W. Shaking Table Tests of Large-Panel Precast Concrete Building System Assemblages; Earthquake Engineering Research Center, University of California: Berkeley, CA, USA, 1985. [Google Scholar]
- Soudki, K.A.; West, J.S.; Rizkalla, S.H.; Blackett, B. Horizontal connections for precast concrete shear wall panels under cyclic shear loading. PCI J. 1996, 41, 64–80. [Google Scholar] [CrossRef]
- Chakrabarti, S.C.; Nayak, G.C.; Paul, D.K. Shear characteristics of cast-in-place vertical joints in story-high precast wall assembly. ACI Struct. J. 1988, 85, 30–45. [Google Scholar]
- Pekau, O.A.; Hum, D. Seismic response of friction jointed precast panel shear Walls. PCI J. 1991, 36, 56–71. [Google Scholar] [CrossRef]
- Hutchinson, R.; Rizkalla, S.; Lau, M.; Huevel, J.S. Horizontal Post-Tensioned Connections for Precast Concrete Load bearing Shear Wall Panels. PCI J. 1991, 36, 64–76. [Google Scholar] [CrossRef]
- Kurama, Y.; Sause, R.; Pessiki, S.; Lu, L.W. Lateral load behavior and seismic design of unbonded post-tensioned precast concrete walls. ACI Struct. J. 1999, 96, 622–633. [Google Scholar]
- Kurama, Y.C. Seismic design of unbonded post tensioned precast concrete walls with supplemental viscous damping. ACI Struct. J. 2000, 97, 648–658. [Google Scholar]
- Rodriguez, M.; Restrepo, J.; BlandóN, J.J. Seismic Design Forces for Rigid Floor Diaphragms in Precast Concrete Building Structures. J. Struct. Eng. 2007, 133, 1604–1615. [Google Scholar] [CrossRef]
- Holden, T.; Restrepo, J.; Mander, J.B. Seismic performance of precast reinforced and prestressed concrete walls. J. Struct. Eng. 2003, 129, 286–296. [Google Scholar] [CrossRef]
- Lu, Z.; Wang, Z.X.; Li, J.B.; Huang, B. Studies on seismic performance of precast concrete columns with grouted splice sleeve. Appl. Sci. 2017, 7, 571. [Google Scholar] [CrossRef]
- Palermo, M.; Trombetti, T. Experimentally-validated modelling of thin RC sandwich walls subjected to seismic loads. Eng. Struct. 2016, 119, 95–109. [Google Scholar] [CrossRef]
- Ricci, I.; Palermo, M.; Gasparini, G.; Silvestri, S.; Trombetti, T. Results of pseudo-static tests with cyclic horizontal load on cast in situ sandwich squat concrete walls. Eng. Struct. 2013, 54, 131–149. [Google Scholar] [CrossRef]
- Palermo, M.; Ricci, I.; Silvestri, S.; Gasparini, G.; Trombetti, T.; Foti, D.; Ivorra, S. Preliminary interpretation of shaking-table response of a full-scale 3-storey building composed of thin reinforced concrete sandwich walls. Eng. Struct. 2014, 76, 75–89. [Google Scholar] [CrossRef]
- Ivorra, S.; Foti, D.; Ricci, I.; Gasparini, G.; Silvestri, S.; Trombetti, T. Shaking table test design to evaluate earthquake capacity of a 3-storey building specimen composed of cast-in-situ concrete walls. Geotech. Geol. Earthq. Eng. 2015, 35, 345–358. [Google Scholar]
- Gasparini, G.; Trombetti, T.; Silvestri, S.; Ricci, I.; Ivorra, C.S.; Foti, D. Preliminary Results of a Shaking Table Tests on a 3-Storey Building Realized With Cast in Place Sandwich Squat Concrete Walls. In Proceedings of the Conference New Developments in Structural Engineering and Construction (ISEC7), Honolulu, HI, USA, 18–23 June 2013; Yazdani, S., Singh, A., Eds.; Research Publishing Services: Singapore, 2013. [Google Scholar]
- Ricci, I.; Palermo, M.; Silvestri, S.; Gasparini, G.; Trombetti, T.; Foti, D.; Ivorra, C.S. Shake table response of a full-scale 3-storey building composed of thin reinforced concrete sandwich walls. In Proceedings of the AES-RSESS’2013 First International Conference on Reliability and Safety of Engineering Systems and Structures, Vancouver, BC, Canada, 12–16 August 2013; pp. 29–41. [Google Scholar]
- Chong, X.; Ye, X.G.; Wang, D.C.; Lian, X. Seismic response of superposed wall panel with different edge components. Adv. Mater. Res. 2011, 163, 1074–1079. [Google Scholar] [CrossRef]
- Chong, X.; Huang, J.Q.; Ye, X.G. Numerical analysis on nonlinear behavior of the superimposed wall under quasi-static reversed cyclic loading. In Proceedings of International Conference on Sustainable Development of Critical Infrastructure, Shanghai, China, 16–18 May 2014. pp. 238–246.
- Chong, X.; Xie, L.; Ye, X.; Jiang, Q.; Wang, D.C. Experimental study and numerical model calibration of full-scale superimposed reinforced concrete walls with I-shaped cross sections. Adv. Struct. Eng. 2016, 19, 1902–1916. [Google Scholar] [CrossRef]
- Xiao, Q.D.; Guo, Z.X.; Zhang, Z.Y. Behavior of double-wall precast concrete shear wall under low-cyclic reversed loading test. Adv. Mater. Res. 2015, 1079, 354–358. [Google Scholar] [CrossRef]
- Shen, X.; Wei, M.A.; Chen, X.; Zhang, W.; Wang, R.; Wang, J.G. Experimental Study on the Seismic Performance of the Vertical Joint Seam of Superimposed Concrete Wall Panels. J. Hefei Univ. Technol. 2010, 33, 1366–1371. (In Chinese) [Google Scholar]
- Zhang, H.; Lu, X.; Li, J.; Liang, L. Cyclic load experiment study on the laminated composite RC walls with different concrete ages. Struct. Eng. Mech. 2010, 36, 745–758. [Google Scholar] [CrossRef]
- Zhang, H.M.; Lu, X.L.; Duan, Y.F.; Li, J.B. Experimental Study and Numerical Simulation of Partially Prefabricated Laminated Composite RC Walls. Adv. Struct. Eng. 2011, 14, 967–980. [Google Scholar] [CrossRef]
- Ministry of Construction of the People’s Republic of China. The Code for Design of Concrete Structures (GB50010-2002); China Architecture & Building Press: Beijing, China, 2002. (In Chinese)
- Lu, X.L.; Jiang, H.J. Hysteretic analysis of a new type of energy dissipation shear walls. Earthq. Eng. Eng. Vib. 2000, 1, 17. [Google Scholar]
Figure 1.
Drawing of the laminated reinforced concrete shear wall: (a) frontal view of specimen PCF-A (including type I and II); (b) frontal view of specimen PCF-C (including type I and II); (c) reinforcement drawing of PCFI-A; (d) reinforcement drawing of PCFII-A; (e) reinforcement drawing of PCFI-C; and (f) reinforcement drawing of PCFII-C. Note: PCF-A and PCF-C are specimen numbers whose details are listed in Table 1.
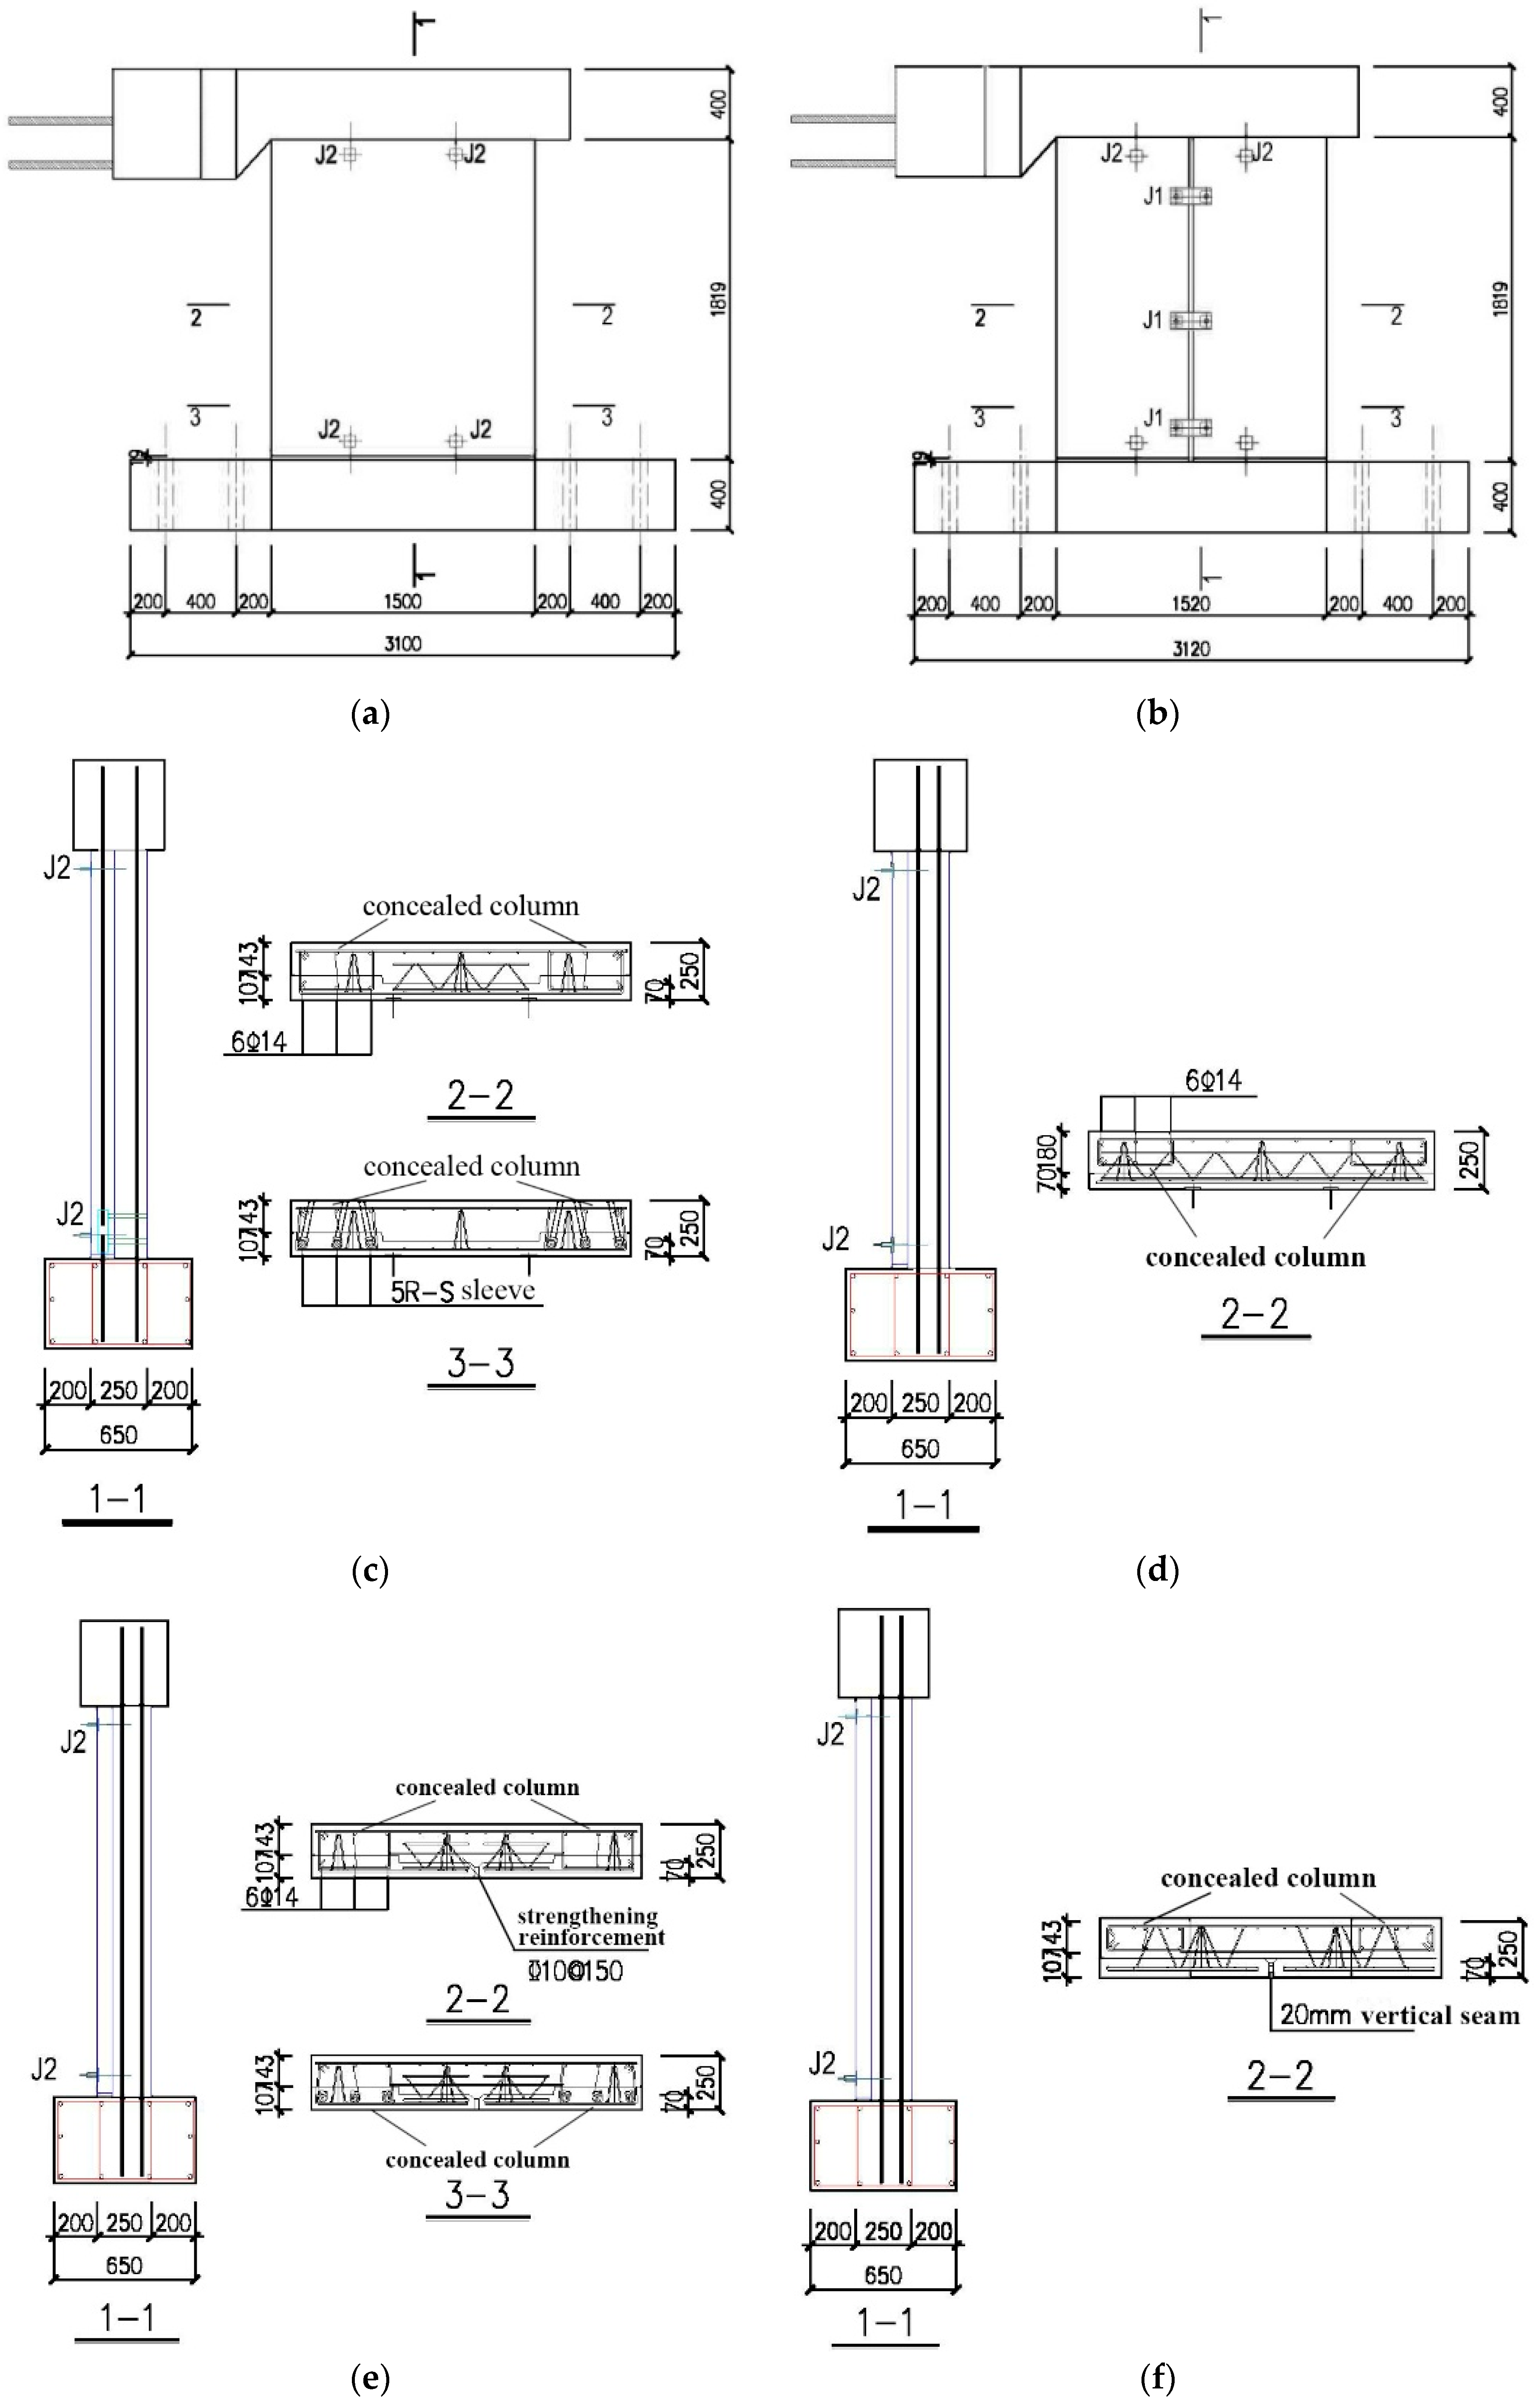
Figure 2.
Sensor placement: (a) displacement meters of PCF-A; (b) displacement meters of PCF-C; (c) strain gauges of PCFI-A; (d) strain gauges of PCFII-A; (e) strain gauges of PCFI-C; and (f) strain gauges of PCFII-C.
Figure 2.
Sensor placement: (a) displacement meters of PCF-A; (b) displacement meters of PCF-C; (c) strain gauges of PCFI-A; (d) strain gauges of PCFII-A; (e) strain gauges of PCFI-C; and (f) strain gauges of PCFII-C.
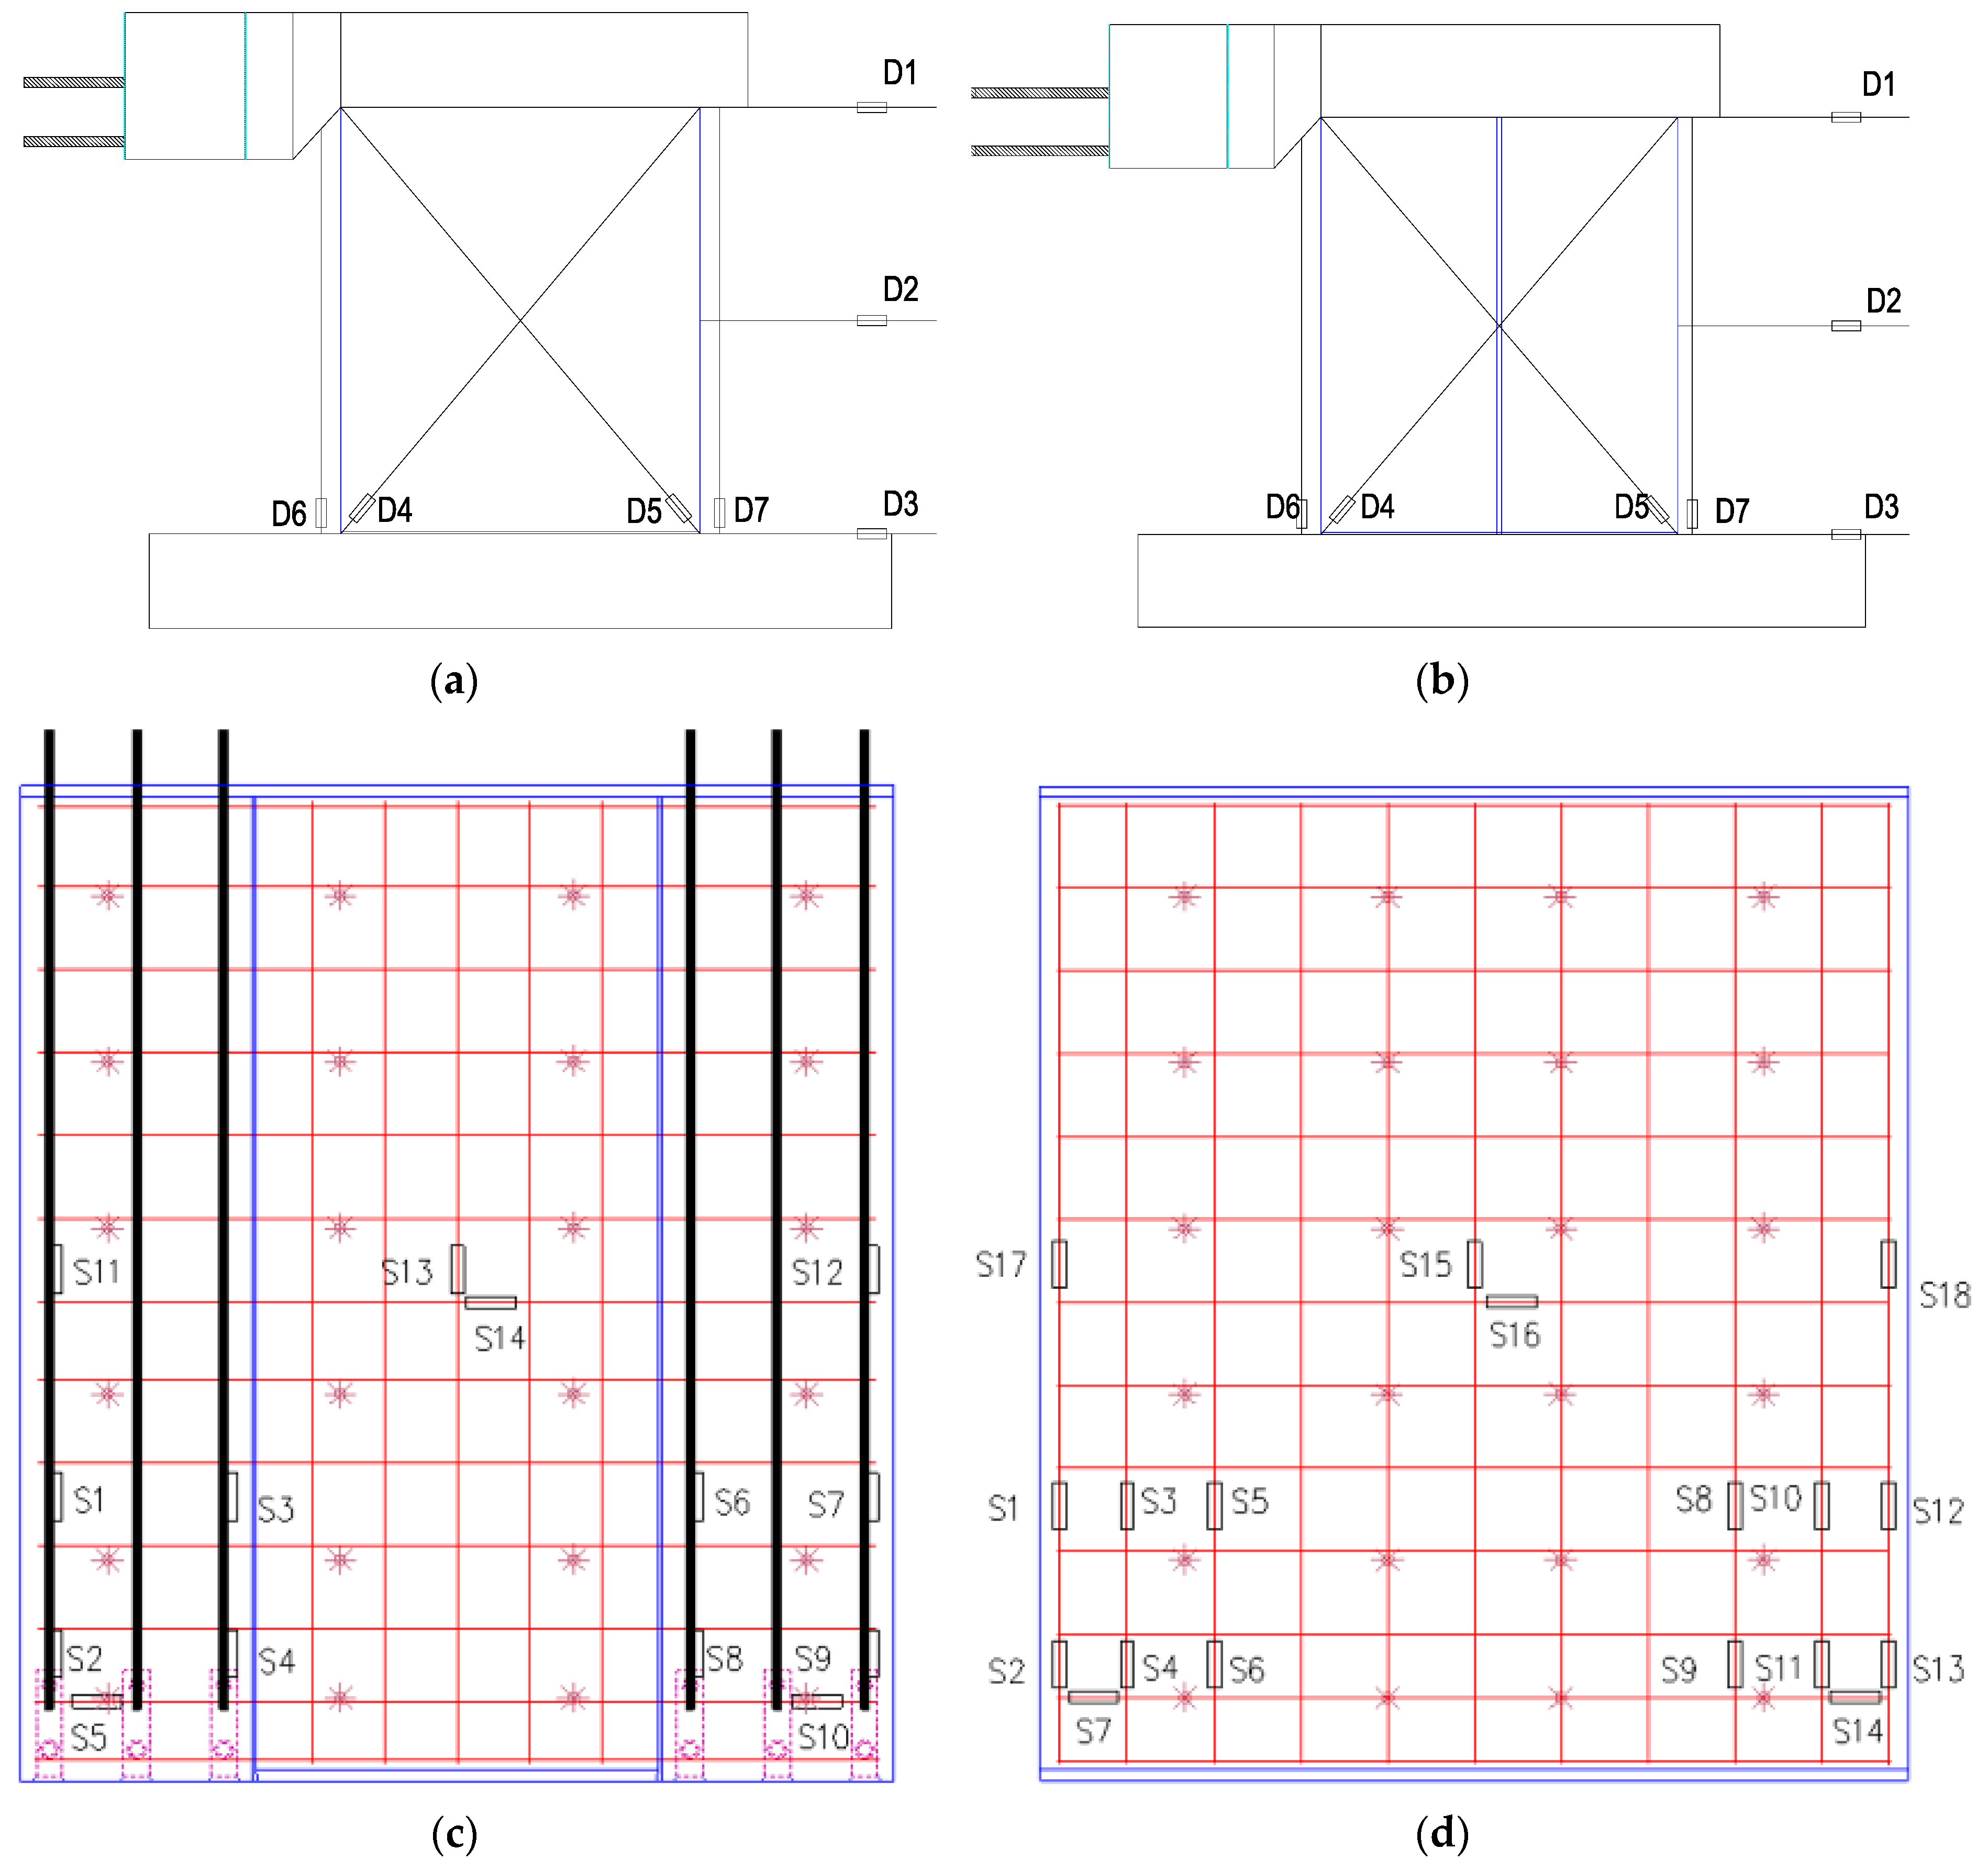
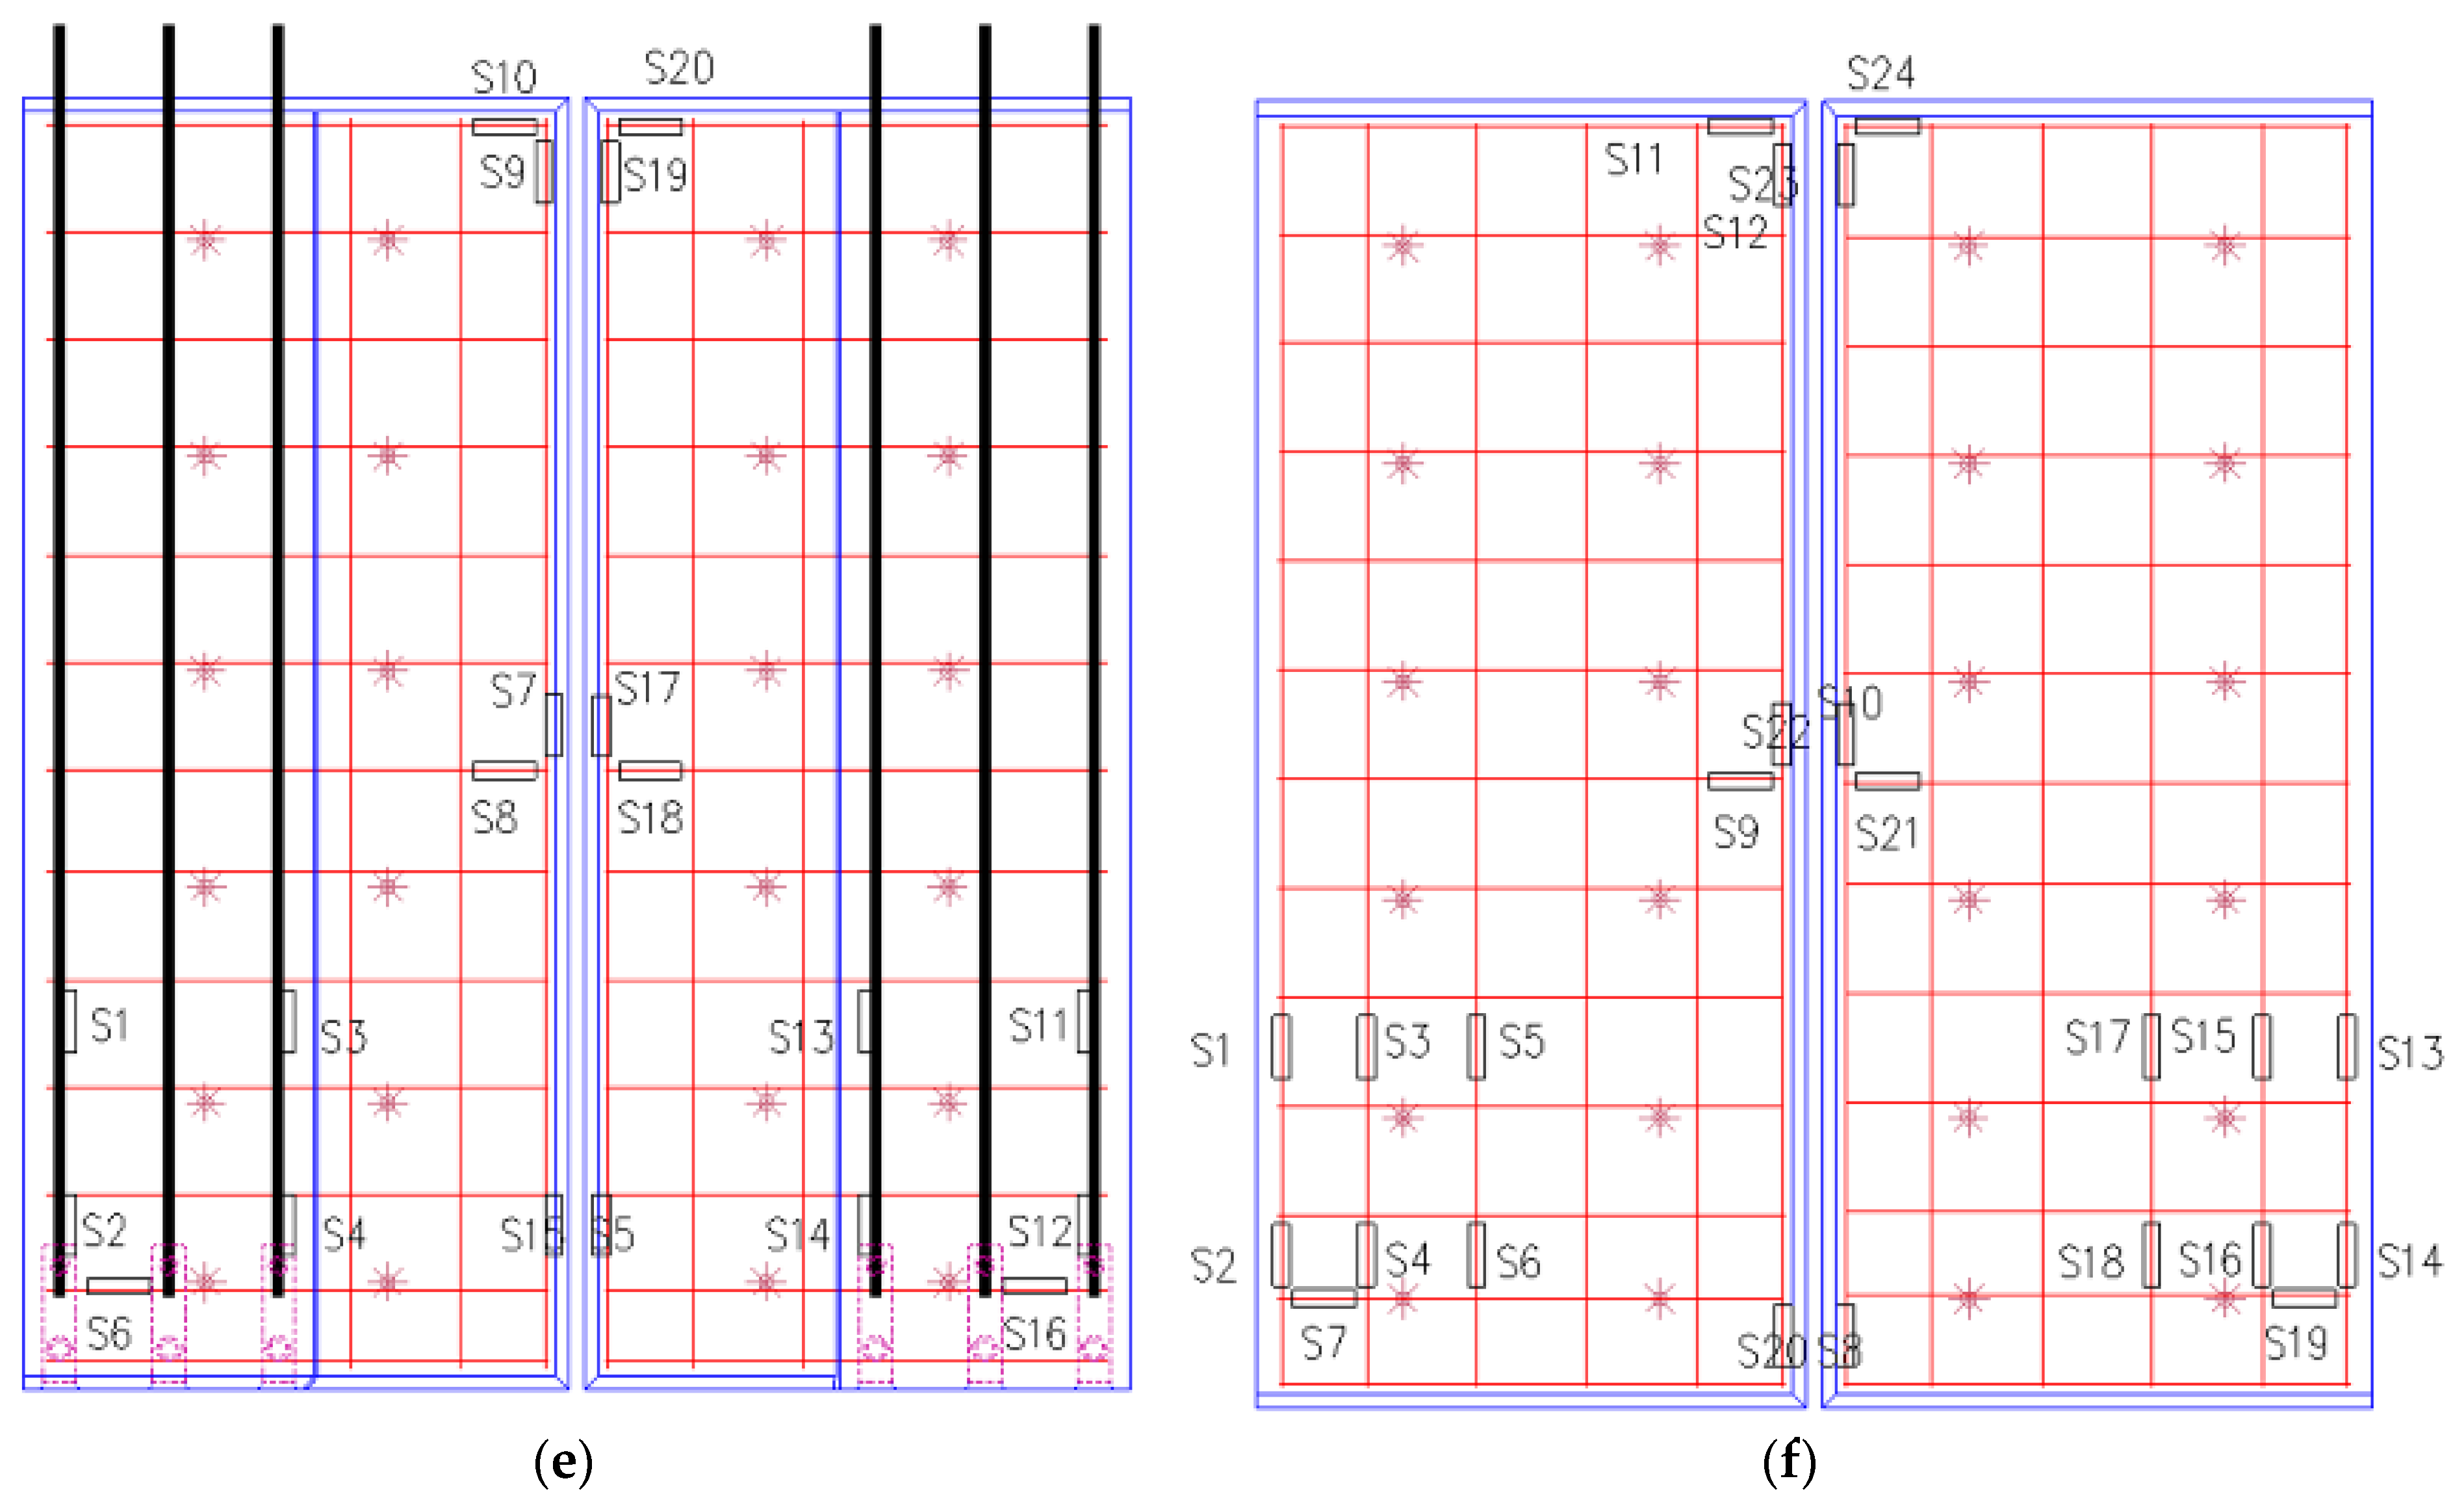
Figure 3.
Fabrication of the laminated reinforced concrete wall: (a) fabrication of the prefabricated part; (b) fabrication of the cast-in-place part; and (c) the connector between the bottom beam and the specimen.
Figure 3.
Fabrication of the laminated reinforced concrete wall: (a) fabrication of the prefabricated part; (b) fabrication of the cast-in-place part; and (c) the connector between the bottom beam and the specimen.

Figure 4.
Test loading: (a) test setup; and (b) load process. Note: N is recycling times, and Δ is displacement increment.
Figure 4.
Test loading: (a) test setup; and (b) load process. Note: N is recycling times, and Δ is displacement increment.

Figure 5.
Hysteretic curves (a–f) and standardized skeleton curves (g–i).
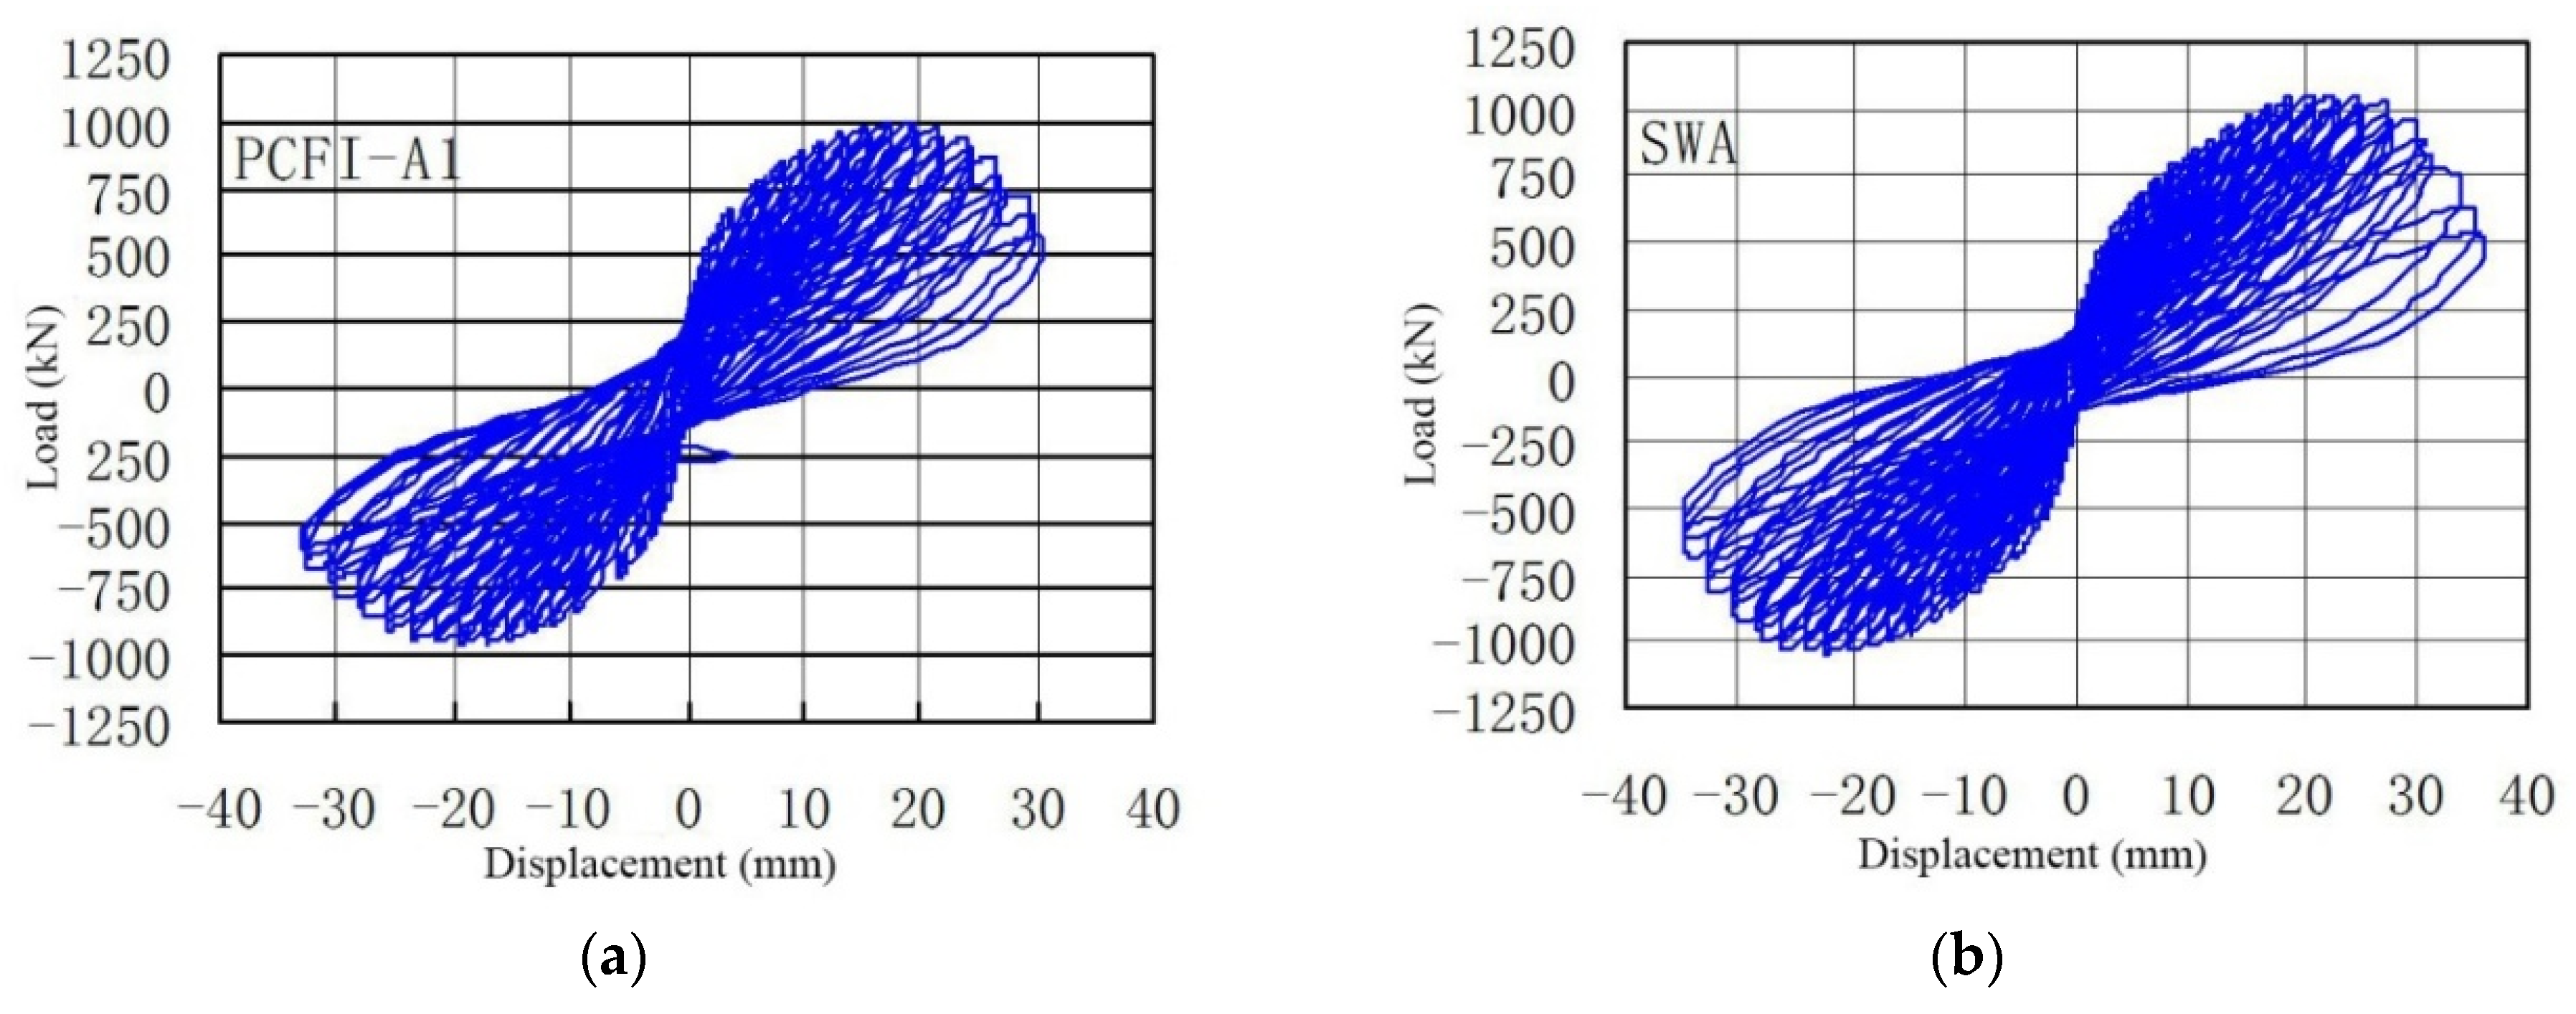

Figure 6.
The calculation diagram of equivalent viscous damping coefficient.

Figure 7.
Stiffness degradation curves: (a) PCFI-A; (b) PCFI-C; and (c) PCFII-C.

Figure 8.
Constitutive model of the reinforcement.
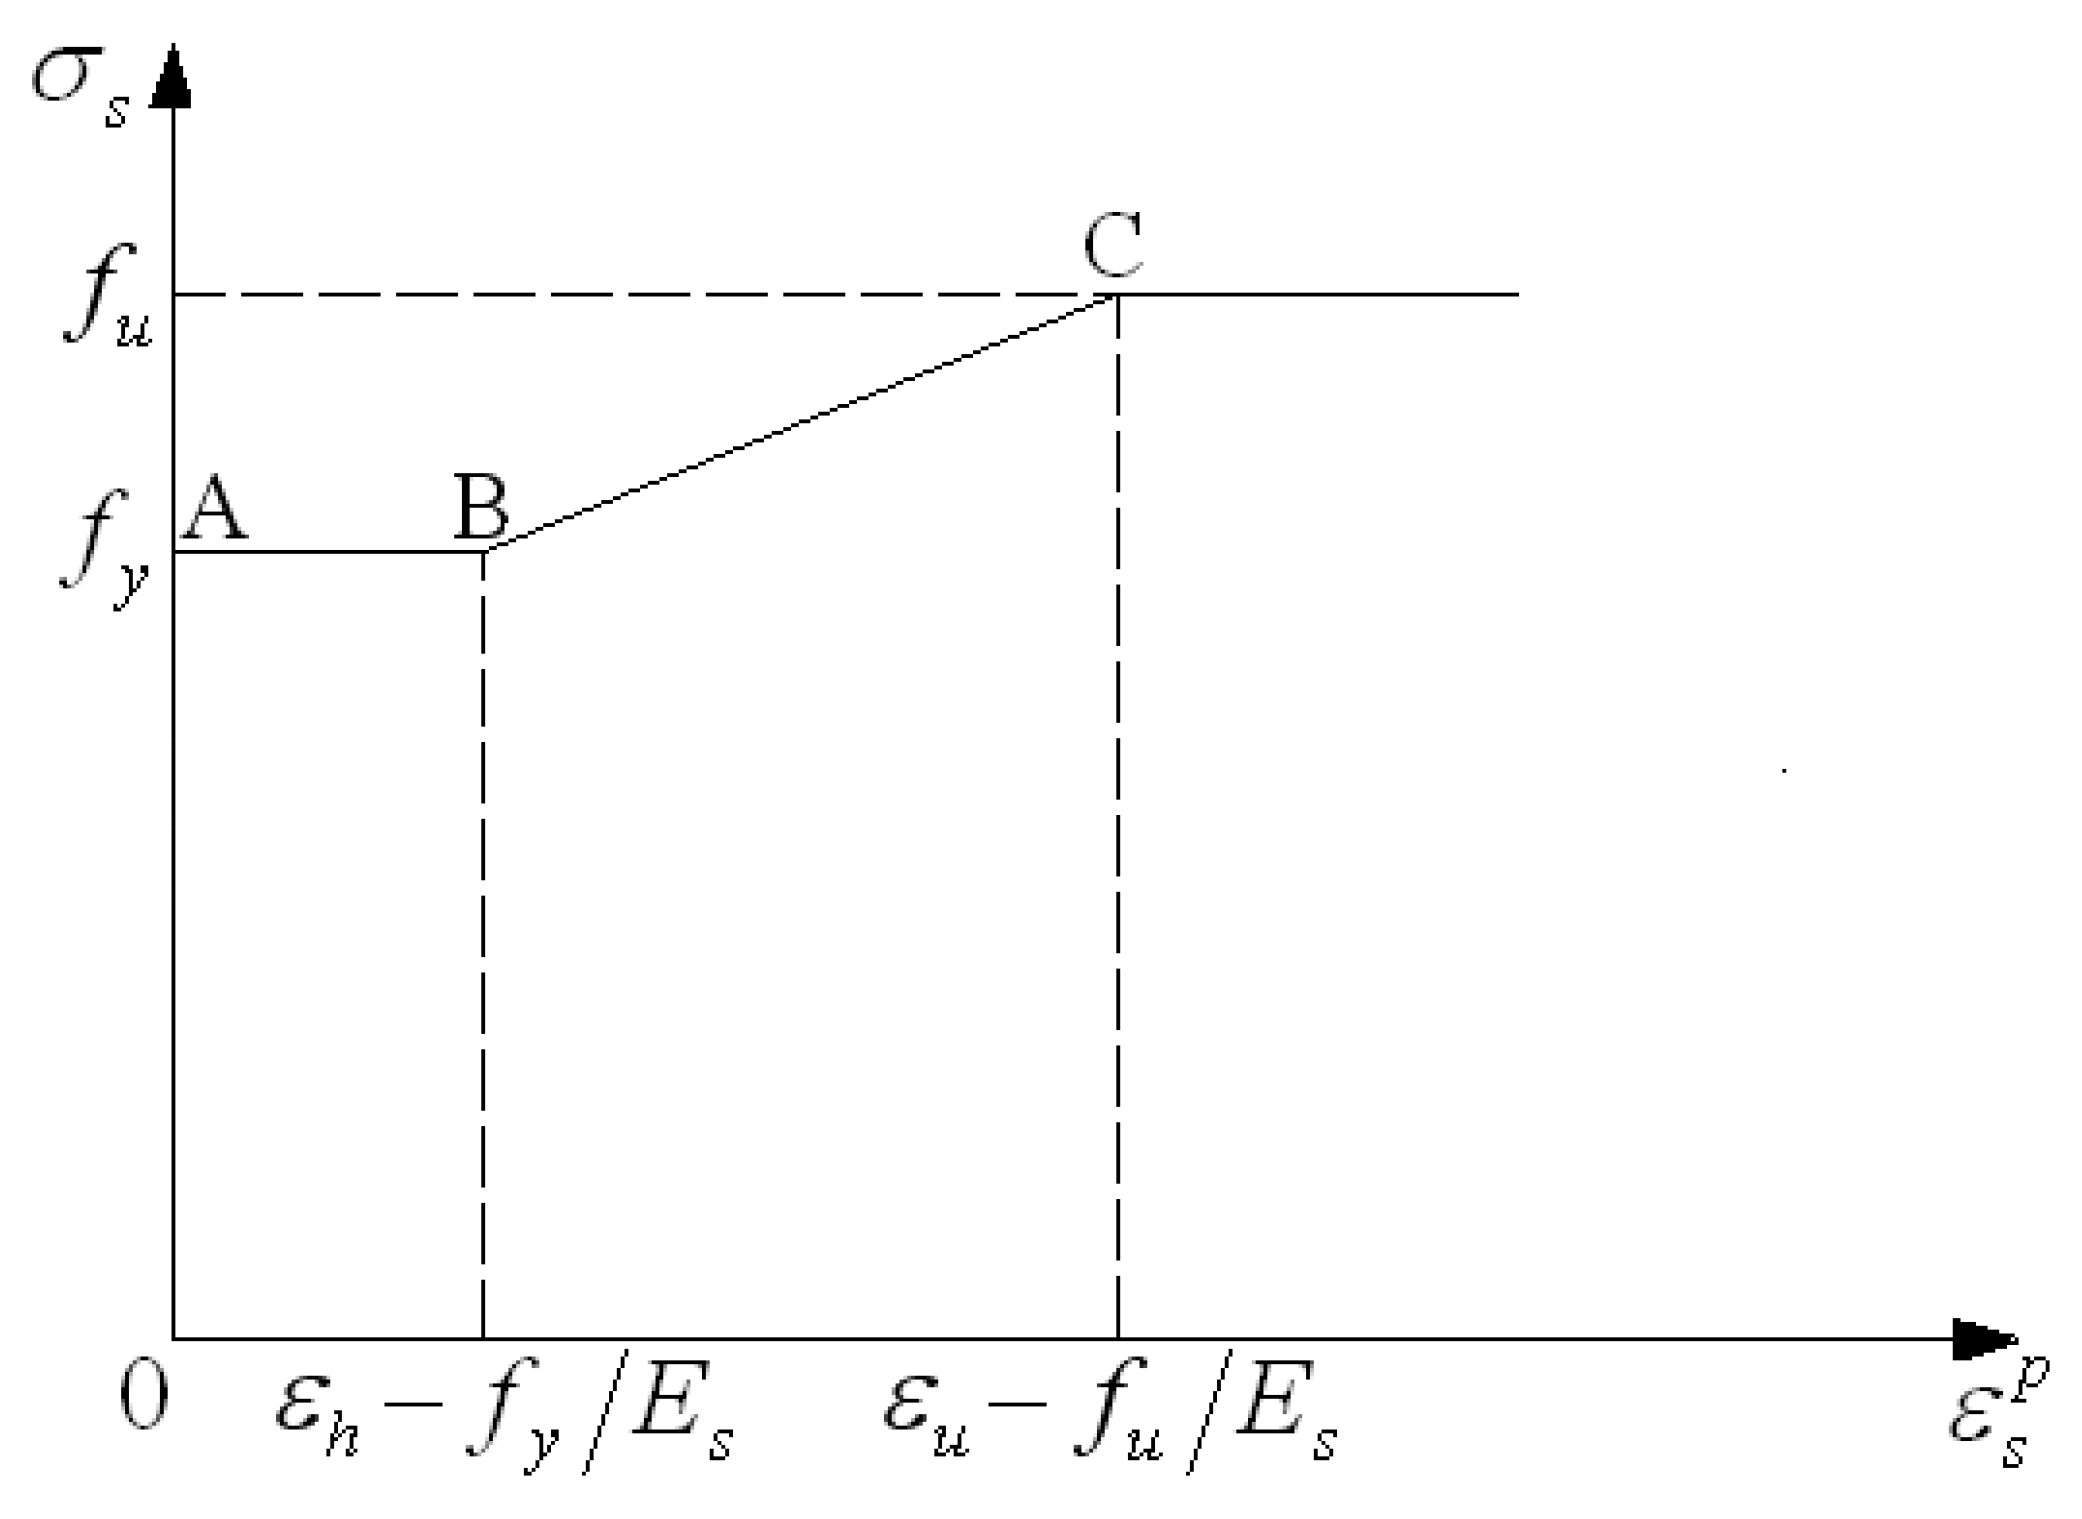
Figure 9.
Stress-Strain relationship of concrete under uniaxial tension: (a) the stress-strain relationship; and (b) the stress-plastic strain relationship.
Figure 9.
Stress-Strain relationship of concrete under uniaxial tension: (a) the stress-strain relationship; and (b) the stress-plastic strain relationship.
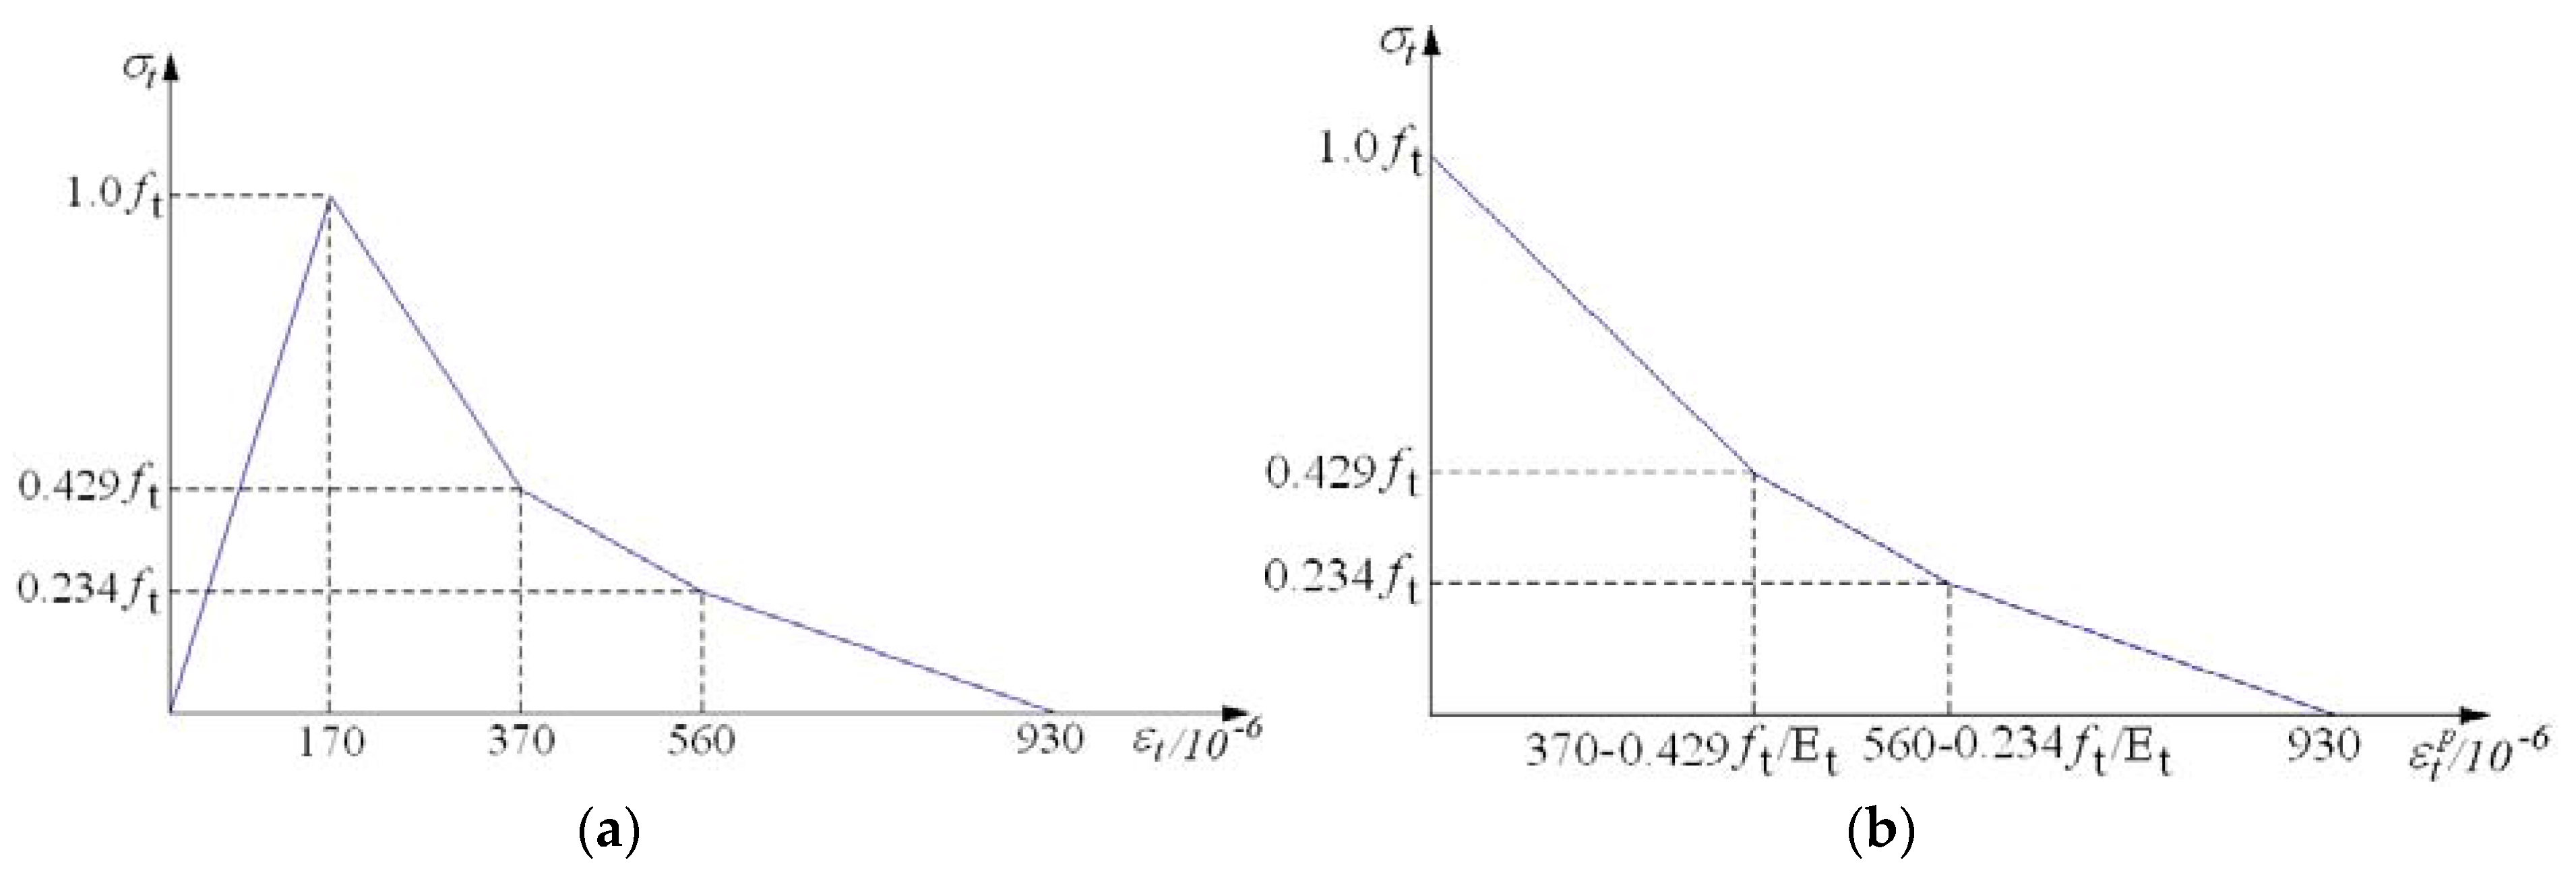
Figure 10.
Strain distribution and crack profile: (a) the strain distribution of the cast-in-place wall; (b) the crack profile of the cast-in-place wall; (c) the strain distribution of the whole wall; (d) the crack profile of the whole wall; (e) the strain distribution of the seam wall; and (f) the crack profile of the seam wall.

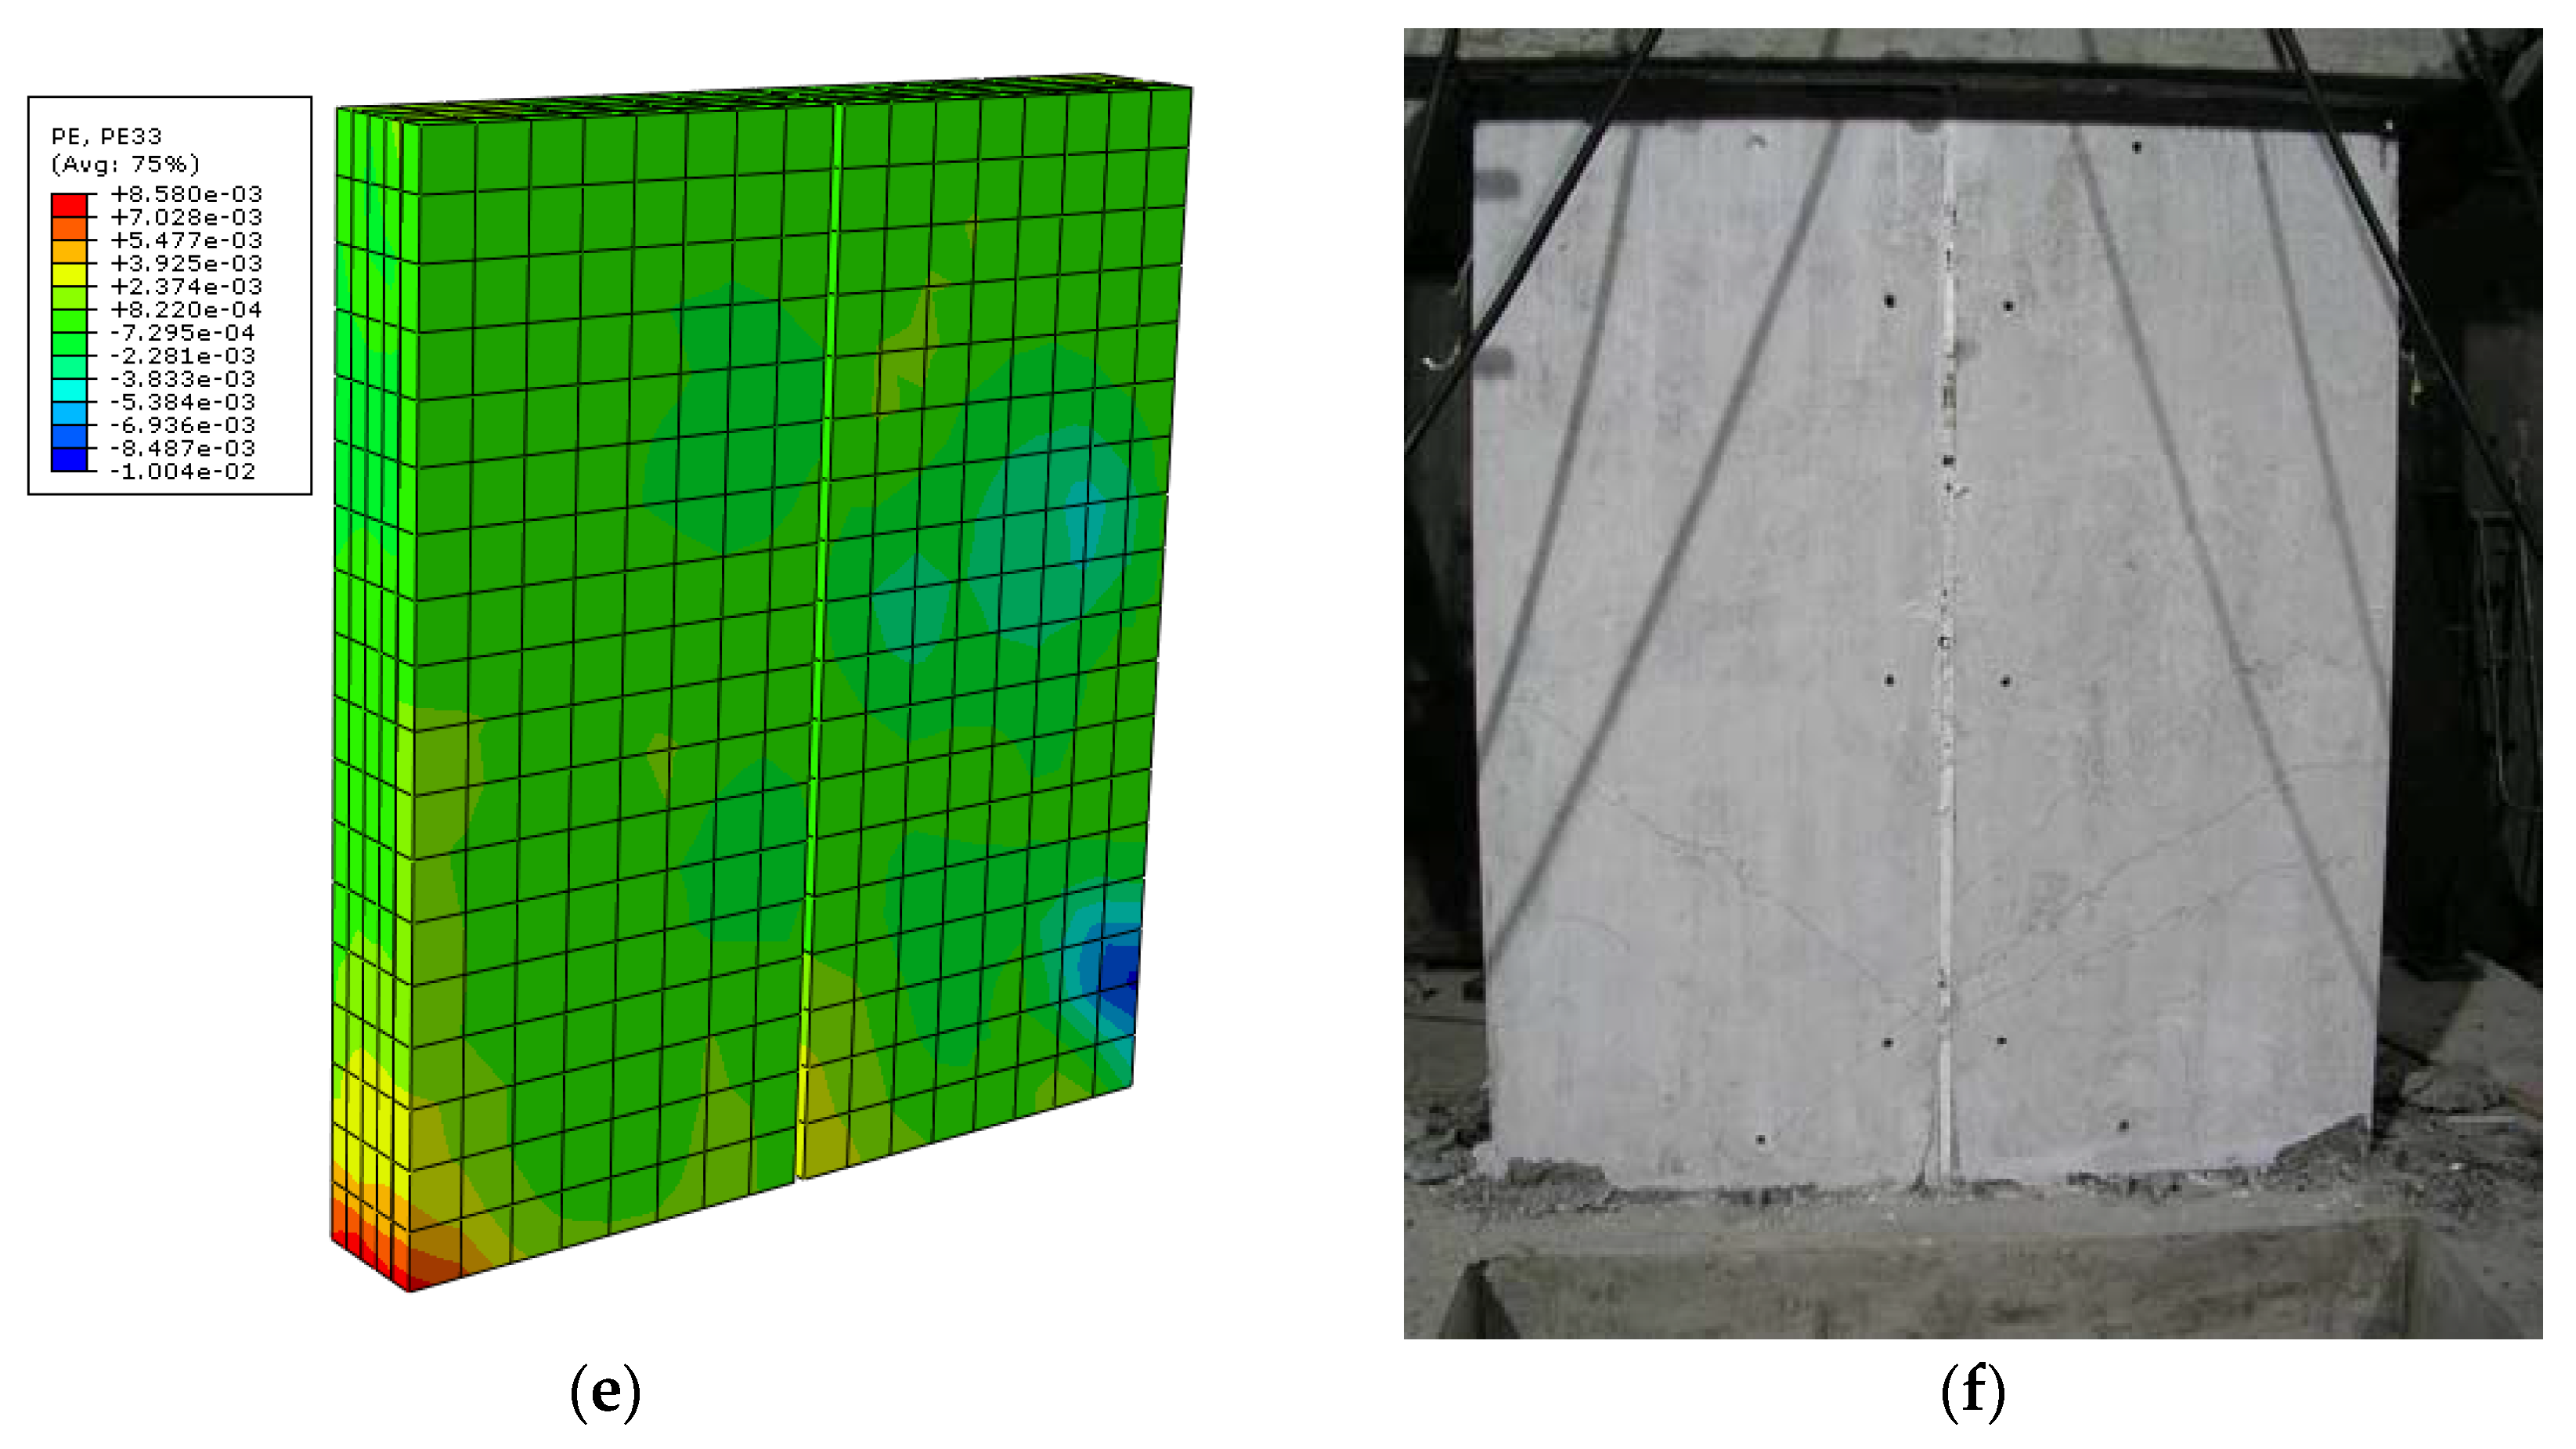
Figure 11.
Displacement-base shear curve: (a) the whole laminated shear wall; and (b) the laminated shear wall with a vertical seam.
Figure 11.
Displacement-base shear curve: (a) the whole laminated shear wall; and (b) the laminated shear wall with a vertical seam.

Figure 12.
Average experimental results and the calculated results of specimens in the two groups.


Table 1.
Parameters of all the walls.
| Type | Number | Thickness | Size of the Concealed Column | Interface Processing |
|---|---|---|---|---|
| A(Whole wall) | PCFI-A1 | 250 | 250 × 400 | Napping treatment |
| PCFI-A2 | Spray surface retarder | |||
| PCFI-A3 | Napping treatment | |||
| SWA | 200 | 200 × 400 | / | |
| C(Seam wall) | PCFI-C1 | 250 | 250 × 400 | Napping treatment |
| PCFI-C2 | Spray surface retarder | |||
| PCFI-C3 | Napping treatment | |||
| SWC | 200 | 200 × 400 | / | |
| PCFII-C1 | 250 | 180 × 400 | Napping treatment | |
| PCFII-C2 | Spray surface retarder | |||
| PCFII-C3 | Napping treatment | |||
| PCFII-C4 | Spray surface retarder |
Note: The specimen size is 1500 mm × 1800 mm; the concealed column longitudinal reinforcement is HRB335 6Φ14; the stirrups and distributing reinforcements are HRB400 Φ8 @ 150; and the strengthening reinforcement is HRB400 Φ10 @ 150.
Table 2.
Material parameters of concrete.
| Specimen | fcu (MPa) | fc (MPa) | Ec (M/mm2) |
|---|---|---|---|
| PCFI-A & SWA | 27.7 | 19.7 | 2.90 × 10⁴ |
| PCFI-C & SWC | 30 | 19.5 | 2.98 × 10⁴ |
| PCFII-C | 35.3 | 31 | 3.14 × 10⁴ |
Note: fcu is the standard value of the concrete cube compressive strength, fc is the standard value of the concrete axial compressive strength, and Ec is the elastic modulus.
Table 3.
Material parameters of reinforcement.
| Reinforcement | Measured Diameter | Type | fy (MPa) | fb (MPa) | Es (MPa) | |
|---|---|---|---|---|---|---|
| Column longitudinal reinforcement HRB335 | 14 mm | I | 382.5 | 655 | 2.0 × 10⁵ | 2913 |
| II | 372.8 | 546.93 | 1864 | |||
| Strengthening reinforcement HRB400 | 10 mm | I | 357.5 | 480 | 1788 | |
| II | 380.24 | 604.5 | 1901 | |||
| Distributing reinforcement HRB400 | 8 mm | I | 370 | 647.5 | 2850 | |
| II | 385.03 | 617.04 | 1925 |
Note: fy is the measured yield strength of the reinforcement, fb is the measured ultimate strength of the reinforcement, Es is the elastic modulus, and is the yield strain.
Table 4.
Peak load and ductility coefficient.
| Number | Designed Peak Load (kN) | Measured Peak Load (kN) | Average Peak Load (kN) | Ductility Coefficient |
|---|---|---|---|---|
| PCFI-A1 | 1003.2 | 1046.6 | 3.46 | |
| PCFI-A2 | 774.8 | 1039 | 3.16 | |
| PCFI-A3 | (873.2) | 1097.6 | 3.15 | |
| SWA | 1053.1 | 1053.1 | 3.45 | |
| PCFI-C1 | 1104 | 1054.5 | 3.63 | |
| PCFI-C2 | 777.2 | 1024.9 | 3.59 | |
| PCFI-C3 | (891.6) | 1034.6 | 3.73 | |
| SWC | 980.3 | 980.3 | 4.52 | |
| PCFII-C1 | 1174 | 1150 | 3.43 | |
| PCFII-C2 | 777.2 | 1251 | 3.38 | |
| PCFII-C3 | (943.2) | 950 | 3.3 | |
| PCFII-C4 | 1225 | 3.62 |
Table 5.
Equivalent viscous damping coefficient.
| Type | Number | Equivalent Viscous Damping Coefficient | Average |
|---|---|---|---|
| A (Whole wall) | PCFI-A1 | 0.089 | 0.080 |
| PCFI-A2 | 0.082 | ||
| PCFI-A3 | 0.074 | ||
| SWA | 0.075 | ||
| C (wall with vertical seam) | PCFI-C1 | 0.075 | 0.090 |
| PCFI-C2 | 0.088 | ||
| PCFI-C3 | 0.110 | ||
| SWC | 0.086 | ||
| PCFII-C1 | 0.118 | 0.122 | |
| PCFII-C2 | 0.125 | ||
| PCFII-C3 | 0.120 | ||
| PCFII-C4 | 0.125 |
© 2017 by the authors. Licensee MDPI, Basel, Switzerland. This article is an open access article distributed under the terms and conditions of the Creative Commons Attribution (CC BY) license (http://creativecommons.org/licenses/by/4.0/).
Share and Cite
MDPI and ACS Style
Li, J.; Wang, Y.; Lu, Z.; Li, J. Experimental Study and Numerical Simulation of a Laminated Reinforced Concrete Shear Wall with a Vertical Seam. Appl. Sci. 2017, 7, 629. https://doi.org/10.3390/app7060629
AMA Style
Li J, Wang Y, Lu Z, Li J. Experimental Study and Numerical Simulation of a Laminated Reinforced Concrete Shear Wall with a Vertical Seam. Applied Sciences. 2017; 7(6):629. https://doi.org/10.3390/app7060629
Chicago/Turabian StyleLi, Jianbao, Yan Wang, Zheng Lu, and Junzuo Li. 2017. "Experimental Study and Numerical Simulation of a Laminated Reinforced Concrete Shear Wall with a Vertical Seam" Applied Sciences 7, no. 6: 629. https://doi.org/10.3390/app7060629
Note that from the first issue of 2016, this journal uses article numbers instead of page numbers. See further details here.