
Passive Vibration Control of a Semi-Submersible Floating Offshore Wind Turbine


1
Shenzhen Graduate School, Harbin Institute of Technology, Shenzhen 518055, China
2
Department of Civil and Environmental Engineering, The Hong Kong University of Science and Technology, Clear Water Bay, Kowloon, Hong Kong, China
*
Author to whom correspondence should be addressed.
Appl. Sci. 2017, 7(6), 509; https://doi.org/10.3390/app7060509
Submission received: 20 March 2017
/
Revised: 8 May 2017
/
Accepted: 9 May 2017
/
Published: 26 May 2017
Abstract
:Floating offshore wind turbines have the potential to commercially convert the vast wind resource in deep-water area. Compared with fixed-bottom wind turbines, motions of the floating foundation complicate vibrations and loads of the wind turbine in offshore environment. To alleviate the responses of the wind turbine, this study investigates the use of fore–aft tuned mass damper (TMD) in nacelle/tower for passive control of a semi-submersible offshore wind turbine. A simplified structural model, considering the degree-of-freedom of platform pitch and surge, tower tilt and TMD translation, is proposed in the light of motion features of semi-submersible platform. After identifying ten unknown parameters, the correctness of the deterministic model is validated by pitch free decay responses. The mass, stiffness and damping of TMD are optimized using both method of exhaustion and genetic algorithm to avoid local minimum. Six optimized TMD devices are evaluated under three kinds of realistic environment conditions. The control effectiveness is assessed by the extreme and fatigue response reduction ratios. It is found that the high stiffness TMDs that directly dissipate the energy of tower oscillation exhibit an overall stable performance. Similar to the spar-type foundation, the TMDs in the nacelle/tower are capable of extending the service life of floating wind turbines.
1. Introduction
With the massive consumption of fossil fuels, energy and environmental pollution are becoming increasingly prominent problems. Developing clean renewable energy to replace the traditional fossil energy is a global urgent requirement. Under such a background, wind energy in deep-water area has attracted worldwide attention in recent years. Based on decades of experience from offshore oil and gas industry, several conceptual floating platforms have been proposed to support large wind turbines in deep-water regions, including spar, tension leg, barge, and semi-submersible.
Different from fixed-bottom wind turbines, the associated rotation and translation of the floating platform induced by the wave and wind loadings can significantly augment the oscillation and loads of wind turbine. Therefore, vibration and load reduction of the floating offshore wind turbine (FOWT) is crucial to the life cycle safety. One approach for vibration alleviation is to utilize structural control devices, which has been successfully applied in civil engineering structures, such as buildings and bridges [1]. Moreover, because the passive vibration control is more robust and less expensive than the active vibration control, it has been extensively adopted in high-rise structures [2,3] and offshore platforms [4,5]. Thus, it is also expected to be a promising solution for inhibiting the vibration of FOWT. Lackner et al. [6,7] established 3 degree-of-freedom (DOF) simplified structural models for barge, spar and tension lag platform types of floating wind turbines, respectively, and optimized the tuned mass damper (TMD) configurations for each type of foundation using a genetic algorithm. They also concluded that the active control device achieved more load reductions than passive TMD. Compared with the other floating foundation, the barge-type floating wind turbines exhibit larger response [8]. Taking the ITI energy barge 5 MW FOWT as an example, He et al. [9] pointed out that the maximum suppression rates of vibration responses vary from 20% to 50% as the mass ratio changes from 0.5% to 2%. Furthermore, Li et al. [10] investigated the active control strategies of TMD device and found that the wind turbine fatigue loads and generator error could be reduced effectively. With regard to the spar-type wind turbine, Si et al. [11,12] established a 5-DOF dynamic model for the Offshore Code Comparison Collaboration (OC3) Hywind spar-type wind turbine, and studied the effectiveness of TMD devices installed in nacelle and platform respectively. Van-Nguyen Dinh et al. [13] also investigated the effectiveness and feasibility of single and multiple TMD devices on a spar-type FOWT, and claimed that the spar TMD is more effective than the nacelle TMD.
Apparently, TMD devices are effective in vibration and load mitigation for both barge-type and spar-type FOWTs. However, to the authors’ knowledge, no studies have been reported to concern this issue of the semi-submersible foundation FOWTs. Nevertheless, currently, the semi-submersible foundation occupies the largest number of the few installed full-scale FOWT prototypes for its conspicuous capability in supporting the operational conditions of FOWT, such as the 2 MW WindFloat in the offshore of Portugal, and the 2 MW Mirai and 7 MW Shimpuu in the open sea of Japan. Although the structure system of the semi-submersible foundation is more complex than the other two types, it has the lowest pitch and roll motions, which is critical in the normal operation of wind turbines [14].
This study aims to investigate the potential application of optimized TMD in the semi-submersible FOWT. According to its particular characteristics, a customized 4-DOF dynamic model was derived based on the D’Alembert’s principle. After identifying the unknown parameters, the simplified model was validated by the recognized FOWT analysis tool FAST [15]. To find the optimized configurations of TMD, both method of exhaustion and genetic algorithm were employed to avoid local minimum. Finally, the performances of six sets of optimized TMD devices were evaluated via the fully coupled aero-hydro-servo-elastic dynamic model.
2. Modeling the Dynamics of Semi-Submersible FOWT
2.1. Simplified Dynamic Model for Semi-Submersible FOWT
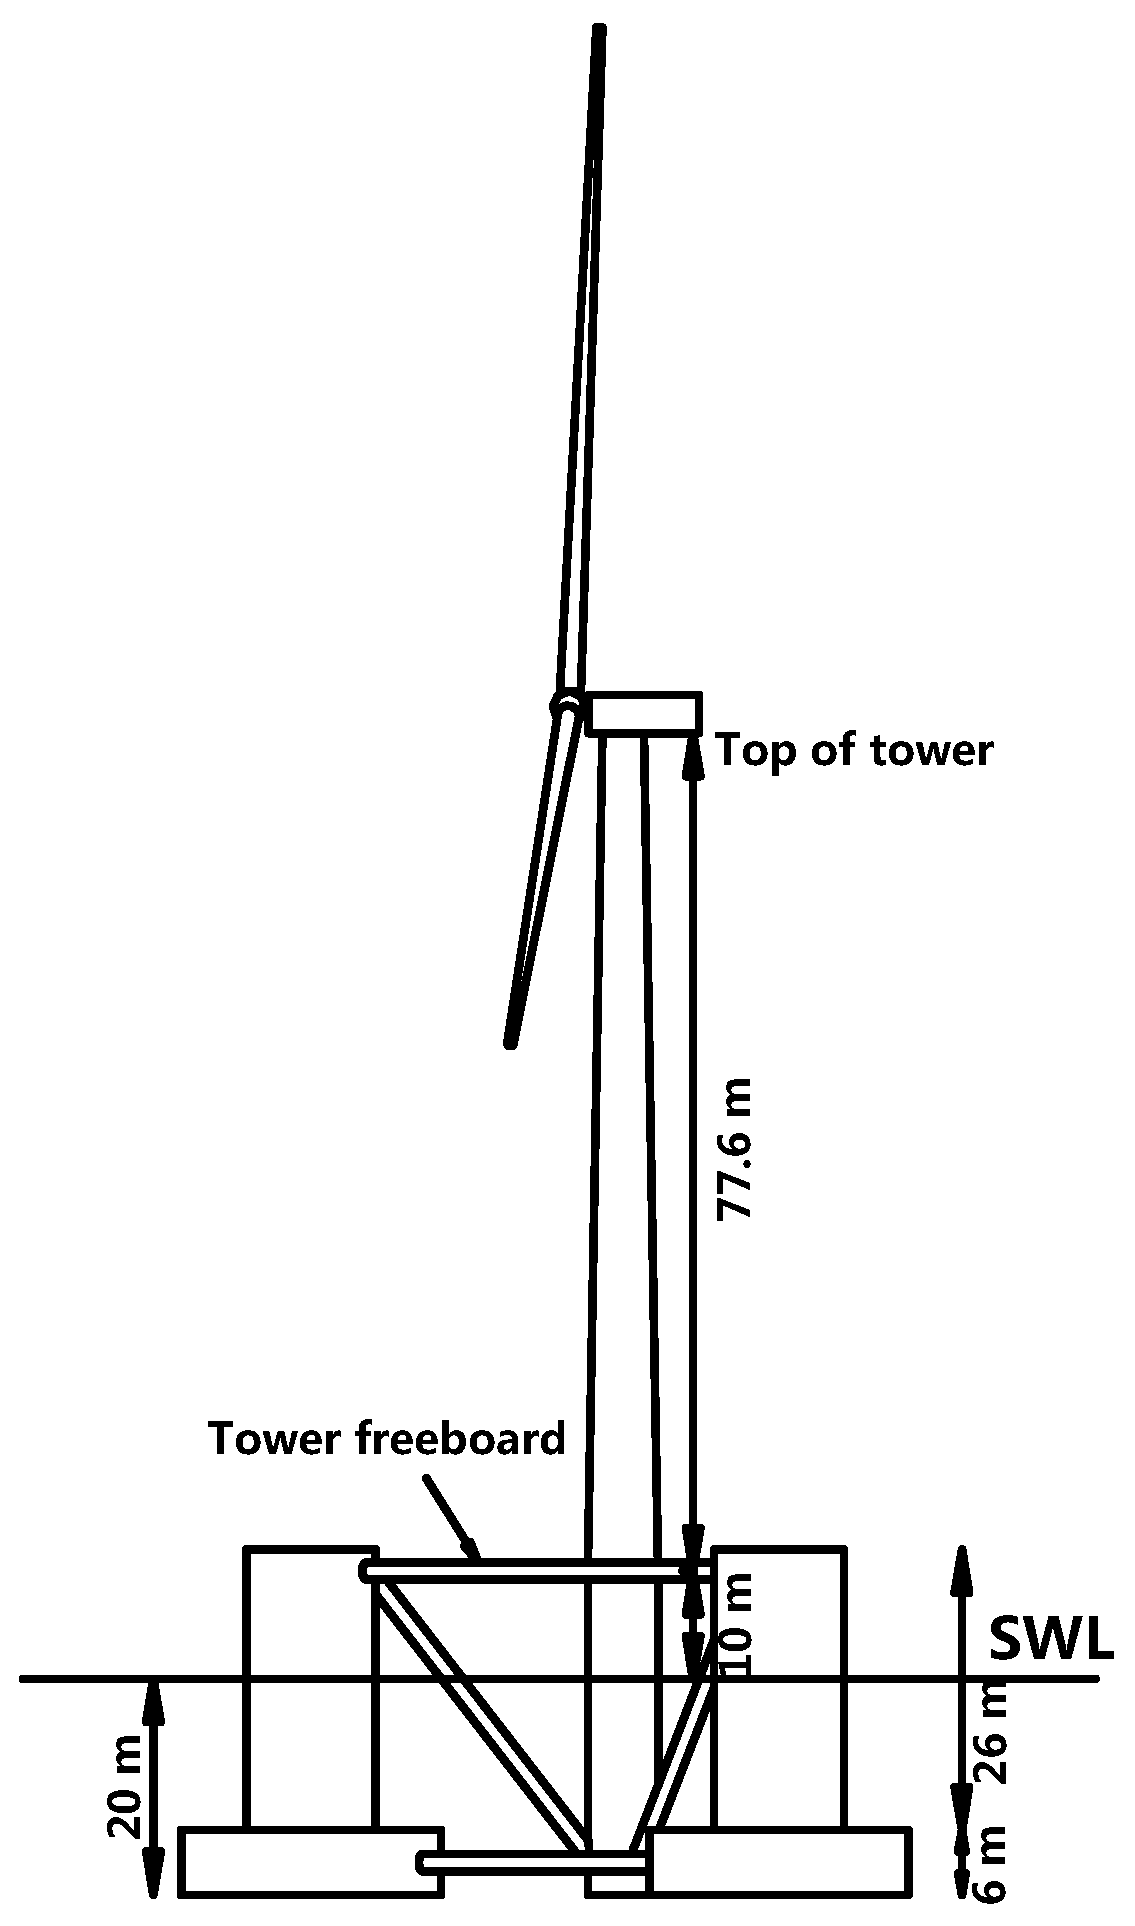
The semi-submersible foundation is gradually becoming the mainstream of FOWTs. In consideration of availability, the offshore code comparison collaboration continuation (OC4) DeepCwind semi-submersible foundation, one of the 5 MW FOWT benchmark model in the IEA-OC4 project, is selected as the research object in this study. The IEA-OC4 project is a program jointly conducted by the International Energy Agency (IEA) and various international research institutes to validate the quality of various FOWT analysis tools. In the OC4-DeepCwind system, the open accessed 5 MW offshore wind turbine designed by National Renewable Energy Laboratory (NREL) [16] is mounted on the foundation. Properties and model diagram of the OC4-DeepCwind model [17] are shown in Table 1 and Figure 1, respectively.
In order to achieve effective loads reduction, a TMD device was planned to install in the OC4-DeepCwind system. For a floating wind turbine system, the TMD device can be installed in the nacelle/tower or platform, and the direction of TMD motion can be fore–aft or side–side. Since the fore–aft fatigue loads of horizontal axis wind turbines are much larger than the side–side loads, we focus on the fore–aft TMD installed in the nacelle/tower in this work (see Figure 2). To simplify the problem in this preliminary study, an ideal TMD device with constant stiffness and damping was adopted. In addition, the TMD track was assumed linear and frictionless.
To find out the optimal parameters of the TMD device, combining an optimization algorithm within the frame of FAST was the first choice. However, due to the limitation of the existing computational resources, the time cost of FAST was unacceptable to finish an onerous optimization procedure. Nevertheless, with respect to the floating systems, previous studies have demonstrated that only a few degrees of freedom are responsible for the most of system responses. Thus, to acquire the optimal TMD configurations for the OC4-DeepCwind model efficiently, it is helpful to establish a simplified mathematical model with limited degree of freedoms to replace the complex fully coupled model in FAST. For instance, Lackner et al. [7] established a 3-DOF (i.e., platform pitch, tower tilt and TMD motion) dynamic model for a barge-type floating wind turbine, in which both the damping coefficient and the recovery stiffness coefficient are considered linear. For the spar-type floating wind turbine in the OC3 project, Si et al. [11,12] obtained a higher accuracy by establishing the dynamic model accounting for 5 DOFs, i.e., the platform surge, heave, pitch, tower tilt and TMD translation.
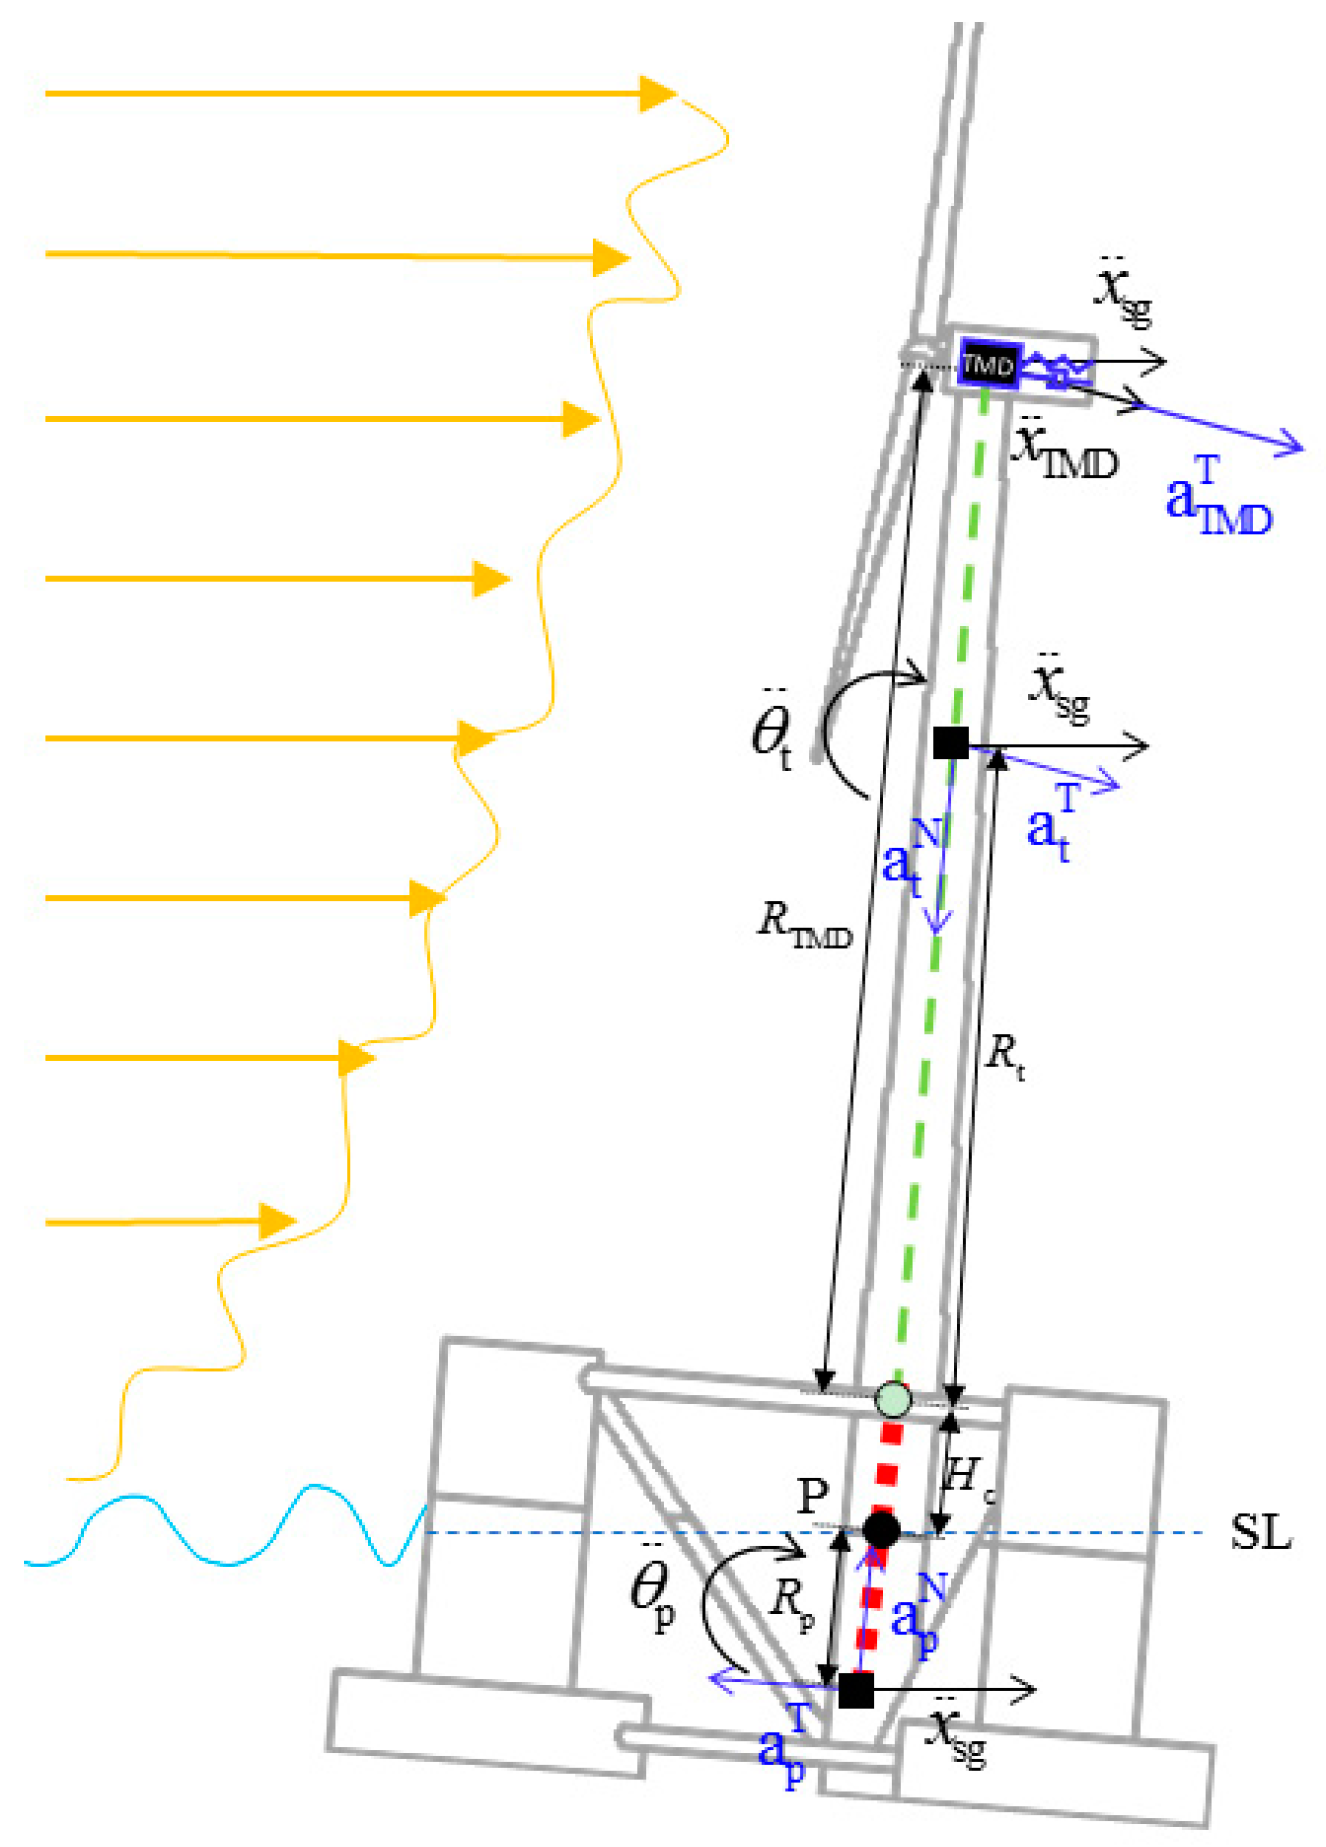
A schematic of the OC4-DeepCwind simplified dynamic model is illustrated in Figure 2. Following aforementioned studies, the preconditions and assumptions required to establish an efficient dynamic model are listed below:
- 1
- The semi-submersible FOWT was modeled as a multi-body dynamic system, in which the platform, tower (include rotor and nacelle), and the TMD were considered as rigid bodies. In order to be consistent with the FAST program, the reference point located in the intersection of sea level (SL) and the centerline of platform was chosen for output analysis. The inertial coordinate system was established with the reference point as the origin.
- 2
- Unlike the spar foundation, the heave motions of the semi-submersible-type foundation resulted in a negligible impact on the pitch motion. Therefore, the simplified dynamic model of OC4-DeepCwind was built using only four DOFs: the platform surge, pitch, tower tilt, and TMD motion. Moreover, since the TMD device was relatively small in mass to the overall FOWT, its rotation was ignored and only the translation was considered.
- 3
- The tower was hinged to the foundation at the tower bottom, and both interactions between the foundation and the tower, and between the TMD device and nacelle were treated as a linear spring and a linear damper.
- 4
- Because only the free decay motion was used to identify the model parameters and optimize the TMD parameters, the external forces like incoming wind and wave loadings were not accounted for in the simplified model. However, the system coupled effects with the hydrodynamics and mooring loads were fully considered in the model. Furthermore, even under extreme conditions, the platform pitch responses do not exceed 10°. Two common small angle approximations, i.e., and were introduced throughout the study.
Based on the above assumptions, D’Alembert’s principle can be employed to describe the overall dynamics of rigid bodies. The key point of D’Alembert’s principle is that a dynamic problem can be treated as a static problem by introducing the inertia forces. As mentioned above, point was adopted as the origin of all the motion and the quasi-static equilibrium equations can be expressed as follows:
where and denote the sum of all external forces and the sum of all moments about P, respectively. While represents the mass of body , namely platform, tower, and TMD, and denote inertia. and are the acceleration vector and angular acceleration for rigid body respectively. is the position vector from to body . and are vector sums of inertial forces and torques about , respectively.
In Equation (1), the left side of the equation is the terms related to the second derivative of the displacement, while the right side of the equal sign is the rest of forces and moments. Therefore, the next major task is calculating all force components of the model.
2.1.1. Inertia Force Terms
The first step is to determine all motion acceleration components of platform, tower and TMD device in the established coordinate system. Apart from the surge acceleration and pitch acceleration of platform, first fore-aft bending’s acceleration of tower and acceleration of TMD device, the tangential acceleration , , , and the normal acceleration of each body as illustrated in the Figure 2, and we can use the following formula to calculate these acceleration.
where denote the distance between the bottom of tower and SL.
Due to the presence of radiation effect, we should consider the added mass in the inertia force term. The added mass coefficient can be calculated by potential theory at infinite frequency, and added mass can be obtained using the follow formula:
For OC4-DeepCwind, we can get the added mass value in [17]. Therefore, we can integrate and list the inertial force term in the follow:
The centripetal forces and moments caused by the rotation of platform and tower about the reference point are calculated by the following expressions
Due to the relatively small mass of TMD, its centripetal force is omitted in this study.
2.1.2. Gravity Terms
The floating body is always subject to gravitational force, which also should be reflected in the modeling. All the gravity related terms can be given by:
It is worth mentioning that the pitch and roll additional stiffness of ballast in the configuration of FAST actually is the projection of the gravity term.
2.1.3. Restoring Force terms of Platform
As a floating body moves in the wave, the restoring force is composed of the hydrostatic and mooring components. The restoring force of pitch motion is mainly controlled by the hydrostatic pressure, which is linear if the rotation is small. However, the restoring force of surge is primarily provided by the non-linear mooring system. The linearization of mooring restoring forces is realized by using only the first order term. Therefore, all the restoring forces are calculated by:
Except , the other restoring stiffness components in Equation (7) mainly originate from the mooring system. Following the settings and schemes in FAST, the initial values of mooring stiffness coefficients are estimated based on the quasi–static catenary equation. Furthermore, referring to [18], we can calculate the hydrostatic restoring stiffness through:
where is an area integral on the waterline surface of the foundation, denotes the displacement volume of the foundation, is the height of the center of buoyancy to the origin of coordinates, is the pitching restoring coefficient caused by hydrostatic force, and denotes the pitching restoring coefficient induced by mooring system.
2.1.4. Damping Force Terms of Platform
For the body floating in still water, damping forces are mainly composed of two parts, viscous damping and radiation damping. According to Morison’s representation [19], the viscous damping force is proportional to the square of the relative velocity between the fluid particles and the platform, which can be calculated as follows in this case:
where denotes the drag coefficients of members of the platform, which are available in the FAST configuration file; denotes the draft of the platform; denotes the distance from the integral position to the free surface.
Generally, the radiation damping term is represented by the convolution integral form [18]:
where denotes radiation damping force for the th degree of freedom (DOF); denotes the (i, j) component of the wave-radiation-retardation kernel; and denotes the th DOF velocity.
After a series of attempts, it is found that these two damping estimation formulas are very computationally expensive for optimization calculation, which is discussed in Section 3. Furthermore, the values of the radiation damping terms for most of modes are considerably smaller than those of the viscous terms. Hence, following the previous study [12], the total damping force is simply approximated by the following equations:
2.1.5. TMD Force Terms
The external force of TMD device includes three parts, the linear spring force, the damping force, and a stop force. We have
where and are the stiffness and damping coefficients respectively. Due to the space restriction of nacelle cabin, the TMD device is subjected to a stop force as the mass hit on the wall. According to the TMD module [20] integrated in FAST, is given by
where denotes the maximum TMD displacement from the origin of the nacelle coordinate system. According to the size properties of NREL-5 MW [16], = 5 m is adopted in this work. and denote a huge constant stiffness and damping coefficients respectively. To be consistent with the work of Stewart [6], we take , , and denotes the part of the TMD displacement that exceeds the limit value.
Following [12,21], the connection between the tower and the foundation is simplified to a hinge joint. The first fore–aft bending mode of tower could be equivalently modeled by a linear spring and damper. Therefore, the additional bending moments at the tower bottom is given by
To ensure the precision of this linear modeling, the tower top displacement (TTD) is validated with FAST output in the following section.
Consequently, we can establish the simplified dynamic model by uniting the above equations.
In addition, according to [16], the center of gravity of the rotor nacelle assembly (RNA) is deviated about 0.4 m from the centerline of the tower. This deviation induces a minor initial inclination of the entire system, and its magnitude can be estimated by simulating the undisturbed model in the FAST program. The initial inclination of platform in still water is −0.077°, and the initial tower top displacement (TTD) is −0.0167 m. In consideration of the effects of the initial inclination on TMD movement, a correction is made to the gravity force of the TMD model as follows:
where denotes the initial inclination of the tower in still water, and is the height of the tower. Moreover, to eliminate the impact of this initial inclination, the corresponding outputs of FAST are translated to realize zero-mean in the model parameter identification.
2.2. Model Parameters Identification
Before the proposed dynamic model is applied in the optimization of TMD parameters, its unknown parameters should be identified first. In the proposed dynamic model, there are totally 11 unknown parameters. However, and therein are simplified to one parameter due to the symmetry of the mooring stiffness. Finally, the ten parameters, all of which need to be identified and evaluated properly, are given by
Because the tower and RNA are treated as a single rigid body and hinged to the platform, their inertia should be re-identified in the simplified model. The parameter values that can be calculated exactly from the practical model are listed in Table 2.
In this study, the vertical pretension of each mooring line is equivalent to a mass fixed at the fairlead point. Consequently, the mass, the inertia and the height of the center of gravity of the platform in Table 2 are modified accordingly.
In order to achieve parameter identification efficiently, the proposed model is established in Matlab Simulink. The Levenberg–Marquardt (LM) algorithm, which combines the advantages of the gradient descent algorithm and the Gauss–Newton approach [22], is employed in the identification process. The LM approach is capable of searching the minimum value of the sum of squared errors (SSE) effectively. The definition of SSE between outputs from the proposed model and FAST is given by
where denotes weight for each variables. Since the magnitude of TTD is smaller than the pitch and surge motions, the weights of TTD, pitch and surge are set as 10, 1 and 1, respectively. denotes the number of selected output responses, and is the number of data samplings. is the response obtained from FAST at time , and is the results of the proposed model adopting parameter vector .
Similar to [12], since the wind and wave loads are not considered in the proposed model, the free-decay motion with a 5° initial pitch and inactive TMD is selected as the test case for identifying parameters. The surge and pitch of platform, and TTD are employed as the targets of comparison to fit in the FAST results. Specifically, in the FAST simulation, deactivate all the DOFs except the surge and pitch of platform and the first fore–aft bending of tower, run FAST and record the response time-histories. In the simplified model, switch off the DOF of TMD and execute in the same condition as FAST.
During parameter identification, the initial values are supposed to influence the efficiency and tendency of the optimization. To achieve a quick convergence, it is important to assign appropriate initial values. The exact value of in the real model is taken as the initial. For the restoring stiffness coefficients, , and , their approximation are obtained by the quasi-static theory of catenary line. In addition, the hydrostatic stiffness in also needs to be calculated according to Equation (8). The initial values of other coefficients are determined by trial and error. Finally, the initial values and the final estimation values are compiled in the Table 3, in which the metric units of each parameter are omitted for a concise expression.
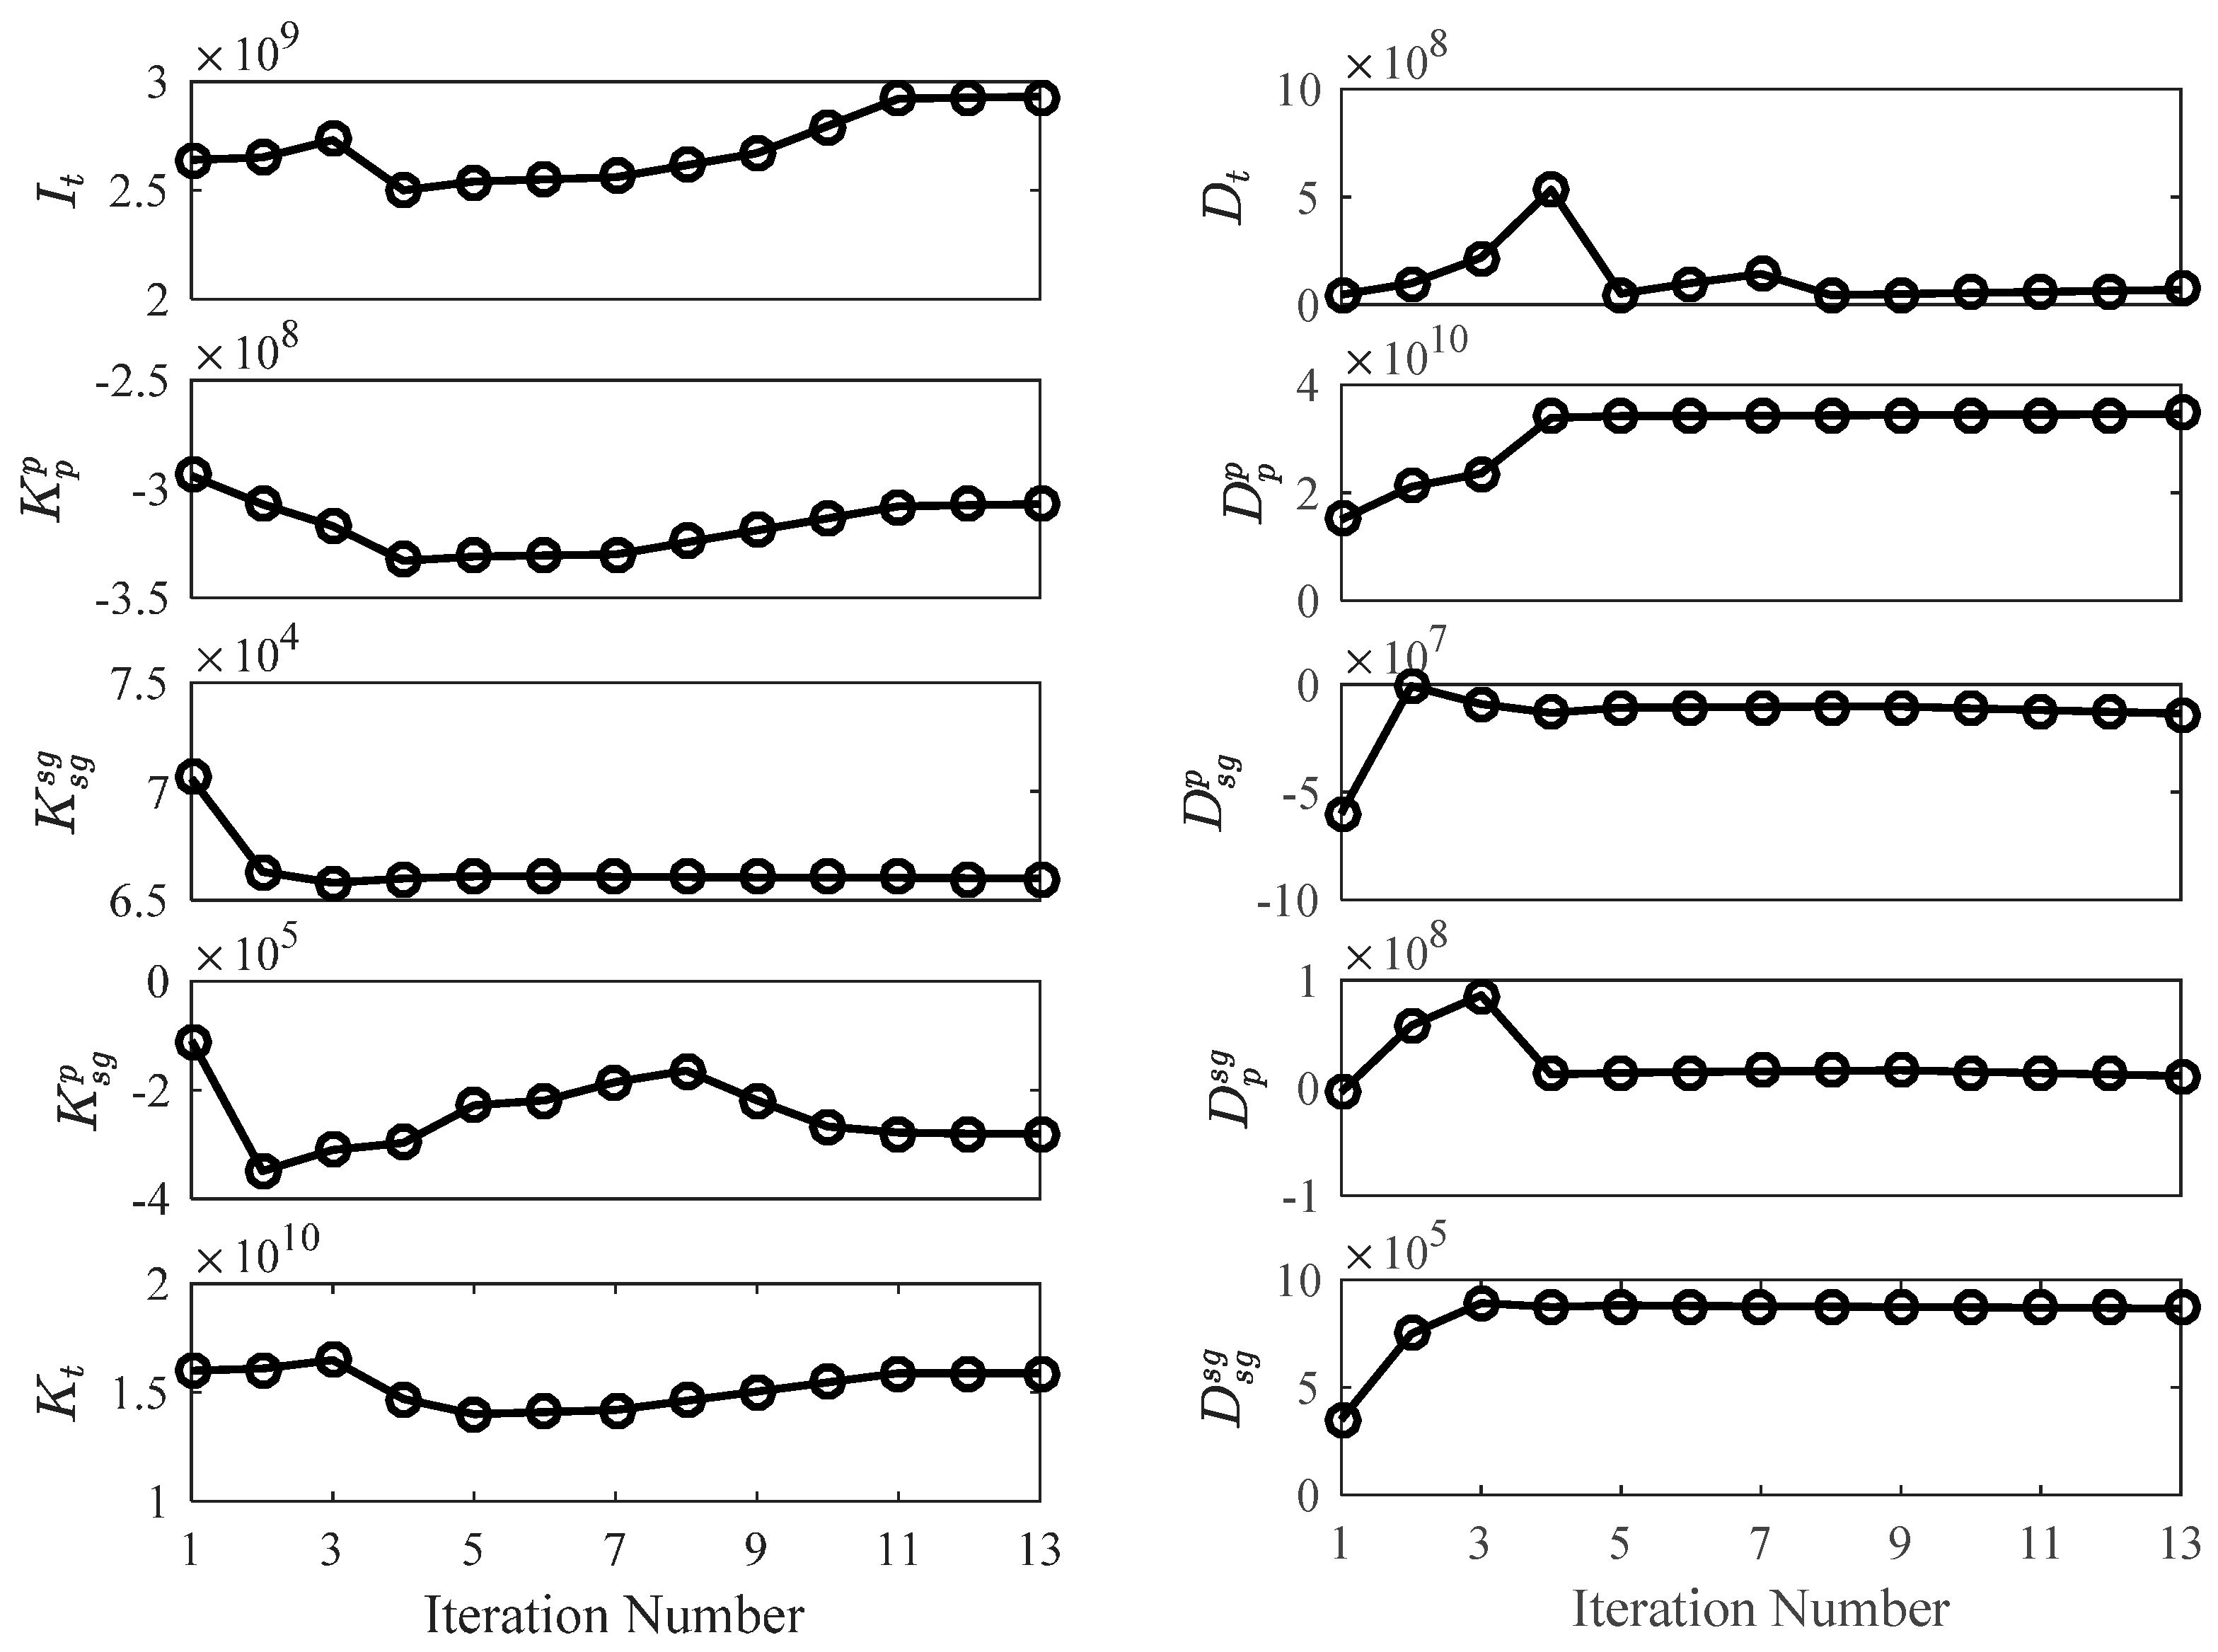
The estimation iteration processes of all the ten parameters are shown in Figure 3. As can be seen, the initial values of , , are highly close to the estimation respectively, which demonstrates the accuracy of our established model to a certain extent. However, due to a relatively strong non-linearity in the mooring system, the estimation of remarkably deviates from the initial value.
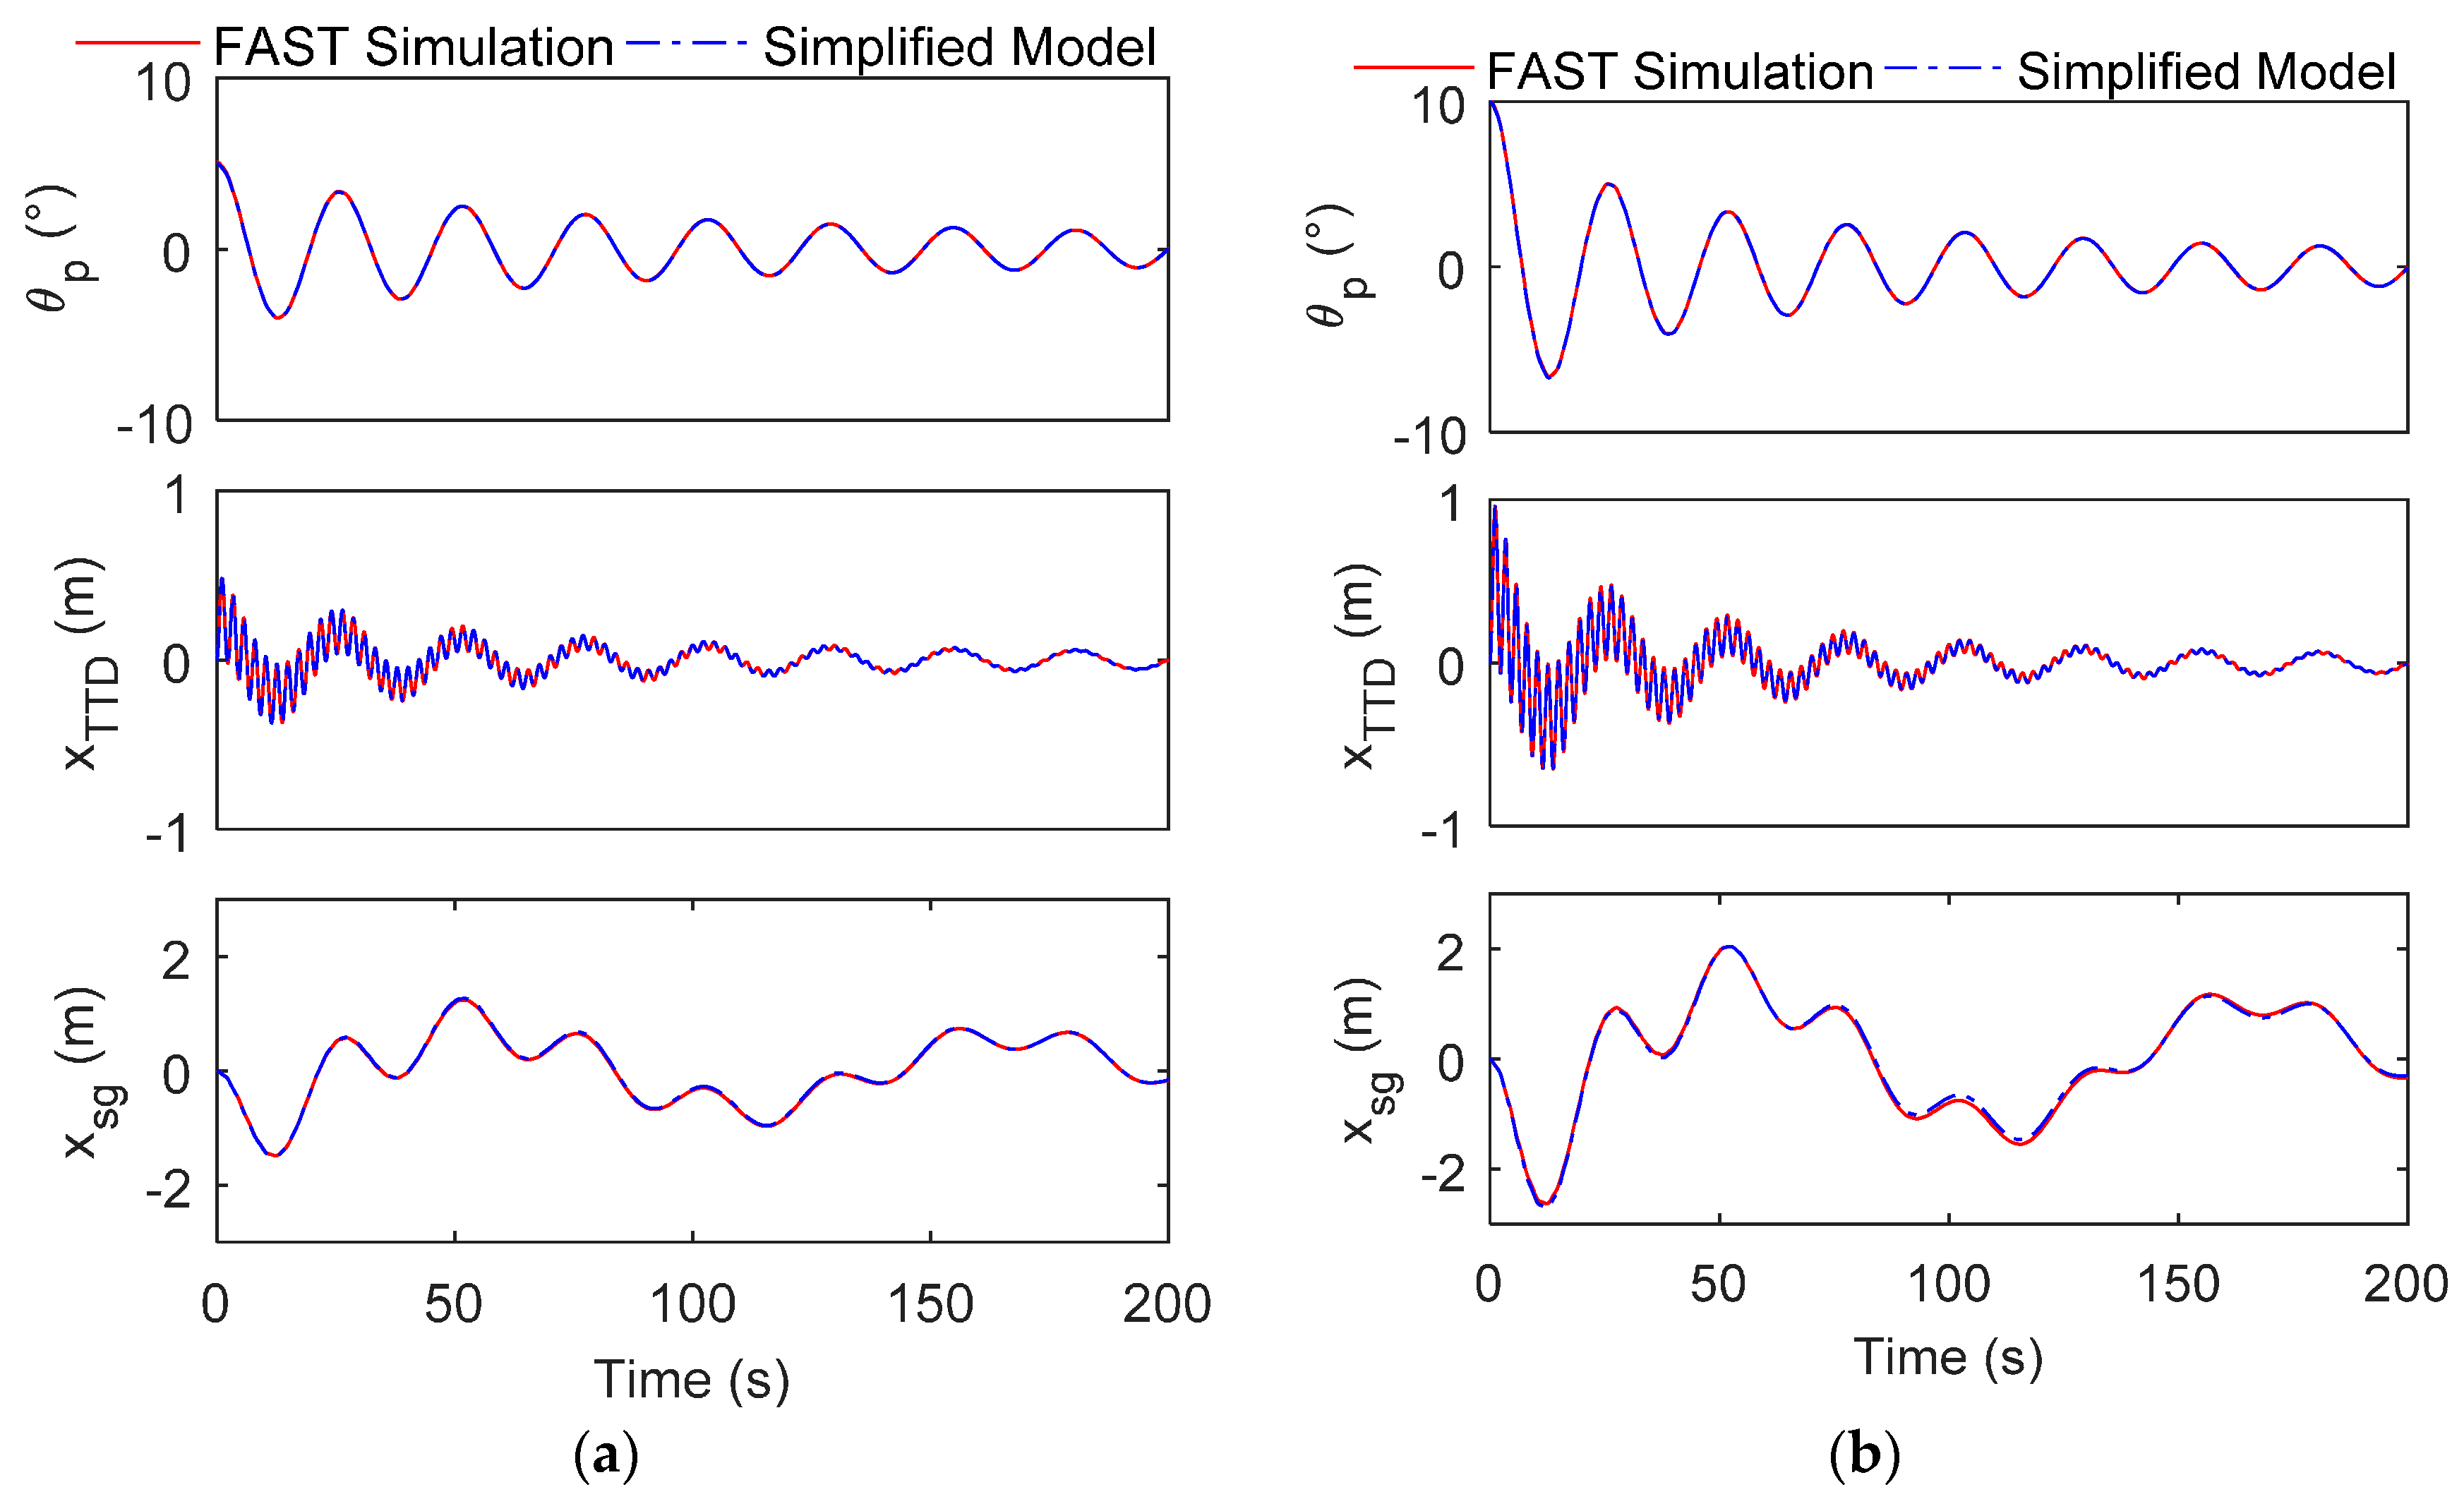
To validate the accuracy of the identified simplified model, we illustrate the free decay responses with inactive TMD obtained by the two approaches in Figure 4. Results of the OC4-DeepCwind surge-pitch motion with a 5° initial platform pitch are shown in Figure 4a. Furthermore, the free decay motions with a 10° initial pitch are also displayed in Figure 4b. The red solid line denotes the FAST simulation results, while the blue dash-dot line denotes the result of the proposed model. Upon examination of the six pair curves, the proposed simplified model can predict the pitch, surge and TTD in a high overlap ratio with the FAST simulation.
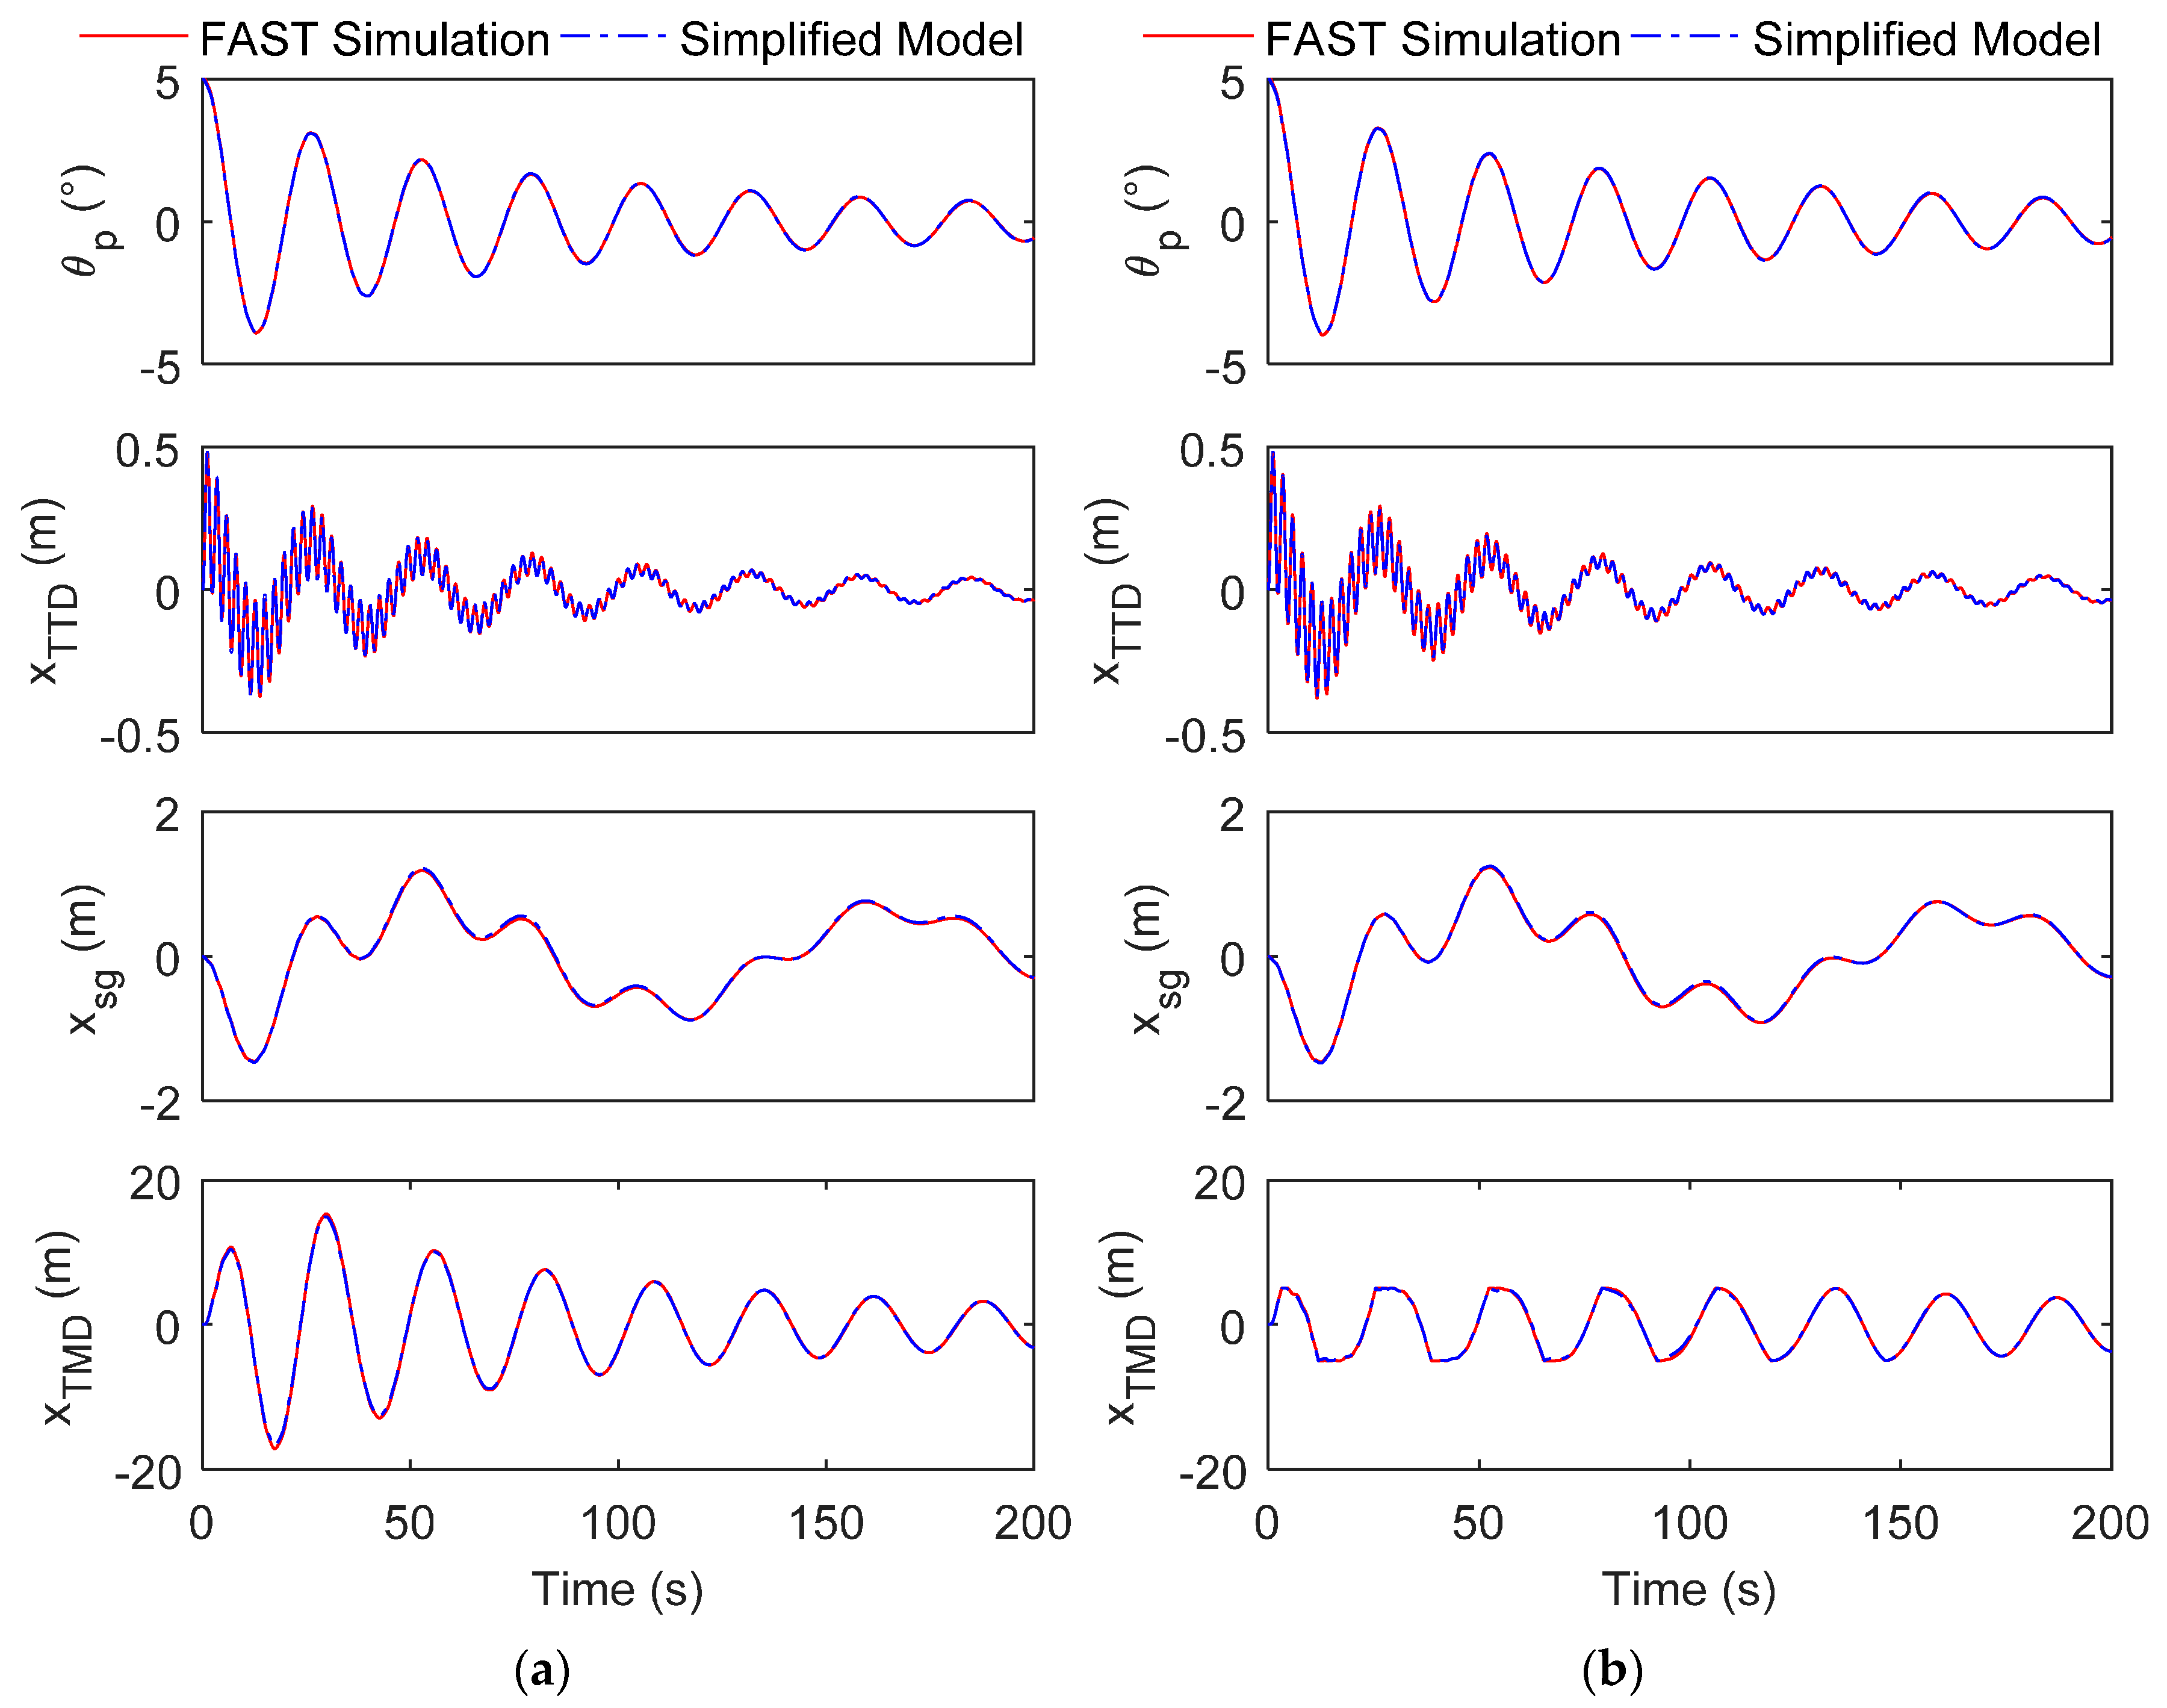
To check the model performance with active TMD, a validation case with and without TMD stops is designed. In this test, the TMD mass is 1 × 10⁴ kg, the spring and damping coefficients are 1000 N/m and 2000 N/(m/s) respectively. All the other parameters equal to the aforementioned definitions. Figure 5 displays comparisons of the 5° pitch free decay motions between the simplified model and the FAST simulation. The displacements of TMD clearly show the effects of stops induced by the limited space in nacelle. For the TMD without stops, since more energy has been dissipated in the first few periods with longer travel, the vibration amplitude of TMD decays slightly faster than the case with stops. In both cases, the simplified model presents a closely agreement with the FAST simulation through the pitch, surge and TTD.
In summary, all the four cases manifest the rational representativeness of the established model. The adopted assumptions and derived equations is able to neglect the minor effects but captured the essential dynamics of OC4-DeepCwind system. It is feasible to optimize TMD parameters based on this simplified and efficient model.
3. Optimization for TMD Parameters
The TMD parameters to be optimized in this study include the mass, spring and damping coefficients. The location of TMD device is fixed in the nacelle or, alternatively, in the top of tower. The free decay case with 5° initial inclination is chosen for carrying out optimization by the limited degree of freedom model. As concluded by Stewart et al. [23], TMD is a robust solution to suppress tower vibrations and reduce fatigue loads of FOWT in the realistic application. Thus, the standard deviation of the tower top displacements is taken as the objective function for its capability in characterizing the fatigue behavior of the system. Both method of exhaustion and genetic algorithm are applied to avoid getting caught in local minimum points.
3.1. Method of Exhaustion (ME) for Lower Stiffness TMD
The optimal mass for TMD is approximately 1–5% of the structural mass based on previous studies on vibration control of tall buildings [24]. Therefore, to accomplish a comprehensive investigation on the effects of TMD mass, its values are chosen from 6000 kg to 20,000 kg with a 2000 kg interval in this study. With respect to spring and damping coefficients, the most direct but computationally expensive method is to perform exhaustive search by the established model. Thus, in the consideration of time spent and accuracy, the searching range of spring and damping coefficients is within 0–12,000 N/m and 0–12,000 N/(m/s), respectively, for each TMD mass, and the searching interval is 100 for both variables. The optimal results for eight TMD masses are listed in Table 4. The reduction ratio defined in Equation (19) is adopted to reflect the performance of TMD.
We can find that decreases monotonously with increasing the TMD mass. The minimum value occurs when the TMD mass is 20,000 kg, and the reduction ratio is 14.23%. As the and curves shown in Figure 4 and Figure 5, the natural frequency of pitch for OC4-DeepCwind system is about 0.0378 Hz. For these lower stiffness TMD devices, their frequencies are close to the pitch motion frequency and the vibration energy dissipation is focused in this band. However, all the damping ratios are larger than one for an overdamped state.
To illustrate the entire variation tendency of TMD parameters, the 3D surfaces of for 10,000 kg and 20,000 kg TMD mass are shown in Figure 6. It is interesting to note that the 3D surfaces are divided into two regions, i.e., the rough area (lower stiffness) and the smooth area (higher stiffness). The irregular variations in rough area may be induced by the stop limitation of TMD movement. In the lower range of stiffness, the TMD mass block is supposed to collide on the nacelle wall, and the collision may complicate the system dynamics and response. In the higher range of stiffness, the TMD mass block can operate within the limitation without collision. Moreover, it can be deduced that a minimum value shall lie in the smooth area. Therefore, another approach to search for the optimum in this infinite region is needed.
3.2. Genetic Algorithm for Higher Stiffness TMD
Genetic algorithm (GA) is a stochastic global optimization and search method inspired by natural biological evolutions [25]. It has been widely applied in extensive practical engineering problems. For a specific optimization problem, a population of individuals is encoded with a simple chromosome-like data structure firstly. Then, in the iteration of generation development, new sets of individuals that contain high fitness genes and newborn random information evolve gradually. The operators such as selection, recombination and mutation can ensure the diversity and superiority of the newborn population. Similar to natural adaptation, this evolution process leads to the individuals that are optimal to environment (fitness criteria) finally. The feasibility of the genetic algorithm in TMD parameters optimization has been proven by Stewart [26] and Si et al. [12]. In this study, the population size of each generation is 50, the ratio of crossover is 0.8, and the convergence criterion is that the average relative change of the best fitness is less than 1 × 10⁻⁶. Eventually, the optimized results in the higher range of stiffness are listed in Table 5.
According to the displacement of TTD shown in Figure 4 and Figure 5, the first fore–aft bending mode frequency of the 5 MW wind turbine with a 10,000 kg TMD is around 0.43 Hz. The frequencies of the optimized TMD devices in Table 5 show a well agreement with the wind turbine’s fore–aft natural frequency. Furthermore, the gradually decreased frequency is induced by the effects of incremental TMD mass. The reduction ratios for all the eight masses are relatively close to each other, which prove the more stable behavior of higher stiffness TMD.
4. Performance Verification and Analysis of the Optimized TMDs
Combined results of the above two optimization algorithms, three TMD masses (8000 kg, 10,000 kg and 20,000 kg) with two sets of corresponding parameters (lower and higher stiffness) are chosen for validating the control effects in a realistic offshore environment. The validation is performed in the FAST program, a fully nonlinear simulator of FOWT dynamics and with all system DOFs enabled.
To make a convenient comparison with previous study [7,11], the same environmental load conditions are adopted in this study and listed in Table 6. The three selected conditions approximately correspond to the rated operation, maximum-wind operation and self-survival. The Kaimal and JONSWAP spectrum are used in the generation of stochastic wind and wave field respectively. Under each load condition, the total simulation time is 630 s and only the last 600 s are recorded for analysis. The time step for all the cases is 0.05 s, which is small enough to obtain an independent solution. To eliminate the influence of random seed, the final statistical results are averaged based on three sets of stochastic environment field for each case.
The wind and wave time-history samples for the three selected cases are plotted in Figure 7. Obviously, the generated environmental loads essentially captured the predefined characteristics in Table 6.
Similar to [12,27], to evaluate the performance of TMD controllers, the 95th percentile of response is employed to represent the extreme value, and the short-term damage equivalent load (DEL) [28] is used to measure the fatigue loads. Response reduction ratios with different TMD parameters are shown in Table 7. As defined in Equation (19), a positive reduction ratio indicates that the TMD device has a mitigation effect on the response of turbine system, and vice versa.
Since the TMD parameters are obtained by minimizing the standard deviation of tower top displacements in the pitch free decay motion, the low stiffness TMD devices mitigate by dissipating the energy in the platform pitch motion, whereas the high stiffness TMD devices dissipate the energy in the tower oscillation. However, in the real environment, the frequencies of platform pitch motion are mainly controlled by the incoming wave spectrum. The peak-spectral period of incident waves listed in Table 6 is 14 s for operating conditions, which is greatly less than the pitch natural period of OC4-DeepCwind 26.8 s [29]. On the other side, the natural frequency of turbine tower is much higher and its oscillations are mostly excited by the wide-band wind spectrum. As can be seen in Table 7, almost all the reduction ratios of high stiffness TMD is larger than the low stiffness TMD, regardless of whether considering the extreme or fatigue index or not. Furthermore, lower stiffness of TMD will frequently collide on the stop walls, which may increase the cost of maintenance. Therefore, the low stiffness TMD is not recommended for FOWTs.
With regard to the platform pitch and roll motion, the controlling performance of TMD is negative for most cases. The absolute values of reduction ratio are relatively small and increasing with the increment of TMD mass. This phenomenon can be explained by the mass ratio and location of TMD. Firstly, the mass ratio of TMD (20,000 kg) to the whole system is 0.14% which is significantly small than the empirical value in building structure control. However, the mass ratio of TMD (20,000 kg) to the 5 MW turbine is 3.33%. Thus, it is not surprising that the TMD devices in this work have negligible effects on the platform motion. Secondly, as the turbine inclines, the gravity of TMD device installed in the nacelle will deteriorate the system tilt.
The DEL of tower base moment in the fore–aft and side–side directions represents the fatigue loads. Under the two operating conditions (10 m/s and 180 m/s), TMD is capable of mitigating the DELs substantially. With the increase of TMD mass, the control effects also improved gradually. Compared with side–side, the reduction ratio of fore–aft direction is lower. Nevertheless, the absolute moments in the fore–aft direction are several times larger than the side–side. Similar as standard deviation, the short-term DEL of a time-series can reflect, in some extent, the level of fluctuations departing from the mean value. Therefore, because is the objective function in optimizing the TMD parameters, it is well reasoned that the DELs can be reduced. As a whole, the main embodiment of TMD device in OC4-DeepCwind is to absorb the energy and mitigate the fatigue loads induced by moderate wind and wave conditions.
According to the above discussion, TMD devices with 20,000 kg mass, 133,467 N/m spring coefficient and 9293 N/(m/s) damping coefficient are chosen for OC4-DeepCwind in practical application. The time-histories of platform pitch and roll and the tower base moments in the fore–aft and side–side directions are illustrated in Figure 8. The responses with and without TMD under the three load conditions are drawn in red and blue lines, respectively. The time domain results also verify the statistics. The platform motions nearly coincide with each other and the controlling performance can be observed in the tower base moments. Similar to the results of Si et al. [12], the generated power time-histories of the 5 MW FOWT under 10 m/s and 18 m/s wind velocities indicate that the TMD devices have negligible interference on the electricity generation.
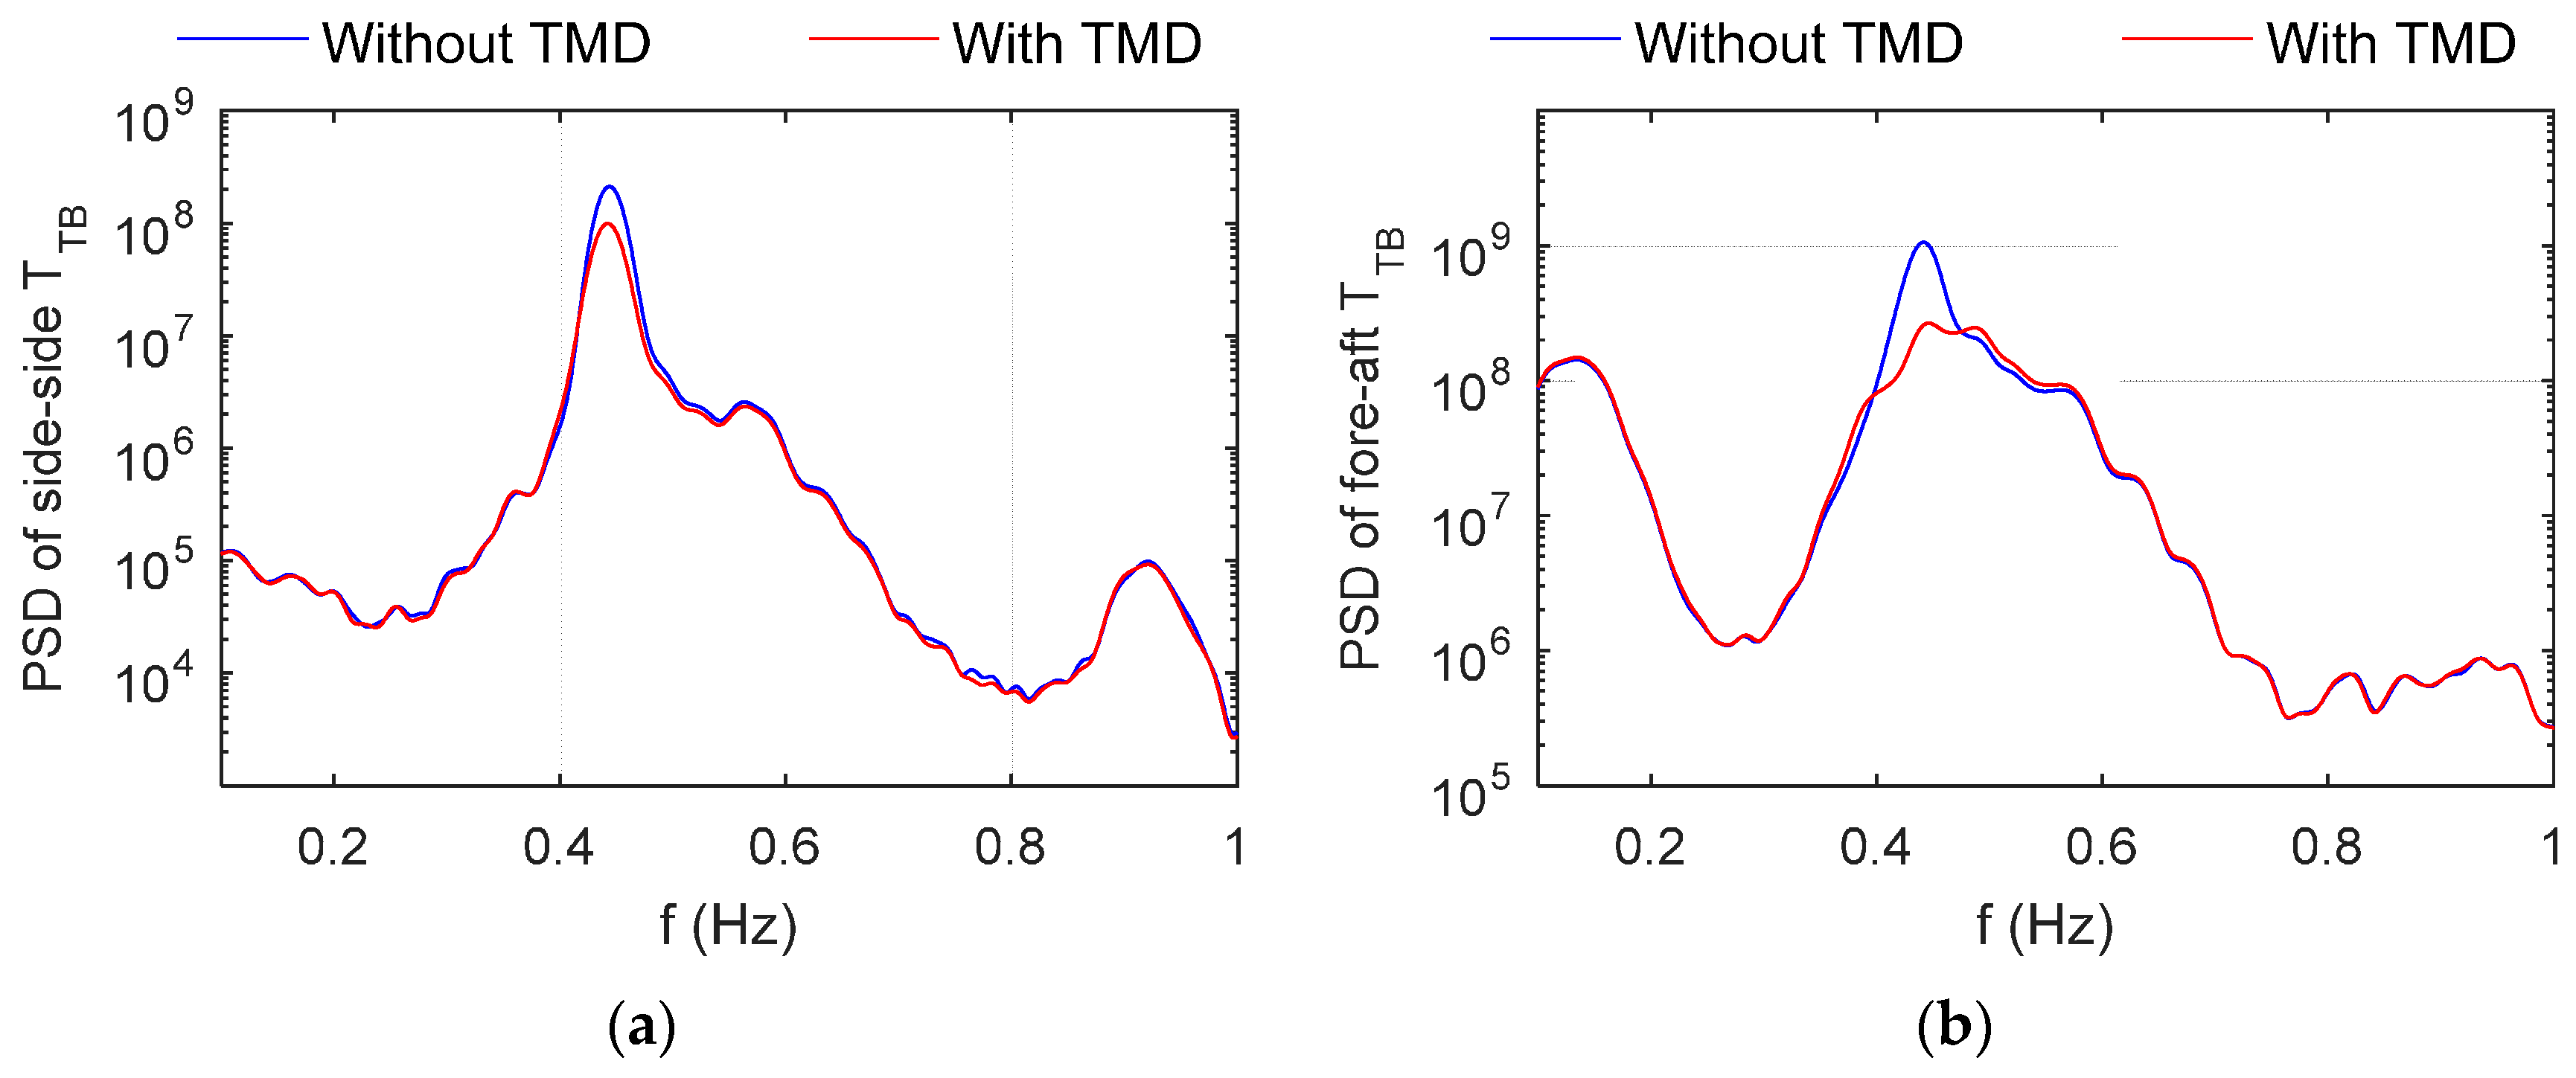
As can be seen in Figure 9, the comparison between the power spectral density of uncontrolled responses and responses controlled by the selected TMD device displays the alleviating effects in frequency domain. Since the TMD is tuned near the wind turbine’s fore–aft natural frequency ≈ 0.43 Hz, the control is generally most effective for tower base moment, which is critical in extending the service life of FOWT.
In addition, to reveal the performance of TMD device on different kinds of floating foundations, the simulation results of OC3-Hywind, a spar type 5 MW FOWT, using the same environmental conditions from [11] are listed in Figure 9. Power spectral density of tower base moments under rated operation condition with and without TMD: (a) Side–side; and (b) Fore–aft.
Table 8 to compare with the semi-submersible OC4-DeepCwind. The TMD device is also installed in the nacelle with = 20,000 kg, = 16,4231 N/m, = 20,889 N/(m/s), which is similar to the 20,000 kg high stiffness TMD in this work. One of the noteworthy differences between spar and semi-submersible platform is their hydrostatic stiffness of pitch; in other words, the small angle stability of spar is worse than the semi-submersible. Encountering the same realistic loads, the pitch response of OC3-Hywind is supposed to be larger than OC4-DeepCwind. However, the response reduction ratios of the two type foundations manifest a similar variation tendency. For DEL of at rated and extreme wind speed, the control effects of TMD on OC4-DeepCwind are better than OC3-Hywind. At maximum operating wind speed, TMD on OC3-Hywind can mitigate more fatigue loads.
5. Conclusions
To find the optimal tuned mass damper (TMD) for the semi-submersible OC4-DeepCwind wind turbine efficiently, we propose a simplified multi-rigid-body dynamic model, in which only the motion of platform pitch and surge, tower tilt and TMD translation are considered. The inertia and gravity forces, restoring and damping forces from hydrodynamics and mooring, and the TMD forces are included in the dynamic model derivation. After the ten unknown parameters are identified by the Levenberg–Marquardt algorithm, the accuracy of the simplified model is verified by the pitch free decay motions. In order to obtain the globally optimized parameters of TMDs, the primary variations of objective function can be predicted firstly by method of exhaustion and a set of optimal parameters are determined in this complex lower stiffness region. Furthermore, genetic algorithm is helpful in finding the optimal stiffness in the higher range efficiently.
According to the performance in realistic environmental conditions, the lower stiffness TMDs mainly dissipate the energy of platform pitch vibration, whereas the higher stiffness TMDs absorb the energy of tower vibration. However, the periods of platform pitch motion are mostly determined by the incoming wave spectrum. Consequently, the high stiffness TMDs that exhibit a more stable performance are recommended for practical use. Of all the three environmental conditions, TMD is certainly helpful to reduce the fatigue loads, but may slightly harm the extreme loads (95th percentile). Compared with spar-type floating wind turbines, the response reduction ratios show that the application of TMD device on semi-submersible floating wind turbines is equally promising.
Acknowledgments
This study was supported by the National Natural Science Foundation of China (51278161, 51308167), and Shenzhen Knowledge innovation program (KQJSCX20160226201838).
Author Contributions
Yiqing Xiao and Chao Li conceived the idea and designed the framework; Tongyi Zhuang and Shengtao Zhou set up the numerical model; Chao Li analyzed the simulation data; and Chao Li and Gang Hu wrote the paper.
Conflicts of Interest
The authors declare no conflict of interest.
Abbreviations
| Nomenclature | |
| Tangential acceleration for mass particle i | |
| Normal acceleration for mass particle i | |
| Equivalent added mass for DOF i with regard to DOF j | |
| Equivalent damping coefficient for DOF i with regard to DOF j | |
| Generalized force for DOF i due to effect or DOF j | |
| Generalized inertia for DOF i with regard to DOF j | |
| Equivalent stiffness coefficient for DOF i with regard to DOF j | |
| Generalized mass for DOF i with regard to DOF j | |
| Vertical distance between point and center of gravity of mass particle i | |
| Generalized moment for DOF i due to effect or DOF j | |
| Displacement of DOF i | |
| Rotation angle of DOF i | |
| Acronyms and Abbreviations | |
| crt | Centripetal effect |
| damp | Hydrodynamic damping effect |
| DEL | Damage equivalent load |
| ex | External effect on TMD |
| gr | Gravitational effect |
| LM | Levenberg-Marquardt algorithm |
| p | DOF of platform pitch motion |
| restore | Hydrostatic restoring effect |
| sg | DOF of platform surge motion |
| t | DOF of tower fore-aft bending |
| TMD | DOF of TMD motion |
| TTD | Tower top displacement |
References
- Spencer, B.F.; Nagarajaiah, S. State of the art of structural control. J. Struct. Eng. 2003, 129, 845–856. [Google Scholar] [CrossRef]
- Liang, S.G.; Li, Q.S.; Qu, W.L. Control of 3-D coupled responses of wind-excited tall buildings by a spatially placed TLCD system. Wind Struct. 2000, 3, 193–207. [Google Scholar] [CrossRef]
- Colwell, S.; Basu, B. Tuned liquid column dampers in offshore wind turbines for structural control. Eng. Struct. 2009, 31, 358–368. [Google Scholar] [CrossRef]
- Liu, K.; Liang, H.; Ou, J. Numerical investigation of a tuned heave plate energy-harvesting system of a semi-submersible platform. Energies 2016, 9, 82. [Google Scholar] [CrossRef]
- Lee, H.H.; Juang, H.H. Experimental study on the vibration mitigation of offshore tension leg platform system with UWTLCD. Smart Struct. Syst. 2012, 9, 71–104. [Google Scholar] [CrossRef]
- Stewart, G.; Lackner, M. Offshore wind turbine load reduction employing optimal passive tuned mass damping systems. IEEE Trans. Control Syst. Technol. 2013, 21, 1090–1104. [Google Scholar] [CrossRef]
- Lackner, M.A.; Rotea, M.A. Structural control of floating wind turbines. Mechatronics 2011, 21, 704–719. [Google Scholar] [CrossRef]
- Jonkman, J.; Matha, D. A quantitative comparison of the responses of three floating platforms. In Proceedings of the European Offshore Wind 2009 Conference and Exhibition, Stockholm, Sweden, 14–16 September 2009. [Google Scholar]
- He, E.M.; Hu, Y.Q.; Zhang, Y. Optimization design of tuned mass damper for vibration suppression of a barge-type offshore floating wind turbine. J. Eng. Marit. Environ. 2017, 231, 302–315. [Google Scholar] [CrossRef]
- Li, X.; Gao, H. Load mitigation for a floating wind turbine via generalized h-infinity structural control. IEEE Trans. Ind. Electron. 2016, 63, 332–342. [Google Scholar] [CrossRef]
- Si, Y.; Karimi, H.R.; Gao, H. Modeling and parameter analysis of the OC3-hywind floating wind turbine with a tuned mass damper in nacelle. J. Appl. Math. 2013, 2013, 1–10. [Google Scholar] [CrossRef]
- Si, Y.; Karimi, H.R.; Gao, H. Modelling and optimization of a passive structural control design for a spar-type floating wind turbine. Eng. Struct. 2014, 69, 168–182. [Google Scholar] [CrossRef]
- Dinh, V.; Basu, B. Passive control of floating offshore wind turbine nacelle and spar vibrations by multiple tuned mass dampers. Struct. Control Health Monit. 2015, 22, 152–176. [Google Scholar] [CrossRef]
- Roddier, D.; Cermelli, C.; Aubault, A.; Weinstein, A. WindFloat: A floating foundation for offshore wind turbines. J. Renew. Sustain. Energy 2010, 2, 033104. [Google Scholar] [CrossRef]
- Jonkman, J.M. Dynamics of offshore floating wind turbines-model development and verification. Wind Energy 2009, 12, 459–492. [Google Scholar] [CrossRef]
- Butterfield, W.; Jonkman, J.; Musial, W.; Scott, G. Definition of a 5-MW Reference Wind Turbine for Offshore System Development; Technical Report NREL/TP-500-38060; National Renewable Energy Laboratory: Golden, CO, USA, 2009. [Google Scholar]
- Robertson, A.; Jonkman, J.; Masciola, M.; Song, H.; Goupee, A.; Coulling, A.; Luan, C. Definition of the Semisubmersible Floating System for Phase II of OC4; Technical Report NREL/TP-5000-60601; National Renewable Energy Laboratory: Golden, CO, USA, 2014. [Google Scholar]
- Jonkman, J.M. Dynamics Modeling and Loads Analysis of an Offshore Floating Wind Turbine; Technical Report, NREL/TP-500-41958; National Renewable Energy Laboratory: Golden, CO, USA, 2007. [Google Scholar]
- Morison, J.R.; Obrien, M.P.; Johnson, J.W.; Schaaf, S.A. The force exerted by surface waves on piles. Trans. Am. Inst. Min. Metall. Eng. 1950, 189, 149–154. [Google Scholar] [CrossRef]
- La Cava, W.; Lackner, M.A. Theory Manual for the Tuned Mass Damper Module in FAST v8; University of Massachusetts Amherst: Amherst, MA, USA, 2015. [Google Scholar]
- Stewart, G.M.; Lackner, M.A. The effect of actuator dynamics on active structural control of offshore wind turbines. Eng. Struct. 2011, 33, 1807–1816. [Google Scholar] [CrossRef]
- Gavin, H.P. The Levenberg-Marquardt Method for Nonlinear Least Squares Curve-Fitting Problems. Available online: http://people.duke.edu/~hpgavin/ce281/lm.pdf (accessed on 19 February 2017).
- Stewart, G.M.; Lackner, M.A. The impact of passive tuned mass dampers and wind–Wave misalignment on offshore wind turbine loads. Eng. Struct. 2014, 73, 54–61. [Google Scholar] [CrossRef]
- Tsai, H.; Lin, G. Optimum tuned-mass dampers for minimizing steady-state response of support-excited and damped systems. Earthq. Eng. Struct. Dyn. 1993, 22, 957–973. [Google Scholar] [CrossRef]
- Chipperfield, A.J.; Fleming, P.J. The MATLAB genetic algorithm toolbox. In Proceedings of the IEE Colloquium on Applied Control Techniques Using MATLAB, London, UK, 24 January 1995. [Google Scholar]
- Stewart, G.M. Load Reduction of Floating Wind Turbines Using Tuned Mass Dampers; University of Massachusetts Amherst: Amherst, MA, USA, 2012. [Google Scholar]
- Lackner, M.A.; Rotea, M.A. Passive structural control of offshore wind turbines. Wind Energy 2011, 14, 373–388. [Google Scholar] [CrossRef]
- Hayman, G. Mlife Theory Manual for Version 1.00; National Renewable Energy Laboratory: Golden, CO, USA, 2012. [Google Scholar]
- Coulling, A.J.; Goupee, A.J.; Robertson, A.N.; Jonkman, J.M.; Dagher, H.J. Validation of a FAST semi-submersible floating wind turbine numerical model with DeepCwind test data. J. Renew. Sustain. Energy 2013, 5, 023116. [Google Scholar] [CrossRef]
Figure 1.
Diagram of DeepCwind semi-submersible.

Figure 2.
Schematic of the OC4-DeepCwind simplified dynamic model.
Figure 3.
Iteration process in parameter identification.

Figure 4.
Comparison of responses between the simplified model and FAST simulation with inactive tuned mass damper (TMD): (a) 5° initial platform pitch; and (b) 10° initial platform pitch.
Figure 4.
Comparison of responses between the simplified model and FAST simulation with inactive tuned mass damper (TMD): (a) 5° initial platform pitch; and (b) 10° initial platform pitch.

Figure 5.
Comparison of 5° pitch free decay responses between the simplified model and FAST simulation with active TMD: (a) without TMD stops; and (b) with TMD stops.
Figure 5.
Comparison of 5° pitch free decay responses between the simplified model and FAST simulation with active TMD: (a) without TMD stops; and (b) with TMD stops.

Figure 6.
3D Surface of for different TMD mass (a) 10,000 kg; (b) 20,000 kg.
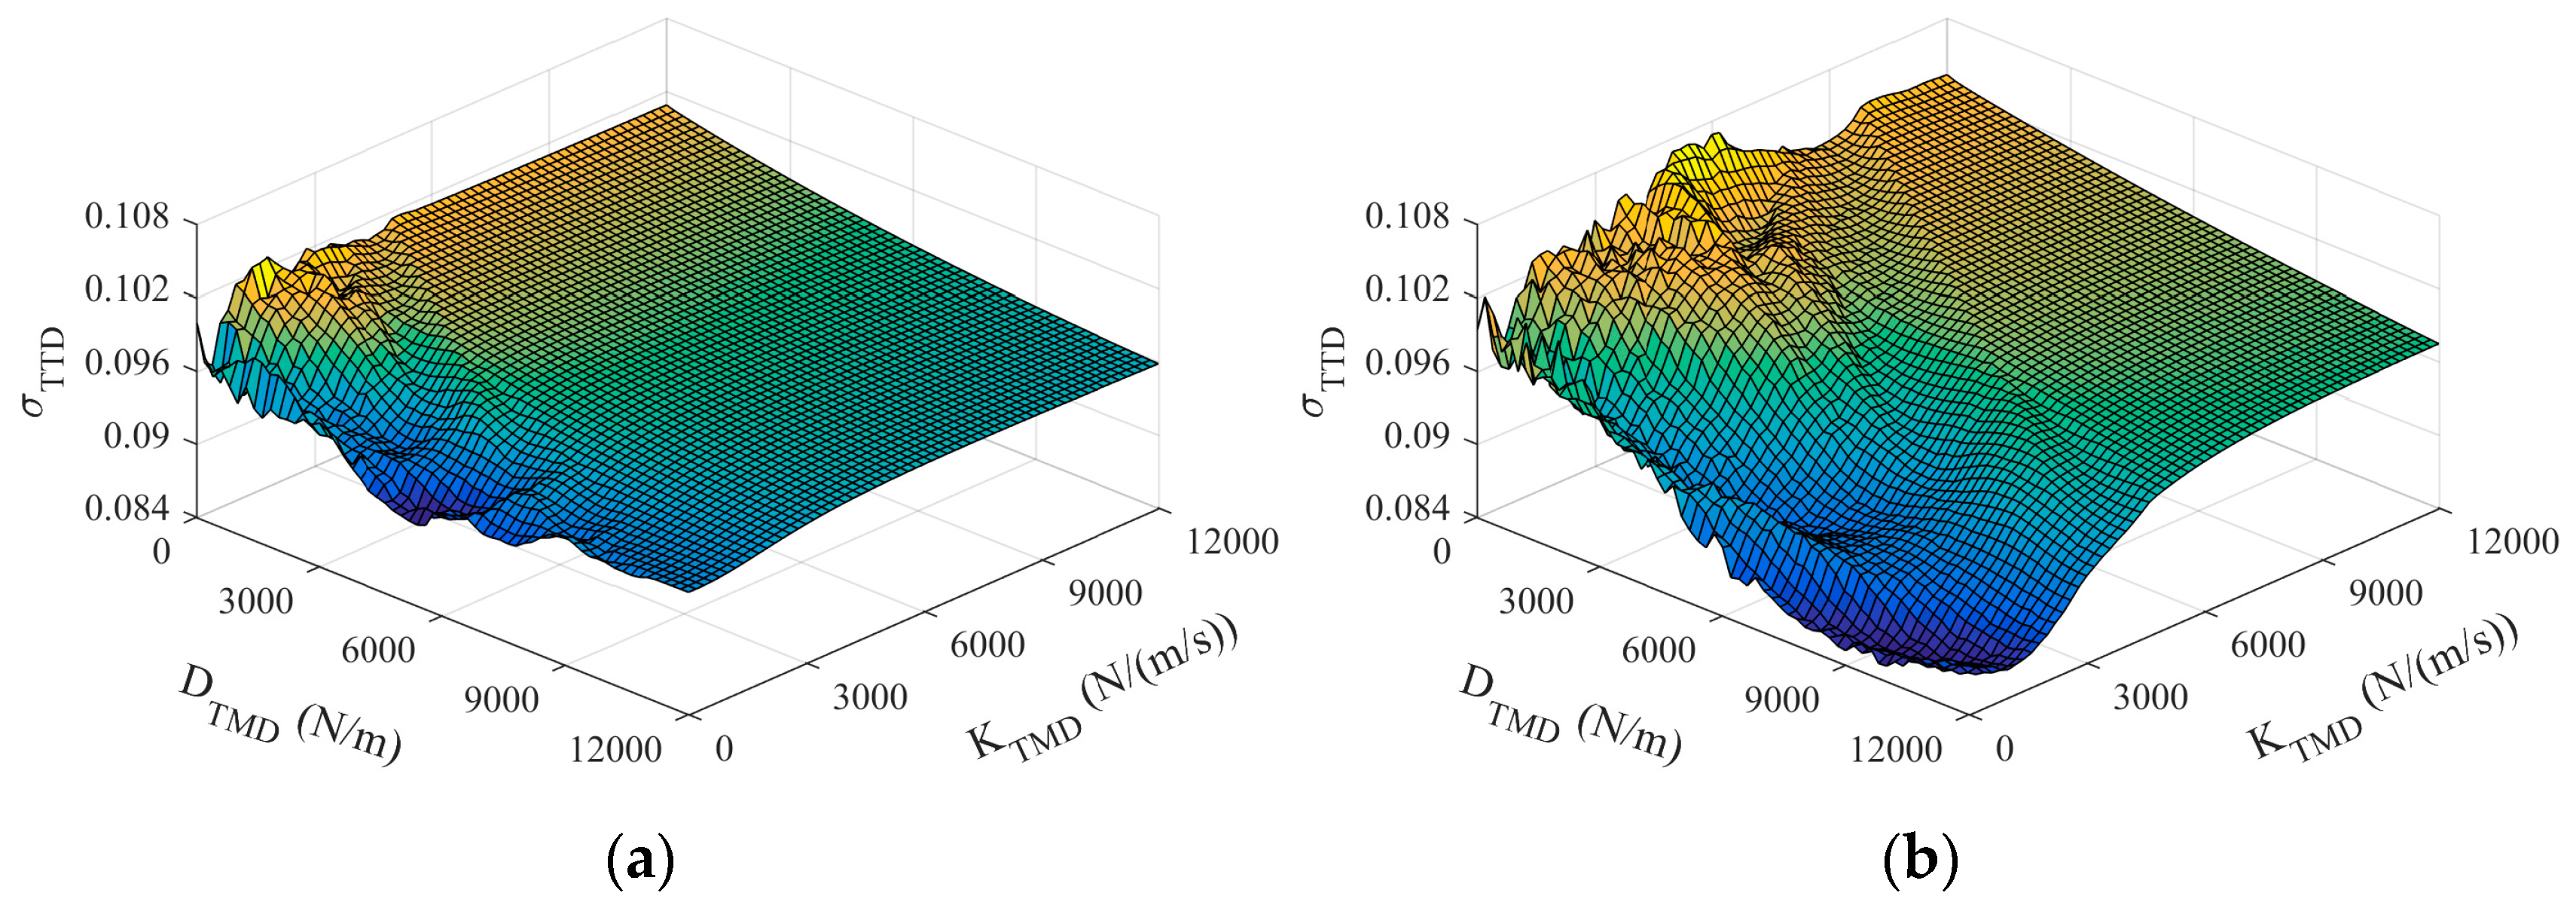
Figure 7.
Time-history samples of environmental load conditions: (a) wind velocity; and (b) wave height.
Figure 7.
Time-history samples of environmental load conditions: (a) wind velocity; and (b) wave height.
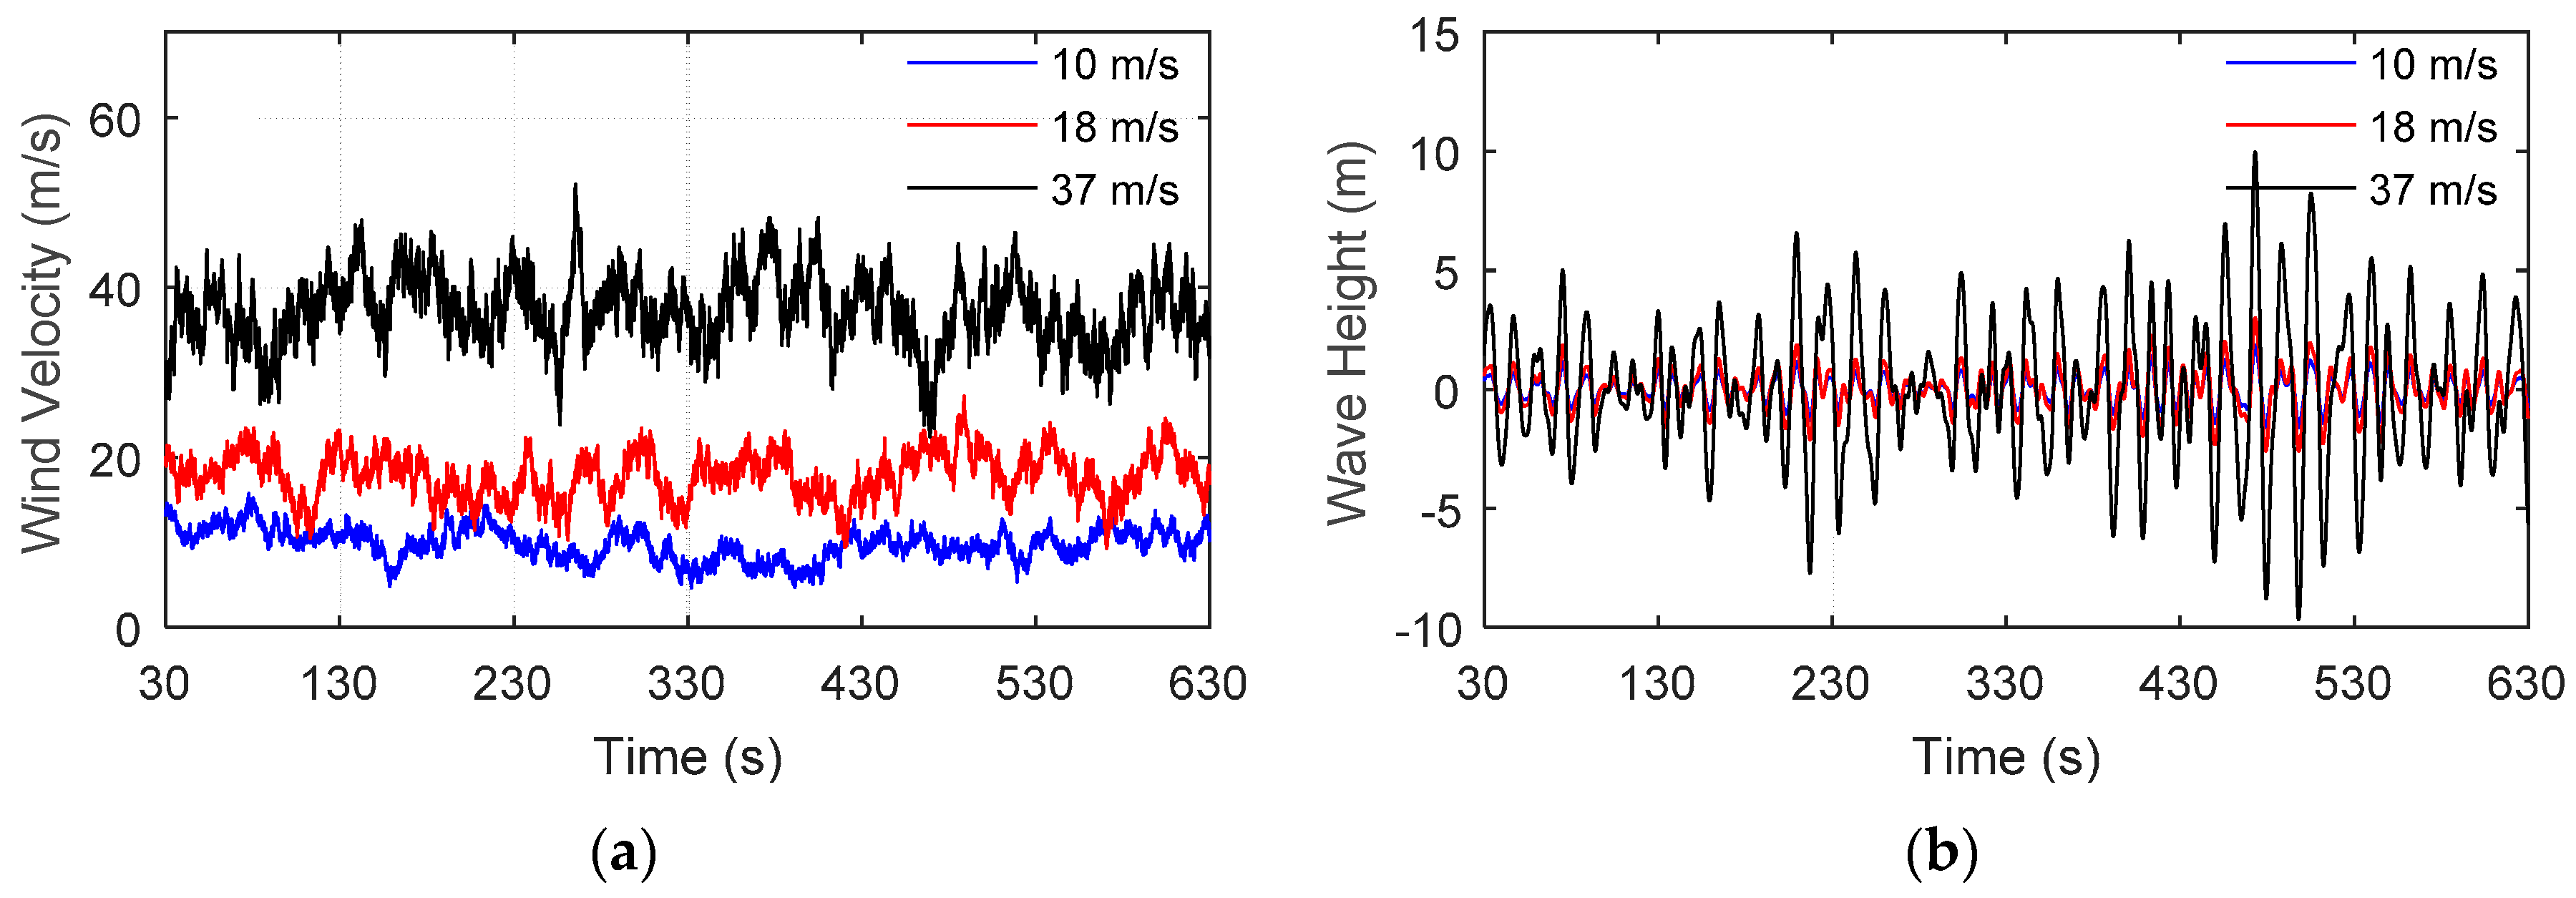
Figure 8.
Time-histories of response under three load conditions with and without TMD: (a) 10 m/s; (b) 18 m/s; and (c) 37 m/s.
Figure 8.
Time-histories of response under three load conditions with and without TMD: (a) 10 m/s; (b) 18 m/s; and (c) 37 m/s.
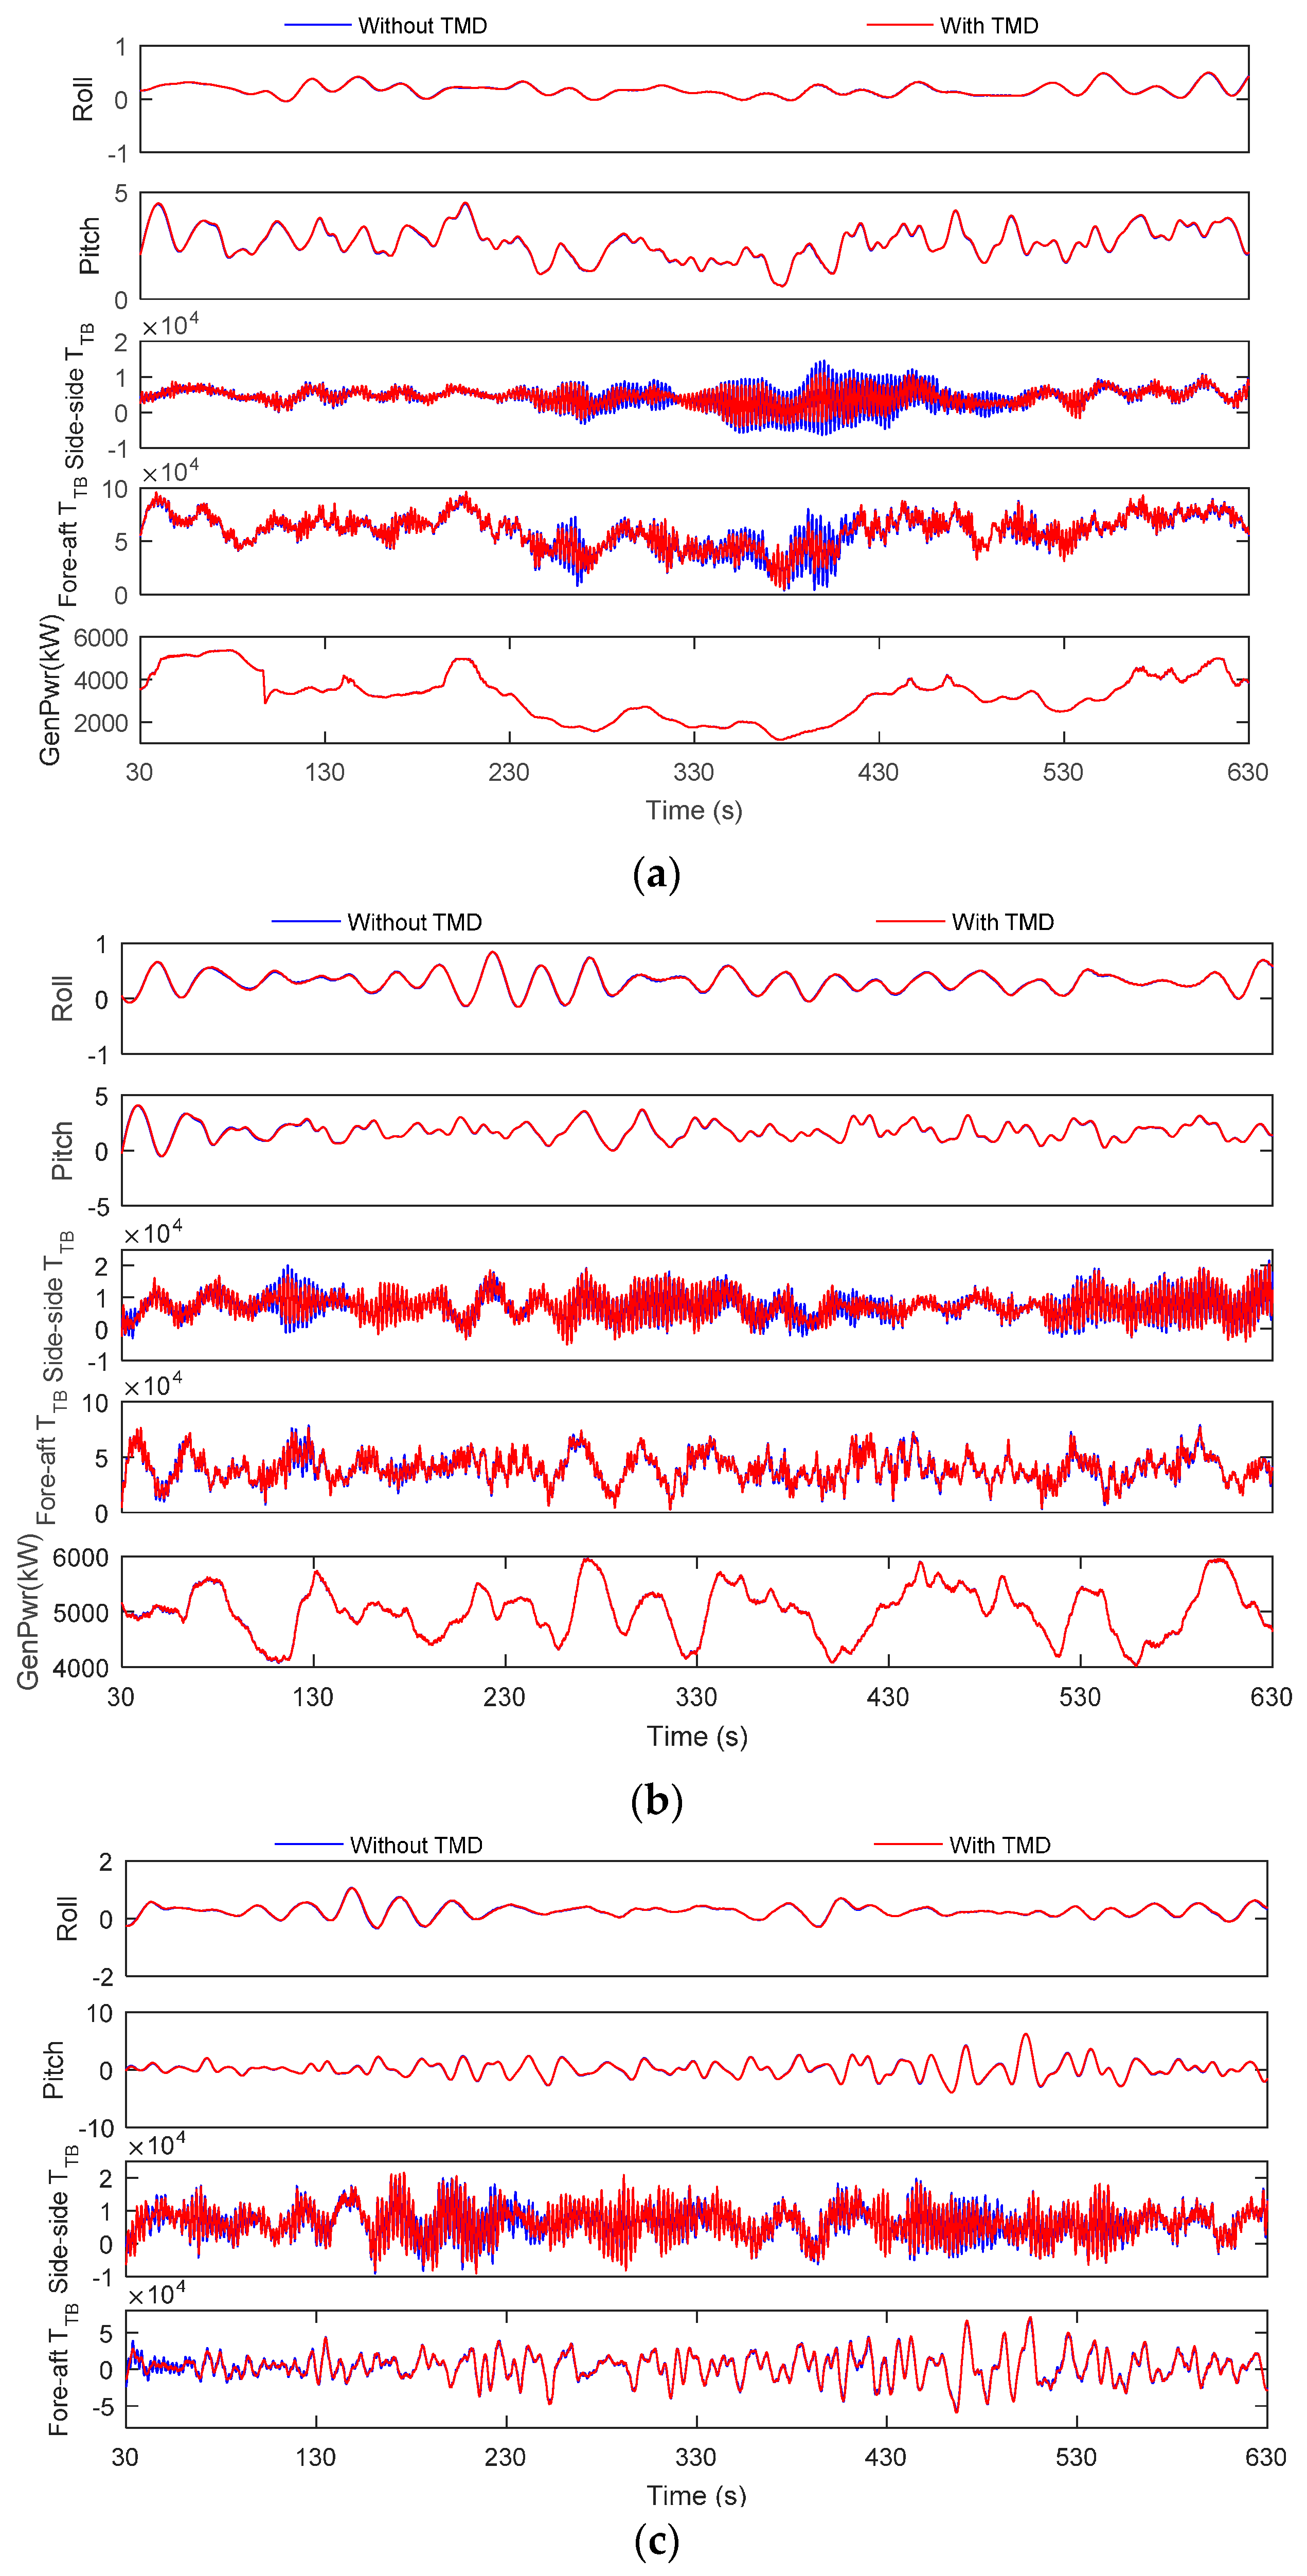
Figure 9.
Power spectral density of tower base moments under rated operation condition with and without TMD: (a) Side–side; and (b) Fore–aft.
Figure 9.
Power spectral density of tower base moments under rated operation condition with and without TMD: (a) Side–side; and (b) Fore–aft.

Table 1.
Properties of the OC4-DeepCwind model.
| Item | Value |
|---|---|
| Rating | 5 MW |
| Rotor configuration | Upwind, 3 blades |
| Cut-in, rated, cut-out wind speed | 3 m/s, 11.4 m/s, 25 m/s |
| Hub height above sea level (SL) | 90 m |
| Total draft below SL | 20 m |
| Platform mass (including ballast) | 1.3473 × 10⁷ kg |
| Elevation of tower base above SL | 10 m |
| Tower and tower-top mass | 599,718 kg |
| Height of tower | 77.6 m |
| Number of mooring lines | 3 |
| Depth to fairleads below SL | 14 m |
| Nacelle dimensions | 18 m × 6 m × 6 m |
Table 2.
Known parameters of the dynamic model.
| Parameter | Value | Parameter | Value |
|---|---|---|---|
| 1.3661 × 10⁷ kg | 9.4614 × 10⁹ kg∙m2 | ||
| 5.9911 × 10⁵ kg | g | 9.806 N/m2 | |
| 13.46 m | 6.49 × 10⁶ kg | ||
| 60.29 m | −8.51 × 10⁷ kg∙m2 | ||
| 10 m | −8.51 × 10⁷ kg∙m2 | ||
| 77.6 m | 7.21 × 10⁹ kg∙m2 |
Table 3.
Initial values and estimation results of the undetermined parameters.
| Parameters | Initial Value | Estimation | Parameters | Initial Value | Estimation |
|---|---|---|---|---|---|
| 2.6368 × 10⁹ | 2.9359 × 10⁹ | 4.6000 × 10⁷ | 6.9515 × 10⁷ | ||
| −2.9330 × 10⁸ | −3.0746 × 10⁸ | 1.5000 × 10¹⁰ | 3.4079 × 10¹⁰ | ||
| 7.0800 × 10⁴ | 6.6026 × 10⁴ | −4.0000 × 10⁶ | 8.7278 × 10⁶ | ||
| −1.0800 × 10⁵ | −2.4605 × 10⁵ | −6.0000 × 10⁷ | −4.5968 × 10⁷ | ||
| 1.6000 × 10¹⁰ | 1.5944 × 10¹⁰ | 3.5000 × 10⁵ | 1.0129 × 10⁶ |
Table 4.
Optimal results of spring and damping coefficients by method of exhaustion.
| Mass (kg) | Optimization Value | (Hz) | (m) | Reduction Ratio | ||
|---|---|---|---|---|---|---|
| Spring Coefficient (N/m) | Damping Coefficient (N/(m/s)) | |||||
| 6000 | 200 | 3400 | 0.02906 | 155.2% | 0.09318 | 5.86% |
| 8000 | 100 | 3900 | 0.01779 | 218.0% | 0.09176 | 7.29% |
| 10,000 | 300 | 5200 | 0.02757 | 150.1% | 0.09045 | 8.61% |
| 12,000 | 200 | 6200 | 0.02055 | 200.1% | 0.08923 | 9.85% |
| 14,000 | 100 | 7100 | 0.01345 | 300.0% | 0.08808 | 11.01% |
| 16,000 | 500 | 7900 | 0.02813 | 139.7% | 0.08669 | 12.41% |
| 18,000 | 0 | 8600 | 0 | - | 0.08586 | 13.25% |
| 20,000 | 800 | 10,100 | 0.03183 | 126.3% | 0.08489 | 14.23% |
Table 5.
Optimized results by genetic algorithm.
| Mass (kg) | Optimized Values | (Hz) | (m) | Reduction Ratio | ||
|---|---|---|---|---|---|---|
| Spring Coefficient (N/m) | Damping Coefficient (N/(m/s)) | |||||
| 6000 | 43,207 | 1580 | 0.4271 | 4.907% | 0.08838 | 10.71% |
| 8000 | 56,970 | 2419 | 0.4247 | 5.665% | 0.08824 | 10.85% |
| 10,000 | 70,429 | 3367 | 0.4224 | 6.344% | 0.08825 | 10.84% |
| 12,000 | 83,596 | 4410 | 0.4201 | 6.962% | 0.08834 | 10.75% |
| 14,000 | 96,477 | 5534 | 0.4178 | 7.529% | 0.08850 | 10.58% |
| 16,000 | 109,078 | 6720 | 0.4156 | 8.043% | 0.08868 | 10.40% |
| 18,000 | 121,406 | 7984 | 0.4133 | 8.540% | 0.08890 | 10.18% |
| 20,000 | 133,467 | 9293 | 0.4111 | 8.993% | 0.08914 | 9.94% |
Table 6.
Realistic environmental load conditions.
| Case | Rated Operation | Maximum Wind Operation | Self-Survival |
|---|---|---|---|
| Mean wind speed at hub height (m/s) | 10 | 18 | 37 |
| Turbulence intensity | 18% | 15% | 11% |
| Roughness coefficient | 0.14 | 0.14 | 0.11 |
| Significant wave height (m) | 2.3 | 3.7 | 13.8 |
| Peak-spectral period of incident waves (s) | 14 | 14 | 19 |
Table 7.
Response reduction ratios of multiple TMD devices.
| Case | Evaluation Index | Low Stiffness TMD Mass (kg) | High Stiffness TMD Mass (kg) | ||||
|---|---|---|---|---|---|---|---|
| 8000 | 10,000 | 20,000 | 8000 | 10,000 | 20,000 | ||
| 10 m/s | 95th Pitch | −0.88% | −1.25% | −2.88% | −0.37% | −0.59% | −1.55% |
| 95th Roll | −0.45% | −0.68% | −1.17% | −0.50% | −0.64% | −0.92% | |
| 95th fore-aft | −1.04% | −1.30% | −2.71% | −0.83% | −1.06% | −2.00% | |
| DEL of side-side | 24.09% | 29.20% | 37.86% | 29.84% | 32.78% | 39.32% | |
| DEL of fore-aft | 1.54% | 1.48% | 2.39% | 2.51% | 3.77% | 7.78% | |
| 18 m/s | 95th Pitch | −0.81% | −0.89% | −0.57% | −0.60% | −0.75% | −1.41% |
| 95th Roll | 0.12% | 0.02% | −1.17% | 0.36% | 0.33% | −0.52% | |
| 95th fore-aft | −1.25% | −1.51% | −3.18% | −0.48% | −0.54% | −1.71% | |
| DEL of side-side | 4.25% | 6.79% | 18.50% | 1.16% | 3.08% | 15.32% | |
| DEL of fore-aft | −1.26% | −1.40% | −3.62% | 1.58% | 1.43% | 0.18% | |
| 37 m/s | 95th Pitch | 0.04% | 0.09% | 0.70% | 0.24% | 0.39% | 0.63% |
| 95th Roll | −0.41% | −0.57% | −1.05% | −0.41% | −0.55% | −1.04% | |
| 95th fore-aft | 0.12% | 0.99% | 1.60% | −1.05% | −1.46% | −2.97% | |
| DEL of side-side | −1.82% | −1.80% | −2.27% | −1.39% | −1.48% | −1.67% | |
| DEL of fore-aft | −1.40% | −1.90% | −4.62% | −0.23% | −0.55% | −1.97% | |
Table 8.
Comparison of TMD performances between spar and semi-submersible foundations.
| Case | Evaluation Index | OC3-Hywind (Spar) | OC4-DeepCwind (Semi-Submersible) |
|---|---|---|---|
| 10 m/s | 95th Pitch | −2.08% | −1.55% |
| 95th Roll | −1.67% | −0.92% | |
| 95th fore-aft | −2.00% | −2.00% | |
| DEL of side-side | 32.18% | 39.32% | |
| DEL of fore-aft | 6.35% | 7.78% | |
| 18 m/s | 95th Pitch | −1.04% | −1.41% |
| 95th Roll | 6.58% | −0.52% | |
| 95th fore-aft | −3.25% | −1.71% | |
| DEL of side-side | 21.24% | 15.32% | |
| DEL of fore-aft | 3.35% | 0.18% | |
| 37 m/s | 95th Pitch | 4.41% | 0.63% |
| 95th Roll | −0.30% | 1.04% | |
| 95th fore-aft | −0.77% | −2.97% | |
| DEL of side-side | 0.18% | 1.67% | |
| DEL of fore-aft | 1.22% | 1.97% |
© 2017 by the authors. Licensee MDPI, Basel, Switzerland. This article is an open access article distributed under the terms and conditions of the Creative Commons Attribution (CC BY) license (http://creativecommons.org/licenses/by/4.0/).
Share and Cite
MDPI and ACS Style
Li, C.; Zhuang, T.; Zhou, S.; Xiao, Y.; Hu, G. Passive Vibration Control of a Semi-Submersible Floating Offshore Wind Turbine. Appl. Sci. 2017, 7, 509. https://doi.org/10.3390/app7060509
AMA Style
Li C, Zhuang T, Zhou S, Xiao Y, Hu G. Passive Vibration Control of a Semi-Submersible Floating Offshore Wind Turbine. Applied Sciences. 2017; 7(6):509. https://doi.org/10.3390/app7060509
Chicago/Turabian StyleLi, Chao, Tongyi Zhuang, Shengtao Zhou, Yiqing Xiao, and Gang Hu. 2017. "Passive Vibration Control of a Semi-Submersible Floating Offshore Wind Turbine" Applied Sciences 7, no. 6: 509. https://doi.org/10.3390/app7060509
Note that from the first issue of 2016, this journal uses article numbers instead of page numbers. See further details here.