1. Introduction
There exist few studies related to using fiber Bragg grating sensor technology to perform structural health monitoring for hydraulic structures in a harbor, as well as on mechanical performance monitoring during the pile driving process. A wharf is one of the most important hydraulic structures in seaports, and piles are key components of a high-piled wharf to support the service load. Therefore, studying the performance of the mechanics during the pile driving process is the key means to determining the mechanic status to maintain the safety of the wharf.
A high-piled wharf structure is one of most important types of wharf structures and is widely adopted in ports with soft soil foundations. However, with soil creep, the lateral displacement of the wharf increases under the service loads, which will cause damage in the wharf structure. Therefore, conducting mechanical performance monitoring of piles when pile driving is an important means to determine the original mechanical status of the structure, which is beneficial in assessing the safety of the wharf.
At present, optical fiber sensors are most often used in structural mechanical performance testing [
1,
2,
3]. Particularly, an optical-fiber Bragg grating (FBG) sensor is used to monitor the structural strain, temperature, angle, and so on [
4,
5]. Writing Bragg gratings into the core of a fiber was first demonstrated by Hill et al. [
6]. The fabrication of fiber Bragg gratings in a fiber core was reported in 1989, which was a significant milestone for fiber Bragg grating (FBG) sensor development [
7]. The working principle of FBG sensors is that a series of parallel gratings is printed into the core of an optical fiber, and a specific wavelength of light is reflected from the sensors when a broadband light illuminates them. Since the wavelength reflected at the peak is proportional to the grating period, the axial strain can be measured through the peak shift and temperature. FBG sensors are immune to electromagnetic noise and radio interference [
2]. The ability to resist corrosion makes FBG sensors durable. The multiplexing capability and wavelength-encoded measure and information are distinct advantages of FBG sensors compared to other types of fiber optic sensors. FBG sensors can be easily multiplexed with a single string of optical fiber, which can accommodate tens of FBG sensors. In particular, FBG sensors are non-conductive and not significantly affected by water, so they are suitable for use in infrastructure served in the sea, whereas traditional electrical sensors have difficulty performing in water environments for extended periods of time. In this regard, the application of this new technology will lead to a significant improvement in the accuracy of measurements [
8]. However, the most common method for pile dynamic testing currently is to monitor driving with the PDA, and the method has gained wide acceptance given the clear advantages in terms of time and cost [
9]. The practical application of FBG sensors to actual port engineering structures has not been widely adopted, especially in pile driving monitoring, although the progress of fiber optic measurement is impressive [
10,
11,
12]. There are few articles reporting pile mechanical performance during driving using the FBG sensor technique.
The main purpose of this paper is to describe mechanical performance monitoring using the FBG sensor technique and analysis results of prestressed concrete piles during pile driving, which are driven for a newly-built high-piled wharf structure located in the Tianjin port of China. The wharf, which is named South 27# Wharf, is 390 m long and 75 m wide. It will be used for ore transportation and other bulk cargo shipping. The fiber-laser-based wavelength-division-multiplexed (WDM) FBG sensor interrogation techniques will be used in the project. The FBG strain sensors and FBG angle sensor are embedded in the body of precast prestressed concrete piles to measure the strain and obliquity angle data of the pile during driving. The experimental setup of FBG sensor arrays in the piles of the wharf and data analysis are all described. This study will play an important role in performance monitoring of precast prestressed concrete pile driving with the FBG technique and in promoting the development of pile driving monitoring technology in coastal ports.
2. Engineering Description
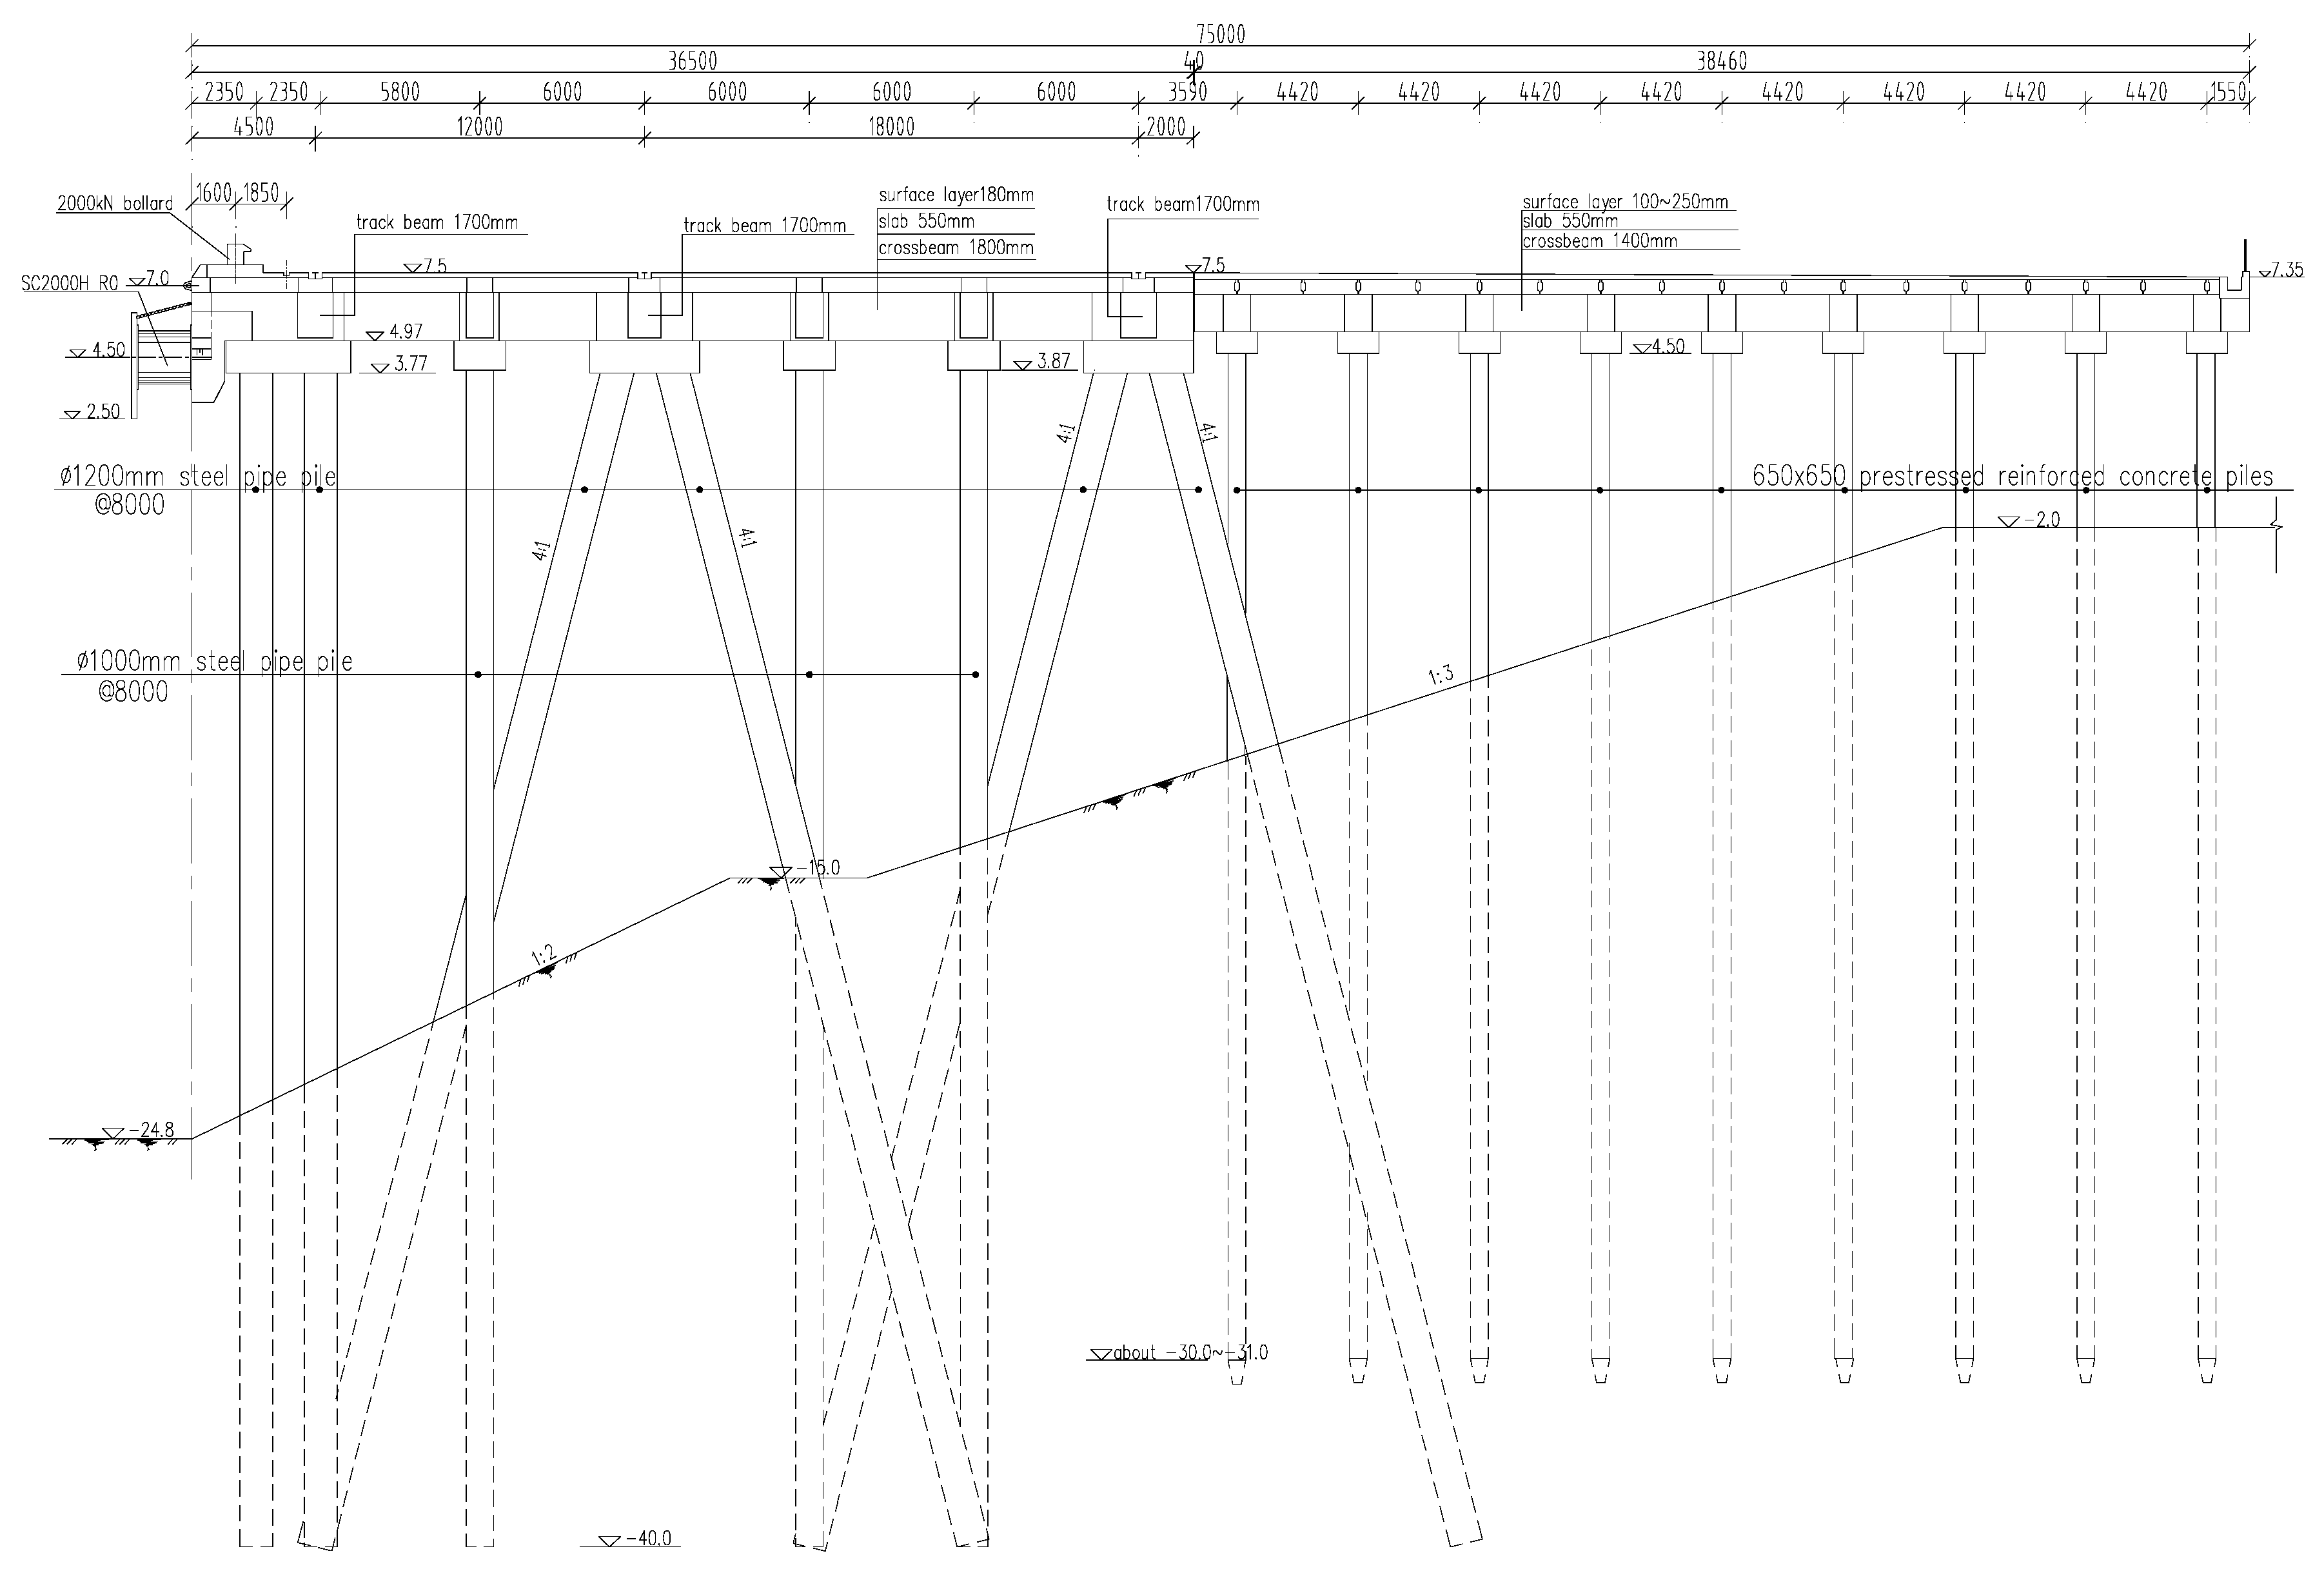
The South 27# Wharf is a high-piled wharf under construction in the Nanjiang Port of Tianjin Port in China, which is designed for bulk cargo transportation. The mechanical properties of this wharf structure are designed based on berthing 300,000 DWT bulk carriers. The South 27# wharf is 390 m long and 75 m wide; it consists of three continuous parts: a 390-m main wharf platform and two 73.3-m side approach bridges. The main wharf platform is divided into a front platform and a back platform based on the operating requirements. The front platform is 36.5 m wide, and the back platform is 38.5 m wide. The beams of the front platform are supported by steel pipe piles, whereas the beams of the back platform are supported by prestressed reinforced-concrete square piles. In each bent frame of the back platform, nine vertical prestressed reinforced-concrete piles are arranged with identical section sizes, which are shown in
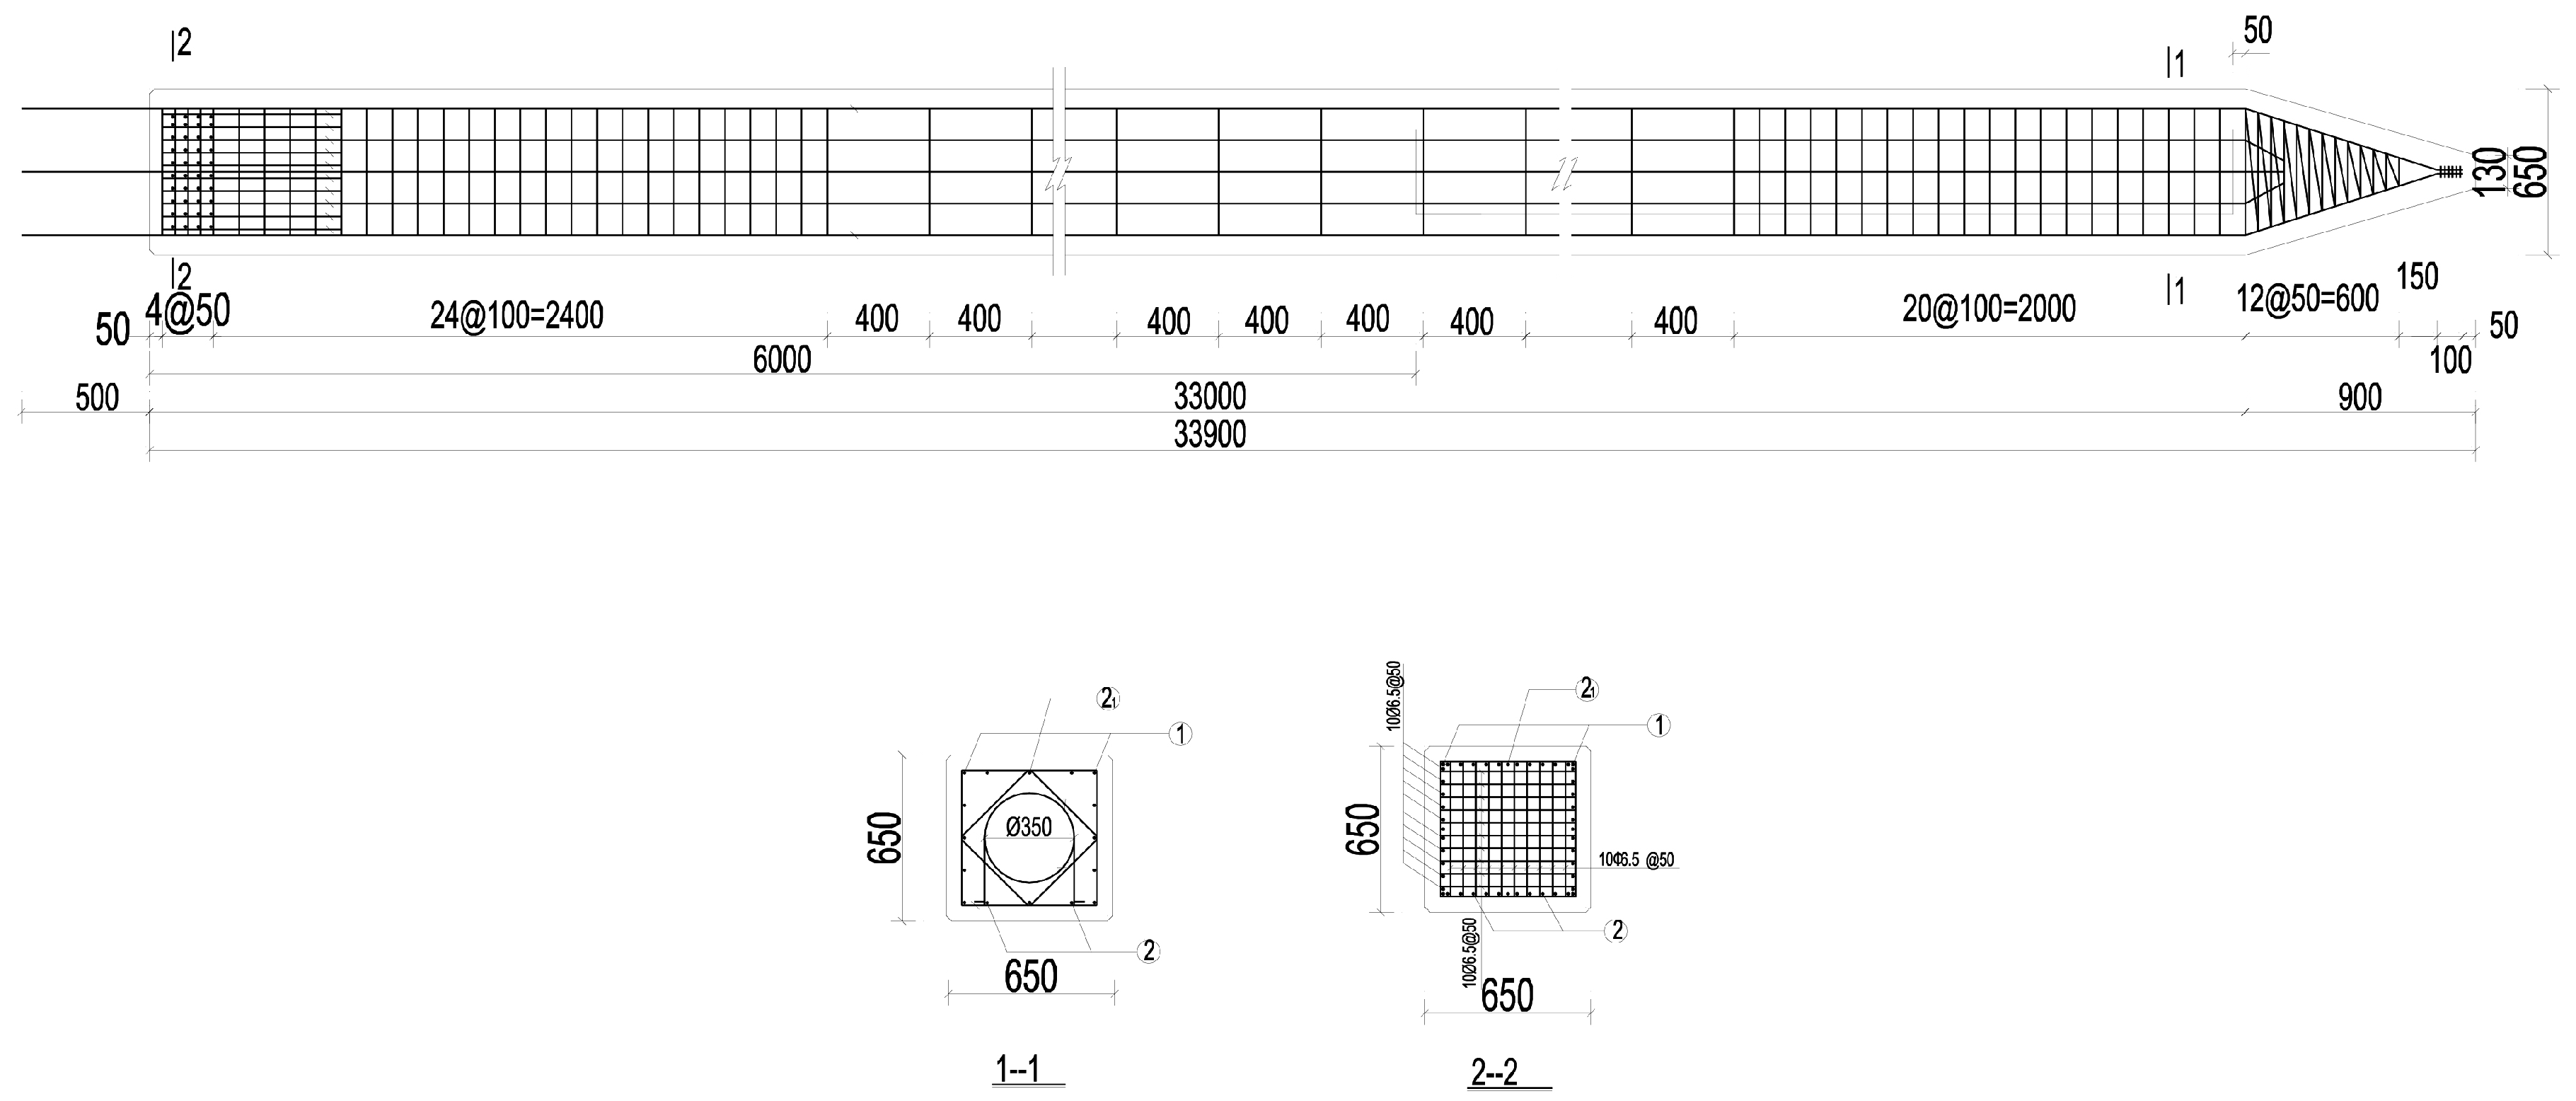
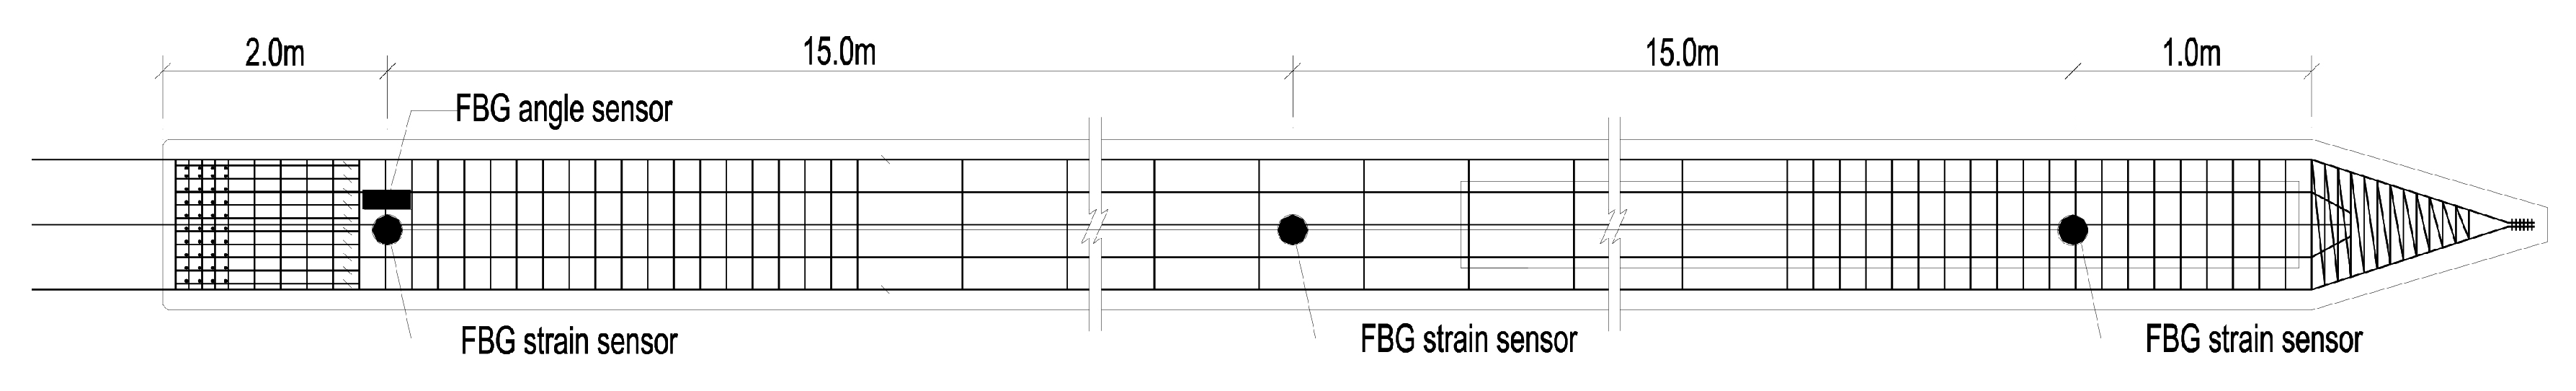
Figure 1. The FBG sensors are embedded in the body of precast prestressed concrete piles near the head, middle and tip to monitor the pile’s mechanical performance during pile driving. The details of the piles to be monitored are shown in
Figure 2. The length of the pile is 33.9 m and its cross-section size is 650 mm × 650 mm. The steel bars of No.1, No.2, and No.2’ in
Figure 2 are HRB400 prestressed reinforcement tensioned before concrete pouring, with the tension control stress of 450 MPa.
The mud surface elevation is −4.0 m where the pile was driven. From top to bottom of the soil layers, there is muck (thickness 7.0 m), mucky soil (thickness 3.2 m), silt (thickness 0.7 m), clay (thickness 3.5 m), silty clay (thickness 2.9 m), and silty-fine sand (thickness 31.4 m), respectively. The pile driven is fixed in the silty-fine sand layer, and the tip of the pile is located near the middle of this layer.
2.1. Test Methodology
The primary aim of the pile mechanical performance testing during pile driving was to identify the strain properties and propagation law of the strain wave during the entire pile driving process. The structural dynamic testing method [
13,
14] is used as a reference to measure the dynamic strain data during pile driving. Due to the setup of the FBG obliquity angle sensor near the head of the precast prestressed concrete pile, the angle data were also measured at the same time as the strain.
During pile driving, the pile hammer dropping to the head of the pile is just an external force to produce an initial velocity of the pile; then, the pile is made to vibrate, and the strain wave propagates in the longitudinal direction. In this process, the dynamic response of the strain and angle is acquired. This testing method is similar to the initial velocity excitation method in the structural modal testing [
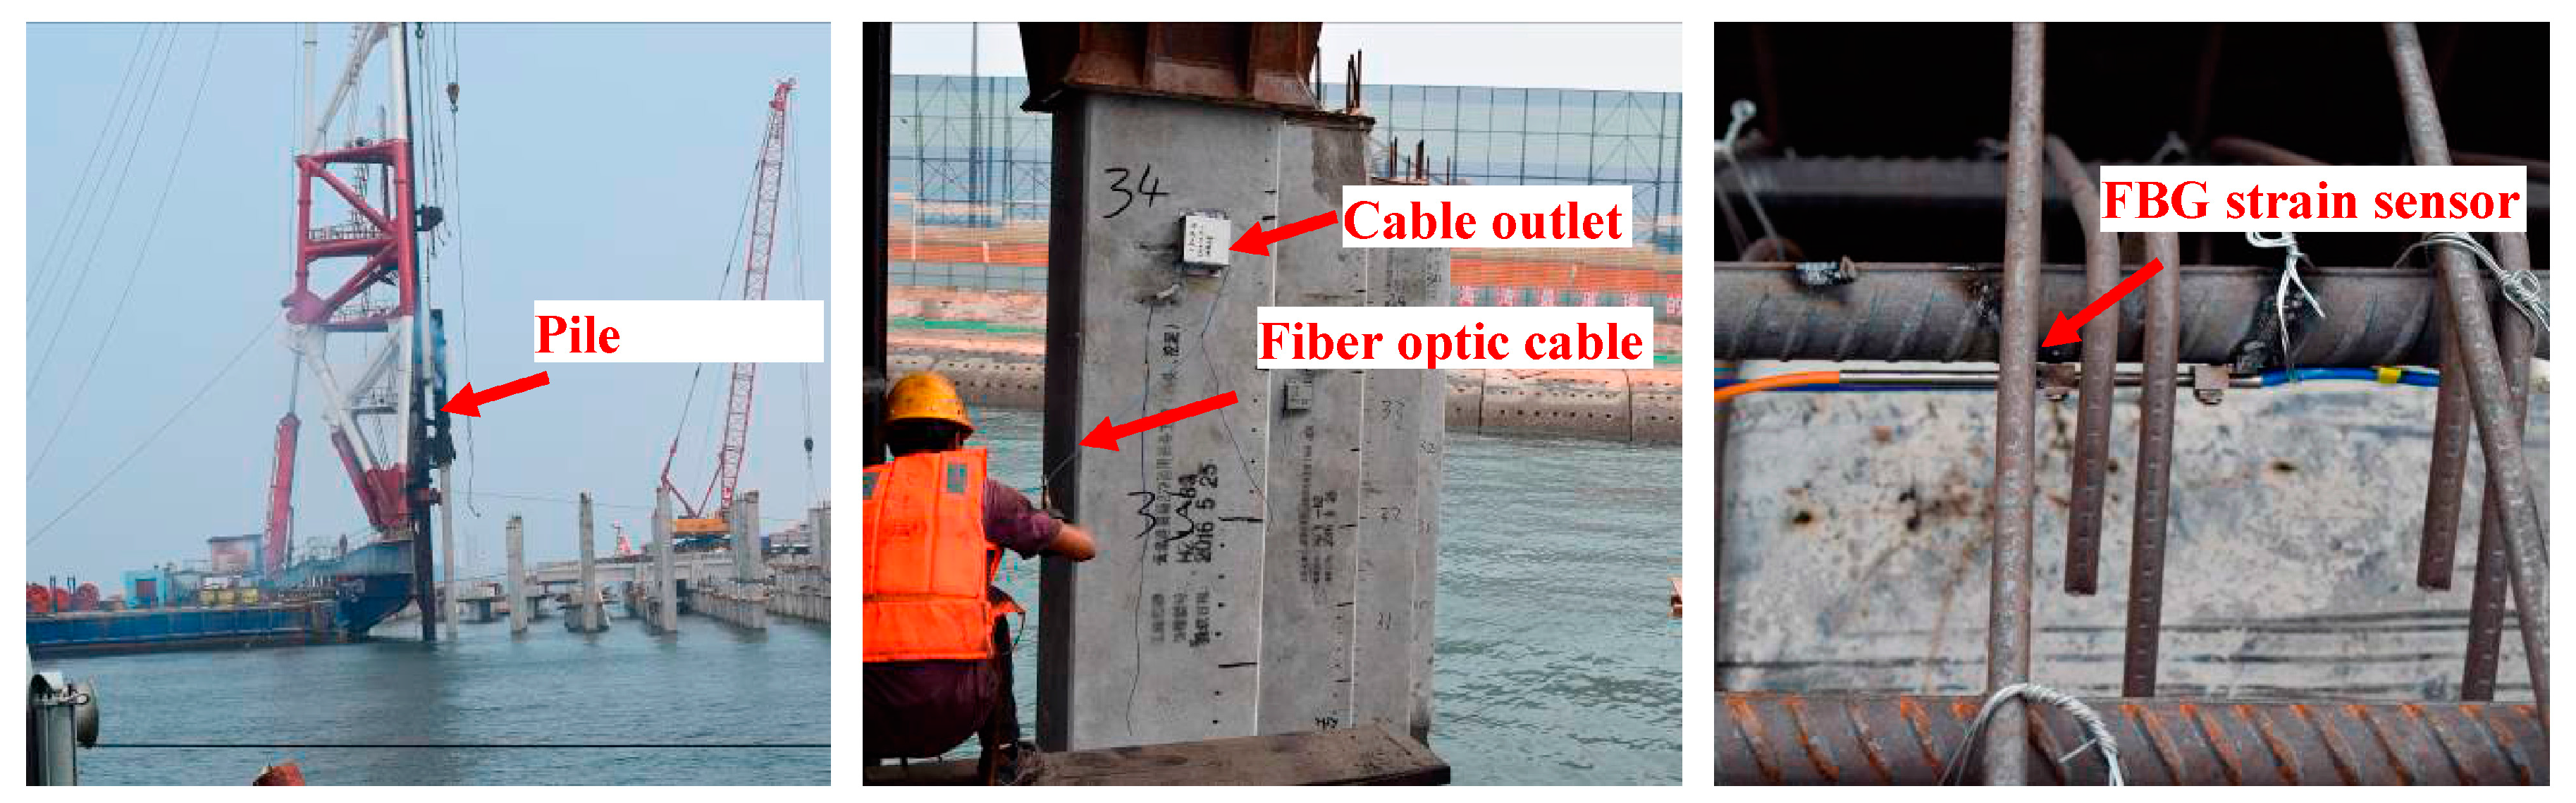
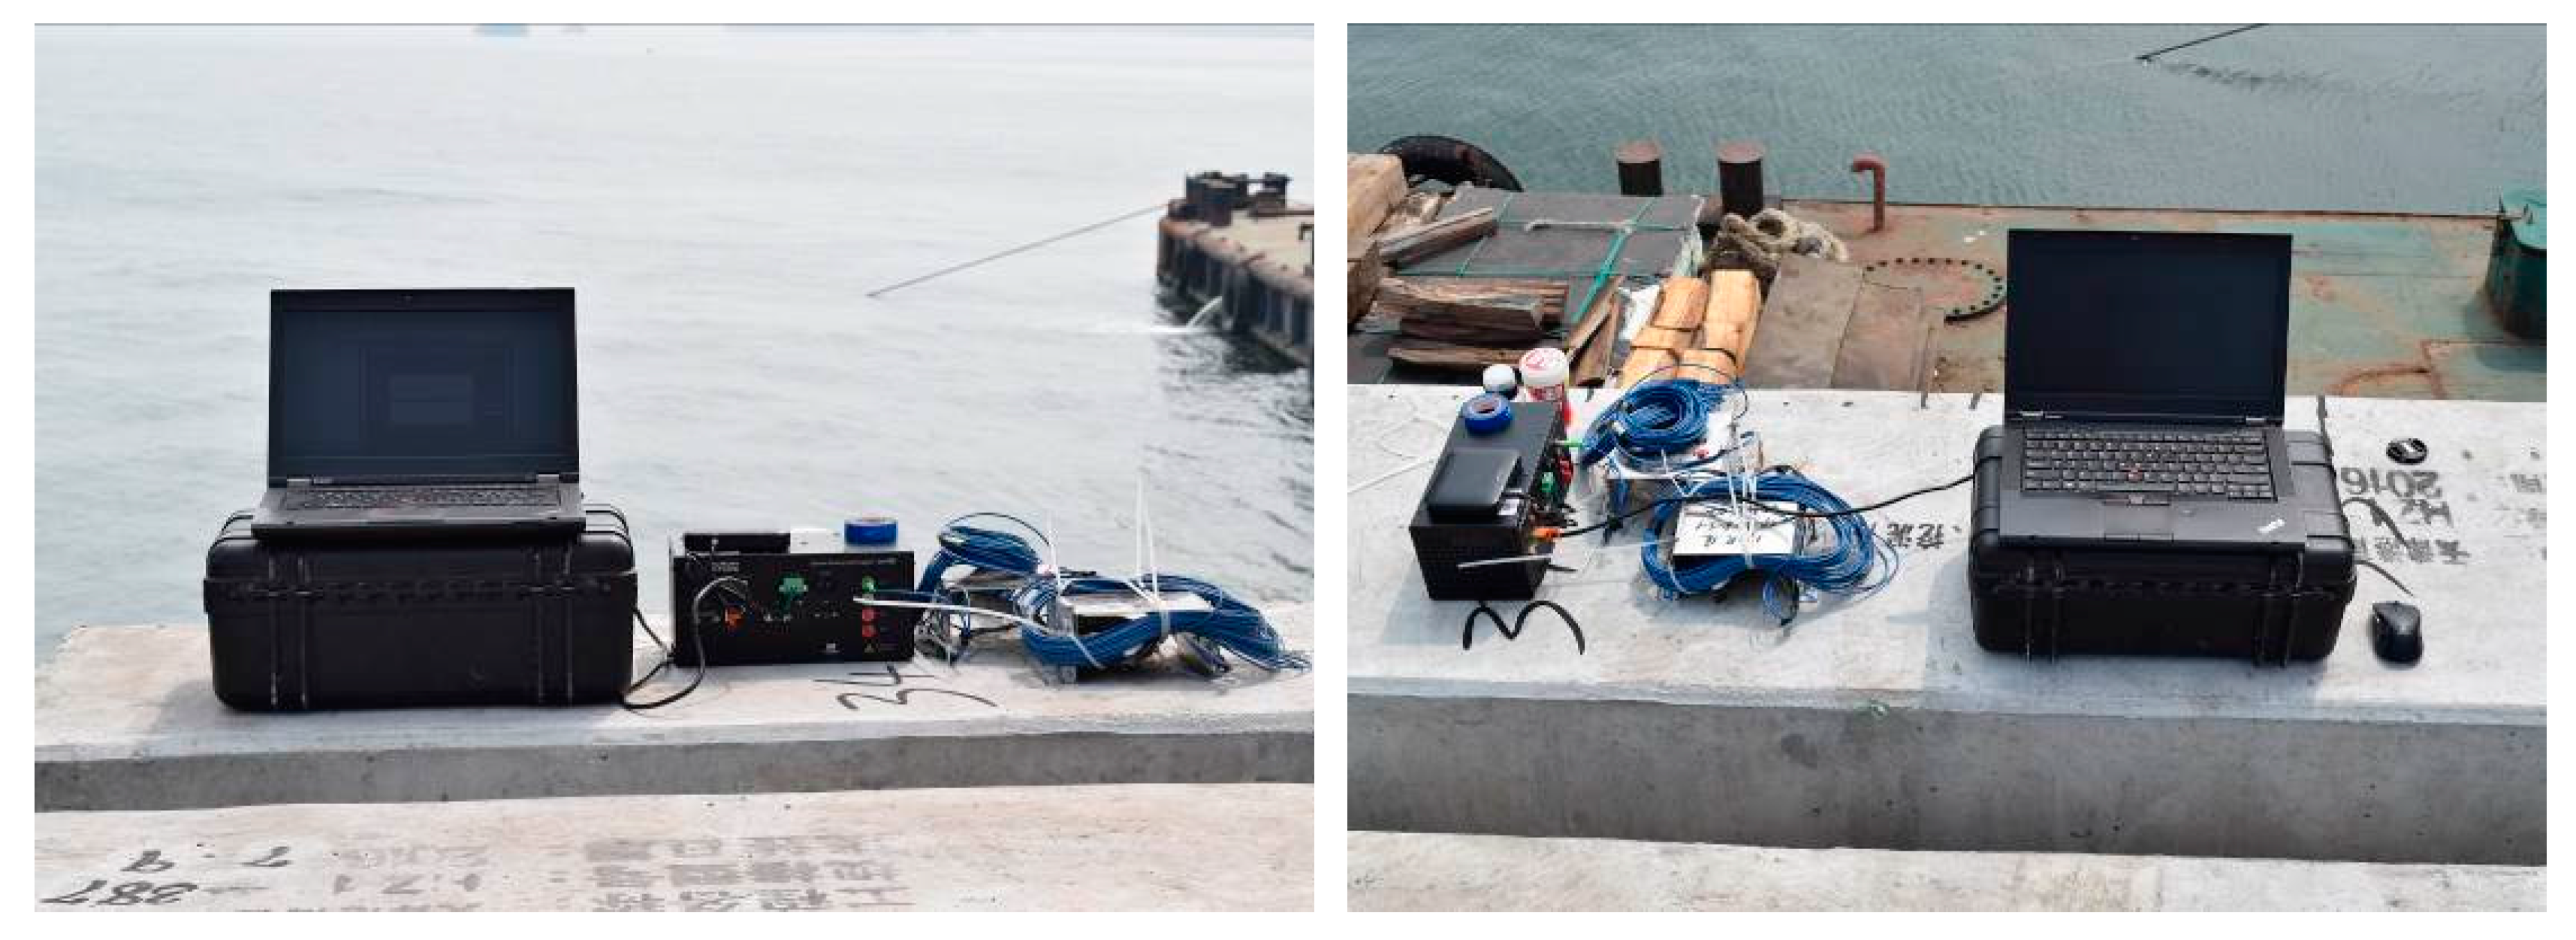
15]. In the testing process, the dynamic strain and angle value of the pile will be collected when the hammer impacts the pile head each time. Therefore, the strain properties and propagation law can then be identified by processing the obtained vibration data. A comparison was done among the results of different stages of the pile driving process after the testing was performed. The sensor setup and field testing are shown in
Figure 3. The pile was impacted by a pile hammer (Model No. D138-32) to produce a velocity, followed by data capture. The impact energy of the pile hammer to the pile head was 461 kJ. The vibration data from two FBG strain channels and one FBG angle channel were digitized and further processed in situ using a Diagnostic Instruments SM130 optic digital spectrum analyzer.
2.2. Testing Instrumentation and Layout
The testing instrumentation of pile driving mainly consists of the FBG strain sensors, FBG angle sensor, and optical data collector. After the pile was impacted by the pile hammer, the pile vibration was measured by the sensors embedded in the body of the pile at the three measurement points. Only two types of transducers were used for the pile’s response measurements, and all transducers used were based on the FBG technique, which were suitable for monitoring of port engineering.
The FBG strain sensors used in the testing were designed to monitor civil infrastructures by the Dalian University of Technology [
16,
17]. Prior to applying the FBG strain sensors in practical engineering, calibration tests were conducted on a steel plate to verify the performance of all the FBG strain sensors. An FBG strain sensor and a bare FBG sensor were mounted directly on the plates. Then, the tensile test in the steel plate was carried out in a uniaxial testing machine (shown in
Figure 4).
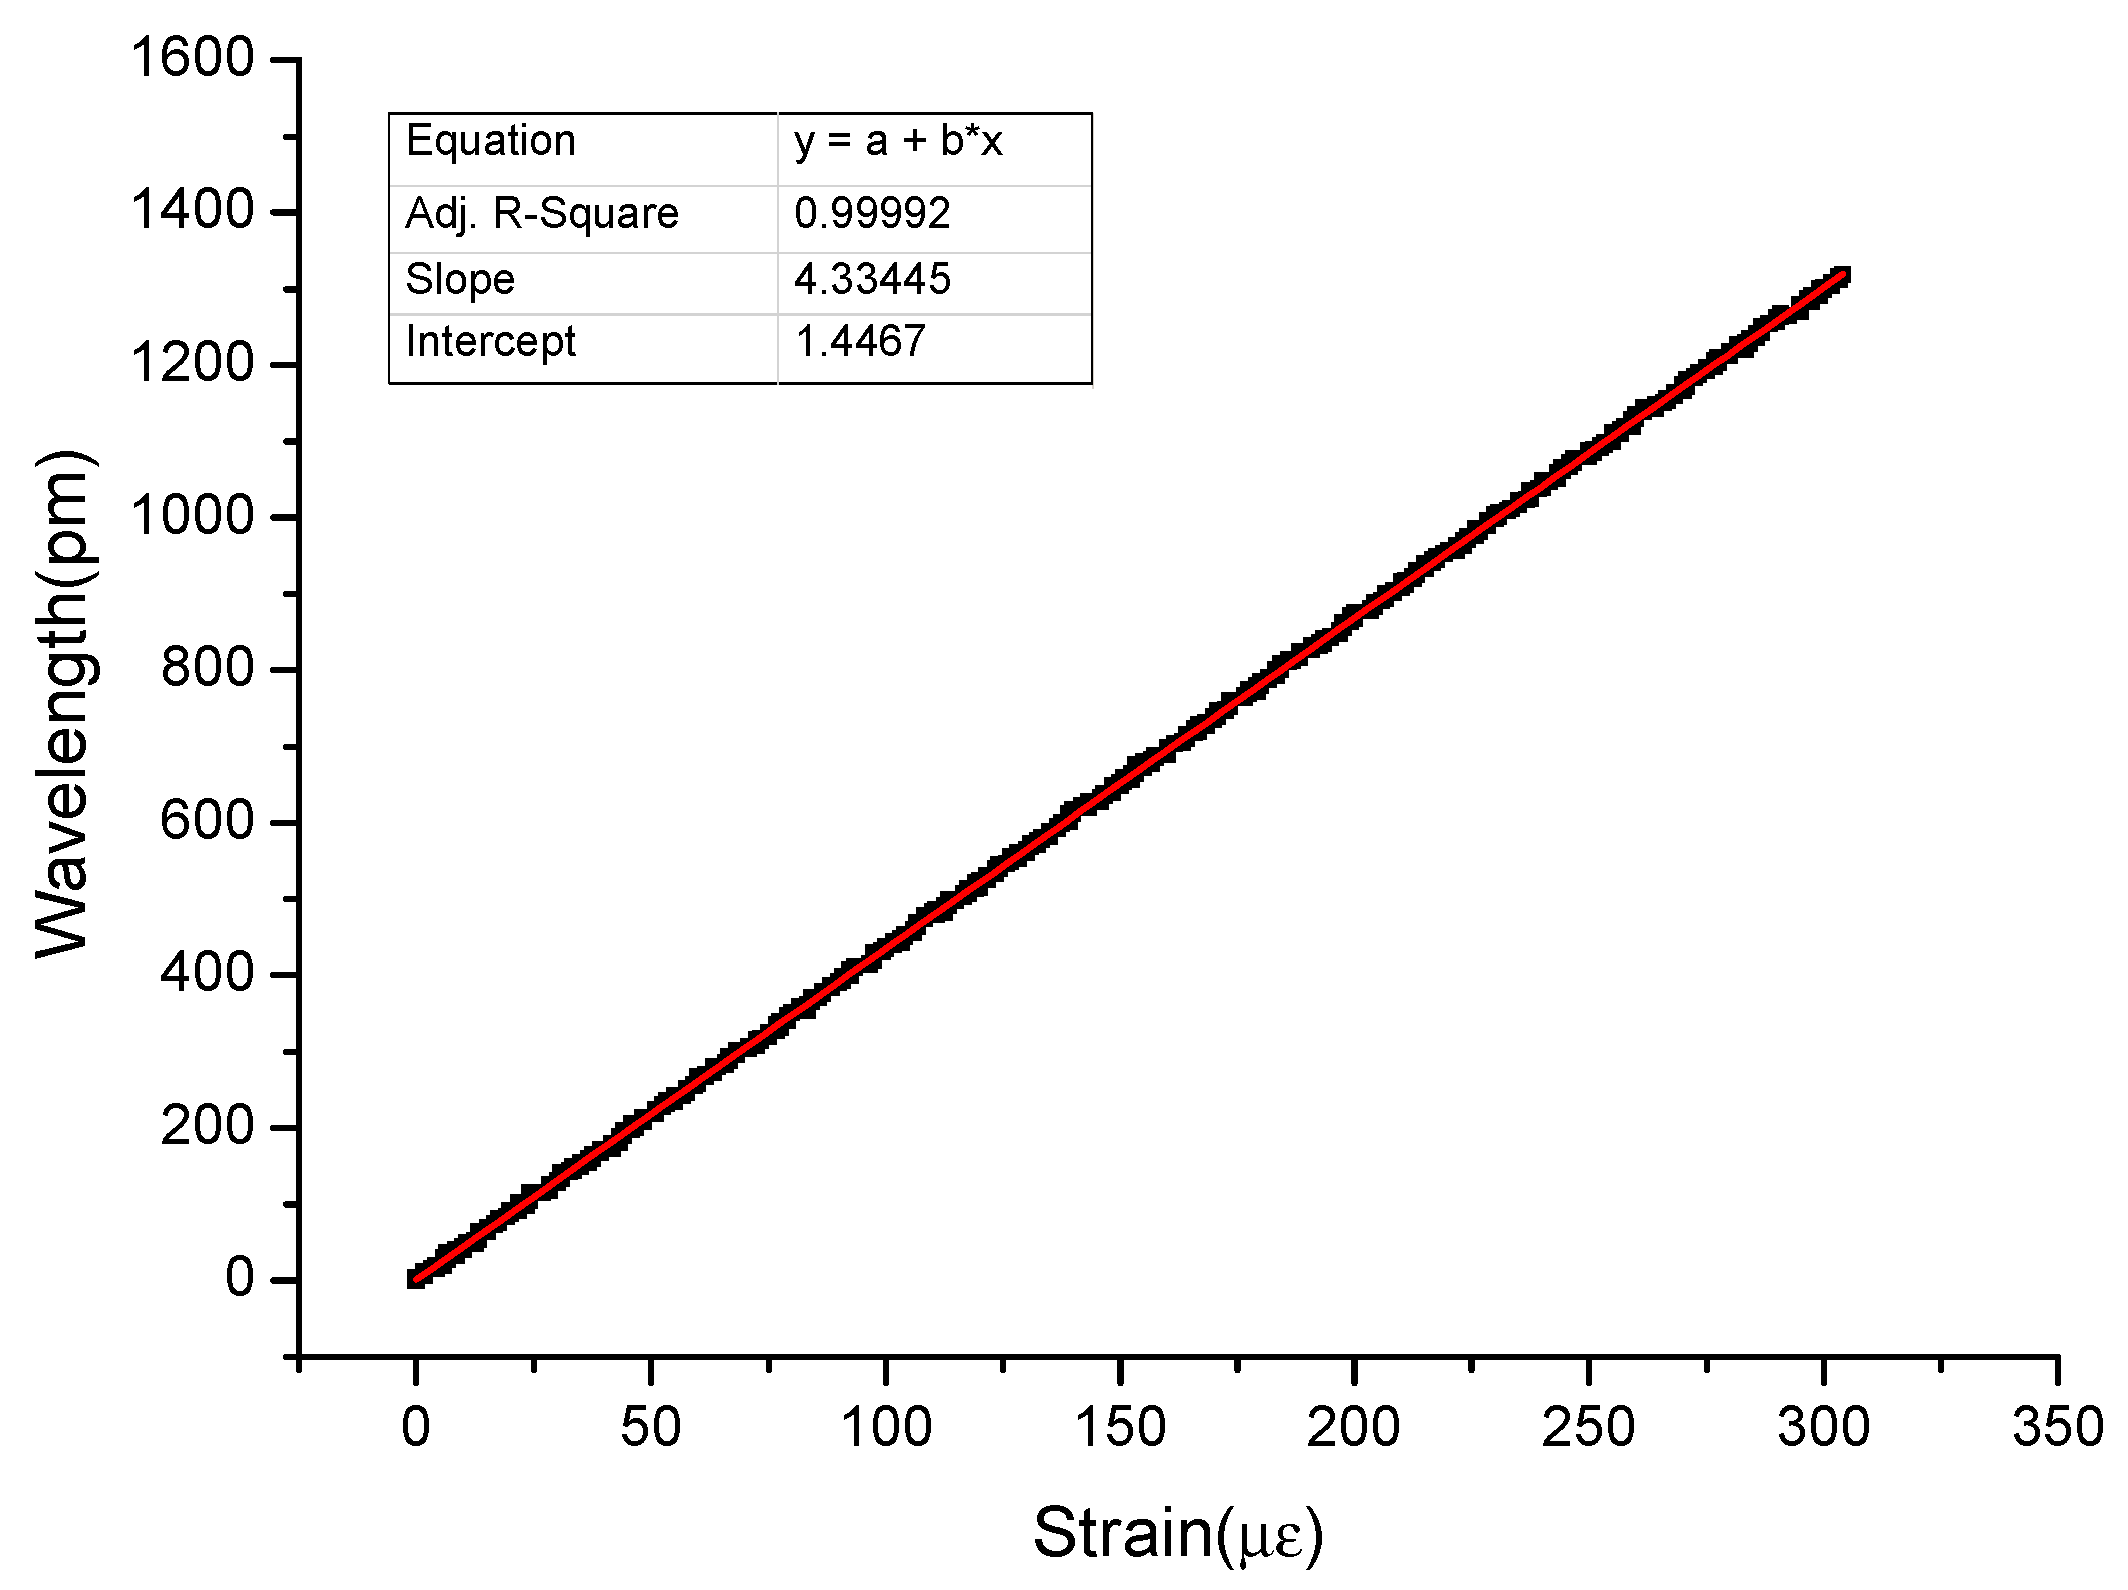
The steel plate was loaded continuously from 0 kN to 20 kN. The calibration test result of the FBG strain sensor is plotted in
Figure 5, showing the relationship between the Bragg wavelength shift of the FBG strain sensor and the strain variation of the bare FBG sensor. The bare FBG and the FBG strain sensor agree well with each other during this load test, and the coefficient of linear association is greater than 0.9999.
Figure 5 shows that the strain sensitivity of the FBG strain sensor is 4.33 pm/με, indicating that the FBG strain sensor is sensitive to the strain variation. The test results demonstrate that the FBG strain sensor has good performance on host materials with a large Young’s modulus, such as steel.
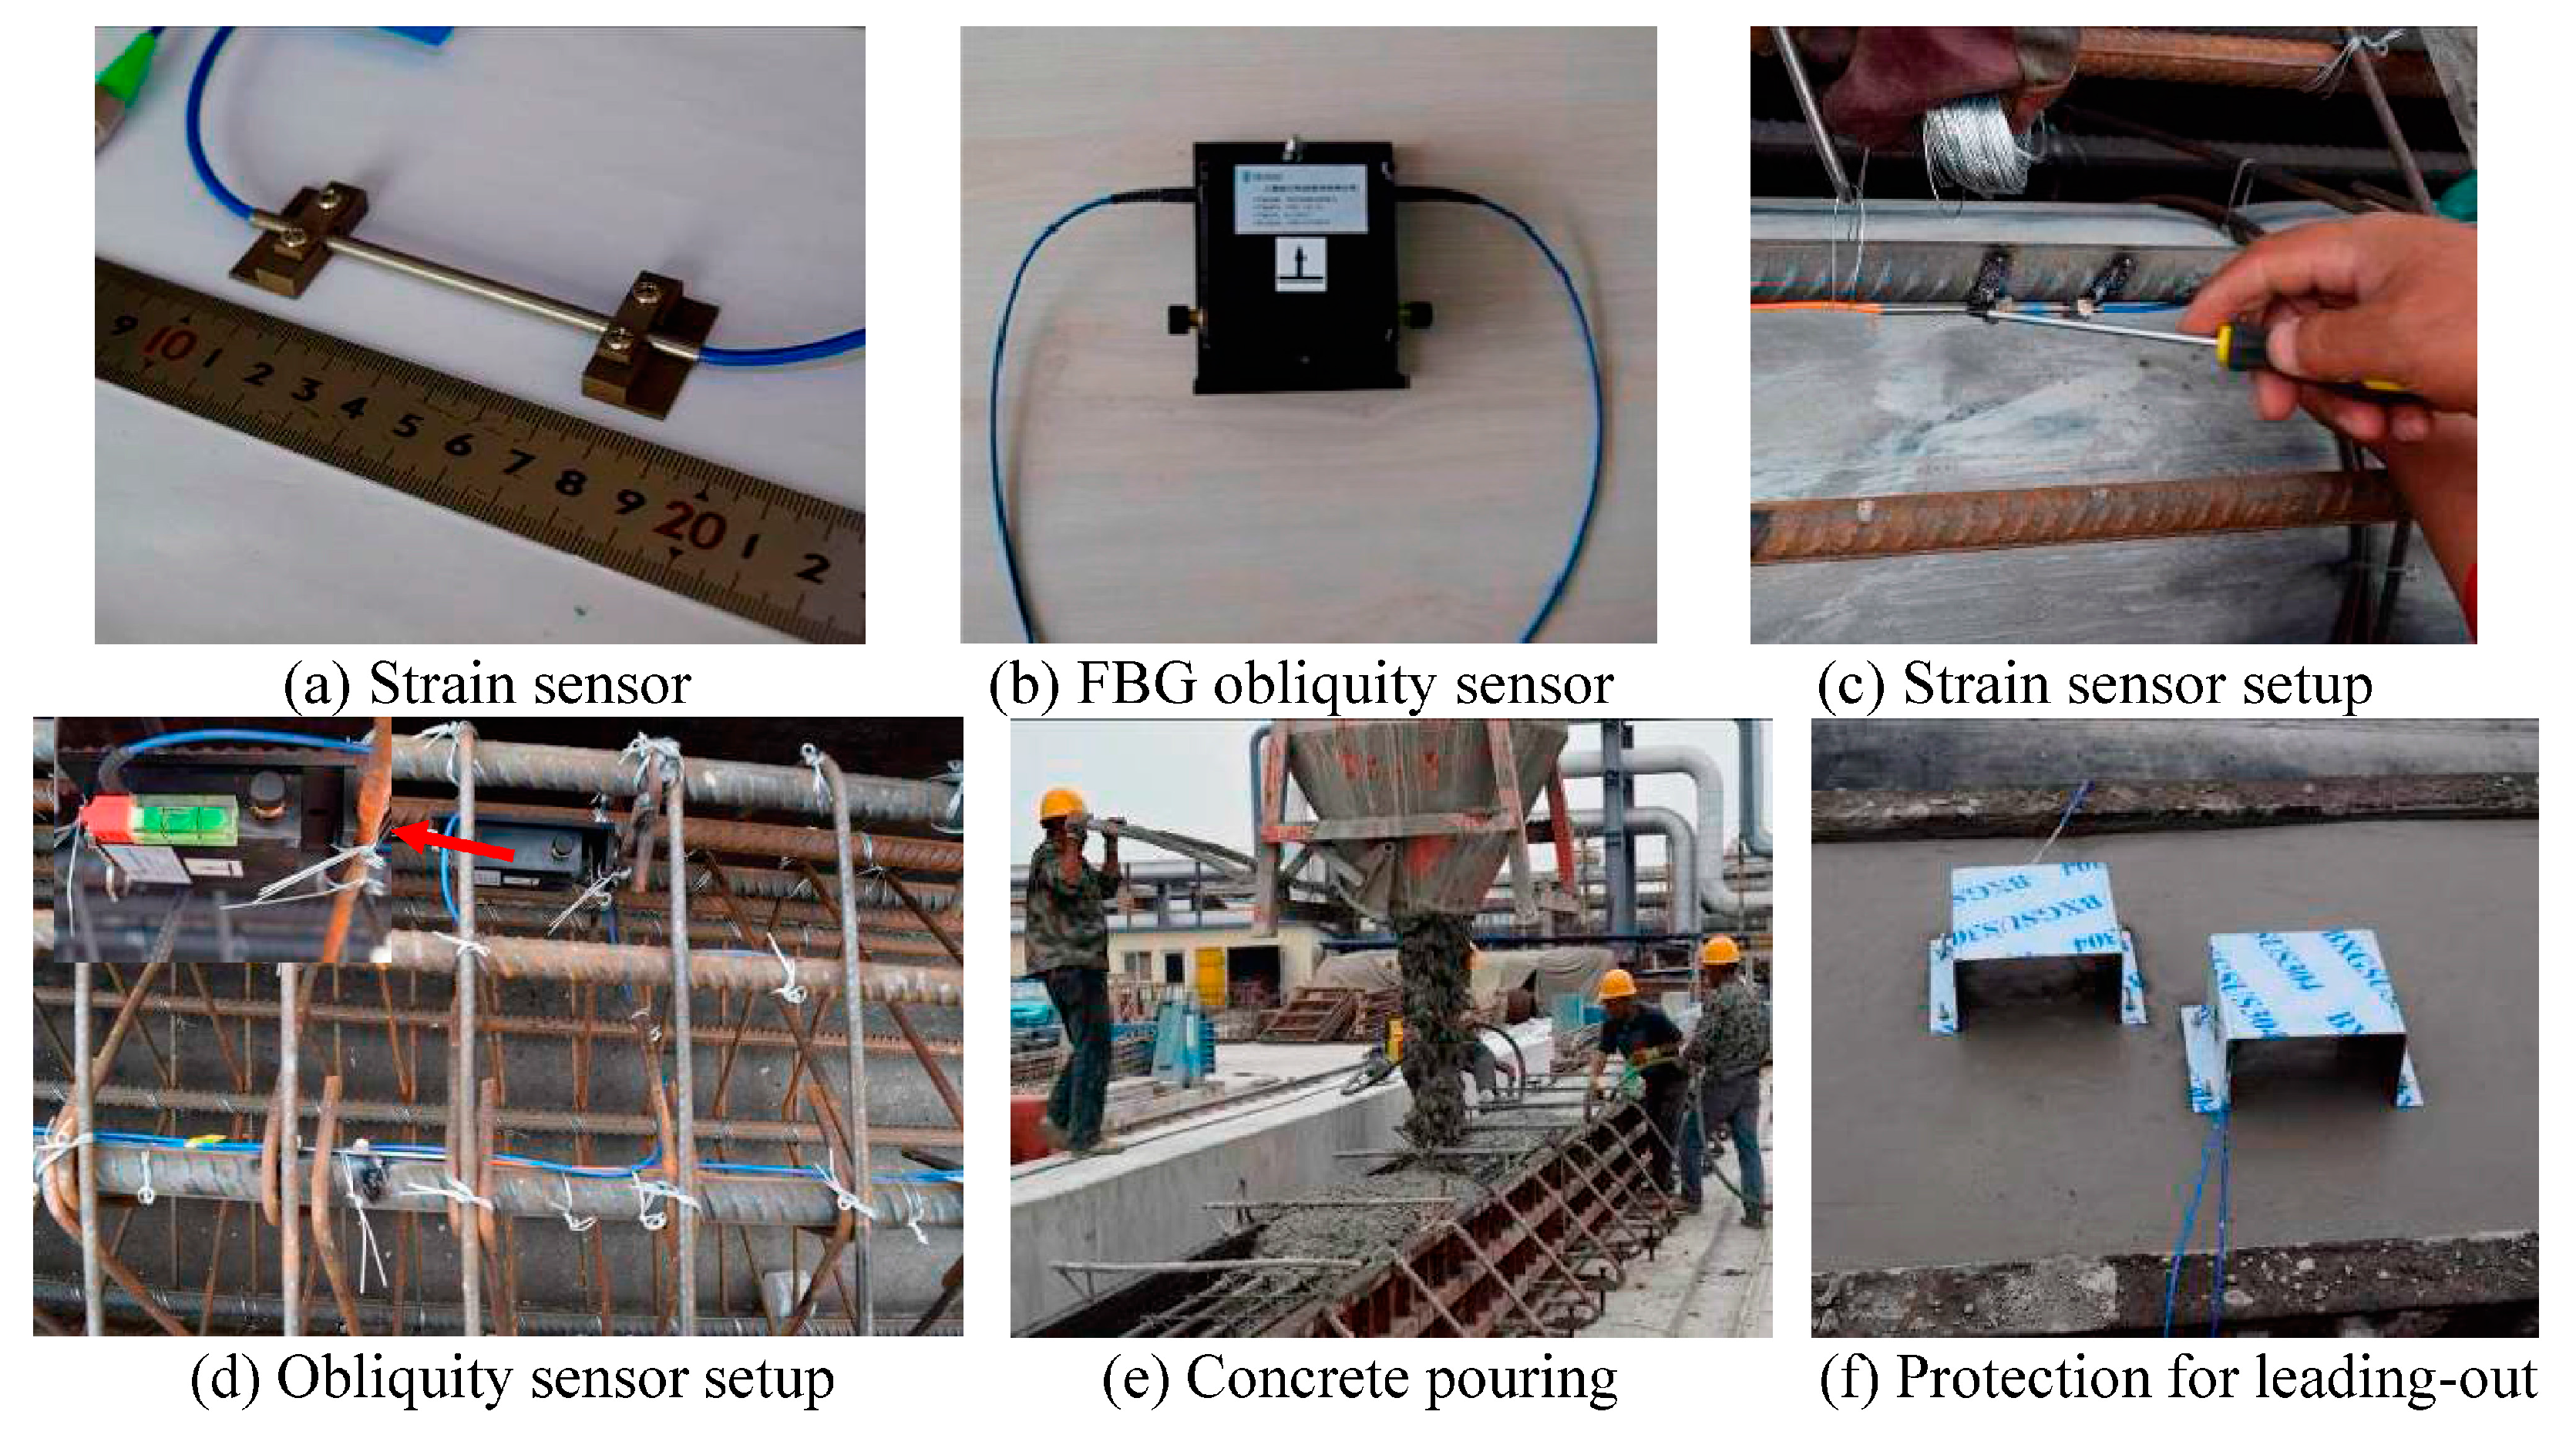
The uniaxial FBG strain sensor has a range of ±1000 με, as shown in
Figure 6a. The FBG obliquity sensor, which has a range of ±10° and a resolution of 0.1°, is used to monitor the pile’s obliquity, as shown in
Figure 6b. The two kinds of sensors are all attached to the reinforcement bars (
Figure 6c,d), then the concrete is poured. The strain and angle signals from the FBG sensors are digitized by the optical digital spectrum analyzer.
The propagation speed of the stress wave in the concrete pile is generally high when performing pile driving. Therefore, a four-channel portable dynamic optic signal acquisition and analyzer system (SM 130) was used to acquire the time domain strain and angle data of the response points. The SM130 optic digital spectrum analyzer used in the testing is manufactured by Micron Optics, Inc. and had the following parameters: precision, 24 bits; measurement range: 1510 nm–1590 nm; and maximum sampling rate, 1000 Hz/channel. This equipment is highly suitable for structural vibration measurements with FBG sensors in situ.
When conducting the mechanical performance testing of a driven pile, the frequency sampling rate was set to 1000 Hz, and the sampling length included the entire pile driving process, approximately 850 s. The test setup is shown in
Figure 7. The FBG strain transducers and FBG angle transducers were all embedded into the pile body during the prefabrication in the factory. Based on the design, three FBG strain sensors were embedded into the pile body near the head, middle, and tip, while one FBG angle sensor was embedded near the head. The installation of transducers is shown in
Figure 8. In our testing, one pile was monitored, and three strain signals and one angle signal were collected in the testing. Meanwhile, three cases of testing for the driven pile were carried out, which were the time when the pile was set flat on the ship before driving, the time when the pile was set vertically for driving and the time during pile driving.
Mechanical performance testing was conducted at three measurement points in each precast prestressed concrete pile (
Figure 8). These measurement points were chosen to enable the identification of the stress wave propagation law based on the different stress values at the different locations along the pile. Since FBG sensors can be easily multiplexed with a single string of optical fiber, the three FBG strain sensors were connected together in series for connection to CH1, and the distances between the middle point and the other points were both 16 m. The data capture began approximately 30 s before pile driving in order to obtain the original status value of the pile in the upright state.
3. Data Acquisition and Analysis
In the testing, one pile’s embedded sensors were chosen to measure the dynamic response during pile driving in situ. Performance monitoring of the pile was conducted during pile driving with the piling hammer (the energy of each impact was 461 kJ) at the seaside of Tianjin Port. The distance between two concrete piles was 4.42 m. By comparing the results obtained through the different sensors, the difference between each sensor can be obtained and each sensor can be verified.
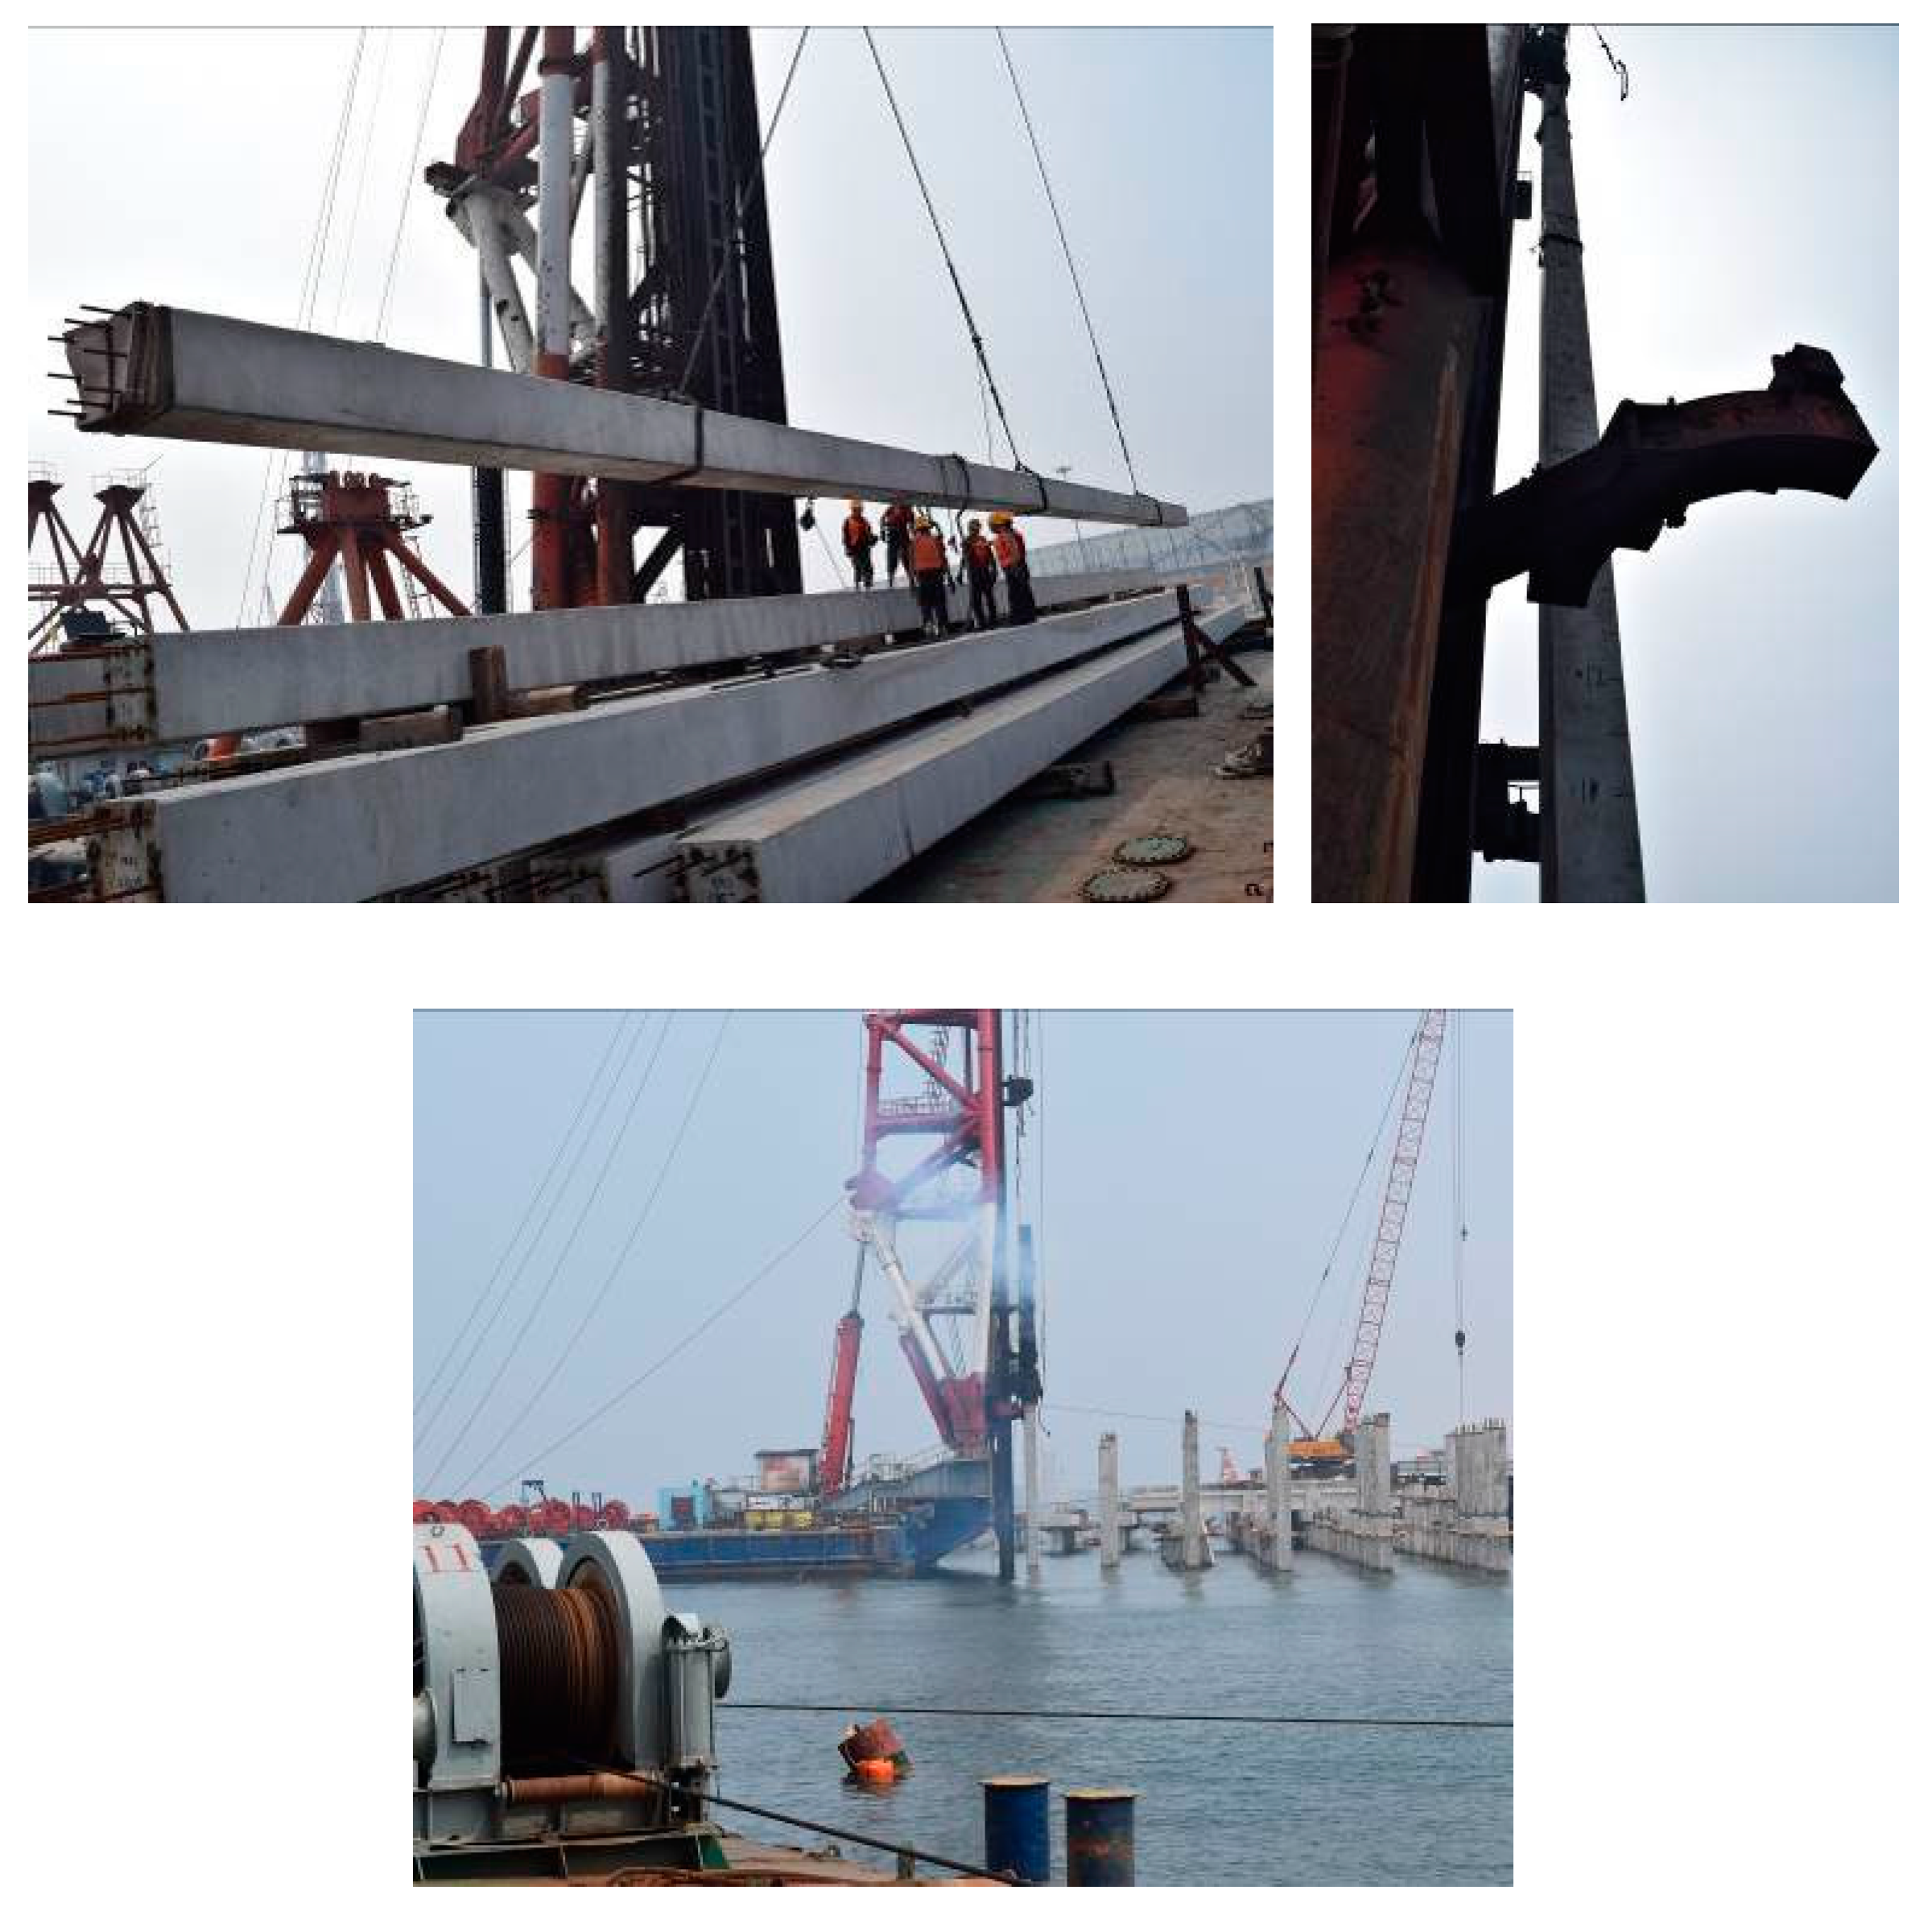
The pile will be maintained in four location states during the entire pile driving process, which are flat in shipment, upright for diving, driving, and ending, as shown in
Figure 9. The mechanical states are different in different location states. We collected all of the data for the pile being maintained in the different location states.
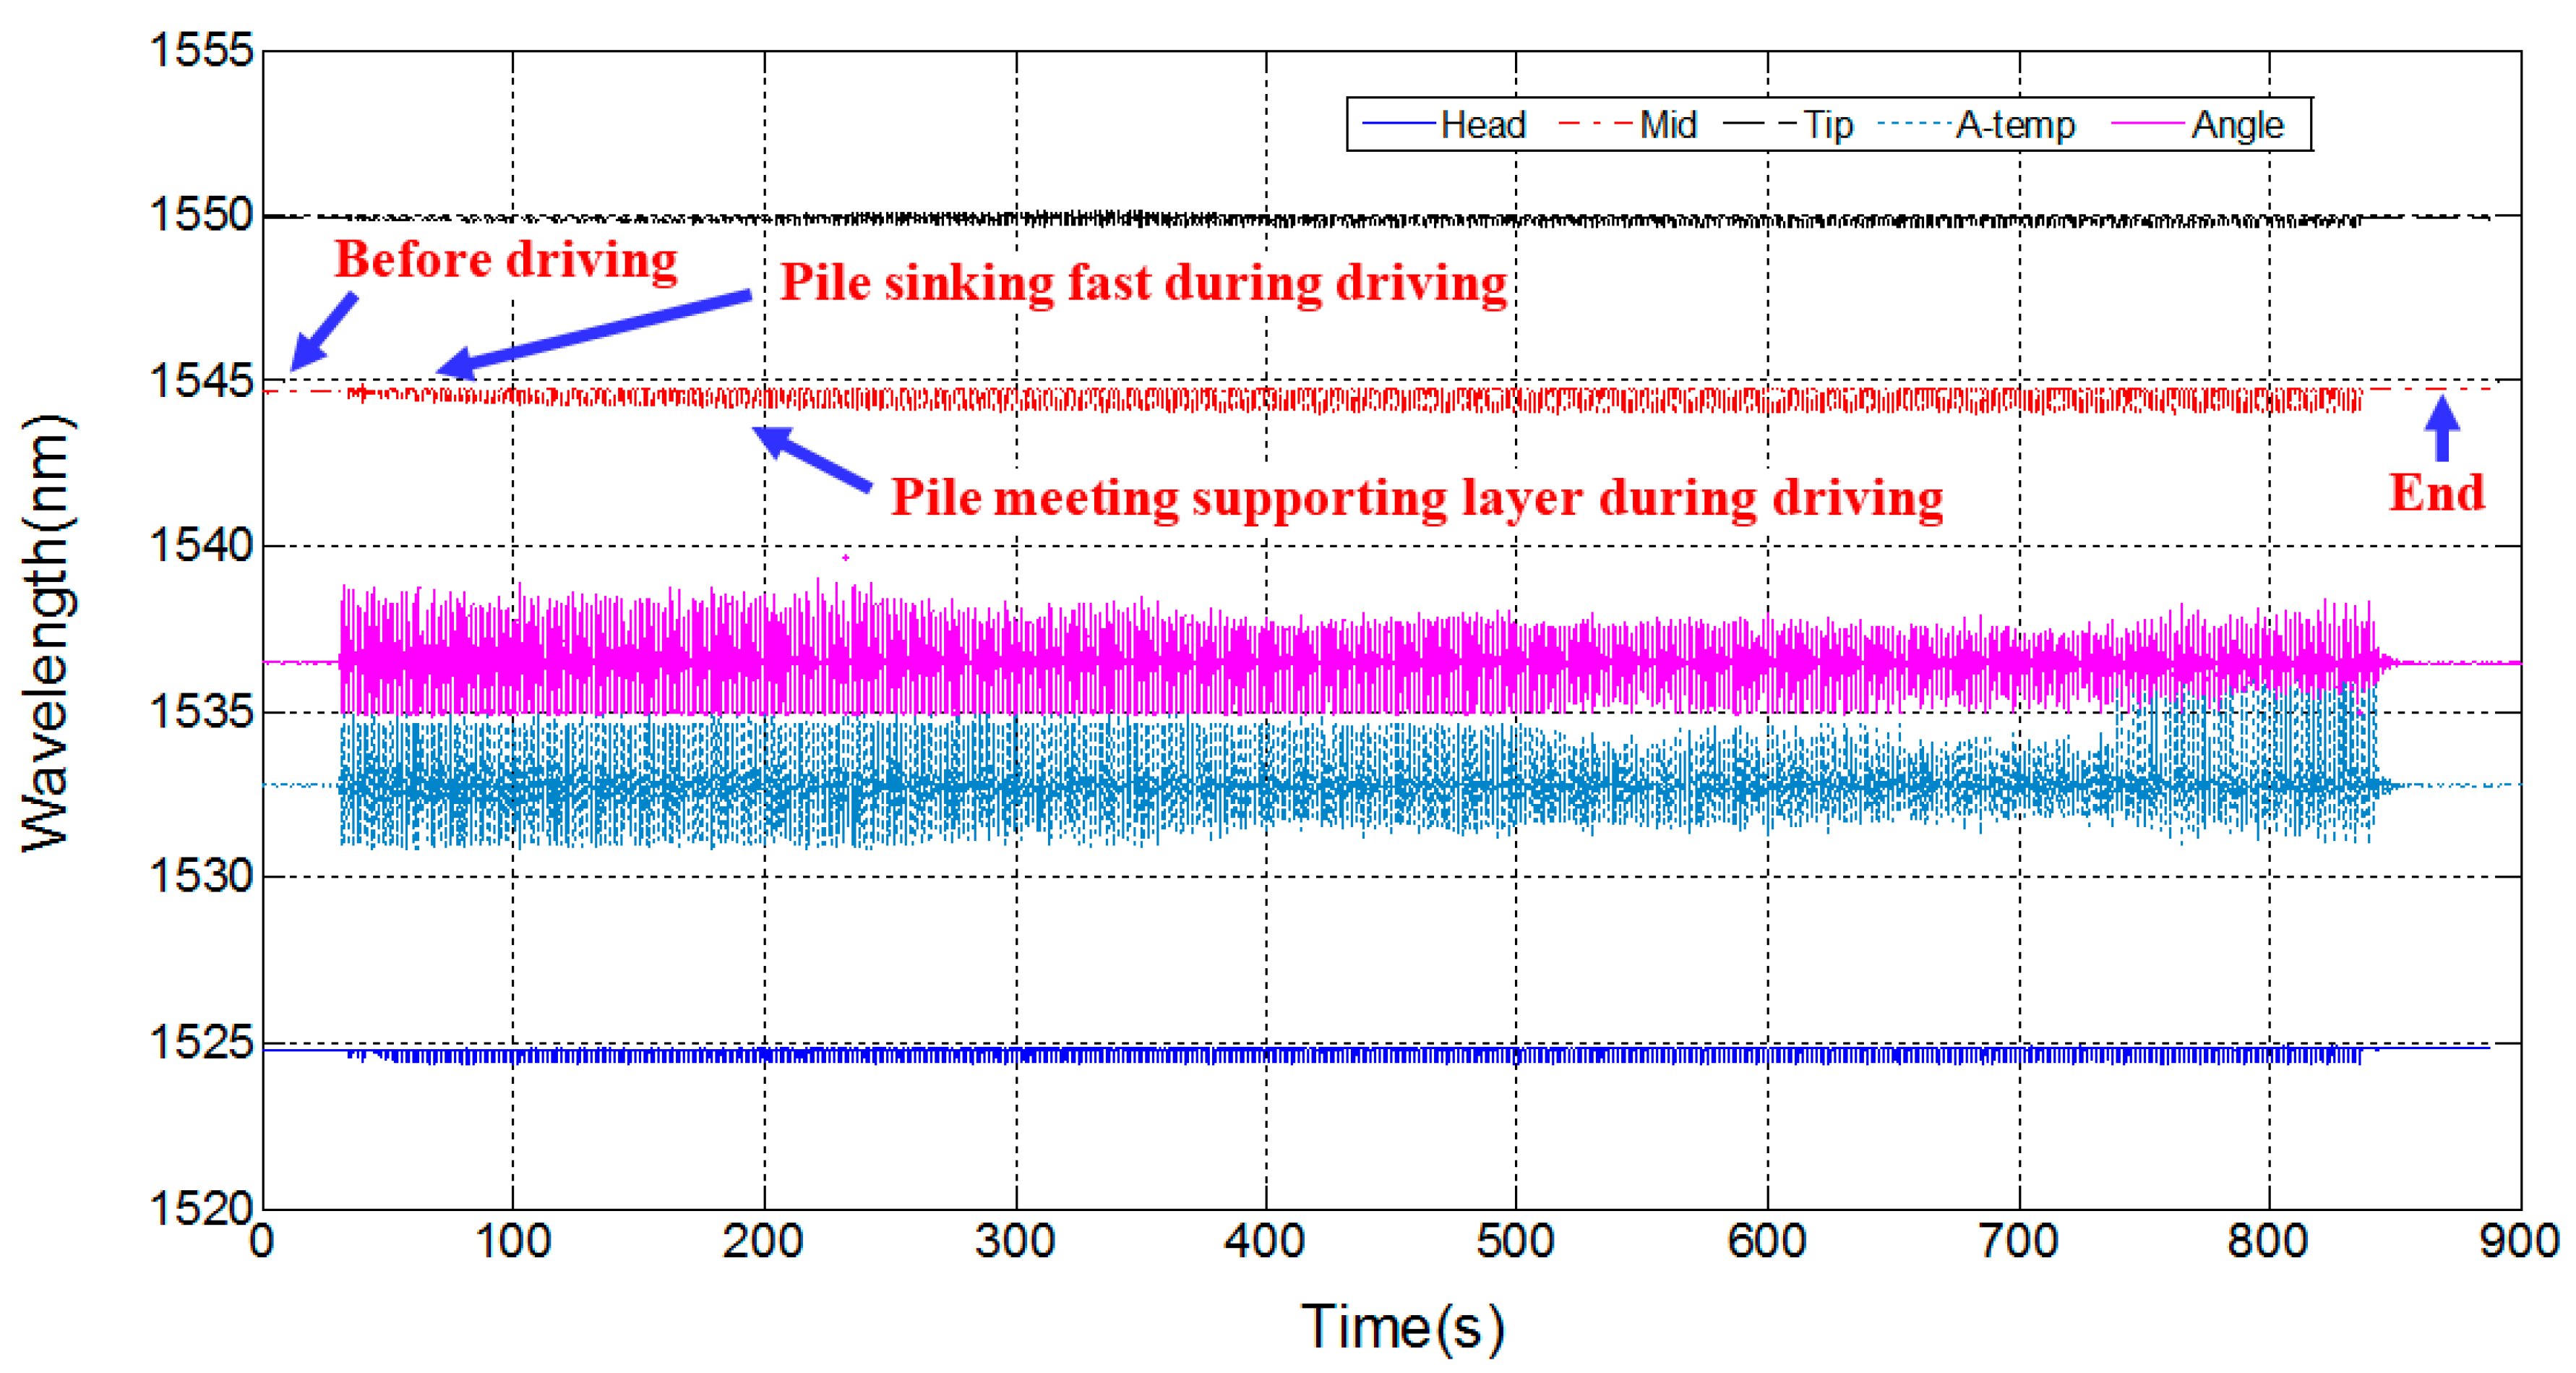
Then, the dynamic response testing of the pile was conducted during pile driving, and the time history of the vibration response under the impact of the piling hammer was obtained. The time history of data from all sensors is shown in
Figure 10 with the unit of wavelength. The FBG strain sensor used in the testing is a new type sensor that is less thermosensitive and does not require temperature compensation, while the FBG angle sensor does include temperature compensation. There are five curve lines in total in
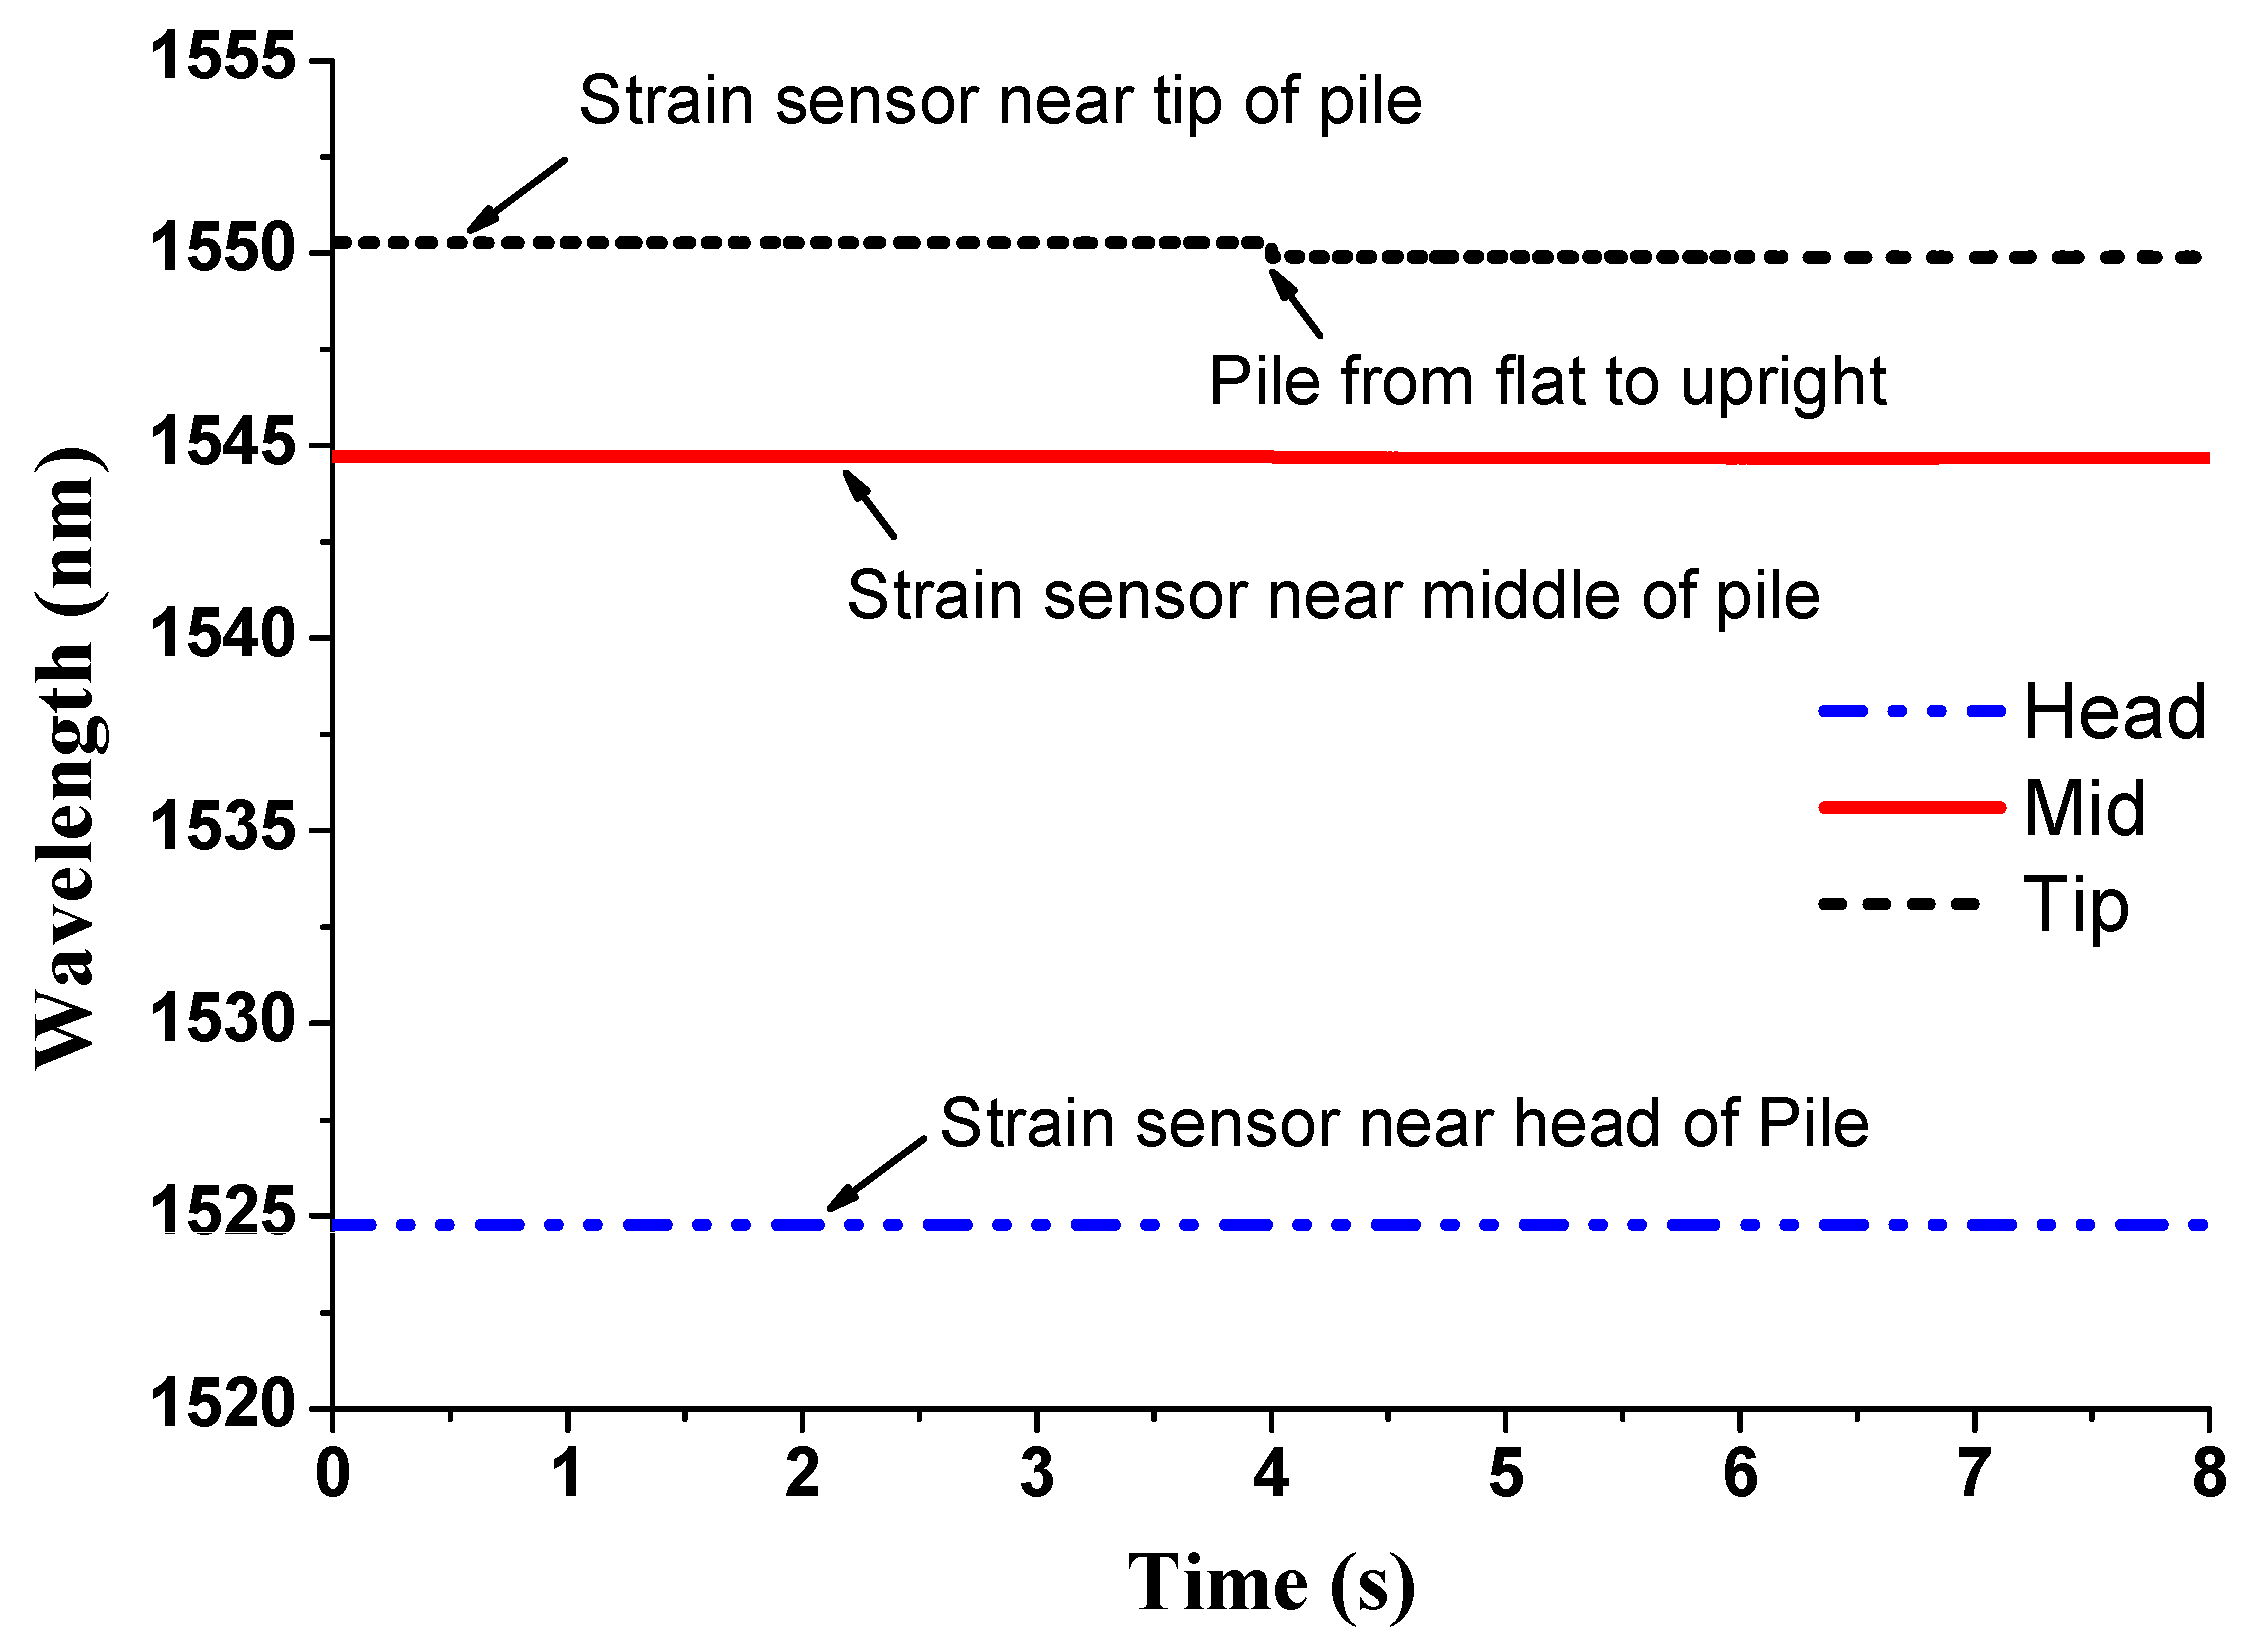
Figure 10. The Head, Mid, Tip, A-temp, and Angle represent the strain at the head of pile, strain at the middle of the pile, strain at the tip of pile, temperature compensation for the angle sensor, and angle measurement, respectively. Based on the curve lines of the angle sensor, the entire time history of strain can be clearly divided into four stages, which is consistent with the pile driving steps. Meanwhile, the data from the pile from flat to upright were also collected, as shown in
Figure 11. From the time history of strain near the tip, it can be seen that there is a saltation of the wavelength. This occurs because the weight of the pile affects its tip, creating a compressive stress, which is consistent with the pile driving process.
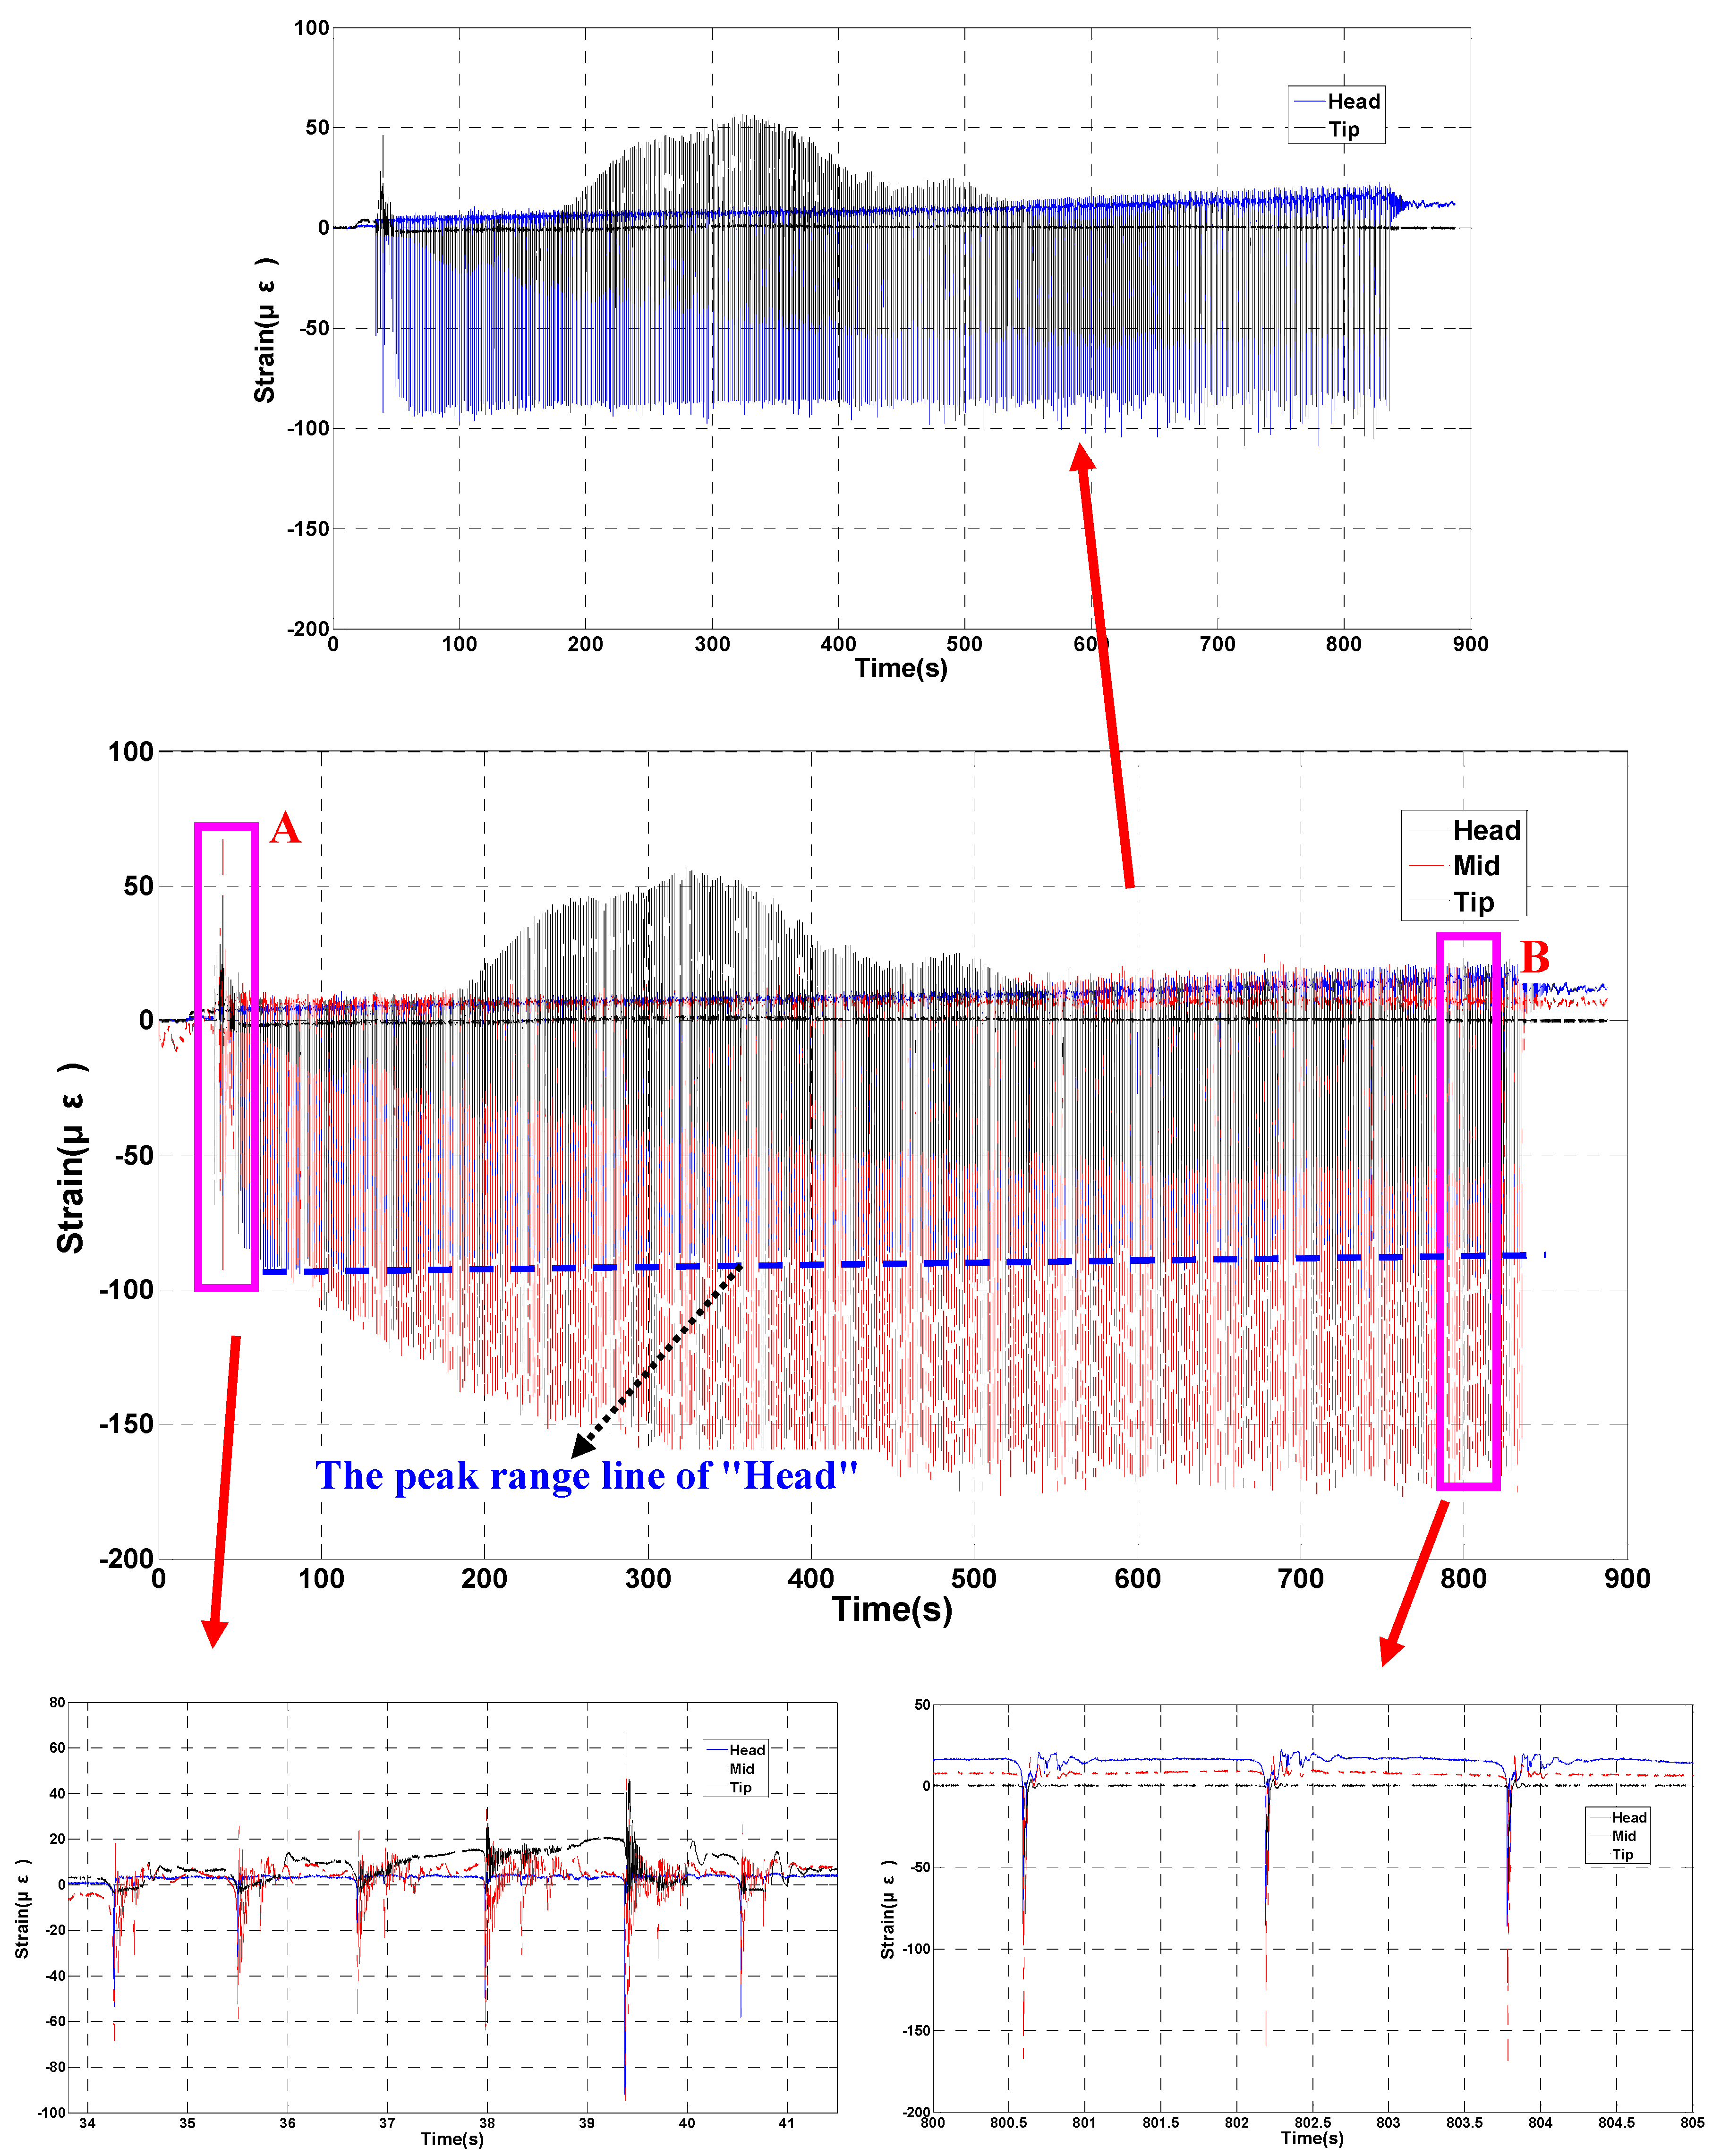
To obtain the strain state of the pile and propagation law of the stress wave during pile driving, the wavelength data of the strain sensor were converted to strain data, which are shown in
Figure 12. Due to the change of angle being so small during pile driving, it is not discussed here and is only used to distinguish the strain data in the different stages mentioned above.
As seen from
Figure 12, the compressive strain at the middle of the pile is larger than that at the head and tip of the pile. This phenomenon occurs due to the eccentric compression of the pile caused by the piling hammer’s eccentric impacting. Eccentric impacting to the head of the pile will create the largest bent moment at the middle of the pile and generate the largest compressive strain at the middle of the pile. Thus, the middle of the pile is the key location that should be monitored preferentially during pile driving.
It can also be seen from
Figure 12 that the tension strain increases at the middle and tip of the pile during the several impacts at the beginning. Since the pile will have an upward movement after hammer impacting, it functions like particle vibration. In the process of the pile moving up, the body of the pile will be tensed due to the frictional resistance of the soil. During the first several hammer impacts, the tension strain at the middle and tip of the pile became larger, and after the fifth impact in
Figure 12, the tension decreased. This is just the process of the pile passing through the first supporting soil layer, and when the pile passes through the soil layer, the frictional resistance became larger. Thus, the tension strain at the middle and tip of the pile increased at first and then decreased.
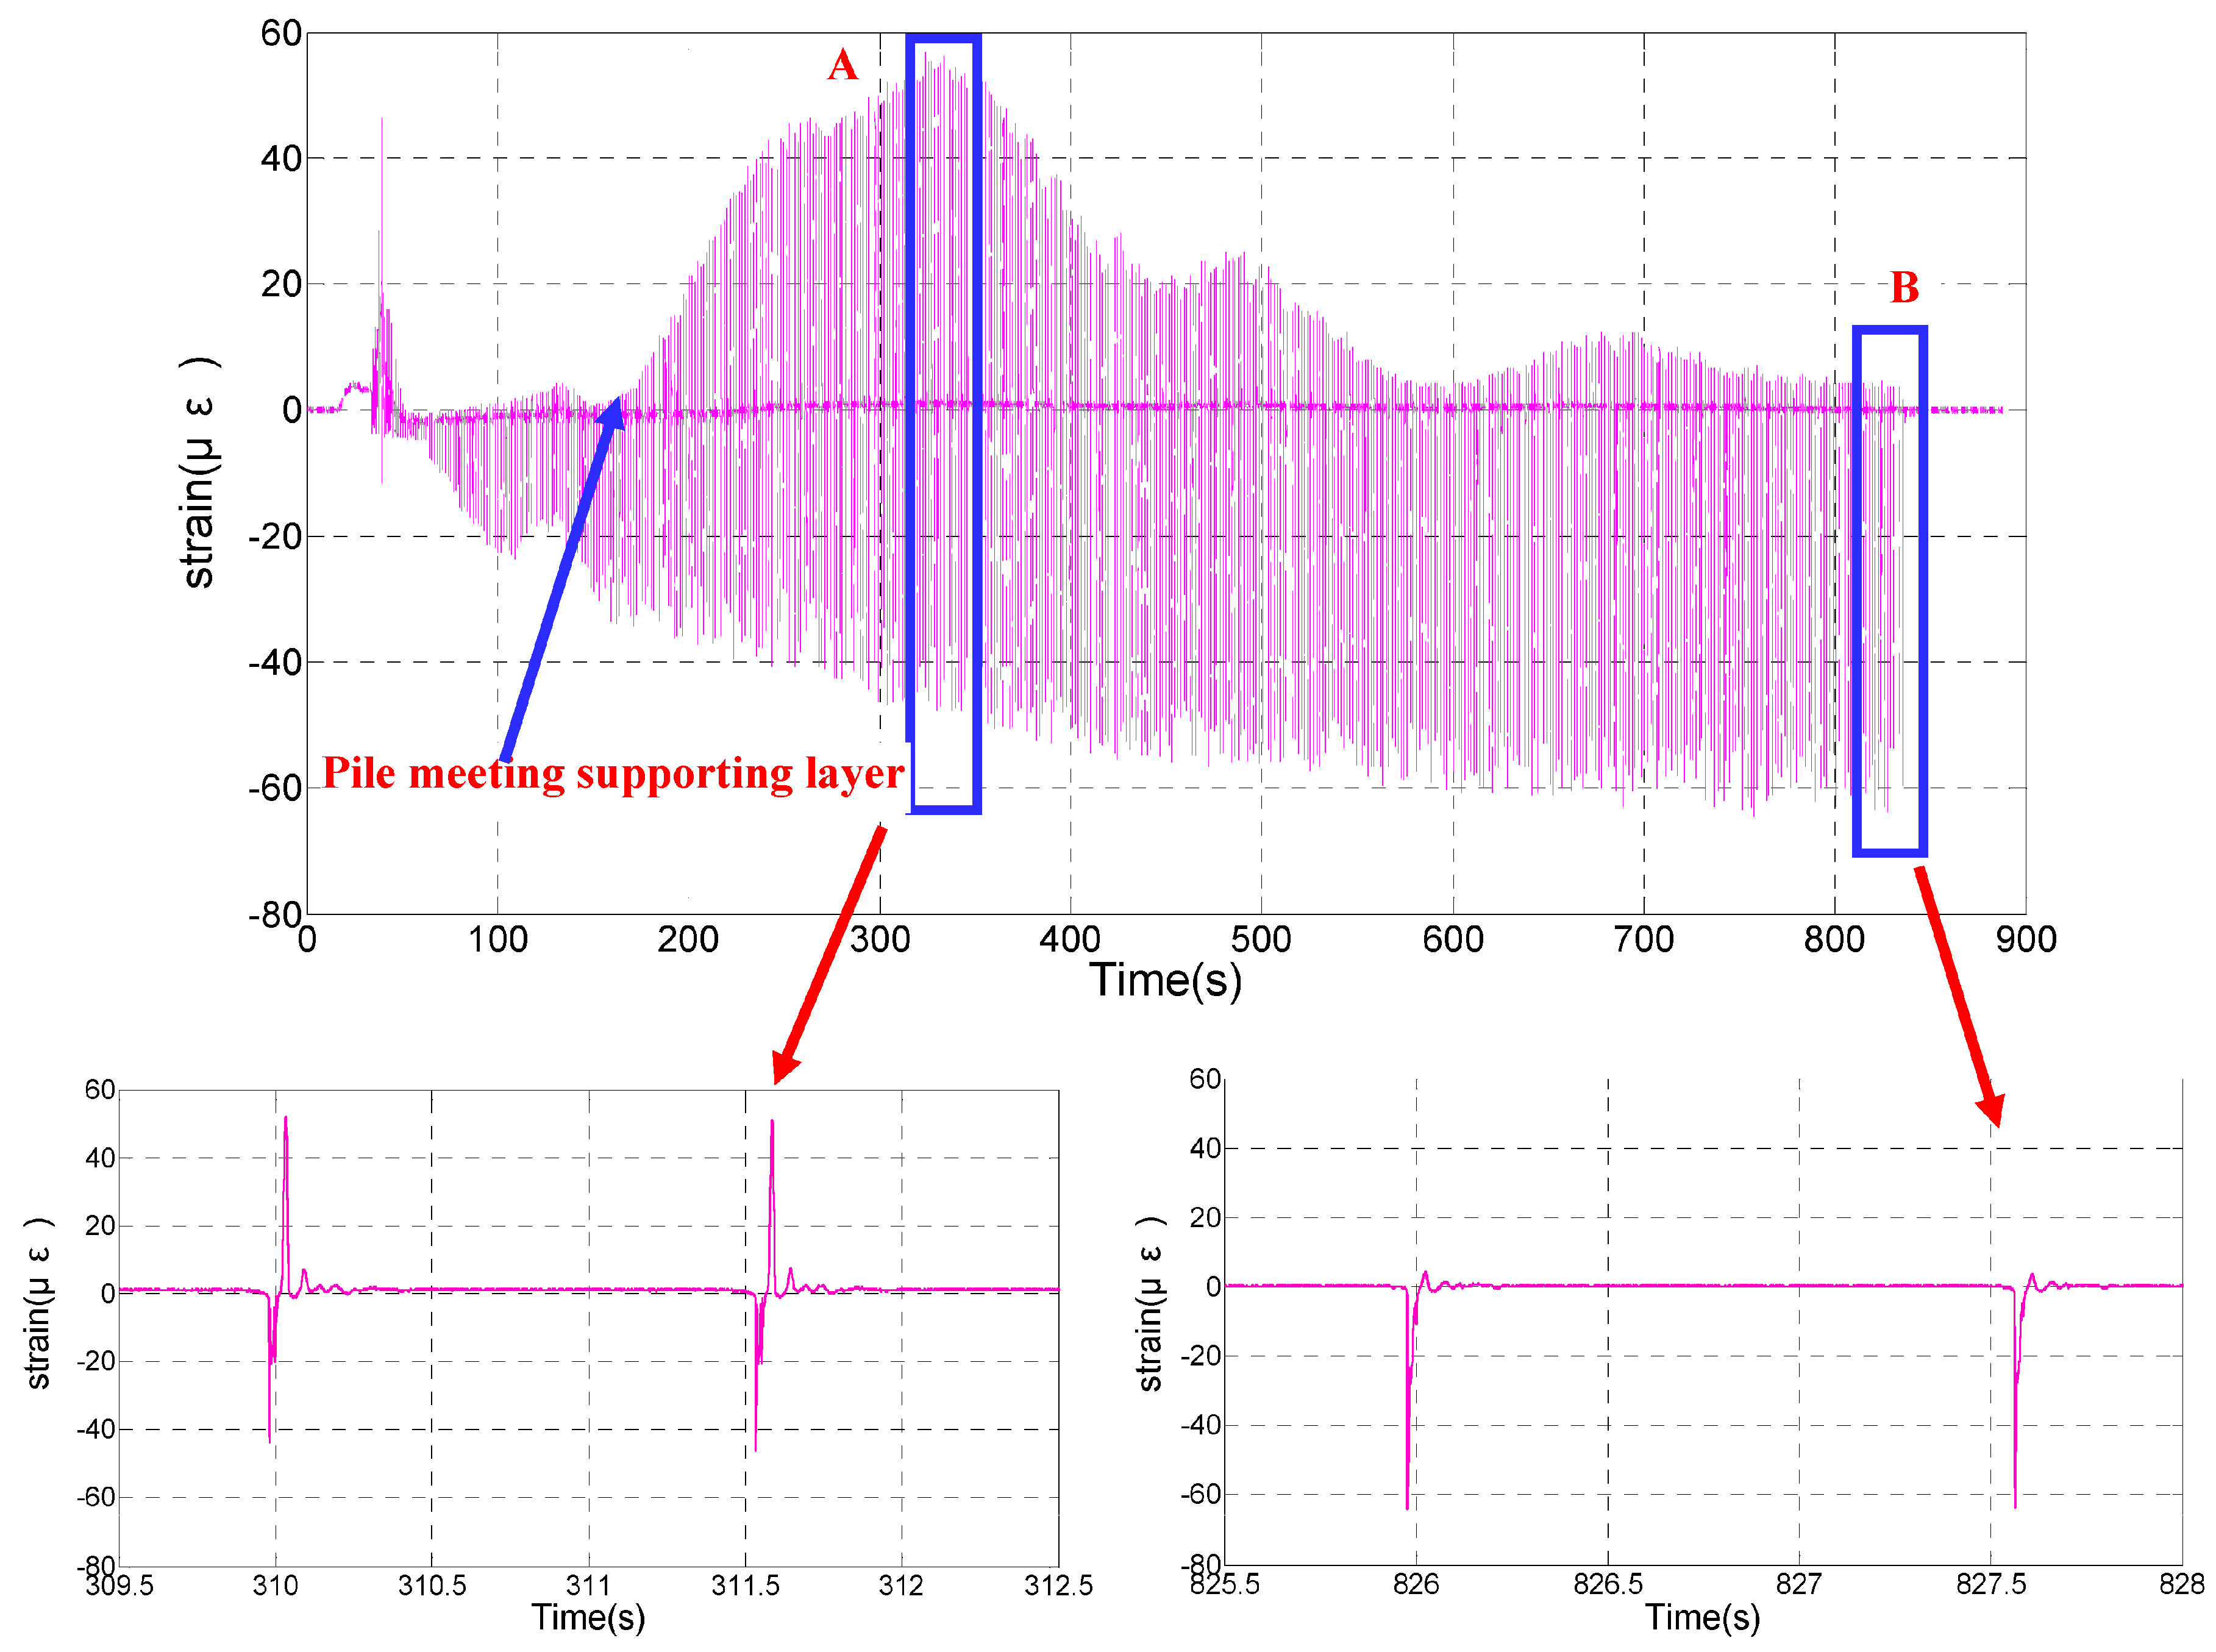
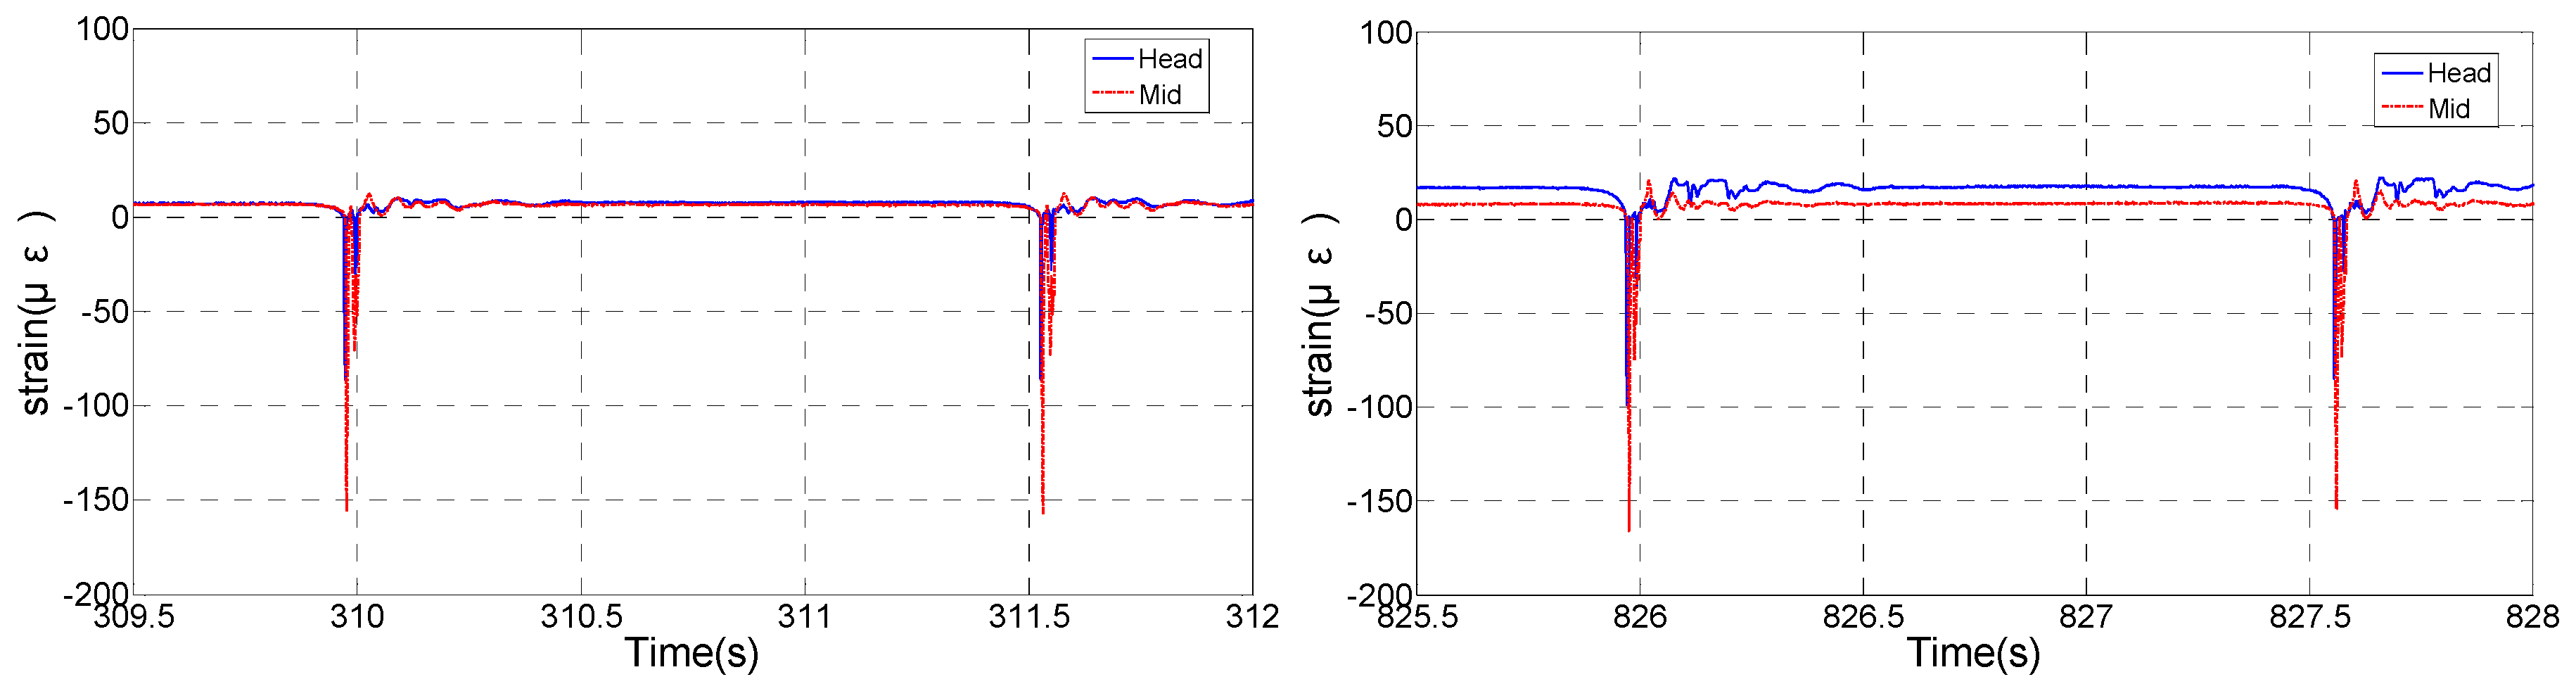
Meanwhile, following the hammer impact, the obvious tension strain at the tip of the pile increased, and the maximum tension strain reached 56 με. The details can be seen in
Figure 13. This occurs due to the frictional resistance of the soil mentioned above and the tip of the pile meeting the significant supporting soil layer. When the pile moved up after impacting, the tip of the pile was tensioned by the frictional resistance of the soil. Then, the tension strain became larger and the strain decreased when the tip of the pile passed through the soil. This is why the tension strain is low at the end of the pile driving.
Nevertheless, the tension strain at the middle and head of the pile is very small, while the tension strain at the tip is very large at the same time, which can be seen in
Figure 14. There are two explanations for this. One is that the head of the pile is located over the soil surface, so there is no tension strain at the head of the pile when the pile rebounds. The other is that the frictional resistance of the soil is too small to load the middle of the pile when the tip meets the significant supporting soil layer, so the tension strain at the middle of the pile is very low.
4. Conclusions
Currently, there are few studies on the mechanical performance monitoring of piles used in high-piled wharfs in coastal ports during pile driving with the FBG sensor technique. Based on the properties of precast, prestressed concrete piles used in high-piled wharfs in coastal ports and severe marine environments, a state-of-the-art FBG sensor technique is used for mechanical performance monitoring of a driven pile used in the South 27# Wharf in the Tianjin port of China. The sensors used for performance testing of the prestressed concrete piles are FBG strain sensors and FBG angle sensors, which were embedded in the body of concrete piles to measure the strain of different locations of the pile and the dip angle of the pile. In one concrete pile, three FBG sensors were setup near the head, middle and tip of the pile. The FBG strain sensor used in the testing is a new type of sensor, which is less thermosensitive and does not require temperature compensation. The FBG angle sensor was set near the head of the pile to measure the dip angle of the pile. Based on the performance testing of the pile during driving, the time history of strain at the three locations was captured, as were the dip angle data. The testing data acquired recorded all the details of the pile driving, including the process of moving the pile from flat to upright, pile driving, and driving ending.
According to data processing and analysis, it is clear that the compressive strain at the middle of the pile during driving is larger than that near the head and tip of the pile, and the maximum reached 177 με, which does not exceed the compressive ultimate strain. Therefore, the middle of a prestressed concrete pile is the key location that should be preferentially monitored during pile driving. Meanwhile, during continuous hammer impacting of the pile, the obvious tension strain at the tip of the pile increased, and the maximum of the dynamic tension strain reached 56 με, which is close to the tension ultimate strain. However, the tension strain at the middle and head of the pile is very small. Furthermore, the tension strains at all the locations of the pile are small at the completion of pile driving. This occurs because the frictional resistance of the soil is too small to load the middle of the pile when the tip meets the significant supporting soil layer, and the frictional resistance of the soil is too low to affect the tip of the pile when it passes through the supporting soil layer.


