
Numerical Simulation of Red Blood Cell-Induced Platelet Transport in Saccular Aneurysms

1
Department of Biomedical Engineering, Carnegie Mellon University, Pittsburgh, PA 15213, USA
2
Department of Mechanical and Nuclear Engineering, The Pennsylvania State University, State College, PA 16803, USA
3
Department of Mechanical and Industrial Engineering, Northeastern University, Boston, MA 02115
4
U.S. Department of Energy, National Energy Technology Laboratory (NETL), Pittsburgh, PA 15236, USA
*
Author to whom correspondence should be addressed.
Appl. Sci. 2017, 7(5), 484; https://doi.org/10.3390/app7050484
Submission received: 2 March 2017
/
Revised: 3 May 2017
/
Accepted: 4 May 2017
/
Published: 6 May 2017
Abstract
:We present a numerical simulation of blood flow in two aneurysmal vessels. Using a multicomponent continuum approach, called mixture theory, the velocity fields and spatial distribution of the red blood cells (RBCs) and the plasma are predicted. Platelet migration is described by a convection-diffusion equation, coupled to the RBC concentration field. The model is applied to study a two-dimensional straight vessel and multiple two-dimensional aneurysm vessels with different neck sizes. The model accurately predicts the enrichment of the platelets near the wall in the straight vessel, agreeing with the experimental measurement quantitatively. The numerical results also show that the near-wall enrichment of the platelets in the parent vessel highly influences the platelet concentration within the aneurysm. The results also indicate that the platelet concentration within the aneurysm increases with Reynolds number and decreases with a smaller neck size. This might have significance on the formation of thrombus (blood clot) within the aneurysm, which in turn may have a protective effect on preventing ruptures. Based on the success with the problems studied, we believe the current model can be a useful tool for analyzing the blood flow and platelets transport within patient specific aneurysms in the future.
Keywords:
blood flow; platelets transport; multiphase flow; RBCs; aneurysm; mixture theory; thrombosis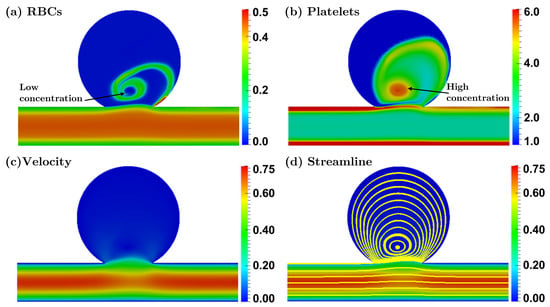
1. Introduction
An intracranial aneurysm is a cerebrovascular disorder in which a weak part of cerebral blood vessels dilates pathologically and there is a possibility of rupture [1,2]. Thrombus (blood clot) formation inside the aneurysm is one of the healing mechanisms [2,3,4]. For example, when there exists unhealthy endothelium in the aneurysm, the thrombus may form, which can significantly lower the risk of rupture [1,2]. Thrombus formation is closely related to various physical and biological factors, including the hemodynamic fields, the distribution of the red blood cells (RBCs), and the concentration of the platelets [5,6,7,8,9,10,11]. Therefore, studying blood flow and platelets transport in the aneurysms is very meaningful both physically and biomedically.
It is known that the RBCs in small blood vessels tend to accumulate near the vessel centerline due to mutual interactions between the cells and plasma, such as the drag and the lift forces, and cell collisions, which further leads to platelets enrichment near the blood vessel wall [12,13,14,15,16,17,18]. Consequently, the platelet concentration in the aneurysm, which is directly connected to the vessel wall, is significantly influenced.
All the evidence indicates that we need to use a multicomponent theory to model blood flow to obtain the important quantities such as the spatial distribution of the RBCs and the platelets. Recently, based on mesoscale simulations which model both the fluid flow and the dynamics of each individual blood cell, such a non-uniform platelets distribution has been predicted successfully in several geometries [14,19,20]. Although these mesoscale simulations successfully replicated the non-uniform platelets distribution, due to their prohibitive computational cost for most engineering-scale problems, a continuum model is necessary. Therefore, in the present study, a continuum multicomponent model is applied. The multicomponent model was previously developed by our group [21,22], in which the flow of the plasma and RBCs are modeled by mixture theory and the platelets transport is modeled by a convection-diffusion equation. The advantage of this continuum approach is its economical computational cost compared with the mesoscale simulations; therefore, it can be potentially applied to very large-scale problems with complex geometries.
2. Mathematical Model
2.1. Governing Equations
Without the electro-magnetic or chemical effects, for a two-component fluid system the governing equations contain the conservation equations for mass, linear and angular momentum. To consider the conservation of the platelets concentration, we apply an additional convection-diffusion equation.
2.1.1. Conservation of Mass
The equations for the conservation of mass in the Eulerian form are (See [23]),
where is the partial derivative in time, div is the divergence operator, the subscript ‘’ refers to the fluid (plasma) phase, and ‘s’ to the solid particles (the RBC) phase, where ,, and are the density of the pure plasma and the pure RBCs in the reference configuration, respectively, is the velocity field and is the volume fraction (hematocrit) of RBCs.
2.1.2. Conservation of Linear Momentum
The governing equations for the linear momentum are,
where and represent the Cauchy stress tensors for the plasma and the RBCs, respectively, and are the body forces, and stands for the interaction forces (exchange of momentum) between the components, (for more information about the derivation operator, see [22]). The balance of the angular momentum implies that, in the absence of couple stresses, the total Cauchy stress tensor is symmetric.
2.1.3. Conservation of Platelets Concentration
In this paper, we do not consider blood to be a three-component fluid (plasma, RBCs and platelets), and we assume that the platelets are influenced by the motion of the plasma and RBCs, but they do not affect the motion of the plasma and the RBCs. This is an assumption and as a result we model the transport of the platelets using a convection-diffusion equation due to the motion of the mixture, composed of plasma and RBCs [24,25,26]:
where is the concentration of platelets, is the velocity of the whole blood flow, and refers to the platelets diffusion flux of platelets in blood [27]. In the next section, we discuss the constitutive relations used in this paper.
2.2. Constitutive Relations
2.2.1. Stress Tensor of the Plasma
We assume that the plasma behaves as a linear viscous fluid,
where is the pressure of the mixture, and are the (constant) first and second coefficients of viscosity of the pure plasma, where , ‘tr’ stands for the trace of a second order tensor, and I is the identity tensor. The second coefficient of the plasma viscosity disappears automatically because we consider the plasma to be incompressible. (See [21,28] for more details).
2.2.2. Stress Tensor of the RBCs
Here, the RBCs are assumed to behave as a non-linear fluid with viscosity dependent on volume fraction and shear rate,
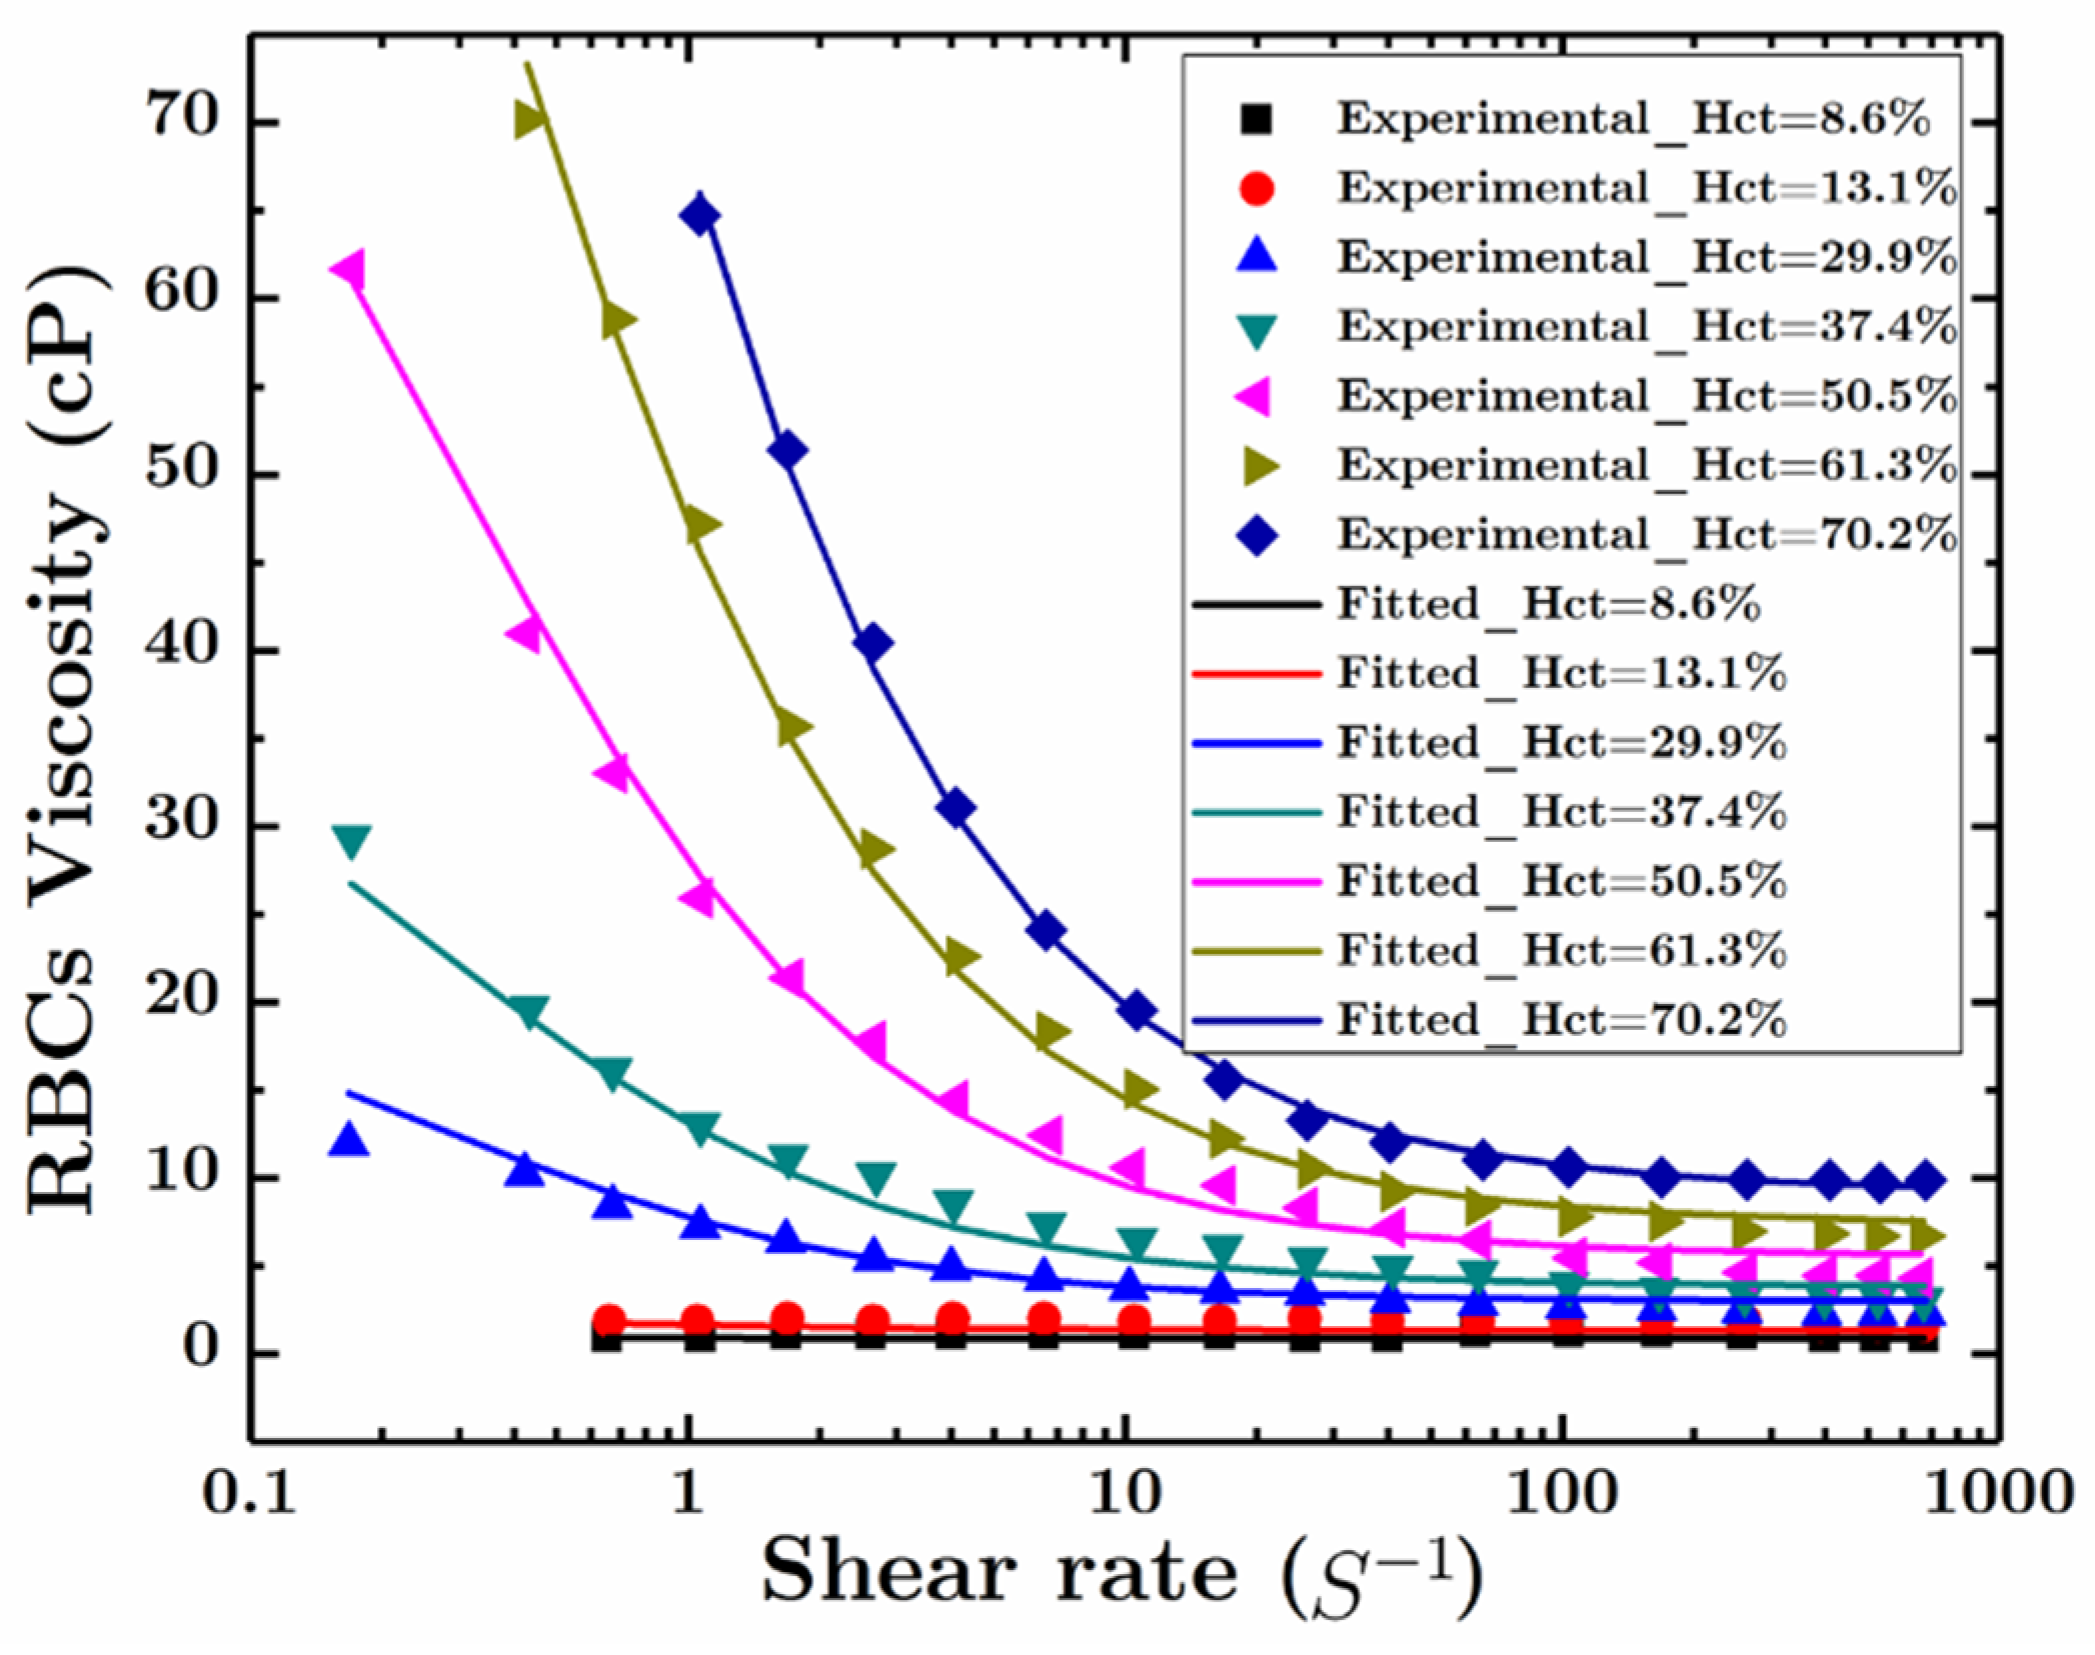
The value of these parameters are fitted using the experimental measurements reported by Brooks [29] (See Figure 1), where
where the unit of and is cP. It is noted that Equations (9a,b) imply that when the hematocrit approaches zero the viscosity of RBCs reduces to zero. One of the outstanding advantages of the current viscosity model is that we use a larger set of experimental data, where the hematocrit ranges from 8.6% to 70.2%; therefore, this correlation is, in a sense, more general and better suited for studying problems when the local hematocrit varies heavily in the flow region [22]. Similar to the plasma, the term disappears automatically, because we consider the RBC component to be incompressible.
2.2.3. Interaction Forces between Plasma and RBCs
For the interaction forces between the two components corresponding to drag and shear lift: (See [30,31]),
where is the diameter of RBCs, here assumed to be 8 , and is the hindrance function suggested by Rusche and Issa [32]. For more information about the interaction force and hindrance function, see [33,34].
2.2.4. The Diffusive Flux of the Platelets
In this section, we discuss the modeling of the platelets’ migration. Usually, the diffusivity of a species transported in the flow can be modeled using a Brownian diffusion approach. However, due to the presentence of the RBCs, the platelets tend to move to the walls of the vessel and the concentration of the platelets near the walls can be several times higher than the concentration near the vessel centerline [14,19,35]. In order to model the RBCs-induced platelets transport, based on the ideas proposed by Phillips et al. [36], Wooton et al. [37] and Hund & Antaki [27], we assume that the platelets diffusion flux, , can be given by,
where is the mixture (whole blood) shear rate, is a function of , based on the experimental data, is the Brownian diffusion constant, and represents the concentration of the platelets in flow. The term represents the dependence of the platelets transport flux intensity on the local shear rate which is proportional to the cells collision frequency; this function disappears as . For the sake of simplicity, we assume , and is an empirical constant from experiments [10]. The term is the diffusive flux of the platelets responsible for the movement away from regions of high RBC content, such as the center of the blood vessel, and represents the RBCs-enhanced diffusion of the platelets in the direction of the gradient of the platelet concentration. We assume that has the following properties: (1) must be a monotonic increasing function of , so that the platelets are always excluded by the RBCs and diffuse to a region with lower volume fraction of the RBCs; (2) When , , which means that when there is no RBC, the RBCs-induced diffusion effect disappears. In the current work, we simply represent as a polynomial function, where,
Through numerical simulations and by quantitatively comparing this with experimental measurements for three benchmark problems, Wu et al. (2017) [38] suggested a polynomial function for ,
In the following section, we will apply the above function to study the blood flow and platelets migration in several representative problems.
3. Results and Discussions
Substituting (6)–(10) into Equations (3) and (4) and Equations (11)–(13) into Equation (5), we obtain the momentum equations in the vectorial form (here we have assumed that both components are incompressible) and the transport equation for the platelets in the scalar form.
The momentum equation for plasma is:
And for the RBCs,
The transport (convection-diffusion) equation for the platelets is,
With the above mathematical model, we built our computational fluid dynamics (CFD) solver based on the libraries provided by OpenFOAM® [39]. For all the cases studied in this paper, we use the following values for the material properties: , and . The body forces, and , refer to gravity, which is ignored due to the large Froude number of the cases studied in the following. We first study the blood flow and platelets transport in a benchmark problem, namely a straight vessel, with different hematocrit. We then study a more practical problem, which is flow in two different aneurysmal vessels. For all cases studied in current work, the hexahedral meshes are generated using ICEM (Version 14.0. ANSYS Inc., Canonsburg, PA, USA). In each of these cases, mesh-dependence studies were performed.
3.1. Blood Flow and Platelets Migration in a Parent Vessel without an Aneurysm
To demonstrate the accuracy of the model, an initial simulation in a straight vessel was performed (See Figure 2). To reduce computational cost, we assume that the flow is two-dimensional. The inlet velocity is 0.5 m/s, and the hematocrit numerically studied are 36% and 42%, respectively. The platelets bulk concentration is . Using the vessel height, inlet velocity, plasma density and plasma viscosity as reference parameters, the Reynolds number of the current problem is about 50. The resulting steady-state concentration profile is provided in Figure 3, for the case of 36% hematocrit, demonstrating excellent agreement with Zhao’s experiments [40]. The relative concentration is defined here as the local platelets concentration divided by the bulk concentration. The simulations also demonstrate that an increase in hematocrit leads to greater enrichment of platelets near the wall.
3.2. Blood Flow and Platelets Migration in Aneurysms
The geometries of the aneurysmal vessels in the current study were adopted from [1,2], as shown in Figure 4. The hematocrit was specified as 42%. The inlet boundary condition was prescribed based on the steady-state results in the straight vessel, as described above. The initial conditions for the RBCs and platelets were set as 0. To evaluate the influence of blood flow rate and neck size of the aneurysm, two geometries and three flow rates were studied. Figure 4a shows the bulbous saccular aneurysm, and Figure 4b represents the bulging saccular aneurysm.
3.2.1. Bulbous Saccular Aneurysm
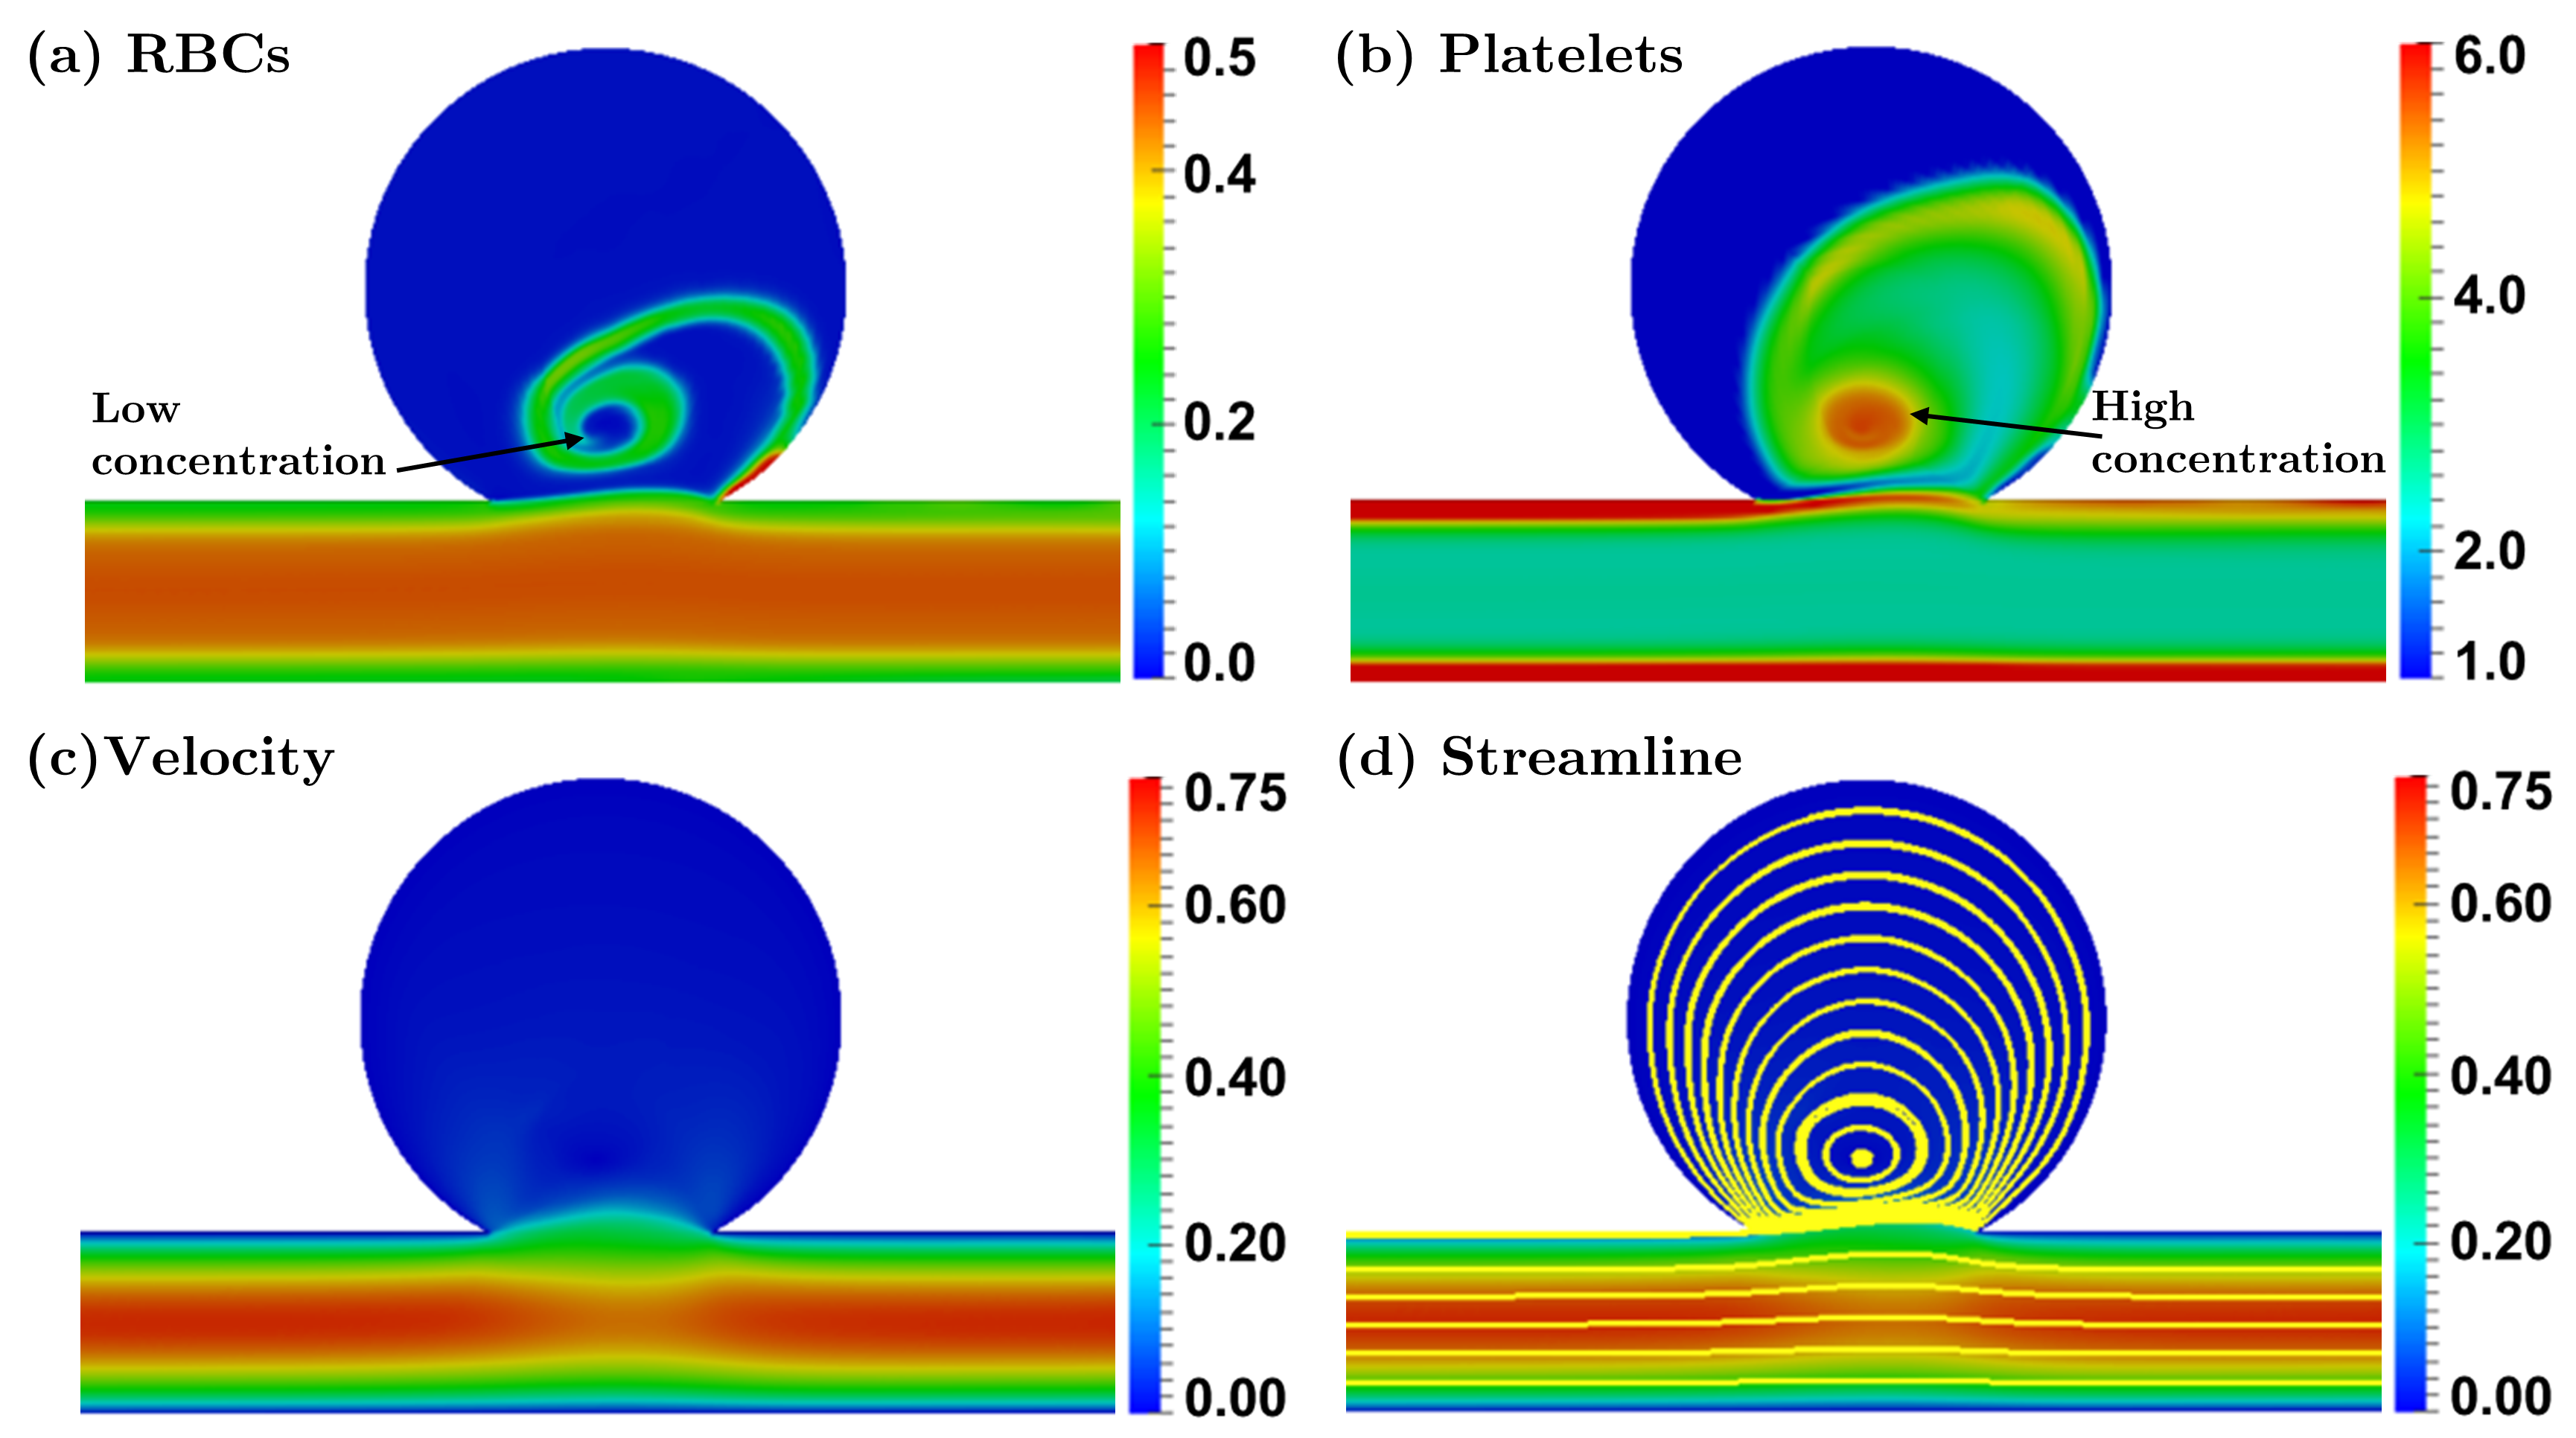
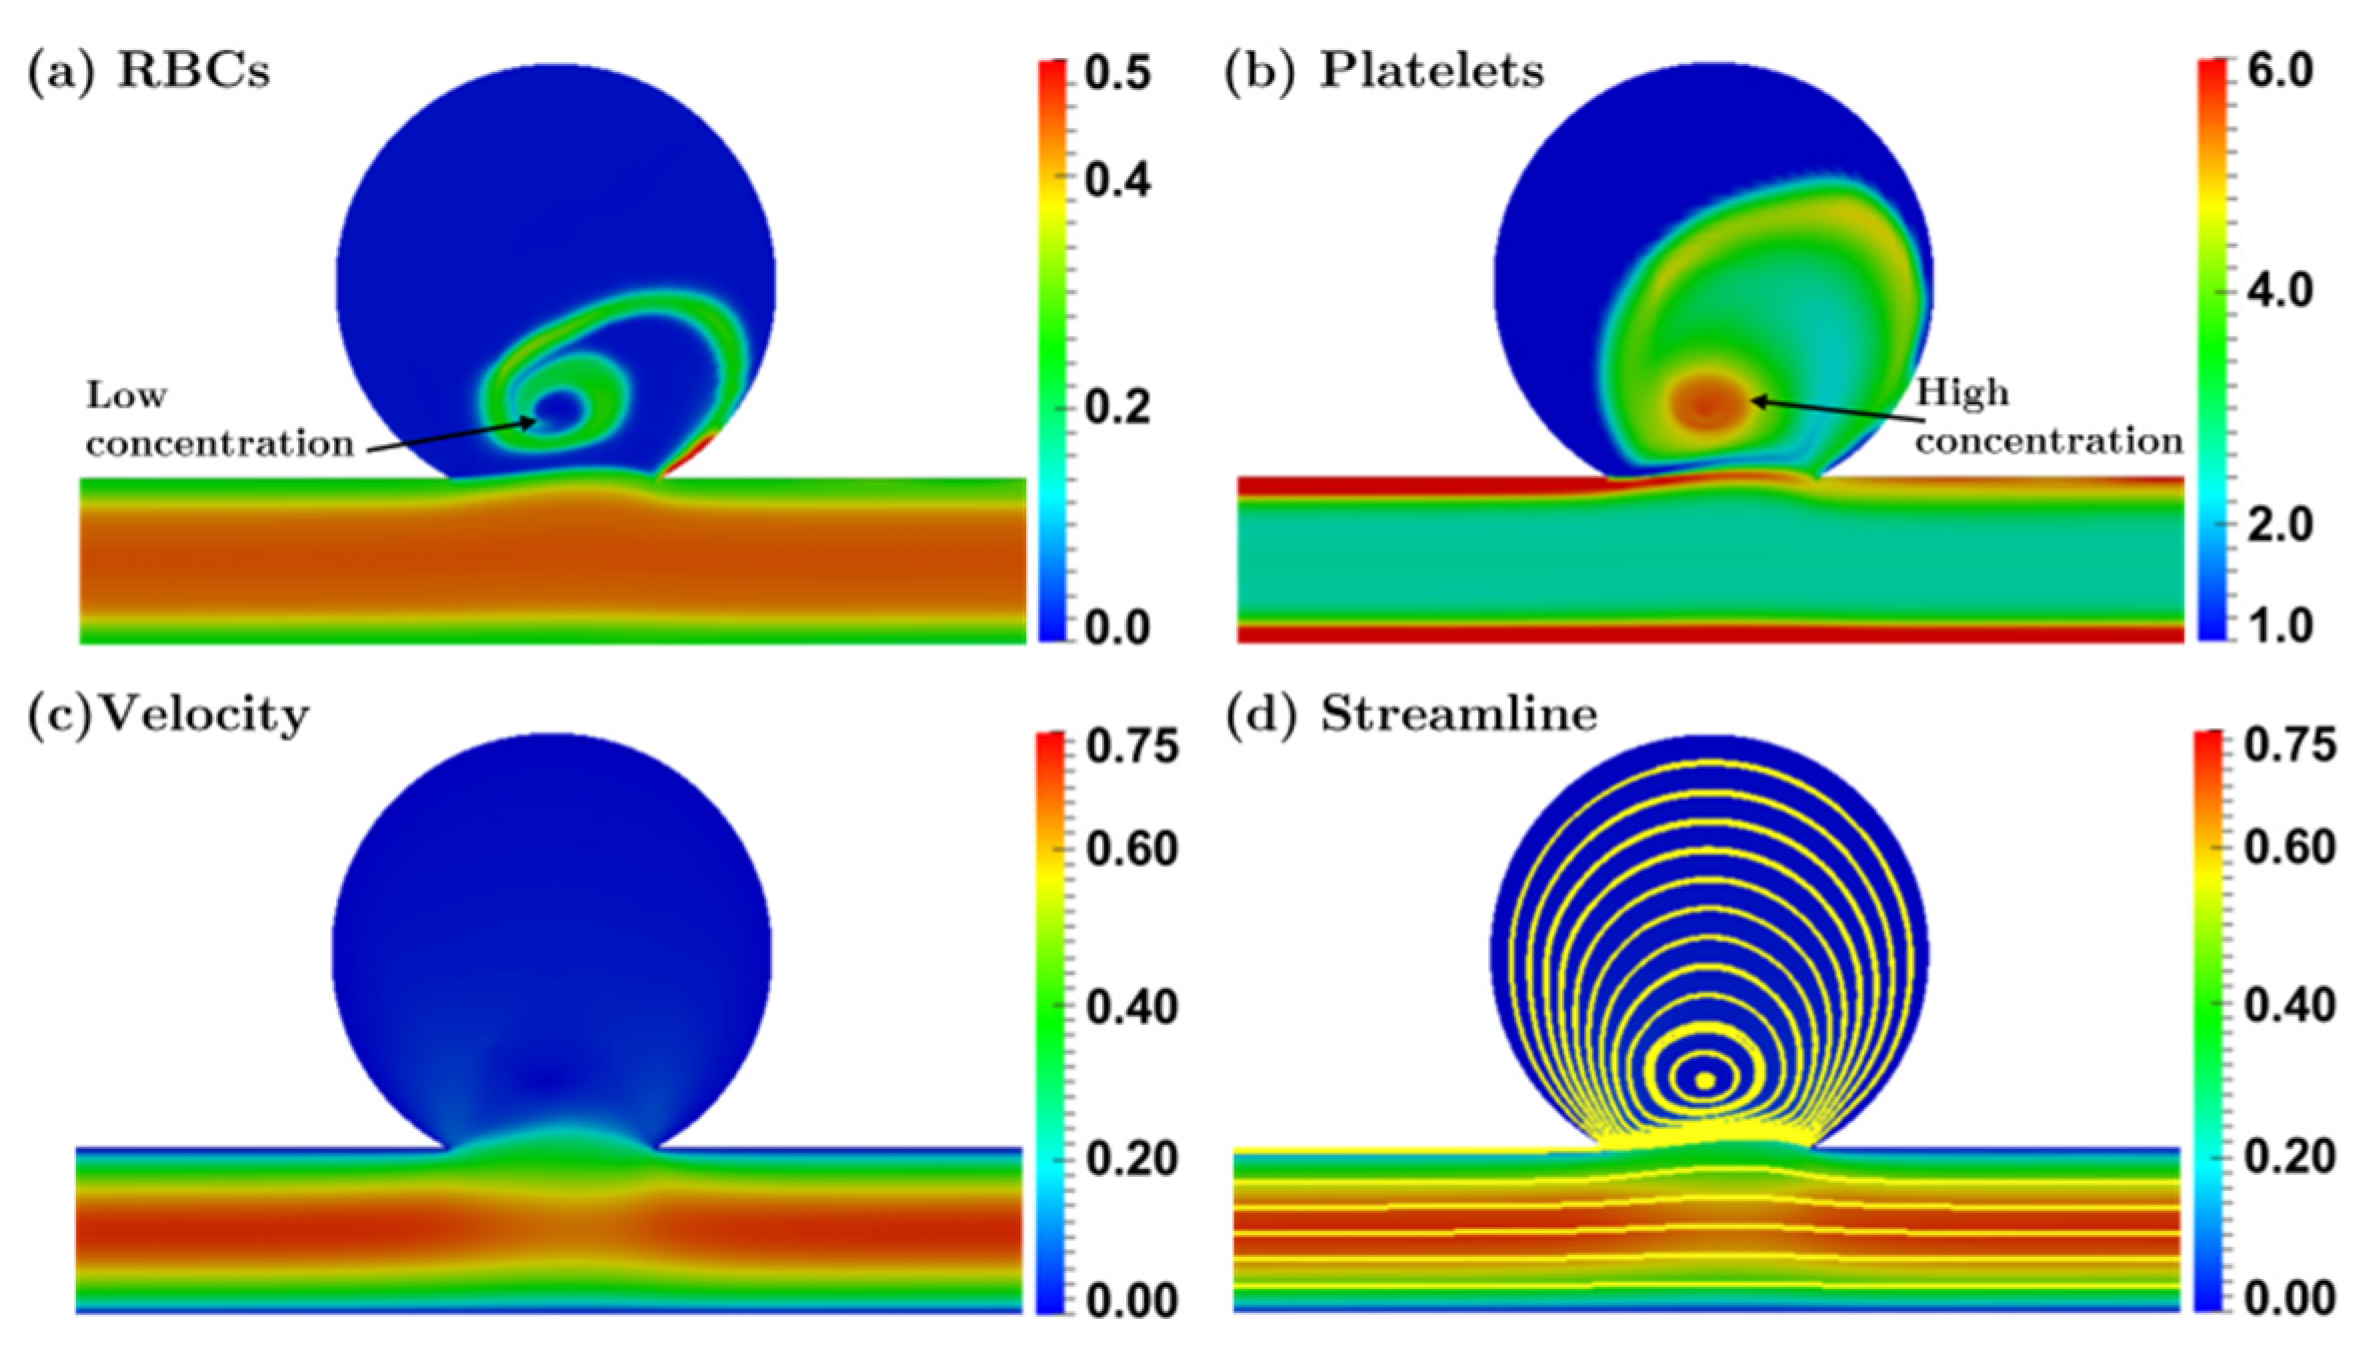
The RBCs concentration in the bulbous saccular aneurysm during the initial filling (dimensionless time . , where is the time, is the inlet velocity and is the vessel height.) is shown in Figure 5a, illustrating that the RBCs are drawn into the aneurysm by a vortex within, as seen in Figure 5d. Figure 5b illustrates the near-wall excess of the platelets from the parent vessel drawn into the aneurysm in a similar fashion. In addition, for the results shown in Figure 5a,b, the RBCs concentration is low while the platelets concentration is quite high near the flow circulation center in the aneurysm. This phenomenon agrees with the platelets transportation model used in this paper. In the model, the platelets tend to move to the region where the RBCs concentration is relatively low. The velocity of whole blood and corresponding streamlines are provided in Figure 5c,d. In the bulbous aneurysm, a purely circulation flow is observed. In such a flow field, the platelets entering into the aneurysm have a large resident time due to the circulation. These resided platelets can be activated and coagulate with a higher possibility compared to the platelets in the mainstream flow outside of the aneurysm.
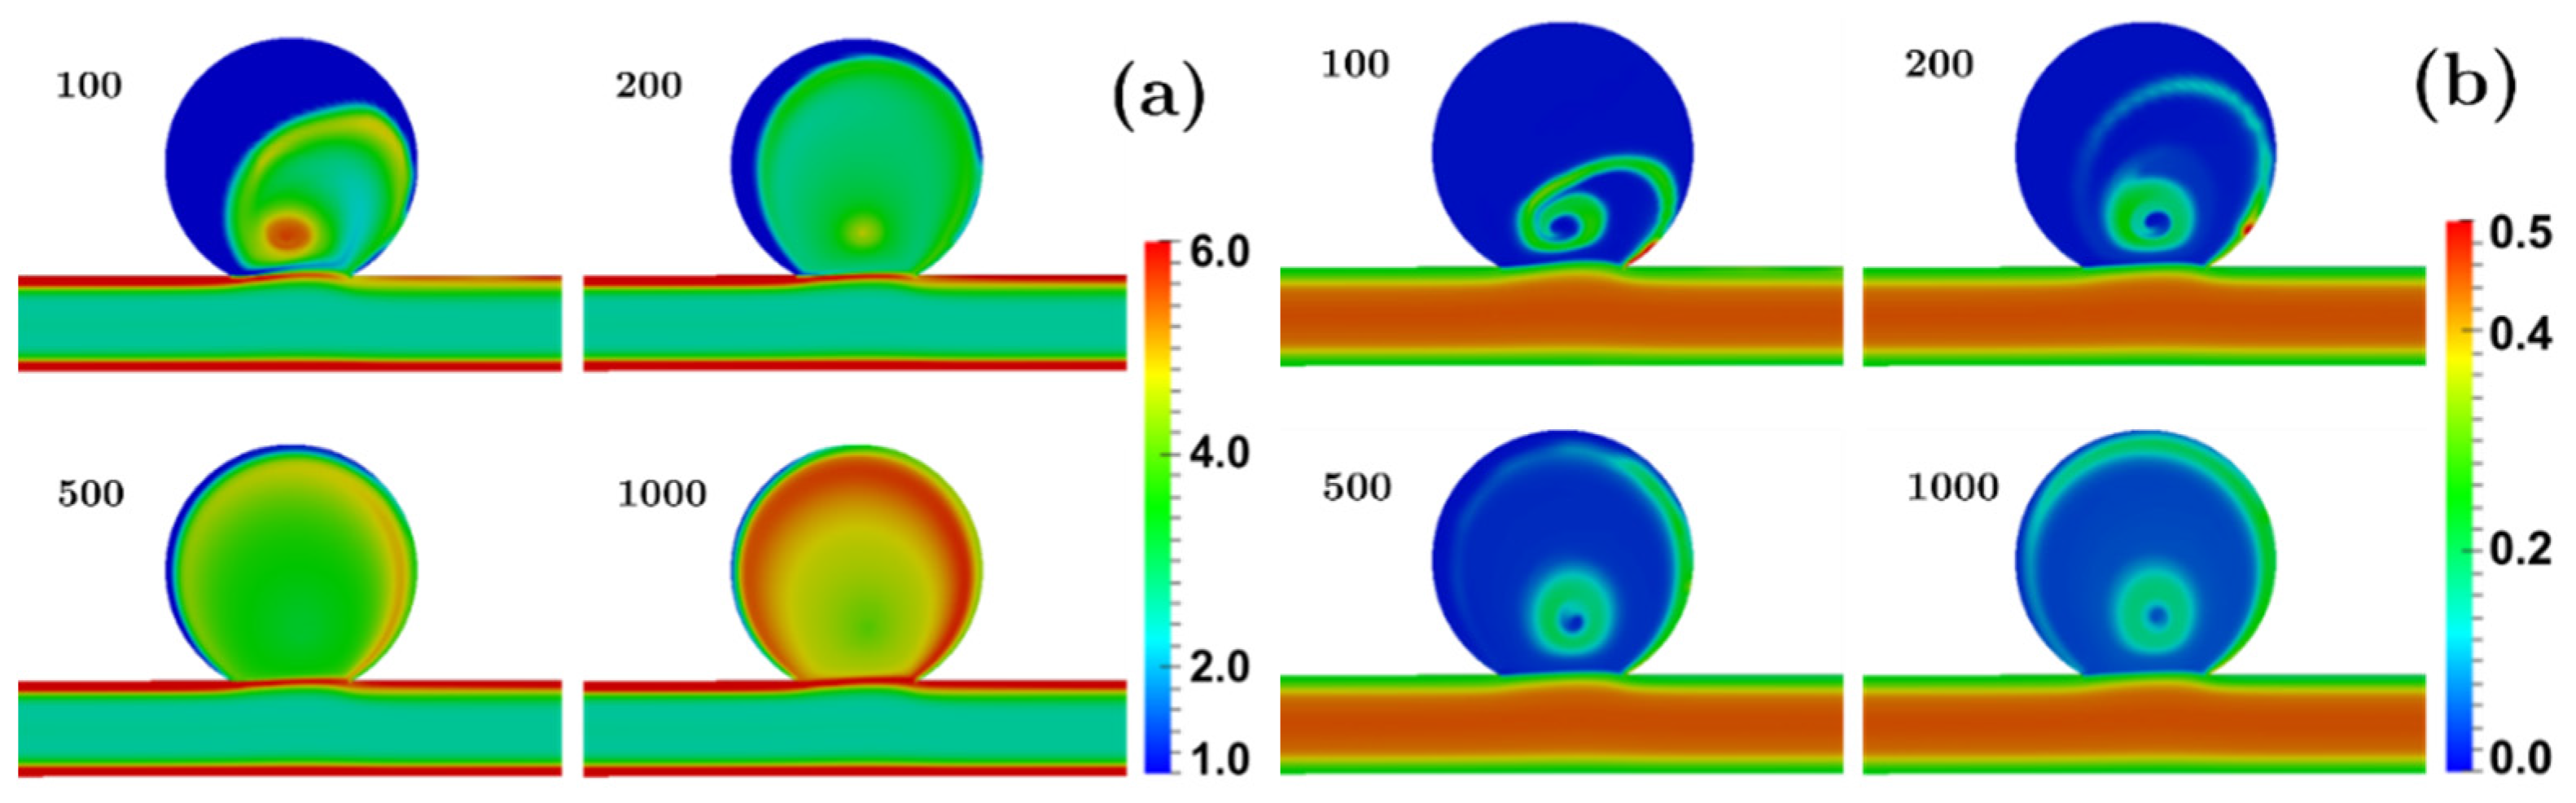
The progression of initial mixing of the RBCs and the platelets in the bulbous saccular aneurysm at different dimensionless time steps is shown in Figure 6a. We can see that as time increases, the platelets concentration in the aneurysm increases gradually and approaches the concentration near the wall of the straight vessel upstream of the aneurysm. Figure 6b shows the RBCs concentration fields at different dimensionless times. Compared to the Figure 6a, the similarity is that both the concentration fields show a circulation pattern; while the difference is that, the amount of the RBCs entering into the aneurysm is much lower than the platelets. This can be attributed to the shear lift force that the RBCs experienced (see Equation (10)): near the neck of the aneurysm the shear lift force still has the tendency of transporting the RBCs to the center of the straight vessel.
3.2.2. Bulging Saccular Aneurysm
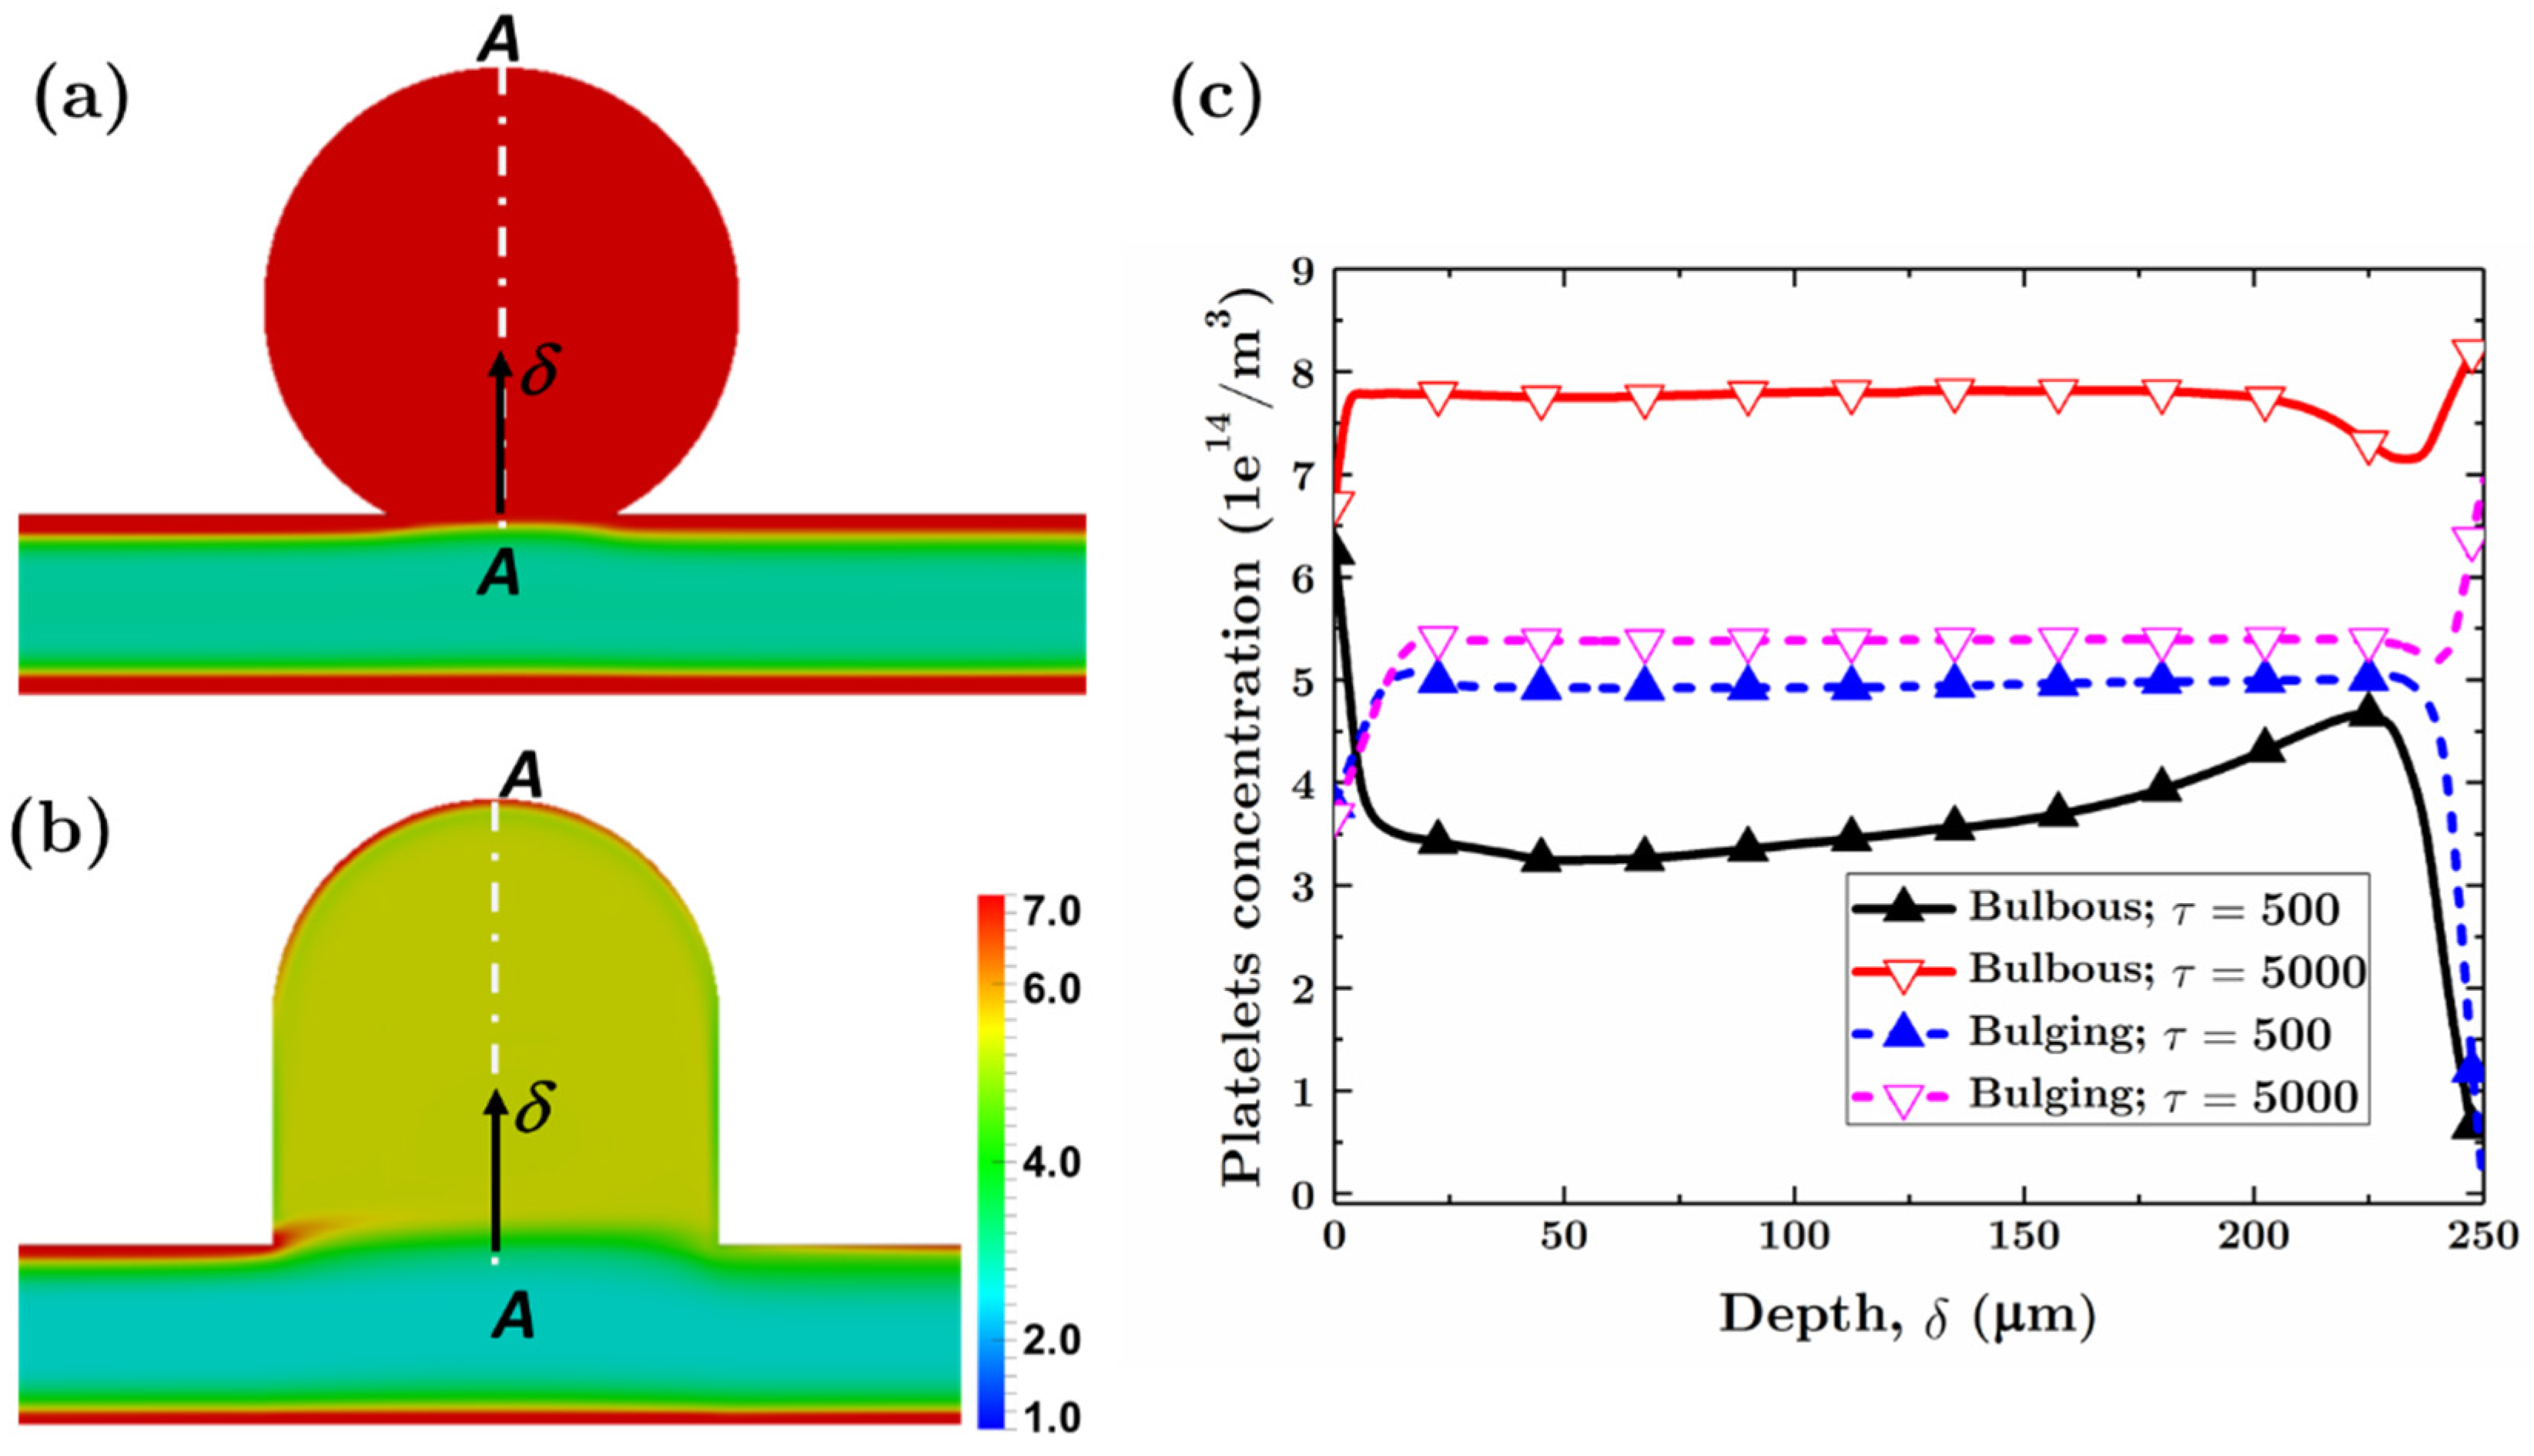
Figure 4b shows the geometry of the bulging saccular aneurysm having a neck, which is twice the size of the bulbous saccular aneurysm. Figure 7 shows the platelet concentration field, the RBCs volume fraction field, and the velocity field in the bulging saccular aneurysm. The difference between the fields in two different aneurysms is obvious. First, for the velocity and streamlines distribution, the vortexes in the bulging saccular aneurysm is not obvious and only exists in the region near corner A (see Figure 7d for the position of corner A). Compared with Figure 5a,b, it is shown that at the dimensionless time point of , the accumulation of the platelets and the RBCs in the bulging saccular aneurysm are much greater than in the bulbous saccular aneurysm. Following the previous case, we also look at the dynamics of the platelets and RBCs migration in the bulging saccular aneurysm at different dimensionless time points. In comparison to Figure 6, Figure 8 shows that the initial mixing of the cells occurs much more quickly than the bulbous saccular aneurysm. This can be explained by the relatively weak circulation in the bulging saccular aneurysm. This velocity field also causes the cells to transport out of the aneurysm, therefore decreasing the dwell time. This has the additional effect of reducing the steady-state concentration of the platelets in the bulging saccular aneurysm, although the initial mixing is faster. To further exemplify this, Figure 9a and b indicate the platelets concentration fields in the bulbous saccular aneurysm and the bulging saccular aneurysm at when the flow fields have changed little over time. We can clearly see that the accumulation of the platelets in the bulbous saccular aneurysm is obviously higher. This is illustrated quantitatively in Figure 9c which shows the platelets concentration profiles along the center line of the aneurysms (lines A-A as defined in Figure 9a,b) at and .
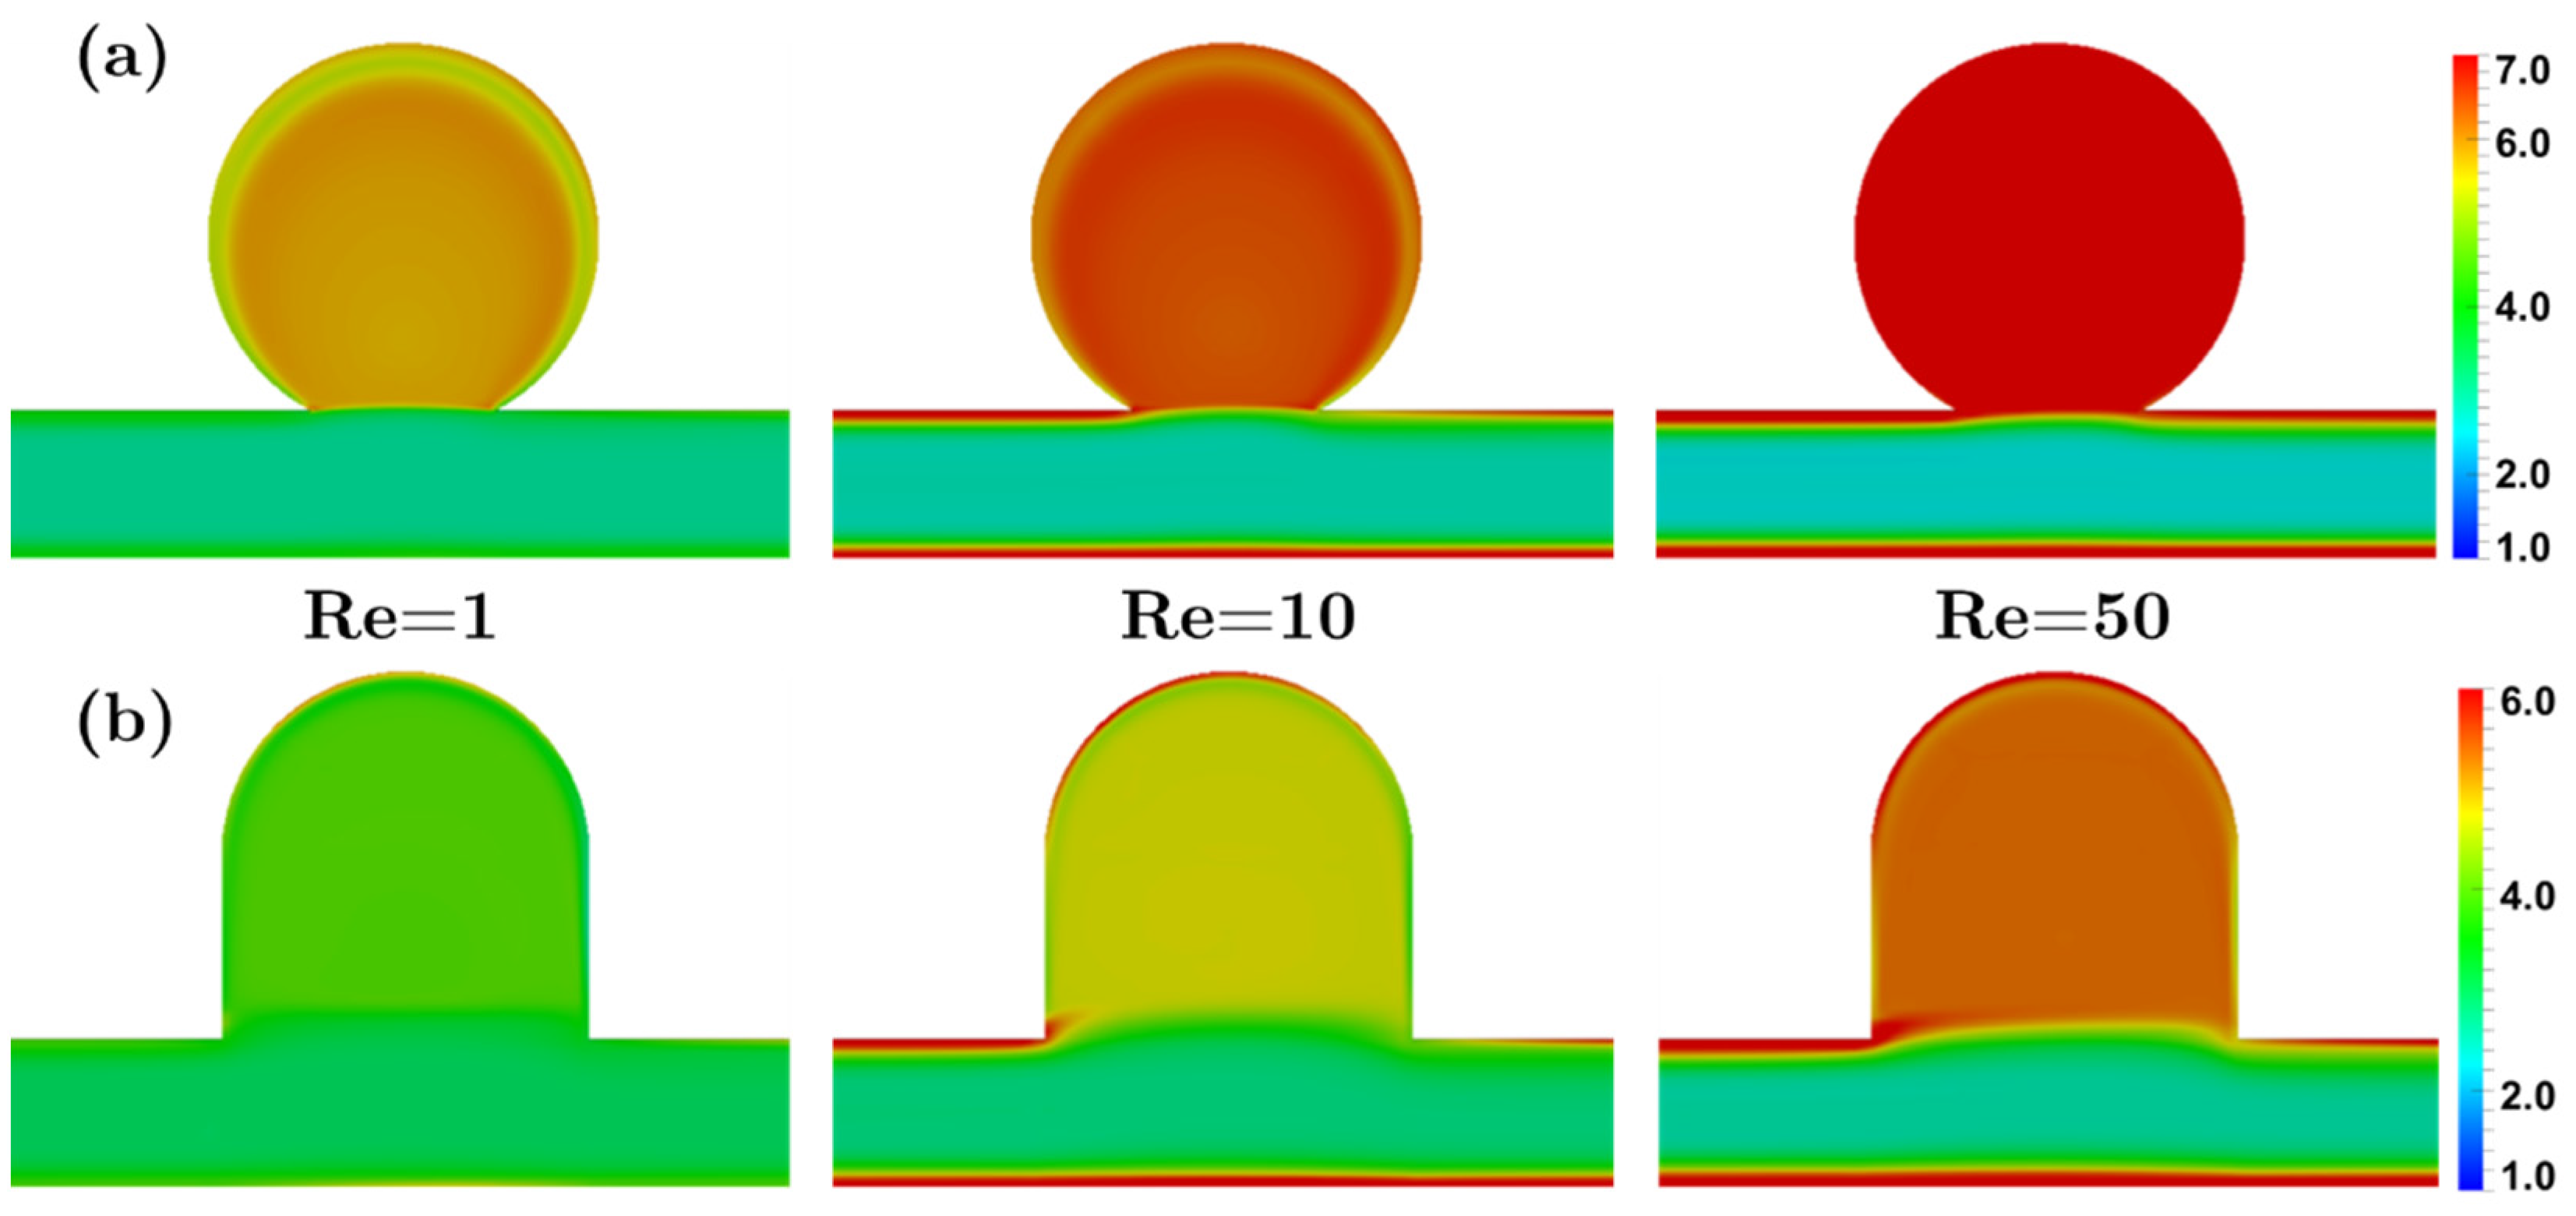
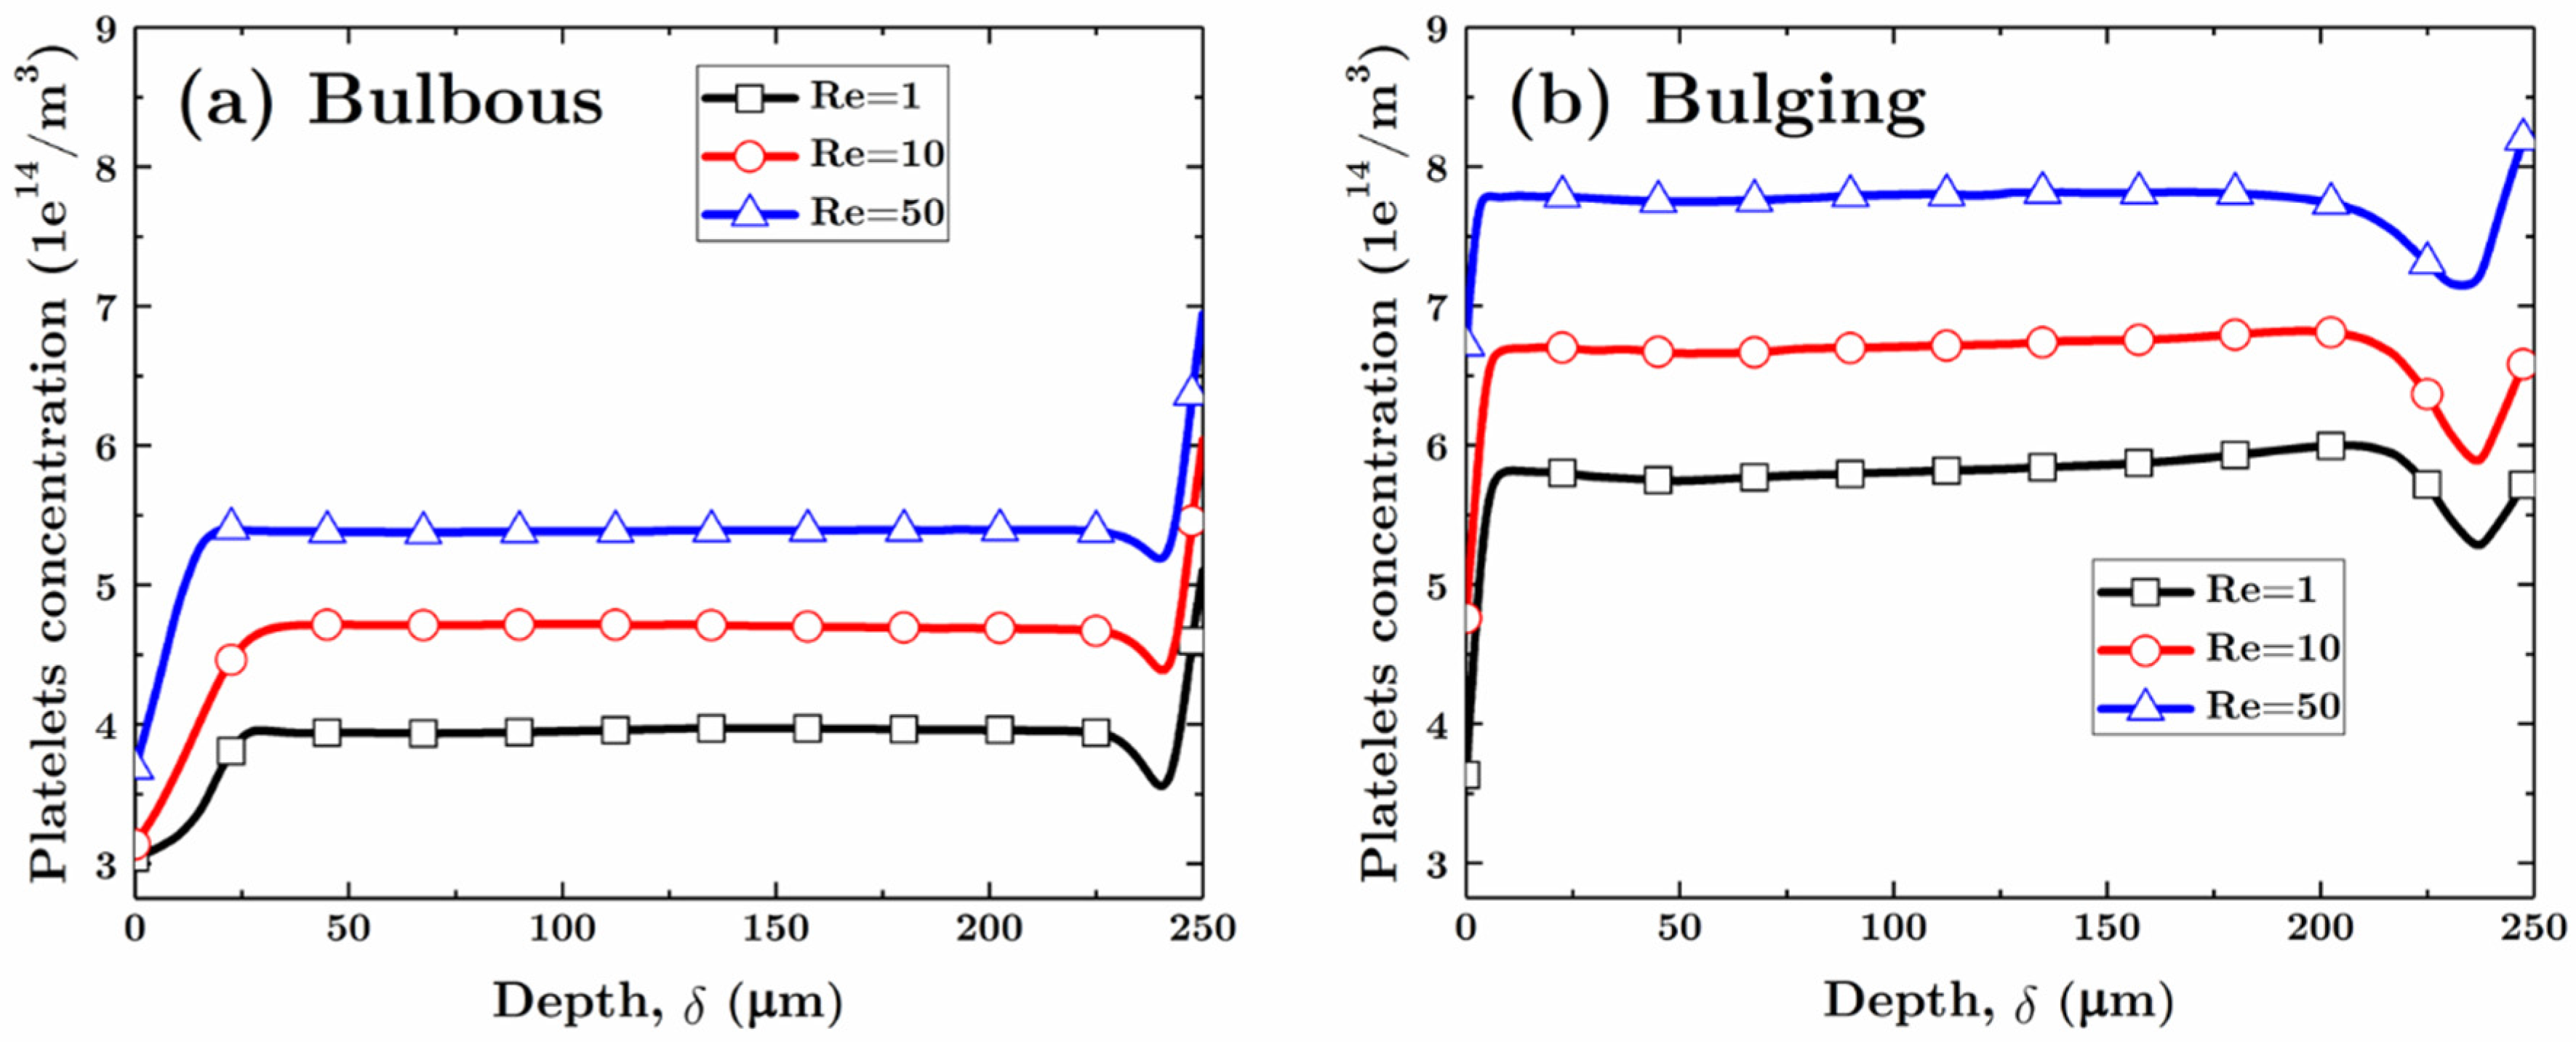
The effect of flow rate (Reynolds number) is illustrated in Figure 10 (at ) in the bulbous and bulging saccular aneurysms. When the Reynolds number increases, the platelets concentration near the wall of the upstream vessel increases, which is known to be attributed to the transport of RBCs towards the core [21]. As a result, the near-wall enrichment layer of platelets flows into the aneurysm. For the aneurysm with the small neck, the RBC gradient is preserved, which constrains the platelets to remain within the aneurism. On the other hand, the wide neck of the bulging aneurism permits the RBC gradient to dissipate, hence reducing its constraining effect, and permitting platelets to escape, particularly at the downstream region (See Figure 10a,b). This disparity is emphasized with an increasing Reynolds number. Figure 11 quantitatively illustrates this effect. As Re increases, the platelets concentration increases monotonically, but not proportionately. However, the concentration patterns are similar.
According to the observations above, it can be observed that the concentration of platelets in the aneurysm tends to increase with a smaller aneurysm neck size or a larger Reynolds number. Specifically, the smaller neck promotes the circulation within the aneurysm and prevents platelets from escaping. The combination of higher concentration and dwell time of platelets increases the probability of activation, and thus coagulation. This, in turn, influences clot formation in the aneurysm, which is known to be one of the healing mechanisms [2,3,4] and may be helpful for preventing rupture. However, if a clot formed within the aneurysm embolizes, it may have a deleterious effect, such as stroke.
A limitation of this study is the applied lift force model, see Equation (10), which was based exclusively on shear lift, derived from classical multicomponent theory [31,41,42]. Although this model has been effective in predicting moderate RBC depletion near the wall, it is not capable of predicting near-wall RBCs free layer. Therefore, an improvement would be to introduce the wall effect which is influenced by the particle deformability and the distance from the wall, as described by Pranay et al. (2012) [43] Grandchamp et al. (2013) [44], and Kumar et al. (2012) [45]. Another limitation is the use of 2D approximation of a spheroidal domain. This was done to economize computational time, inasmuch as each simulation required about 24 h to reach steady state using 4 CPUs at 2.7 GHz. This was due to the relatively slow process for development of the concentration fields (RBCs and platelets) in the aneurysms. However, the key observations in this study are likely to reflect the 3-D case, since the secondary flow in the azimuthal direction is negligible. The reported results accentuate the importance of a multi-phase model on platelet transport, and motivate further study of thrombosis in aneurisms using this simulation model.
4. Conclusions
In this paper, we have used a multicomponent approach to model the blood flow and the RBCs-induced platelets transport in two aneurysmal vessels. The model used here is based on a continuum approach that achieves a compromise between complexity and scale. The advantage of this approach is that it can potentially be applied to engineering-scale problems with very large scale and complex geometries. The model accurately predicted the phenomenon of the platelets enrichment near the walls of the straight vessel, agreeing well with the experimental observations quantitatively. For a straight vessel, such a high concentration layer of the platelets near the wall is beneficial for the healing of an injured vessel site; for an aneurysmal vessel, because this high concentration layer is directly connected to the aneurysm, and thus the platelets concentration in the aneurysm is much higher than the bulk concentration. These results also illustrated that the platelet concentration is higher in the aneurysm with a smaller neck or a larger Reynolds number. This may enhance the thrombus formation within the aneurysm, which can lower the risk of rupture but it may also increase the risk of stroke if the thrombus embolizes into the blood circulation system.
Acknowledgments
This research was supported by NIH grant 1 R01 HL089456.
Author Contributions
W.-T.W. and Y.L. did all the numerical simulations. W. -T.W. and M.M. derived all the equations. J.F.A., N.A. and M.M. supervised this work. All of the authors have provided substantial contributions to the manuscript preparation.
Conflicts of Interest
The authors declare no conflict of interest.
References
- Hirabayashi, M.; Ohta, M.; Rüfenacht, D.A.; Chopard, B. Characterization of flow reduction properties in an aneurysm due to a stent. Phys. Rev. E 2003, 68, 21918. [Google Scholar] [CrossRef] [PubMed]
- Mountrakis, L.; Lorenz, E.; Hoekstra, A.G. Where do the platelets go? A simulation study of fully resolved blood flow through aneurysmal vessels. Interface Focus 2013, 3, 20120089. [Google Scholar] [CrossRef] [PubMed]
- Whittle, I.R.; Dorsch, N.W.; Besser, M. Spontaneous thrombosis in giant intracranial aneurysms. J. Neurol. Neurosurg. Psychiatry 1982, 45, 1040–1047. [Google Scholar] [CrossRef] [PubMed]
- Weir, B. Unruptured intracranial aneurysms: A review. J. Neurosurg. 2002, 96, 3–42. [Google Scholar] [CrossRef] [PubMed]
- Badimon, L.; Badimon, J.J.; Turitto, V.T.; Fuster, V. Thrombosis: Studies under flow conditions. Ann. N. Y. Acad. Sci. 1987, 516, 427–540. [Google Scholar] [CrossRef]
- Badimon, L.; Turitto, V.; Rosemark, J.A.; Badimon, J.J.; Fuster, V. Characterization of a tubular flow chamber for studying platelet interaction with biologic and prosthetic materials: Deposition of indium 111-labeled platelets on collagen, subendothelium, and expanded polytetrafluoroethylene. J. Lab. Clin. Med. 1987, 110, 706–718. [Google Scholar] [PubMed]
- Adams, P.C.; Fuster, V.; Badimon, L.; Badimon, J.J.; Chesebro, J.H. Platelet/Vessel wall interactions, rheologic factors and thrombogenic substrate in acute coronary syndromes: Preventive strategies. Am. J. Cardiol. 1987, 60, G9–G16. [Google Scholar] [CrossRef]
- Merino, A.; Cohen, M.; Badimon, J.J.; Fuster, V.; Badimon, L. Synergistic action of severe wall injury and shear forces on thrombus formation in arterial stenosis: Definition of a thrombotic shear rate threshold. J. Am. Coll. Cardiol. 1994, 24, 1091–1097. [Google Scholar] [CrossRef]
- Sing, C.E.; Alexander-Katz, A. Elongational flow induces the unfolding of von Willebrand factor at physiological flow rates. Biophys. J. 2010, 98, L35–L37. [Google Scholar] [CrossRef] [PubMed]
- Wu, W.-T.; Jamiolkowski, M.A.; Wagner, W.R.; Aubry, N.; Massoudi, M.; Antaki, J.F. Multi-Constituent Simulation of Thrombus Deposition. Sci. Rep. 2017, 7, 42720. [Google Scholar] [CrossRef] [PubMed]
- Wu, W.-T.; Yang, F.; Wu, J.; Aubry, N.; Massoudi, M.; Antaki, J.F. High fidelity computational simulation of thrombus formation in Thoratec HeartMate II continuous flow ventricular assist device. Sci. Rep. 2016, 6, 38025. [Google Scholar] [CrossRef] [PubMed]
- Goldsmith, H.L.; Turitto, V.T. Rheological aspects of thrombosis and haemostasis: Basic principles and applications. ICTH-Report--Subcommittee on Rheology of the International Committee on Thrombosis and Haemostasis. Thromb. Haemost. 1986, 55, 415–435. [Google Scholar] [PubMed]
- Turitto, V.T.; Benis, A.M.; Leonard, E.F. Platelet Diffusion in Flowing Blood. Ind. Eng. Chem. Fundam. 1972, 11, 216–223. [Google Scholar] [CrossRef]
- AlMomani, T.; Udaykumar, H.S.; Marshall, J.S.; Chandran, K.B. Micro-scale dynamic simulation of erythrocyte–platelet interaction in blood flow. Ann. Biomed. Eng. 2008, 36, 905–920. [Google Scholar] [CrossRef] [PubMed]
- Cadroy, Y.; Hanson, S.R. Effects of red blood cell concentration on hemostasis and thrombus formation in a primate model. Blood 1990, 75, 2185–2193. [Google Scholar] [PubMed]
- Joist, J.H.; Bauman, J.E.; Sutera, S.P. Platelet adhesion and aggregation in pulsatile shear flow: Effects of red blood cells. Thromb. Res. 1998, 92, S47–S52. [Google Scholar] [CrossRef]
- Peerschke, E.I.; Silver, R.T.; Weksler, B.B.; Yin, W.; Bernhardt, B.; Varon, D. Examination of platelet function in whole blood under dynamic flow conditions with the cone and plate(let) analyzer: Effect of erythrocytosis and thrombocytosis. Am. J. Clin. Pathol. 2007, 127, 422–428. [Google Scholar] [CrossRef] [PubMed]
- Turitto, V.T.; Weiss, H.J. Red blood cells: Their dual role in thrombus formation. Science 1980, 207, 541–543. [Google Scholar] [CrossRef] [PubMed]
- Reasor, D.A.; Mehrabadi, M.; Ku, D.N.; Aidun, C.K. Determination of critical parameters in platelet margination. Ann. Biomed. Eng. 2013, 41, 238–249. [Google Scholar] [CrossRef] [PubMed]
- Skorczewski, T.; Erickson, L.C.; Fogelson, A.L. Platelet motion near a vessel wall or thrombus surface in two-dimensional whole blood simulations. Biophys. J. 2013, 104, 1764–1772. [Google Scholar] [CrossRef] [PubMed]
- Wu, W.-T.; Aubry, N.; Massoudi, M.; Kim, J.; Antaki, J.F. A numerical study of blood flow using mixture theory. Int. J. Eng. Sci. 2014, 76, 56–72. [Google Scholar] [CrossRef] [PubMed]
- Wu, W.-T.; Yang, F.; Antaki, J.F.; Aubry, N.; Massoudi, M. Study of blood flow in several benchmark micro-channels using a two-fluid approach. Int. J. Eng. Sci. 2015, 95, 49–59. [Google Scholar] [CrossRef] [PubMed]
- Bowen, R.M. Theory of Mixtures; Academic Press Inc.: New York, NY, USA, 1976; Volume 3. [Google Scholar]
- Bridges, C.; Karra, S.; Rajagopal, K.R. On modeling the response of the synovial fluid: Unsteady flow of a shear-thinning, chemically-reacting fluid mixture. Comput. Math. Appl. 2010, 60, 2333–2349. [Google Scholar] [CrossRef]
- Massoudi, M.; Uguz, A.K. Chemically-reacting fluids with variable transport properties. Appl. Math. Comput. 2012, 219, 1761–1775. [Google Scholar] [CrossRef]
- Wu, W.-T.; Massoudi, M. Heat Transfer and Dissipation Effects in the Flow of a Drilling Fluid. Fluids 2016, 1, 4. [Google Scholar] [CrossRef]
- Hund, S.J.; Antaki, J.F. An extended convection diffusion model for red blood cell-enhanced transport of thrombocytes and leukocytes. Phys. Med. Biol. 2009, 54, 6415–6435. [Google Scholar] [CrossRef] [PubMed]
- Kim, J.; Massoudi, M.; Antaki, J.F.; Gandini, A. Removal of malaria-infected red blood cells using magnetic cell separators: A computational study. Appl. Math. Comput. 2012, 218, 6841–6850. [Google Scholar] [CrossRef] [PubMed]
- Brooks, D.E.; Goodwin, J.W.; Seaman, G.V. Interactions among erythrocytes under shear. J. Appl. Physiol. 1970, 28, 172–177. [Google Scholar] [PubMed]
- Johnson, G.; Massoudi, M.; Rajagopal, K.R. Flow of a fluid—Solid mixture between flat plates. Chem. Eng. Sci. 1991, 46, 1713–1723. [Google Scholar] [CrossRef]
- Massoudi, M. Constitutive relations for the interaction force in multicomponent particulate flows. Int. J. Non-Linear Mech. 2003, 38, 313–336. [Google Scholar] [CrossRef]
- Rusche, H.; Issa, R.I. The Effect of Voidage on the Drag Force on Particles, Droplets and Bubbles in Dispersed Two-Phase Flow. In Proceedings of the 2nd Japanese-European Two-Phase Flow Group Meeting, Tsukuba, Japan, 25–29 September 2000. [Google Scholar]
- Wu, W.-T.; Aubry, N.; Massoudi, M. On the coefficients of the interaction forces in a two-phase flow of a fluid infused with particles. Int. J. Non-Linear Mech. 2014, 59, 76–82. [Google Scholar] [CrossRef]
- Massoudi, M.; Antaki, J.F. An Anisotropic Constitutive Equation for the Stress Tensor of Blood Based on Mixture Theory. Math. Probl. Eng. 2008, 2008, 1–30. [Google Scholar] [CrossRef]
- Zhao, R.; Marhefka, J.N.; Shu, F.; Hund, S.J.; Kameneva, M.V.; Antaki, J.F. Micro-flow visualization of red blood cell-enhanced platelet concentration at sudden expansion. Ann. Biomed. Eng. 2008, 36, 1130–1141. [Google Scholar] [CrossRef] [PubMed]
- Phillips, R.J.; Armstrong, R.C.; Brown, R.A.; Graham, A.L.; Abbott, J.R. A constitutive equation for concentrated suspensions that accounts for shear-induced particle migration. Phys. Fluids A Fluid Dyn. 1992, 4, 30–40. [Google Scholar] [CrossRef]
- Wootton, D.M.; Ku, D.N. Fluid mechanics of vascular systems, diseases, and thrombosis. Annu. Rev. Biomed. Eng. 1999, 1, 299–329. [Google Scholar] [CrossRef] [PubMed]
- Wu, W.-T.; Aubry, N.; Antaki, J.F.; Massoudi, M. Transport of platelets induced by red blood cells based on mixture theory. arXiv Prepr. 2017. [Google Scholar]
- OpenCFD. OpenFOAM Programmer’s Guide Version 2.1.0; OpenCFD, Ed.; Free Software Foundation, Inc.: Boston, MA, USA, 2011. [Google Scholar]
- Zhao, R.; Marhefka, J.N.; Antaki, J.F.; Kameneva, M.V. Drag-reducing polymers diminish near-wall concentration of platelets in microchannel blood flow. Biorheology 2010, 47, 193–203. [Google Scholar] [PubMed]
- Drew, D.A.; Segel, L.A. Averaged equations for two-phase flows. Stud. Appl. Math. 1971, 50, 205–231. [Google Scholar] [CrossRef]
- Müller, I. A thermodynamic theory of mixtures of fluids. Arch. Ration. Mech. Anal. 1968, 28, 1–39. [Google Scholar] [CrossRef]
- Pranay, P.; Henríquez-Rivera, R.G.; Graham, M.D. Depletion layer formation in suspensions of elastic capsules in Newtonian and viscoelastic fluids. Phys. Fluids 2012, 24, 61902. [Google Scholar] [CrossRef]
- Grandchamp, X.; Coupier, G.; Srivastav, A.; Minetti, C.; Podgorski, T. Lift and down-gradient shear-induced diffusion in red blood cell suspensions. Phys. Rev. Lett. 2013, 110, 108101. [Google Scholar] [CrossRef] [PubMed]
- Kumar, A.; Graham, M.D. Mechanism of margination in confined flows of blood and other multicomponent suspensions. Phys. Rev. Lett. 2012, 109, 108102. [Google Scholar] [CrossRef] [PubMed]
Figure 1.
Viscosity of the red blood cells (RBCs) as a function of the shear rate. Experimental data is by Brooks [29]. The figure is reused with permission from [22], Copyright Elsevier, 2015.

Figure 2.
Schematic of the straight vessel.
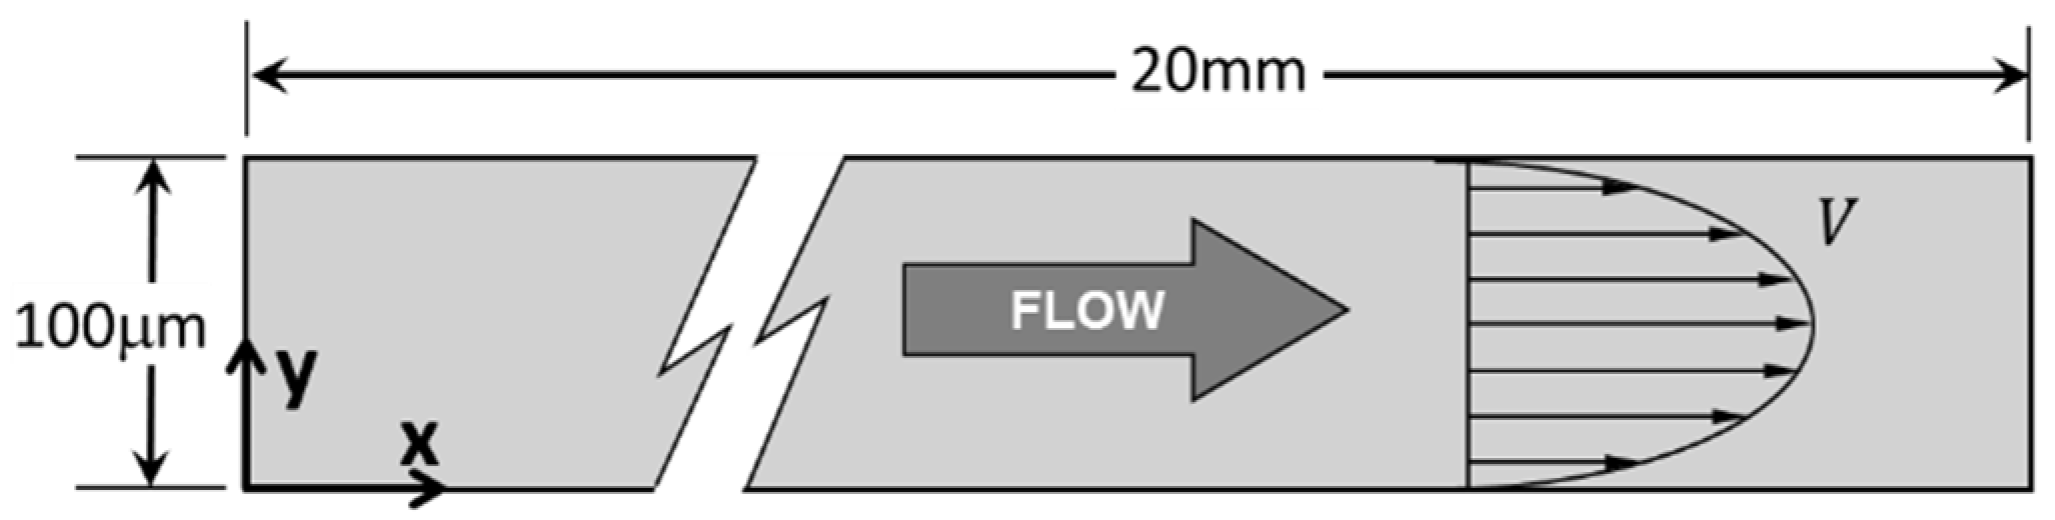
Figure 3.
The numerical and experimental results for the relative platelets concentration along the y-direction [40]. The relative concentration is defined as the local concentration divided by the bulk concentration of the platelets. The simulated hematocrits are 36% and 42% and the experimental hematocrit is 36%. The inlet velocity is 0.5 m/s (Re = 50). The platelets bulk concentration is .
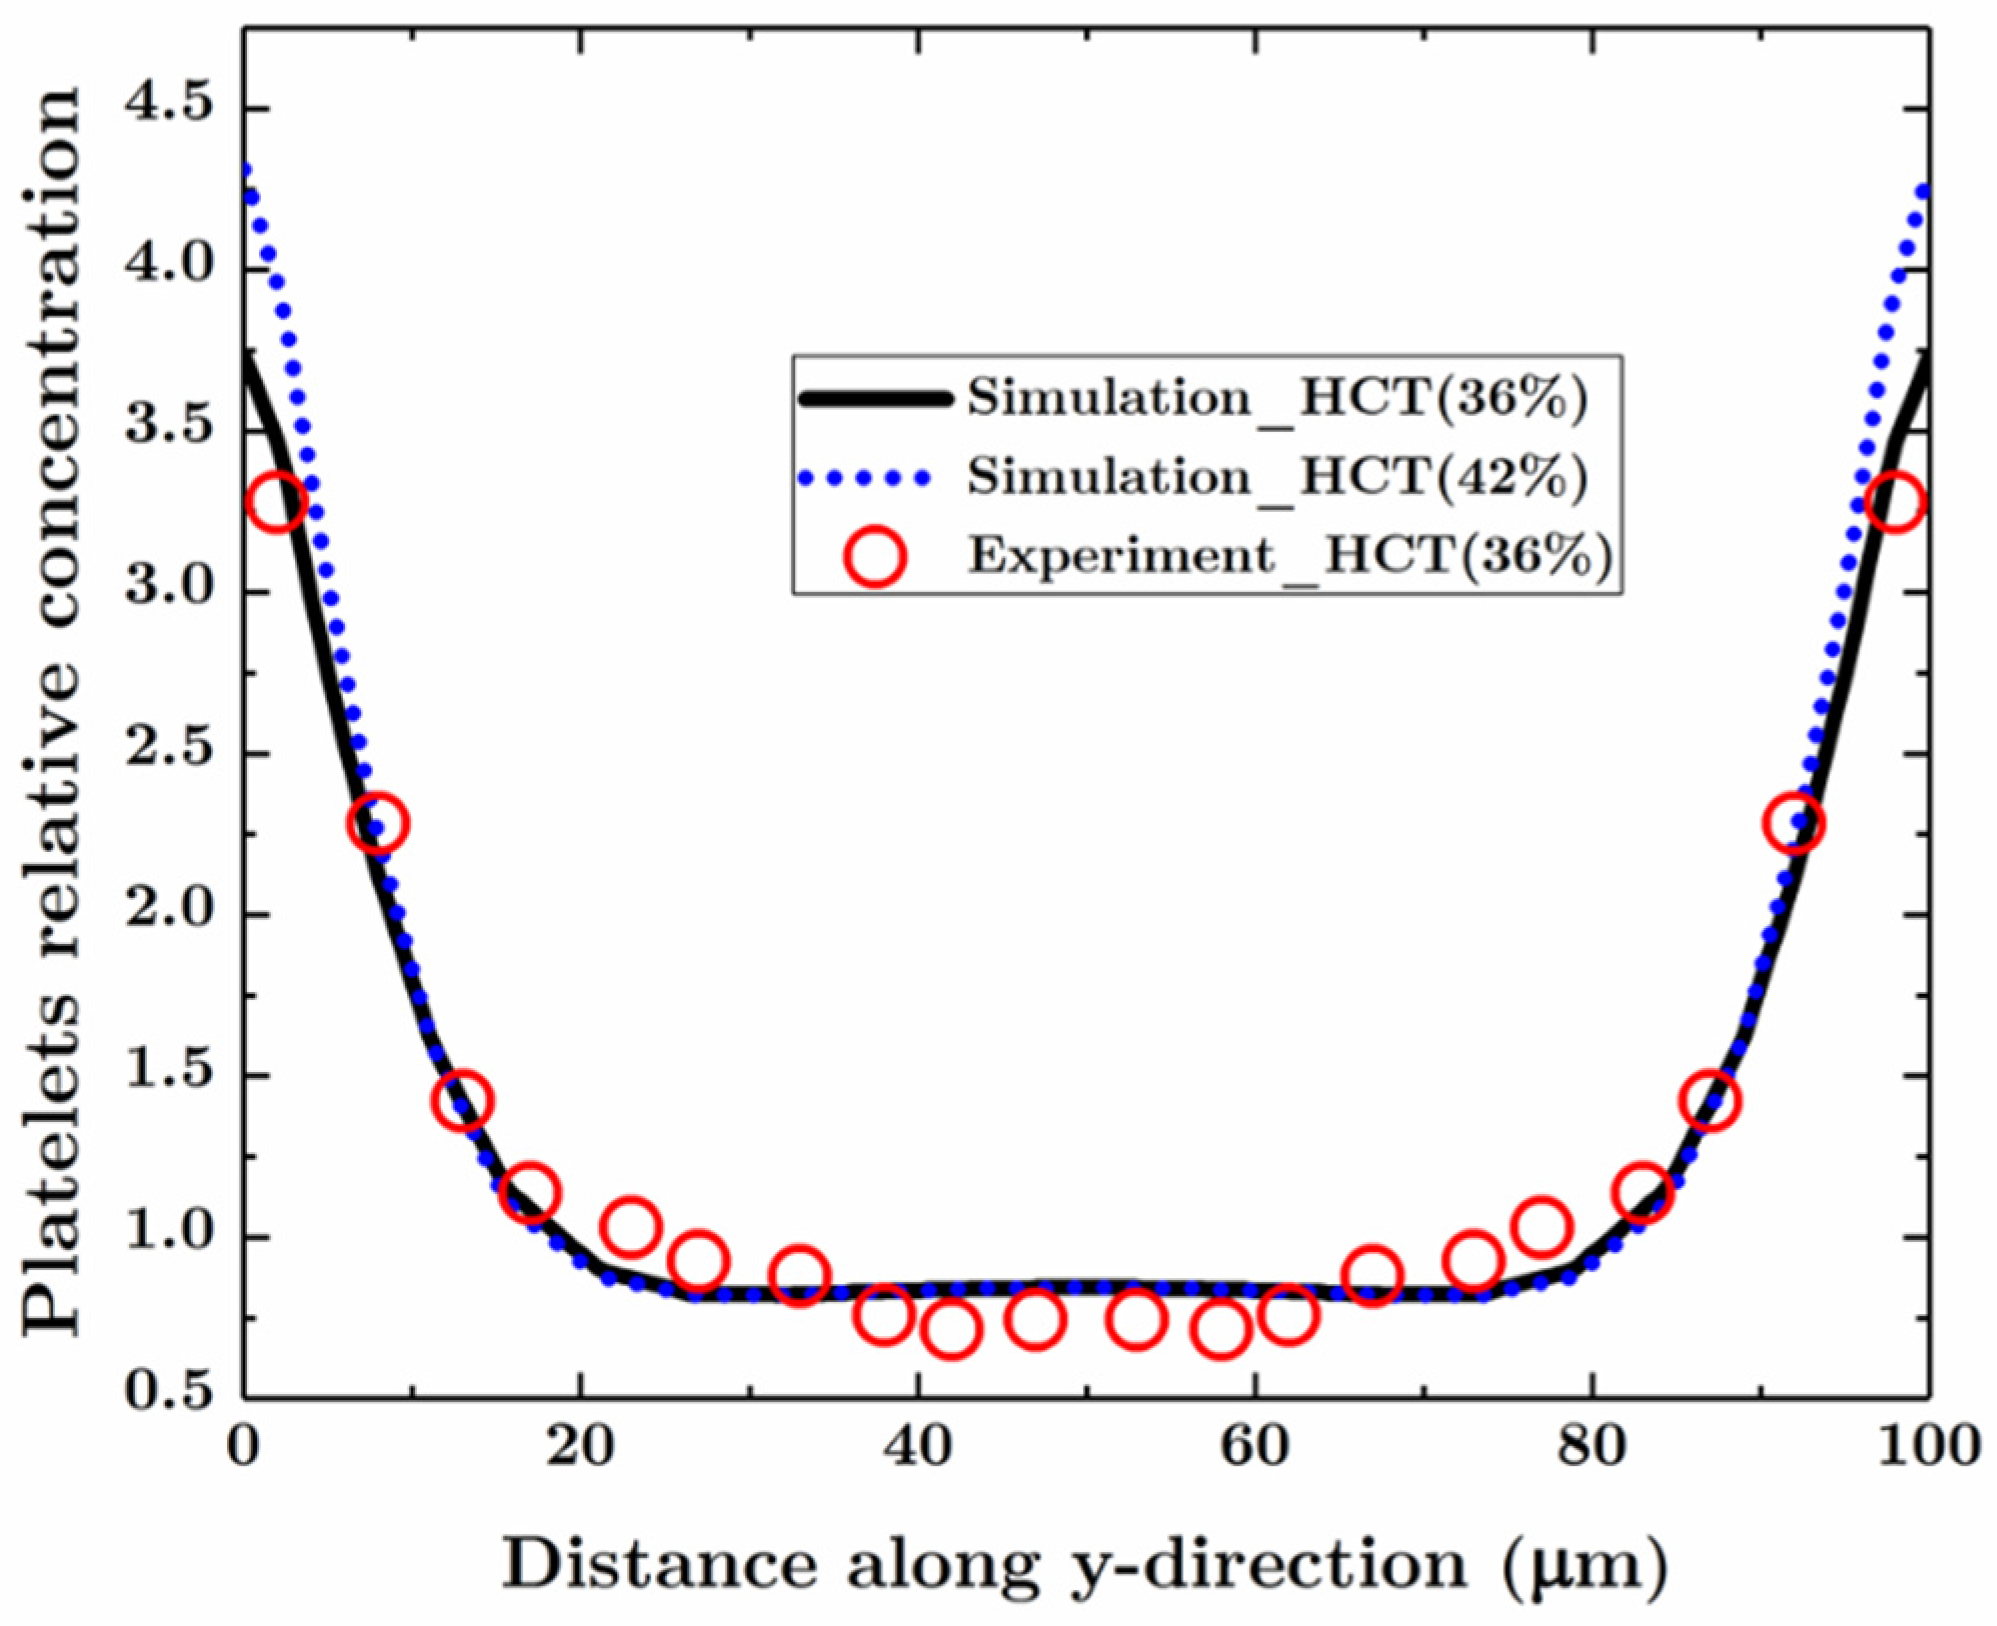
Figure 4.
Schematic of the aneurysmal vessels. (a) Bulbous saccular aneurysm with neck size of 125; (b) Bulging saccular aneurysm with neck size of 250. The inlet velocity is 0.5 m/s (Re = 50). The hematocrit is 42%. The platelets bulk concentration is .
Figure 4.
Schematic of the aneurysmal vessels. (a) Bulbous saccular aneurysm with neck size of 125; (b) Bulging saccular aneurysm with neck size of 250. The inlet velocity is 0.5 m/s (Re = 50). The hematocrit is 42%. The platelets bulk concentration is .
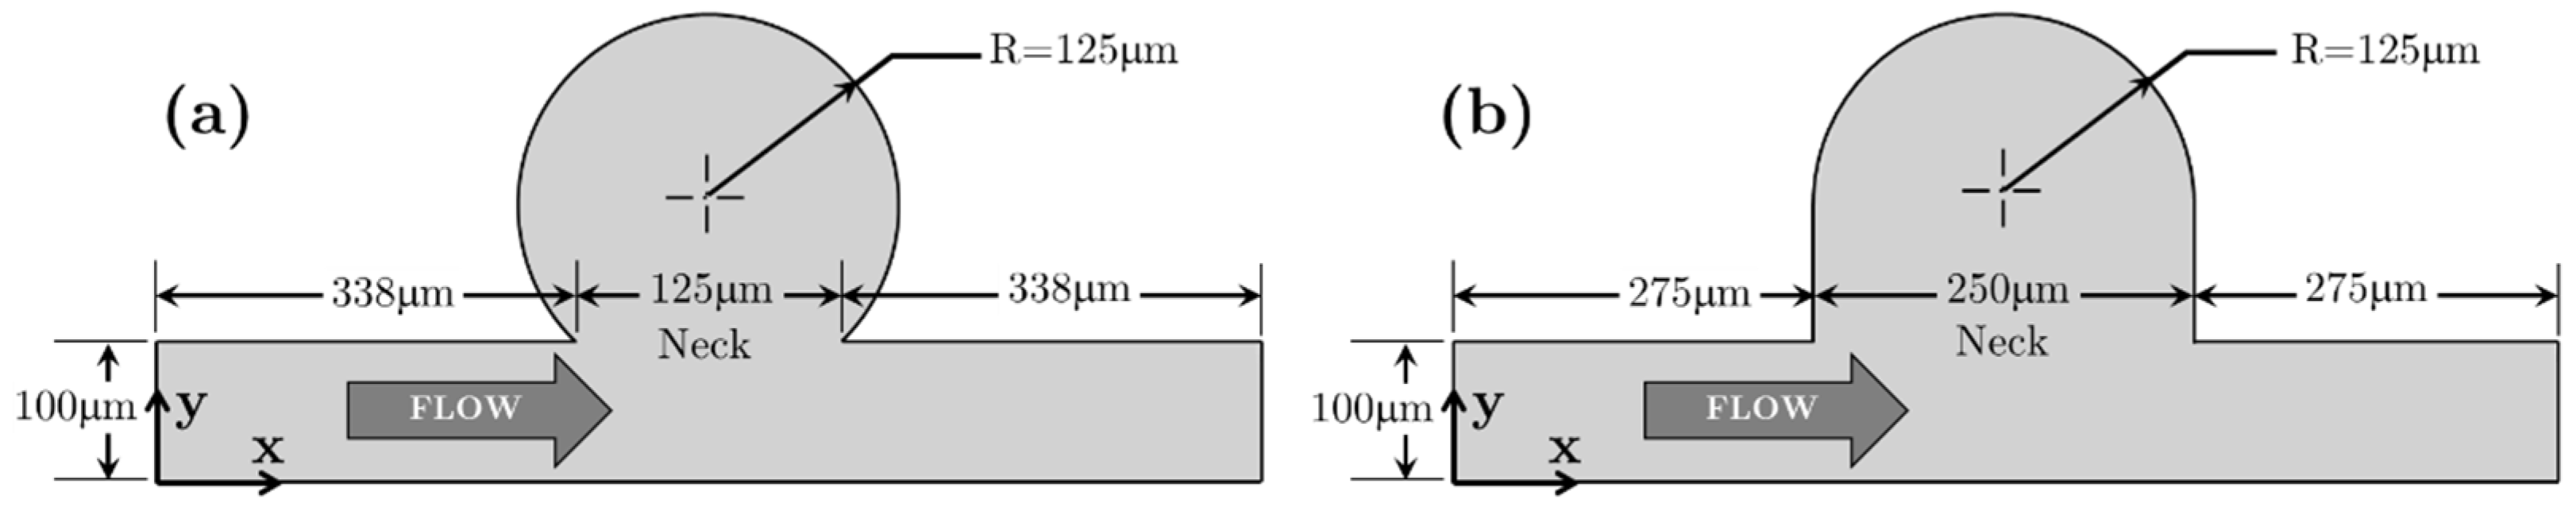
Figure 5.
The distribution of (a) the RBCs concentration, (b) the platelets concentration, (c) the velocity and (d) the streamlines of the whole blood in the bulbous saccular aneurysm after simulating for . is the dimensionless time, where is the time, is the inlet velocity and is the vessel height. The units of the scale bars in (b–d) are , and .

Figure 6.
(a) The distributions of the platelets concentration in the bulbous saccular aneurysm at different dimensionless time steps. The unit of the scale bar is . (b) The distributions of the RBCs concentration in the bulbous saccular aneurysm at different dimensionless time steps.
Figure 6.
(a) The distributions of the platelets concentration in the bulbous saccular aneurysm at different dimensionless time steps. The unit of the scale bar is . (b) The distributions of the RBCs concentration in the bulbous saccular aneurysm at different dimensionless time steps.

Figure 7.
The distribution of, (a) the RBCs concentration, (b) the platelets concentration, (c) the velocity and (d) the streamlines of the whole blood in the bulging saccular aneurysm after simulating for . The units of the scale bars in (b–d) are , and .
Figure 7.
The distribution of, (a) the RBCs concentration, (b) the platelets concentration, (c) the velocity and (d) the streamlines of the whole blood in the bulging saccular aneurysm after simulating for . The units of the scale bars in (b–d) are , and .
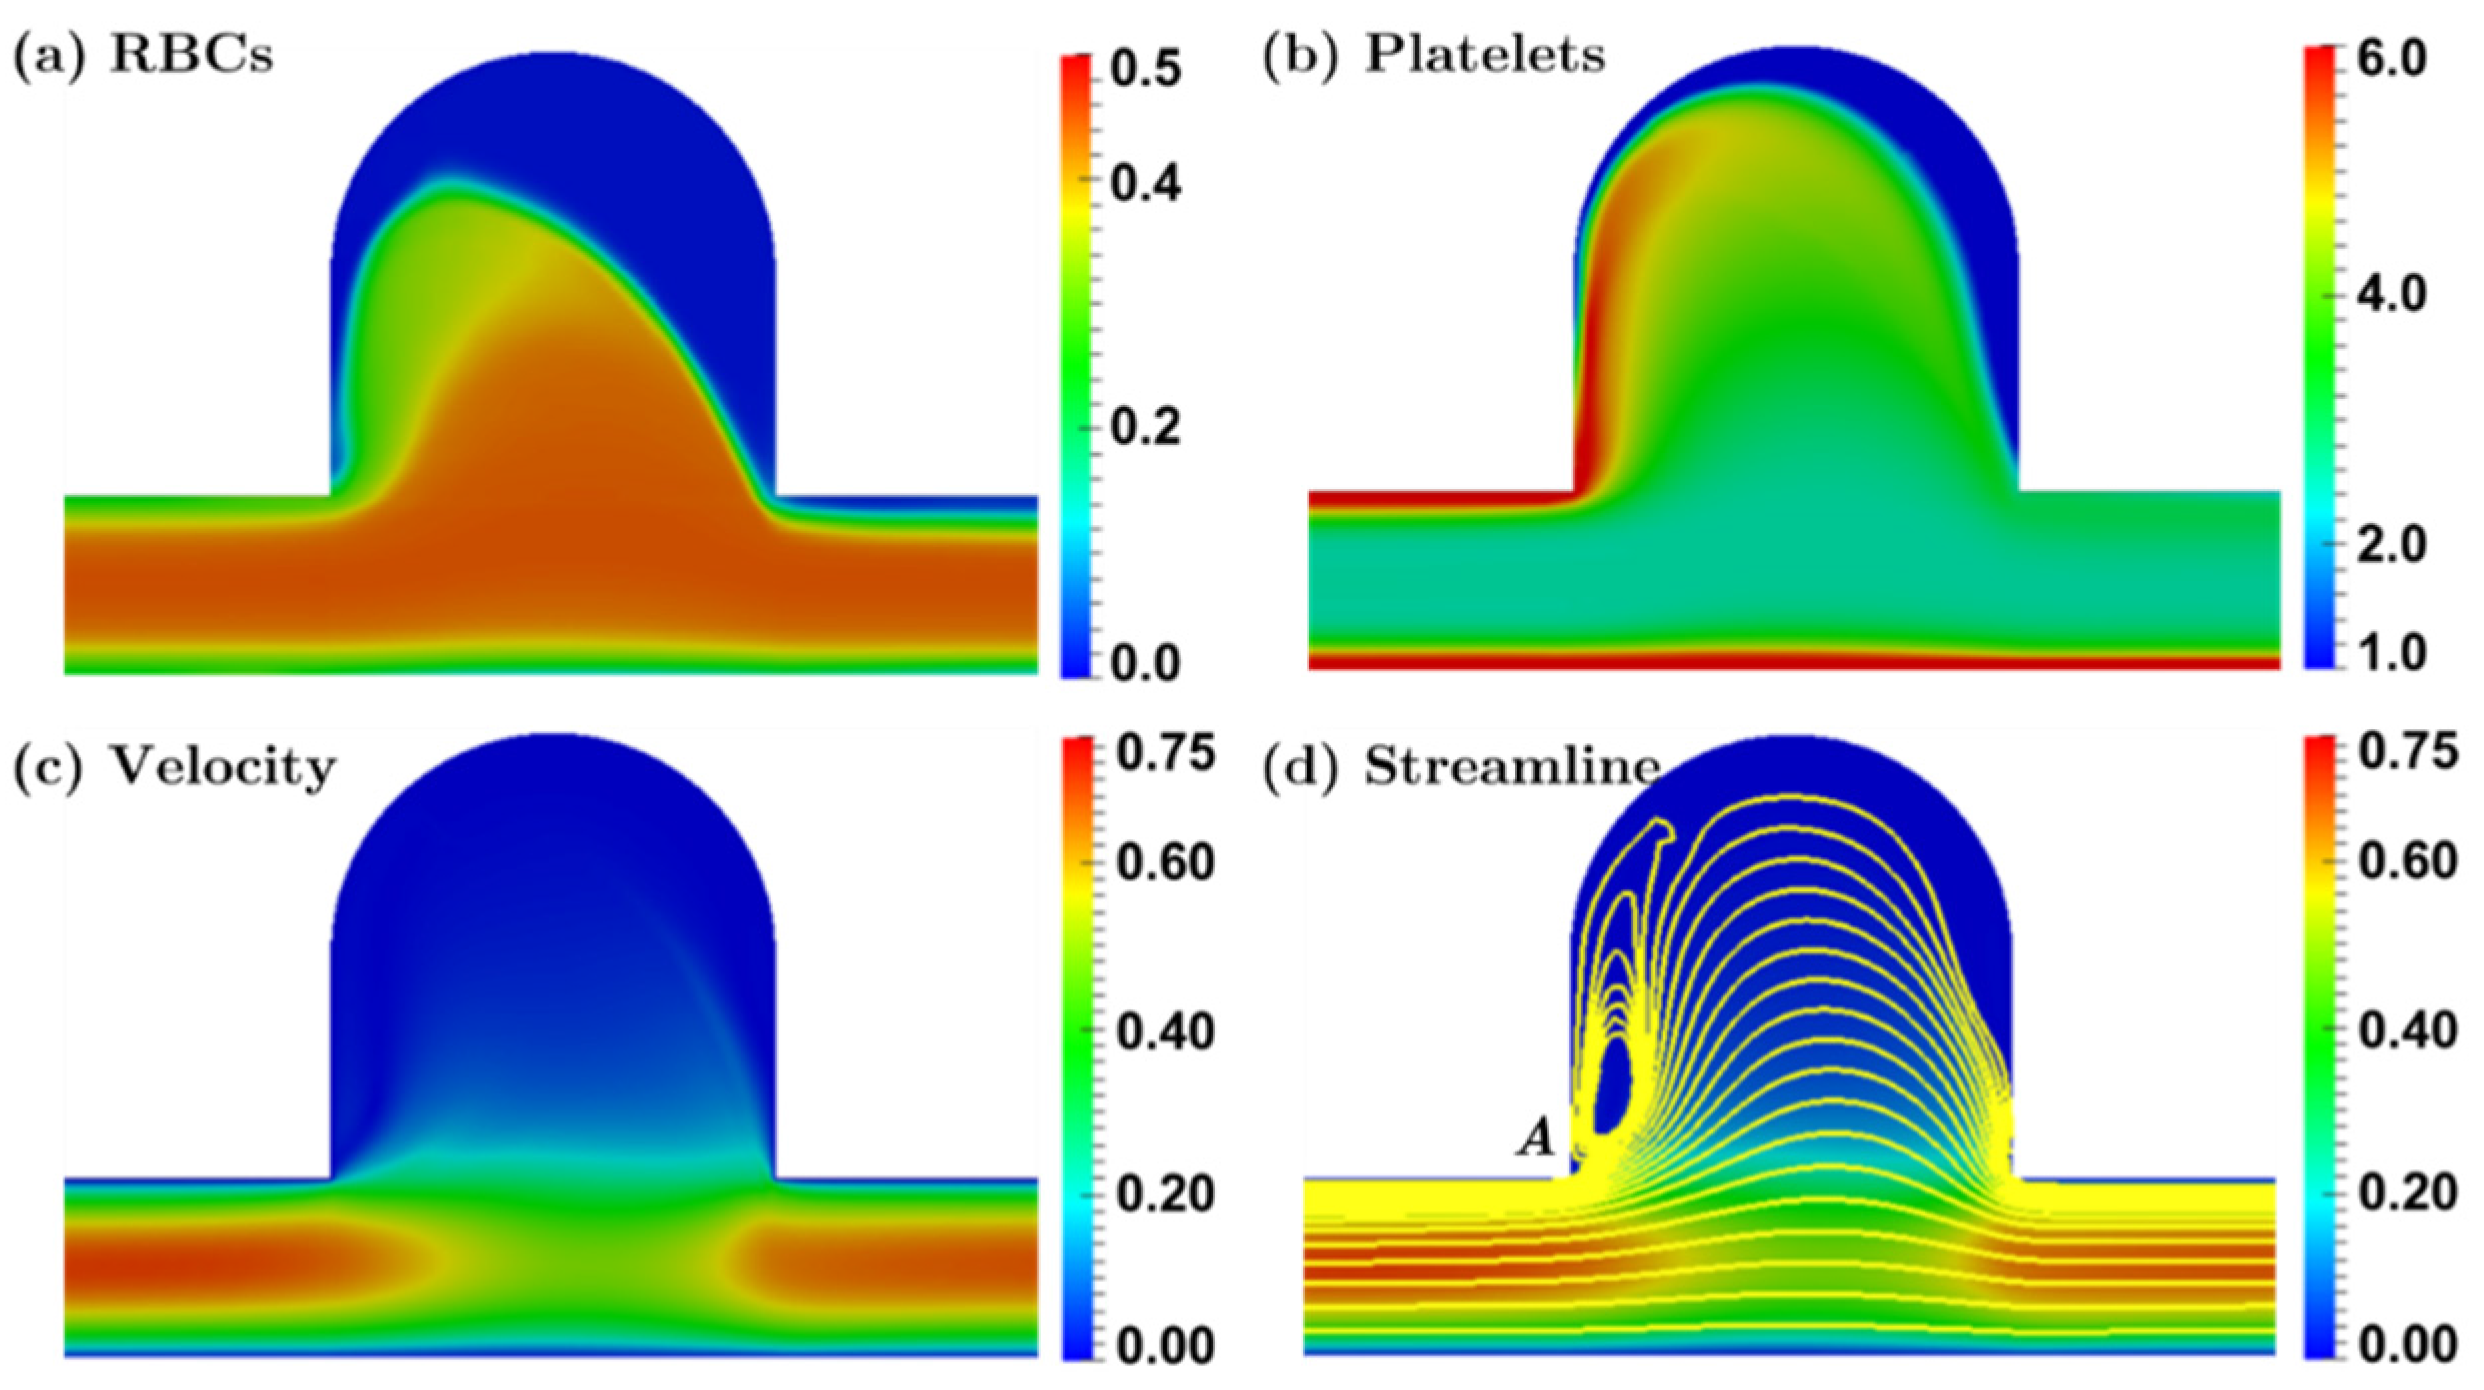
Figure 8.
(a) The distributions of the platelets concentration in the bulging saccular aneurysm at different dimensionless time steps. The unit of the scale bar is . (b) The distributions of the RBCs concentration in the bulging saccular aneurysm at different dimensionless time steps.
Figure 8.
(a) The distributions of the platelets concentration in the bulging saccular aneurysm at different dimensionless time steps. The unit of the scale bar is . (b) The distributions of the RBCs concentration in the bulging saccular aneurysm at different dimensionless time steps.
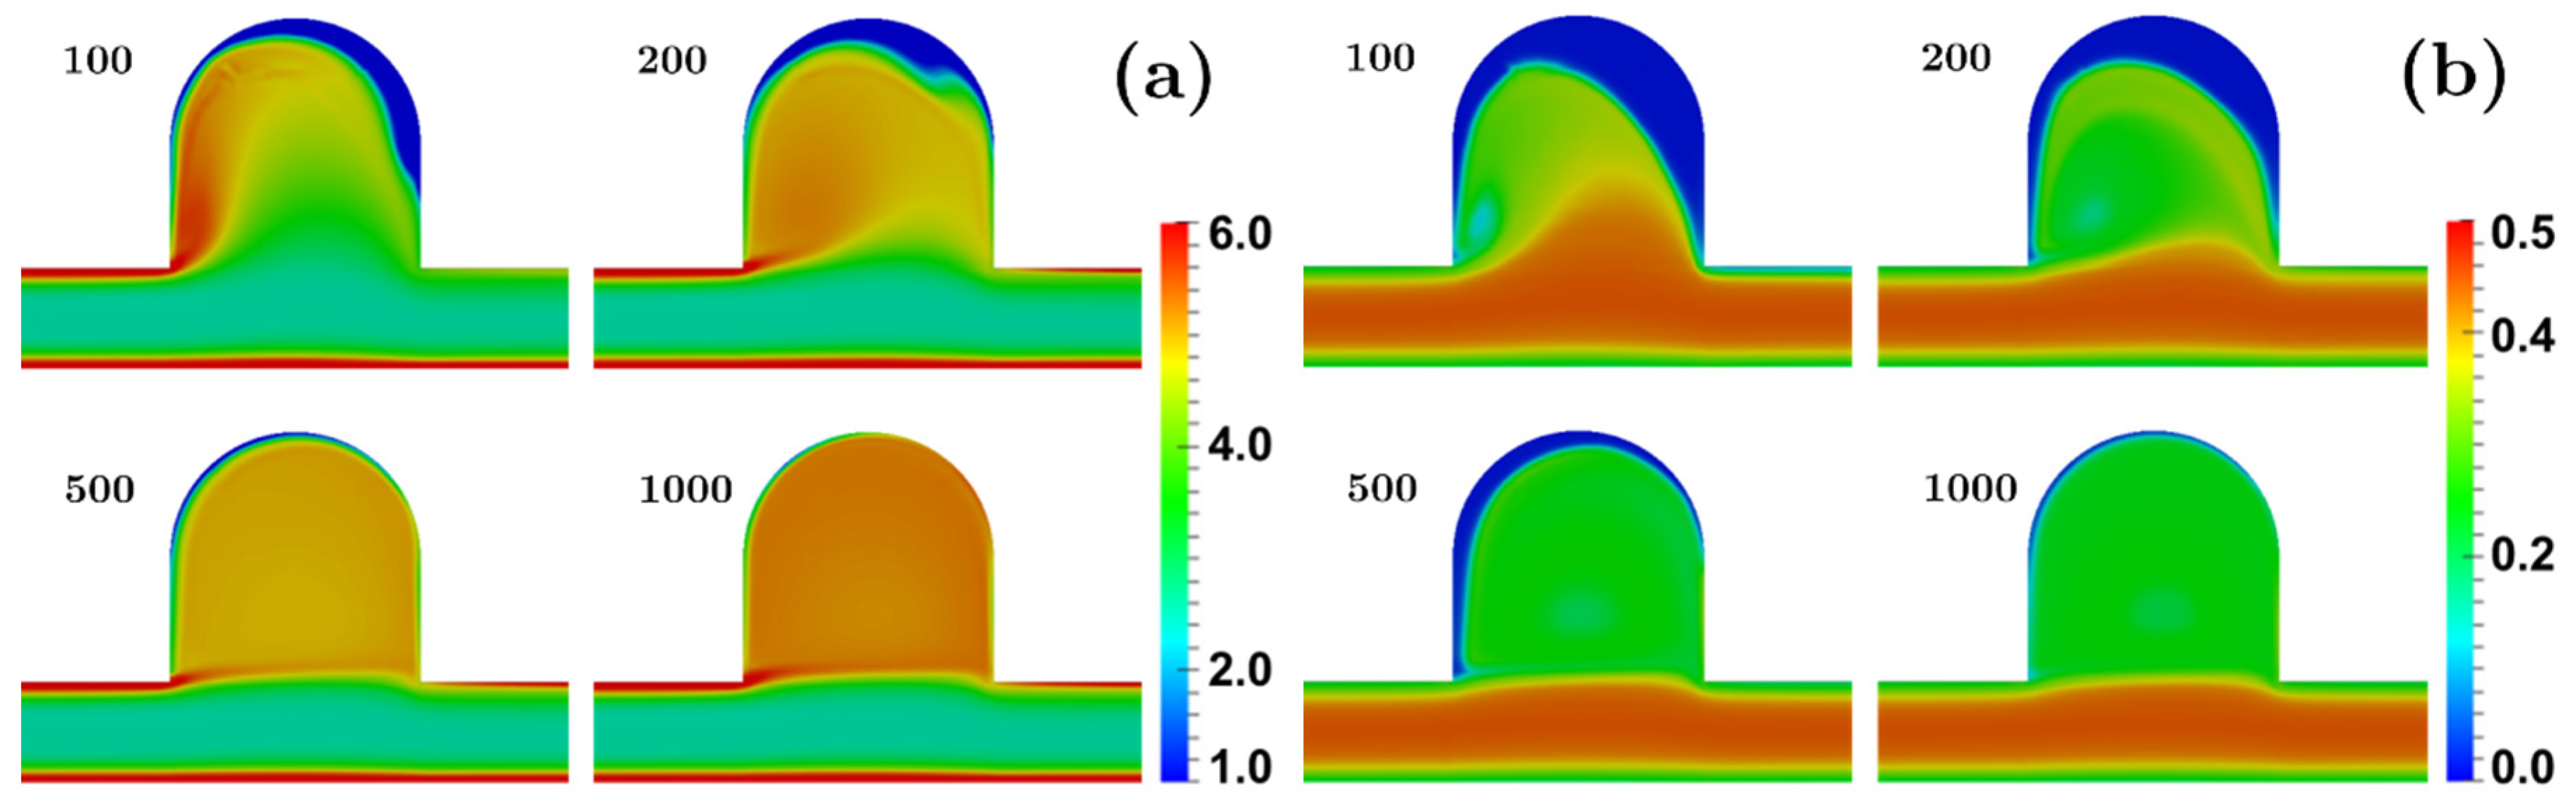
Figure 9.
(a) The distributions of the platelets concentration in the bulbous saccular aneurysm at . (b) The distributions of the platelets concentration in the bulging saccular aneurysm at . The unit of the scale bar is . (c) The platelets concentration profiles along the lines A-A at and .
Figure 9.
(a) The distributions of the platelets concentration in the bulbous saccular aneurysm at . (b) The distributions of the platelets concentration in the bulging saccular aneurysm at . The unit of the scale bar is . (c) The platelets concentration profiles along the lines A-A at and .

Figure 10.
(a) The distributions of the platelets concentration in the bulbous saccular aneurysm at , when Re = 1, 10 and 50. (b) The distributions of the platelets concentration in the bulging saccular aneurysm at , when Re = 1, 10 and 50. The unit of the scale bar is .
Figure 10.
(a) The distributions of the platelets concentration in the bulbous saccular aneurysm at , when Re = 1, 10 and 50. (b) The distributions of the platelets concentration in the bulging saccular aneurysm at , when Re = 1, 10 and 50. The unit of the scale bar is .

Figure 11.
Platelet concentration profiles along the lines A-A in Figure 9, at , with different Reynolds number in the bulbous (a) and the bulging (b) saccular aneurysms.
Figure 11.
Platelet concentration profiles along the lines A-A in Figure 9, at , with different Reynolds number in the bulbous (a) and the bulging (b) saccular aneurysms.
© 2017 by the authors. Licensee MDPI, Basel, Switzerland. This article is an open access article distributed under the terms and conditions of the Creative Commons Attribution (CC BY) license (http://creativecommons.org/licenses/by/4.0/).
Share and Cite
MDPI and ACS Style
Wu, W.-T.; Li, Y.; Aubry, N.; Massoudi, M.; Antaki, J.F. Numerical Simulation of Red Blood Cell-Induced Platelet Transport in Saccular Aneurysms. Appl. Sci. 2017, 7, 484. https://doi.org/10.3390/app7050484
AMA Style
Wu W-T, Li Y, Aubry N, Massoudi M, Antaki JF. Numerical Simulation of Red Blood Cell-Induced Platelet Transport in Saccular Aneurysms. Applied Sciences. 2017; 7(5):484. https://doi.org/10.3390/app7050484
Chicago/Turabian StyleWu, Wei-Tao, Yubai Li, Nadine Aubry, Mehrdad Massoudi, and James F. Antaki. 2017. "Numerical Simulation of Red Blood Cell-Induced Platelet Transport in Saccular Aneurysms" Applied Sciences 7, no. 5: 484. https://doi.org/10.3390/app7050484
Note that from the first issue of 2016, this journal uses article numbers instead of page numbers. See further details here.