
PTMD Control on a Benchmark TV Tower under Earthquake and Wind Load Excitations


1
School of Civil Engineering, Fuzhou University, Fuzhou 350116, China
2
School of Mechanical Engineering, University of Houston, Houston, TX 77204, USA
*
Author to whom correspondence should be addressed.
Appl. Sci. 2017, 7(4), 425; https://doi.org/10.3390/app7040425
Submission received: 16 February 2017
/
Revised: 12 April 2017
/
Accepted: 12 April 2017
/
Published: 22 April 2017
(This article belongs to the Special Issue Energy Dissipation and Vibration Control: Modeling, Algorithm and Devices)
Abstract
:A pounding tuned mass damper (PTMD) is introduced by making use of the energy dissipated during impact. In the proposed PTMD, a viscoelastic layer is attached to an impact limitation collar so that energy can be further consumed and transferred to heat energy. An improved numerical model to simulate pounding force is proposed and verified through experimentation. The accuracy of the proposed model was validated against a traditional Hertz-based pounding model. A comparison showed that the improved model tends to have a better prediction of the peak pounding force. A simulation was then carried out by taking the benchmark Canton Tower, which is a super-tall structure, as the host structure. The dynamic responses of uncontrolled, TMD-controlled and PTMD controlled system were simulated under wind and earthquake excitations. Unlike traditional TMDs, which are sensitive to input excitations and the mass ratio, the proposed PTMD maintains a stable level of control efficiency when the structure is excited by different earthquake records and different intensities. Particularly, more improvement can be observed when an extreme earthquake is considered. The proposed PTMD was able to achieve similar, or even better, control effectiveness with a lower mass ratio. These results demonstrate the superior adaptability of the PTMD and its applicability for protection of a building against seismic activity. A parametric study was then performed to investigate the influence of the mass ratio and the gap value on the control efficiency. A comparison of results show that better control results will be guaranteed by optimization of the gap value.
1. Introduction
Along with the construction of higher and more complex civil structures, there have been concerns about their safety under natural disasters, such as typhoons and earthquakes. It is nearly impossible for the designers to fully predict the excitations during the service stage; if the designers try to enhance the capacity of the structure against all possibilities, the loadings will largely increase the cost of the construction. Structural control is considered to be an effective approach to adapt the host structures to different kinds of harmful excitations and enhance their safety and serviceability [1,2,3]. Passive control approaches, such as tuned-mass-dampers (TMD), viscous dampers, viscoelastic dampers, and base isolation techniques have advantages of low cost and easy implementation [4]. Particularly, TMD is considered to be one of the most effective passive devices and has many applications, such as the CN tower in Toronto and the Taipei 101 building [5]. It possesses the merit of easy maintenance and can be implemented even on existing structures. The TMD absorbs inertial force from the host structure to reduce its motion, with its effectiveness determined by its dynamic characteristics, stroke, and the amount of added mass it employs. The potential of the TMD has been verified in reducing vibrations under a variety of excitations [6]. A TMD consist of a mass, a damping mechanism, and a restoring mechanism with certain stiffness connected to the host structure. During operation, the TMD is tuned to a certain frequency and a certain amount of the vibration energy will be transferred to the movement of the mass of the device. However, studies have pointed out that passive devices are hard to adjust once they are installed and their robustness is questionable when the host structure is subjected to different excitations. Since TMD can only reduce vibration components whose frequencies are close to the tuned frequencies, it is believed that the most significant limitation of the TMD is its narrow effective bandwidth and the high sensitivity to even a small change in the tuning [7,8,9,10]. Thus, it is considered to be unsuitable for vibration control under broadband earthquake inputs [11].
As a result, various schemes have been proposed to improve the TMD for better robustness and reliability [12]. For example, a nonlinear hysteretic damper has been supplemented for enhanced energy dissipation [13,14,15,16,17]. Chung et al. [18] demonstrated the effectiveness of such a TMD by implementation in the Taipei 101 building. These enhanced TMDs were found to be more effective than the conventional ones in a certain range of excitation frequencies. Another common alternative is to incorporate TMDs with active and semi-active devices [19,20]. Active mass dampers (AMD) have been developed and widely used in the civil engineering field [21,22,23]. Active tuning of TMDs can be achieved by using active springs [24,25], and some scholars tried to use shape-memory alloy (SMA) to achieve on-line adaptation [26,27]. Nagarajaiah and his coworkers developed semi-active tuned mass dampers (STMD) using semi-active variable stiffness systems [28,29], the STMD is able to be tuned to the desired frequencies instantaneously. Some researchers incorporated magnetorheological (MR) dampers into TMD to enhance adaptability [30]. The MR damper generates extra dissipation energy in the TMD and emulates positive and negative stiffness in order to adjust the stiffness of the TMD [31]. Cai et al. [32] conducted an experiment on a cable installed with TMD-MR and great control results were obtained. Eason et al. [33] found that multiple semi-active tuned mass dampers can give significant reduction on both the steady-state and transient responses.
Although the active and semi-active TMDs possess better performance, they are also liable to control algorithms and must be equipped with sensors and external power sources, which are not guaranteed to function normally under severe events. The complicated setup of the system and time delay caused by computational times of the control system will also affect the control results. The actuator used in the control system may also have its own dynamics and interactions with other structural components, all of which need to be considered. They also have higher maintenance costs, thus limiting their applicability. Therefore, this paper attempts to seek possible application of a pounding tuned mass damper (PTMD) in the reduction of vibration of high-rise structures induced by typhoons and earthquakes. An improved numerical model to predict the pounding force from the impact between the steel mass and the viscoelastic layer will be proposed and validated through experimental data. By taking a super tall benchmark TV tower as the host structure, a comprehensive numerical study will be carried out to verify the control efficiency of the PTMD under wind load and earthquake excitations, and possibly surpass in performance of traditional TMD. A parameter study will be carried out to analyze the influence of parameters on the control results, while seeking better performance of the control system.
2. Schematic Model of a Pounding Tuned Mass Damper (PTMD)
Based on the fact that a large amount of energy can be dissipated during impact, a pounding tuned mass damper (PTMD) is developed by setting up a motion limitation around the mass of a tuned mass damper (TMD) device [34]. The basic schematic model of a PTMD device is shown in Figure 1. As shown in the figure, a viscoelastic (VE) layer is attached to the limitation collar. Unlike some limitation collars found in traditional TMD devices, the limitation can not only function to prevent extreme vibration of the mass, but it can also further dissipate vibration energy through the deformation of VE layer during impact. When a certain gap is set between the mass and the limitation, impact will happen between the mass and the VE layer as soon as their relative displacement reaches the gap value. As a result, during operation, this device can absorb vibration energy of the host structure and transfer it to the kinetic energy and potential energy of the attached mass, as well as some heat energy from the impact. The amount of kinetic energy is largely dependent on the weight and the moving speed of the mass; the potential energy is affected by the stiffness of the connection; the amount of impact energy will be dependent on the relative velocity and deformation of the VE layer. Therefore, by changing the mass, stiffness, and gap of the TMD will definitely vary the control efficiency under different cases.
3. Modeling of Structure Installed with PTMD
Assuming the host structure has n degree of freedoms (DOFs), a controlled structure coupled with a PTMD has the equation of motion as:
where M, C, K are the mass, damping, and stiffness matrices of the coupled system, which has n + 1 DOFs; F is the excitation force and P is the control force acting between the added mass and the host structure; matrices E and D are the index matrix indicating the DOFs of the excitation and the control forces, respectively.
By reordering the DOFs of the controlled system, making n represent the DOF of the host structure connected with PTMD, and r to represent the DOF of the added mass, the coupled equation is rewritten as:
where mr represents the mass of the PTMD, cr and kr are, respectively, the connecting damping and stiffness of the PTMD, and p is the pounding force between the attached mass and the VE layer. If decoupling the system, one is able to obtain the internal forces, which is the control force exerted on the host structure. Extracting the last line in Equation (2), the equation of motion referring to the dynamic response of added mass is expressed as:
By moving those terms related to to the right side of the equation yields the governing equation of the added mass as:
and in above equation can be considered as the external force applied to the PTMD mass.
Further extracting those equations corresponding to the original system from Equation (2), the governing equation of the system is rewritten as:
where , , and , respectively, represent the stiffness, mass, and damping matrices of the host structure. Reconstruction of the above equation yields:
where:
By comparing with uncontrolled equation of motion, the control force acting on the host structure can be decoupled and extracted as:
From the above equation one can see that, if the impact does not happen, in Equation (8). In this case the PTMD is performing as a traditional TMD.
4. Improved Pounding Model
4.1. Improved Hertz Contact-Based Pounding Model
One of the most popular contact force models used in the impact events is proposed by Lankarani and Nikravesh and further improved for higher-impact velocities [35,36], this model gives an expression for the hysteresis damping factor relating the kinetic energy loss due to internal damping, and it has been utilized in many domains [37,38,39]. More recently, Gonthier et al. proposed a three-dimensional contact force model that can be used to simulate fully elastic to completely plastic impacts [40]. Another Hertz contact theory-based contact force model recently published was developed by Flores et al. [41]. This model uses a hysteresis damping parameter that accommodates the loss of energy during the contact process. Most of these pounding models have their respective suitable domains of applications, and most of them can only be accurate when the impact objects are considered to be rigid, the contact area is small, and the impact velocity is not too large.
For the particular pounding cases in the proposed PTMD, the pounding happens between a rigid mass and a VE layer with high nonlinearity. Viscoelastic material is featured by the large deformation ability and energy-dissipating capacity and, thus, energy can be further dissipated by the damping effect. A numerical pounding force model is required to decide the interaction forces between the host structure and the added mass. A non-linear viscoelastic model based on the Hertz contact law in conjunction with a damper that is active only during the approach period of the impact has been used to analyze the structural pounding in the previous study [42]. The model can be denoted as:
where and are the displacements of the device and pounding layers, and is the distance between the device and pounding layers. is the relative pounding displacement and is the pounding velocity. is the pounding stiffness coefficient that mainly depends on material properties and the geometry of colliding bodies, and is the impact damping which, at any instant of time, can be obtained from the formula:
where and are the masses of the two colliding bodies, and is the impact damping ratio correlated with the coefficient of restitution , which is defined as the relation between the post-impact (final) relative velocity, and the prior-impact (initial) relative velocity, , of two colliding bodies:
The coefficient of restitution can also be determined by calculating the ratio of the rebound height and the original height :
The case when denotes a fully elastic collision, whereas represents a perfectly plastic impact.
However, the above Hertz contact-based model expressed by Equations (9)–(13) is more accurate when describing the pounding force between two layers with higher stiffness. In the previous application, this model tends to underestimate the pounding forces. After a careful examination of the deformation features of the viscoelastic layer during impact, a modified pounding model is proposed as follows: In the proposed modified model, it is assumed that during the approaching period, the impact damping, c, is not only affected by the stiffness, but also influenced by the different extent of compressed areas which can be considered as a function of the approaching velocity, denoted as:
in which is the damping ratio correlated with the coefficient of restitution , which is expressed by Equation (12), and is the damping ratio correlated with approaching velocity.
are parameters to be decided in this model. During application, these parameters are relevant to the characteristic of the viscoelastic material.
4.2. Experimental Validation
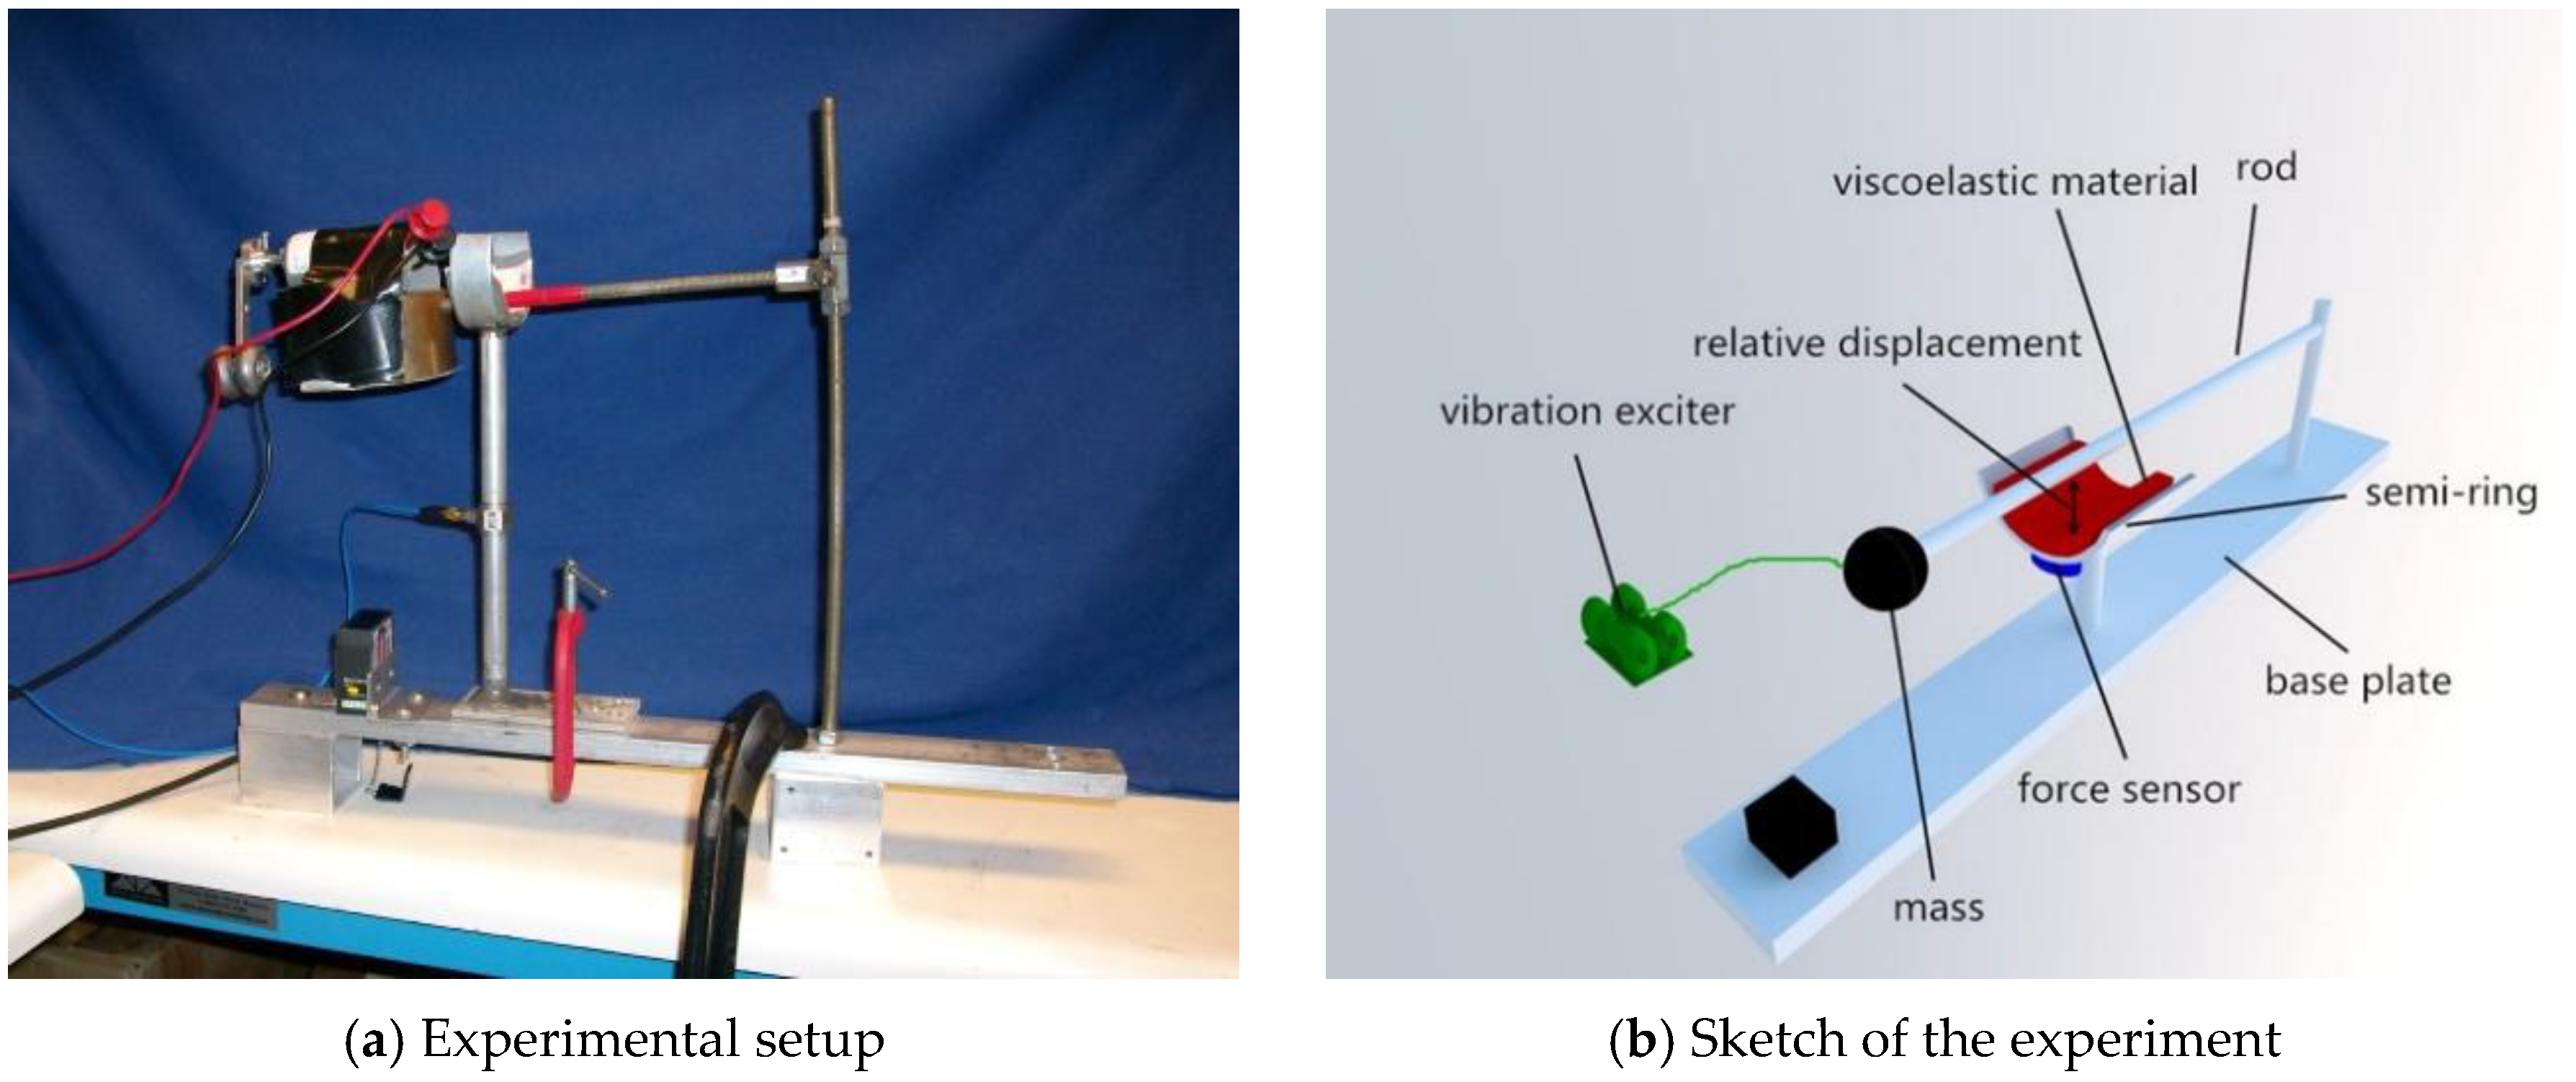
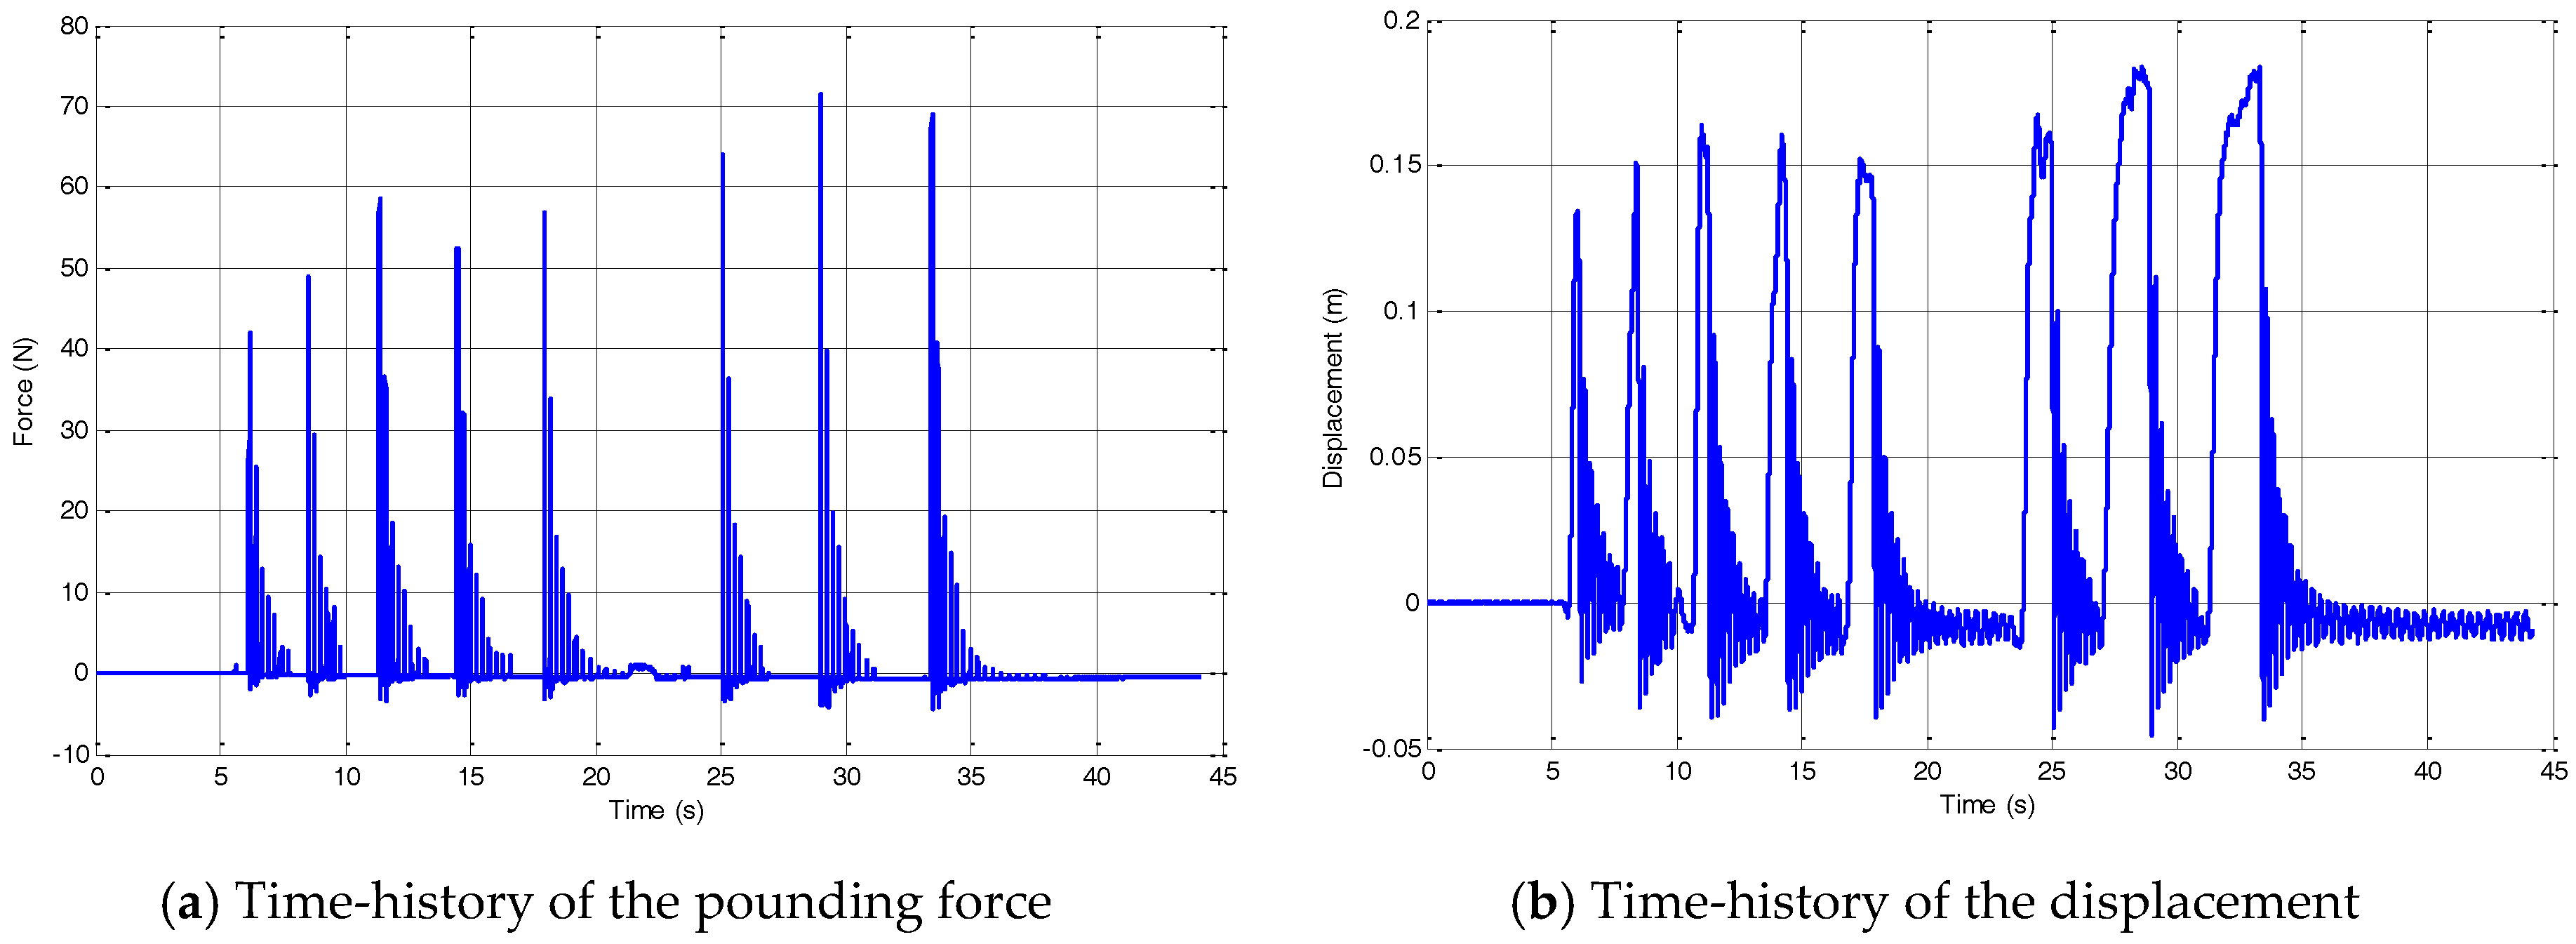
A small-scale experiment is carried out for validation of the improved numerical pounding force model [34]. Figure 2 shows the setup of the experiment. A mass is driven by an attached motor and impact happens between the mass and the surface of a semi-ring to which seven layers of 3M VHB4936 tape adhere. A force sensor is installed beneath the semi-ring to measure the pounding force, and a Keyence Lbl1 laser sensor (Keyence, Osaka, Japan) is installed to capture the displacement of the mass. The data is collected by dSPACE 1104 (dSPACE, Shanghai, China) and the sampling frequency is set as 1000 Hz. The measured pounding force and displacement are shown in Figure 3.
4.3. Parameter Tuning
For the selected material, the parameters for both the traditional Hertz-based model, as well as the five parameters for the modified pounding model, are optimized. The minimization problem is defined and the following residual vector is to be minimized:
Here is a weighting factor applied to different residual items, represents the differences of the peak pounding force between the experimental and simulation data, and represents the similarity of the pounding force vector. and are defined as:
in which is the pounding force vector, the superscripts ‘E’ and ‘S’ represent the items associated with the experimental and the simulated data, respectively, and ‘T’ denotes vector (matrix) transpose.
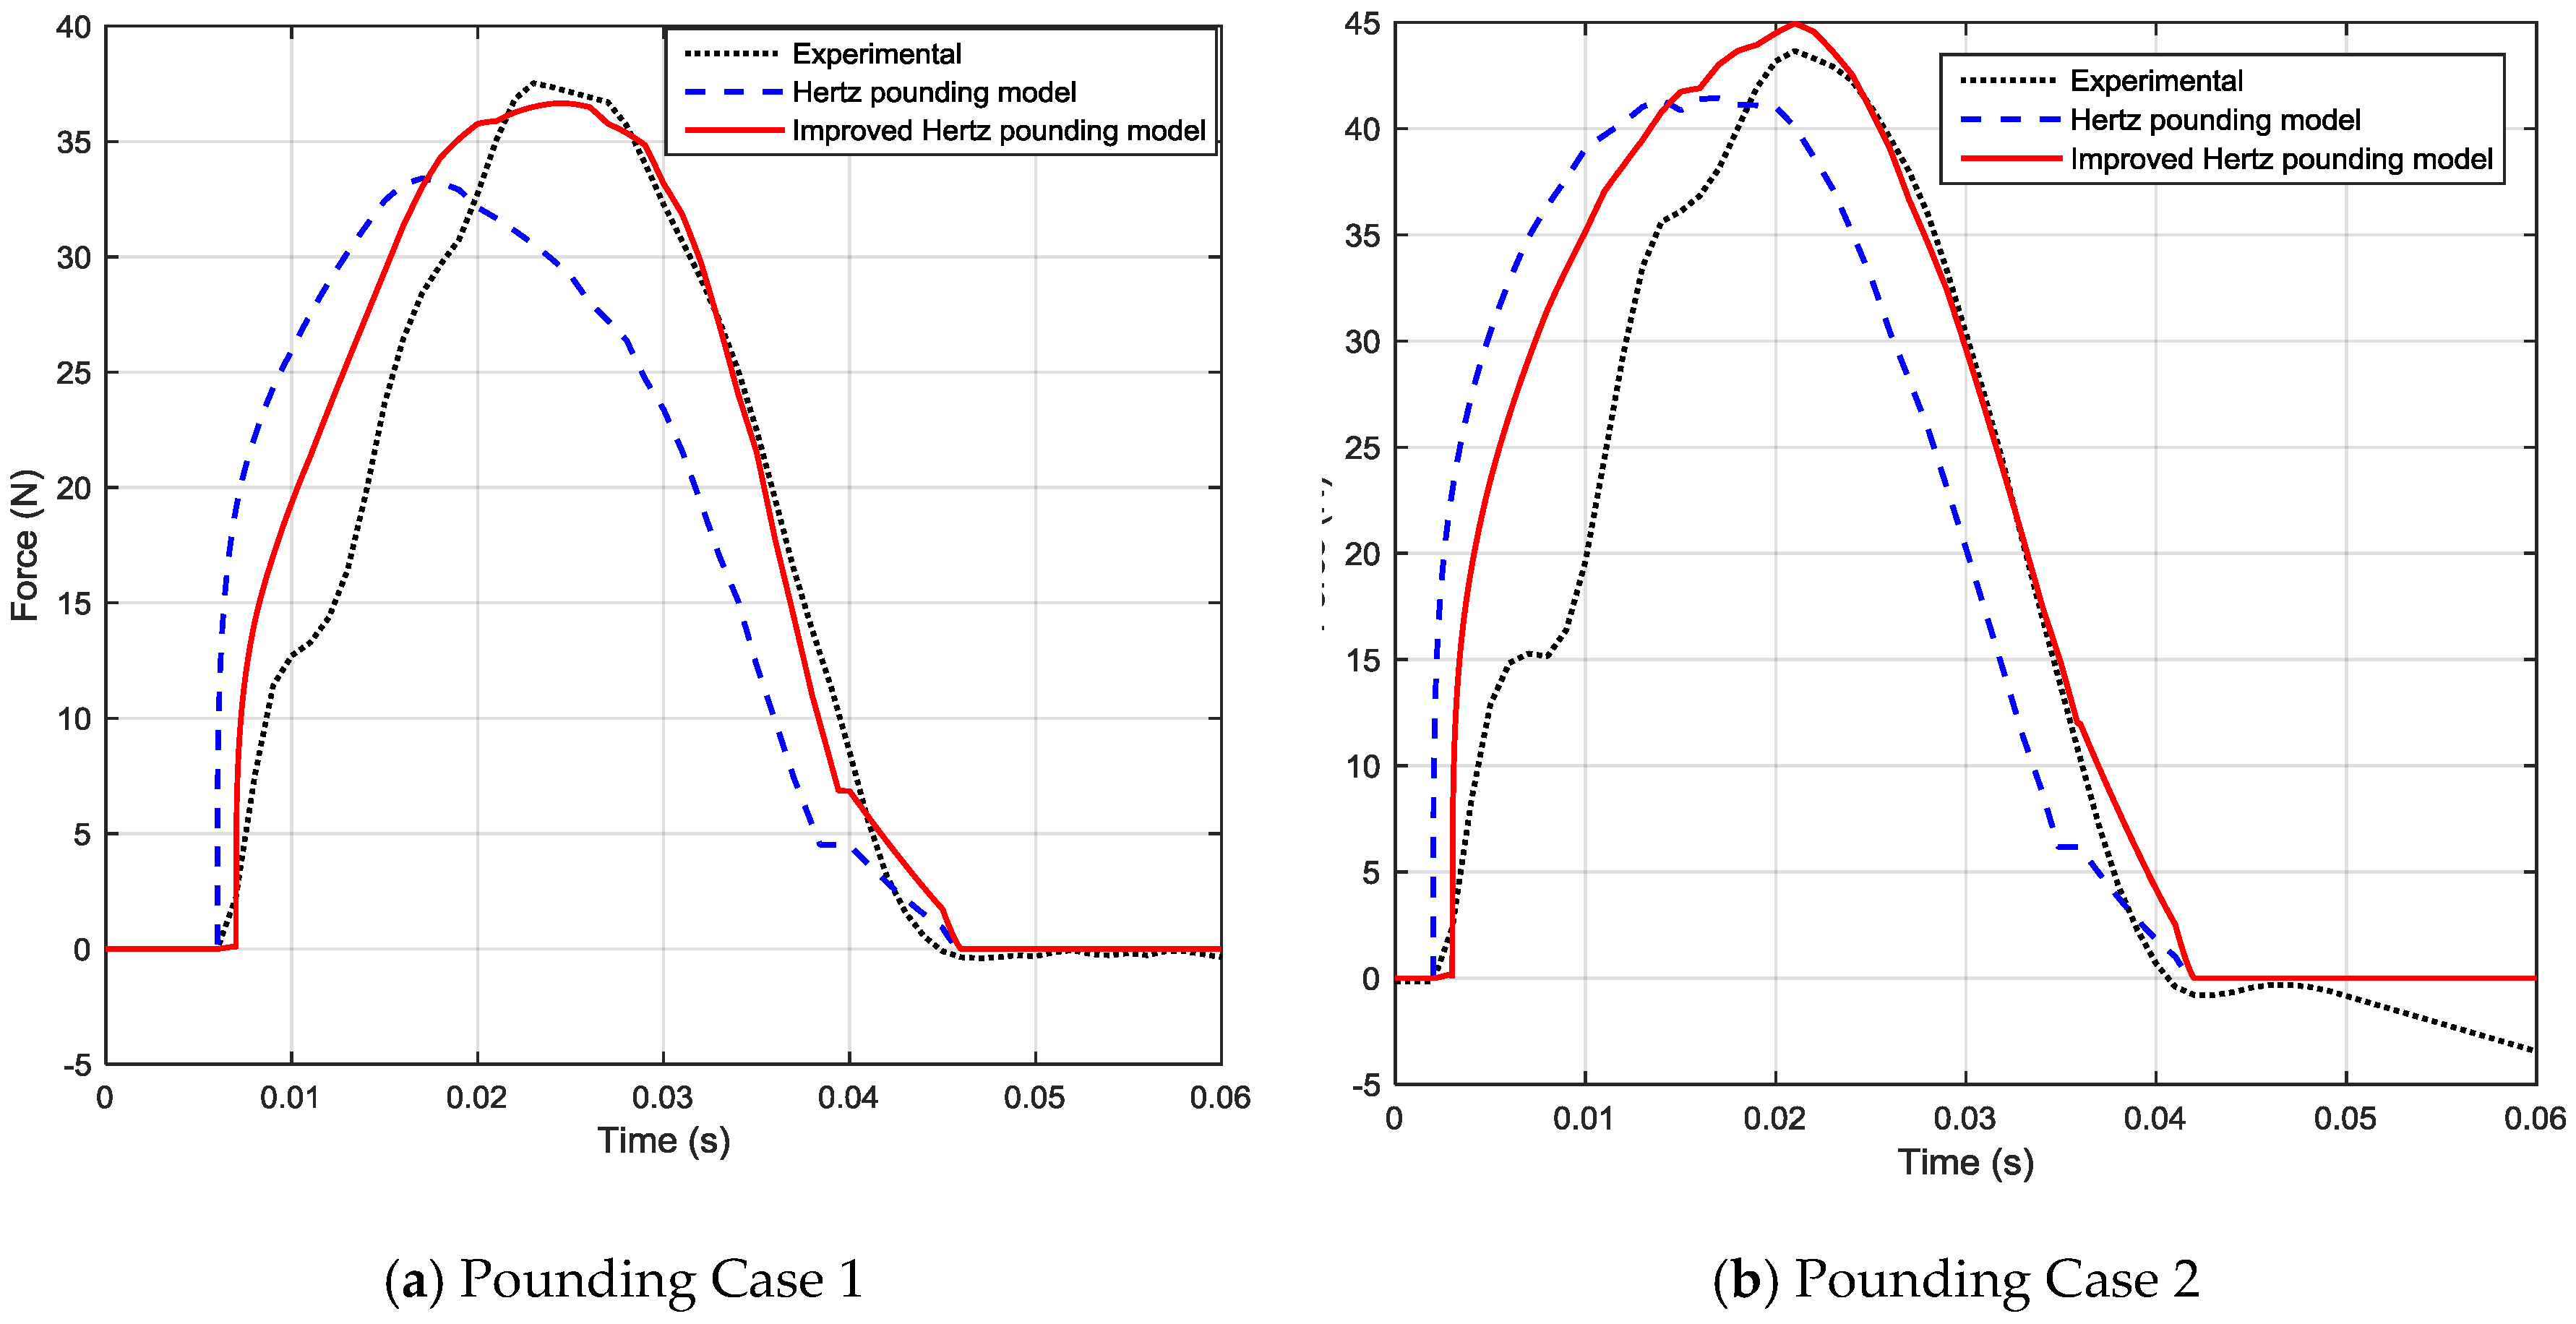
A Hertz contact law-based pounding model is adopted in the previous study by Zhang et al. [34]. In the previous model, only the pounding stiffness needs to be estimated. In this modified model, a trust-region based optimization method with global minimization is adopted to decide the parameters . Ten sets of pounding data were chosen for model tuning and the optimized parameters are listed in Table 1. The tuned model is then used to predict the pounding force from the recorded displacement. The comparison of the simulated and experimental pounding force is shown in Figure 4. An obvious improvement is observed from these figures. By compensating the influence of the changing impact damping, the proposed model can now better predict the peak value of the pounding force during impact.
5. SHM System and Benchmark Model of the Canton Tower
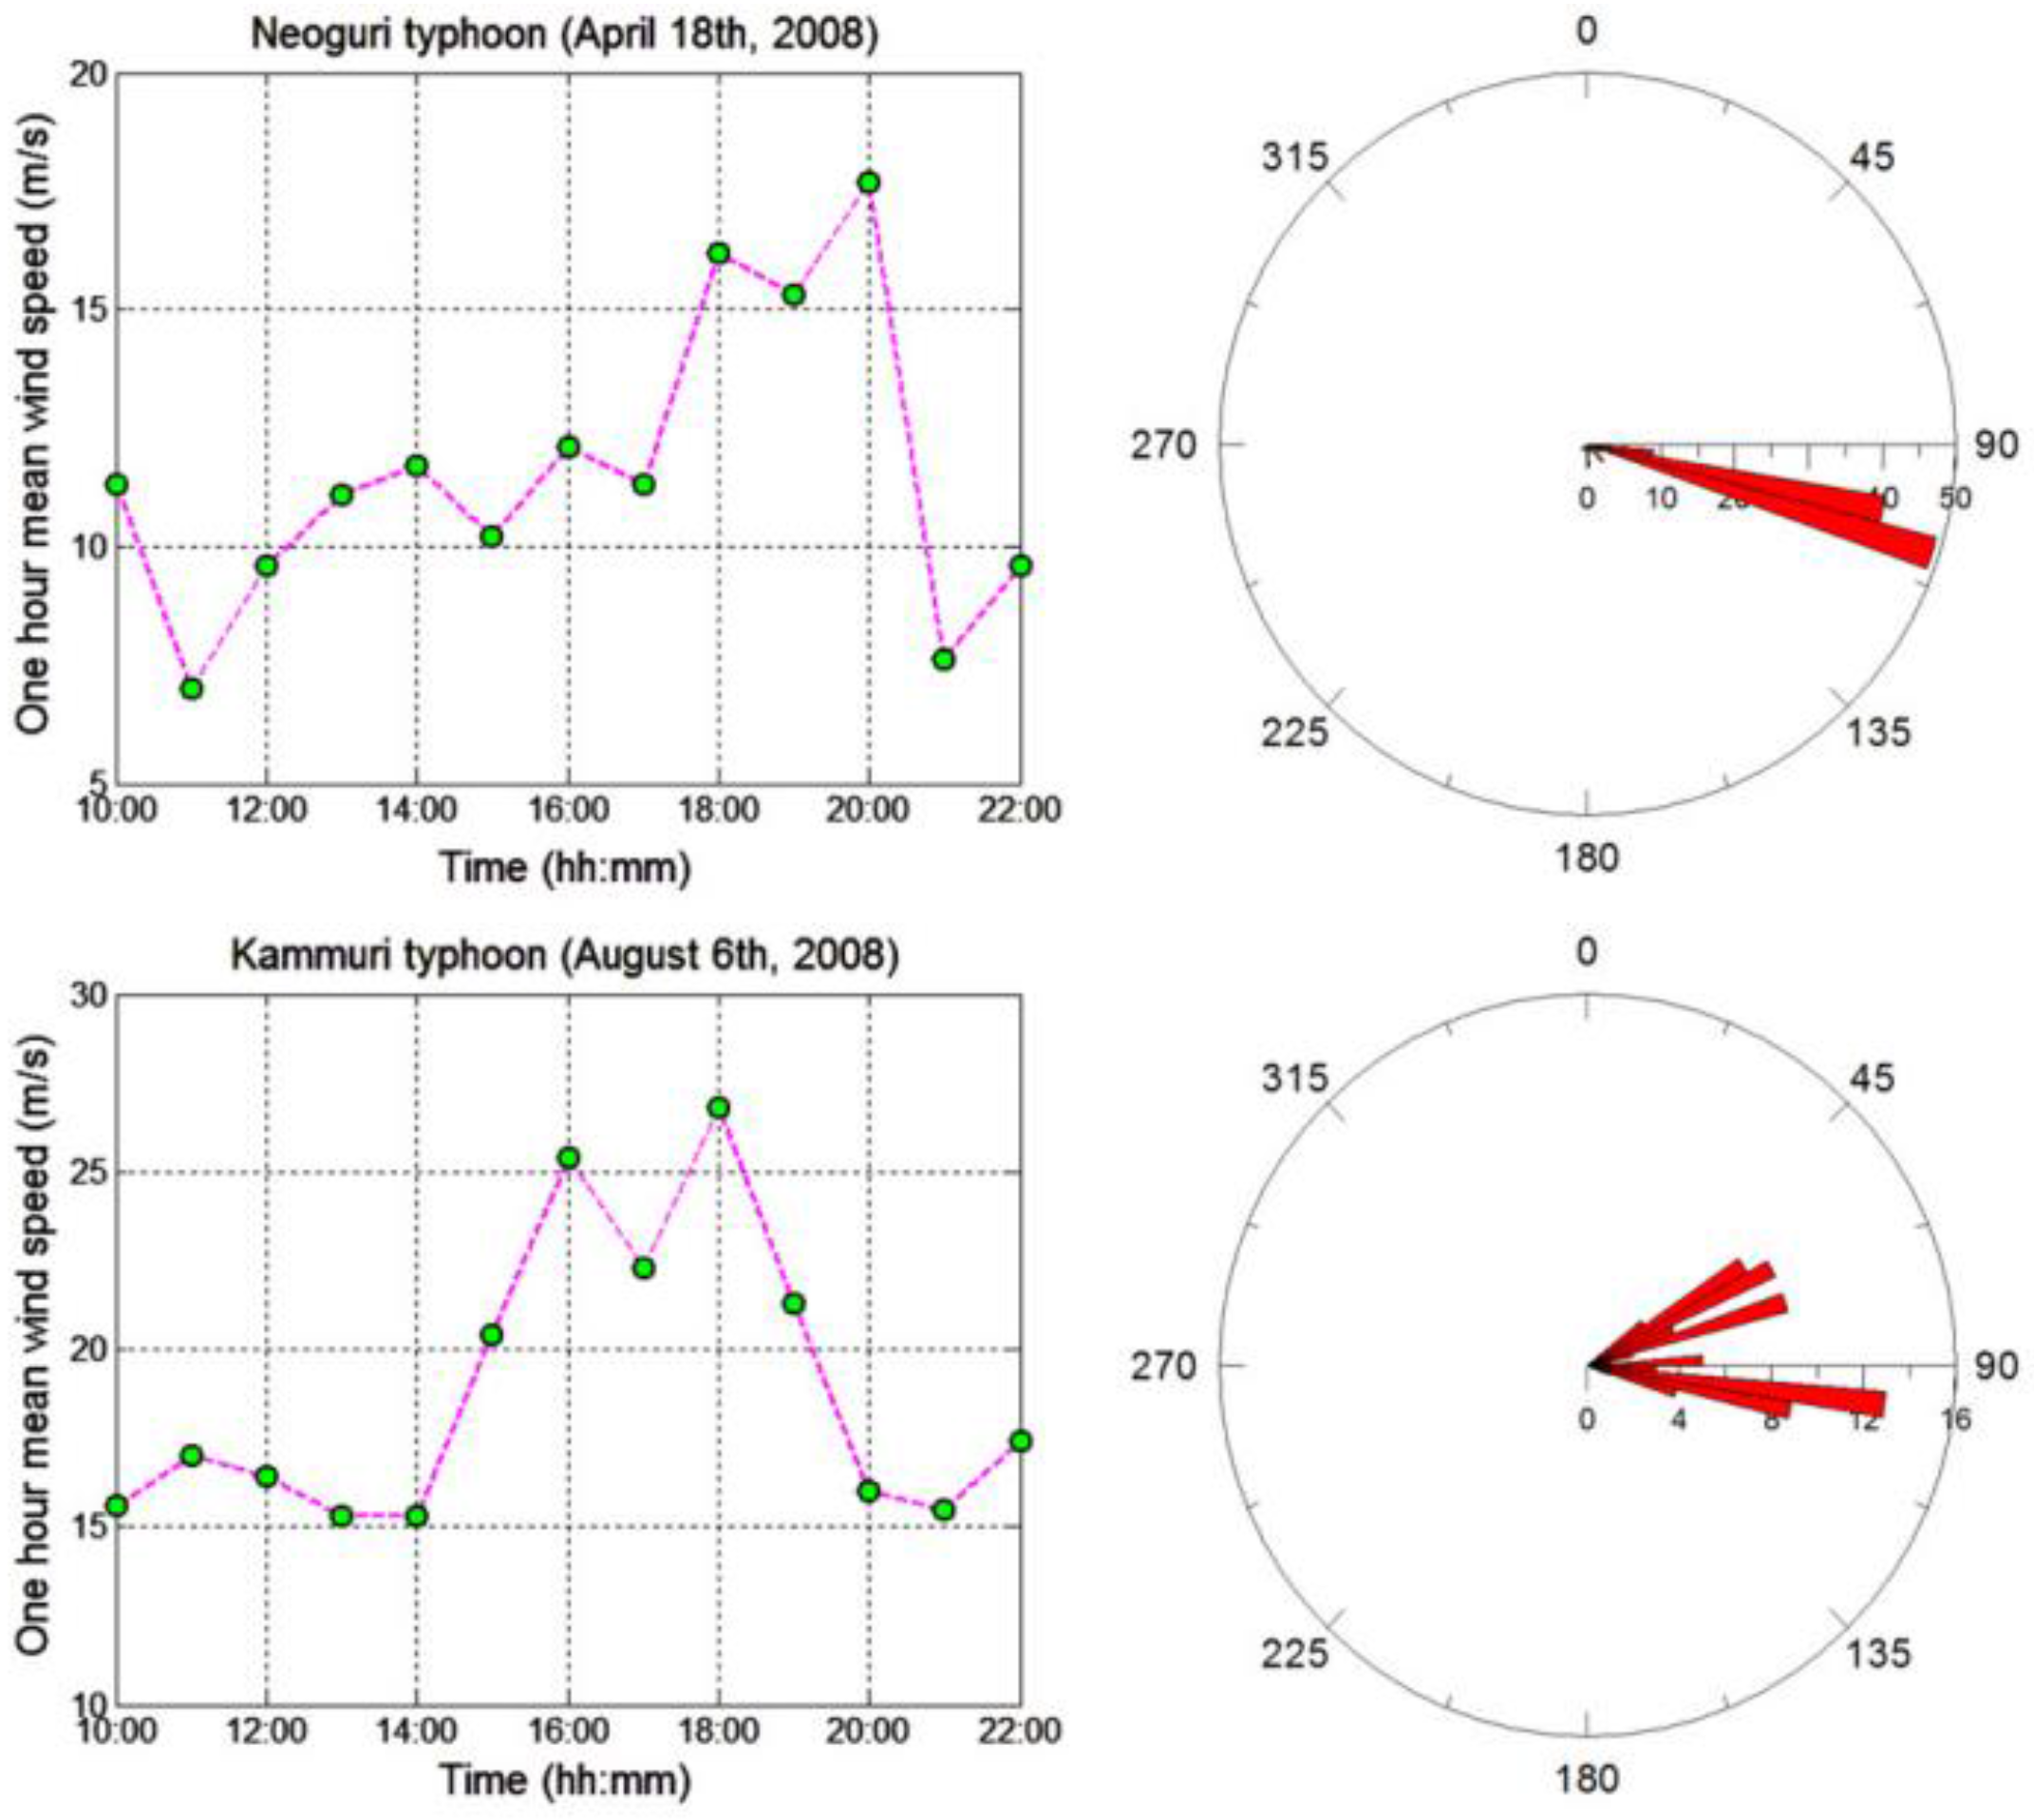
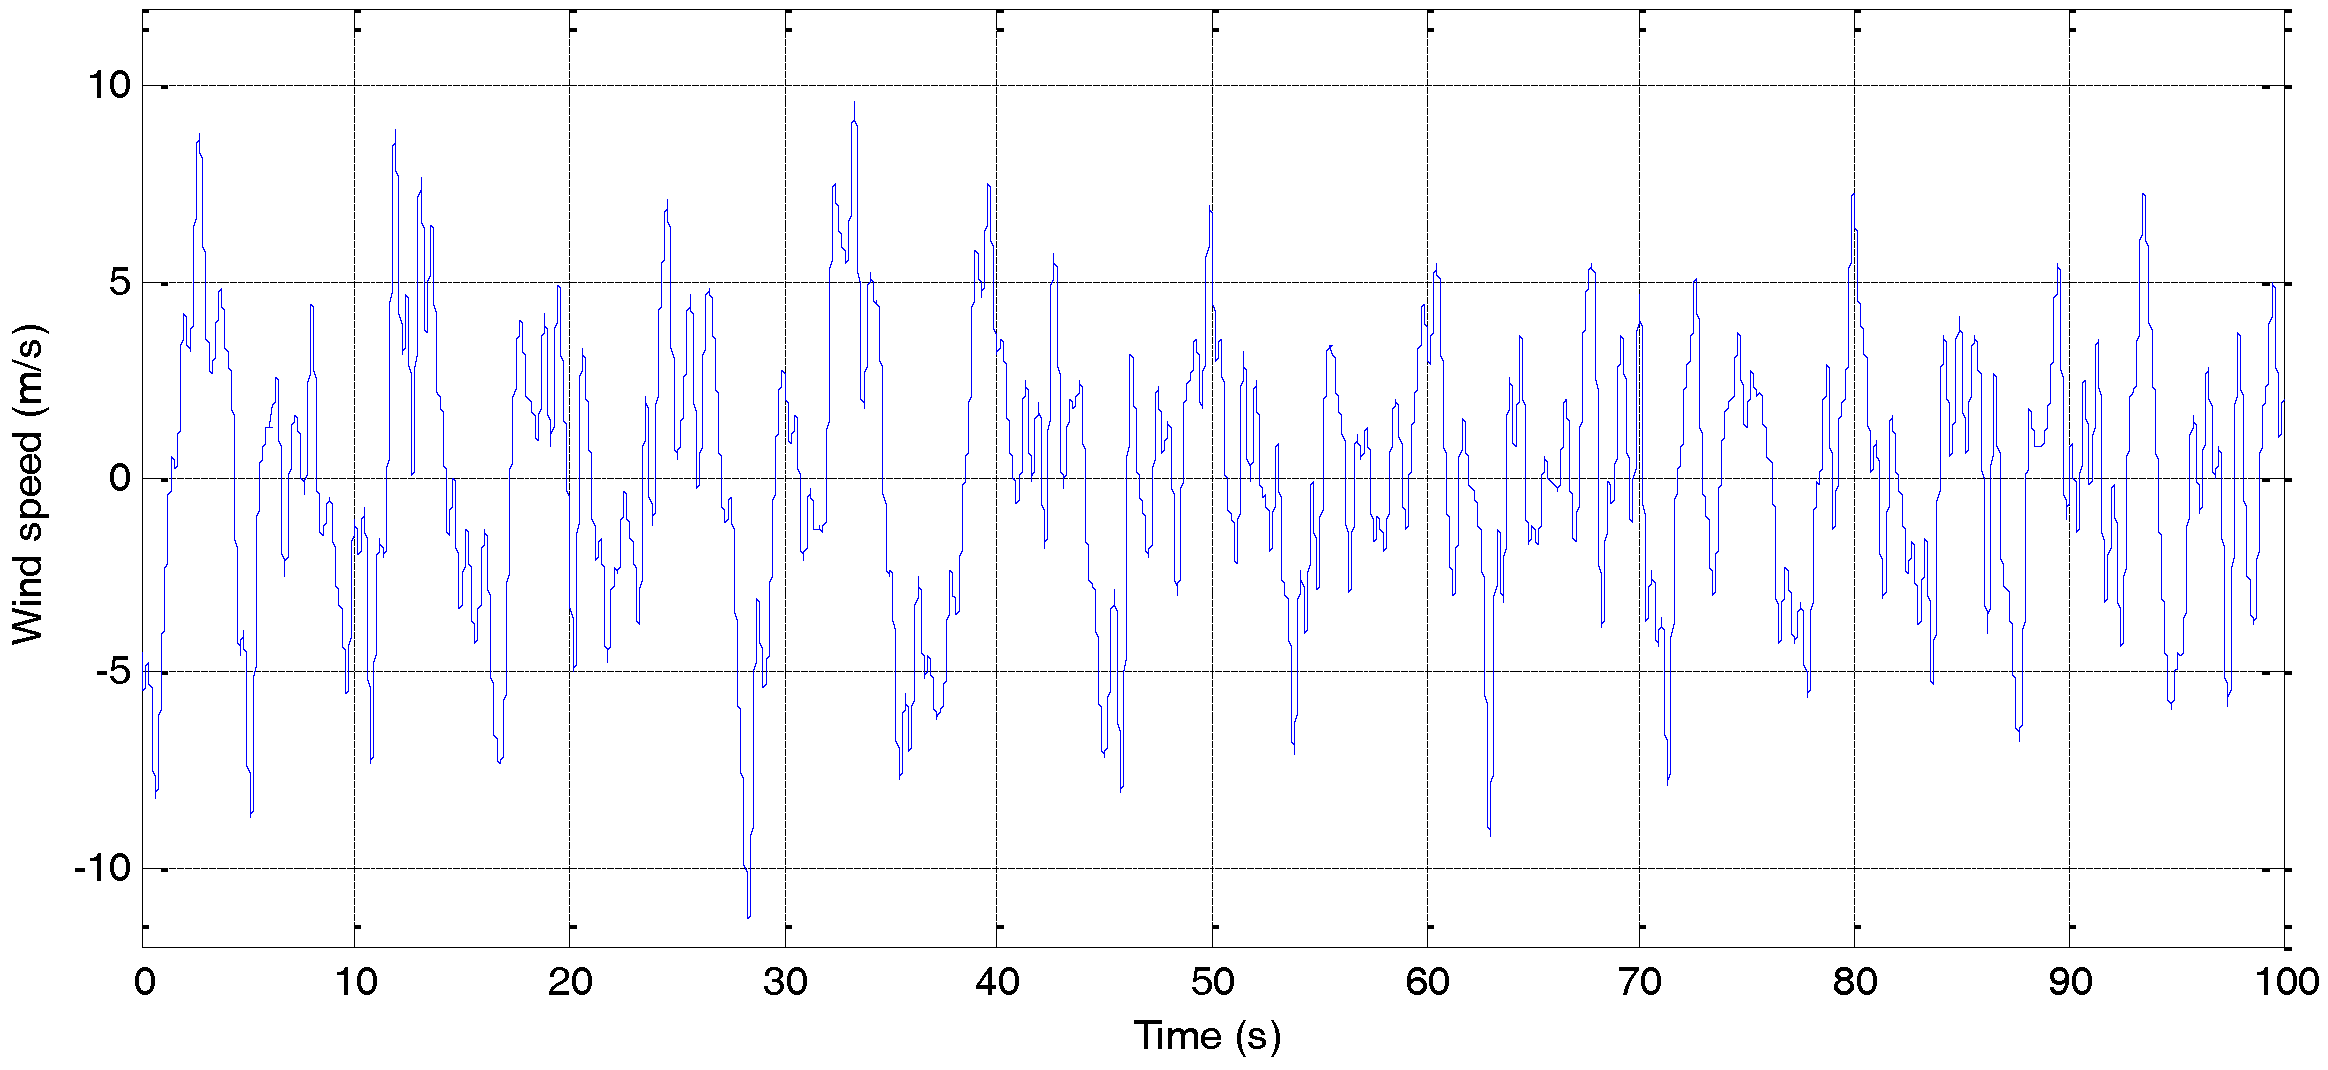
In order to study the feasibility of the PTMD on vibration control of civil structures under wind load and earthquake excitations, a benchmark model of the Canton Tower is selected as the host structure. The Canton Tower is located in Guangzhou, China. It has a total height of 600 m, includes a 454 m high main tower and a 146 m high antenna mast. The composite main tower has a reinforced concrete tube covered by a steel lattice. A sophisticated SHM system consisting of 16 types of more than 700 sensors has been installed in the tower. The SHM system has continuously acquired response data and loading data, such as temperature and wind speed, since 2010. As of today, the SHM system has successfully recorded the dynamic responses of the structure under several severe events, such as earthquakes and typhoons. Sets of ambient data have been adopted to verify the correctness of the full-order and reduced-order models in the previous study [43]. Particular wind speed data and wind rose diagrams drawn based on the monitor on top of the main tower during typhoons are shown in Figure 5. In the following simulation of this paper, two sets of the wind load data will be extracted from selected typhoons to verify the control effectiveness of the proposed PTMD device.
The benchmark problem for this tower originates from the structural health monitoring and damage detection problem of super-high-rise structures. Both a full-order FE model and a corresponding reduced-order model are established by the first author of this paper. Since the purpose of this paper will focus mainly on the global dynamic responses of the structure, the reduced order FE model is adopted in this study. The reduced-order model has been validated in the previous study [43] by field test data to have great precision and can describe the dynamic characteristic of the structure well. In the reduced-order model, the whole structure is modeled as 37 beam elements (27 for the main tower and 10 for the mast) and 38 nodes. Considering five DOFs for each node, which are the two horizontal translational and three rotational DOFs, a total number of 185 DOFs are included. The damping ratio of the structure was assumed to be 0.004 [44,45]. The layout of the model [46] is shown in Figure 6. Directions x and y represent the direction along the long axis and the short axis, respectively.
6. Vibration Control with PTMD
6.1. Design of the PTMD
In this study, the PTMD is assumed to be effective in both directions, which means the impact may happen in any horizontal direction. Thus, pounding force can always be decomposed to the components along the x and y directions in every impact. The PTMD is first designed as an optimal TMD whose stiffness is first tuned to match a certain natural frequency of the host structure. The first 10 natural frequencies obtained from modal analysis results are listed in Table 2. The first and the second modes of the structure appear to be bending modes along the long and short axes. The PTMD here is assumed to be tuned as 0.11 Hz, the same as the first natural frequency of the structure. The thickness of the viscoelastic layer was set to 0.6 m during the simulation. As shown in Figure 1, the impact will occur as soon as the mass contacts the surface of the limitation device; and by assuming the viscoelastic material can be fully compressed, the maximum allowance for the deformation of the viscoelastic layer will also be 0.6 m.
Usually, for this kind of high-rise structure, the optimal position to install a TMD device is on top of the structure [47]. However, considering the mast is made of lightweight steel and has a relatively small section, the local safety cannot be guaranteed if too much weight is connected. Additionally, it will be difficult to install at a certain height. Therefore, in this study, the top of the main tower is selected to be the optimal position of the PTMD. The corresponding nodal number is 27 in the reduced order model. For TMD and PTMD controls, the control effectiveness is how effective the PTMD is in controlling vibration. Theoretically, for a TMD device, the weight of the mass has to reach a certain mass ratio for obvious control effectiveness. However, for real complex civil structures, it is difficult to reach the ideal weight due to the carrying capacity of local elements around the connection. Examples of the world’s largest TMD systems include the Taipei 101 building with a weight of 660 t, the Shinjuku Nomura building at 1400 t (two units), and the largest at the Shinjuku Mitsui building at 1800 t (six units) [48]. The TMD is only designed and installed for wind-induced vibration control purposes. In this study, after trial calculation, the weight of the mass used in the PTMD device is chosen to be varied from 100 t to 500 t which, when compared to the first order modal mass, 2.17 × 10⁷ kg, the mass ratio is between 0.005 and 0.023. The stiffness of the connection and the optimal damping ratio is calculated as [49]:
where is the desired frequency to be tuned, usually set to be the first natural frequency of the structure, is the weight of the mass attached to the structure, and denotes the mass ratio of the mass to the generalized mass of the tuned mode.
The aforementioned pounding model is adopted for the simulation of the pounding force. The impact is considered to happen as soon as the relative displacement of the mass and the connected node is less than the selected gap. For the proposed PTMD device, the preset gap value significantly affects the control effectiveness. If the gap is too large, pounding can hardly happen or too small a pounding force is generated due to the small relative velocity between the mass and the limitation. However, if the preset gap value is too small, the movement of the mass will be confined to a relatively small amplitude, and the device will not be able to consume more pounding energy since the relative velocity will also be small in this case. As a result, it is believed the selection of the gap value will be influenced by different control purposes, the frequency components, and the intensity of the excitation. The influences of the gap value will be discussed later in the numerical simulation.
In the following simulation, the control effectiveness was defined to as a metric to evaluate the control performance of the damper. The control effectiveness is expressed as:
where and refer to the uncontrolled and controlled responses, respectively.
6.2. Wind Load Excitation Cases
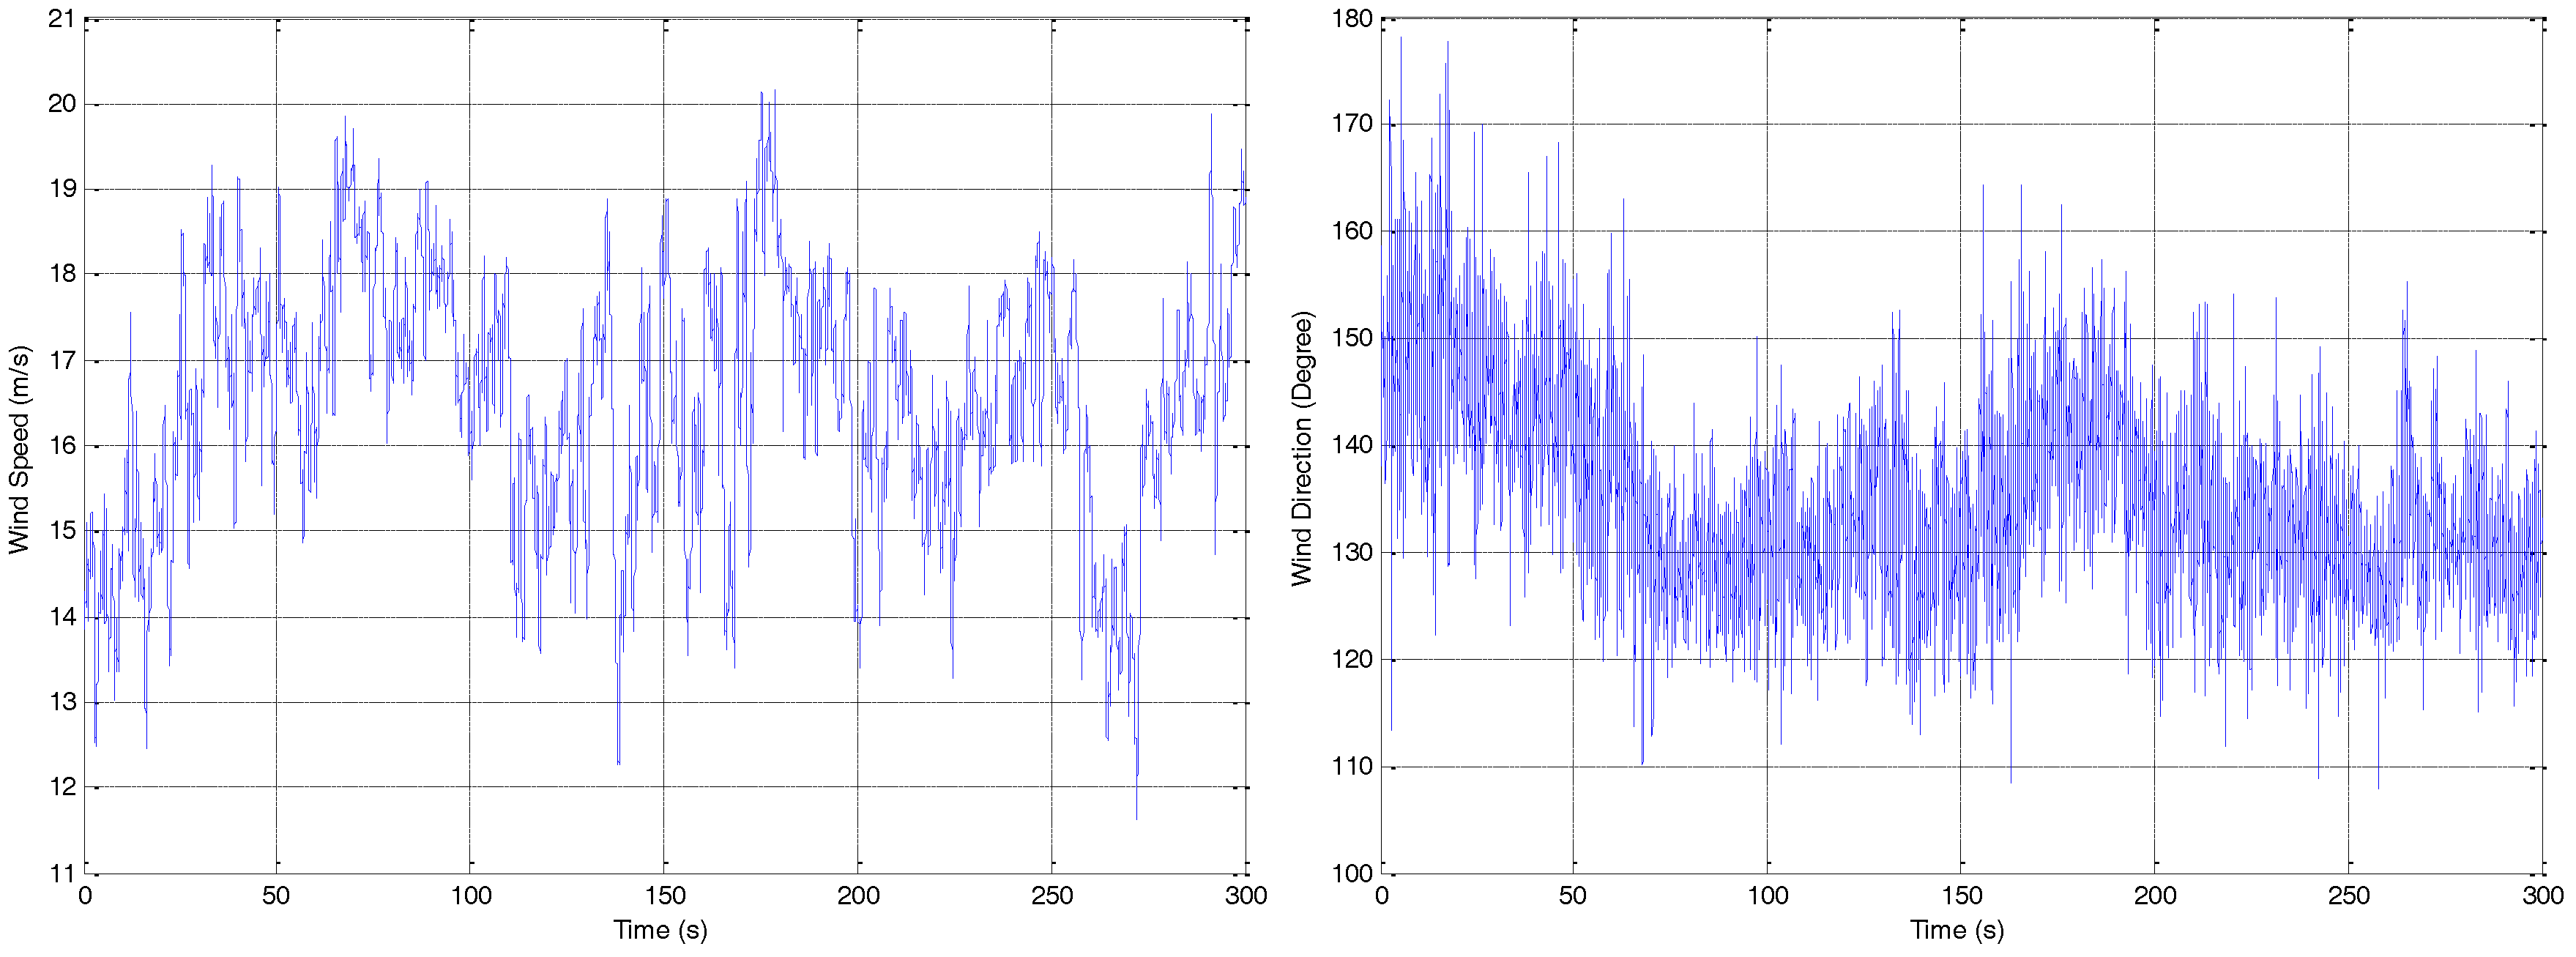
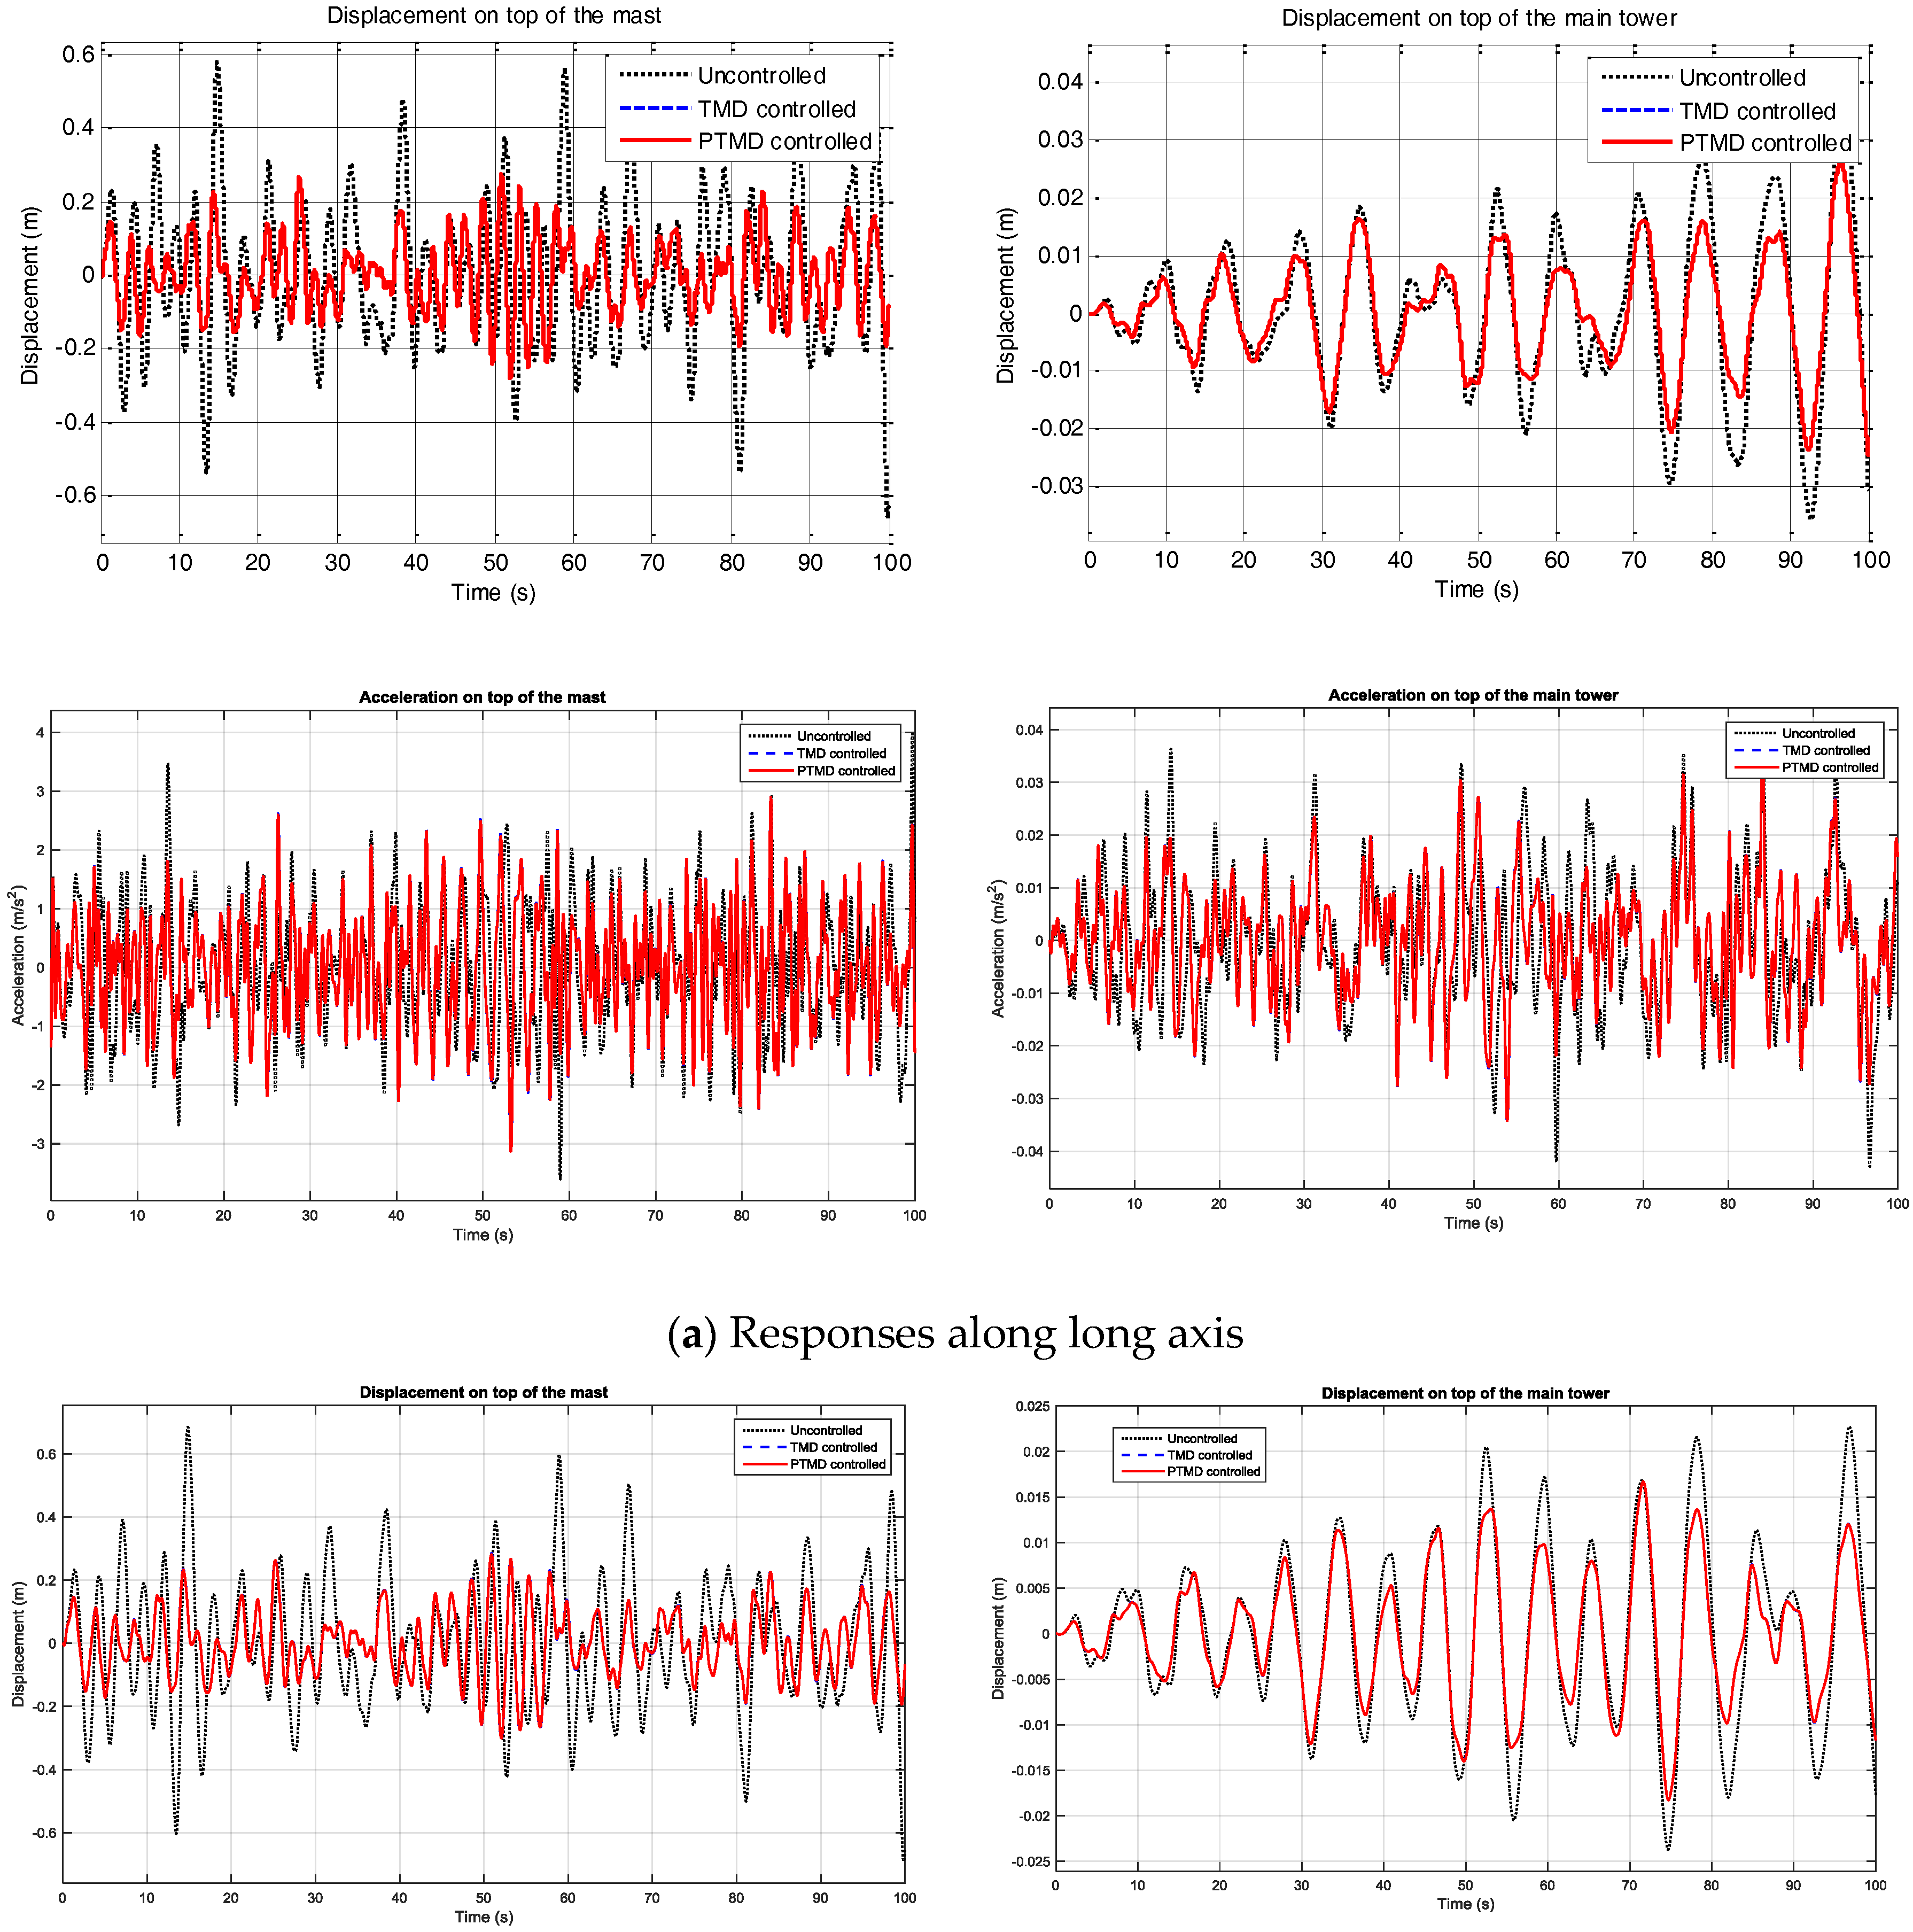
Time domain analyses are employed to calculate the responses of the structure under typical typhoons and stochastic wind loads. In typhoon cases, the time history of the wind speed is selected from the record of an anemometer installed on the Canton Tower. Typical recorded wind speeds and wind angle data are shown in Figure 7. It is assumed that wind load only acts on each node along the long and short axes. Information about the shape coefficient is used to generate the wind load from the wind speed, and is collected from the wind tunnel experiments done by Tongji University, China. The approximate windward area of each section is derived from the full-order FE model of the structure. After generating, the wind load will be decomposed into two directions, along the long-axis and short-axis, respectively. The composition force along the two directions will then be calculated and applied to the corresponding nodes of the reduced order model. For simplification, it is assumed that the segment between two adjacent nodes share the same wind load value. The time-history displacement and acceleration responses of the uncontrolled, TMD-controlled, and PTMD-controlled systems are shown in Figure 8. A summary of the peak and RMS responses on the mast top and the tower top of the structure are listed in Table 3 and Table 4. In these cases, the weight of the mass is fixed as 300 t for comparison. It should be noted that, as shown in Figure 8b, even though the wind excitation can be quite severe, the PTMD did not contribute much vibration mitigation. The reason for the lack of vibration suppression can be seen in Figure 8c, where one can see that the pounding force was insufficient despite the wind input.
Under typhoon excitation, it is shown that the proposed PTMD shares similar control effectiveness; only slight improvement is noticed on the peak and the RMS values. It can be observed from the tables that both control approaches can reduce the peak and RMS responses. On the mast top, the peak displacement responses are reduced by 19.14% and 34.75% subjected to Typhoon Haima and Typhoon Nanmado excitations, respectively, and the RMS displacement responses are reduced by 21.50% and 33.23%. Meanwhile, the peak displacement response along the y-direction on top of the mast are reduced by 24.24% and 32.86% under these typhoon excitations. When it comes to the acceleration responses, 18.46% and 28.15% control effectiveness values are obtained for peak responses on top of the mast, and 30.84% and 32.53% for the reduction of the RMS responses. As listed in the table, the PTMD is able to reduce the peak displacement responses on top of the main tower by 24.23% and 20.72%, but it is also important to notice that the peak acceleration responses along the short axis on the tower top are slightly increased when the TMD or PTMD is installed.
Stochastic wind load is generated from the Davenport spectrum to further verify the effectiveness of the devices. The AR method is utilized here for stochastic wind load generation. The time-history of the generated wind speed and the responses along the long-axis on the tower top and mast top are shown Figure 9 and Figure 10 and Table 5. The PTMD still observed similar control efficiency, not much better than that of the TMD, but the control efficiency is better than the typhoon excitation cases. Both of them are capable of reducing the peak and RMS responses by 57.79% and 49.65%, respectively.
6.3. Optimization Control Effectiveness under Earthquake Excitation
The feasibility of the proposed PTMD on enhancing earthquake safety of the host structure is verified by subjecting the structure to real earthquake records. The El Centro earthquake (NS, 1980) and Tianjin earthquake records (NS, 1976) are adopted to excite the structure. A simulation is performed by tuning the peak acceleration of the excitations along the long-axis from 0.1 g to 0.3 g. The earthquake records are chosen based on the sites and the suggestions from the local design codes. Earthquake components along the long and short axes are considered simultaneously, and the ratio of peak acceleration is set to be 1:0.85 according to the Chinese Aseismic Design Code.
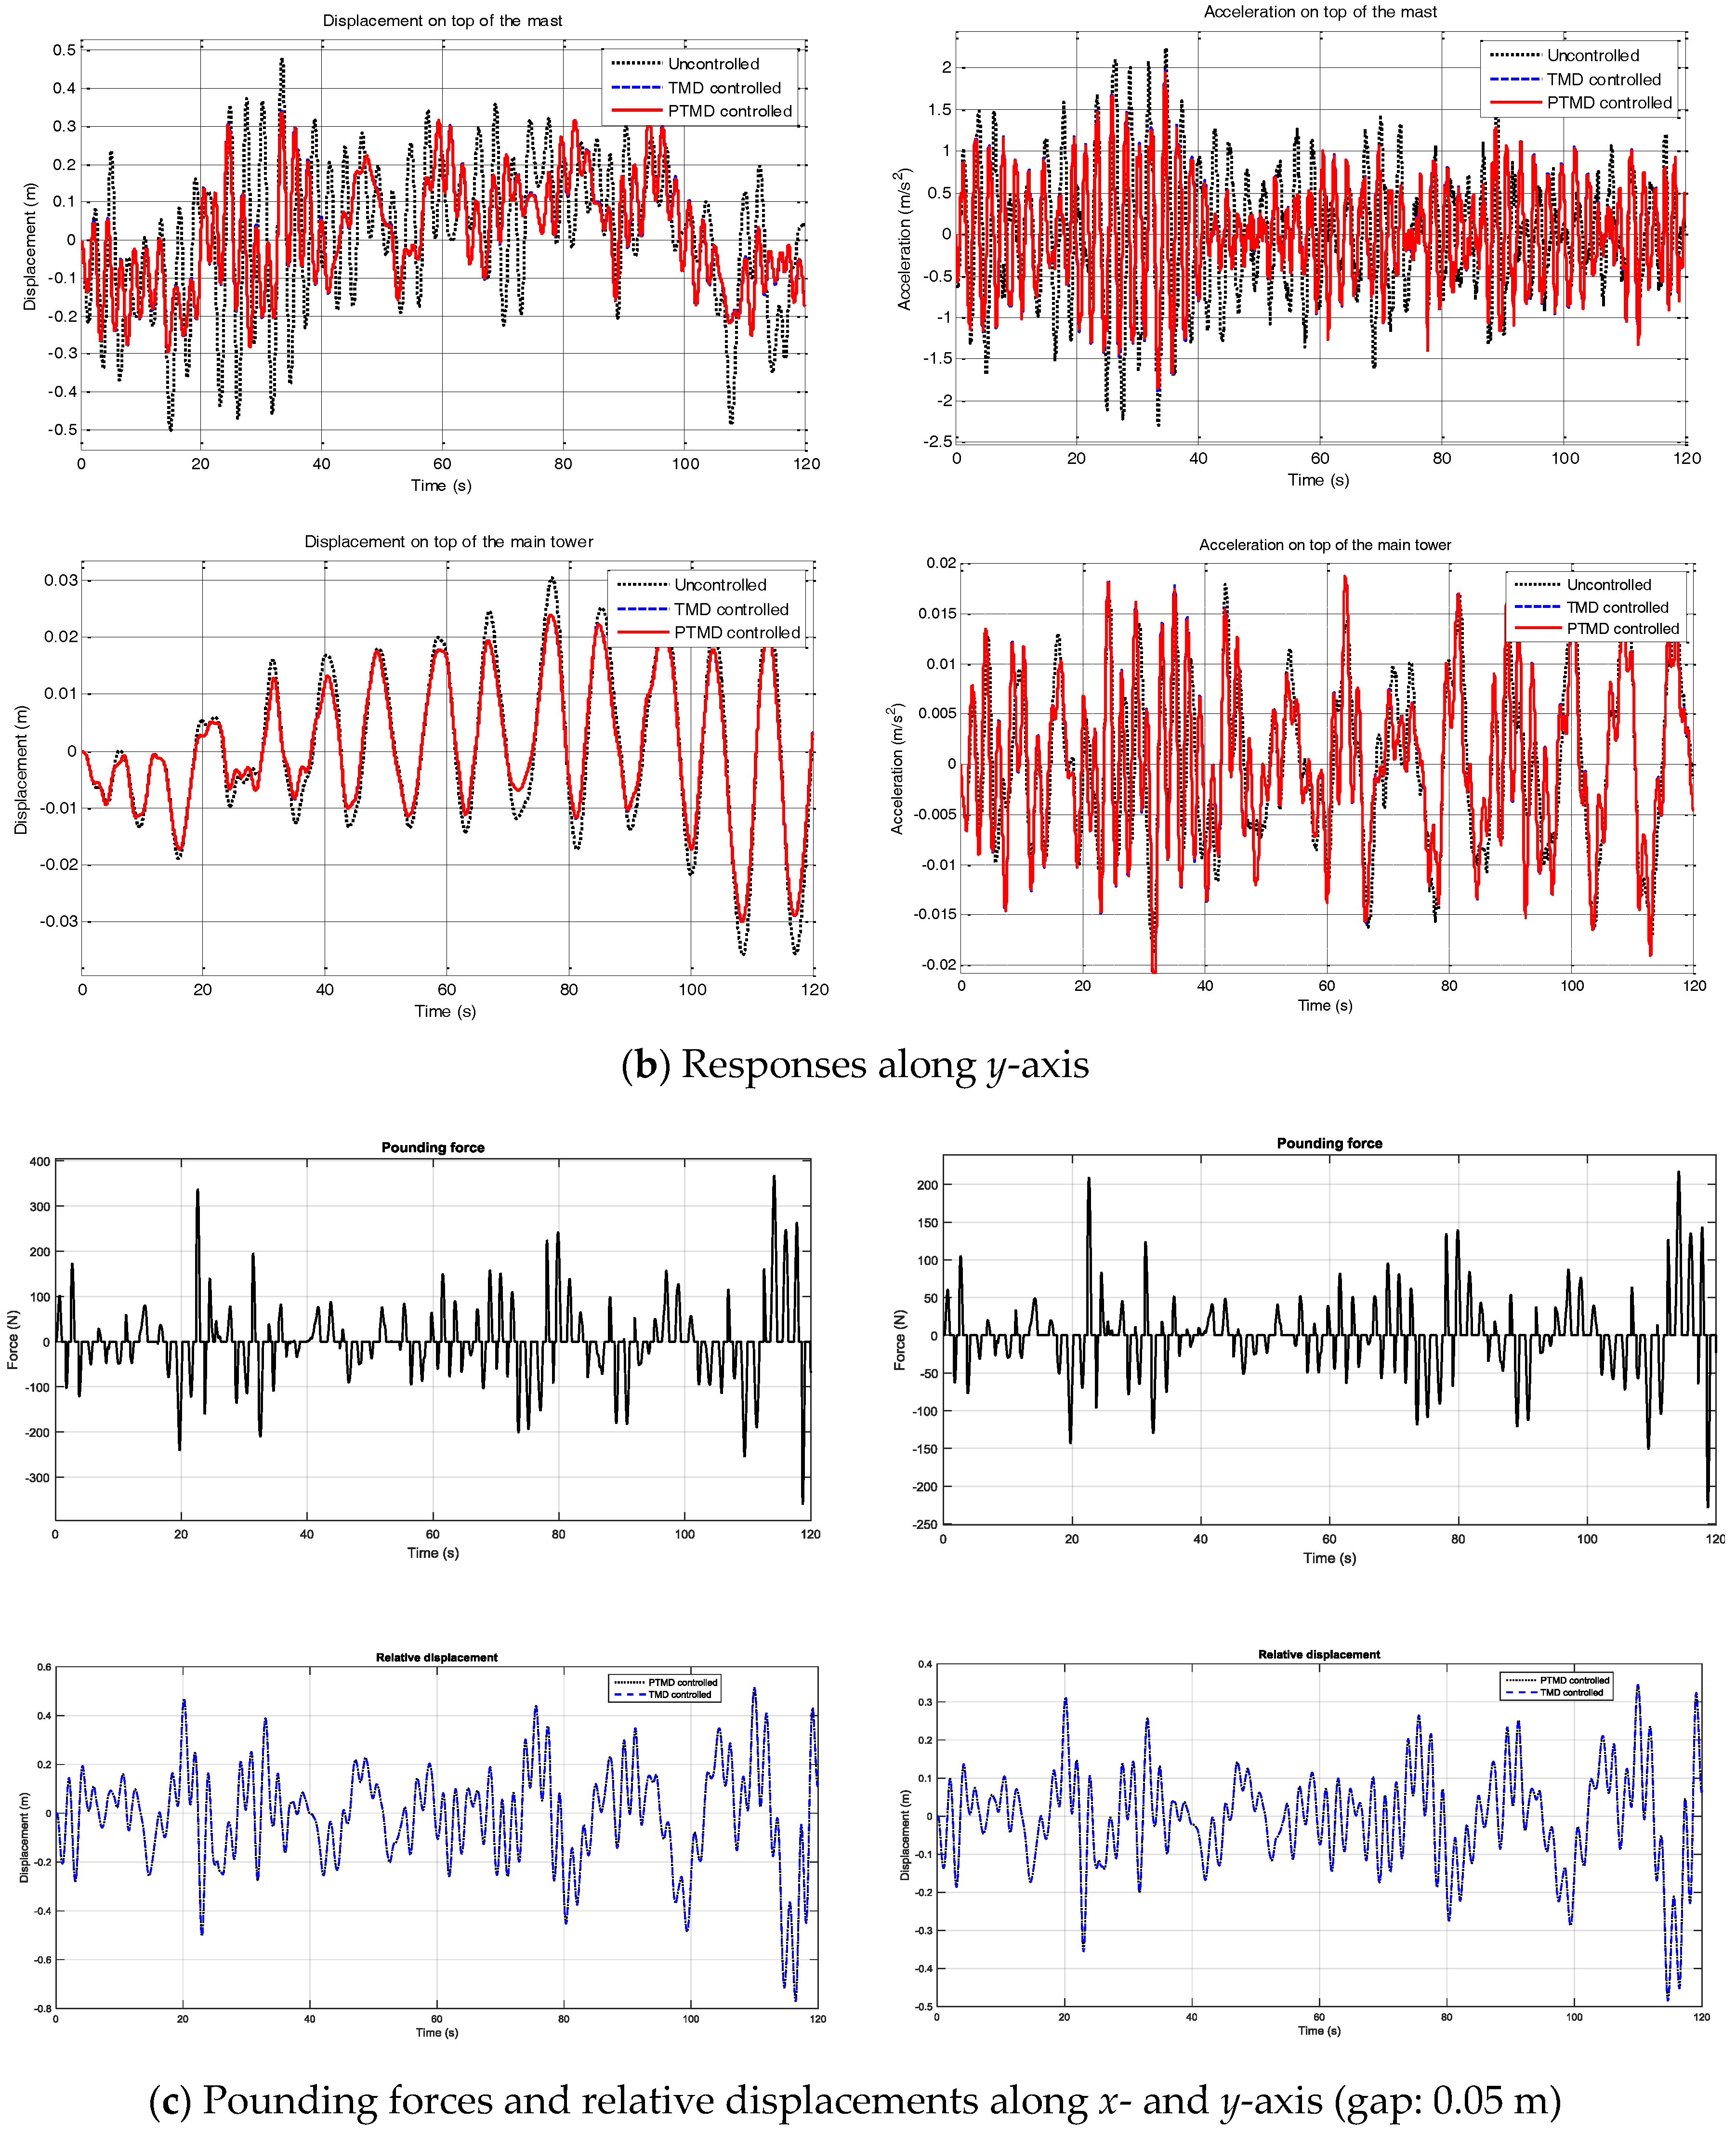
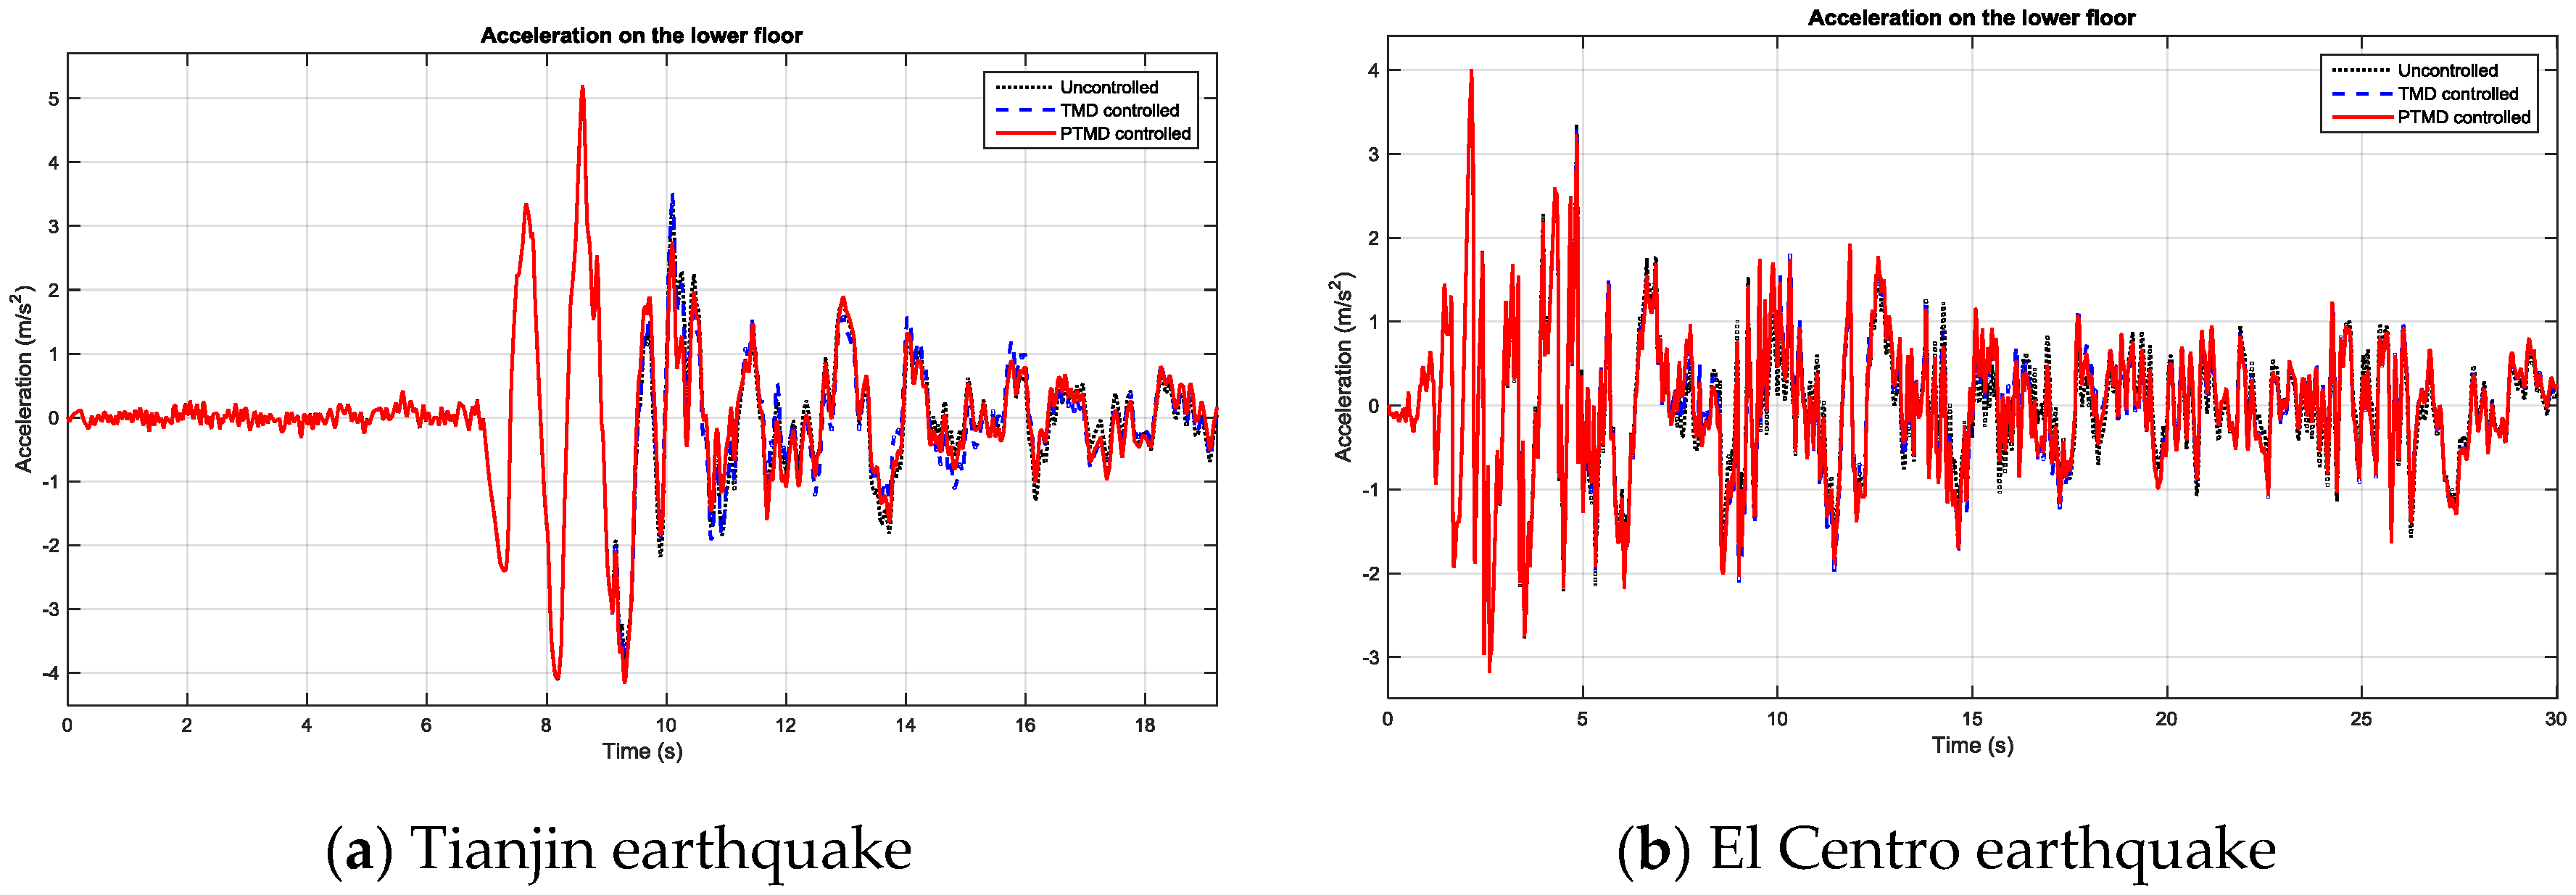
Unlike wind load excitation cases, earthquakes can generate more severe impacts between the mass and the host structure. Thus, a certain amount of energy can be consumed through the impact behavior. As mentioned before, the original gap value between the mass and the limitation should be selected carefully to guarantee beyond a certain impact level. Here the maximum gap value is decided based on the maximum relative displacement of the mass and the structure derived from TMD-controlled simulation results. Time history of uncontrolled, TMD-controlled, and PTMD-controlled displacement responses on the tower top are compared in Figure 11 when a 300 t mass is connected and the gap is set as 0.25 m. The corresponding pounding force is also shown in the figures. It is clearly observed from these results that the PTMD can produce much better performance on the reduction of earthquake-induced displacement. When the Tianjin earthquake strikes, the TMD failed to reduce the peak responses. On the contrary, the peak and RMS displacement responses are decreased by 60.10% and 64.82%, respectively, when the PTMD is installed. Data from Figure 11 and Figure 12 suggests that higher acceleration is needed to enable significant displacement reduction. This was observed especially when the Tianjin earthquake record was used. On the other hand, the acceleration on the lower floor is not severe, as shown in Figure 13. For now this is a major drawback for PTMD control, and this problem may be improved by the use of multiple, smaller PTMDs to make the displacement over the whole structure smaller.
6.4. Control Performance with Improved Hertz Pounding Model
The comparison of time history displacement responses when using the improved pounding model and the Hertz-based pounding model is shown in Figure 14. As mentioned above, the traditional Hertz-based pounding model tends to underestimate the peak pounding forces especially when the relative velocities between the two impact bodies are large. The comparison results show that when the structure is subjected to the Tianjin earthquake, the improved Hertz model gives better control performances (approximate 32%) by fully considering the nonlinear damping coefficient during impact, and the dissipated energy during the impact behavior can be described more precisely. When the El Centro earthquake strikes, although the peak pounding force is larger, only slight improvement can be obtained when using the improved Hertz model. As similar comparison results between the control effectiveness of the TMD and PTMD controls is shown in Figure 12, the El Centro excitation did not generate a particularly severe impact compared to the Tianjin record. The dissipated energy through the impact behavior is relatively small and, in this case, the PTMD acts more like a TMD.
6.5. Parameter Studies
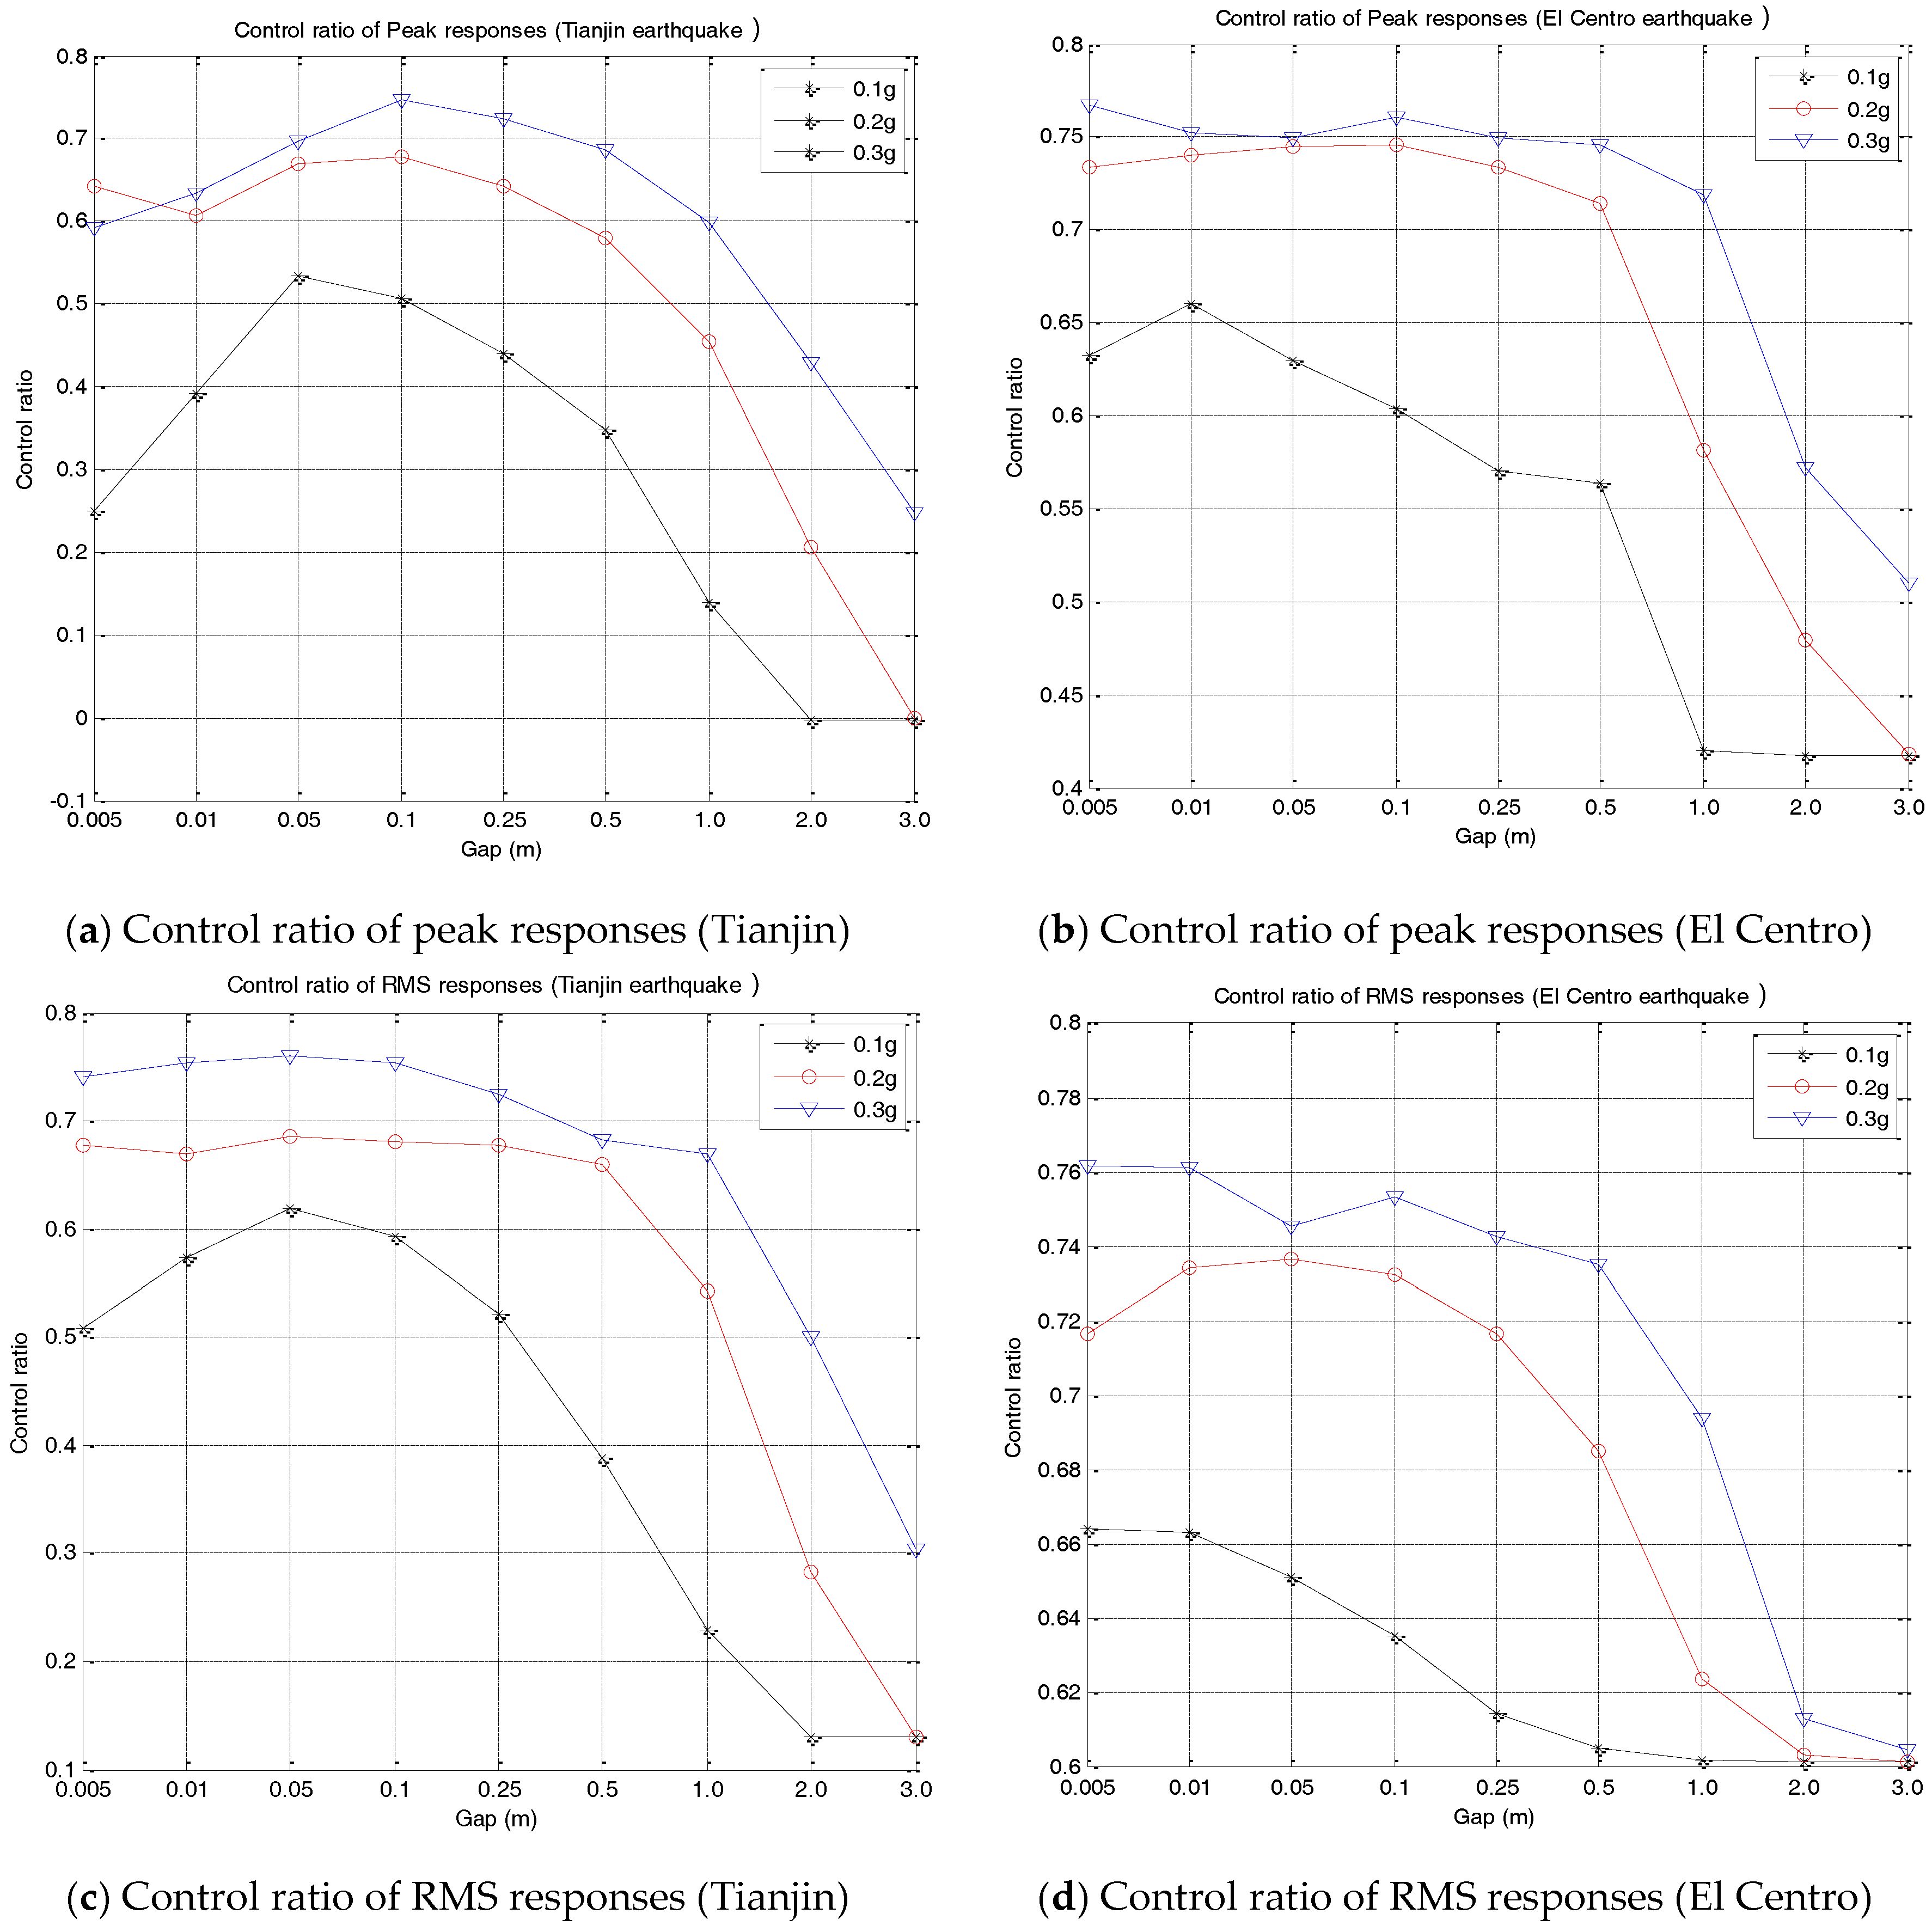
In order to investigate the influence of the gap value on the control effectiveness, the peak and RMS displacement responses along the x direction are listed in Table 6 and Figure 15, with the gap value selected from 0.005 m to 3 m. The maximum gap is chosen with reference to the maximum relative displacement between the mass and the connected point during TMD cases’ simulations. As listed in the table, when the gap becomes larger, the control effectiveness is approaching the TMD-controlled results, which means pounding can hardly happen or not enough impact energy is consumed. Along with the decreasing of the gap value, the control results improved until the gap reaches a certain value and starts to degenerate. This phenomenon arises from the fact that even though the gap value is small enough to constantly induce impact, the relative velocity before pounding is not large enough to dissipate more energy and yield deformation of the VE layer. In addition, the movement of the mass will also be confined by the small gaps and, thus, the mass will possess less kinetic and potential energy and reduce the control effectiveness.
By fixing the gap value to 0.05 m, the influence of the mass ratio can be examined (Table 7). As seen in the table, both the TMD and PTMD systems tend to perform better with a larger mass ratio. However, the performance of the TMD varies significantly with the changing mass value and the excitations. Results show that the TMD can perform well under the El Centro excitations—both the peak and the RMS responses can have a reduction over 40%. In the Tianjin earthquake excitation cases, even though the mass of the TMD increases from 200 t to 500 t, the control effectiveness of the peak responses can only increase from −0.28% to 12.65%. On the contrary, promising results in which less variation are observed in the PTMD-controlled cases with the changing value of the mass ratio. The control results on the peak and the RMS varies little and remains above 50% in every cases. These results also indicate that the PTMD is able to achieve better control results with a lower mass ratio, which will result in easier installation and lower cost of the whole controlled system. In addition, the trend of the PTMD control results presented with respect to the variation of the intensity of the earthquake input clearly shows better improvement on the control efficiency under extreme excitations.
From these parameter study results, the basic design guidelines of a PTMD can be concluded thusly: (i) the mass ratio can be selected from 0.005 to 0.1; (ii) tune the frequency of the PTMD according to the first natural frequency of the host structure; (iii) calculate the TMD-controlled cases with moderate/designed earthquake input levels; (iv) the initial gap value between the mass and the viscoelastic limitation is selected as 1/3 of the maximum relative displacement of the mass and the connection point in the TMD control case; and (v) more earthquake inputs with different intensities are adopted for trial calculations to further adjust and optimize the gap value according to the control effectiveness.
7. Conclusions
Making use of the energy dissipation during impact, an application of a PTMD on controlling the responses of high-rise structures under wind load and earthquake inputs are presented in this paper. An improved pounding force model was proposed. After optimizing the parameters, the comparison results between the simulated and experimental data demonstrates that the proposed model appears to be more precise over the traditional Hertz-based pounding model in describing the pounding force between the mass and the viscoelastic layer. By taking the benchmark Canton Tower with a height of 600 m as the host structure, TMD- and PTMD-controlled cases were simulated and compared under wind and earthquake excitations. Particularly, the recorded typhoon data collected from the structural health monitoring system on the tower was adopted to excite the structure. The proposed PTMD will perform as a traditional TMD under wind load excitations. The generated impact will not be strong enough to dissipate energy even when trying to adjust the gap to force pounding. Under earthquake excitations, a TMD can only be effective under certain excitations and the control effectiveness is very sensitive to the mass ratio. On the contrary, the PTMD appears to have better performance over the traditional TMD. In addition, the robustness of the device is demonstrated by the stability of the control results under different earthquake inputs. The superiority of the device over traditional TMD is also verified by the fact that it is able to achieve similar, or even better, control effectiveness with less weight, and the improvement is even better when the intensity of the earthquake input increases. Simulation results indicate that the performance of the PTMD has a lot to do with the selected gap value and, thus, it should be carefully chosen with respect to the optimal value.
Acknowledgments
The authors are grateful for financial support by the National Natural Science Foundation of China (No. 51578159 and 51678158), the Program for New Century Excellent Talents at Fujian Province University (2016, No. 83016017), the Co-operative Project of Fujian Province Colleges and Universities (No. 2016H6011), and the Co-operative Leading Project of Fujian Province Colleges and Universities (No. 2017H0016).
Author Contributions
Wei Lin and Gangbing Song did the modelling work, built the PTMD simulation program, and wrote the paper. Shanghong Chen analyzed the simulation data.
Conflicts of Interest
The authors declare no conflict of interest.
References
- Zhang, Z.; Ou, J.P. Optimization Design of Coupling Beam Metal Damper in Shear Wall Structures. Appl. Sci. 2017, 7, 7020137. [Google Scholar] [CrossRef]
- Weber, F.; Distl, H.; Fischer, S.; Braun, C. MR Damper Controlled Vibration Absorber for Enhanced Mitigation of Harmonic Vibrations. Appl. Sci. 2016, 5, 5040027. [Google Scholar] [CrossRef]
- Jansen, L.M.; Dyke, S.J. Semiactive control strategies for MR dampers: Comparative study. J. Eng. Mech. 2000, 126, 795–803. [Google Scholar] [CrossRef]
- Soong, T.T.; Spencer, B.F., Jr. Supplemental energy dissipation: State-of-the-art and state-of-the-practice. Eng. Struct. 2002, 24, 243–259. [Google Scholar] [CrossRef]
- Lee, C.L.; Chen, Y.T.; Chung, L.L.; Wang, Y.P. Optimal design theories and applications of tuned mass dampers. Eng. Struct. 2006, 28, 43–53. [Google Scholar] [CrossRef]
- Mishra, S.K.; Gur, S.; Chakraborty, S. An improved tuned mass damper (SMA-TMD) assisted by a shape memory alloy spring. Smart Mater. Struct. 2013, 22, 095016. [Google Scholar] [CrossRef]
- Nagarajaiah, S. Adaptive passive, semiactive, smart tuned mass dampers: Identification and control using empirical mode decomposition, hilbert transform, and short-term fourier transform. Struct. Control Health Monit. 2009, 16, 800–841. [Google Scholar] [CrossRef]
- Casado, C.M.; Poncela, A.V.; Lorenzana, A. Adaptive tuned mass damper for the construction of concrete piers. Struct. Eng. Int. 2007, 17, 252–255. [Google Scholar] [CrossRef]
- Occhiuzzi, A.; Spizzuoco, M.; Ricciardelli, F. Loading models and response control of footbridges excited by running pedestrians. Struct. Control Health Monit. 2008, 15, 349–368. [Google Scholar] [CrossRef]
- Weber, B.; Feltrin, G. Assessment of long-term behavior of tuned mass dampers by system identification. Eng. Struct. 2010, 32, 3670–3682. [Google Scholar] [CrossRef]
- Hoang, N.; Fujino, Y.; Warnitchai, P. Optimal tuned mass damper for seismic applications and practical design formulas. Eng. Struct. 2008, 30, 707–715. [Google Scholar] [CrossRef]
- Demetriou, D.; Nikitas, N. A Novel Hybrid Semi-Active Mass Damper Configuration for Structural Applications. Appl. Sci. 2016, 6, 6120397. [Google Scholar] [CrossRef]
- Inaudi, J.A.; Kelly, J.M. Mass damper using friction-dissipating devices. J. Eng. Mech. 1995, 121, 142–149. [Google Scholar] [CrossRef]
- Rüdinger, F. Optimal vibration absorber with nonlinear viscous power law damping and white noise excitation. J. Eng. Mech. 2006, 132, 46–53. [Google Scholar] [CrossRef]
- Rüdinger, F. Tuned mass damper with nonlinear viscous damping. J. Sound Vib. 2007, 300, 932–948. [Google Scholar] [CrossRef]
- Alexander, N.A.; Schilder, F. Exploring the performance of a nonlinear tuned mass damper. J. Sound Vib. 2009, 319, 445–462. [Google Scholar] [CrossRef]
- Kaloop, M.R.; Hu, J.W.; Bigdeli, Y. Identification of the Response of a Controlled Building Structure Subjected to Seismic Load by Using Nonlinear System Models. Appl. Sci. 2016, 6, 6100301. [Google Scholar] [CrossRef]
- Chung, L.L.; Wu, L.Y.; Huang, H.H.; Chang, C.H.; Lien, K.H. Optimal design theories of tuned mass dampers with nonlinear viscous damping. Earthq. Eng. Eng. Vib. 2009, 8, 547–560. [Google Scholar] [CrossRef]
- Ricciardelli, F.; Occhiuzzi, A.; Clemente, P. Semi-active tuned mass damper control strategy for wind-excited structures. J. Wind Eng. Ind. Aerodyn. 2000, 88, 57–74. [Google Scholar] [CrossRef]
- Pinkaew, T.; Fujino, Y. Effectiveness of semi-active tuned mass dampers under harmonic excitation. Eng. Struct. 2001, 23, 850–856. [Google Scholar] [CrossRef]
- Ikeda, Y. Active and semi-active vibration control of buildings in Japan—Practical applications and verification. Struct. Control Health Monit. 2009, 16, 703–723. [Google Scholar] [CrossRef]
- Spencer, B.F., Jr.; Nagarajaiah, S. State of the art of structural control. J. Struct. Eng. (ASCE) 2003, 129, 845–856. [Google Scholar] [CrossRef]
- Li, L.; Song, G.; Ou, J. Hybrid active mass damper (AMD) vibration suppression of nonlinear high-rise structure using fuzzy logic control algorithm under earthquake excitations. Struct. Control Health Monit. 2011, 18, 698–709. [Google Scholar] [CrossRef]
- Gsell, D.; Feltrin, G.; Motavalli, M. Adaptive tuned mass damper based on pre-stressable leaf-springs. J. Intell. Mater. Syst. Struct. 2007, 18, 845–851. [Google Scholar] [CrossRef]
- Rizos, D.; Feltrin, G.; Motavalli, M. Structural identification of a prototype pre-stressable leaf-spring based adaptive tuned mass damper: Nonlinear characterization and classification. Mech. Syst. Signal Proc. 2011, 25, 205–221. [Google Scholar] [CrossRef]
- Williams, K.A.; Chiu, G.C.; Bernhard, R.J. Dynamic modelling of a shape memory alloy adaptive tuned vibration absorber. J. Sound Vib. 2005, 280, 211–234. [Google Scholar] [CrossRef]
- Sun, W.Q.; Li, Q.B. TMD semi-active control with shape memory alloy. J. Harbin Inst. Technol. 2009, 41, 164–168. [Google Scholar] [CrossRef]
- Varadarajan, N.; Nagarajaiah, S. Wind response control of building with variable stiffness tuned mass damper using empirical mode decomposition/Hilbert transform. J. Eng. Mech. 2004, 130, 451–458. [Google Scholar] [CrossRef]
- Nagarajaiah, S.; Varadarajan, N. Short time Fourier transform algorithm for wind response control of buildings with variable stiffness TMD. Eng. Struct. 2005, 27, 431–441. [Google Scholar] [CrossRef]
- Weber, F.; Maślanka, M. Frequency and damping adaptation of a TMD with controlled MR damper. Smart Mater. Struct. 2012, 21, 055011. [Google Scholar] [CrossRef]
- Weber, F.; Boston, C.; Maślanka, M. An adaptive tuned mass damper based on the emulation of positive and negative stiffness with an MR damper. Smart Mater. Struct. 2011, 20, 015012. [Google Scholar] [CrossRef]
- Cai, C.S.; Wu, W.J.; Araujo, M. Cable vibration control with a TMD-MR damper system: Experimental exploration. J. Struct. Eng. 2007, 133, 629–637. [Google Scholar] [CrossRef]
- Eason, R.P.; Sun, C.; Dick, A.J.; Nagarajaiah, S. Attenuation of a linear oscillator using a nonlinear and a semi-active tuned mass damper in series. J. Sound Vib. 2013, 332, 154–166. [Google Scholar] [CrossRef]
- Zhang, P.; Song, G.; Li, H.N.; Lin, Y.X. Seismic Control of Power Transmission Tower Using Pounding TMD. J. Eng. Mech. 2012, 139, 1395–1406. [Google Scholar] [CrossRef]
- Lankarani, H.M.; Nikravesh, P.E. A contact force model with hysteresis damping for impact analysis of multibody systems. J. Mech. Des. 1990, 112, 369–376. [Google Scholar] [CrossRef]
- Lankarani, H.M.; Nikravesh, P.E. Continuous contact force models for impact analysis in multibody systems. Nonlinear Dyn. 1994, 5, 193–207. [Google Scholar]
- Wasfy, T.M.; Noor, A.K. Computational strategies for flexible multibody systems. Appl. Mech. Rev. 2003, 56, 553–613. [Google Scholar] [CrossRef]
- Schwab, A.L.; Meijaard, J.P.; Meijers, P. A comparison of revolute joint clearance models in the dynamic analysis of rigid and elastic mechanical systems. Mech. Mach. Theory 2002, 37, 895–913. [Google Scholar] [CrossRef]
- Pereira, C.M.; Ambrósio, J.A.; Ramalho, A.L. A methodology for the generation of planar models for multibody chain drives. Multibody Syst. Dyn. 2010, 24, 303–324. [Google Scholar] [CrossRef]
- Gonthier, Y.; Mcphee, J.; Lange, C.; Piedbceuf, J.C. A Regularized Contact Model with Asymmetric Damping and Dwell-Time Dependent Friction. Multibody Syst. Dyn. 2004, 11, 209–233. [Google Scholar] [CrossRef]
- Flores, P.; Ambrósio, J.; Claro, J.P.; Lankarani, H.M. Dynamic behaviour of planar rigid multi-body systems including revolute joints with clearance. Proc. Inst. Mech. Eng. Part K J. Multi-Body Dyn. 2007, 221, 161–174. [Google Scholar] [CrossRef]
- Flores, P.; Machado, M.; Silva, M.T.; Martins, J.M. On the continuous contact force models for soft materials in multibody dynamics. Multibody Syst. Dyn. 2011, 25, 357–375. [Google Scholar] [CrossRef]
- Ni, Y.Q.; Xia, Y.; Lin, W.; Chen, W.H.; Ko, K.M. SHM benchmark for high-rise structures: A reduced-order finite element model and field measurement data. Smart Mater. Struct. 2012, 10, 411–426. [Google Scholar] [CrossRef]
- Chen, W.H.; Lu, Z.R.; Lin, W.; Chen, S.H.; Ni, Y.Q.; Xia, Y.; Liao, W.Y. Theoretical and experimental modal analysis of the Guangzhou New TV Tower. Eng. Struct. 2011, 33, 3628–3646. [Google Scholar] [CrossRef]
- Li, Q.S.; Fang, J.Q.; Jeary, A.P.; Wong, C.K.; Liu, D.K. Evaluation of wind effects on a supertall building based on full-scale measurements. Earthq. Eng. Struct. Dyn. 2000, 29, 1845–1862. [Google Scholar] [CrossRef]
- Lin, W.; Lin, Y.; Song, G.; Li, J. Multiple Pounding Tuned Mass Damper (MPTMD) control on benchmark tower subjected to earthquake excitations. Earthq. Struct. 2016, 11, 1123–1141. [Google Scholar]
- Zhang, H.Y.; Zhang, L.J. Tuned Mass Damper System of High-rise Intake Towers Optimized by Improved Harmony Search Algorithm. Eng. Struct. 2017, 138, 270–282. [Google Scholar] [CrossRef]
- Yaguchi, T.; Kurino, H.; Kano, N.; Nakai, T.; Fukuda, R. Development of large tuned mass damper with stroke control system for seismic upgrading of existing high-rise building. Int. J. High Rise Build. 2016, 5, 167–176. [Google Scholar] [CrossRef]
- Rana, R.; Soong, T.T. Parametric study and simplified design of tuned mass dampers. Eng. Struct. 1998, 20, 193–204. [Google Scholar] [CrossRef]
Figure 1.
Schematic model and prototype of the pounding tuned mass damper (PTMD).
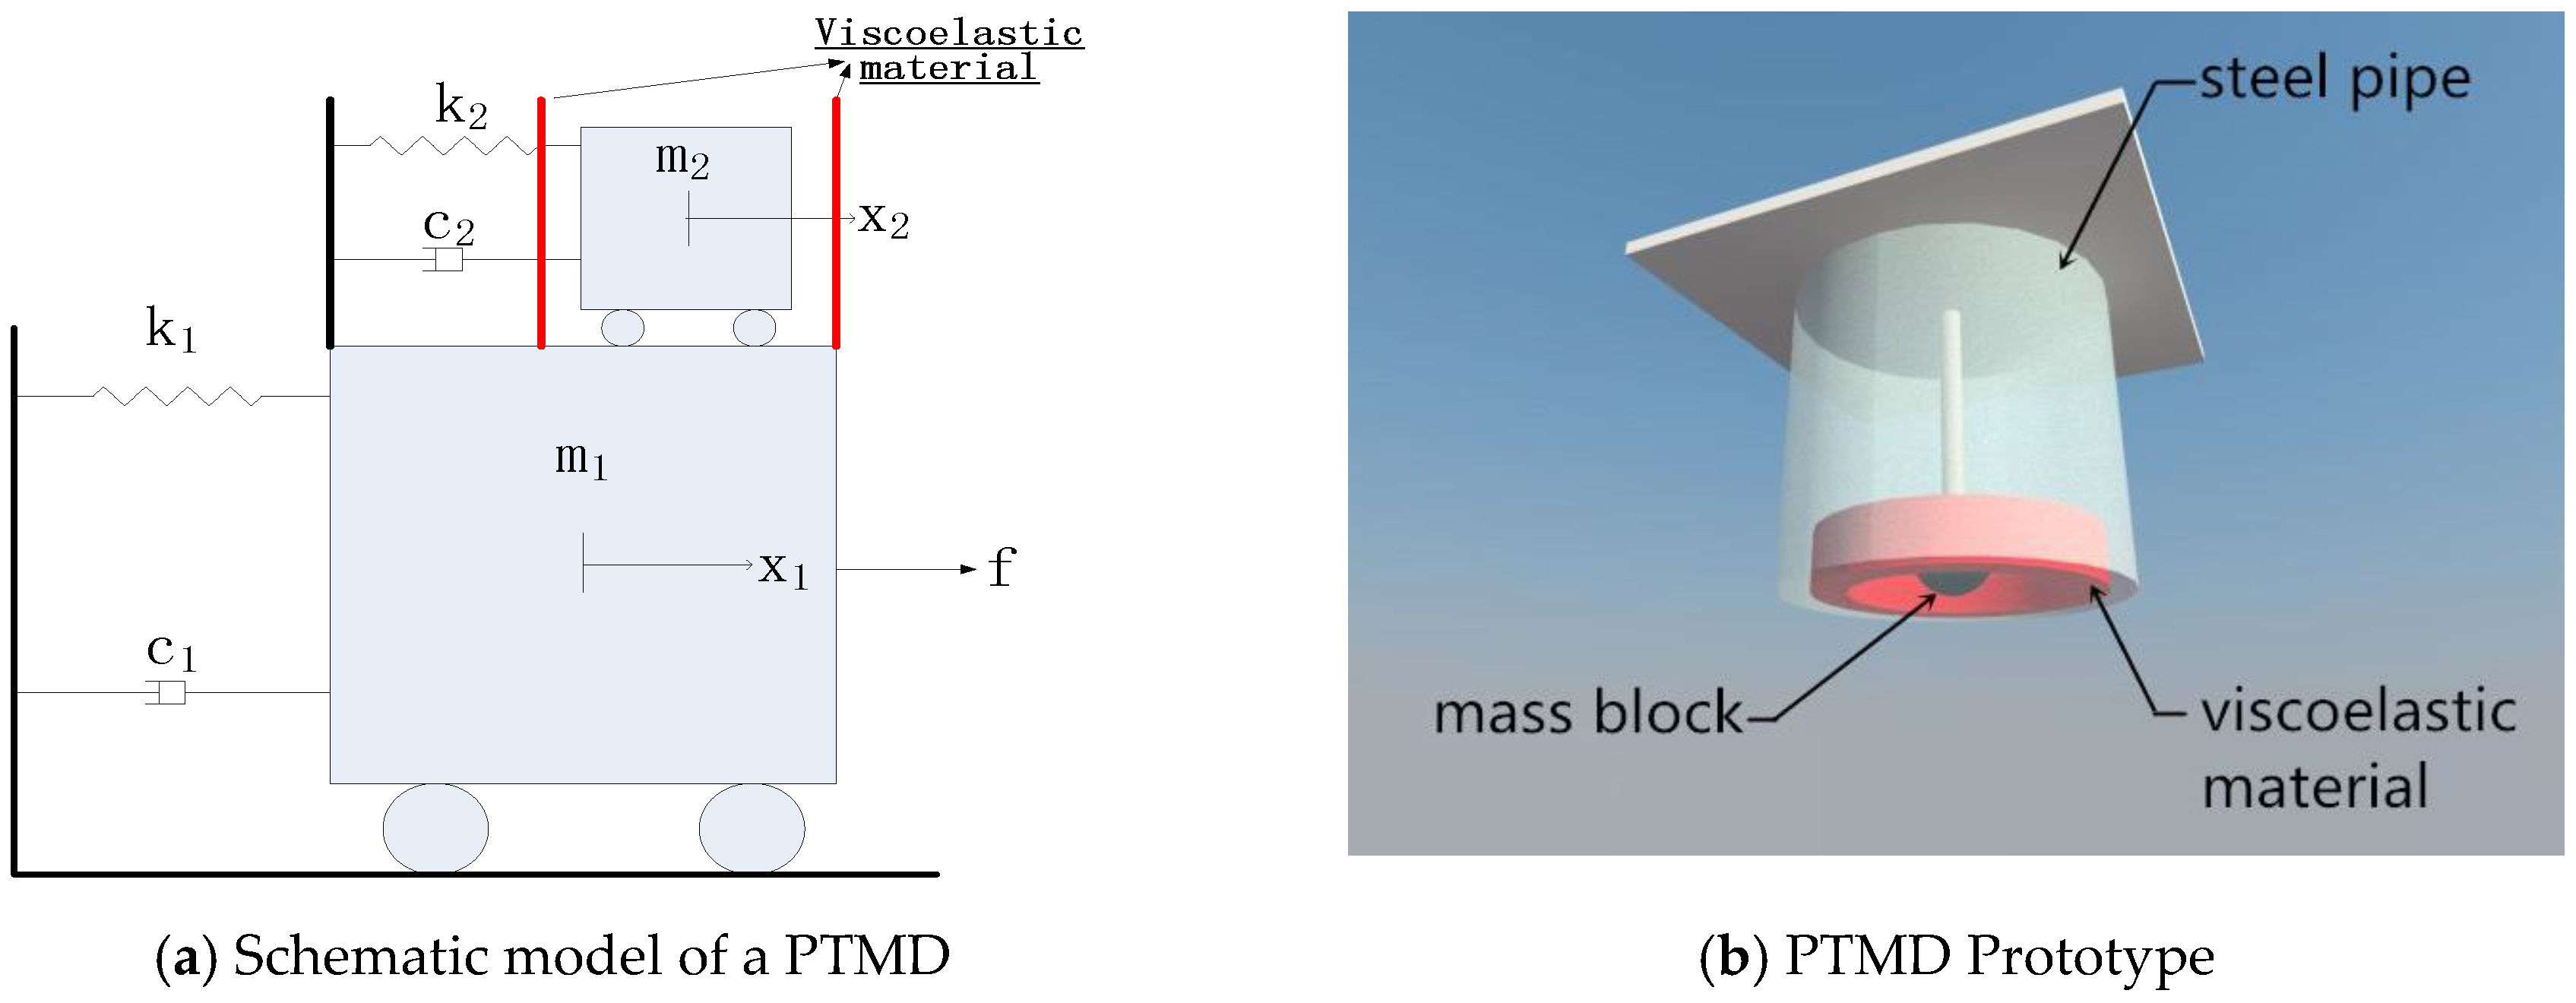
Figure 2.
Experimental setup for the validation experiment. Upon excitation of the motor, the horizontal rod holding the mass will impact repeatedly on the viscoelastic layer.
Figure 2.
Experimental setup for the validation experiment. Upon excitation of the motor, the horizontal rod holding the mass will impact repeatedly on the viscoelastic layer.

Figure 3.
Pounding force and displacement recorded during the experiment.

Figure 4.
Comparison of the improved and traditional pounding force models.


Figure 5.
Wind speed and wind rose diagrams obtained during typhoons.

Figure 6.
Benchmark model of Canton Tower.
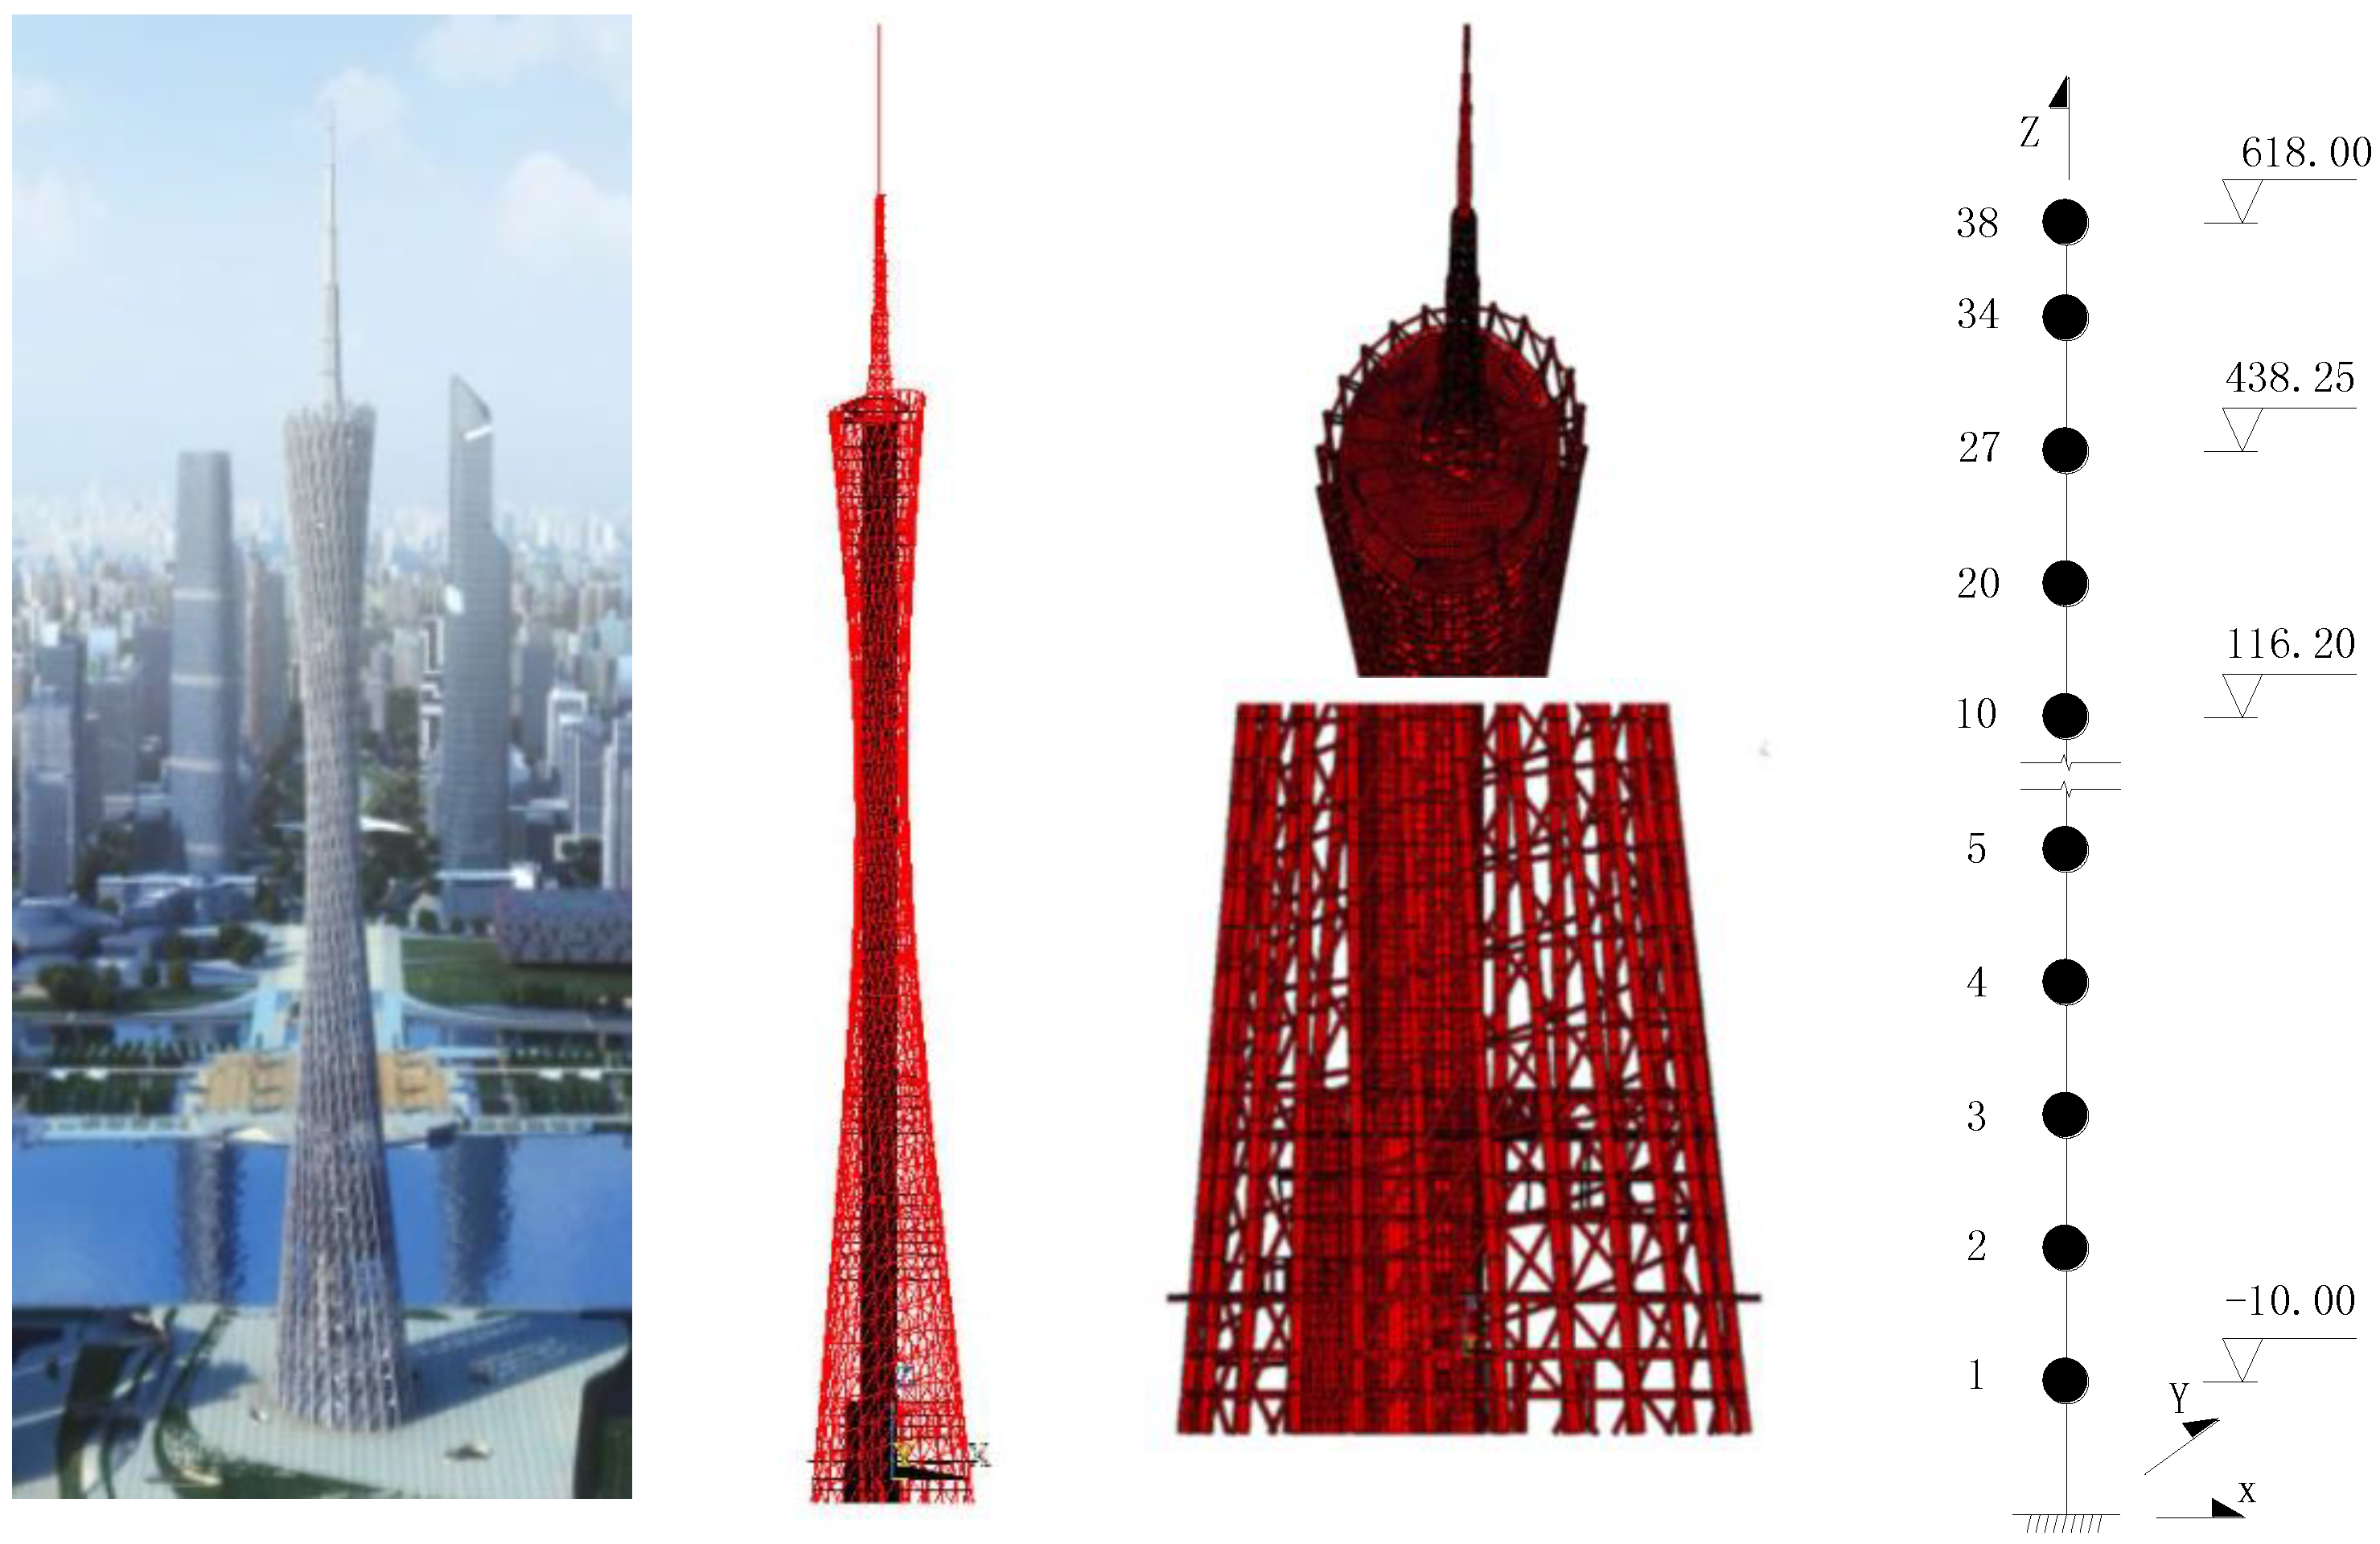
Figure 7.
Time history record of wind speed and direction on top of the main tower (Typhoon Nanmado, 2011).
Figure 7.
Time history record of wind speed and direction on top of the main tower (Typhoon Nanmado, 2011).

Figure 8.
Time-history responses under Typhoon Haima excitation (2011).


Figure 9.
Generated wind speed on top of Canton Tower.

Figure 10.
Control results under a stochastic wind load.


Figure 11.
Comparison of the seismic responses (Tianjin earthquake record, 0.3 g).
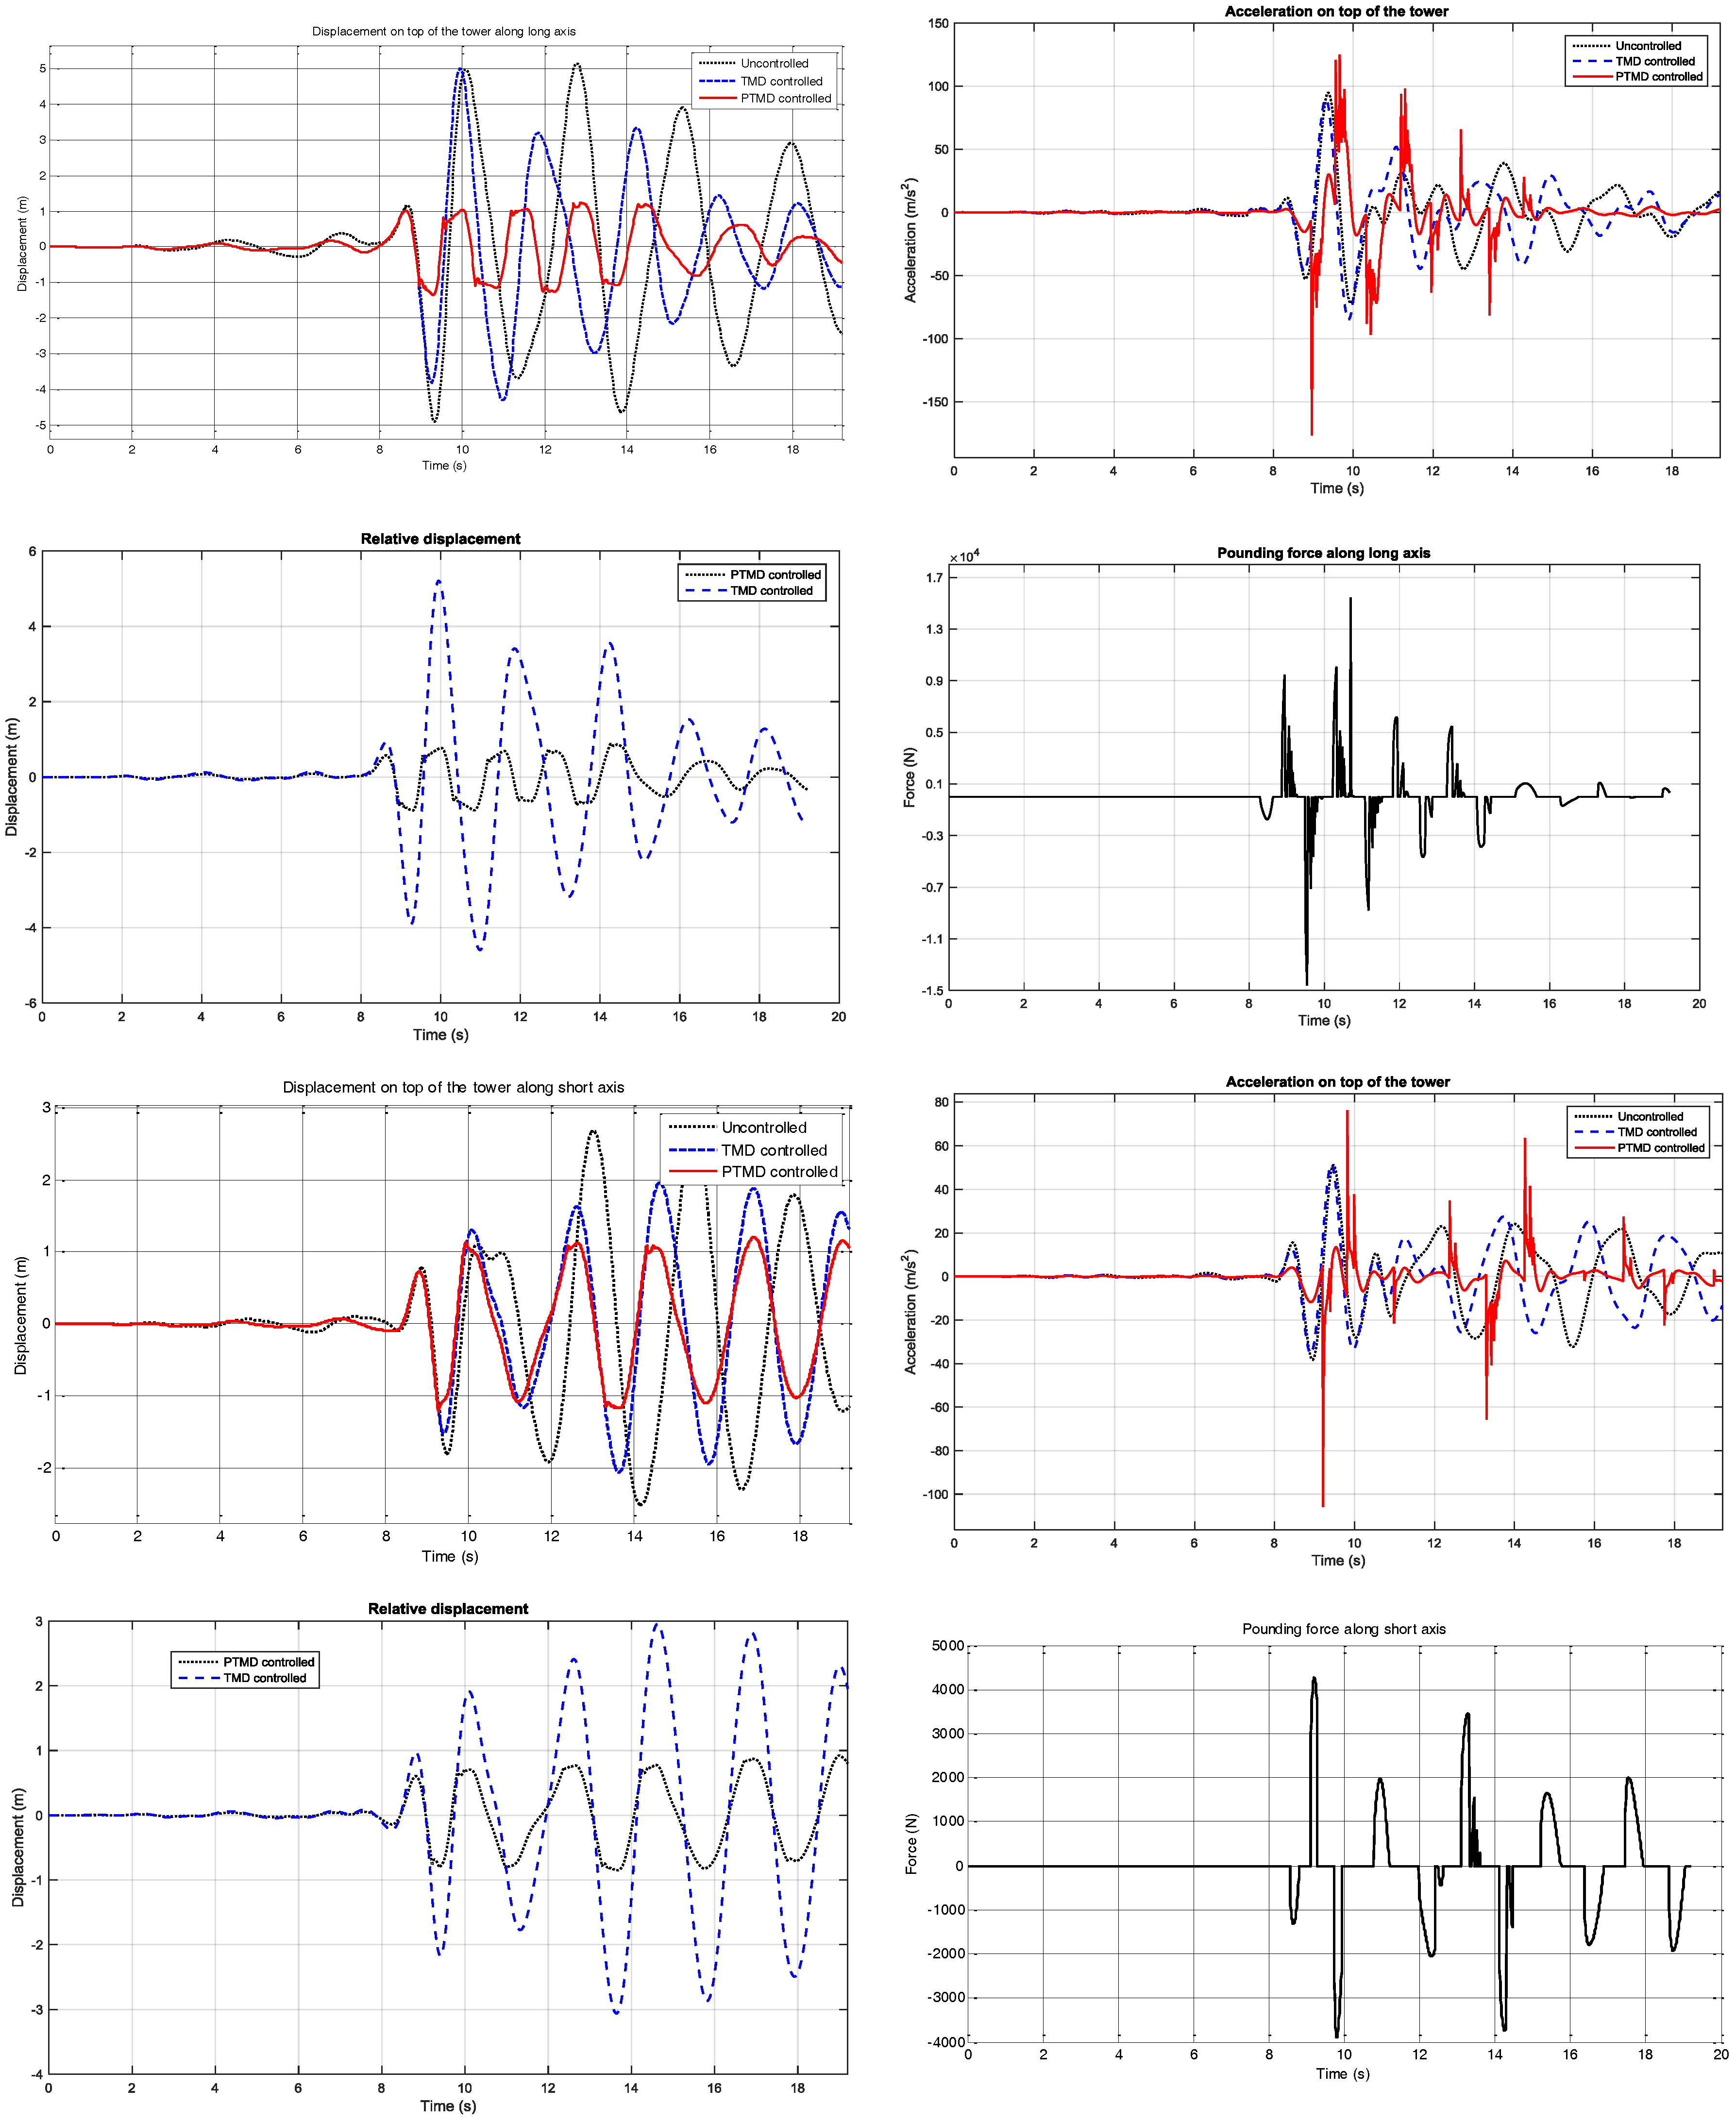
Figure 12.
Comparison of the seismic responses. (El Centro earthquake record, 0.3 g).
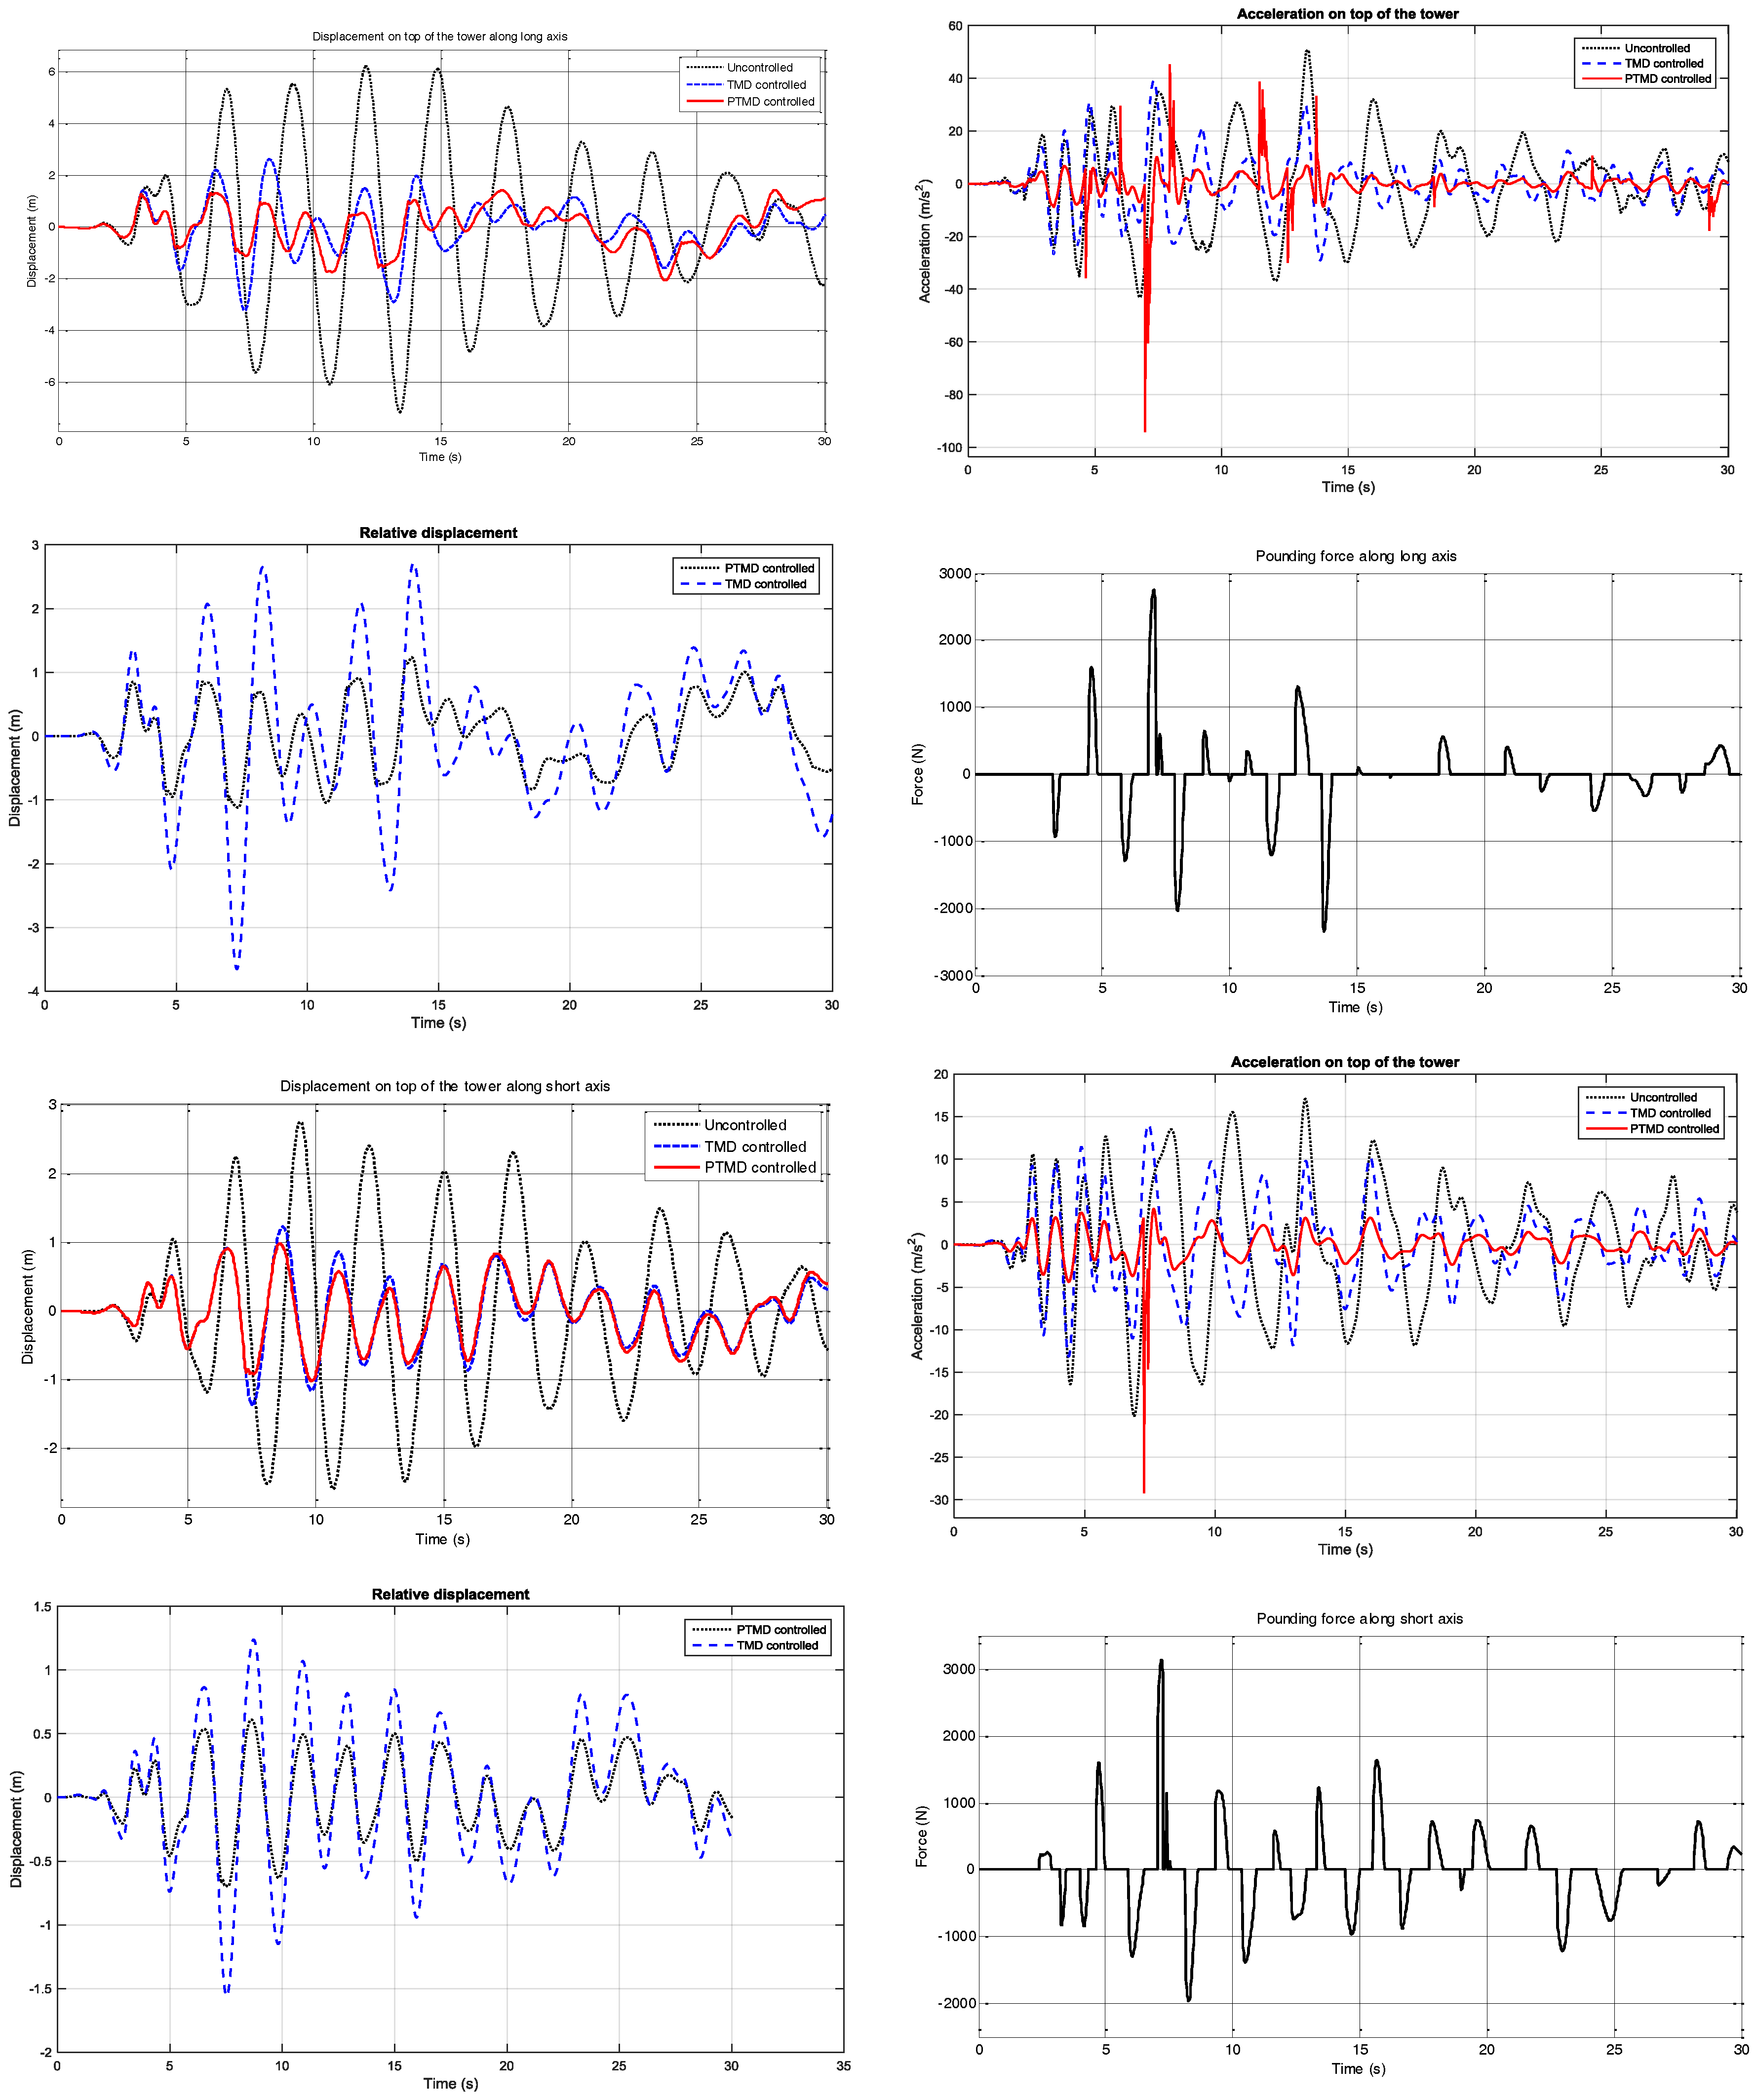
Figure 13.
Acceleration responses on the lower floor.

Figure 14.
Comparison of displacement responses and pounding force using different pounding force model.
Figure 14.
Comparison of displacement responses and pounding force using different pounding force model.
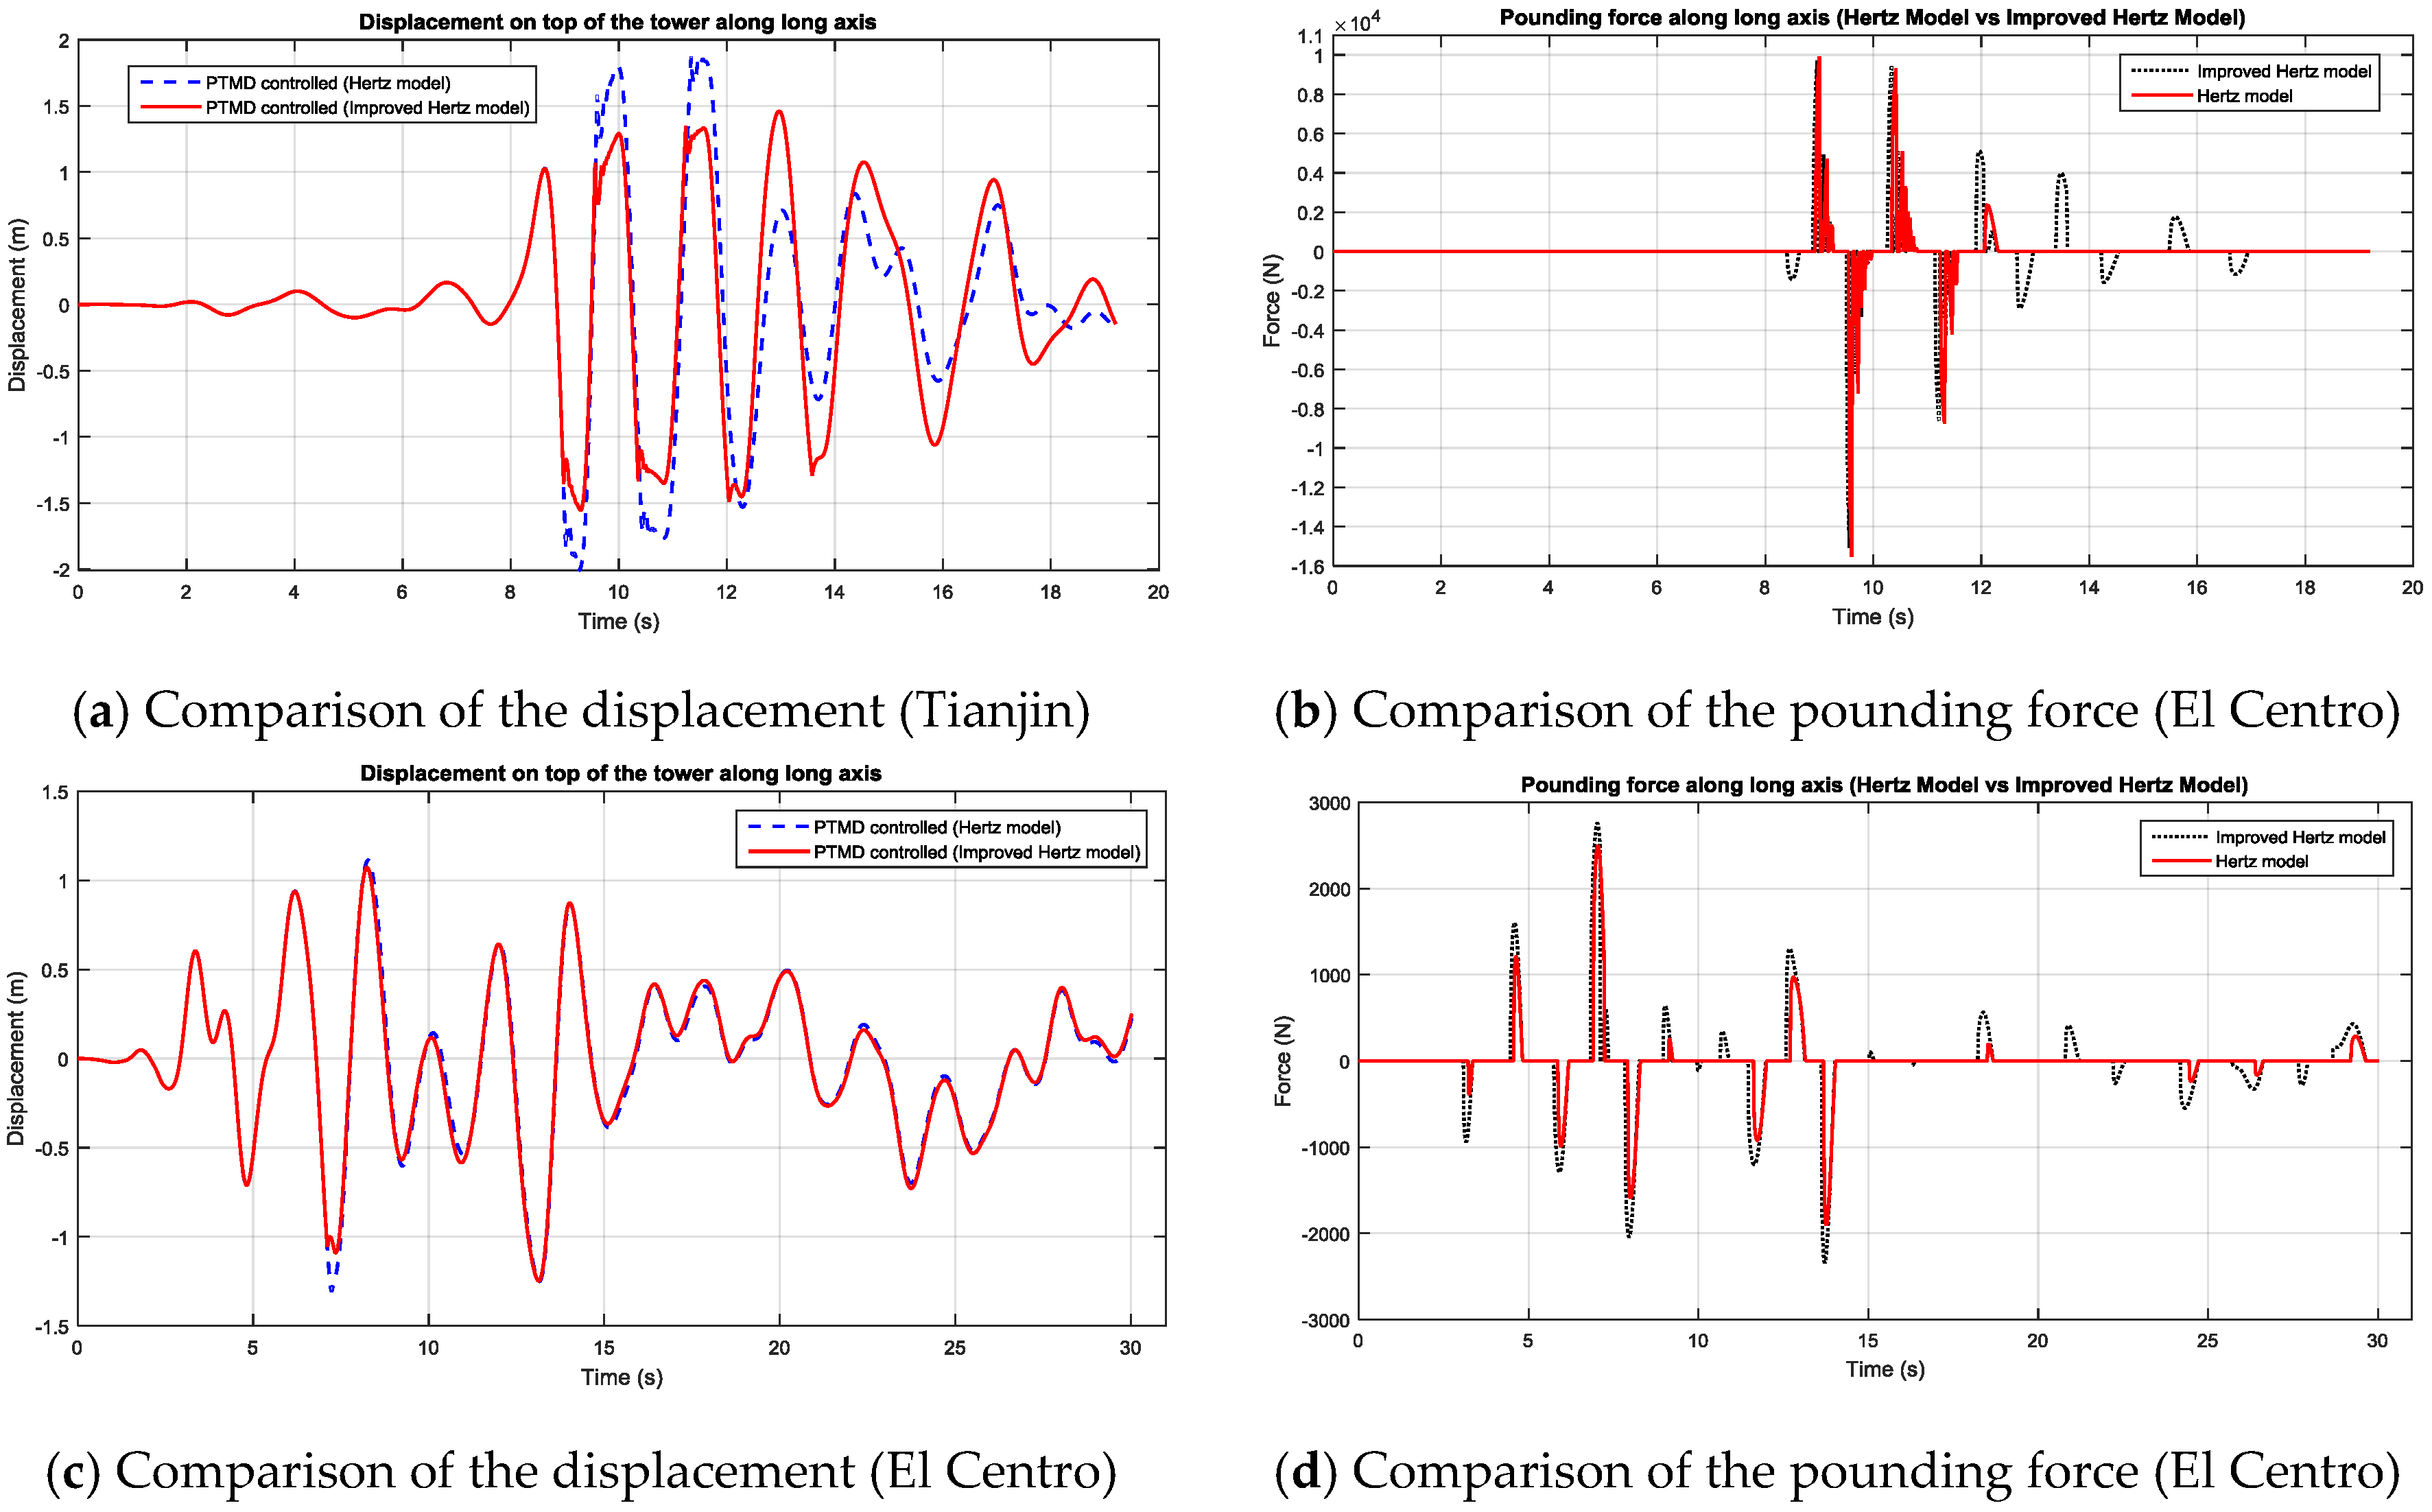
Figure 15.
Control effectiveness with different gap value (mass: 200 t).

Table 1.
Optimized parameters of the modified pounding model.
| Parameters | ||||
|---|---|---|---|---|
| value | 10,560 | 0.8 | 1.3 | 1.1 |
Table 2.
Natural frequencies of the reduced-order model.
| Mode | 1 | 2 | 3 | 4 | 5 |
|---|---|---|---|---|---|
| Frequency (Hz) | 0.110 | 0.159 | 0.347 | 0.368 | 0.399 |
| Mode | 6 | 7 | 8 | 9 | 10 |
| Frequency (Hz) | 0.460 | 0.485 | 0.738 | 0.902 | 0.997 |
Table 3.
Comparison of peak and RMS responses under Typhoon Haima excitation.
| Responses | Uncontrolled | TMD Controlled | PTMD Controlled | |
|---|---|---|---|---|
| Mast top (long axis) | Peak displacement (m) | 0.802 | 0.637 | 0.636 |
| RMS displacement (m) | 0.278 | 0.238 | 0.238 | |
| Peak acceleration (m/s2) | 3.138 | 2.375 | 2.346 | |
| RMS acceleration (m/s2) | 0.987 | 0.788 | 0.781 | |
| Tower top (long axis) | Peak displacement (m) | 0.126 | 0.092 | 0.092 |
| RMS displacement (m) | 0.044 | 0.034 | 0.034 | |
| Peak acceleration (m/s2) | 0.065 | 0.053 | 0.053 | |
| RMS acceleration (m/s2) | 0.023 | 0.018 | 0.018 | |
| Mast top (short axis) | Peak displacement (m) | 0.502 | 0.397 | 0.396 |
| RMS displacement (m) | 0.190 | 0.150 | 0.150 | |
| Peak acceleration (m/s2) | 2.288 | 1.558 | 1.543 | |
| RMS acceleration (m/s2) | 0.758 | 0.526 | 0.522 | |
| Tower top (short axis) | Peak displacement (m) | 0.036 | 0.032 | 0.032 |
| RMS displacement (m) | 0.014 | 0.012 | 0.012 | |
| Peak acceleration (m/s2) | 0.019 | 0.022 | 0.022 | |
| RMS acceleration (m/s2) | 0.008 | 0.008 | 0.008 | |
Table 4.
Comparison of peak and RMS responses under Typhoon Nanmado excitation.
| Responses | Uncontrolled | TMD Controlled | PTMD Controlled | |
|---|---|---|---|---|
| Mast top (long axis) | Peak displacement (m) | 1.128 | 0.742 | 0.736 |
| RMS displacement (m) | 0.376 | 0.251 | 0.251 | |
| Peak acceleration (m/s2) | 5.445 | 3.913 | 3.857 | |
| RMS acceleration (m/s2) | 1.713 | 1.155 | 1.145 | |
| Tower top (long axis) | Peak displacement (m) | 0.081 | 0.064 | 0.064 |
| RMS displacement (m) | 0.028 | 0.022 | 0.022 | |
| Peak acceleration (m/s2) | 0.070 | 0.065 | 0.065 | |
| RMS acceleration (m/s2) | 0.023 | 0.018 | 0.018 | |
| Mast top (short axis) | Peak displacement (m) | 0.726 | 0.491 | 0.487 |
| RMS displacement (m) | 0.271 | 0.164 | 0.164 | |
| Peak acceleration (m/s2) | 3.558 | 2.662 | 2.623 | |
| RMS acceleration (m/s2) | 1.289 | 0.773 | 0.766 | |
| Tower top (short axis) | Peak displacement (m) | 0.039 | 0.033 | 0.033 |
| RMS displacement (m) | 0.012 | 0.010 | 0.010 | |
| Peak acceleration (m/s2) | 0.031 | 0.037 | 0.037 | |
| RMS acceleration (m/s2) | 0.011 | 0.012 | 0.012 | |
Table 5.
Comparison of peak and RMS responses under stochastic wind excitation.
| Responses | Uncontrolled | TMD Controlled | PTMD Controlled | |
|---|---|---|---|---|
| Mast top (long axis) | Peak displacement (m) | 0.662 | 0.280 | 0.276 |
| RMS displacement (m) | 0.203 | 0.102 | 0.101 | |
| Peak acceleration (m/s2) | 3.976 | 3.170 | 3.139 | |
| RMS acceleration (m/s2) | 1.068 | 0.935 | 0.929 | |
| Tower top (long axis) | Peak displacement (m) | 0.042 | 0.026 | 0.026 |
| RMS displacement (m) | 0.014 | 0.009 | 0.009 | |
| Peak acceleration (m/s2) | 0.043 | 0.037 | 0.037 | |
| RMS acceleration (m/s2) | 0.013 | 0.011 | 0.011 | |
| Mast top (short axis) | Peak displacement (m) | 0.691 | 0.305 | 0.301 |
| RMS displacement (m) | 0.213 | 0.105 | 0.104 | |
| Peak acceleration (m/s2) | 4.253 | 3.359 | 3.323 | |
| RMS acceleration (m/s2) | 1.130 | 0.955 | 0.949 | |
| Tower top (short axis) | Peak displacement (m) | 0.031 | 0.020 | 0.020 |
| RMS displacement (m) | 0.011 | 0.008 | 0.008 | |
| Peak acceleration (m/s2) | 0.029 | 0.027 | 0.027 | |
| RMS acceleration (m/s2) | 0.009 | 0.008 | 0.008 | |
Table 6.
Comparison of control efficiency with the variation of gap value (mass: 200 t).
| Excitation | Uncontrolled | TMD | PTMD Gap (m) | ||||||||||
|---|---|---|---|---|---|---|---|---|---|---|---|---|---|
| 0.005 | 0.01 | 0.05 | 0.1 | 0.25 | 0.5 | 1 | 2 | 3 | |||||
| TJ | 0.1 g | Peak | 2.203 | 2.209 | 1.655 | 1.341 | 1.029 | 1.087 | 1.233 | 1.436 | 1.895 | 2.208 | 2.209 |
| RMS | 0.883 | 0.768 | 0.434 | 0.377 | 0.336 | 0.360 | 0.423 | 0.540 | 0.680 | 0.768 | 0.768 | ||
| 0.2 g | Peak | 3.672 | 3.682 | 1.543 | 1.442 | 1.210 | 1.181 | 1.313 | 1.545 | 2.005 | 2.920 | 3.677 | |
| RMS | 1.472 | 1.281 | 0.531 | 0.487 | 0.464 | 0.470 | 0.475 | 0.501 | 0.673 | 1.055 | 1.279 | ||
| 0.3 g | Peak | 5.141 | 5.155 | 2.098 | 1.878 | 1.564 | 1.304 | 1.422 | 1.614 | 2.062 | 2.932 | 3.868 | |
| RMS | 2.060 | 1.792 | 0.534 | 0.506 | 0.493 | 0.507 | 0.566 | 0.655 | 0.681 | 1.030 | 1.436 | ||
| EC | 0.1 g | Peak | 3.068 | 1.787 | 1.128 | 1.042 | 1.136 | 1.217 | 1.317 | 1.337 | 1.781 | 1.787 | 1.787 |
| RMS | 1.252 | 0.499 | 0.420 | 0.422 | 0.437 | 0.457 | 0.483 | 0.494 | 0.498 | 0.499 | 0.499 | ||
| 0.2 g | Peak | 5.114 | 2.979 | 1.334 | 1.329 | 1.303 | 1.301 | 1.363 | 1.464 | 2.140 | 2.662 | 2.977 | |
| RMS | 2.087 | 0.831 | 0.555 | 0.555 | 0.550 | 0.558 | 0.592 | 0.657 | 0.785 | 0.828 | 0.831 | ||
| 0.3 g | Peak | 7.160 | 4.170 | 1.670 | 1.773 | 1.794 | 1.718 | 1.792 | 1.820 | 2.013 | 3.064 | 3.507 | |
| RMS | 2.922 | 1.164 | 0.697 | 0.698 | 0.743 | 0.721 | 0.752 | 0.773 | 0.894 | 1.130 | 1.155 | ||
Table 7.
Comparison of control efficiency with the variation of the mass (gap: 0.05 m).
| Excitation | Terms | Uncontrolled | TMD | PTMD | |||||
|---|---|---|---|---|---|---|---|---|---|
| 200 t | 300 t | 500 t | 200 t | 300 t | 500 t | ||||
| Tianjin | 0.1 g | Peak (m) | 2.203 | 2.209 | 2.150 | 1.924 | 1.029 | 1.024 | 1.047 |
| RMS (m) | 0.883 | 0.768 | 0.660 | 0.508 | 0.336 | 0.329 | 0.335 | ||
| 0.2 g | Peak (m) | 3.672 | 3.682 | 3.584 | 3.207 | 1.210 | 1.098 | 1.103 | |
| RMS (m) | 1.472 | 1.281 | 1.100 | 0.847 | 0.464 | 0.466 | 0.469 | ||
| 0.3 g | Peak (m) | 5.141 | 5.155 | 5.016 | 4.490 | 1.564 | 1.161 | 1.094 | |
| RMS (m) | 2.060 | 1.792 | 1.540 | 1.185 | 0.493 | 0.507 | 0.517 | ||
| El Centro | 0.1 g | Peak (m) | 3.068 | 1.787 | 1.383 | 0.924 | 1.136 | 1.246 | 0.908 |
| RMS (m) | 1.252 | 0.499 | 0.422 | 0.330 | 0.437 | 0.410 | 0.329 | ||
| 0.2 g | Peak (m) | 5.114 | 2.979 | 2.305 | 1.541 | 1.303 | 1.379 | 1.402 | |
| RMS (m) | 2.087 | 0.831 | 0.703 | 0.551 | 0.550 | 0.561 | 0.515 | ||
| 0.3 g | Peak (m) | 7.160 | 4.170 | 3.227 | 2.157 | 1.794 | 2.025 | 1.618 | |
| RMS (m) | 2.922 | 1.164 | 0.984 | 0.771 | 0.743 | 0.760 | 0.642 | ||
© 2017 by the authors. Licensee MDPI, Basel, Switzerland. This article is an open access article distributed under the terms and conditions of the Creative Commons Attribution (CC BY) license (http://creativecommons.org/licenses/by/4.0/).
Share and Cite
MDPI and ACS Style
Lin, W.; Song, G.; Chen, S. PTMD Control on a Benchmark TV Tower under Earthquake and Wind Load Excitations. Appl. Sci. 2017, 7, 425. https://doi.org/10.3390/app7040425
AMA Style
Lin W, Song G, Chen S. PTMD Control on a Benchmark TV Tower under Earthquake and Wind Load Excitations. Applied Sciences. 2017; 7(4):425. https://doi.org/10.3390/app7040425
Chicago/Turabian StyleLin, Wei, Gangbing Song, and Shanghong Chen. 2017. "PTMD Control on a Benchmark TV Tower under Earthquake and Wind Load Excitations" Applied Sciences 7, no. 4: 425. https://doi.org/10.3390/app7040425
Note that from the first issue of 2016, this journal uses article numbers instead of page numbers. See further details here.