
Parametric Sensitivity Analysis on the Buffeting Control of a Long-Span Triple-Tower Suspension Bridge with MTMD


1
Key Laboratory of C&PC Structures of Ministry of Education, Southeast University, Nanjing 210096, China
2
School of Civil Engineering, Southeast University, Nanjing 210096, China
3
School of Civil Engineering, Central South University, Changsha 410075, China
*
Author to whom correspondence should be addressed.
Appl. Sci. 2017, 7(4), 395; https://doi.org/10.3390/app7040395
Submission received: 7 February 2017
/
Revised: 26 March 2017
/
Accepted: 12 April 2017
/
Published: 14 April 2017
(This article belongs to the Section Energy Science and Technology)
Abstract
:The long-span triple-tower suspension bridge is a brand-new type of structural form with typical wind-sensitive features. Inevitable wind-induced vibrations will heavily influence the driving comfort during strong winds and shorten the fatigue life of the bridge structure, which highlights the demand for the mitigation of wind-induced vibrations of long-span bridges. In this study, a parametric analysis is performed to investigate the control effect of multiple tuned mass dampers (MTMD) on the buffeting responses of a long-span triple-tower suspension bridge. Taking Taizhou Bridge as an example, the buffeting analysis is conducted via the finite-element-based approach. A step-updating framework is presented to guide the parametric analysis and determine the preferred values of the mechanical parameters of the MTMD. Specifically, four parameters—including the number of TMDs, the mass ratio, the damping ratio, and the frequency bandwidth ratio—are included in the parametric analysis. The robustness of the MTMD is also evaluated by changing another parameter called the frequency ratio. It is found that the performance of the MTMD is sensitive to the variation of the four parameters and the robustness can be adjusted by increasing the frequency bandwidth ratio. Utilizing the MTMD with reasonable mechanical parameters, the buffeting responses of the long-span triple-tower suspension bridge under strong winds can be effectively mitigated.
1. Introduction
In recent decades, wind disasters have become more and more violent across the world. Damages to property with attendant economic losses and casualties are frequently reported by the public media [1,2]. Among the disasters, extreme wind events—e.g., typhoons/hurricanes, downbursts, tornadoes, etc.—have become the most severe cases that will cause destructive damages or significant performance deteriorations to engineering structures [2,3]. With the worsening of global climatic environment, many places have been known as typical wind-prone areas. For example, every year the coastal area of East China will be attacked many times by the severe typhoons from the Pacific Ocean.
However, in the wind-prone areas above, there are a great number of long-span bridges constructed or still under construction over rivers or even seas, which is catering to the developments of local transportation and economics [4]. With the rapid increase of the bridge span, the bridge will be a typical slender structure which is sensitive to the wind effects [5]. There are four main types of wind-induced vibrations occurring on bridges known as flutter, buffeting, galloping, and vortex-induced vibration. Among them, buffeting is a typical forced vibration induced by the turbulence existing inherently in natural wind. Different from the other three vibrations, buffeting is daily experienced by long-span bridges and becomes more prominent with the increase of the bridge span. Although the buffeting will not cause direct catastrophic failure to structures, it will result in instability of the vehicles travelling on the deck as well as discomfort of pedestrians, it will also severely shorten the fatigue life of structural components [6,7,8,9,10].
Many studies have been conducted on the buffeting performance of cable-supported bridges. For example, Xu and Zhu investigated the buffeting responses of Tsing Ma Bridge under skew winds during Typhoon Sam [11]. Wang et al. conducted a comparative study on the buffeting performance of Sutong Cable-Stayed Bridge based on design and measured spectrum [10]. In recent years, a typical bridge with a brand new type of structural form, which is called the triple-tower suspension bridge, has been put into engineering practices for long-span bridges, e.g., Taizhou Yangtze River Bridge and Ma’anshan Yangtze River Bridge in China. The triple-tower suspension bridge has not only two towers at the ends of two main spans, but also a dominant mid-tower between two main spans to alleviate the strain of main cables. Compared to the double-tower suspension bridge, structural characteristics of a triple-tower suspension bridge are strikingly different because of the existence of the middle tower and an additional main span [12,13]. Most existing research focuses on the static analysis of long-span triple-tower suspension bridges [14,15,16]. Several studies also made efforts to the flutter stability [17,18,19]. However, few researches are concerned about the buffeting problem of the long-span triple-tower suspension bridge.
With the increase of the bridge span, buffeting may perform an important role in the structural design of long-span triple-tower suspension bridges, especially for the ones located in the typhoon/hurricane-prone areas. In order to improve the travelling comfort and keep sufficient structural fatigue life, effective measures need to be adopted to mitigate the buffeting responses of long-span triple-tower suspension bridges during strong winds. There are a lot of dampers available in the vibration control of engineering structures—e.g., viscous damper, magnetorheological damper, tuned mass damper (TMD) [20,21,22,23,24]. Buffeting responses of long-span bridges are prominent in the main girder, which is a linear and flexible structure. Obviously, the viscous damper and magnetorheological damper are not easy to be applied in the vibration control since they are usually installed between two adjacent joints to alleviate the comparative motions. However, the TMD is proved to be an effective device for the vibration control of long-span structures as the tacit mechanism is inertia.
TMD is a classical device with a mass, a spring and a damper attached to attenuate undesirable vibrations of engineering structures [25]. However, it is known that the performance of the TMD is sensitive to the frequency variation of the main structure [4,26,27]. A solving scheme is realized by the MTMD, which is equipped with a series of TMDs with distributed frequencies. Hence, there is a frequency band formed in the MTMD to cope with any target frequency lying in this band, which means the robustness of the TMD has been significantly improved. A lot of pioneering work has been done on the performance of the MTMD [26,28,29]. Also, a few studies have been conducted on the buffeting control of the double-tower cable-stayed bridge with MTMD. For example, Gu et al. conducted a parametric study on the MTMD for buffeting control of Yangpu Bridge, which is a cable-stayed bridge with a main span of 602 m [27]; Wang et al. presented a simulation study on the optimal control of a long-span cable-stayed bridge with MTMD via the first-order optimization method [4]; However, few studies are reported on the buffeting control of the novel long-span triple-tower suspension bridge.
In this study, a parametric sensitivity analysis is conducted on the buffeting control of a long-span triple-tower suspension bridge. The Taizhou Yangtze River Bridge, “Taizhou Bridge” for short, is taken as the research object. The buffeting performance of the long-span triple-tower suspension bridge is firstly analyzed with the unconditionally simulated wind field. Then, a step-updating framework is presented to guide the parametric analysis and determine the preferred values of the mechanical parameters of the MTMD. Four parameters, which are the number of TMDs, the mass ratio, the damping ratio and the frequency bandwidth ratio, are specifically included in the parametric analysis. Meanwhile, the robustness of the MTMD is also evaluated by changing another parameter of MTMD which is called the frequency ratio. The analytical results are expected to provide references for the buffeting control and wind-resistant design of long-span triple-tower suspension bridges.
2. Structural Description and Finite Element Model
2.1. Description of the Taizhou Bridge
The Taizhou Yangtze River Bridge, ‘Taizhou Bridge’ for short, is located in the lower reach of the Yangtze River in China, and first establishes the connection of land transportation between Taizhou and Zhenjiang, as shown in Figure 1. The bridge has been a landmark project across the Yangtze River and the longest triple-tower suspension bridge in the world since it was open to traffic in 2012. With respect to the geographical location, Taizhou Bridge is located in the eastern part of the Asian continent, which belongs to a wind-prone area that is vulnerable to the typhoons from the west Pacific Ocean in the summer and the strong northern wind from Siberia in the winter.
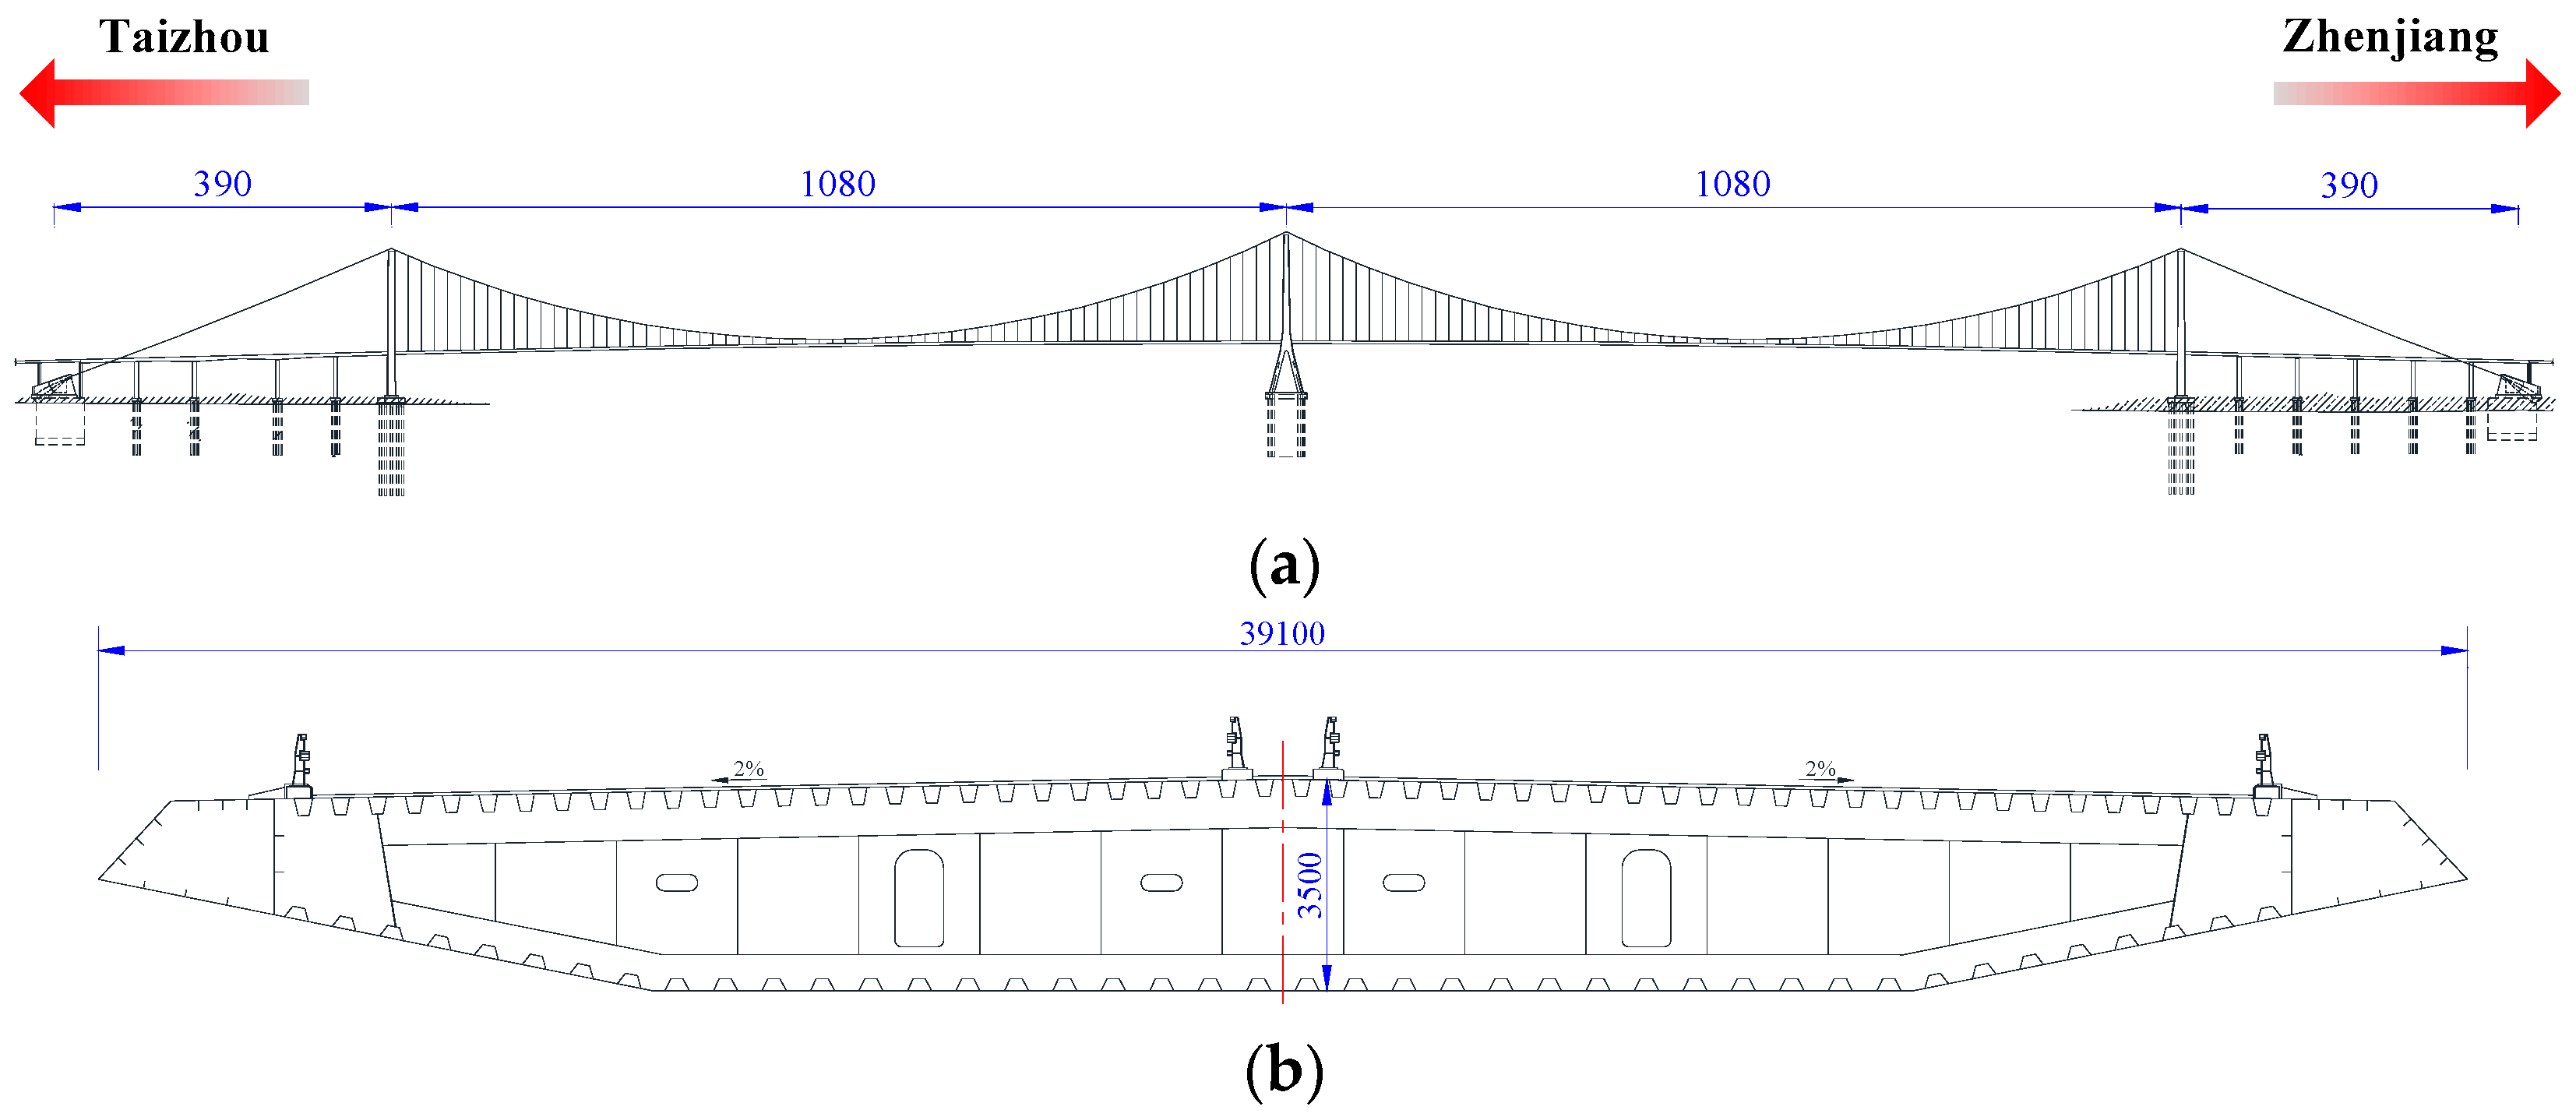
As shown in Figure 2a, Taizhou Bridge is equipped with two main spans. Each main span is 1080 m long. The two main spans are continuously connected at the mid-tower while they are separated from side spans with two expansion joints installed at the side towers, respectively. The streamline flat-steel-box girder is employed as the bridge deck, as shown in Figure 2b. The total width of the bridge deck is 39.1 m with the wind mouth included. Two steel-wired cables are installed in parallel to support the static and dynamic loads on the main girder, and the sag-to-span ratio of the main cable is 1/9. The two side towers are reinforced concrete structures with a height of 178 m, and the middle tower is a steel tower with a height of 192 m. To constrain the lateral and vertical displacements of the main girder, lateral and vertical bearings are installed on lower cross beams of side towers, while only lateral bearings are installed on the mid-tower. Elastic restraints made of steel-stranded wires are installed in the longitudinal direction to control the relative displacement between the main girder and mid-tower. Since Taizhou Bridge is such a long-span bridge with a novel structural type, the buffeting performance attracts extensive attention.
2.2. Finite Element Model
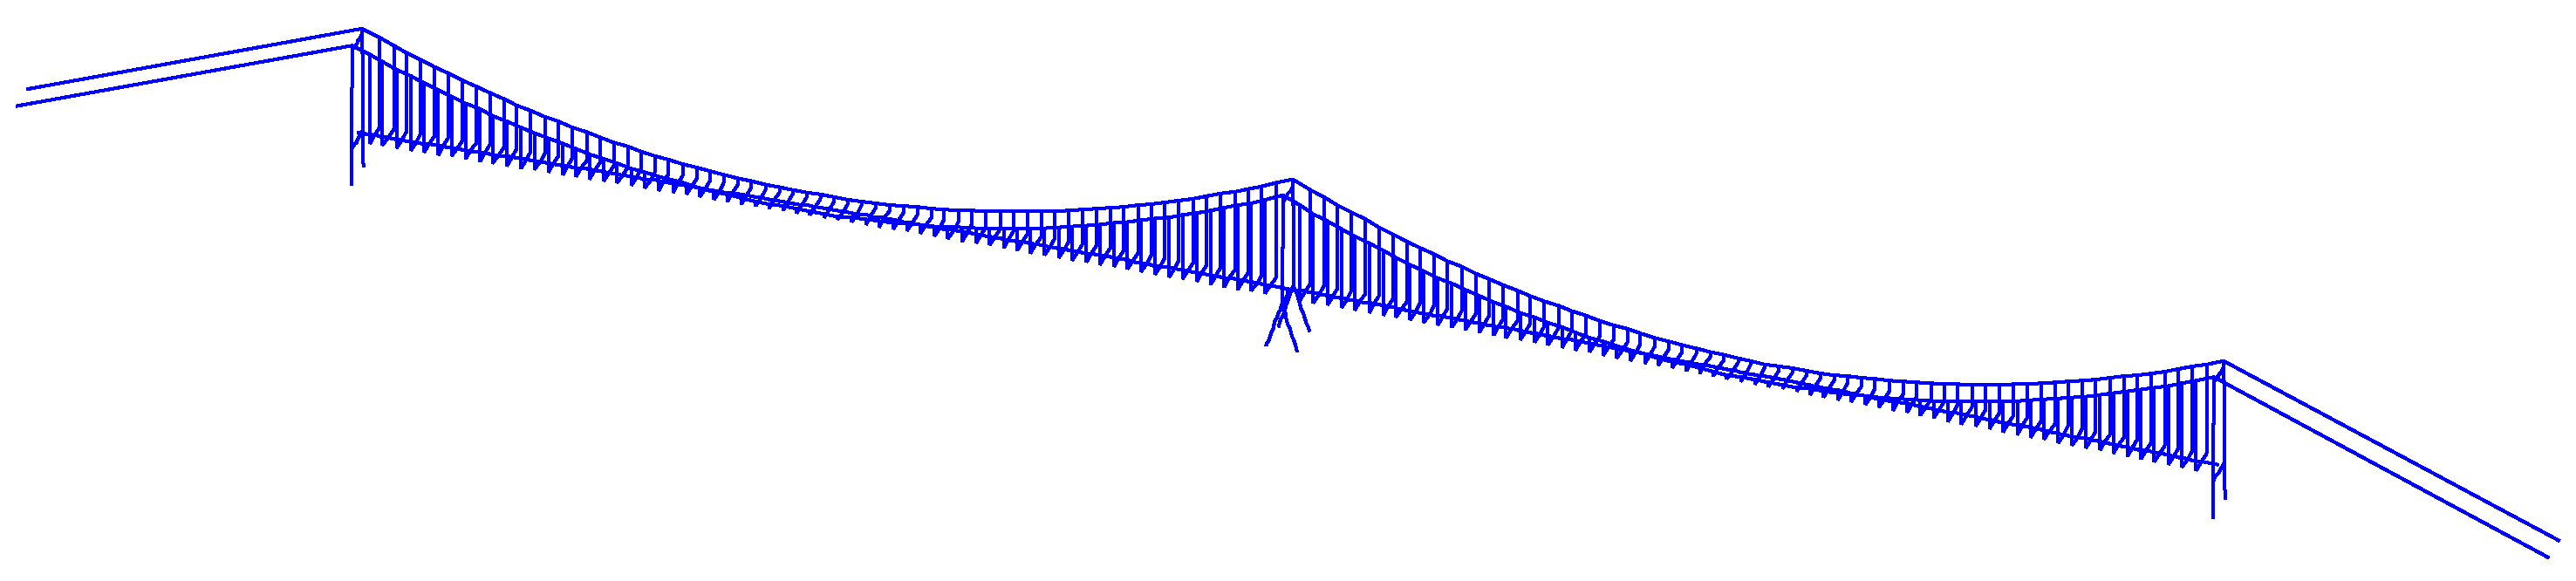
According to the ultimate design scheme of Taizhou Bridge, the finite element (FE) model is established based on ANSYS (ANSYS, Inc., Canonsburg, PA, USA), as shown in Figure 3. In the FE model, the BEAM4 element is utilized to simulate the main girder and the towers, and the LINK10 element is selected for the simulation of the main cable and suspenders. The main girder and suspenders are connected via the zero-mass rigid beams. To model the real restrictions between the main girder and the towers, the lateral, vertical, and torsional degree of freedoms (DOF) of the main girder are coupled with the lower beams of the side towers, while only the lateral DOF of the main girder is coupled with the mid tower. The COMBIN14 element with only stiffness coefficient is applied to model the elastic cable between the main girder and the mid-tower in a longitudinal direction.
2.3. Modal Analysis of Taizhou Bridge
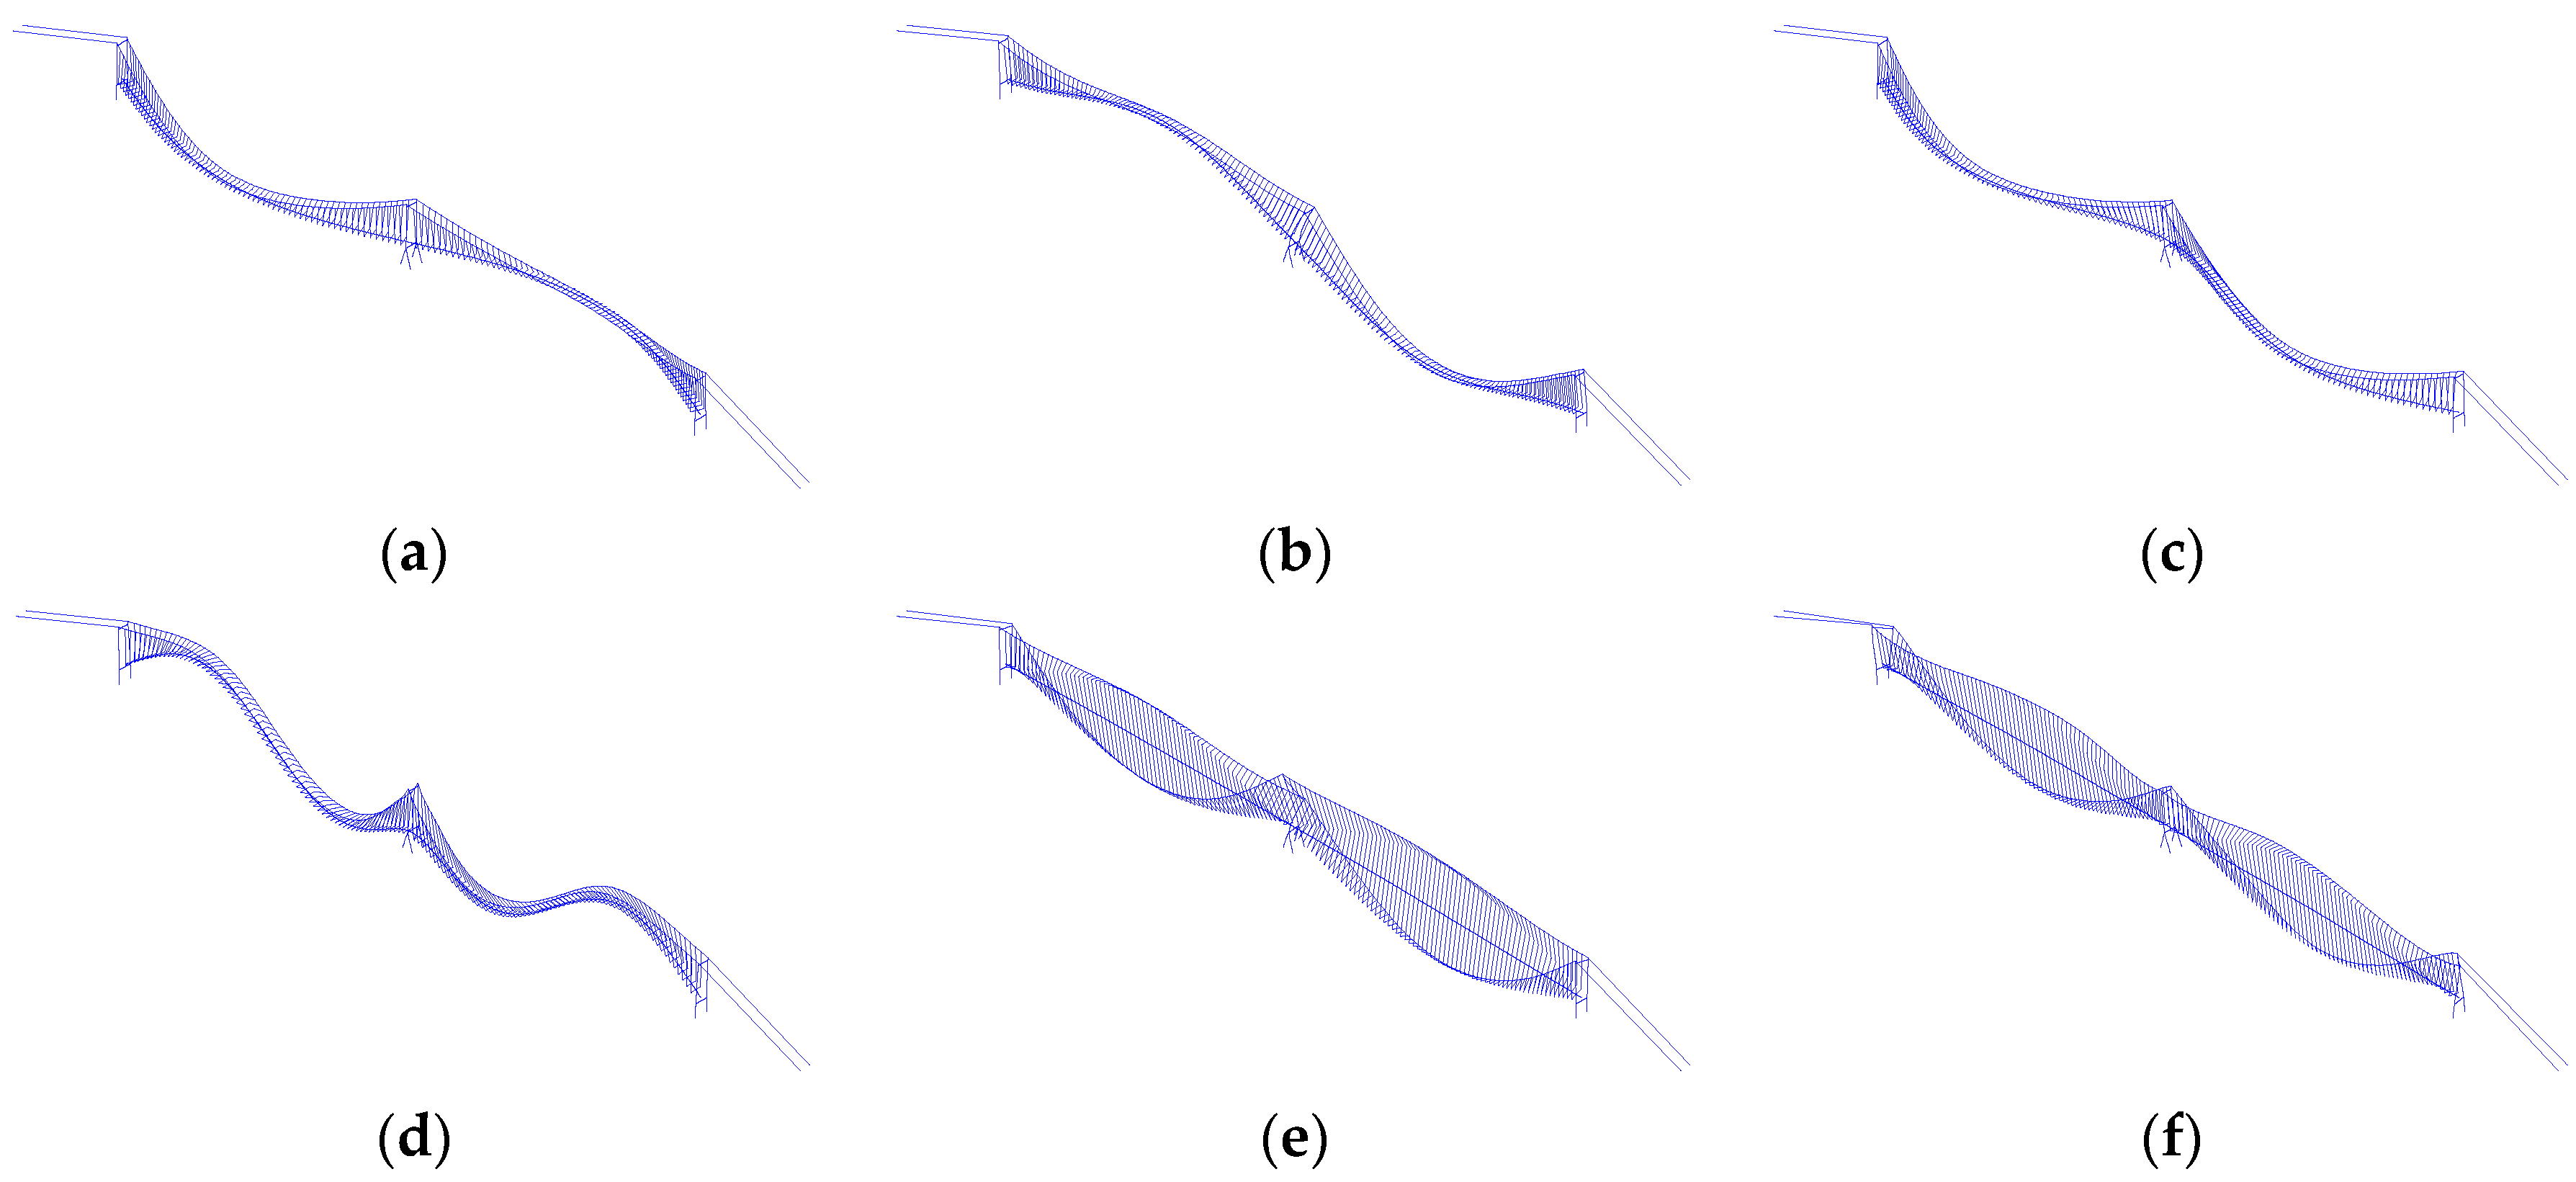
Modal analysis of Taizhou Bridge is conducted with the subspace iteration method based on ANSYS (ANSYS, Inc., Canonsburg, PA, USA), and 200 modes of the structure are extracted. Among them, the 13 typical modes with natural frequencies and the corresponding mode shapes are presented in Table 1, and six typical mode shapes of Taizhou Bridge are shown in Figure 4.
3. Wind Loads on Structures
To compute the buffeting responses of Taizhou Bridge in time domain, an important step is to integrate the wind loads on structures. In this study, the Alan G. Davenport Wind Loading Chain [30,31] is utilized for analysis, in which the aerostatic forces, buffeting forces, and the self-excited forces are included.
Under the framework of finite element approach, the governing equation for the buffeting analysis of Taizhou Bridge under turbulent winds can be expressed as
where M, C, and K are structural mass, damping and stiffness matrices, respectively; , , and are acceleration, velocity, and displacement vectors; FG = structural gravity vector; Fst is the static wind force vector; Fb is the buffeting force vector; Fse is the self-excited force vector. For such a long-span cable-supported bridge, the actions of gravity and aero-static forces will heavily influence the initial geometry and stiffness of the structure. Hence, the static forces must be firstly applied to the bridge structure to establish an initial structural state for the buffeting analysis.
3.1. Wind Forces on the Bridge
The quasi-steady equations accompanied by the aerodynamic admittance functions are utilized to simulate the buffeting forces [30,32]. The buffeting forces, which include lift force, drag force, and pitching moment, acting on the bridge deck per unit length are given as Equations (2)–(4).
where is the air density; is the average wind velocity; is the width of the bridge deck; , , and are steady-state coefficients; ; ; ; α is the attack angle; , , , , , and are the aerodynamic admittance functions; and are fluctuating wind velocities in along-wind and vertical direction, respectively.
Self-excited forces are included in the buffeting analysis to describe the coupled and feedback relationships between structural motions and wind field [32]. The self-excited forces acting on the bridge deck per unit length can be expressed as linear functions of nodal displacement and nodal velocity as Equations (5)–(7).
where is the reduced circular frequency; , , and are vertical, lateral, and torsional displacements, respectively; , , and are vertical, lateral, and torsional velocities, respectively; , , and (i = 1, 2, …, 6) are flutter derivatives, which are expressed in terms of reduced wind velocity and determined by geometric configuration of the deck’s cross-section; is the natural frequency.
Equations (5)–(7) is expressed in a frequency manner for complex sinusoidal structural motions [33], but the self-excited forces can be reshaped as aerodynamic stiffness and aerodynamic damping [6,9,34,35]. Hence, the governing equation by Equation (1) can be further expressed as
where and are the aerodynamic damping matrix and the aerodynamic stiffness matrix, respectively.
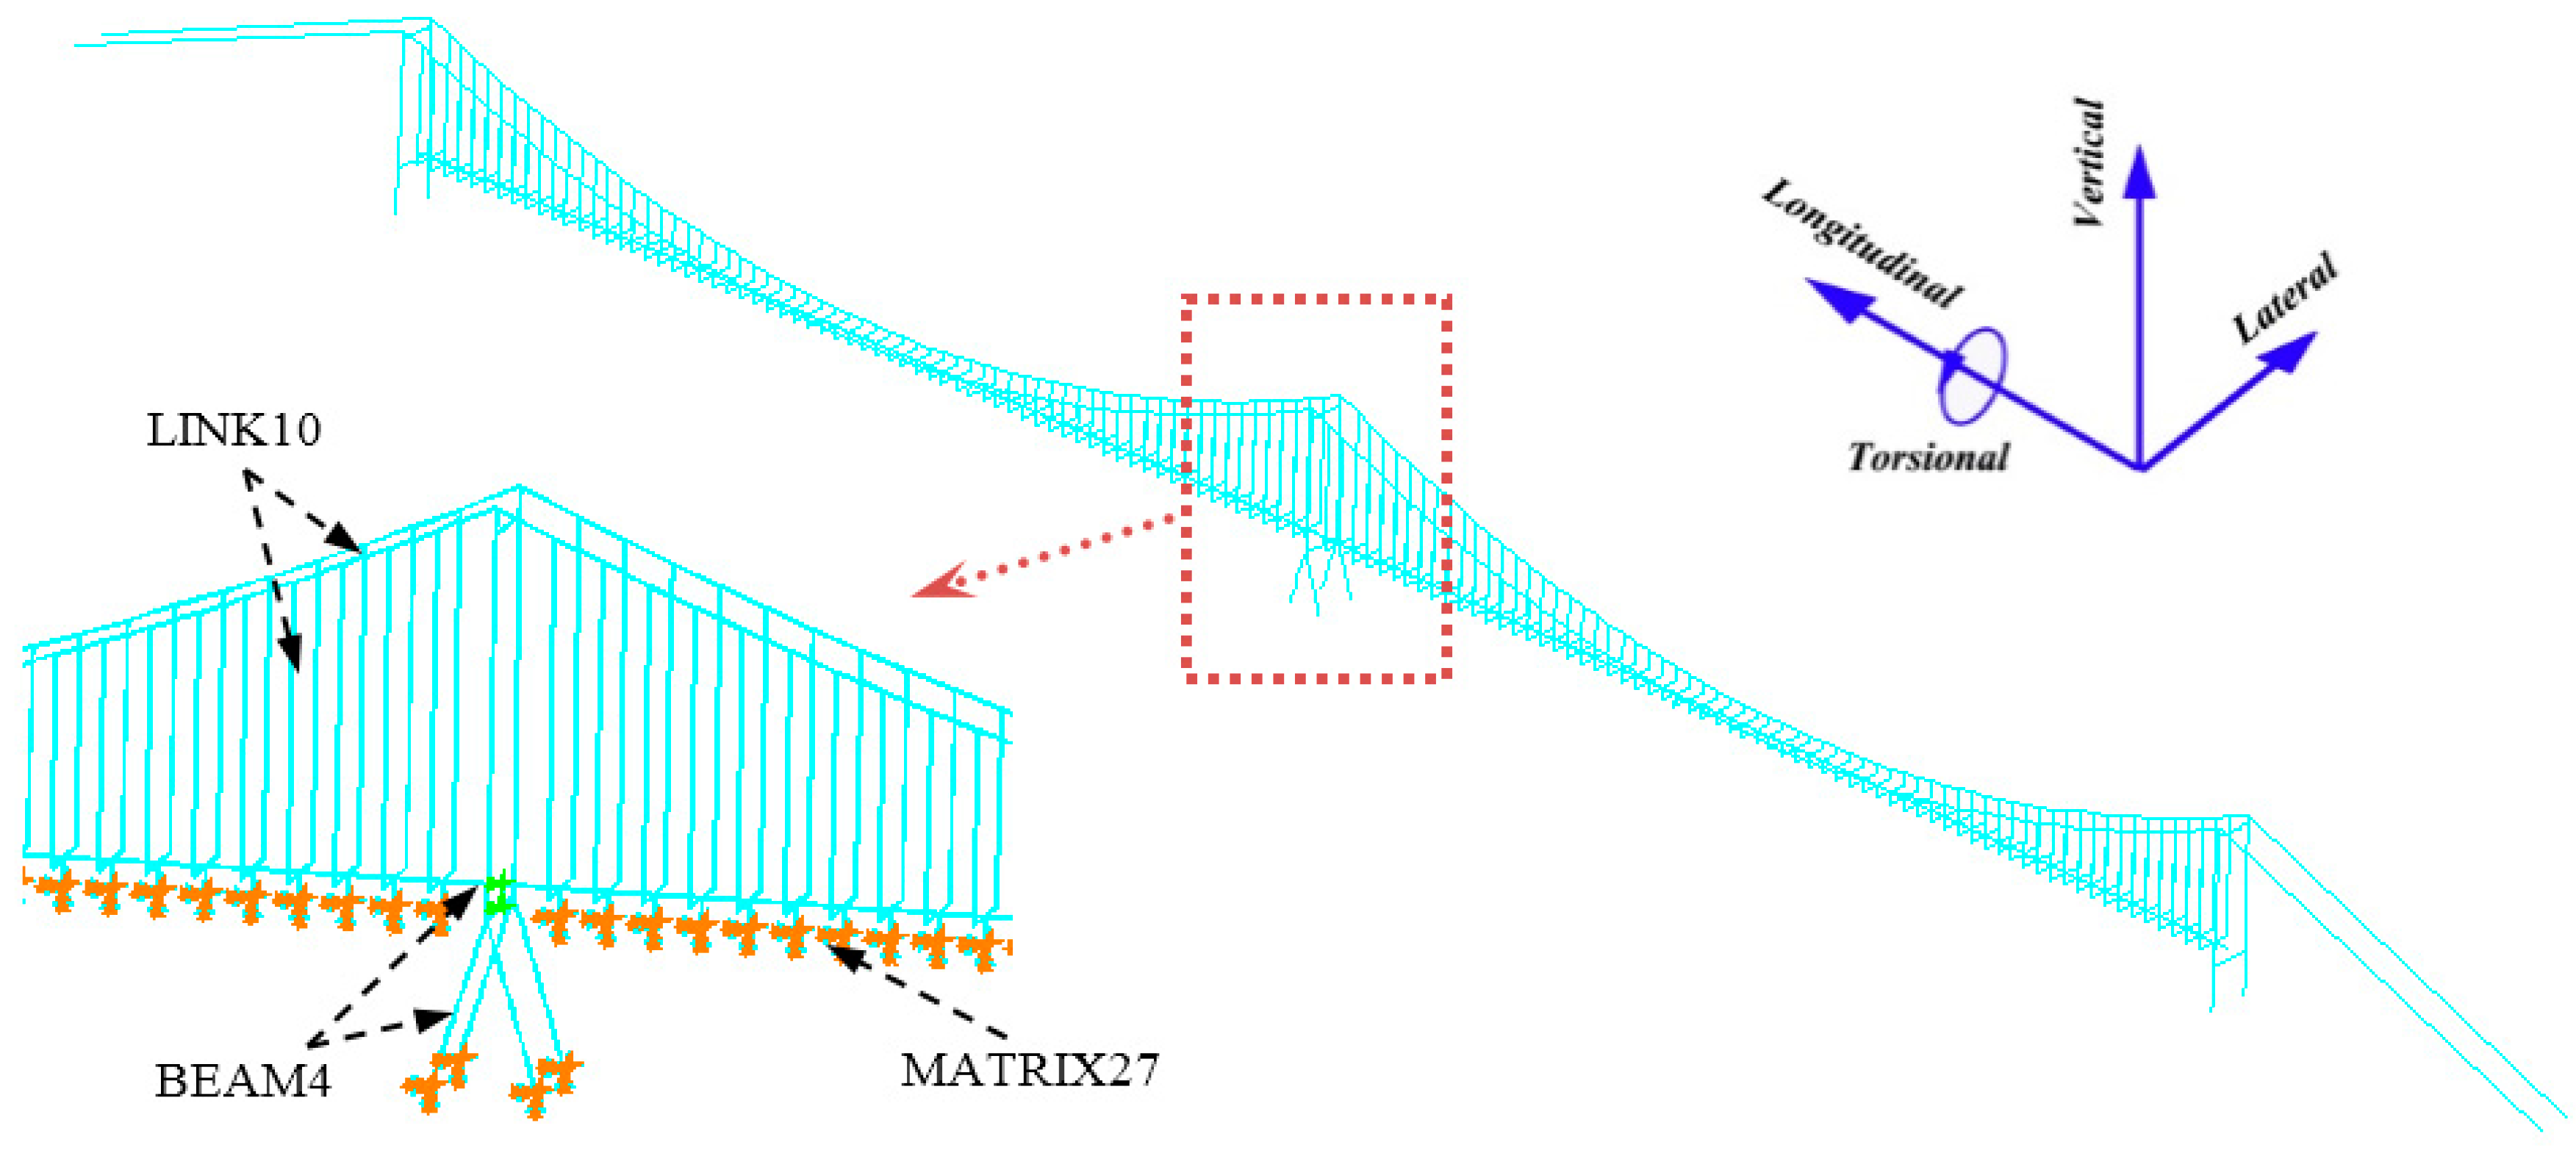
In such a case, the self-excited forces can be treated as parts of structural components instead of direct loadings. In this study, self-excited forces are realized in ANSYS with the user-defined element MATRIX27 [19,35]. Then, the ultimate FE model for the buffeting analysis of Taizhou Bridge is shown in Figure 5.
In the buffeting analysis of Taizhou Bridge, the steady-state coefficients and flutter derivatives were obtained from the section-model wind tunnel tests conducted in the State Key Lab for Disaster Reduction of Civil Engineering at Tongji University [17,19]. As there is no available measured admittance function, it is supposed to be one in the analysis. The wind is assumed to be perpendicular to the main girder, which means the yaw wind issue is not considered in this study. From Equations (2)–(4), it is easy to find that the turbulence is another vital factor that must be included in the time-domain buffeting analysis. Hence, the simulation of the fluctuating wind field is conducted in the following section.
3.2. Simulation of Wind Field
The spectral representation method proposed by Deodatis [36] is utilized to unconditionally simulate the spatial fluctuating wind field around the triple-tower suspension bridge. To enhance the computational efficiency, the fluctuating wind inputs are exerted on the uniformly distributed locations [34], as shown in Figure 6. There are 55 simulated points in total on the main girder. Due to their insignificant contributions to the buffeting response, the wind effects on the main towers, the main cables, and suspenders are neglected for the sake of brevity [37].
Kaimal spectrum [38] and Panofsky spectrum [39] are utilized to simulate the along-wind and vertical fluctuating wind velocities with a sampling frequency of 1 Hz, respectively. Davenport coherence function [40] is adopted to present the spatial correlation of fluctuating winds and the coherence coefficient is conservatively taken as 7. With the Deodatis method, the wind field for Taizhou Bridge is successfully simulated. A typical set of generated along-wind and vertical fluctuating winds at Point 15 is presented in Figure 7.
To verify the effectiveness of the simulated wind field, the power spectral densities (PSDs) and cross-correlation functions of the simulated wind samples are compared with theoretical target values. Some cases of them are selected as examples, which are shown in Figure 8 and Figure 9. The targets refer to Kaimal and Panofsky spectrum in Figure 8, while the target cross-correlation functions in Figure 9 are acquired by the inverse Fourier transform to the corresponding cross-PSDs. In Figure 9, Ri,j denotes the cross-correlation function of fluctuating winds at Point i and Point j. It can be seen that both the PSDs and cross-correlation functions conform well to the targets, indicating the high fidelity of the simulated fluctuating wind field.
4. Buffeting Analysis of Taizhou Bridge
4.1. Buffeting Responses
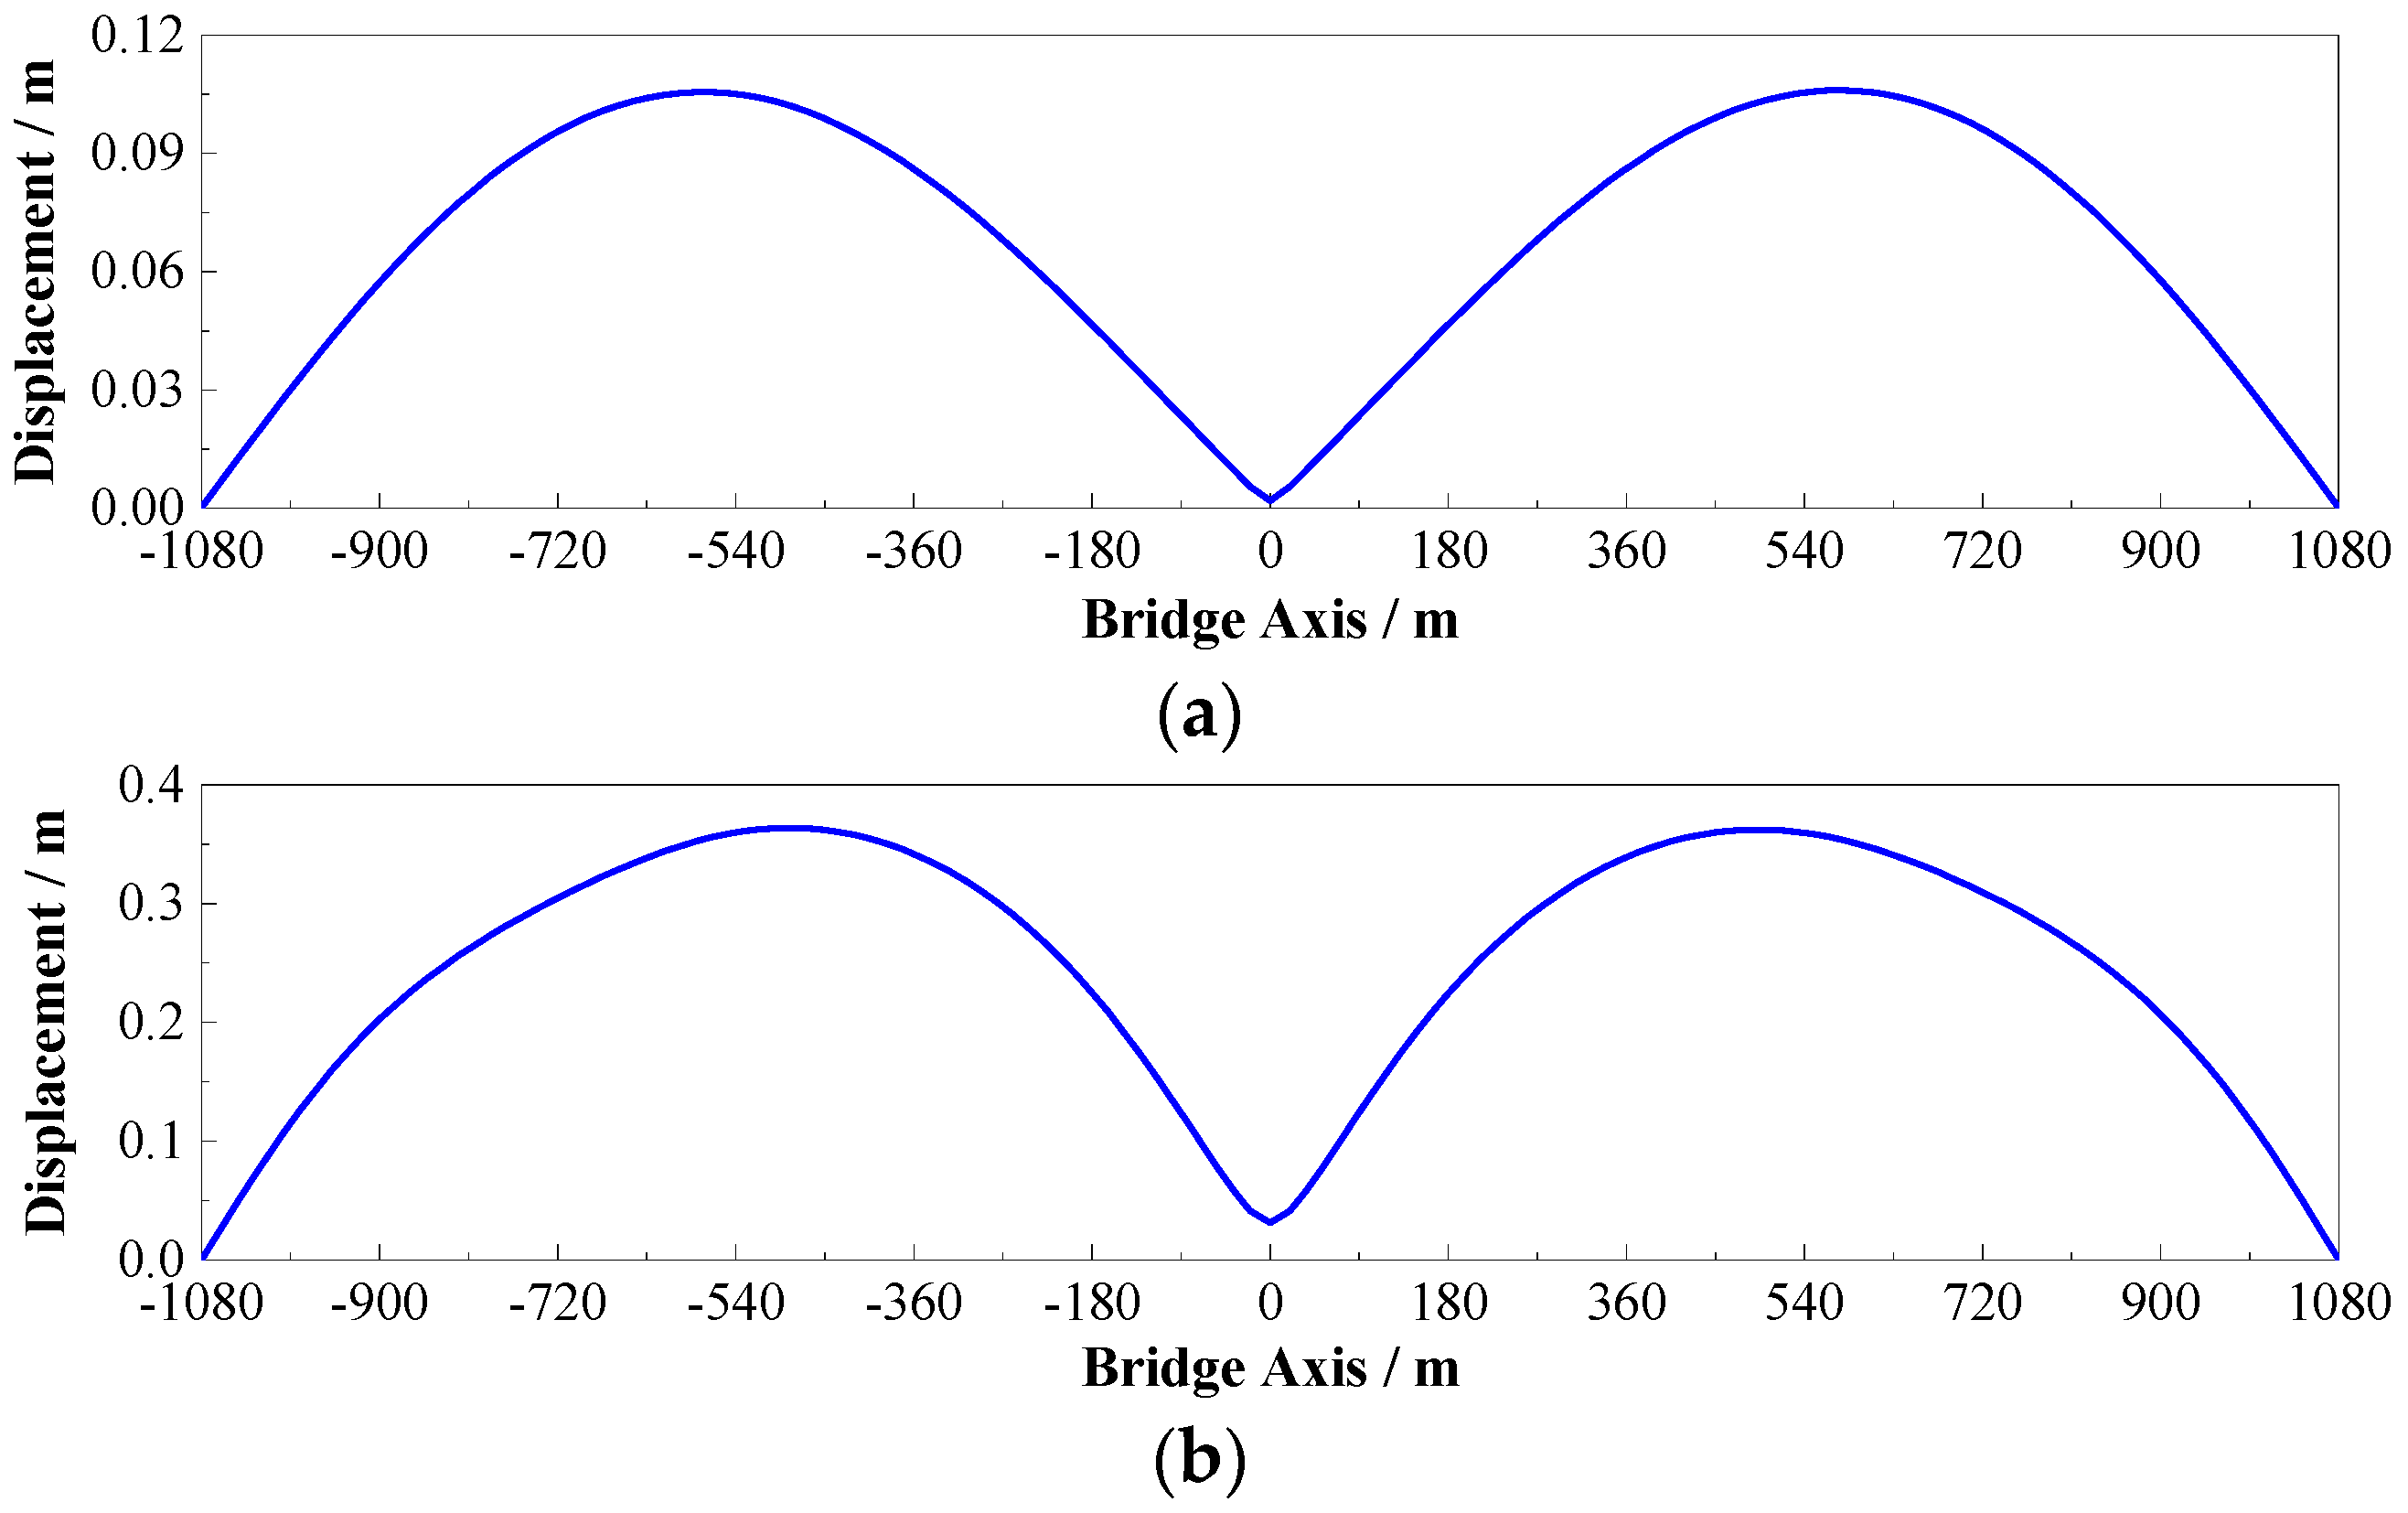
Based on the simulated wind field and the FE model shown in Figure 5, the buffeting responses of Taizhou Bridge are calculated via the governing equation by Equation (8) in time domain. The RMS distribution of buffeting displacements of the main girder is presented in Figure 10. To unify the unit, the torsional buffeting displacement has been multiplied by half of the width of the main girder.
As shown in Figure 10, the buffeting displacements of Taizhou Bridge exhibit the most prominent in the central region of each main span. Different from the other two cases, the maximum of the vertical buffeting displacement shows a leaning trend to the mid-tower. The primary reason is that the vertical stiffness of the main girder is mainly dominated by the longitudinal stiffness of the towers. Obviously, the longitudinal stiffness of the mid-tower is much smaller than side towers, which are tightly restricted by the anchorages.
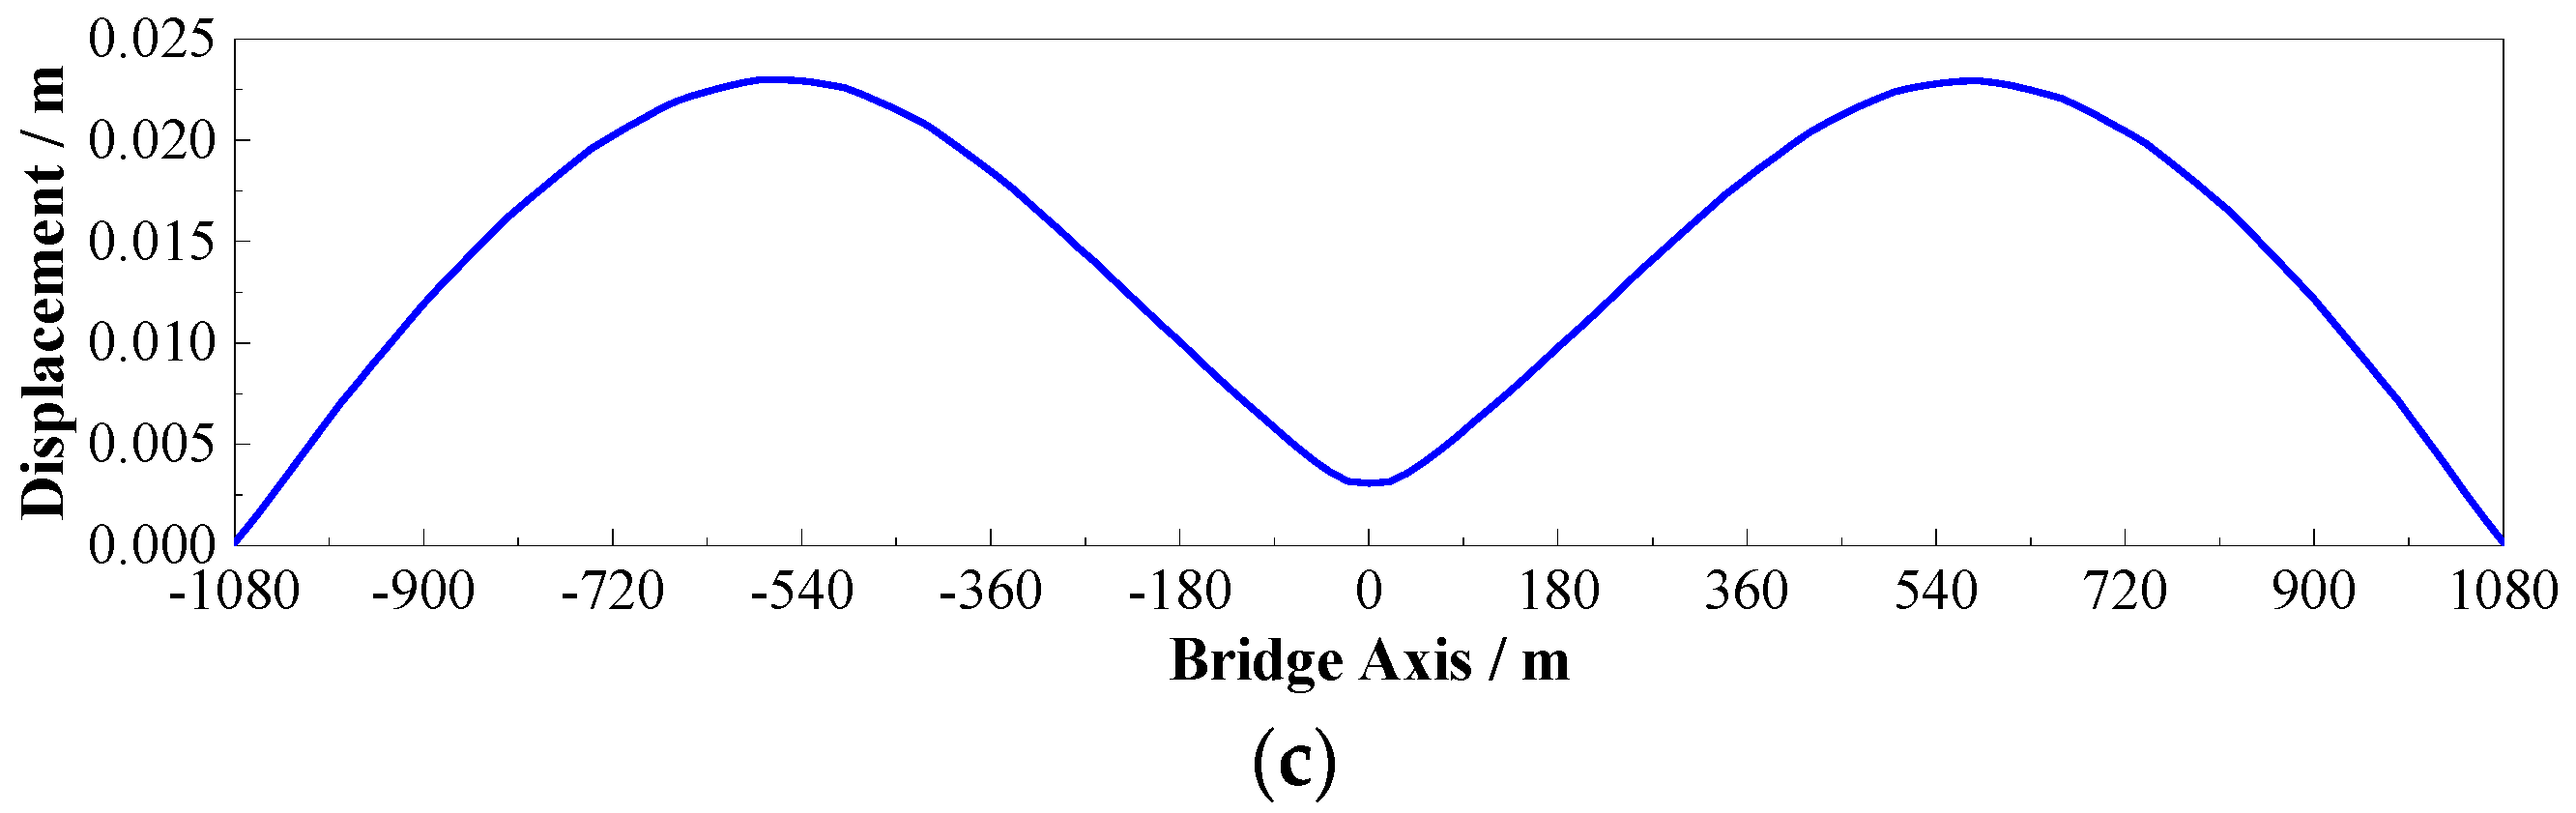
As a typical sample, the buffeting displacements in the middle of one span are presented as shown in Figure 11. It can be seen that the lateral and vertical buffeting displacements are very prominent, while the torsional displacement is generally small. Hence, the torsional vibration of the main girder will not be considered in the following vibration control stage of buffeting responses.
4.2. Time-Frequency Analysis
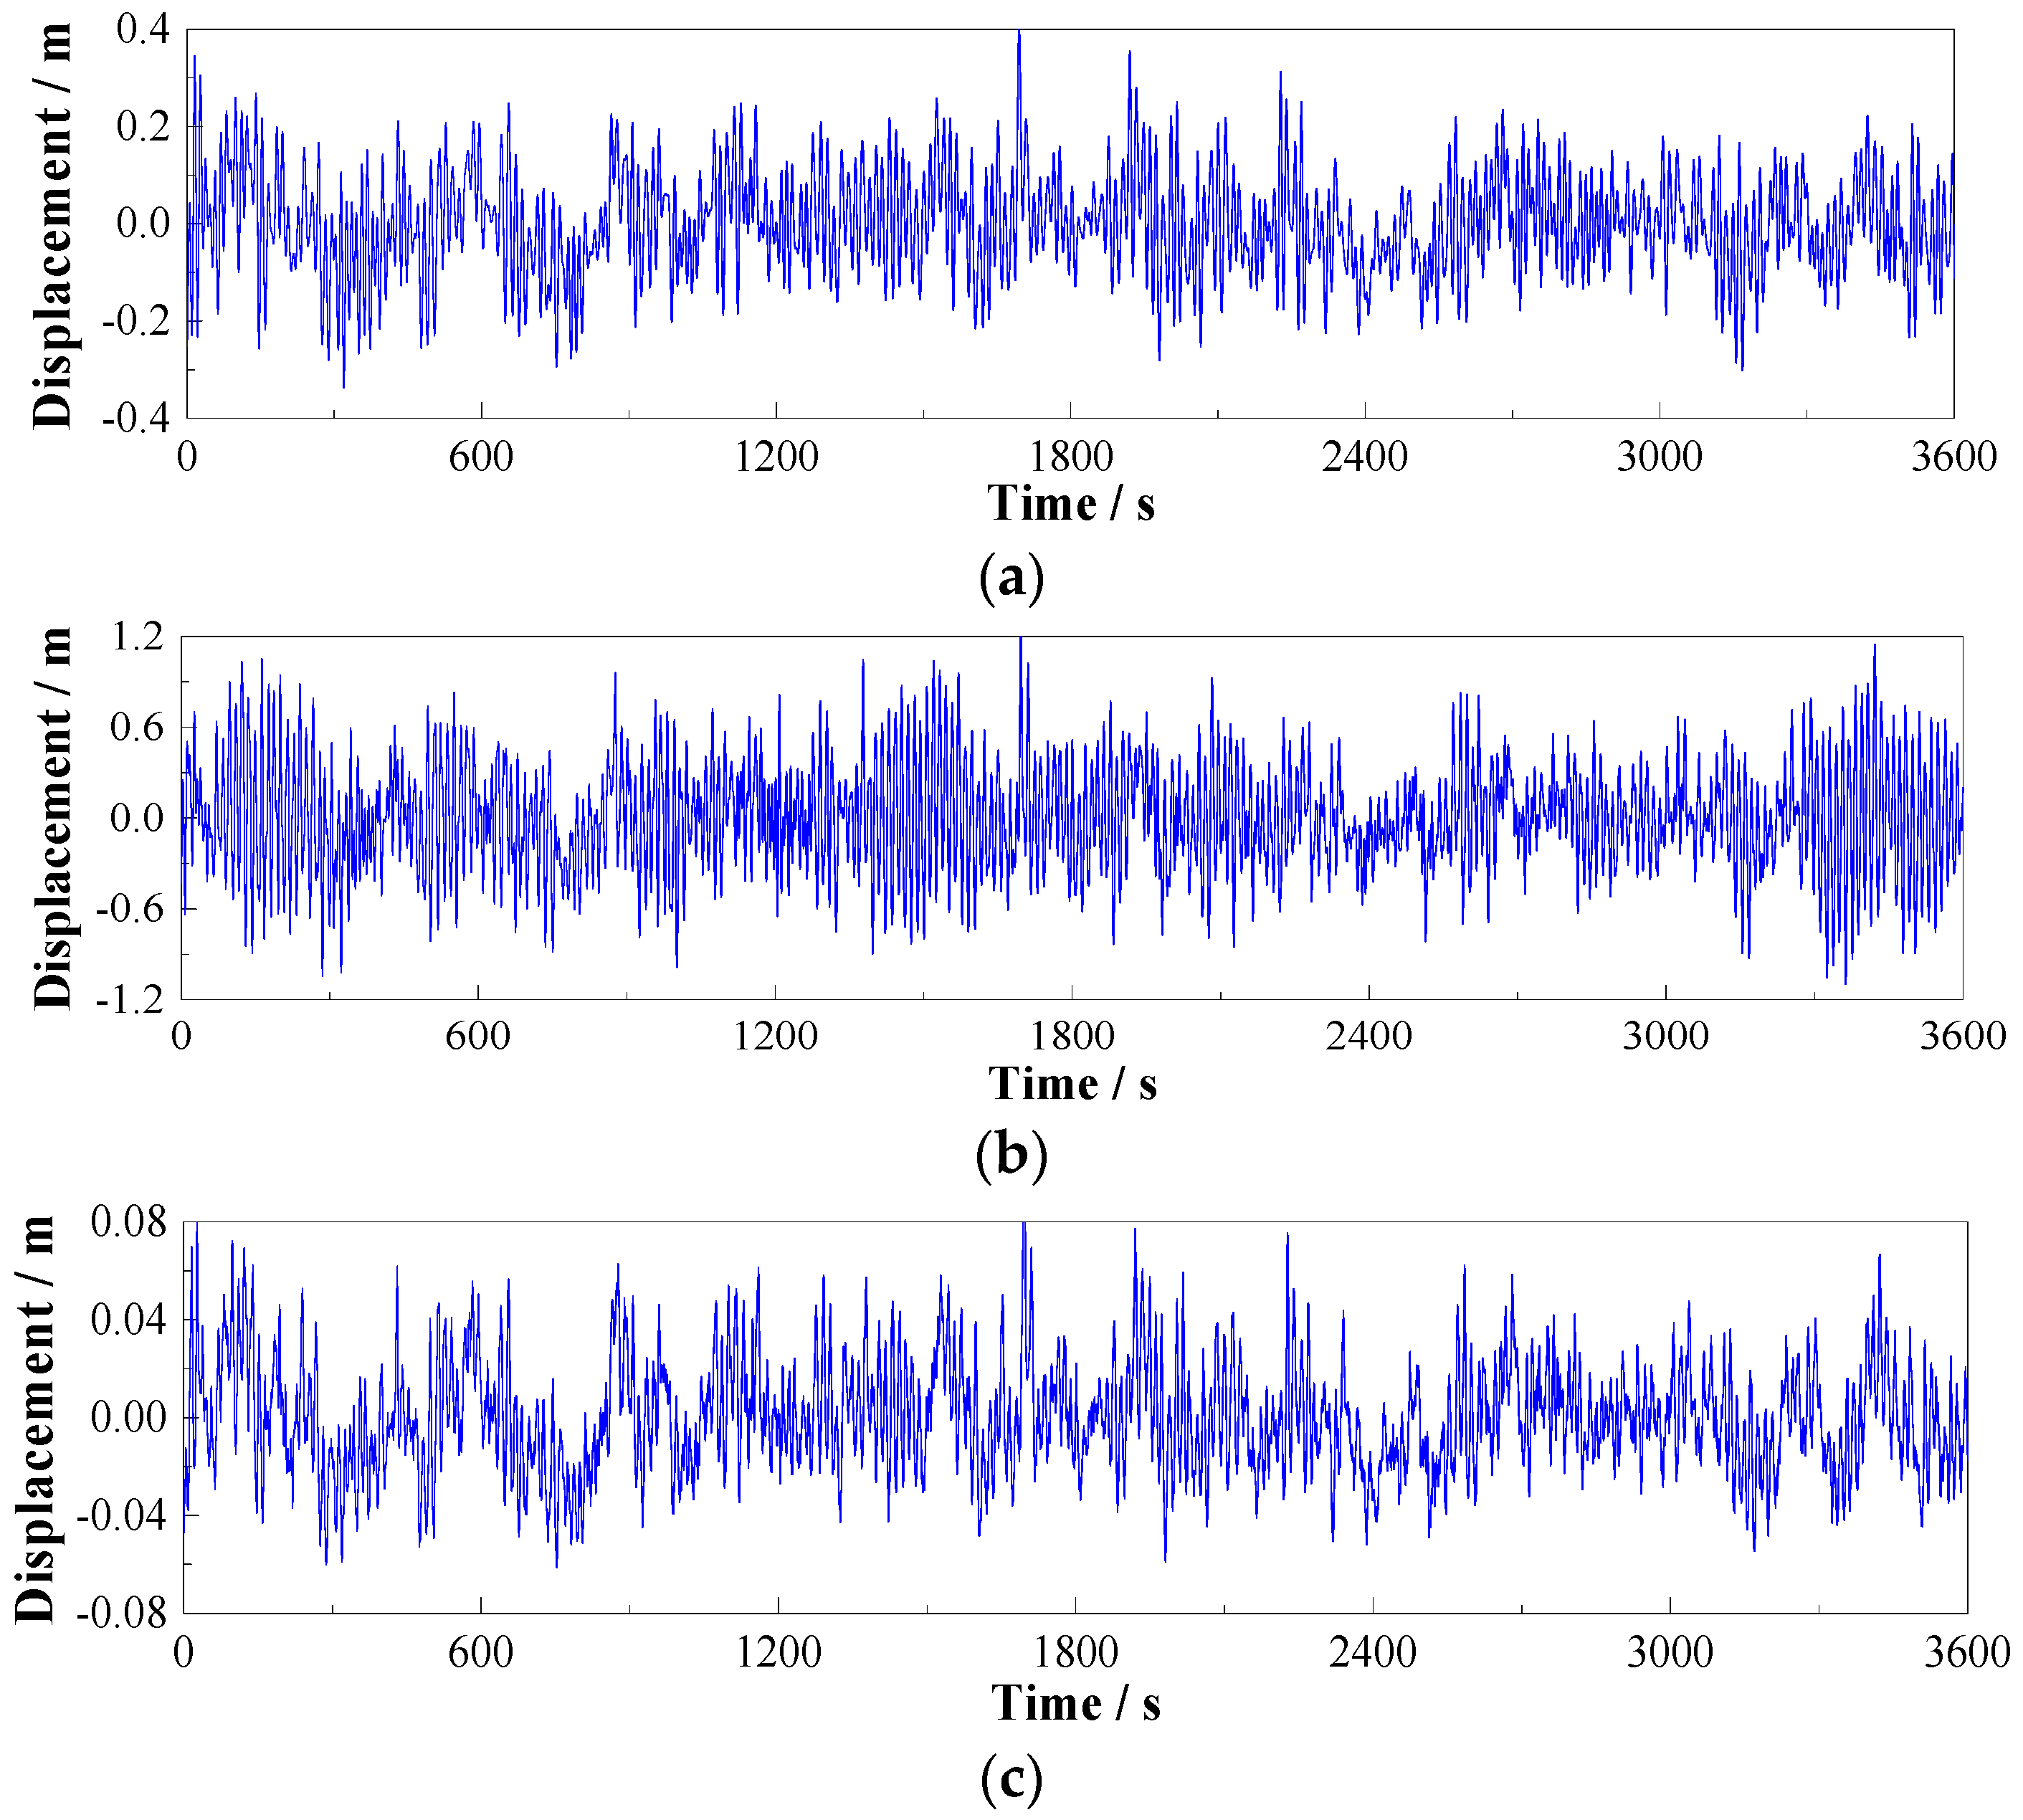
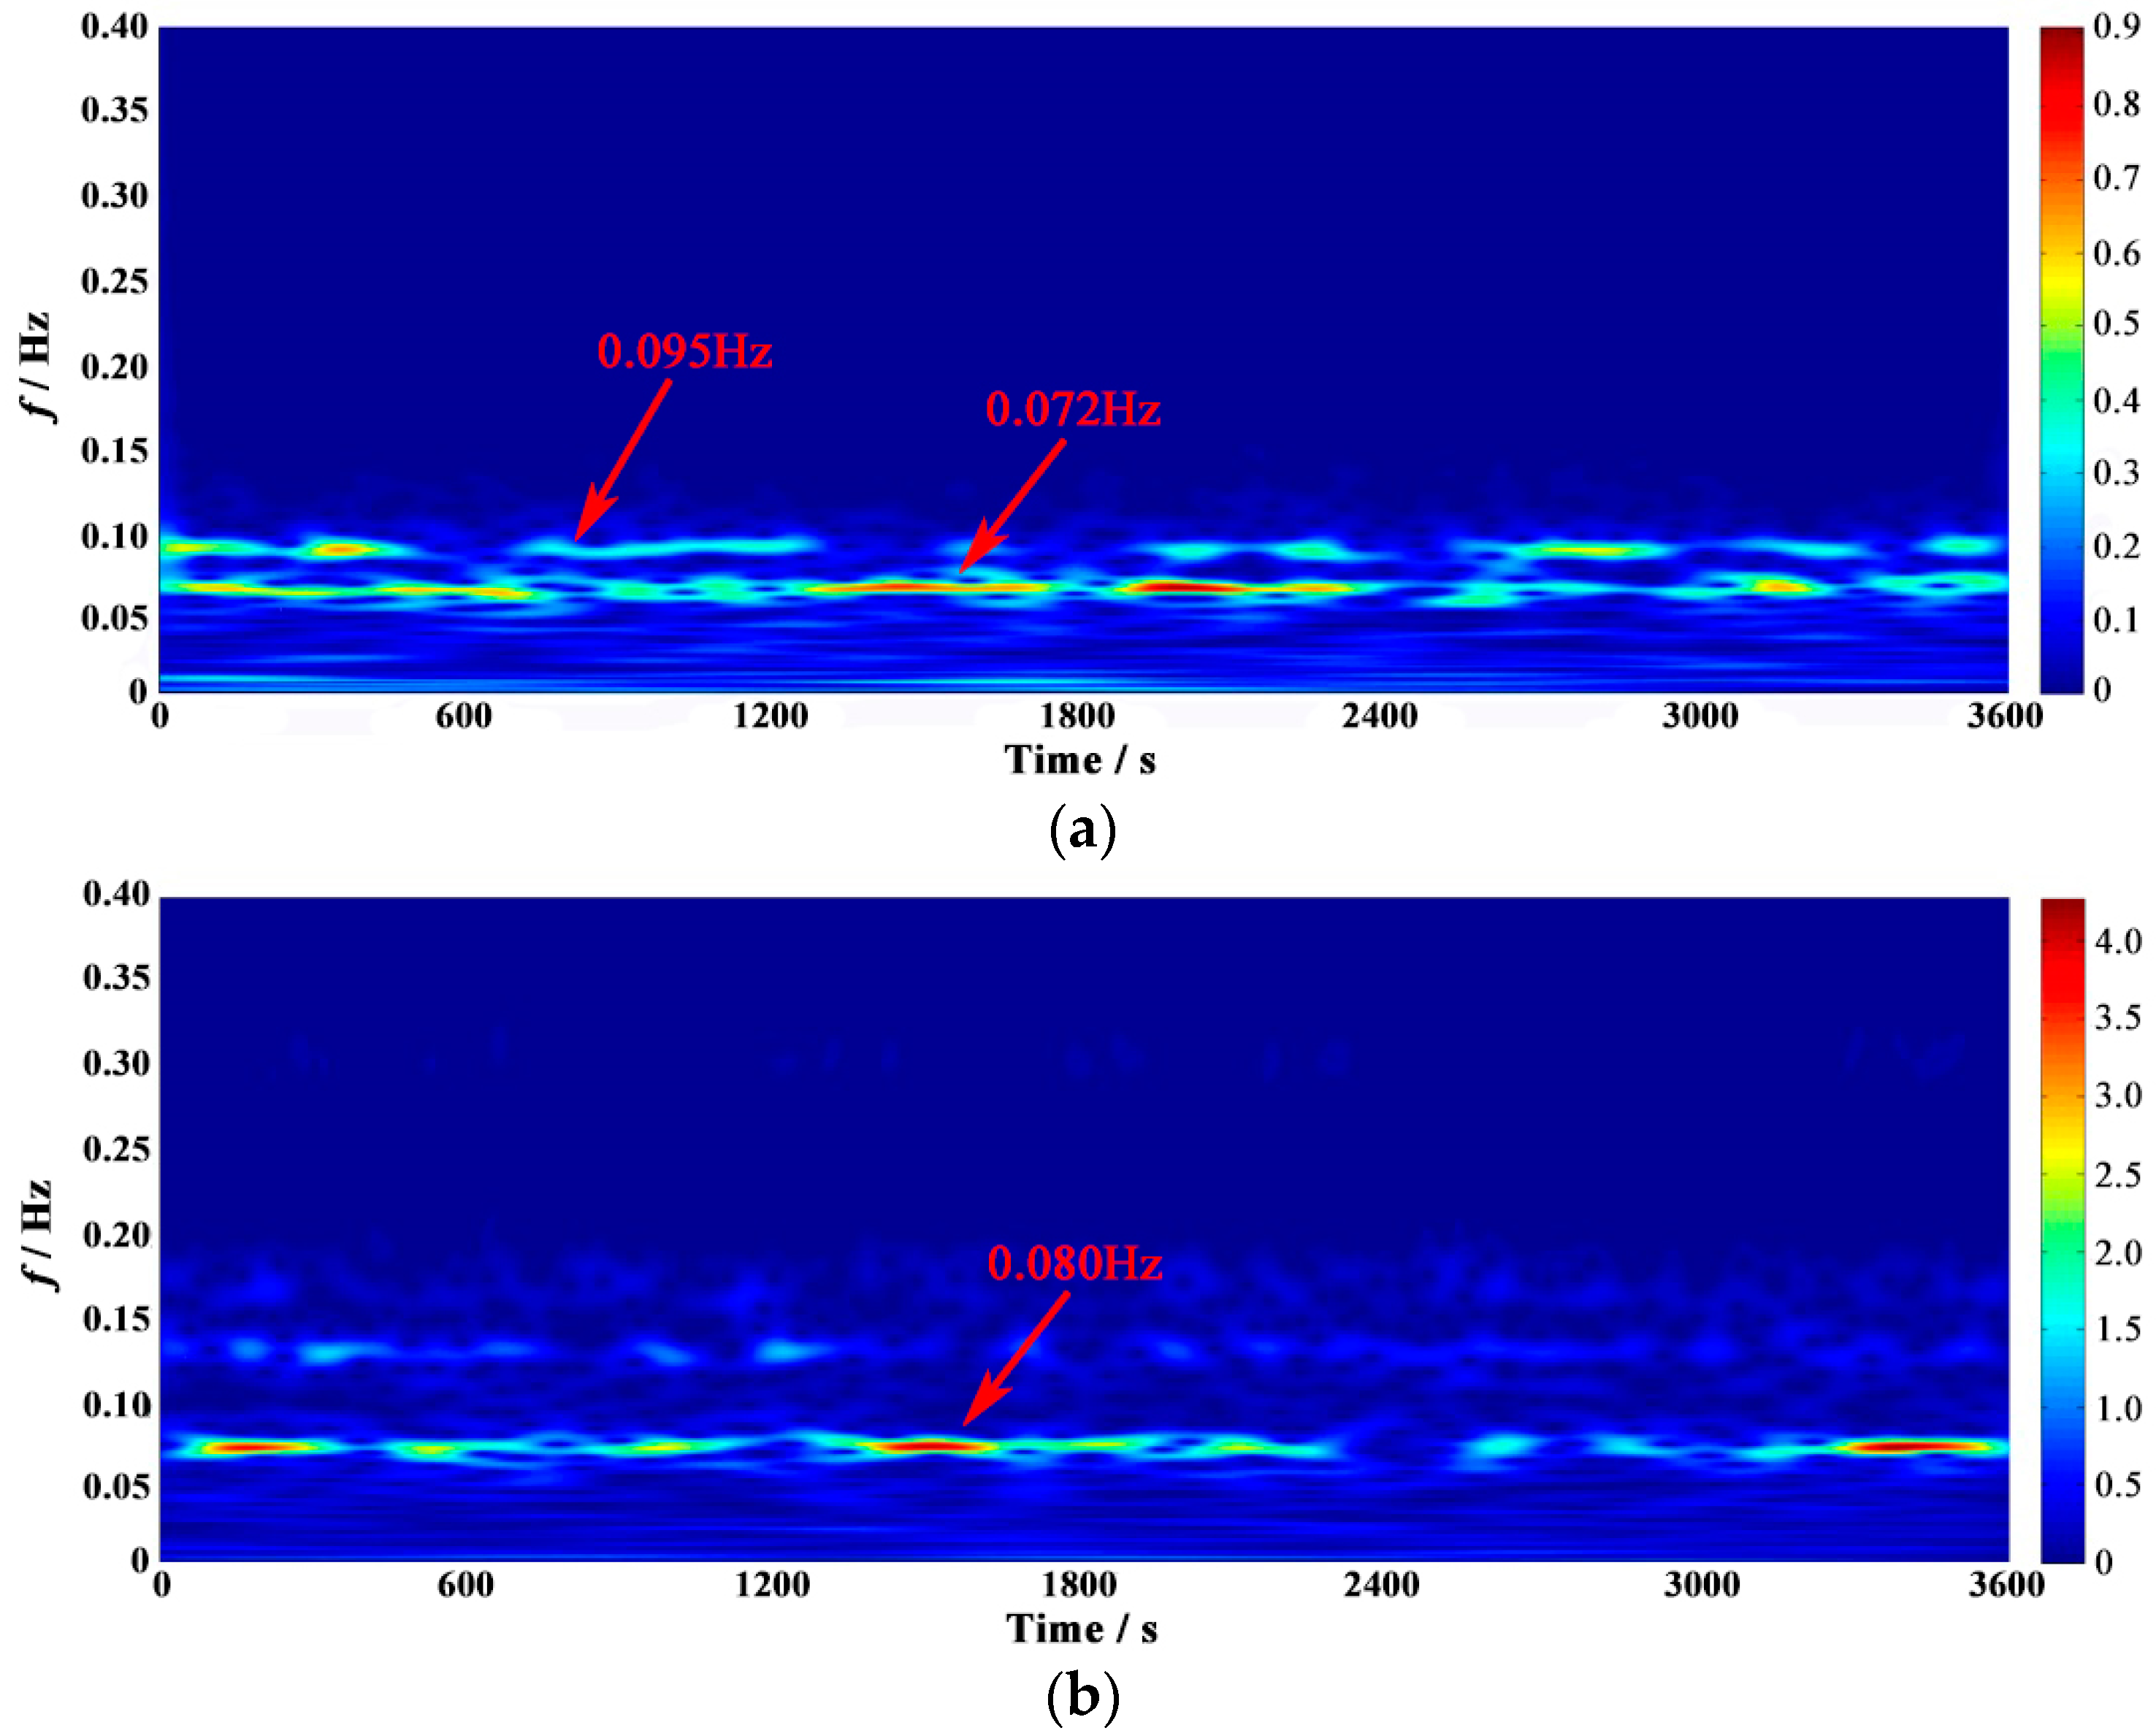
Before conducting the buffeting control of the long-span triple-tower suspension bridge, a prior step is to find the dominant modes in charge of the buffeting responses. These modes are the basis for the design of the MTMD system. Hence, the wavelet transform is selected to characterize the energy distribution of vibrations in frequency domain. In addition, the energy variation along the time will also be clearly presented. With the Moret wavelet as the mother wavelet, the wavelet transform is applied to the lateral and vertical buffeting displacements. The distribution of the modules of the wavelet coefficients in time-frequency domain are shown in Figure 12. It is found that the energy distribution at each time instant is presented, and the dominant frequency can gather to form a bright frequency band along the time. In such a case, the energy variation is easily evaluated via the primary dominant frequency band. For example, some intermittence can be found in each bright frequency band as the input energy varies with the turbulence.
As can be seen in Figure 12, the energy of the lateral buffeting displacement mainly concentrates on two frequencies (0.072 Hz and 0.095 Hz), which correspond to the AS-L-1 mode and the S-L-1 mode. It means that the lateral buffeting displacement is mainly dominated by these two modes. For the vertical buffeting displacement, 0.080 Hz is the most prominent frequency that plays a dominant role in frequency domain. Although there are some vague high-frequency bands captured in the time-frequency spectrum, they are so minor compared to the bright band of 0.080 Hz that they can be neglected. With the aid of Table 1, the vertical buffeting displacement of Taizhou Bridge is proved to be dominated by the AS-V-1 mode. Hence, AS-L-1 and S-L-1 modes are determined as the target modes for the design of vertical MTMD system while AS-V-1 for the lateral MTMD system.
5. MTMD Applications on Taizhou Bridge
5.1. Layout of MTMD on the Main Girder
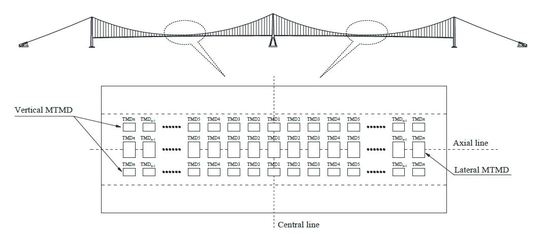
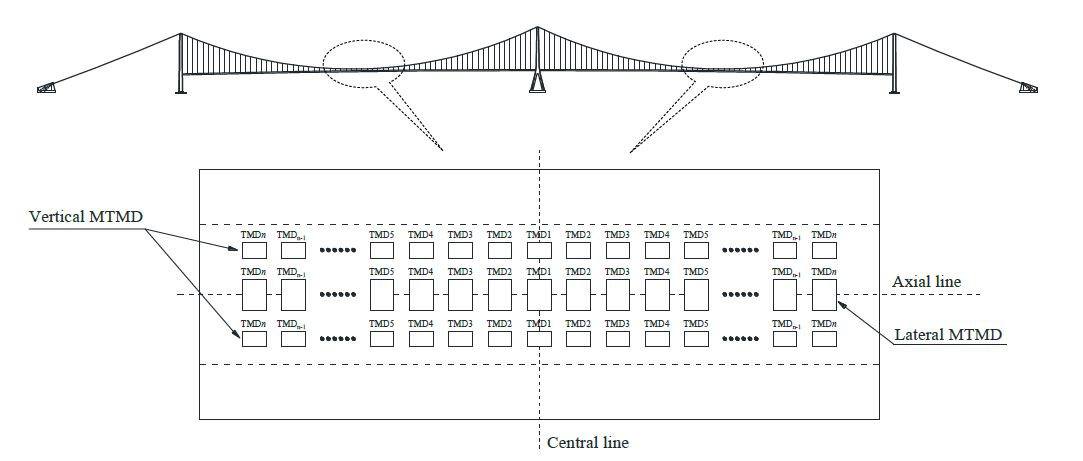
To exert the effect of MTMD to the maximum extent, the MTMD system should be deposited near the maximum amplitude of the dominant mode. As the lateral and vertical buffeting displacements are both dominated by the mode whose maximum amplitude appears in the middle of the span, the MTMD systems are attached to the center region of Taizhou Bridge in each span, as shown in Figure 13.
In this study, there are two independent MTMD systems, a lateral MTMD system and a vertical MTMD system, for the buffeting control of Taizhou Bridge. The layouts of TMDs in the two main spans are entirely the same considering the structural symmetry. In the longitudinal direction of each span, the TMDs of two systems are both symmetric about the central line of the main girder. For the lateral MTMD system in each span, there is only one MTMD included. As shown in Figure 13a, the TMDs are distributed on the axial line of the main girder with equivalent distance between each other. The two TMDs symmetrical about the central line are equipped with the same mechanical parameters. For the vertical MTMD system in each span, there are two MTMDs with the same configuration included. Identical to the TMDs in the lateral MTMD system, the TMDs in one vertical MTMD are distributed in parallel to the axial line with equivalent distance between each other. The two TMDs symmetrical about the central line are also equipped with the same mechanical parameters. For the two corresponding TMDs from the two vertical MTMD, they are symmetric about the axial line with the same mechanical parameter. As there is a distance between the vertical MTMD and the axial line, the MTMD can also to some extent participate in the mitigation of torsional buffeting responses. The section view of TMDs of lateral and vertical MTMD systems is shown in Figure 13b.
For the simulation of TMDs, there is no element directly available in ANSYS. It is simulated with the combination of two basic elements, the MASS21 element and COMBIN14 element. The MASS21 element is utilized to simulate the mass block of TMD, and the COMBIN14 element is applied to simulate the spring and the damper with the stiffness coefficient and the damping coefficient included. Hence, TMD can be represented via the connection of the MASS21 element and COMBIN14 element.
5.2. Design Parameters of the MTMD
The MTMD is consisted of groups of TMDs, whose frequencies are uniformly distributed around the frequency of the dominated mode. The MTMD in Figure 13a is equipped with two groups of TMDs with a shared TMD on the central line. For the TMDs from the central one to the last one on each side in one MTMD, they are named from TMD1 to TMDn using the subscript 1, 2, …, n. For convenience, the mass of the block as well as the damping ratio of each TMD in the same MTMD is assumed to be the same. The basic frequencies of TMDs from TMD1 to TMDn, f1, f2, …, fn, are assumed to increase or decrease with a constant difference. The frequency of the TMD is adjusted by changing the stiffness of the spring component.
In the application of MTMD, the mechanical parameter of each TMD, including the mass of the block, the stiffness of the spring, and the damping ratio, must first be known. This raises the determination of limited key parameters of MTMD to facilitate the damper design. In this study, five key parameters are utilized to characterize the structure of the MTMD. They are the number of TMDs N, the mass ratio μ, the damping ratio ζ, the frequency bandwidth ratio δ, and the frequency ratio λ, respectively. Once the five parameters are given, the MTMD will naturally be determined.
The number of TMDs N refers to the number of TMDs included in one MTMD. In this study, this number will be odd considering the distribution in Figure 13a. The relationship between N and subscript n can be expressed as Equation (9). When the other parameters are given, more TMDs will lead to more intensive natural frequencies. This means the frequency difference between two adjacent TMDs will be smaller with the increment of N.
The mass ratio μ is a key parameter reported to heavily influence the control effectiveness of the MTMD system. μ denotes the ratio of the total mass of TMDs in a MTMD to the equivalent mass of the dominated structural mode, which is defined as
where m is the mass of the block for each TMD; Mequ is the equivalent mass of the dominated mode.
To facilitate the design of the MTMD system, the damping ratios for all the TMDs in the same MTMD are assumed to be identical. ζ is defined as Equation (11) in detail.
where ci and fi are the damping coefficient and the natural frequency of the ith TMD, respectively.
Frequency bandwidth ratio δ is a measurement of the range of frequencies that can be controlled by the MTMD. It is a vital parameter indicating the robustness of the MTMD and makes the MTMD insensitive to frequency variations of the main structure. It is defined as the ratio of the maximum frequency difference in the TMDs to the central frequency, which is detailed as
where f1 and fn are natural frequencies of TMD1 and TMDn, respectively. fc is the central frequency which is the average of frequencies from TMD1 to TMDn.
The frequency ratio λ denotes the ratio of central frequency to the dominated frequency of the main structure, as expressed in Equation (13). In engineering applications, this ratio is often determined as 1 for the MTMD case. Moreover, the modal frequencies of such a long-span bridge will not vary too much after the installation of the MTMD with a not very large mass ratio. When the natural frequency of the main structure varies with the performance deteriorations or maintenance, this parameter is utilized to evaluate the frequency shift of the installed MTMD system and for further performance evaluation of the damper.
Once the five parameters above are given, the mechanical parameter for each TMD can be determined. The procedure is detailed as follows,
- (1)
- The frequency difference Δ between two adjacent TMDs is
- (2)
- The frequency from TMD1 to TMDn can be either ascending or descending. It is set as descending in this study. The natural frequency of the ith TMD is
- (3)
- The mass of the block for each TMD is
- (4)
- The damping coefficient of the ith TMD is
- (5)
- The stiffness of the spring for the ith TMD is
5.3. Step-Updating Framework for the Determination of Parameters
In order to quantify the control efficiency of the MTMD, the attenuation factor is defined as
where α and β are the RMS (Root Mean Square) of the buffeting displacements with and without MTMD, respectively. This attenuation factor is a performance-oriented index that directly presents the effect of the MTMD system [27].
As shown in Figure 14, a step-updating framework is presented to analyze the parameter sensitivity of the control efficiency for each MTMD, and determine the preferred values for the main parameters with the expected attenuation factor. The frequency ratio is set as 1 in the analysis, but it is also changed within ±10% to investigate the robustness of the MTMD system. The step-updating framework gets the main parameters updated one by one via the parametric analysis. A feedback in each step will be included for the next round of updating, which will save time for the parameter determination. By the experience obtained in testing the framework, the prescribed attenuation factor can be satisfied within 2–3 rounds.
There are seven steps included in the whole procedure, which are detailed as
- Step 1
- Set the initial values for the four main parameters, including the number of TMDs N0, the mass ratio μ0, the damping ratio ζ0, and the frequency bandwidth ratio δ0, by experience.
- Step 2
- Conduct the parametric analysis on the number of TMDs N with the other parameters unchanged, and determine a preferred value for N in this round. Then, include the positive range between N and the attenuation factor in the next round.
- Step 3
- Conduct the parametric analysis on the mass ratio μ with the updated N and two initial other parameters, and determine a preferred value for μ in this round. Then, include the positive range between μ and the attenuation factor in the next round.
- Step 4
- Conduct the parametric analysis on the damping ratio ζ with the updated N and μ as well as δ0, and determine a preferred value for ζ in this round. Then, include the positive range between ζ and the attenuation factor in the next round.
- Step 5
- Conduct the parametric analysis on the frequency bandwidth ratio δ with the updated N, μ, and ζ0, and determine a preferred value for δ in this round. Then, include the positive range between δ and the attenuation factor in the next round.
- Step 6
- Compare the damping ratio η of the MTMD with the updated parameters to the prescribed threshold η0. If η ≥ η0, go to Step 7; Otherwise, go to Step 2.
- Step 7
- The final values of the four main parameters are determined as the ones in Step 6 and are renamed as Nd, μd, ζd, and ηd, respectively.
5.4. Parametric Analysis on the MTMD Application
Before the parametric analysis on the MTMD application, the dominant frequency and corresponding equivalent mass should be firstly determined. Since the vertical buffeting response of Taizhou Bridge is dominated by the AS-V-1 mode, the modal frequency and equivalent modal mass for the vertical MTMD design is definite, as shown in Table 2. However, the lateral buffeting response is mainly dominated by two modes (AS-L-1 and S-L-1). Hence, a weighting calculation is performed on the two modes. The weight coefficients are given according to the average energy represented by the two modes over the time. For example, if the averaged energies on two frequencies are E1 and E2, respectively, the corresponding weight coefficients will be E1/(E1 + E2) and E2/(E1 + E2). Then, the dominant modal mass and frequency are expressed as
where fL and ML are the dominant modal mass and frequency, respectively. fAS-L-1 and fS-L-1 are the modal frequencies of Mode AS-L-1 and Mode S-L-1, respectively. MAS-L-1 and MS-L-1 are the equivalent modal masses of Mode AS-L-1 and Mode S-L-1, respectively. w1 and w2 are weight coefficients, and in this study correspond to 0.7 and 0.3, respectively.
In such a case, the dominant modal mass for the lateral MTMD is set as 25,318.6 t and the dominant modal frequency is 0.07868 Hz. The modal mass for vertical MTMD is 24,200.4 t and the modal frequency is 0.08023 Hz. Then, a parametric analysis is conducted in the following section.
5.4.1. Number of TMDs
The control efficiency of the lateral and vertical MTMD systems is investigated with different numbers of TMDs, as shown in Figure 15. During the process, the other three parameters are constant. These three parameters for lateral MTMD are μ0 = 0.02, ζ0 = 2%, δ0 = 0.5, while those for vertical MTMD are μ0 = 0.02, ζ0 = 2%, δ0 = 0.2. The lateral buffeting response is dominated by two modes, so the selection of frequency bandwidth ratio needs to cover both of the two modes. In such a consideration, the frequency bandwidth for lateral MTMD is wider than the vertical one.
According to Figure 15, the control efficiency firstly increases with the augment of the number of TMDs, but the rising trend gradually levels off and finally becomes stable. This phenomenon is consistent in both lateral and vertical MTMDs. When the number of TMDs is small (e.g., it is taken as two), the MTMD system will mainly dedicate itself to mitigating the vibration components characterized by the two frequencies, even though the MTMD system is equipped with a wide frequency bandwidth. However, as the number of TMDs increase, the effective frequencies in the given frequency bandwidth will be densely distributed so that the effect of the MTMD can be fully exerted. The maximum control efficiencies of the lateral and vertical MTMDs in this round can be 17.9% and 30.4%, respectively.
Except the control efficiency, the robustness is another consideration in the performance of the MTMD. The parameter sensitivity of the number of TMDs is also investigated with the frequency ratio ranging from 0.90 to 1.10. As is apparent from Figure 15, the difference of the control efficiency for different frequency ratios will be nearly constant when the number of TMDs is large enough. This means the attenuation factor will not deviate too much from the prediction even if there is a big shift captured in the modal frequency of the main structure.
Hence, to keep the MTMD with a stable performance, the number of TMDs should lie in the aforementioned steady range. However, considering the increasing construction difficulty of more TMDs, the lower limit of the range is a preferable selection of this number. In this round, the numbers of TMDs in the lateral and vertical MTMD system are set as 13 and 11, respectively.
5.4.2. Mass Ratio
The control efficiency of the lateral and vertical MTMD systems is also investigated with different mass ratios, as shown in Figure 16. During the process, the damping ratio and frequency bandwidth ratio are kept the same as the parametric analysis on the number of TMDs above, while the number of TMDs is updated with 13 for the lateral MTMD and 11 for the vertical MTMD.
As shown in Figure 16, the control efficiency of the lateral MTMD increases with the augment of the mass ratio, but the ascending gradient is gradually decreasing. For example, the control efficiency goes up by 8.99% when the mass ratio varies from 0.01 to 0.03, however, it increases by only 7.18% when the mass ratio changes from 0.03 to 0.10. It is indicated that the improvement of the control efficiency is rather limited when the mass ratio is larger than 0.03. Hence, the mass ratio is updated as 0.03 for the lateral MTMD.
For the vertical MTMD, there is also a rising trend between the control efficiency and the mass ratio. But the control efficiency gradually decreases when the mass ratio is larger than 0.07. This is mainly because the mass distribution of the bridge structure will be changed when the mass ratio of the MTMD is too large. Then, the natural frequency of the vertical dominant mode will have a big shift from the design value, which accounts for the decreasing of the attenuation factor of the MTMD. This phenomenon is not captured in the lateral case, which means the lateral mode is not obviously influenced by the investigated mass ratios. Since the control efficiency is improved the most dramatically from 0.01 to 0.02 and the value when mass ratio is 0.02 has reached 30.33%, the preferred mass ratio of the vertical MTMD is determined as 0.02 in this round.
5.4.3. Damping Ratio
The control efficiency of the lateral and vertical MTMD systems is also investigated with different damping ratios, as shown in Figure 17. During the process, the frequency bandwidth ratio are kept the same as the one in the parametric analysis above, while the other parameters are updated as N = 13, μ = 0.03 for lateral MTMD and N = 11, μ = 0.02 for vertical MTMD.
As illustrated in Figure 17, when the damping ratio changes from 0% to 10%, the control efficiencies for lateral and vertical MTMD vary only 1.41% and 3.44%, respectively, indicating that the damping ratio has less influence on the control efficiency. For the lateral MTMD system, with the augment of the damping ratio the control efficiency first increases and then gradually declines, which peaks at 20.27% with the damping ratio of 2%. This is mainly because increasing the damping is beneficial for the energy dissipation of the structure. However, when the damping ratio goes up to a certain level, the movement of the mass block will be suppressed, leading to the decline of the MTMD control effect. Hence, the preferred value of the damping ratio for the lateral MTMD is set as 2% in this round.
For the vertical MTMD system, the control efficiency decreases with the augment of the damping ratio, which means only the suppression effect of damping is presented in the movement of the mass block. When the damping ratio is between 0% and 2%, the reduction of the control efficiency is unapparent, but the subsequent reduction is nearly in a big constant gradient. Since the un-damped TMD is very sensitive to the variation of the natural frequency of the main structure [27], the preferred value of the damping ratio for the vertical MTMD is also set as 2%.
5.4.4. Frequency Band Width Ratio
The control efficiency of the lateral and vertical MTMD systems is investigated with different frequency bandwidth ratios, as shown in Figure 18. During the process, the other updated parameters are N = 13, μ = 0.03, ζ0 = 2% for the lateral MTMD and N = 11, μ = 0.02, ζ0 = 2% for the vertical MTMD.
According to Figure 18, a typical feature in the parametric analysis is that the control efficiency first increases to a peak and then decreases with the augment of the frequency bandwidth ratio. When the frequency bandwidth ratio is small, the effective frequencies that can be controlled are limited. An extreme case is that, when the frequency bandwidth ratio is zero, the MTMD is reduced to the TMD, which means only the central frequency is determined as the controlled target. Hence, with the increase of the frequency bandwidth ratio, the control efficiency of the MTMD will have a prominent improvement, but when the frequency bandwidth ratio becomes larger, the frequency difference between two adjacent TMDs is increasing. This will lead to the same problem resulting from the case with small number of TMDs. In such a status, only limited discrete frequencies can be controlled by the MTMD system, which accounts for the decreasing attenuation factor in the high frequency bandwidth range.
The robustness of the MTMD system is also investigated via changing the frequency ratio, which is also shown in Figure 18. In this study, there is a 10% maximum frequency shifting to the central frequency considered. For the lateral MTMD, the control efficiencies in the five cases do not deviate too much from each other. However, for the vertical MTMD, the performance is sensitive to the frequency variation in the range of small frequency bandwidth ratios. This phenomenon can be obviously alleviated utilizing high frequency bandwidth ratios. The lateral buffeting responses are dominated by two modes, which means the buffeting responses cannot be well mitigated in the cases with low frequency bandwidth ratios as the central frequency is between the frequencies of the two modes. That is why the performance of the MTMD sensitive to frequency variations in low frequency-bandwidth-ratio cases is not captured in the lateral MTMD.
For the lateral MTMD, the frequency bandwidth ratio should cover the two dominant modes. To make the control efficiency of the MTMD sufficiently performed, the preferred value of the frequency bandwidth ratio for the lateral MTMD is determined as 0.5. When the frequency bandwidth ratio is 0.3, the control efficiency of the vertical MTMD is only a little smaller than the peak value, but the robustness is obviously improved and can be accepted for application. Hence, the preferred value of the frequency bandwidth ratio is updated as 0.3 for the vertical MTMD.
In this study, the prescribed thresholds for the control efficiencies of the lateral and vertical MTMD systems are both set as 20%. Thus, with only one round, the main parameters of the MTMD systems for the buffeting control of Taizhou Bridge are determined via the step-updating framework. Of course, a better attenuation factor can be obtained after another step or two, but the increment would not be as big as the first step due to the small gradient observed in the parametric analysis. The preferred values for the design parameters of the MTMDs are presented in Table 3.
5.5. Performance Evaluation of the MTMD Application
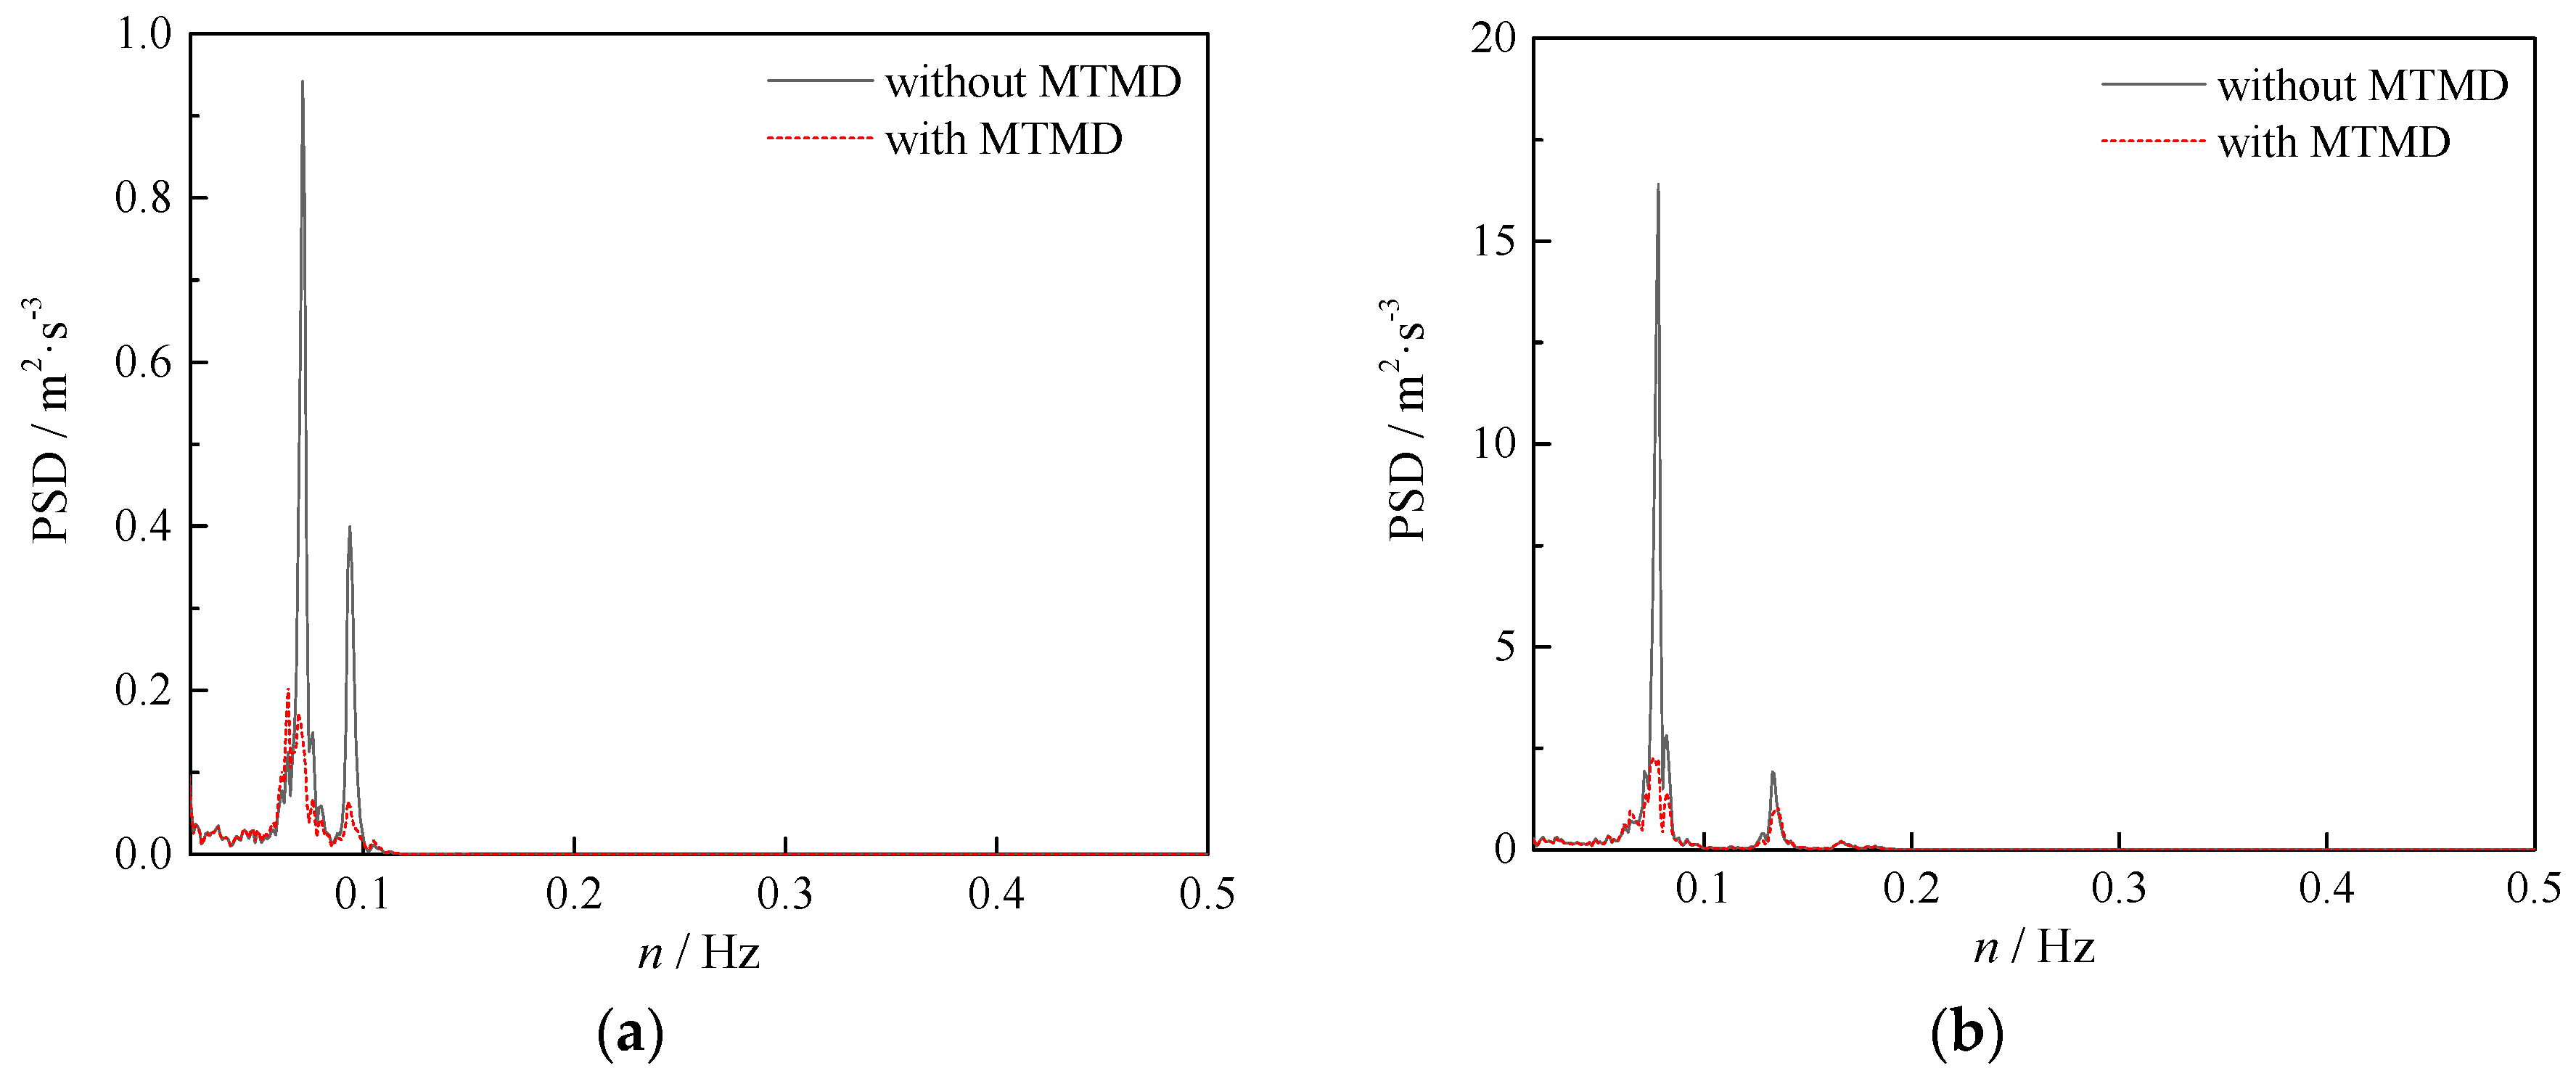
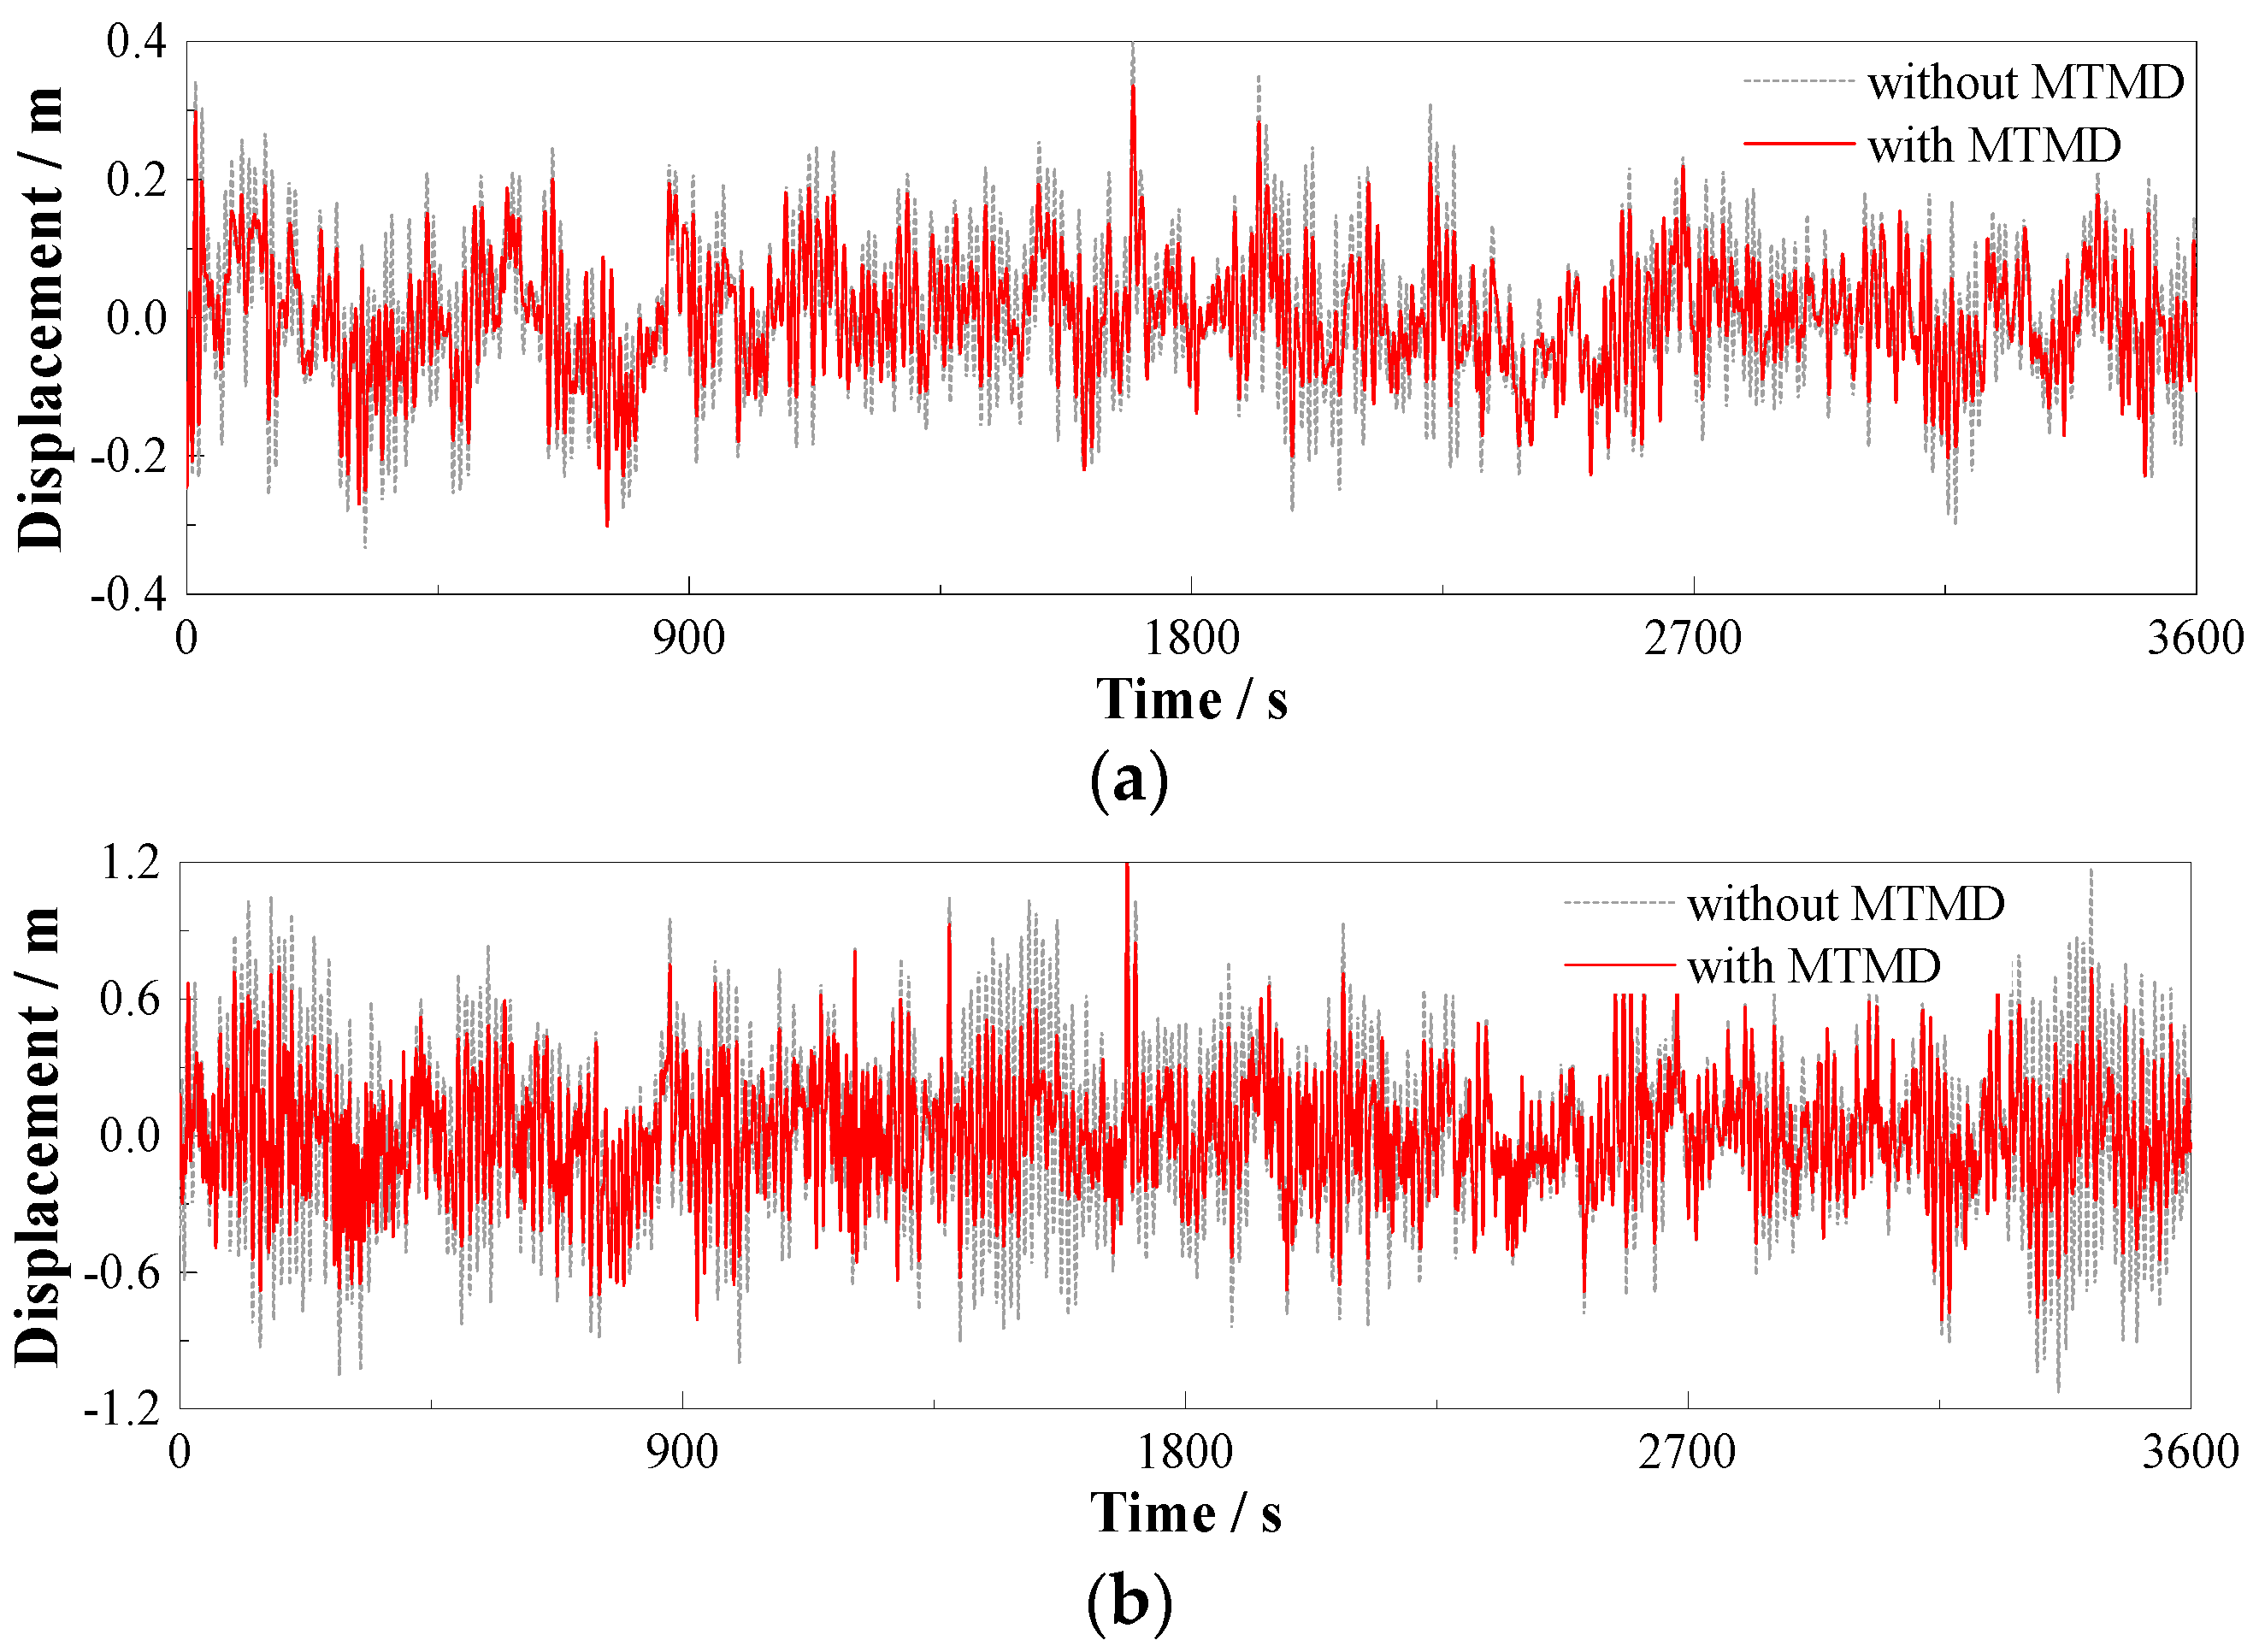
With the parameters for the MTMD systems above, the buffeting displacement of Taizhou Bridge in the middle of the main girder is compared to the non-MTMD case to make a performance evaluation of the MTMD application. The buffeting displacements of Taizhou Bridge with and without MTMDs are shown in Figure 19.
As shown in Figure 19, the lateral and vertical buffeting displacements of the main girder of Taizhou Bridge are both successfully suppressed. The RMS of the lateral buffeting displacement has been reduced to 0.083 m from 0.105 m with a 21.0% reduction, while the RMS in the vertical case is decreased to 0.255 m from 0.361 m with a 29.4% reduction. To better present the performance of the MTMD system, a spectral analysis is conducted on the buffeting displacements in Figure 19. The PSDs of the displacements with and without MTMD are presented in Figure 20. It is obvious that the energies contained in the dominant frequencies are remarkably mitigated by the MTMD, which means the damper system has fully exerted its function. In conclusion, with the preferred mechanical parameters determined by the step-updating framework for MTMD application, the buffeting responses of the long-span triple-tower suspension bridge under strong winds can be effectively mitigated.
6. Conclusions
In this study, a parameter sensitivity analysis is conducted on the buffeting control of a long-span triple-tower suspension bridge with MTMD. The following conclusions can be drawn accordingly:
- The buffeting responses of Taizhou Bridge are the most prominent in the central region of each main span. The lateral buffeting displacement is dominated by the AS-L-1 mode and the S-L-1 mode while the vertical displacement is dominated by the AS-V-1 mode.
- The control efficiency of MTMD firstly increases with the augment of the number of TMDs, but the rising trend gradually levels off and finally becomes stable. The effect of MTMD can be fully exerted when the amount of TMDs is big enough with effective frequencies densely distributed in the given frequency bandwidth.
- The augment of the mass ratio has a positive contribution to the control efficiency of the MTMD. However, the structural modal frequency will have a big shift from the design value when the mass ratio is too large, which even leads to the decreasing of the attenuation factor of the MTMD.
- The damping ratio has less influence on the control efficiency of the MTMD. Increasing the damping is beneficial for the energy dissipation of the structure, but when the damping ratio goes up to a certain level, the movement of the mass block will be suppressed to cause the decline of the MTMD control effect.
- When the frequency bandwidth ratio is small, the effective frequencies that can be controlled are rather limited. Hence, the control efficiency of the MTMD firstly increases to a peak with the augment of the frequency bandwidth ratio. However, when the frequency bandwidth ratio increases, the frequency difference between two adjacent TMDs increases. Then, only some discrete frequencies can be controlled, which accounts for the decreasing of the control efficiency.
- The performance of the MTMD with small frequency bandwidth ratios is sensitive to the frequency variation, but it can be obviously alleviated when utilizing high frequency bandwidth ratios. That means increasing the frequency bandwidth ratio can improve the robustness of the MTMD.
- The preferred mechanical parameters of the MTMD can be easily determined by the presented step-updating framework. With the MTMD application, the buffeting responses of the long-span triple-tower suspension bridge under strong winds can be effectively mitigated.
Acknowledgments
The authors would like to gratefully acknowledge the supports from the National Basic Research Program of China (973 Program) (Grant No. 2015CB060000), the National Science Foundation of China (Grant No. 51378111), the Fundamental Research Funds for the Central Universities (Grant No. 2242015K42028), the Funding of Jiangsu Innovation Program for Graduate Education (Grant No. KYLX16_0258), the Scientific Research Foundation of Graduate School of Southeast University (Grant No. YBJJ1659), the National Project Funded by the China Scholarship Council (Grant No. 201606090054), and the Project of Innovation-Driven Planning in Central South University (2015CX006).
Author Contributions
All authors discussed and agreed upon the idea and made scientific contributions. Tianyou Tao did the numerical simulation and parametric analyses. Hao Wang and Tianyou Tao wrote the paper and completed the revisions. Chengyuan Yao and Xuhui He gave some reasonable suggestions in simulation and participated in the revisions of the manuscript.
Conflicts of Interest
The authors declare no conflict of interest.
References
- Kareem, A. Structure of wind field over the ocean. In Proceedings of the International Workshop on Offshore Winds and Icing, Halifax, NS, Canada, 7–11 October 1985. [Google Scholar]
- Tao, T.Y.; Wang, H.; Wu, T. Comparative study of the wind characteristics of a strong wind event based on stationary and nonstationary models. ASCE J. Struct. Eng. 2016, 143, 04016230. [Google Scholar] [CrossRef]
- Li, L.X.; Kareem, A.; Xiao, Y.Q.; Song, L.L.; Zhou, C.Z. A comparative study of field measurements of the turbulence characteristics of typhoon and hurricane winds. J. Wind Eng. Ind. Aerodyn. 2015, 140, 49–66. [Google Scholar] [CrossRef]
- Wang, H.; Tao, T.Y.; Cheng, H.Y.; Li, A.Q. A simulation study on the optimal control of buffeting displacement for the Sutong Bridge with multiple tuned mass dampers. J. Zhejiang Univ. Sci. A 2014, 15, 798–812. [Google Scholar] [CrossRef]
- Simiu, E.; Scanlan, R.H. Wind Effects on Structures: Fundamentals and Applications to Design, 3rd ed.; John Wiley & Sons, Inc.: New York, NY, USA, 1996. [Google Scholar]
- Xu, Y.L.; Sun, D.K.; Ko, J.M.; Lin, J.H. Buffeting analysis of long-span bridges: A new algorithm. Comput. Struct. 1998, 68, 303–313. [Google Scholar] [CrossRef]
- Cai, C.S.; Albrecht, P.; Bosch, H.R. Flutter and buffeting analysis. I: Finite-element and RPE solution. ASCE J. Bridge Eng. 1999, 4, 174–180. [Google Scholar] [CrossRef]
- Cai, C.S.; Albrecht, P.; Bosch, H.R. Flutter and buffeting analysis. II: Luling and Deer Isle Bridges. ASCE J. Bridge Eng. 1999, 4, 181–188. [Google Scholar] [CrossRef]
- Zhu, L.D.; Xu, Y.L. Buffeting response of long-span cable-supported bridges under skew winds. Part 1: Theory. J. Sound Vib. 2005, 281, 647–673. [Google Scholar] [CrossRef]
- Wang, H.; Hu, R.M.; Xie, J.; Tong, T. Comparative study on buffeting performance of Sutong Bridge based on design and measured spectrum. ASCE J. Bridge Eng. 2013, 18, 587–600. [Google Scholar] [CrossRef]
- Xu, Y.L.; Zhu, L.D. Buffeting response of long-span cable-supported bridges under skew winds. Part 2: Case study. J. Sound Vib. 2005, 281, 675–697. [Google Scholar] [CrossRef]
- Yoshida, O.; Okuda, M.; Moriya, T. Structural characteristics and applicability of four-span suspension bridge. ASCE J. Bridge Eng. 2004, 9, 453–464. [Google Scholar] [CrossRef]
- Ge, Y.J.; Xiang, H.F. Extension of bridging capacity of cable-supported bridges using double main spans or twin parallel deck solutions. Struct. Infrastruct. Eng. 2011, 7, 551–567. [Google Scholar] [CrossRef]
- Fukuda, T. Analysis of multi-span suspension bridges. ASCE J. Struct. Div. 1967, 93, 63–87. [Google Scholar]
- Thai, H.T.; Choi, D.H. Advanced analysis of multi-span suspension bridges. J. Constr. Steel Res. 2013, 90, 29–41. [Google Scholar] [CrossRef]
- Choi, D.H.; Gwon, S.G.; Yoo, H.; Na, H.S. Nonlinear static analysis of continuous multi-span suspension bridges. Int. J. Steel Struct. 2013, 13, 103–115. [Google Scholar] [CrossRef]
- Chen, A.R. Wind-Resistant Research on the Taizhou Yangtze River Highway Bridge; Research Report of Tongji University: Shanghai, China, 2006. (In Chinese) [Google Scholar]
- Zhang, X.J. Study of structural parameters on the aerodynamic stability of three-tower suspension bridge. Wind Struct. 2010, 13, 471–485. [Google Scholar] [CrossRef]
- Wang, H.; Tao, T.Y.; Zhou, R.; Hua, X.G.; Kareem, A. Parameter sensitivity study on flutter stability of a long-span triple-tower suspension bridge. J. Wind Eng. Ind. Aerodyn. 2014, 128, 12–21. [Google Scholar] [CrossRef]
- Housner, G.; Bergman, L.A.; Caughey, T.K.; Chassiakos, A.G. Structural control: Past, present, and future. ASCE J. Eng. Mech. 1997, 123, 897–971. [Google Scholar] [CrossRef]
- Spencer, B.F., Jr.; Nagarajaiah, S. State of the art of structural control. ASCE J. Struct. Eng. 2003, 129, 845–856. [Google Scholar] [CrossRef]
- Pnevmatikos, N.G.; Gantes, C.J. Sliding mode control for structures based on the frequency content of the earthquake loading. Smart Struct. Syst. 2009, 5, 209–221. [Google Scholar] [CrossRef]
- Pnevmatikos, N.G. New strategy for controlling structures collapse against earthquakes. Nat. Sci. 2012, 4, 667–676. [Google Scholar] [CrossRef]
- Pnevmatikos, N.G. Pole placement algorithm for control of civil structures subjected to earthquake excitation. J. Appl. Comput. Mech. 2017, 3, 25–36. [Google Scholar]
- Fujino, Y.; Abe, M. Design formulas for tuned mass dampers based on a perturbation technique. Earthq. Eng. Struct. Dyn. 1993, 22, 833–854. [Google Scholar] [CrossRef]
- Kareem, A.; Kline, S. Performance of multiple mass dampers under random loading. ASCE J. Struct. Eng. 1995, 121, 348–361. [Google Scholar] [CrossRef]
- Gu, M.; Chen, S.R.; Chang, C.C. Parametric study on multiple tuned mass dampers for buffeting control of Yangpu Bridge. J. Wind Eng. Ind. Aerodyn. 2001, 89, 987–1000. [Google Scholar] [CrossRef]
- Abe, M.; Fujino, Y. Dynamic characterization of multiple tuned mass dampers and some design formulas. Earthq. Eng. Struct. Dyn. 1994, 23, 813–835. [Google Scholar] [CrossRef]
- Igusa, T.; Xu, K. Vibration control using multiple tuned dampers. J. Sound Vib. 1994, 175, 491–503. [Google Scholar] [CrossRef]
- Davenport, A.G. Buffeting of a suspension bridge by storm winds. ASCE J. Struct. Eng. 1962, 88, 233–268. [Google Scholar]
- Isyumov, N.; Alan, G. Davenport’s mark on wind engineering. J. Wind Eng. Ind. Aerodyn. 2012, 104–106, 12–24. [Google Scholar] [CrossRef]
- Scanlan, R.H. The action of flexible bridges under wind: Buffeting theory. J. Sound Vib. 1978, 60, 187–199. [Google Scholar] [CrossRef]
- Chen, X.Z.; Kareem, A. Advances in modeling of aerodynamic forces on bridge decks. ASCE J. Eng. Mech. 2002, 128, 1193–1205. [Google Scholar] [CrossRef]
- Ding, Q.; Lee, P.K.K. Computer simulation of buffeting actions of suspension bridges under turbulent wind. Comput. Struct. 2000, 76, 787–797. [Google Scholar] [CrossRef]
- Hua, X.G.; Chen, Z.Q.; Ni, Y.Q.; Ko, J.M. Flutter analysis of long-span bridges using ANSYS. Wind Struct. 2007, 10, 61–82. [Google Scholar] [CrossRef]
- Deodatis, G. Simulation of ergodic multivariate stochastic processes. ASCE J. Eng. Mech. 1996, 122, 778–787. [Google Scholar] [CrossRef]
- Wang, H.; Li, A.Q.; Hu, R.M. Comparison of ambient vibration response of the Runyang suspension bridge under skew winds with time-domain numerical predictions. ASCE J. Bridge Eng. 2011, 16, 513–526. [Google Scholar] [CrossRef]
- Kaimal, J.C. Spectral characteristics of surface layer turbulence. J. R. Meteorol. Soc. 1972, 98, 563–589. [Google Scholar] [CrossRef]
- Panofsky, H.A.; McCormick, R.A. The spectrum of vertical velocity near the surface. J. R. Meteorol. Soc. 1960, 86, 546–564. [Google Scholar] [CrossRef]
- Davenport, A.G. The dependence of wind load upon meteorological parameters. In Proceedings of the International Research Seminar on Wind Effects on Building and Structures; University of Toronto Press: Toronto, ON, Canada, 1968. [Google Scholar]
Figure 1.
Geographical location of Taizhou Bridge.

Figure 2.
Schematic description of Taizhou Bridge: (a) Elevation (unit: m); (b) Section of the main girder (unit: mm).
Figure 2.
Schematic description of Taizhou Bridge: (a) Elevation (unit: m); (b) Section of the main girder (unit: mm).

Figure 3.
Finite element model of Taizhou Bridge.

Figure 4.
Typical fundamental modal shapes of Taizhou Bridge: (a) AS-L-1; (b) AS-V-1; (c) S-L-1; (d) S-V-1; (e) AS-T-1; (f) S-T-1. AS—Antisymmetric; S—Symmetric; V—Vertical; L—Lateral; T—Torsional. The number represents the order.
Figure 4.
Typical fundamental modal shapes of Taizhou Bridge: (a) AS-L-1; (b) AS-V-1; (c) S-L-1; (d) S-V-1; (e) AS-T-1; (f) S-T-1. AS—Antisymmetric; S—Symmetric; V—Vertical; L—Lateral; T—Torsional. The number represents the order.

Figure 5.
FE model of Taizhou Bridge with MATRIX27 element included.

Figure 6.
Layout of simulated points for the fluctuating wind field.

Figure 7.
Typical samples from the simulated fluctuating wind field: (a) Along-wind case; (b) Vertical case.
Figure 7.
Typical samples from the simulated fluctuating wind field: (a) Along-wind case; (b) Vertical case.
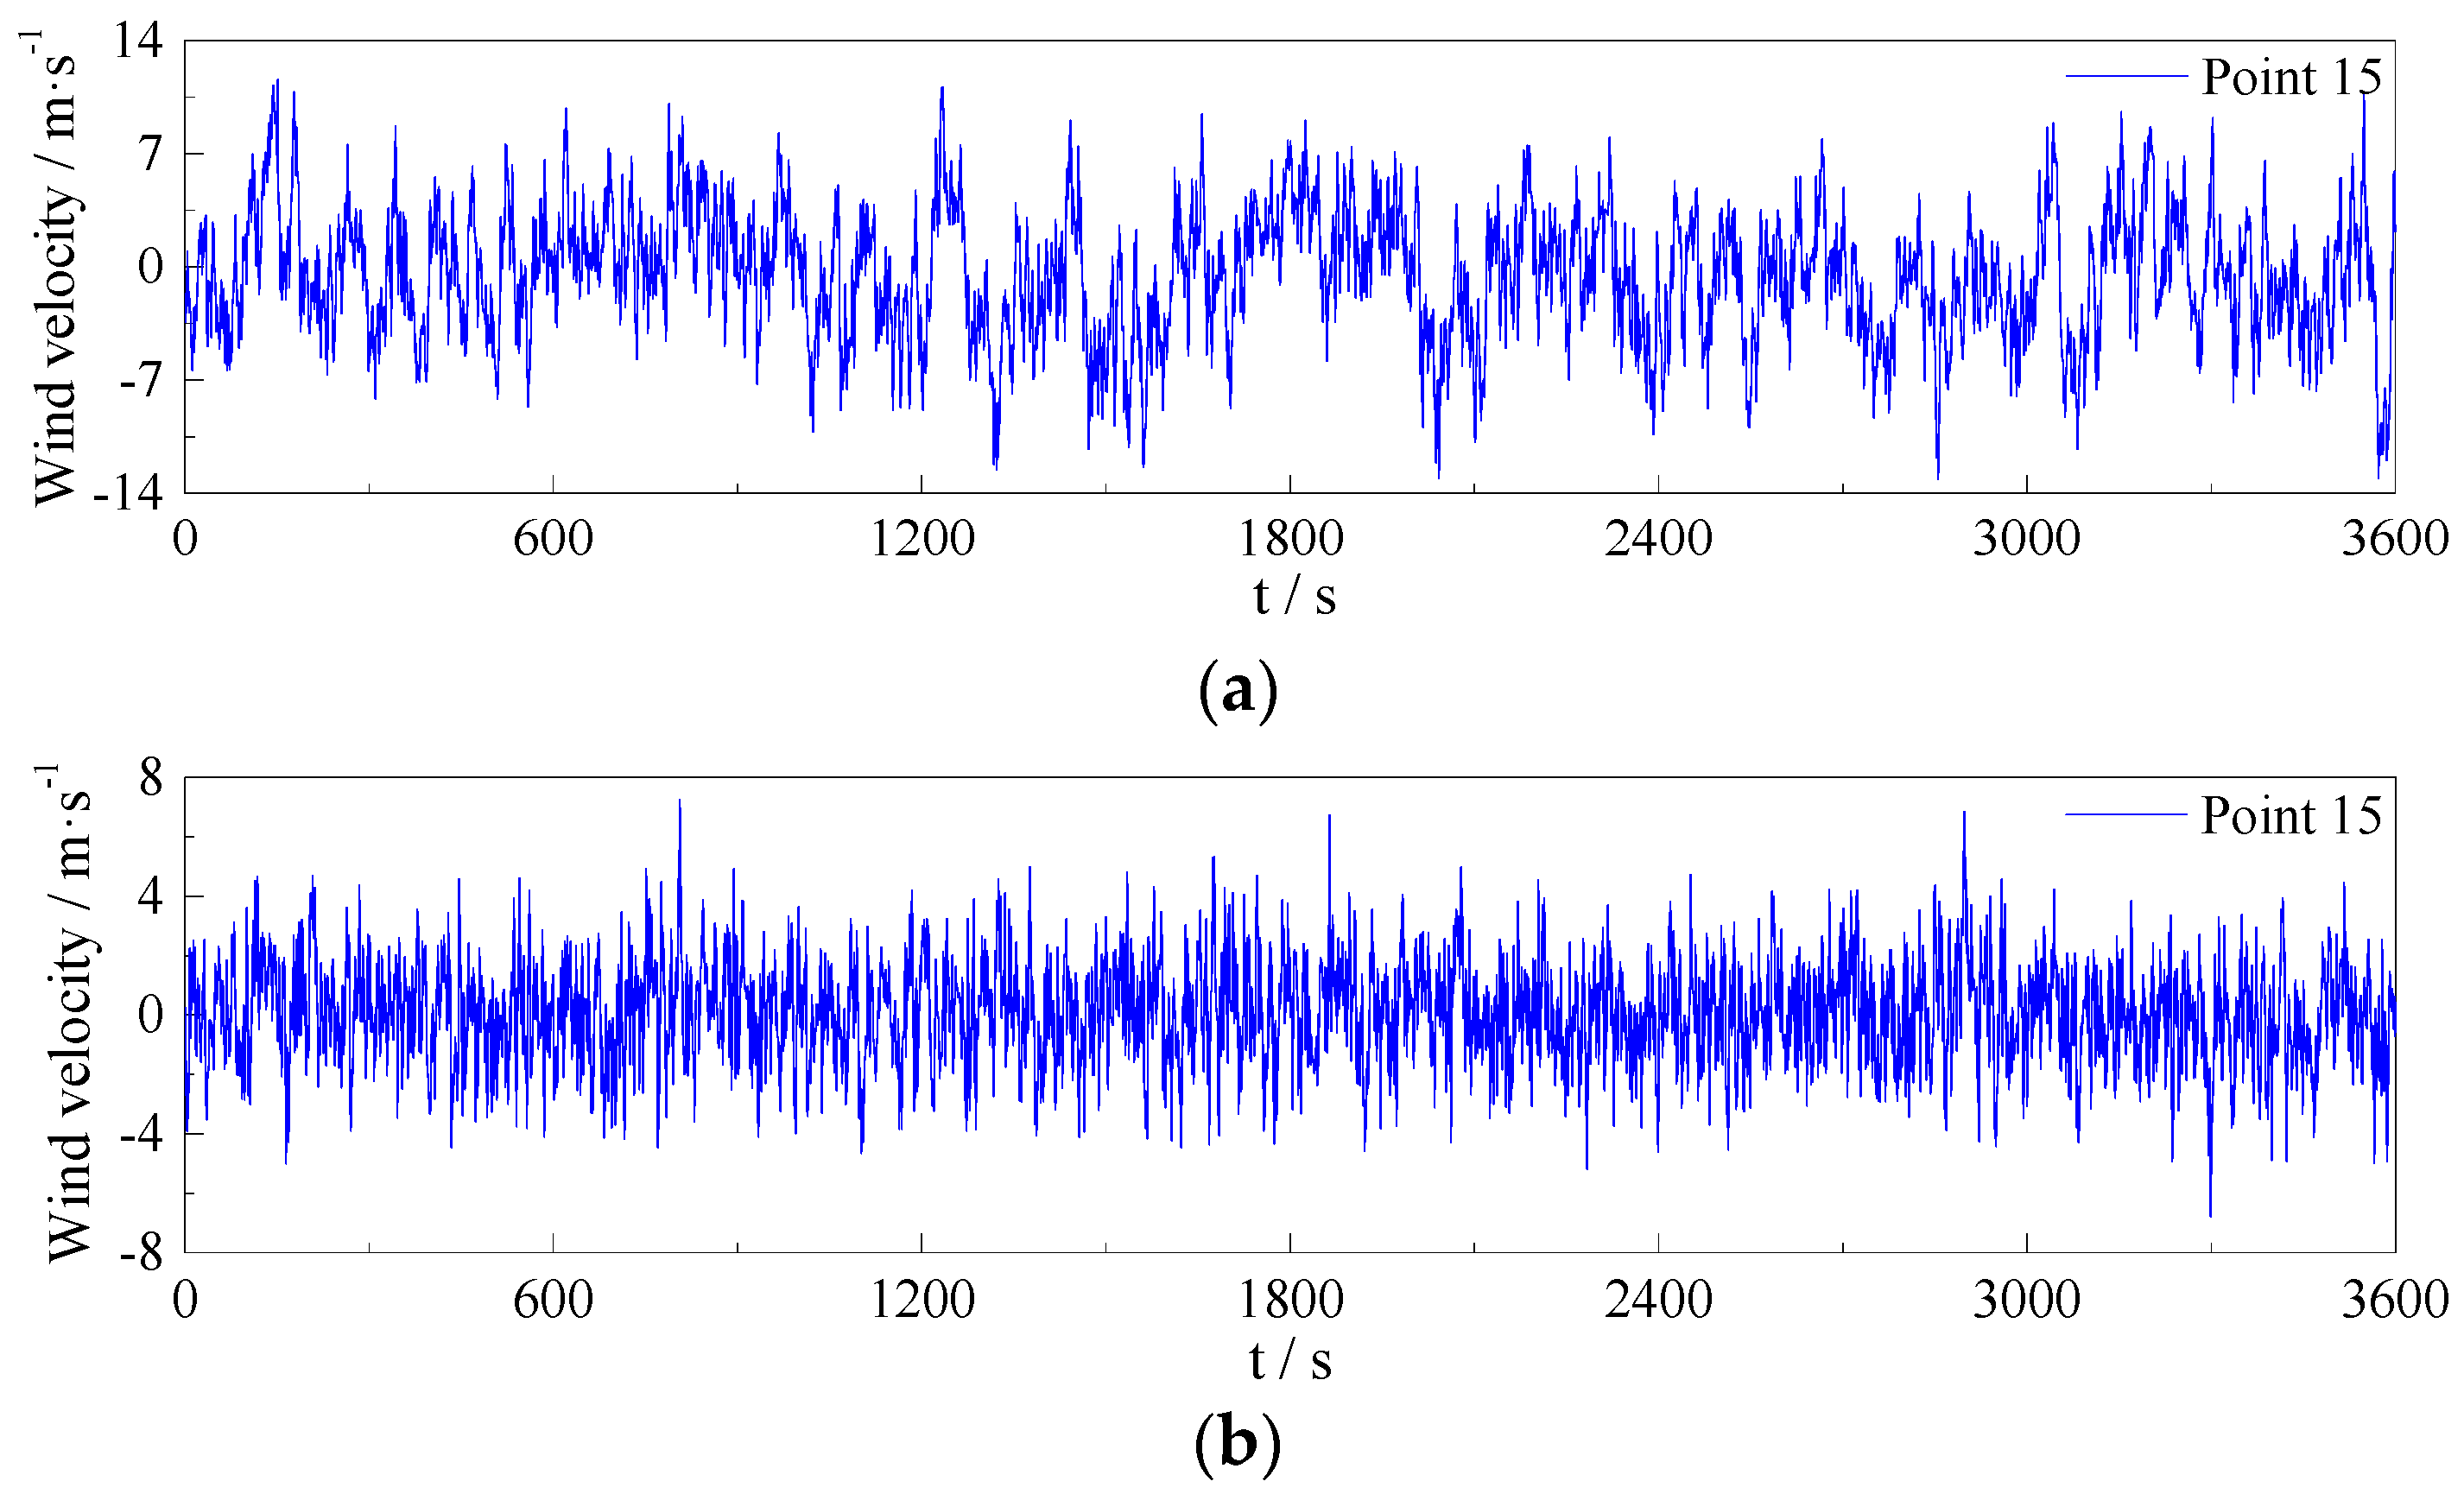
Figure 8.
Comparison of the PSD of the simulated wind velocity and the target function: (a) Along-wind case; (b) Vertical case.
Figure 8.
Comparison of the PSD of the simulated wind velocity and the target function: (a) Along-wind case; (b) Vertical case.
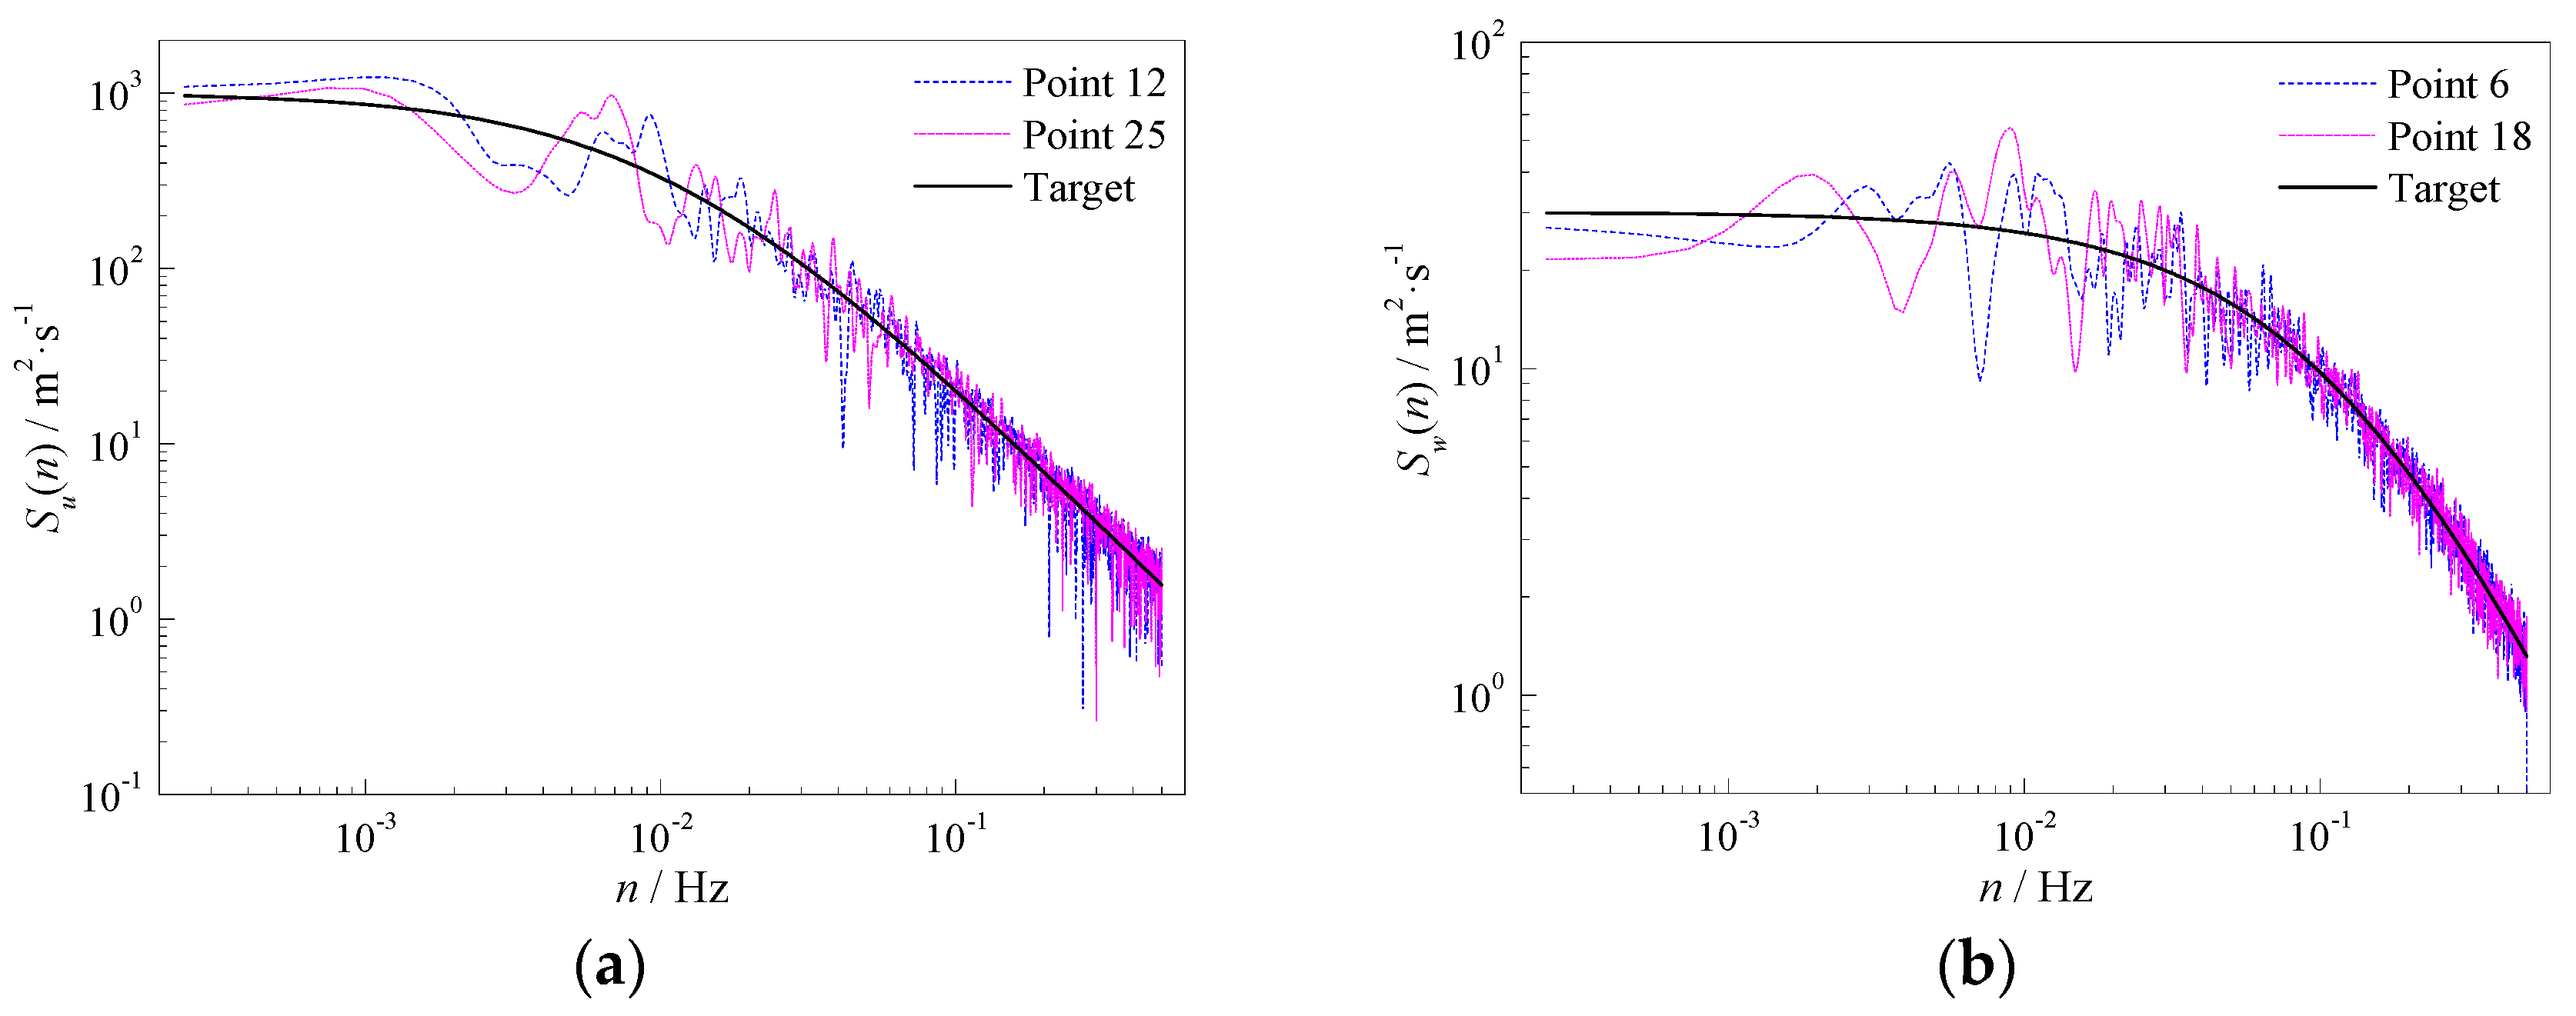
Figure 9.
Cross-correlation functions of the simulated wind samples with comparison to target values: (a) Along-wind case; (b) Vertical case.
Figure 9.
Cross-correlation functions of the simulated wind samples with comparison to target values: (a) Along-wind case; (b) Vertical case.
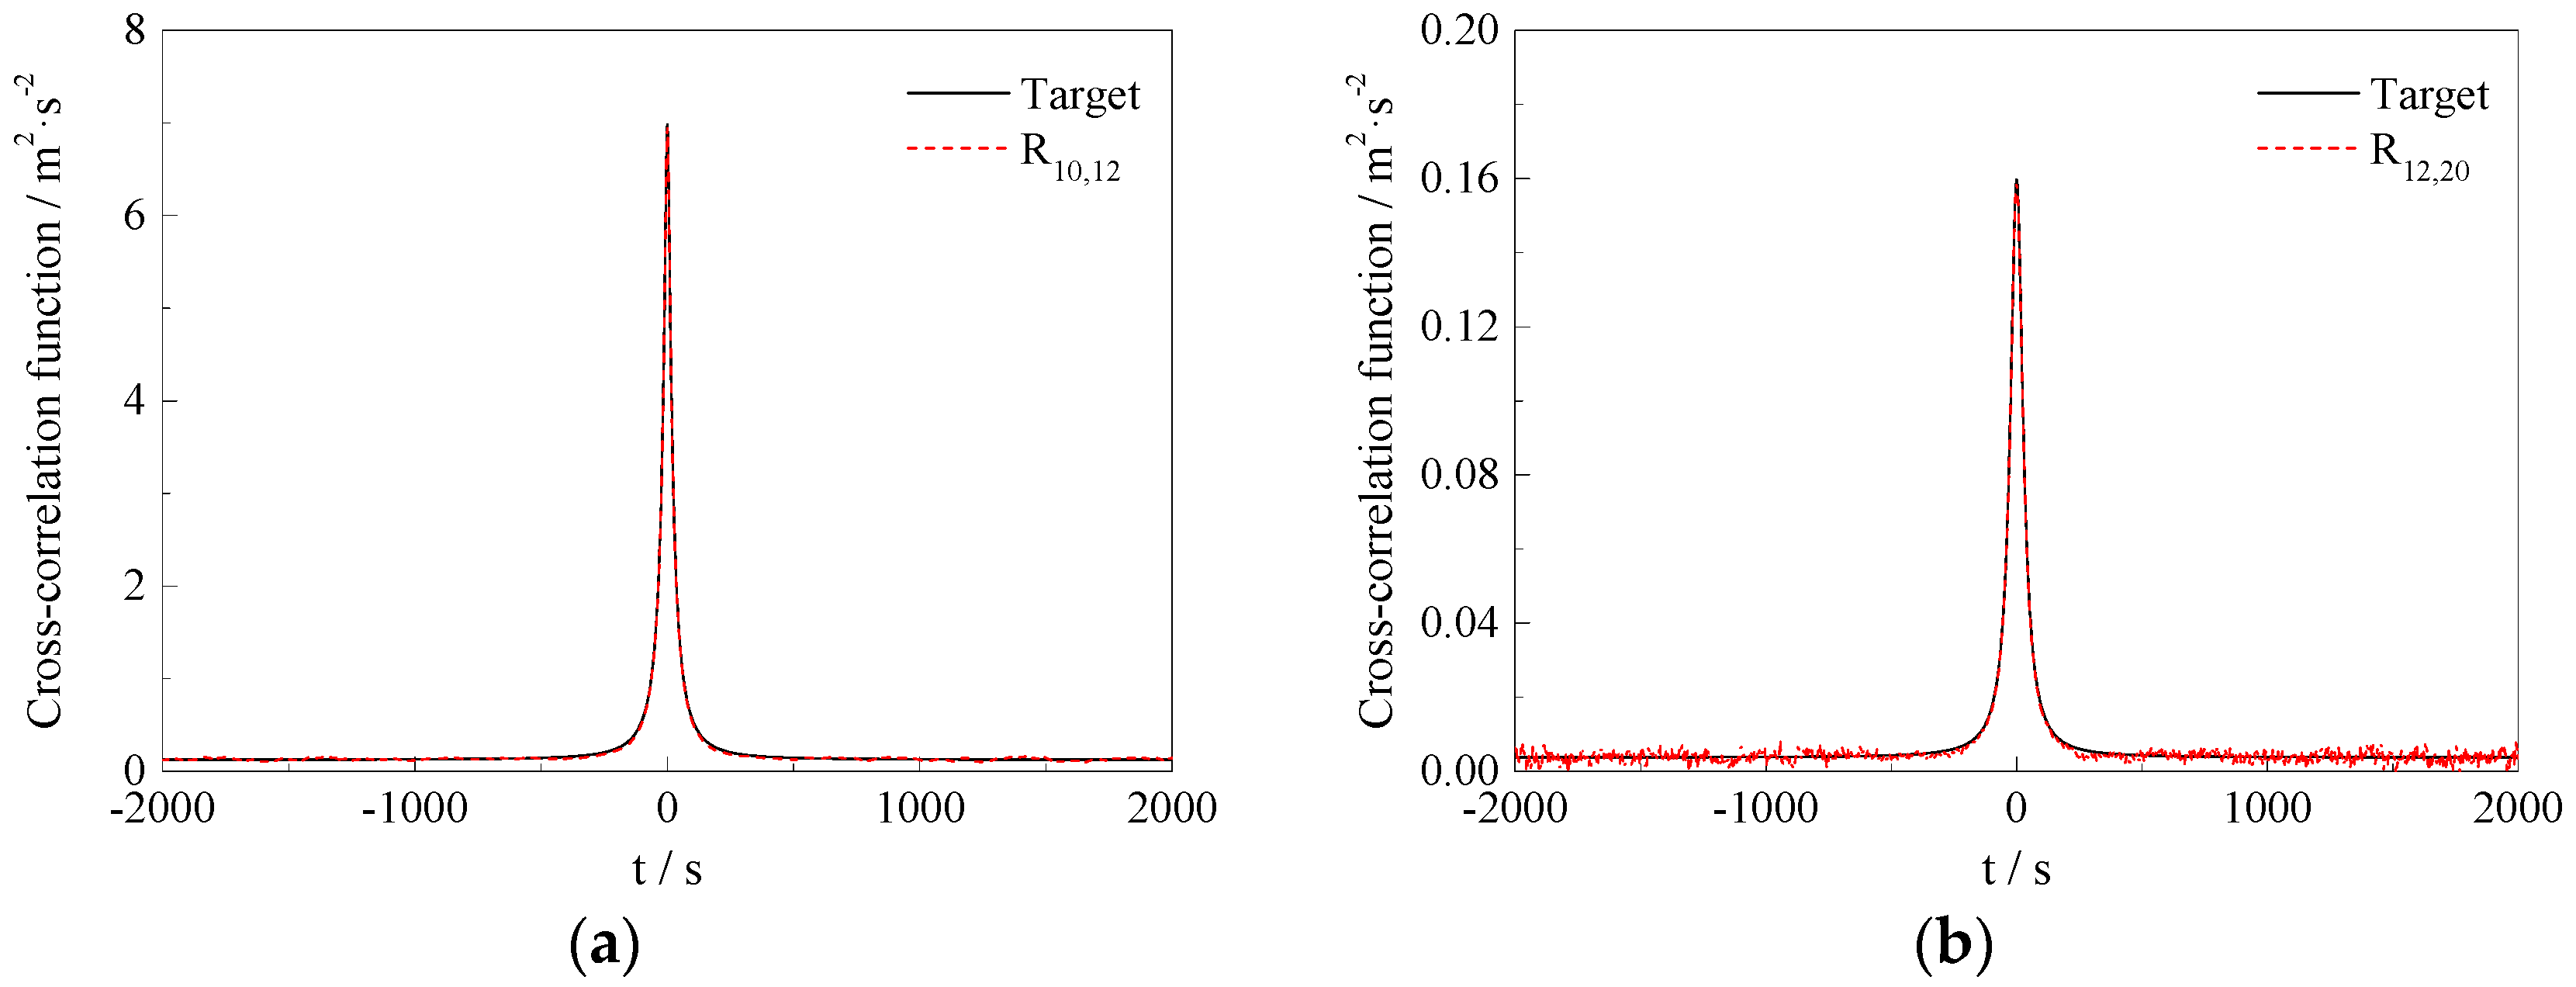
Figure 10.
RMS distribution of the buffeting displacements of the main girder: (a) Lateral case; (b) Vertical case; (c) Torsional case.
Figure 10.
RMS distribution of the buffeting displacements of the main girder: (a) Lateral case; (b) Vertical case; (c) Torsional case.


Figure 11.
Buffeting displacements in the middle of the main girder in one span: (a) Lateral case; (b) Vertical case; (c) Torsional case.
Figure 11.
Buffeting displacements in the middle of the main girder in one span: (a) Lateral case; (b) Vertical case; (c) Torsional case.

Figure 12.
Time-frequency spectrum of the buffeting displacements: (a) Lateral; (b) Vertical.

Figure 13.
Distribution of the MTMD system in the main girder: (a) Top view; (b) in the main girder.
Figure 13.
Distribution of the MTMD system in the main girder: (a) Top view; (b) in the main girder.
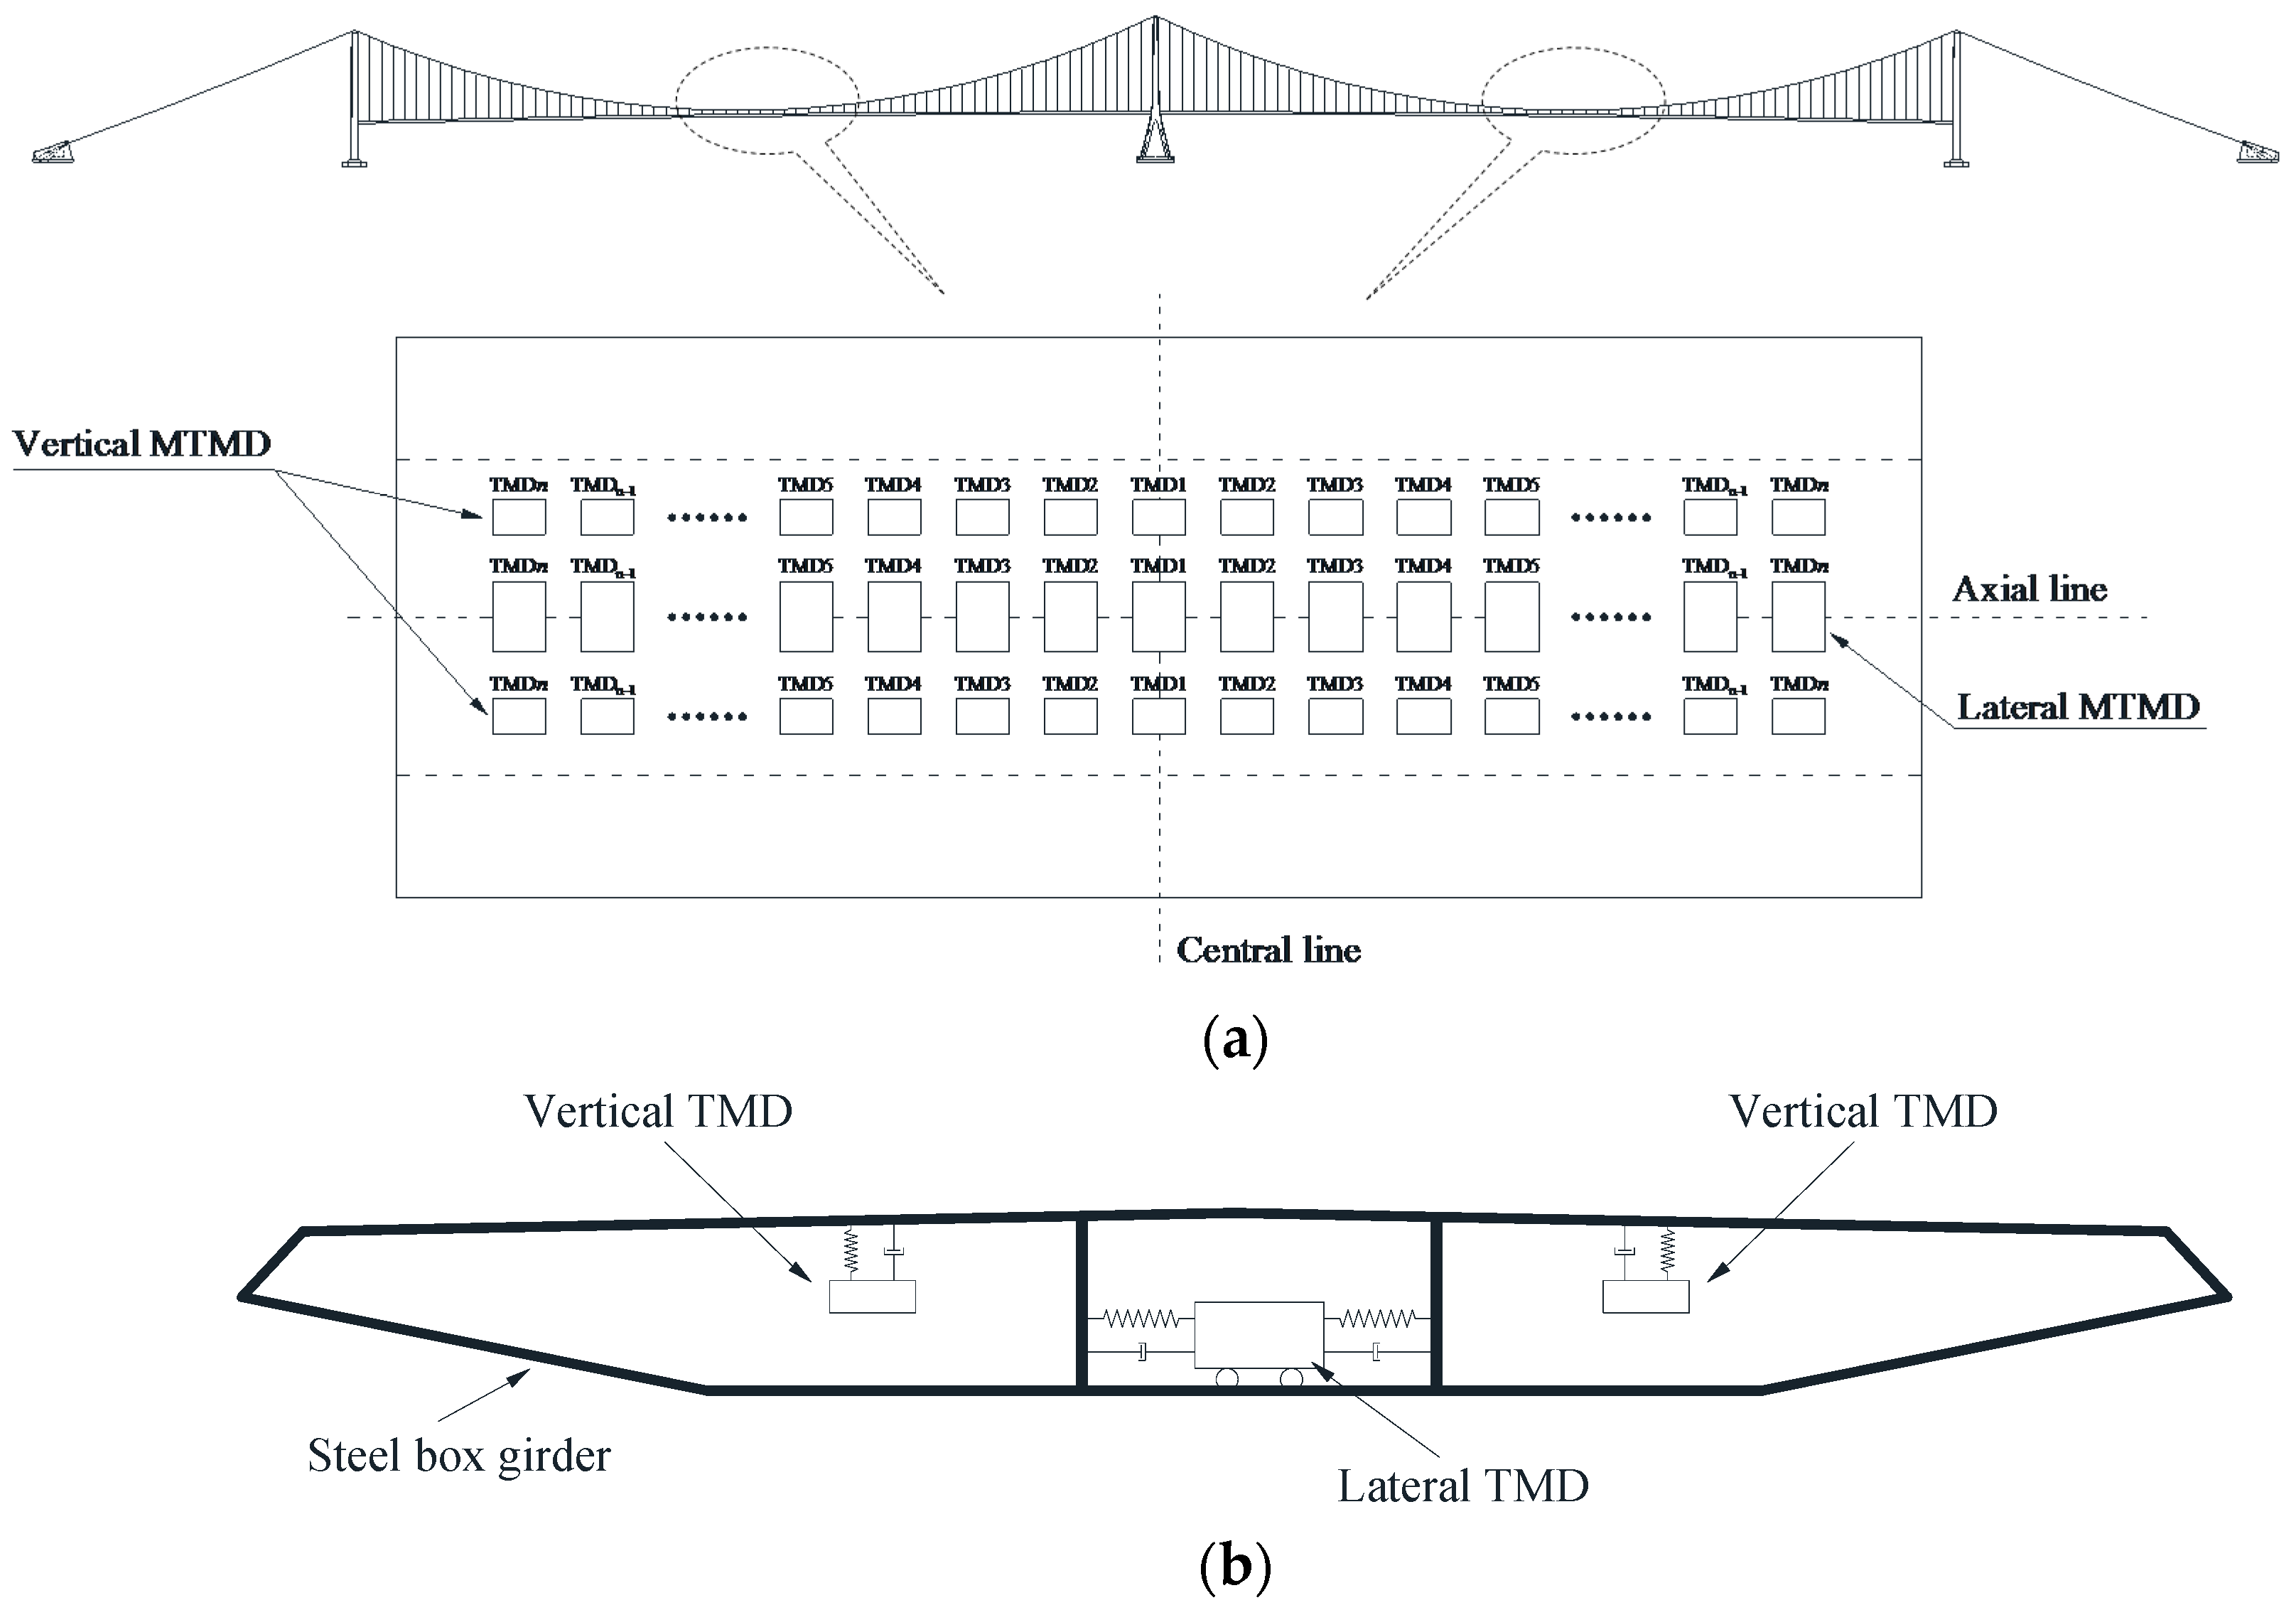
Figure 14.
Step-updating framework for the determination of the main parameters.
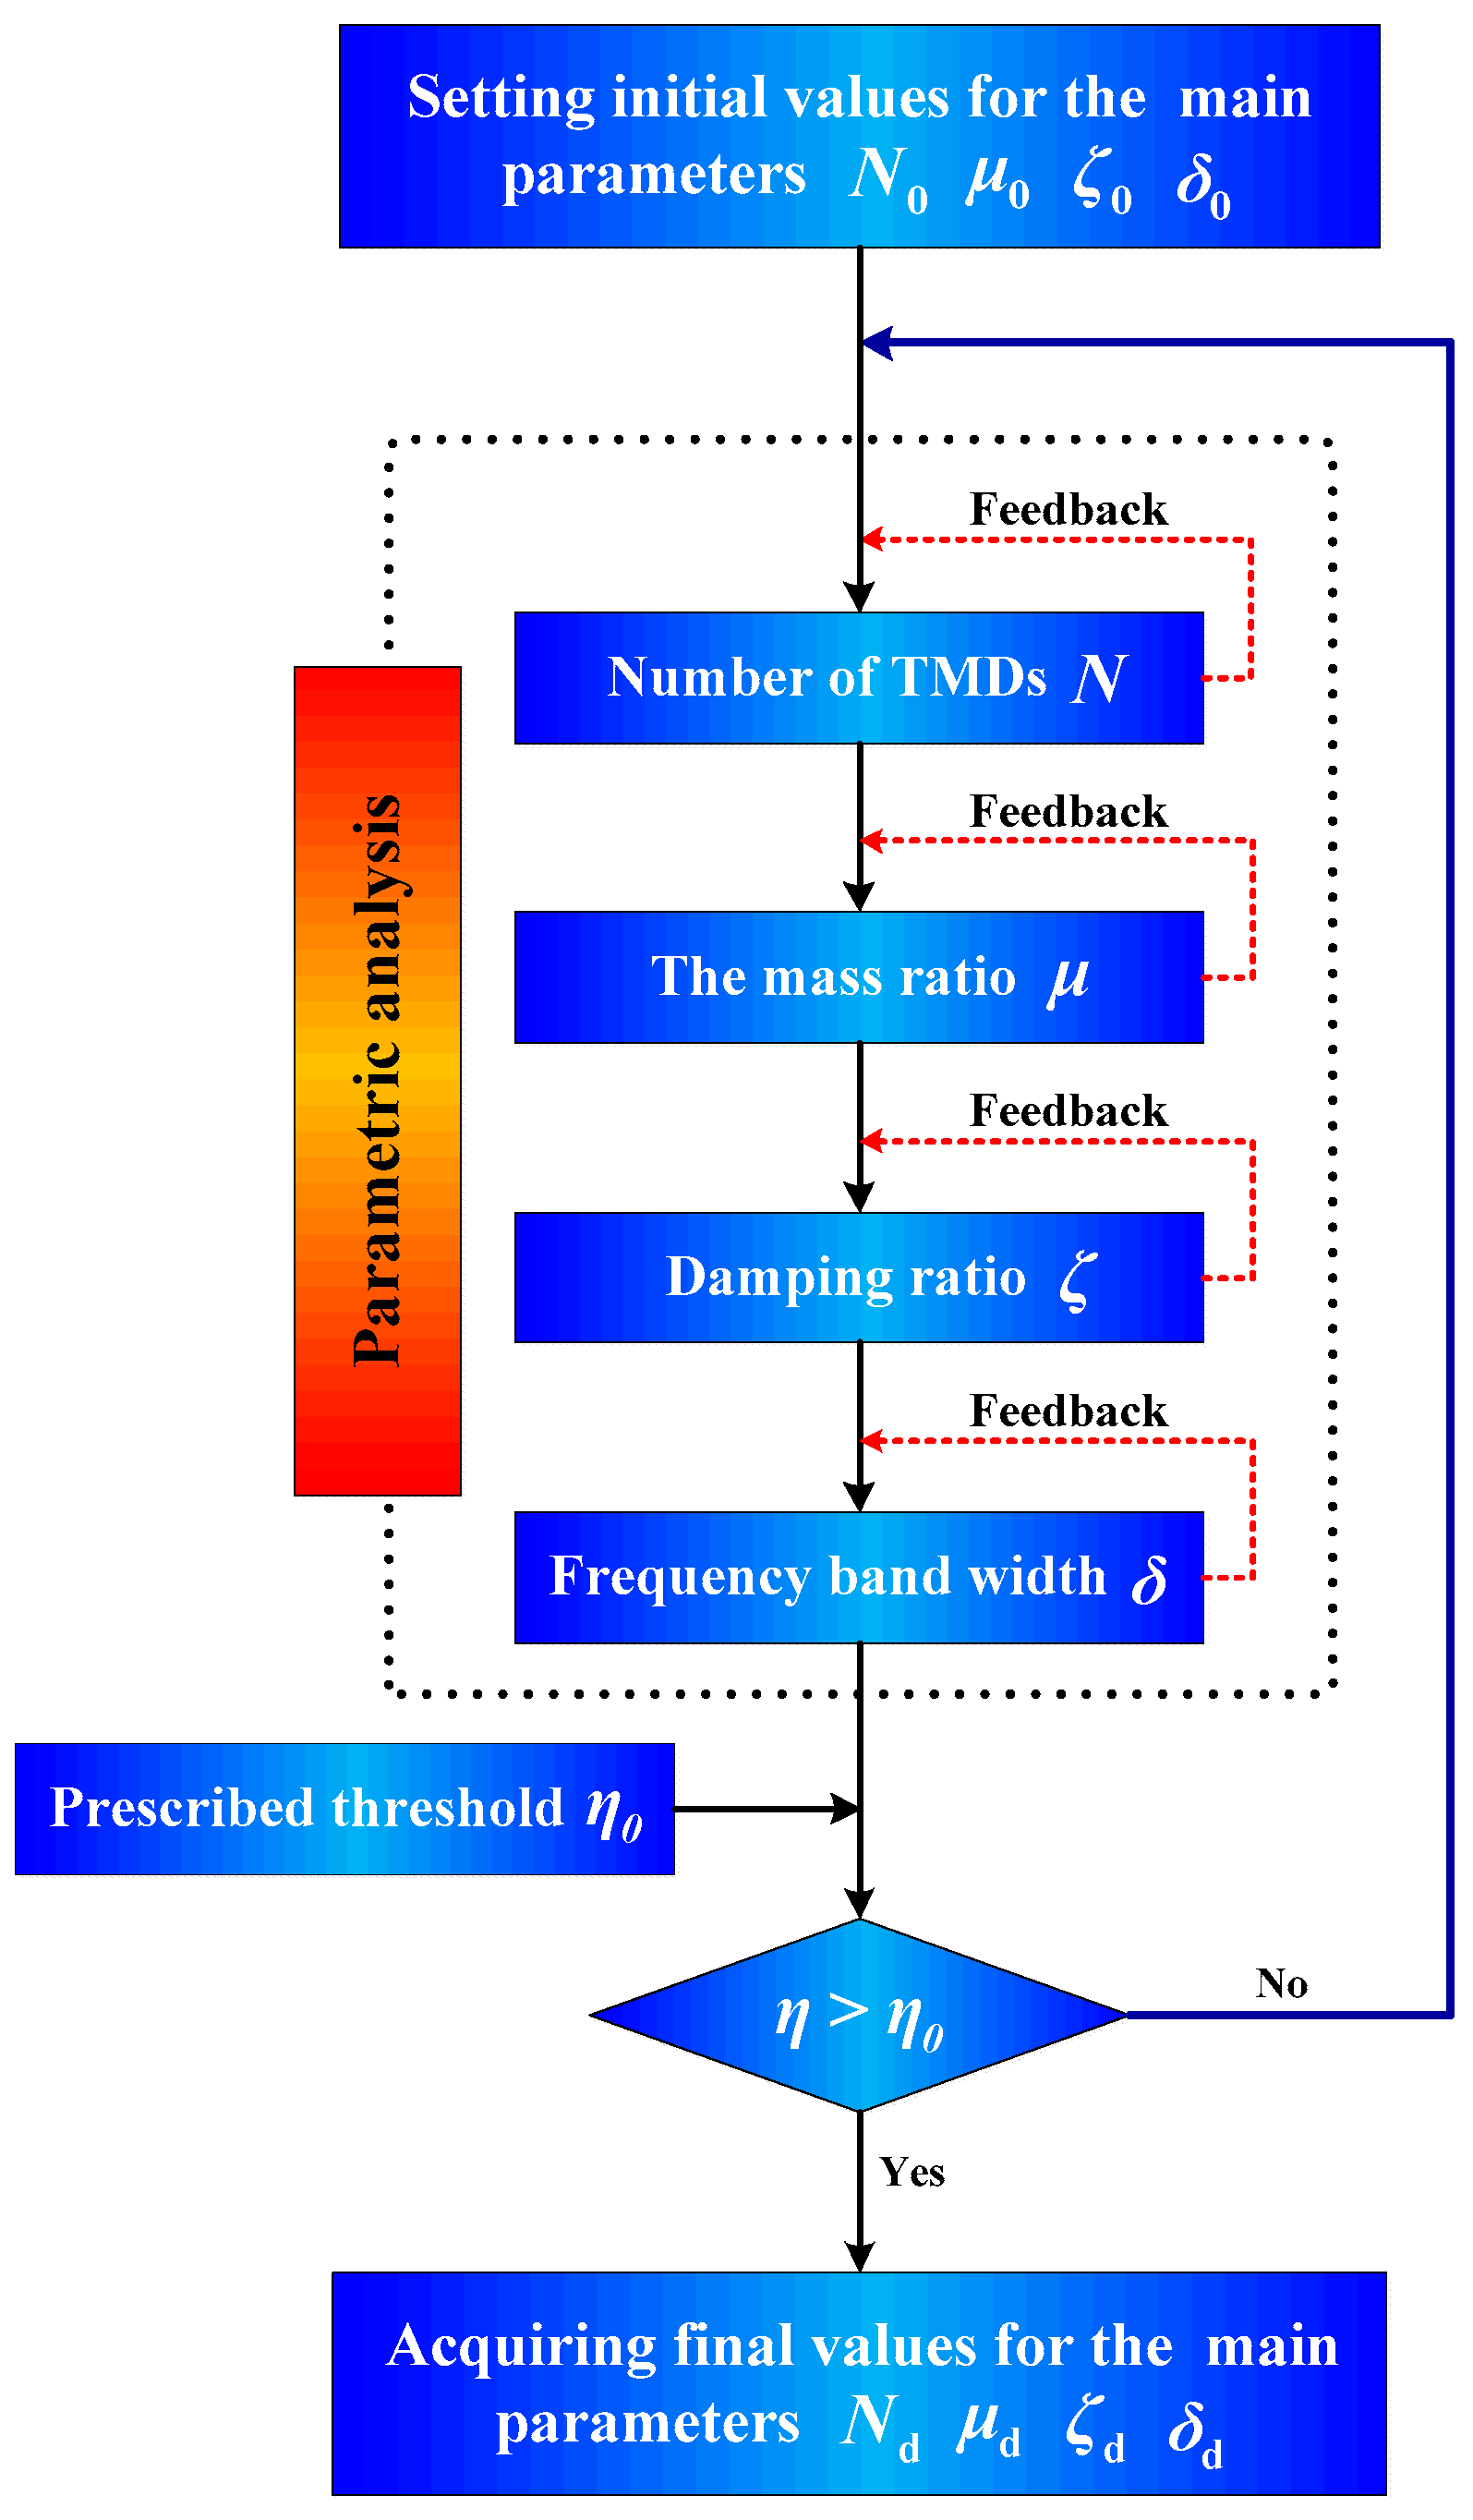
Figure 15.
Influence of the number of TMDs on the control efficiency of MTMD: (a) Lateral case; (b) Vertical case.
Figure 15.
Influence of the number of TMDs on the control efficiency of MTMD: (a) Lateral case; (b) Vertical case.
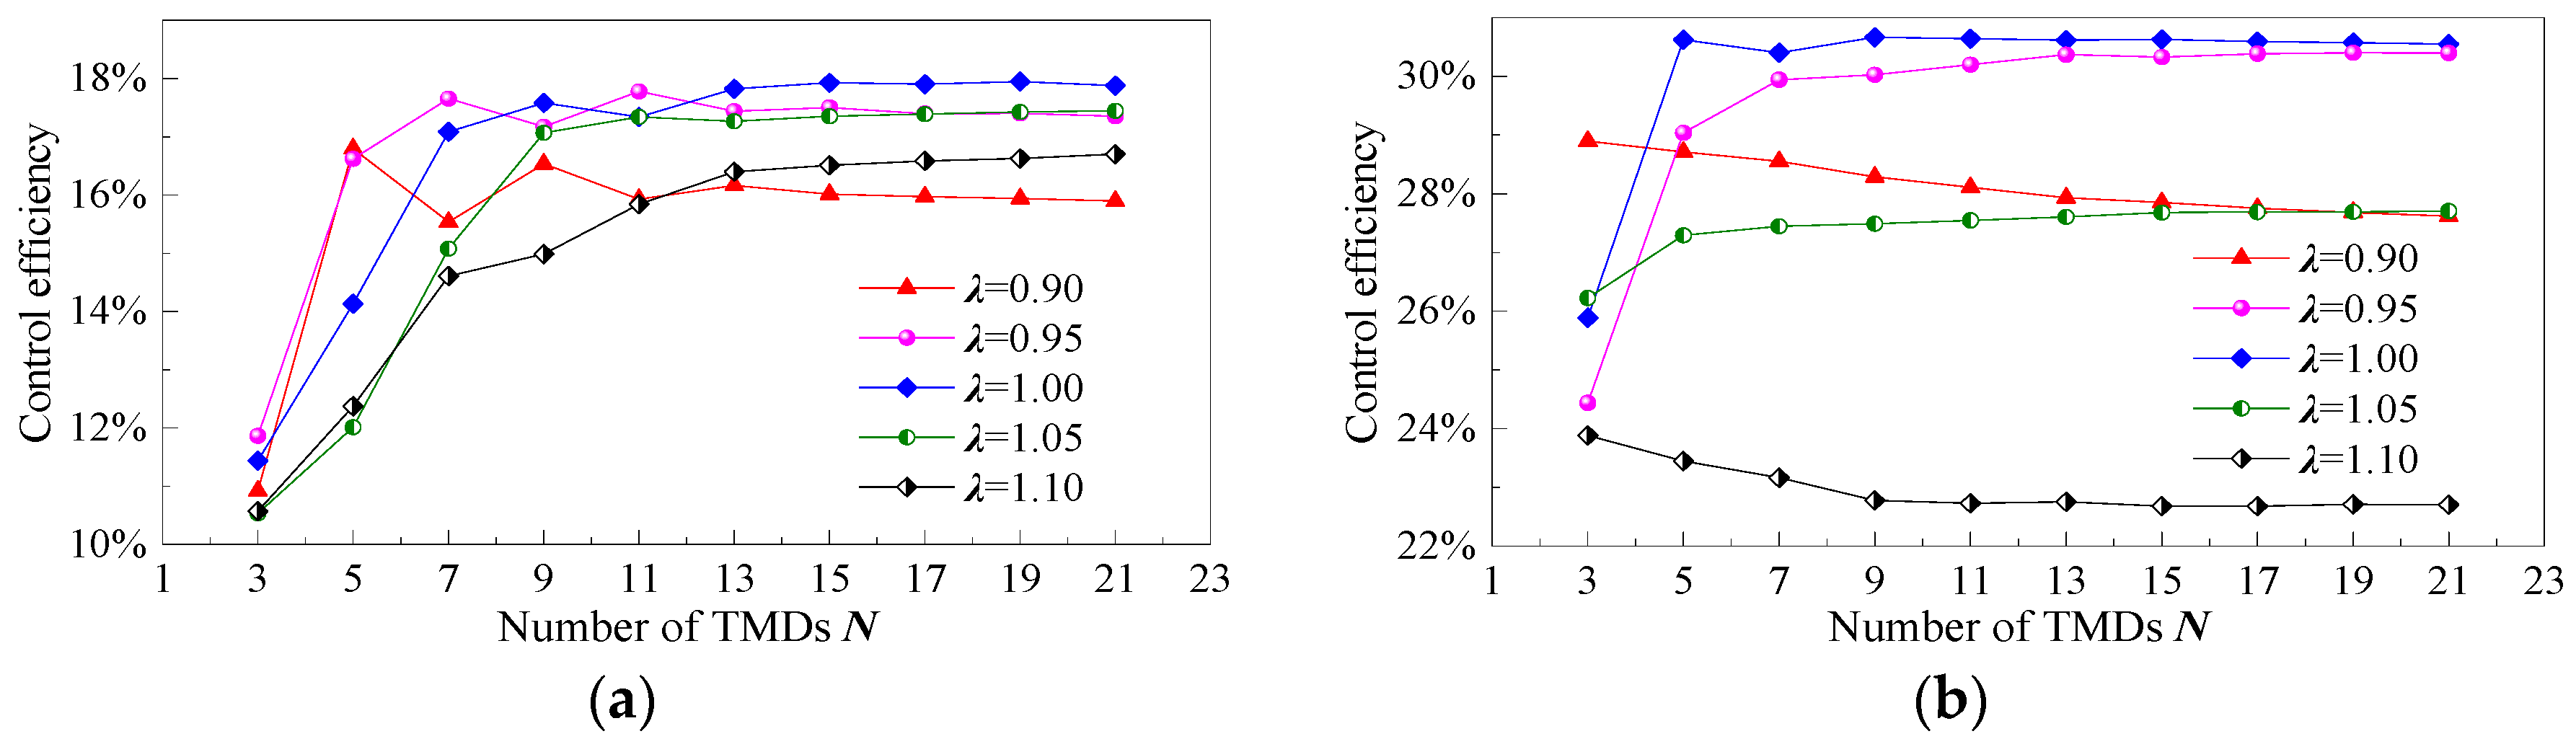
Figure 16.
Influence of the mass ratio on the control efficiency of MTMD: (a) Lateral case; (b) Vertical case.
Figure 16.
Influence of the mass ratio on the control efficiency of MTMD: (a) Lateral case; (b) Vertical case.
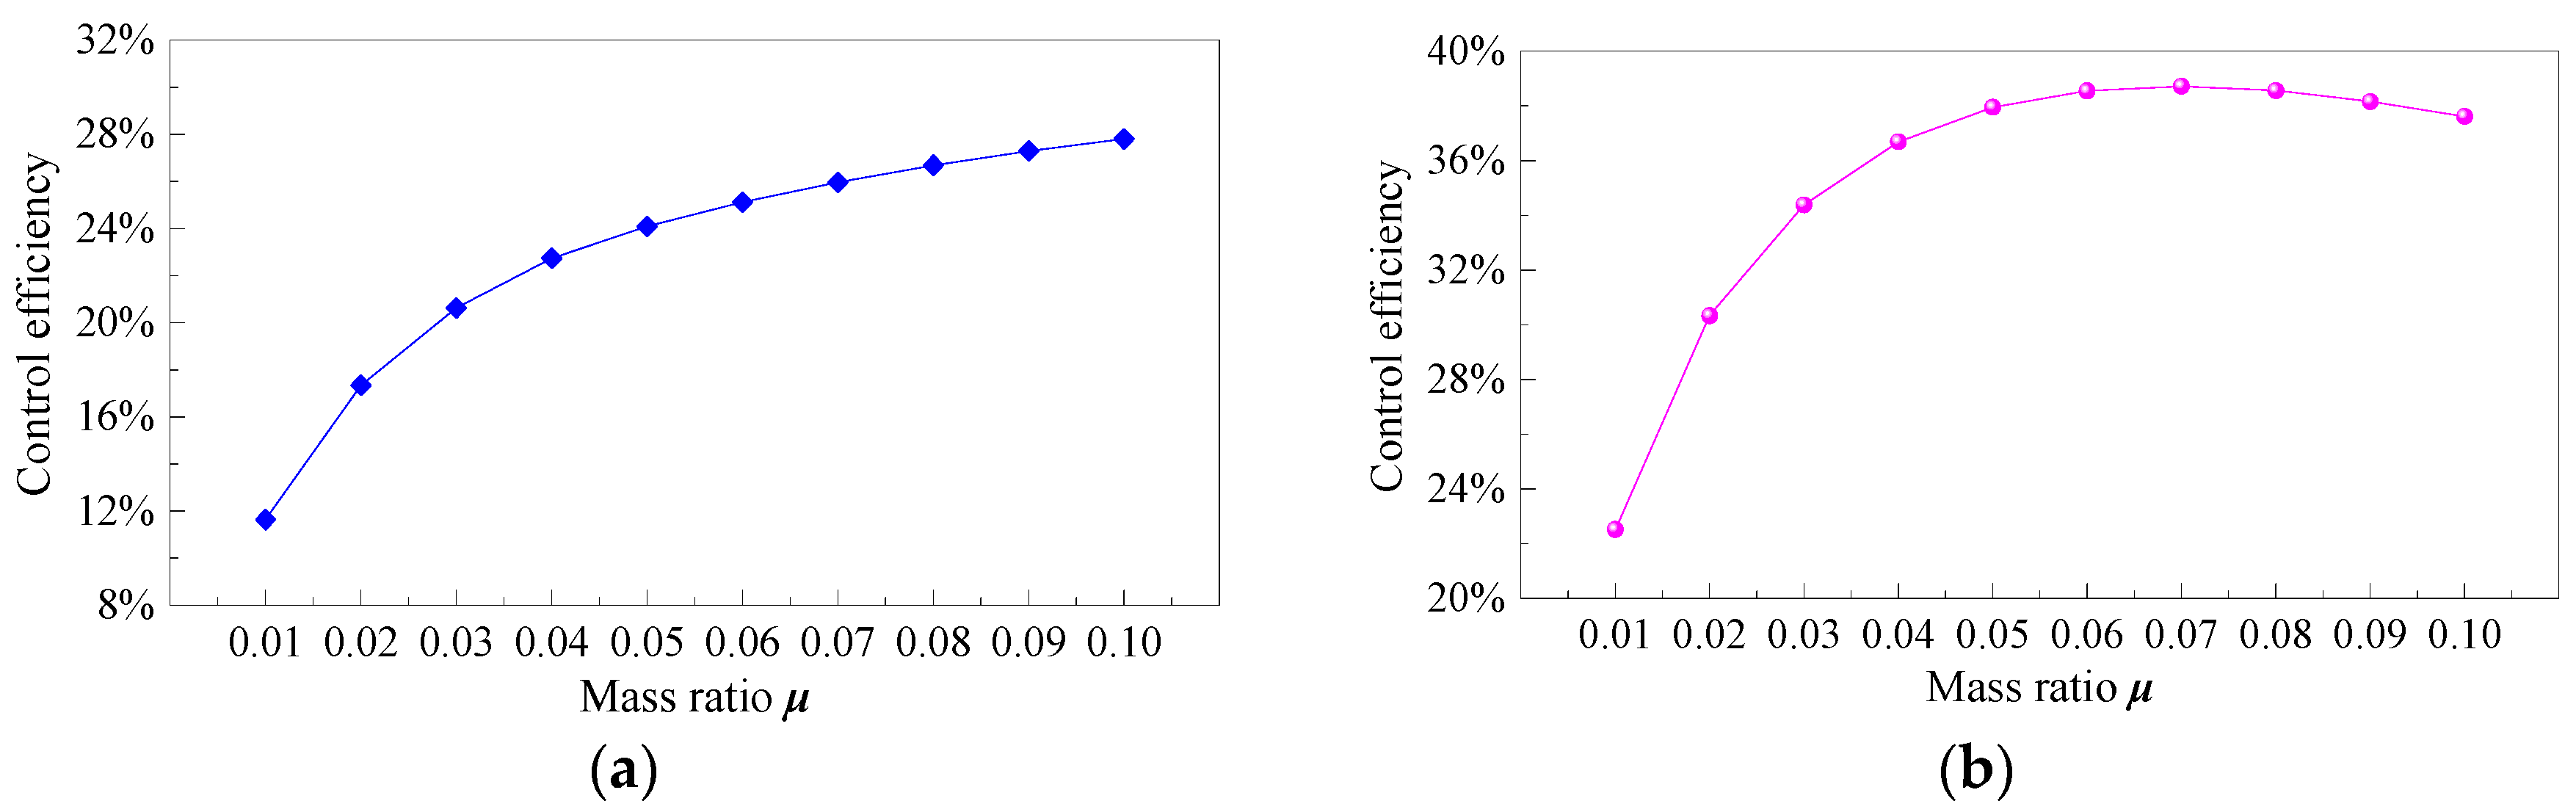
Figure 17.
Influence of the damping ratio on the control efficiency of MTMD: (a) Lateral case; (b) Vertical case.
Figure 17.
Influence of the damping ratio on the control efficiency of MTMD: (a) Lateral case; (b) Vertical case.
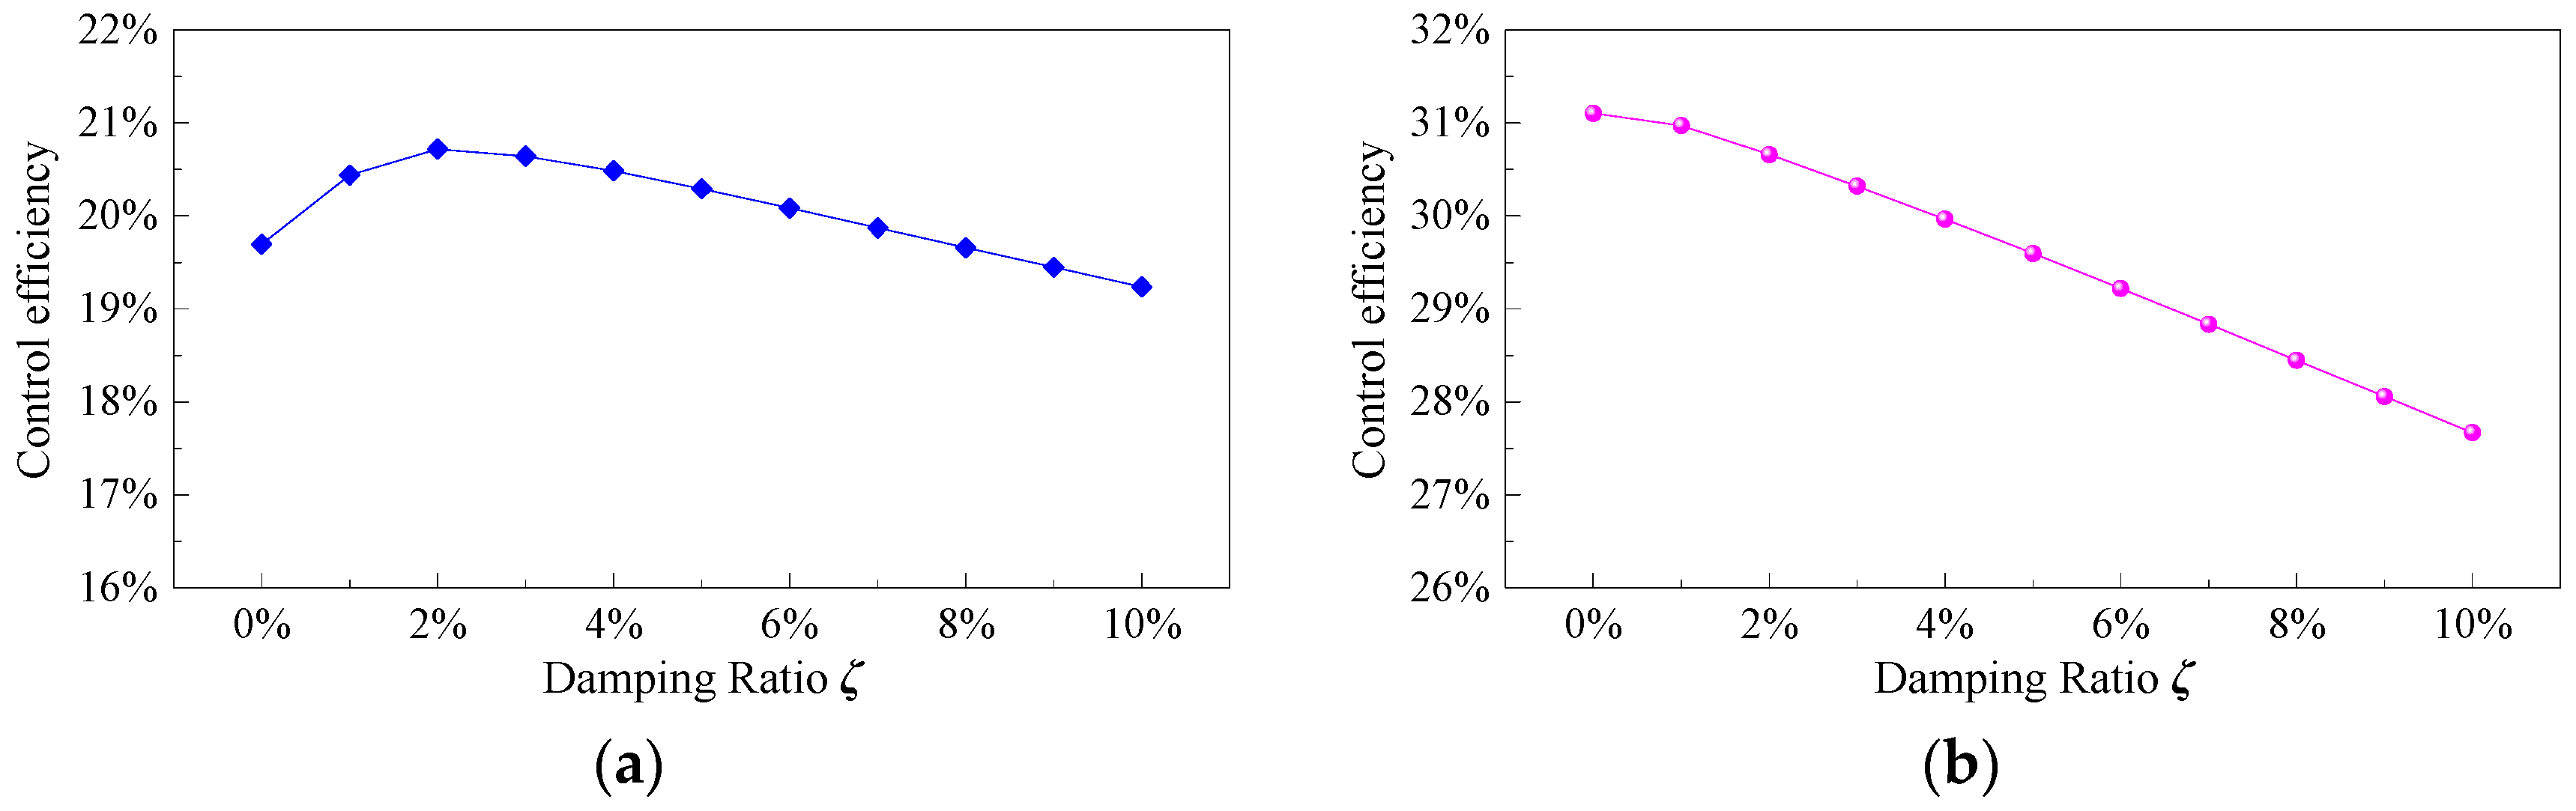
Figure 18.
Influence of the frequency bandwidth ratio on the control efficiency of MTMD: (a) Lateral caese; (b) Vertical case.
Figure 18.
Influence of the frequency bandwidth ratio on the control efficiency of MTMD: (a) Lateral caese; (b) Vertical case.
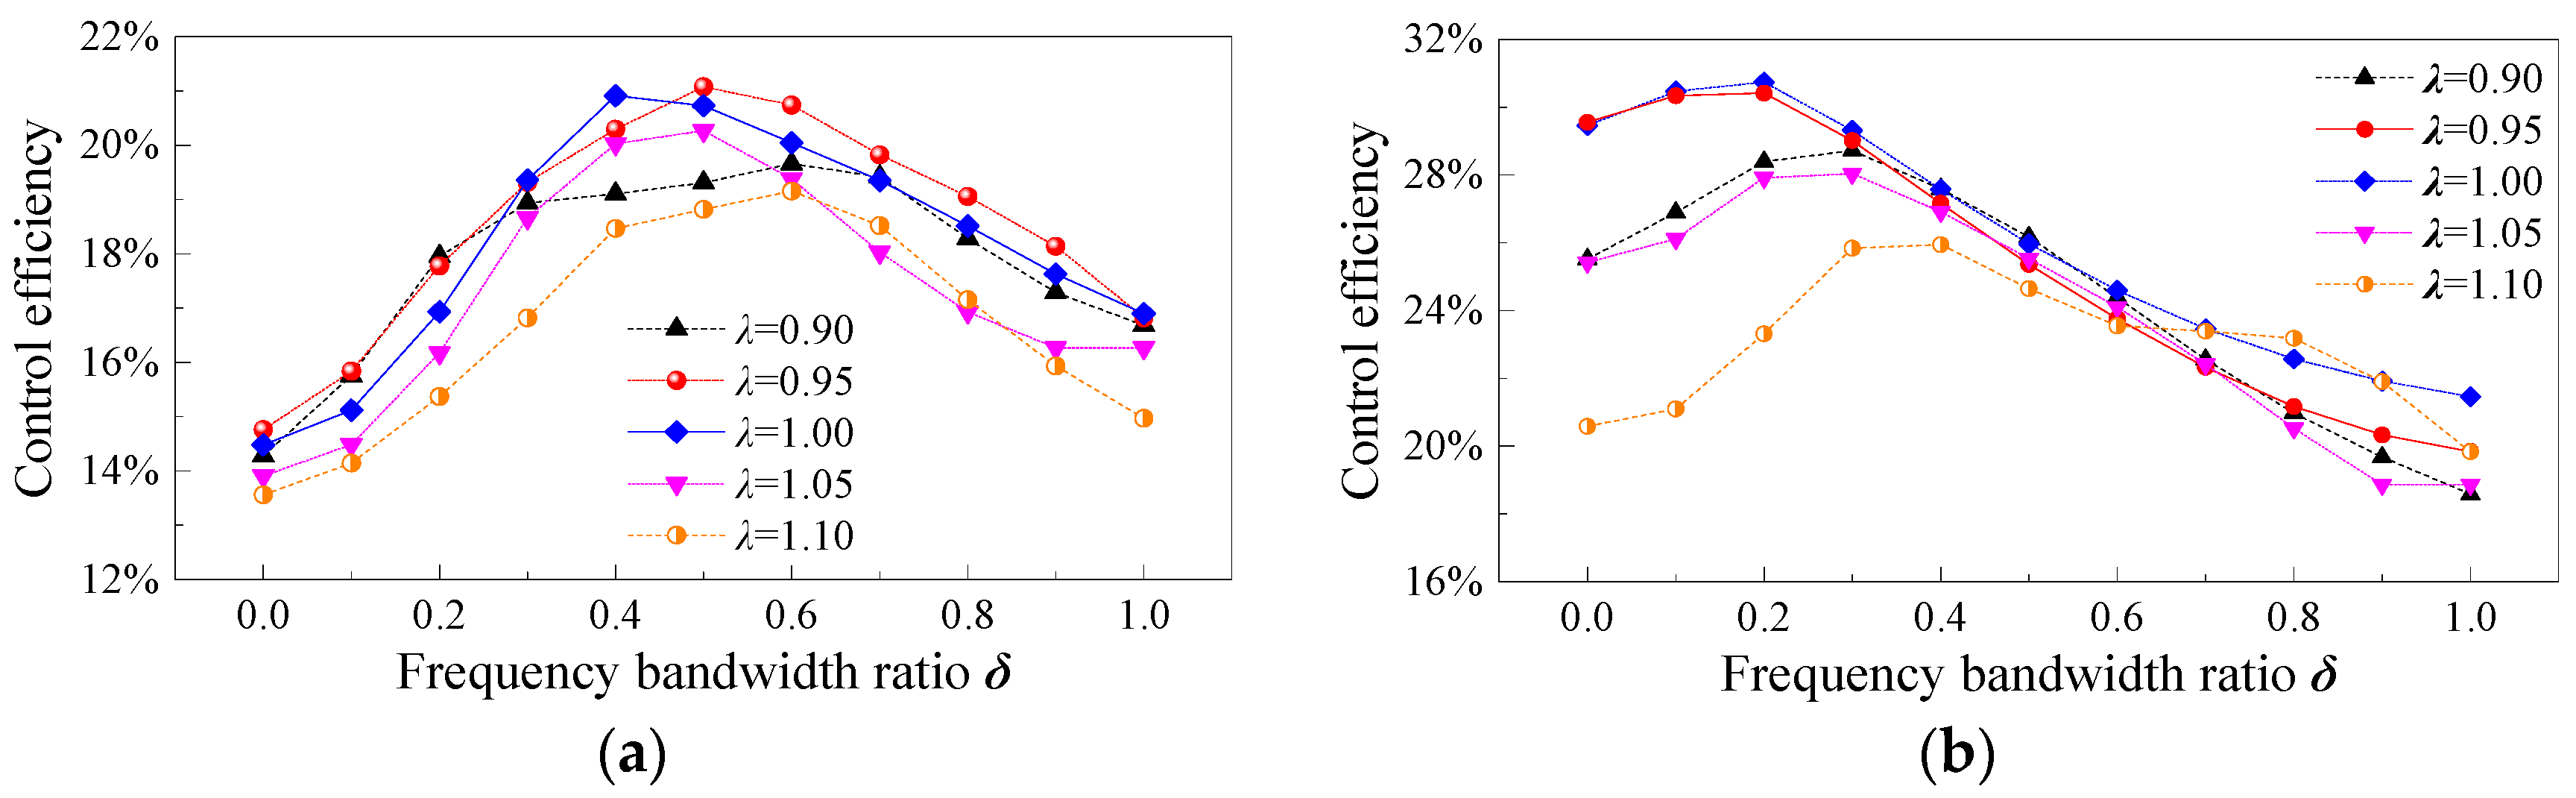
Figure 19.
Comparison of the buffeting displacements at the midspan with and without MTMD: (a) Lateral; (b) Vertical.
Figure 19.
Comparison of the buffeting displacements at the midspan with and without MTMD: (a) Lateral; (b) Vertical.

Figure 20.
PSD comparison of the buffeting displacements with and without MTMD: (a) Lateral; (b) Vertical.
Figure 20.
PSD comparison of the buffeting displacements with and without MTMD: (a) Lateral; (b) Vertical.

Table 1.
Typical modes of Taizhou Bridge. 1
| No. | Frequency/Hz | Modal Shape |
|---|---|---|
| 1 | 0.07163 | First antisymmetric lateral vibration of the main girder (AS-L-1) |
| 2 | 0.08023 | First antisymmetric vertical vibration of the main girder (AS-V-1) |
| 3 | 0.09512 | First symmetric lateral vibration of the main girder (S-L-1) |
| 4 | 0.11489 | Second antisymmetric vertical vibration of the main girder (AS-V-2) |
| 5 | 0.11758 | First symmetric vertical vibration of the main girder (S-V-1) |
| 6 | 0.13709 | Second symmetric vertical vibration of the main girder (S-V-2) |
| 7 | 0.17089 | Third antisymmetric vertical vibration of the main girder (AS-V-3) |
| 8 | 0.18518 | Third symmetric vertical vibration of the main girder (S-V-3) |
| 9 | 0.23058 | Second antisymmetric lateral vibration of the main girder (AS-L-2) |
| 10 | 0.23786 | Fourth antisymmetric vertical vibration of the main girder (AS-V-4) |
| 11 | 0.23983 | Fourth symmetric vertical vibration of the main girder (S-V-4) |
| 13 | 0.27290 | First antisymmetric torsional vibration of the main girder (AS-T-1) |
| 25 | 0.36613 | First symmetric torsional vibration of the main girder (S-T-1) |
1 AS—Antisymmetric; S—Symmetric; V—Vertical; L—Lateral; T—Torsional. The number represents the order.
Table 2.
Dominant frequency and corresponding equivalent mass for MTMD design.
| Dominant Mode | Lateral | Vertical | |
|---|---|---|---|
| AS-L-1 | S-L-1 | AS-V-1 | |
| Equivalent modal mass/t | 25,988.8 | 23,754.8 | 24,200.4 |
| Modal frequency/Hz | 0.07163 | 0.09512 | 0.08023 |
| Weight coefficient | 0.7 | 0.3 | 1 |
| Dominant modal mass/t | 25,318.6 | 24,200.4 | |
| Dominant modal frequency/Hz | 0.07868 | 0.08023 | |
Table 3.
Preferred values for the design parameters of MTMD.
| Cases | Number of TMDs Nd | Mass Ratio μd | Damping Ratio ζd (%) | Frequency Band-Width δd |
|---|---|---|---|---|
| Lateral MTMD | 13 | 0.03 | 2 | 0.5 |
| Vertical MTMD | 11 | 0.02 | 2 | 0.3 |
© 2017 by the authors. Licensee MDPI, Basel, Switzerland. This article is an open access article distributed under the terms and conditions of the Creative Commons Attribution (CC BY) license (http://creativecommons.org/licenses/by/4.0/).
Share and Cite
MDPI and ACS Style
Tao, T.; Wang, H.; Yao, C.; He, X. Parametric Sensitivity Analysis on the Buffeting Control of a Long-Span Triple-Tower Suspension Bridge with MTMD. Appl. Sci. 2017, 7, 395. https://doi.org/10.3390/app7040395
AMA Style
Tao T, Wang H, Yao C, He X. Parametric Sensitivity Analysis on the Buffeting Control of a Long-Span Triple-Tower Suspension Bridge with MTMD. Applied Sciences. 2017; 7(4):395. https://doi.org/10.3390/app7040395
Chicago/Turabian StyleTao, Tianyou, Hao Wang, Chengyuan Yao, and Xuhui He. 2017. "Parametric Sensitivity Analysis on the Buffeting Control of a Long-Span Triple-Tower Suspension Bridge with MTMD" Applied Sciences 7, no. 4: 395. https://doi.org/10.3390/app7040395
Note that from the first issue of 2016, this journal uses article numbers instead of page numbers. See further details here.