Cable Force Health Monitoring of Tongwamen Bridge Based on Fiber Bragg Grating


1
School of Resources and Environmental Engineering, Wuhan University of Technology, Wuhan 430070, China
2
Key Laboratory of Metallurgical Equipment and Control Technology, Ministry of Education, Wuhan University of Science and Technology, Wuhan 430081, China
3
Hubei Key Laboratory of Mechanical Transmission and Manufacturing Engineering, Wuhan University of Science and Technology, Wuhan 430081, China
*
Author to whom correspondence should be addressed.
Appl. Sci. 2017, 7(4), 384; https://doi.org/10.3390/app7040384
Submission received: 27 February 2017
/
Revised: 7 April 2017
/
Accepted: 10 April 2017
/
Published: 12 April 2017
Abstract
:A normal cable force state of a suspension bridge is extremely vital to bridge safety. For cable force monitoring of already completed suspension bridges, it is not suitable to conduct direct parameter measurements by modifying the anchor cable structure of the bridge. Instead, using an indirect measurement would not destroy the bridge’s original structure and also meet engineering requirements. In this paper, a fiber Bragg grating (FBG) vibration sensor was developed for online monitoring of the cable vibration characteristics of Tongwamen bridge. The monitored vibration frequency was converted into cable force according to the theory of string vibration, so as to achieve an indirect measurement of bridge cable force. On both north and south sides of the bridge, FBG vibration sensors were mounted symmetrically on 8 of 19 cables for distributed measurement. The forces of two cables were found to be abnormal, which was considered worthy of attention and close inspection. This result is of great significance for the structural monitoring and safe operation of Tongwamen bridge.
1. Introduction
Large suspension bridges are common in river-crossing and gulf-crossing transportation projects. Magnitude and distribution of cable tension force can reflect the stress state of a bridge, and a reasonable cable force state is extremely important for the safe operation of a bridge. With the rapid development of China’s transportation system, heavy load and overloaded vehicles are common in transportation. As a result, operation loads of the bridge often exceed the design load, resulting in damage and failure to the bridge structure. Therefore, the long-term real-time cable force state and parameter measurements are critical to bridge engineering safety monitoring during the operation of suspension bridges [1,2].
Fiber Bragg grating (FBG) sensors have received considerable attention in research publications and a wide range of applications have been implemented due to their advantages, such as immunity to electromagnetic noise, small size, light weight, ease of incorporation into a sensor network, and long signal transmission distance [3,4,5,6]. Although use of fiber grating sensing technology in civil engineering applications such as bridges and tunnels has spanned over several decades, fiber Bragg grating based structural health monitoring technology has undergone rapid growth in recent years, and research and applications in various engineering fields have been reported consistently by numerous research groups at home and abroad [7,8,9,10]. Li [9] proposed a smart stay cable for bridge health monitoring. This cable is a glass fiber with high durability and high intensity, which has an embedded FBG and is coated by steel wires. A. Panopoulou and T. Loutas [11,12,13] have reported numerous articles on FBG-based health monitoring of aerospace composite structures. Here, FBG arrays were used to obtain the dynamic strain response of an aerospace structure under vibration excitation.
Tongwamen bridge, located in Xiangshan County, Ningbo City, Zhejiang Province, is a sea-crossing bridge connecting Shipu Town and Dongmen Island. It is a boom arch bridge, 292 m in length from east to west. There are 19 suspenders on both north and south sides. Each suspender has a diameter of 64 mm and a height ranging from 8.919 m to 35.268 m. The distance between adjacent suspenders is 10 m. Since 2002, when public traffic was first allowed on the bridge, traffic flow has seen a significant increase each year, exceeding the design traffic load. In addition, some adverse factors including overloading of vehicles, traffic jams, and typhoons have also adversely affected the health of the bridge. During maintenance, the cable forces of the 38 suspenders were found to be abnormal. This motivates the need for real-time monitoring of cable forces. Compared with bridges under construction, which can be embedded with sensors for structural health monitoring, bridges already in operation are not suitable for direct measurement by modifying their anchor cable structure largely, since it will destroy their original structure. For example, an FBG force ring is usually mounted at the end of a cable during bridge construction. However, when the construction is completed, it would be inappropriate to disconnect cables to install a force ring [14]. Suspension cable measurement technology based on the theory of string vibration can be used for bridge cable force measurement without making any structural changes to the main structure of the cable and bridge. As a result, this method has strong engineering practicality [15,16,17]. Considering cable sag and bending stiffness, Ren and Zhao [15,16] further developed the taut string theory. Zhang [17] reported an FBG vibration sensor-based real-time monitoring system for cable force. But a complicated signal processing system reduces its engineering practicability. Based on the vibration frequency method, Yu [18] investigated a wireless monitoring system for bridge cable tension force monitoring. However, the signal transmission of a wireless system is not stable enough for real-time supervision. Zhao [19] developed a portable and convenient cable force measurement device. In this case, the vibration frequency method was chosen to capture cable fundamental frequency by the use of a precise vibration sensor. In this paper, an FBG vibration sensing technique was used for measuring the vibration frequencies of suspension cable strings, and cable forces were retrieved based on string vibration theory. Accordingly, an indirect measurement without destroying the bridge structure was achieved. Forces of 16 suspension cables on the north and south sides of the bridge were successfully monitored in real time and cables with abnormal forces were found.
2. Monitoring Method and FBG Vibration Sensor
2.1. Measurement Method
According to the theory of string vibration, the relation between tension T acting on a two-end fixed tightened string and the characteristic frequency of the string vibration can be written as:
where l, m and fn are length, linear density and n-th order characteristic frequency of the string, respectively.
Since the physical size of the suspension cable is known, cable force can be obtained as long as the vibration frequency of the suspension cable can be measured in real time. The actual cross section of the suspender is comprised of 19 thin wires connected in parallel, which form one suspension cable with a diameter of 70 mm. A PVC protection tube tightly wraps all suspension cables. Compared to the cable, rigidity of PVC tube is small, so its linear density can be ignored during the calculation of cable force using Equation (1). For this purpose, according to their vibration frequency characteristics, FBG vibration sensors for Tongwamen bridge were developed, as described in detail in the next section.
On each side (north and south) of Tongwamen bridge, there are 19 suspension cables, among which 8 were selected for monitoring. Accordingly, a total of 16 FBG vibration sensors were mounted on Tongwamen bridge. As Figure 1a shows, on both north and south sides of the bridge, sensors are located on the 3rd, 5th, 7th, 9th, 11th 13th, 15th and 17th suspension cables, in the direction from Shipu to Dongmen island. As shown in Figure 1b, sensors on the south and north sides are numbered as S1–S8 and N1–N8, respectively. Sensors on either side were concatenated through a single-mode optical fiber, which were then connected to the control room. A homemade FBG demodulator (channels: 8, acquisition frequency: 0–5000 Hz, accuracy: 3 pm, resolution: 0.1 pm) is used to record the wavelength of the sensor at a sampling frequency of 200 Hz. The bandwidth of light source in the interrogator is 80 nm (1525–1605 nm), where each channel can accommodate at least 20 FBG vibration sensors with a different central wavelength.
2.2. Design of FBG Vibration Sensor
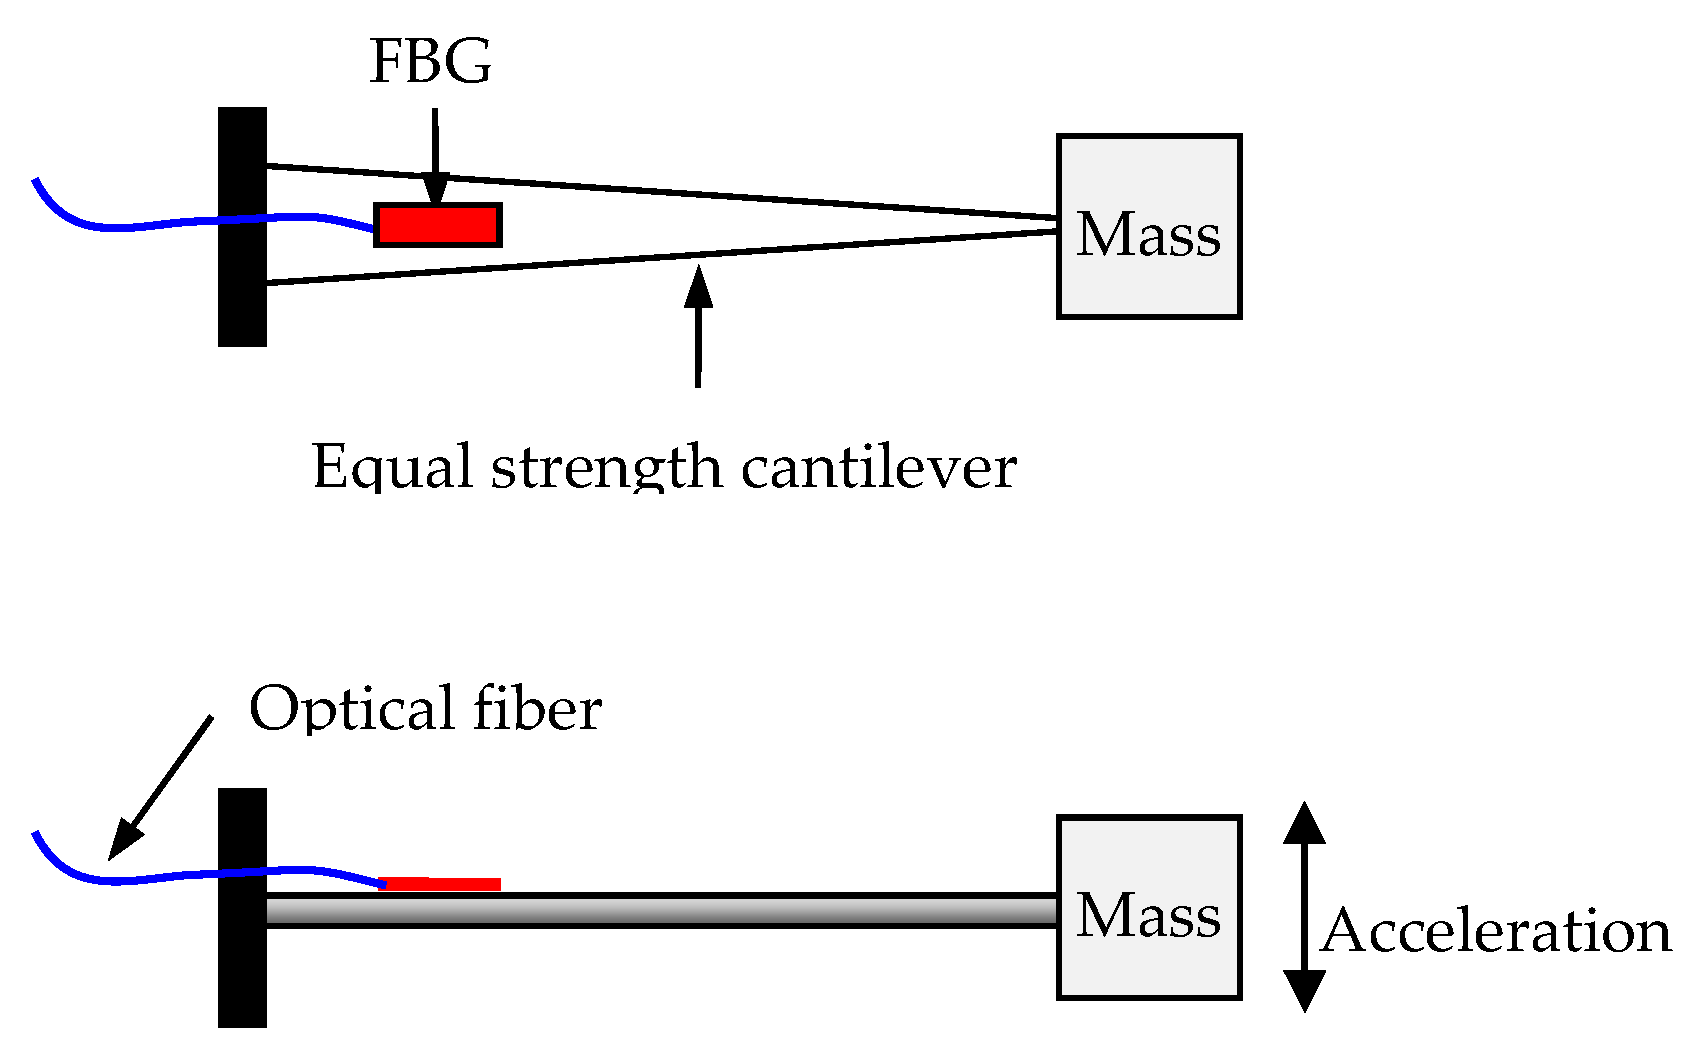
Through an earlier field test on the bridge suspension cables, it was found that the cable’s vibration frequencies are generally within 6 Hz. Thus, the resonant frequency of the FBG vibration sensor should be far higher than 6 Hz so as to avoid interference caused by superimposition of the resonant frequency of the sensor with measured frequencies. Principles of fiber grating vibration sensors vary widely, and have been a hot research topic in the field of optical fiber sensing [14,15,16,17,18,19,20,21,22]. As a classic elastic element, cantilever beam shows broad applications in the design of FBG vibration sensors. Sensors based on this principle are simple and reliable with strong engineering applicability. Due these favorable reasons, FBG vibration sensor based on an equal-strength cantilever beam was designed. Compared with other cantilever-based vibration sensors, this FBG vibration sensor possesses a simpler structure of just an original equal-strength cantilever beam, which avoids complex assembly and has higher reliability. In our previous work [20], a high frequency FBG vibration sensor was made through metallization packaging. The sensor possesses a high resonance frequency of 3.6 kHz but a low sensitivity of 0.17 pm/(m/s2), which is not suitable for measuring cable vibration with low frequency and high measurement sensitivity. As shown in Figure 2, a FBG was attached on the beam surface, and a block mass was fixed on the free end of the beam. Under the influence of external vibration acceleration, the beam vibrated with inertial force on the mass, generating alternating bending strain on the surface. This bending strain was detected and converted into wavelength shift by the FBG sensor (Fenglan Tech, Co, Ltd, Anshan, China). Thus, external vibration acceleration was retrieved using wavelength shift information detected by the demodulator.
Based on the principle from mechanics of materials, for a cantilever beam of equal strength, relationship between its deflection w and force acting on its end can be written as:
where L is length of the beam, b is width of the beam’s fixed end, h is thickness, and E is Young’s modulus of the beam.
The force on the free-end of the beam is inertia force F generated by the block mass under external acceleration a can be calculated by:
where m is mass of mass block.
For an equal-strength beam, the relationship between strain ε of its surface, which can be sensed and measured by the FBG, and its deflection w, can be described as:
For a FBG with initial central wavelength λ, its wavelength shift Δλ has the following relationship with its longitudinal strain change Δε and its environmental temperature change ΔT:
where αf, ξ, and Pe are optical fiber’s thermal expansion coefficient, thermo-optic coefficient and elasto-optic coefficient, respectively. Pe is approximately 0.22 at normal temperature. For the vibration acceleration sensor, which only measures frequency, wavelength shift caused by temperature change has no impact on the frequency. Therefore, only effect of the strain change Δε remained on grating wavelength, and Equation (5) can be rewritten as:
By combining Equations (2)–(4) and (6), relationship between wavelength shift Δλ of the designed FBG sensor and external vibration acceleration can be expressed as:
Equation (7) is the basic measuring principle of the developed FBG vibration sensor.
A ‘B & K 4808’ vibration test system (Brüel & Kjær, Nærum, Denmark) and a standard ‘B & K 4371’ piezoelectric accelerometer (Brüel & Kjær, Nærum, Denmark) were used to measure amplitude-frequency and linearity response of the vibration sensor. Figure 3 shows the typical performance test results for the developed 16 FBG sensors. Figure 3a is the amplitude-frequency curve, which was obtained by exerting different frequencies from 0.5 to 21.5 Hz at an acceleration of 0.2 m/s2. It can be observed that the resonance frequency is approximately 15 Hz, which exceeds the required 6 Hz and meets monitoring requirements. As shown in Figure 3b acceleration performance test was repeated three times. Average data was fit to obtain sensitivity as 109.667 pm/(m/s2), and the measurement showed favorable repeatability of 3.12%.
To verify the applicability of the proposed FBG vibration sensor, a contrast experiment has been carried out. A FBG vibration sensor and a ‘B & K 4371’ piezoelectric accelerometer have been fixed together on the exciter and applied by a sine excitation signal with different frequencies of 2, 5, and 8 Hz, respectively. Figure 4 shows the contrast of the two sensors in responses of time-domain waveforms and frequency spectrums under different excitation signal. From the comparison charts, it can be seen that the FBG vibration sensor is consistent with the piezoelectric accelerometer, which demonstrates the applicability of the proposed sensor.
3. Monitoring Results
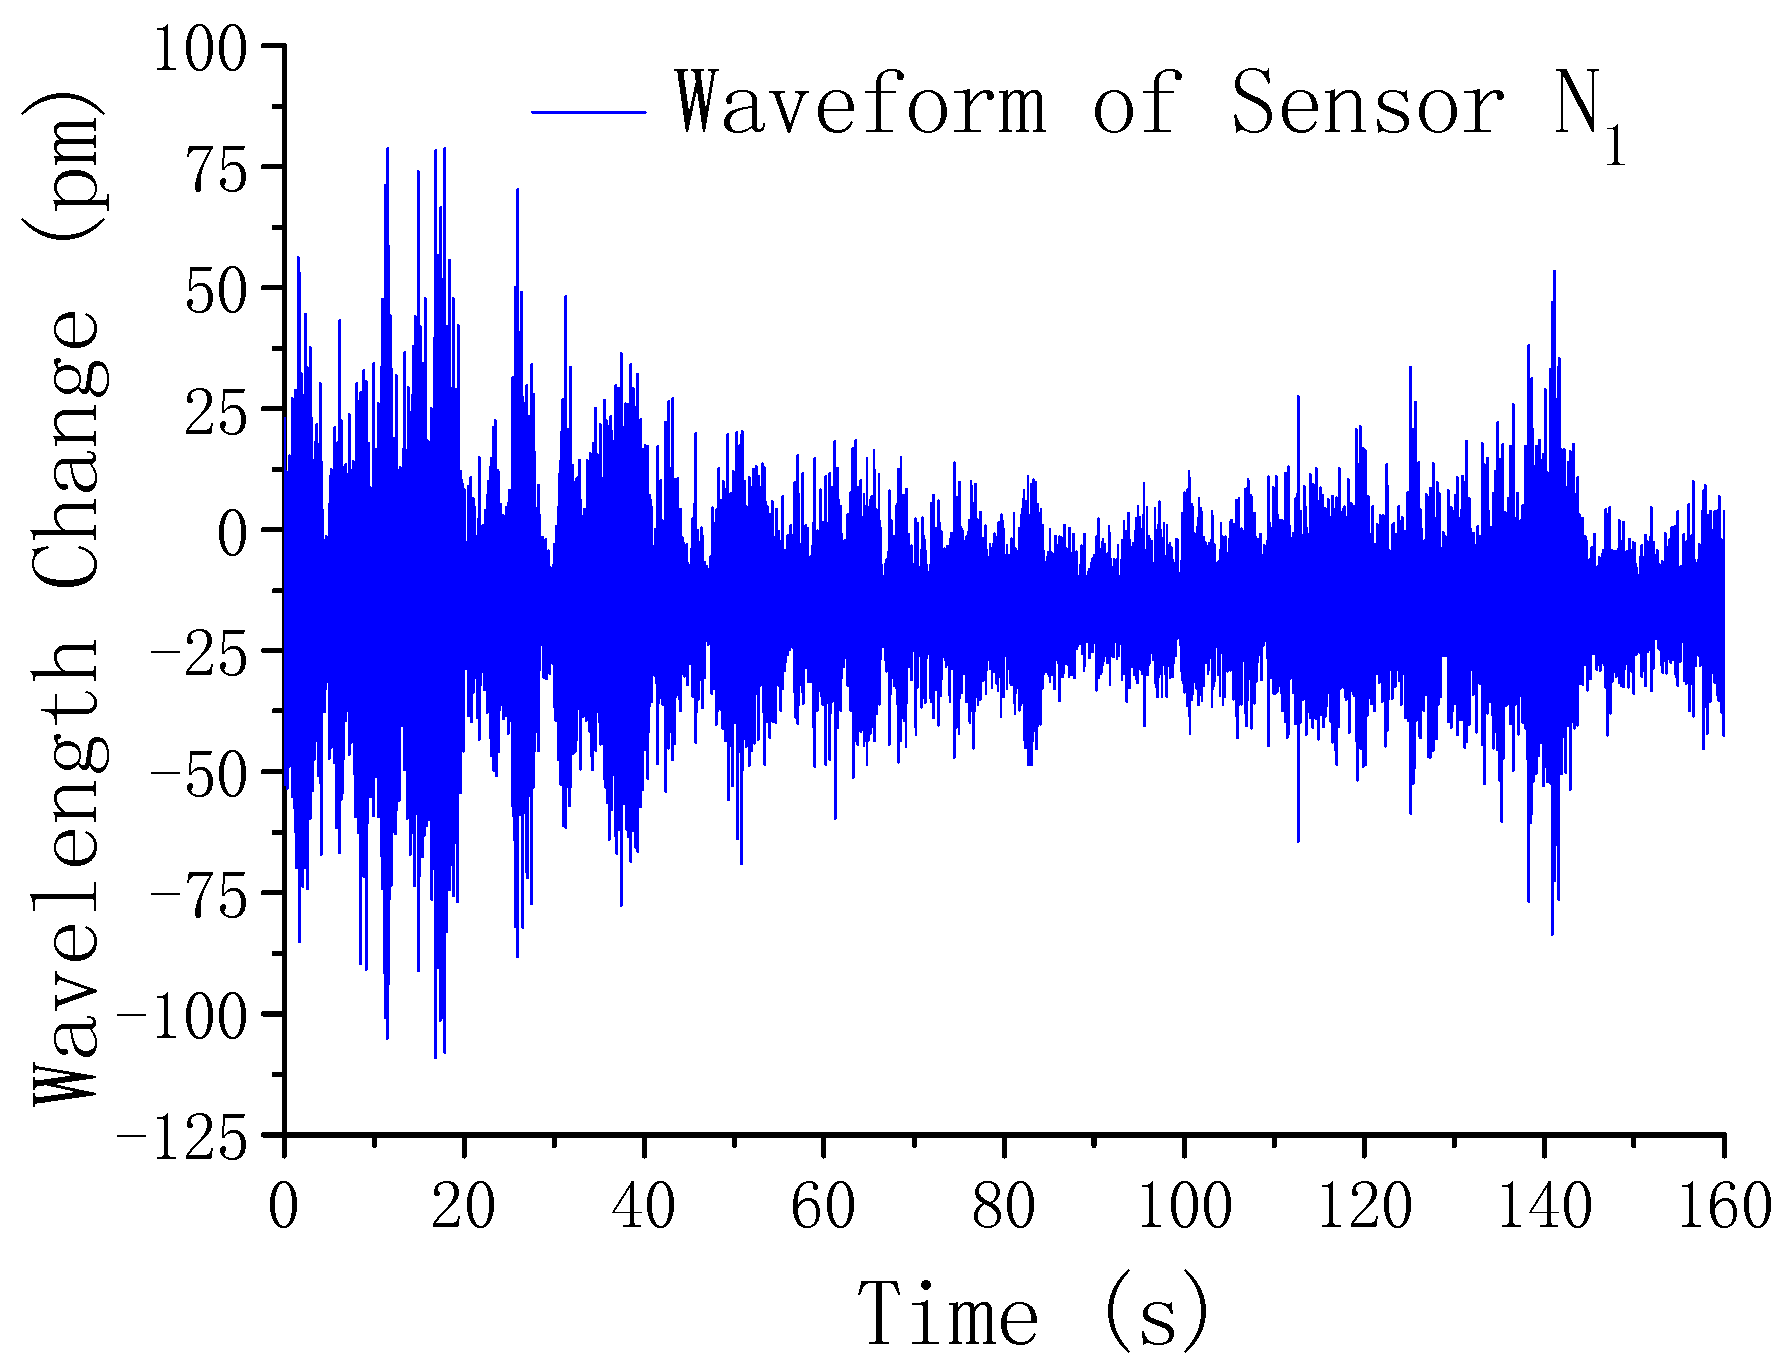
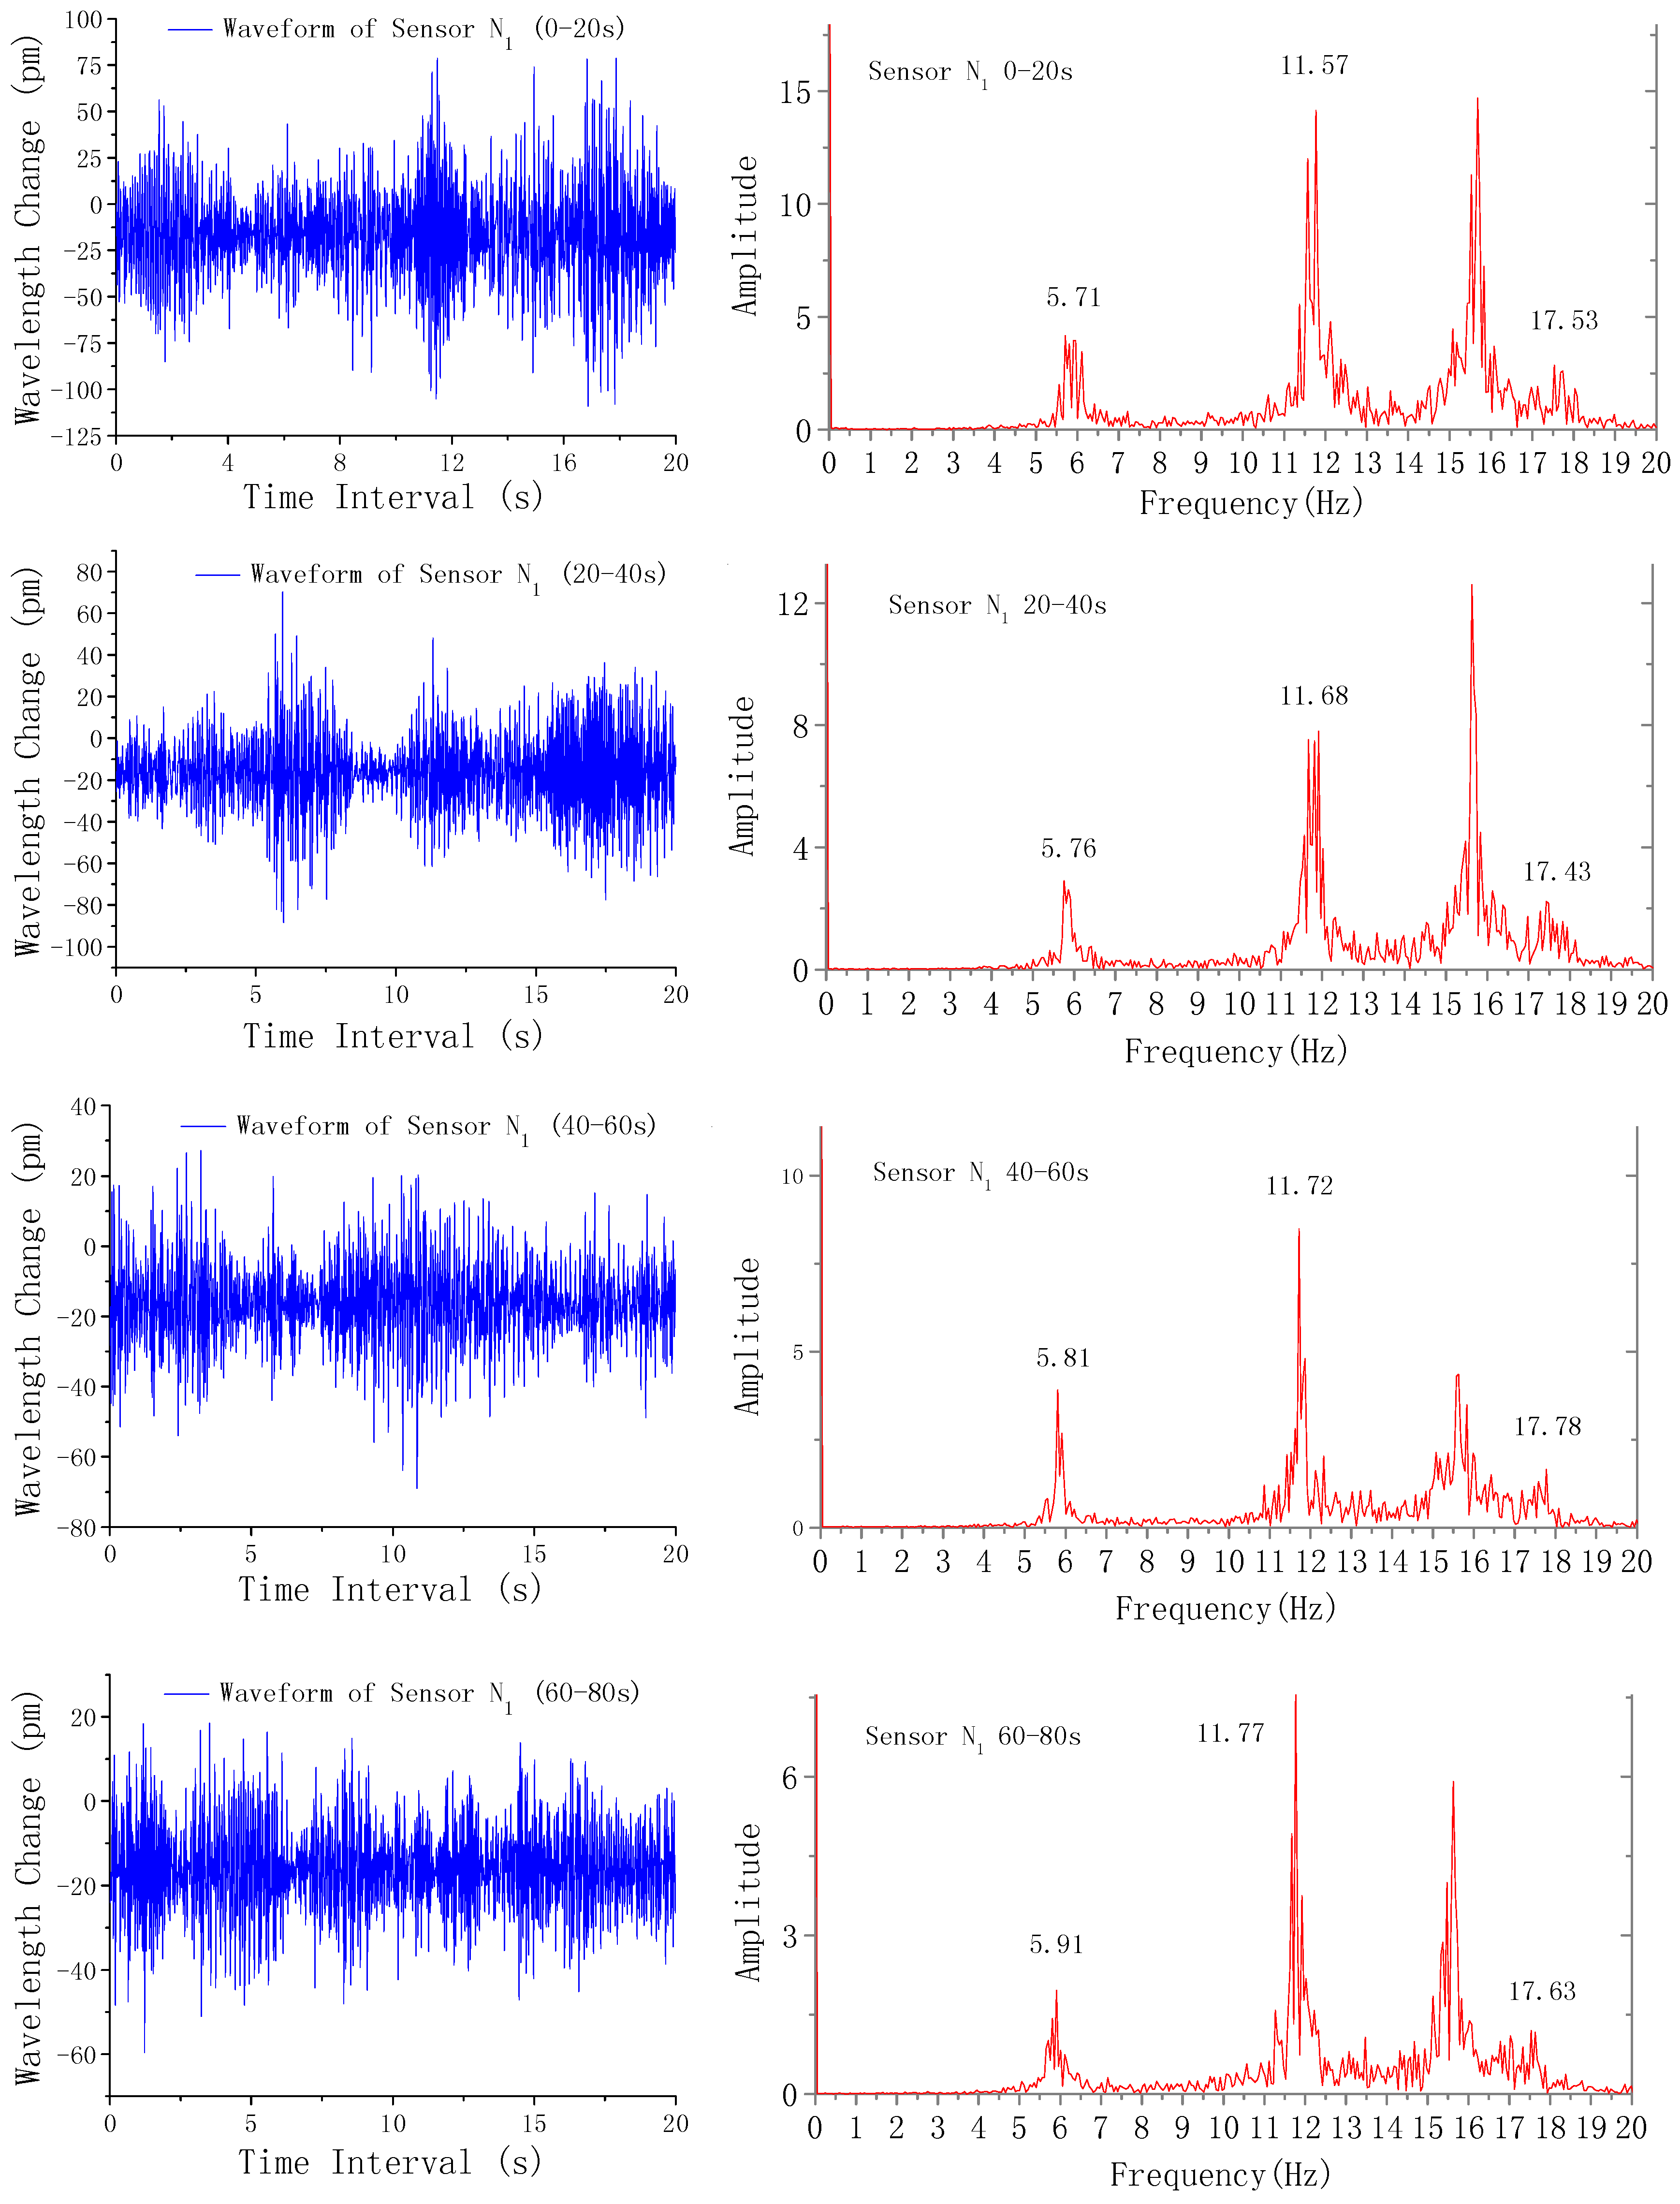
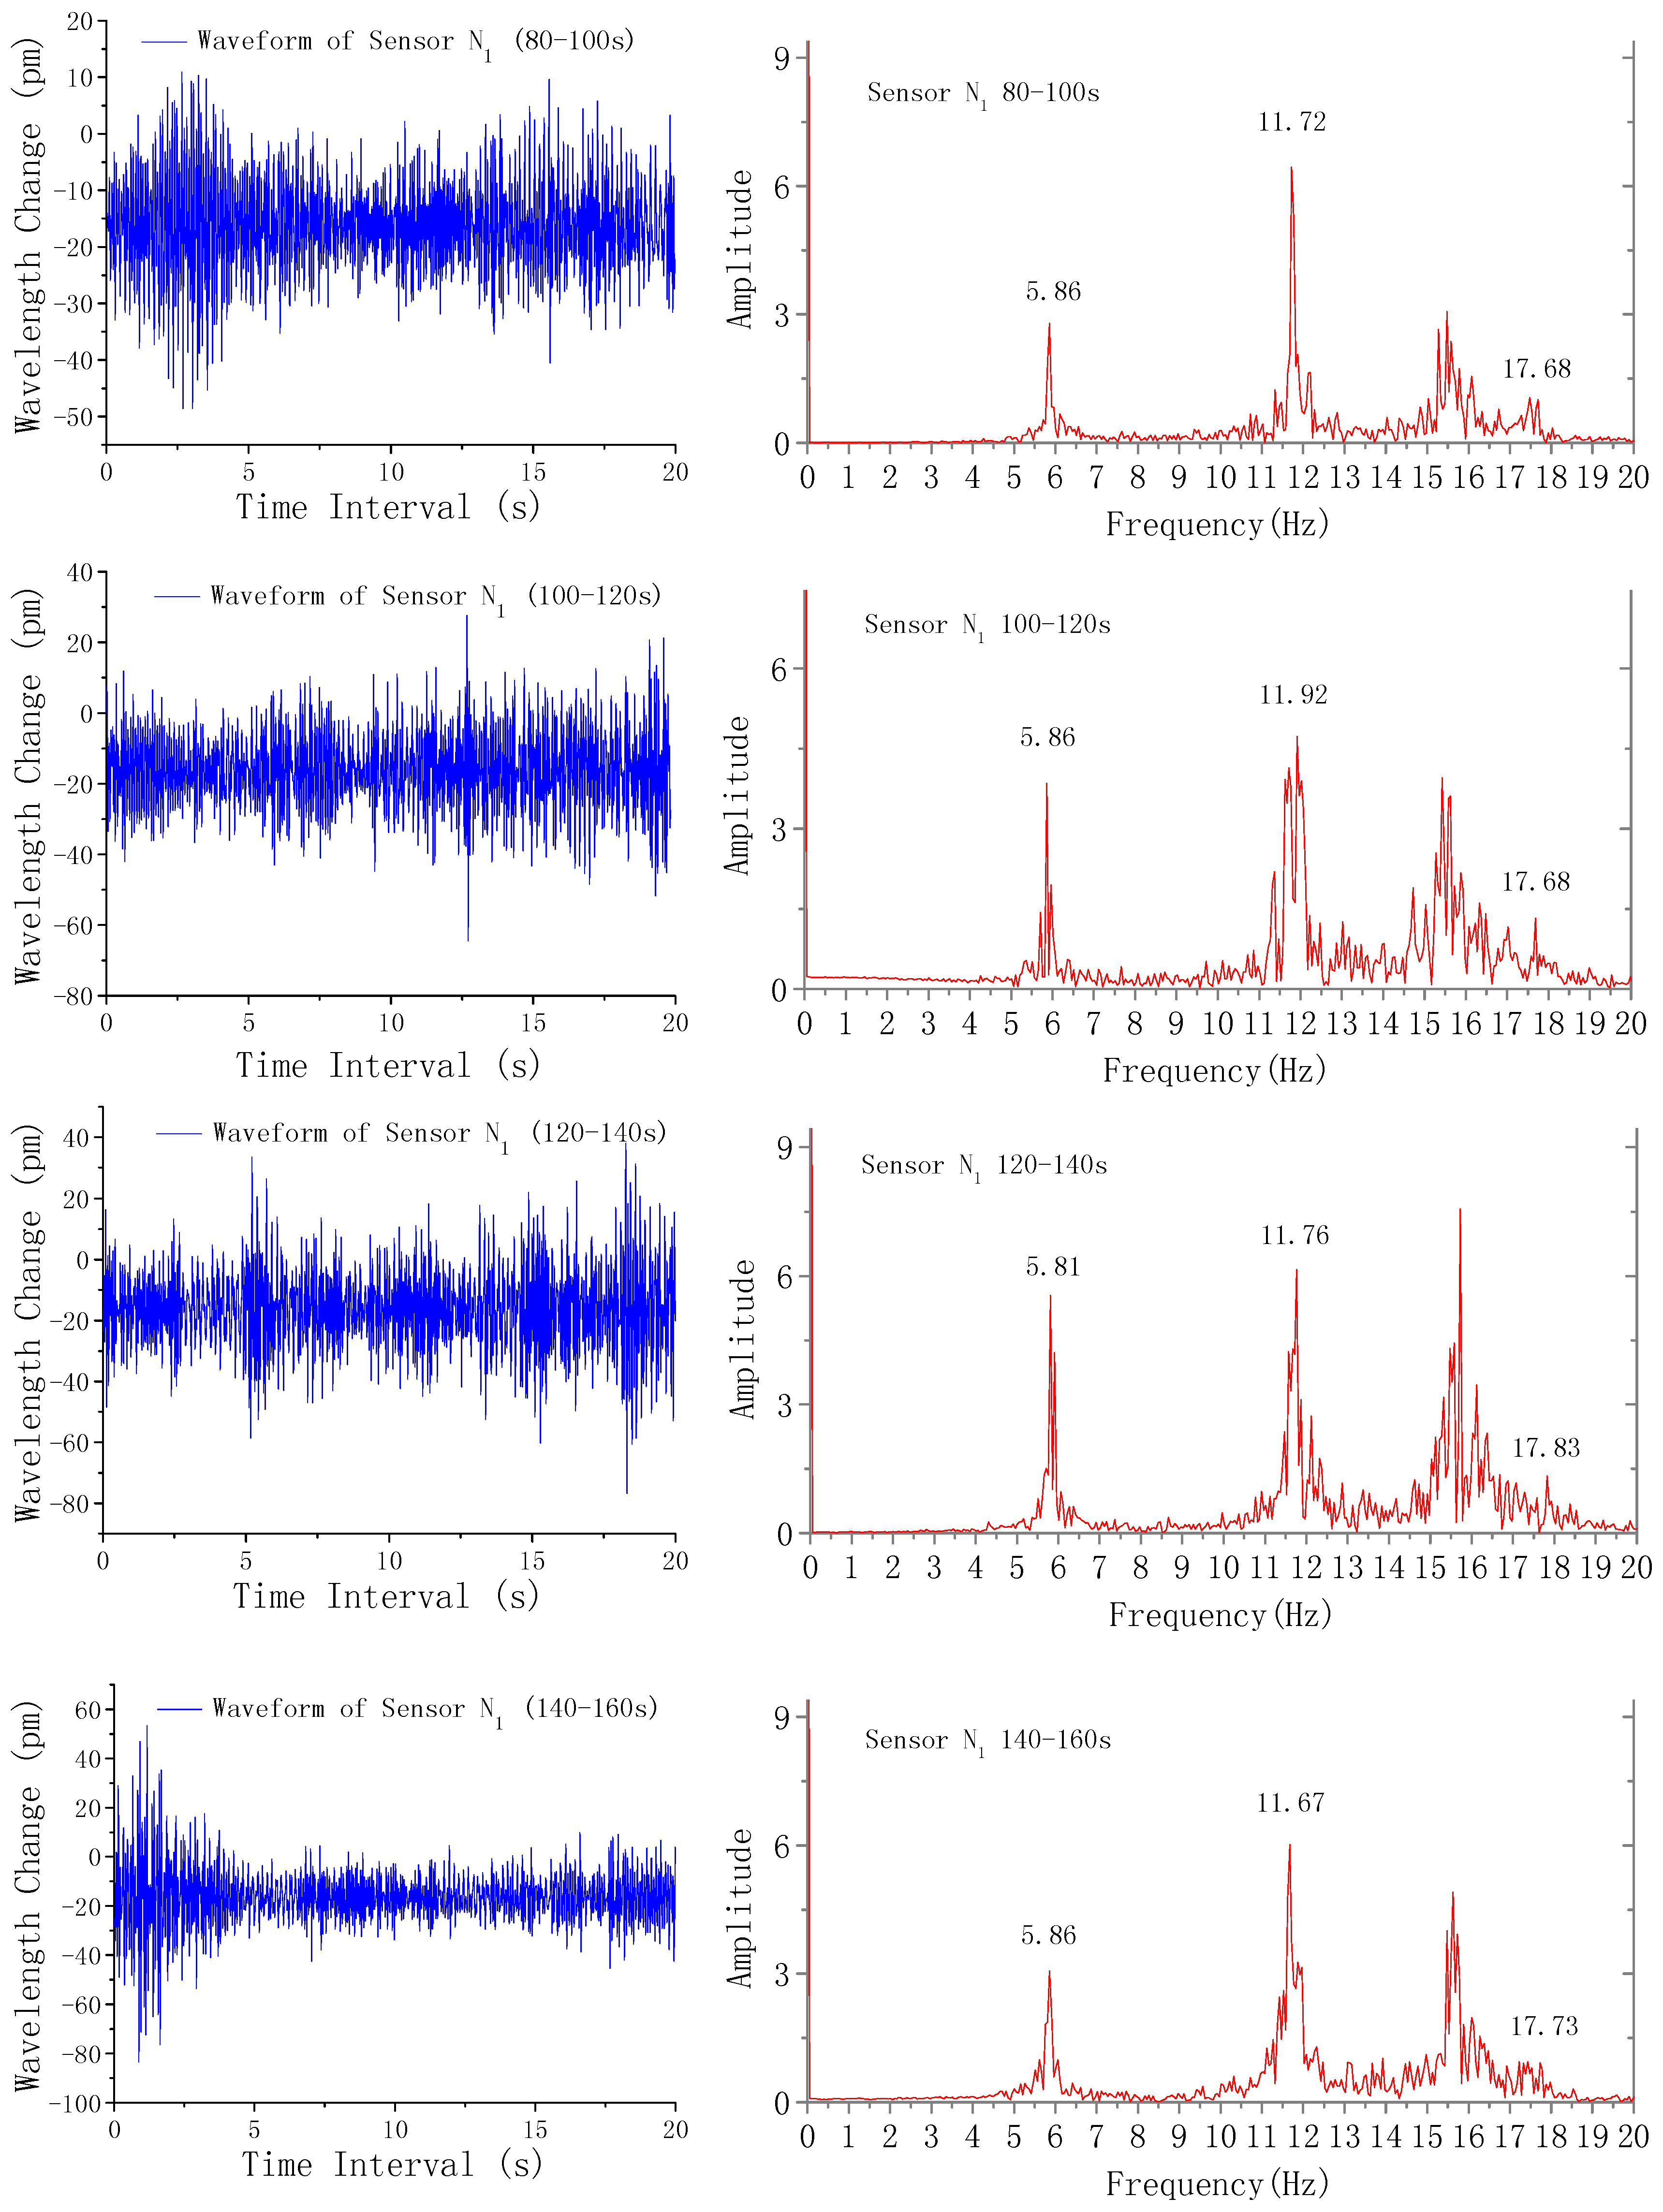
Sensor arrays on each side were composed of eight vibration sensors with a wavelength interval of three nanometers. Then, sensors on north and south sides were connected into the FBG demodulator through a single-mode optical fiber. The wavelength sampling precision of the demodulator was three picometers and sampling frequency was set as 200 Hz. Given the larger number of sensors and large volume of real-time collected data, here, monitoring data collected for 160 s from the first vibration sensor (Sensor N1) on the north side of the bridge is used as an example. Figure 6 shows the time-domain waveform of sensor N1 for 160 s. To facilitate measurement of fundamental cable frequency, every 20 s in a time span of 160 s was taken as a measurement time unit. Then, frequency spectrum within this time period was acquired using fast Fourier transform (FFT). Figure 7 and Figure 8 show time-domain waveform and frequency-domain spectrum for each 20 s. Taking the 0–20 s data in Figure 7 as an example, the fundamental frequency of the cable is obtained as 5.71 Hz and multiplier frequencies are 11.57 Hz and 17.53 Hz, and the resonant frequency of the sensor is 15.5 Hz. Results from the other time periods are the same. Therefore, it can be concluded the that vibration frequency of the cable can be successfully measured by the sensor.
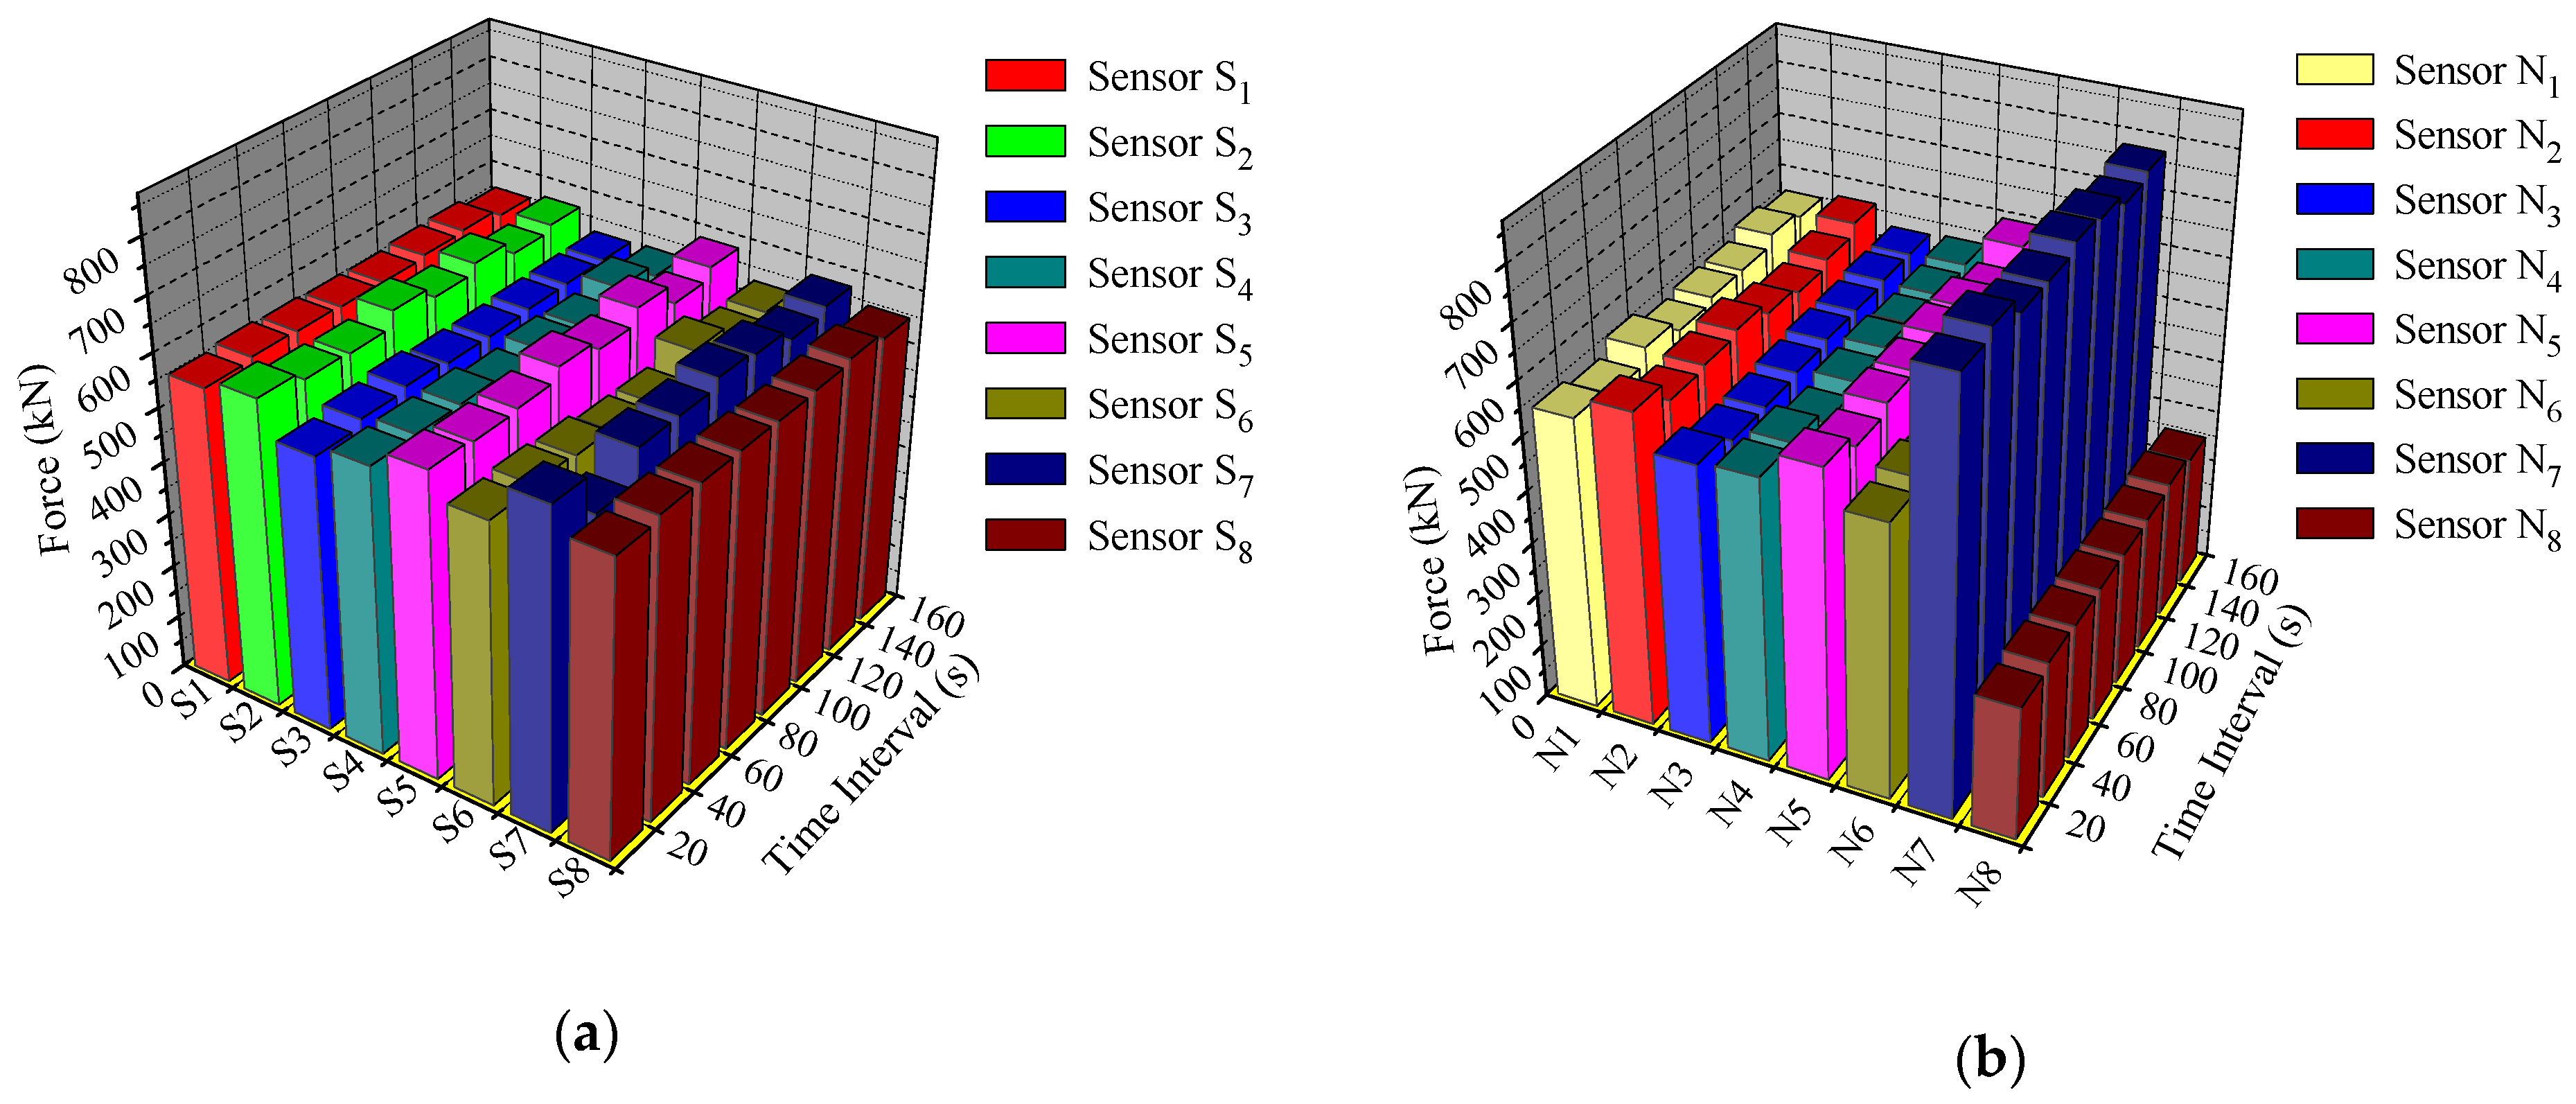
For the 3rd cable, where sensor N1 was located, effective length and weight are 19.502 m and 218 kg, so linear density is 218/19.502 = 11.178 kg/m. Then, the corresponding terms in Equation (1) are: m = 11.178 kg/m, l = 19.502 m, fundamental frequency fn within 0–20 s is 5.71 Hz, for n = 1, and cable force can be obtained as T = 554.44 kN. Forces in remaining time units for sensor N1 can be calculated similarly. By this method, cable forces measured by all 16 sensors can be obtained. In addition, measurement results can be influenced by wind or gusts because wind load will cause whole-body vibration of the bridge. This whole-body vibration has an influence on the sensor measurements. However, compared with cables, the whole-body vibration frequency is usually much lower than the fundamental frequency of cables, so fundamental frequency measurement will not be affected. When environmental temperature changes, the amplitude of the vibration waveform changes correspondingly, whereas the frequency of the vibration waveform after FFT still remains unchanged. So, vibration sensors for frequency measurement do not need temperature compensation. Figure 9a,b shows the dynamic force distribution over time for all 16 cables on south and north sides, respectively. As can be seen, for most cables, forces were around 550 kN. However, measured forces on the 15th and 17th cables on north side with sensors N7 and N8 were found to be abnormal. The average force of the 15th cable was 780 kN, which exceeds the normal value of 550 kN, whereas the force of the 17th cable was only 250 kN. From these two cables, it can be concluded that they are in a critical state and in urgent need for maintenance and repairs. Monitoring results have been reported to the bridge management department, and were taken seriously. Current monitoring results can provide accurate data for making scientific decisions on further safe operation and maintenance of the bridge. In addition, if an independent measure like magnetic flux method or piezoelectric acceleration sensor measurement is carried out to measure the cable force, a comparison of the two measuring results would be significant. However, we did not perform this during the project implementation about half a year ago, which is an oversight of our work.
4. Conclusions
According to characteristics of Tongwamen bridge suspension cables, a cable force health monitoring scheme was proposed based on the theory of string vibration and FBG sensing. FBG sensors with high sensitivity and good repeatability suitable for detection of suspension cable frequency were developed. A total of 16 sensors were installed on 16 suspension cables. Vibration frequencies of the cables were measured and cable forces were calculated. From the monitoring results, two cables with abnormal tension forces were found using the proposed method. This monitoring method has strong practical applications in structural health monitoring of significant engineering and equipment, owing to its broad application prospects.
Acknowledgments
This research was partially supported by the Natural Science Foundation of China under Grant (No. 51605348, 51174153, 51374164), and the Natural Science Foundation of Hubei province under Grants No. 2016CFB116.
Author Contributions
Dongtao Hu, Yongxing Guo conceived and designed the experiments; Dongtao Hu, Yongxing Guo and Congrui Zhang performed the experiments; Yongxing Guo analyzed the data; Dongtao Hu, Yongxing Guo wrote the paper; Xianfeng Chen modified and improved the paper.
Conflicts of Interest
The authors declare no conflicts of interest.
References
- Chan, T.H.T.; Yu, L.; Tam, H.Y. Fiber Bragg grating sensors for structural health monitoring of Ting Ma bridge: Background and experimental. Eng. Struct. 2006, 28, 648–659. [Google Scholar] [CrossRef]
- Richard, H.S.; Pradipta, B.; Sanjay, C. Commissioning and evaluation of a fiber-optic sensor system for bridge monitoring. IEEE Sens. J. 2013, 13, 2555–2562. [Google Scholar]
- Guo, Y.; Kong, J.; Liu, H. Design and Investigation of a Reusable Surface-Mounted Optical Fiber Bragg Grating Strain Sensor. IEEE Sens. J. 2016, 16, 8456–8462. [Google Scholar] [CrossRef]
- Wang, H.; Zhou, H.; Gao, H. Fiber grating acceleration vibration sensor with double uniform strength cantilever beams. J. Optoelectron. Laser 2013, 24, 635–641. [Google Scholar]
- Yang, D.; Du, L.; Xu, Z. Magnetic field sensing based on tilted fiber Bragg grating coated with nanoparticle magnetic fluid. Appl. Phys. Lett. 2014, 104, 061903. [Google Scholar] [CrossRef]
- Tong, Z.; Wang, J.; Zhang, W. Simultaneous measurement of refractive index, temperature and strain based on core diameter mismatch and polarization maintaining FBG. Optoelectron. Lett. 2013, 9, 238–240. [Google Scholar] [CrossRef]
- Mousumi, M.; Tarun, K.G. Fiber Bragg gratings in structural health monitoring-Present status and applications. Sens. Actuators A Phys. 2008, 147, 150–164. [Google Scholar]
- Minardo, A.; Porcaro, G.; Giannetta, D. Real-time monitoring of railway traffic using slope-assisted Brillouin distributed sensors. Appl. Opt. 2013, 52, 3770–3776. [Google Scholar] [CrossRef] [PubMed]
- Li, D.; Zhou, Z.; Ou, J. Development and sensing properties study of FRP-FBG smart stay cable for bridge health monitoring applications. Measurement 2011, 44, 722–729. [Google Scholar] [CrossRef]
- Grattan, S.K.; Taylor, T.; Basheer, M. Monitoring of corrosion in situ in structural reinforcements bars using a wrapped fiber optic sensor network. Sens. Actuators A Phys. 2009, 1, 1–9. [Google Scholar]
- Loutas, T.; Panopoulou, A.; Roulias, D.; Kostopoulos, V. Intelligent health monitoring of aerospace composite structures based on dynamic strain measurements. Expert Syst. Appl. 2012, 39, 8412–8422. [Google Scholar] [CrossRef]
- Panopoulou, A.; Loutas, T.; Roulias, D.; Fransen, S.; Kostopoulos, V. Dynamic fiber Bragg gratings based health monitoring system of composite aerospace structures. Acta Astronaut. 2012, 69, 445–457. [Google Scholar] [CrossRef]
- Loutas, T.; Charlaftis, P.; Airoldi, A.; Bettini, P. Reliability of strain monitoring of composite structures via the use of optical fiber ribbon tapes for structural health monitoring purposes. Compos. Struct. 2015, 134, 762–771. [Google Scholar] [CrossRef]
- Li, X.; Ren, W.; Bi, K. FBG force-testing ring for bridge cable force monitoring and temperature compensation. Sens. Actuators A Phys. 2015, 223, 105–113. [Google Scholar] [CrossRef]
- Ren, W.; Chen, G. Practical formulas to determine cable tension by using cable fundamental frequency. China Civ. Eng. J. 2005, 38, 26–31. [Google Scholar]
- Zhao, Y.; Zhou, H.; Jin, B. Influence of bending rigidity on nonlinear natural frequency of inclined cable. Eng. Mech. 2008, 25, 196–201. [Google Scholar]
- Zhang, D.; Li, W.; Guo, D. Real-time monitor system of bridge-cable force based on fbg vibration sensor and its application. Chin. J. Sens. Actuators 2007, 20, 2720–2723. [Google Scholar]
- Yu, Y.; Zhang, C.; Zhu, X. Design and experimental investigations of a vibration based wireless measurement system for bridge cable tension monitoring. Adv. Struct. Eng. 2014, 17, 1657–1668. [Google Scholar] [CrossRef]
- Zhao, X.; Han, R.; Ding, Y.; Yu, Y. Portable and convenient cable force measurement using smartphone. J. Civ. Struct. Health Monit. 2015, 5, 481–491. [Google Scholar] [CrossRef]
- Guo, Y.; Zhang, D.; Zhou, Z. Welding packaged accelerometer based on metal-coated FBG. Chin. Opt. Lett. 2013, 1, 070604. [Google Scholar]
- Yin, G.; Dai, Y.; Karanja, J. Optimization design for medium-high frequency FBG accelerometer with different eigenfrequency and sensitivity. Sens. Actuators A Phys. 2015, 235, 311–316. [Google Scholar] [CrossRef]
- Li, T.; Tan, Y.; Han, X. Diaphragm based fiber bragg grating acceleration sensor with temperature compensation. Sensors 2017, 17, 218. [Google Scholar] [CrossRef] [PubMed]
Figure 1.
Arrangement of fiber Bragg grating (FBG) vibration sensors on Tongwamen bridge cables: (a) Side view; (b) Overhead view.
Figure 1.
Arrangement of fiber Bragg grating (FBG) vibration sensors on Tongwamen bridge cables: (a) Side view; (b) Overhead view.
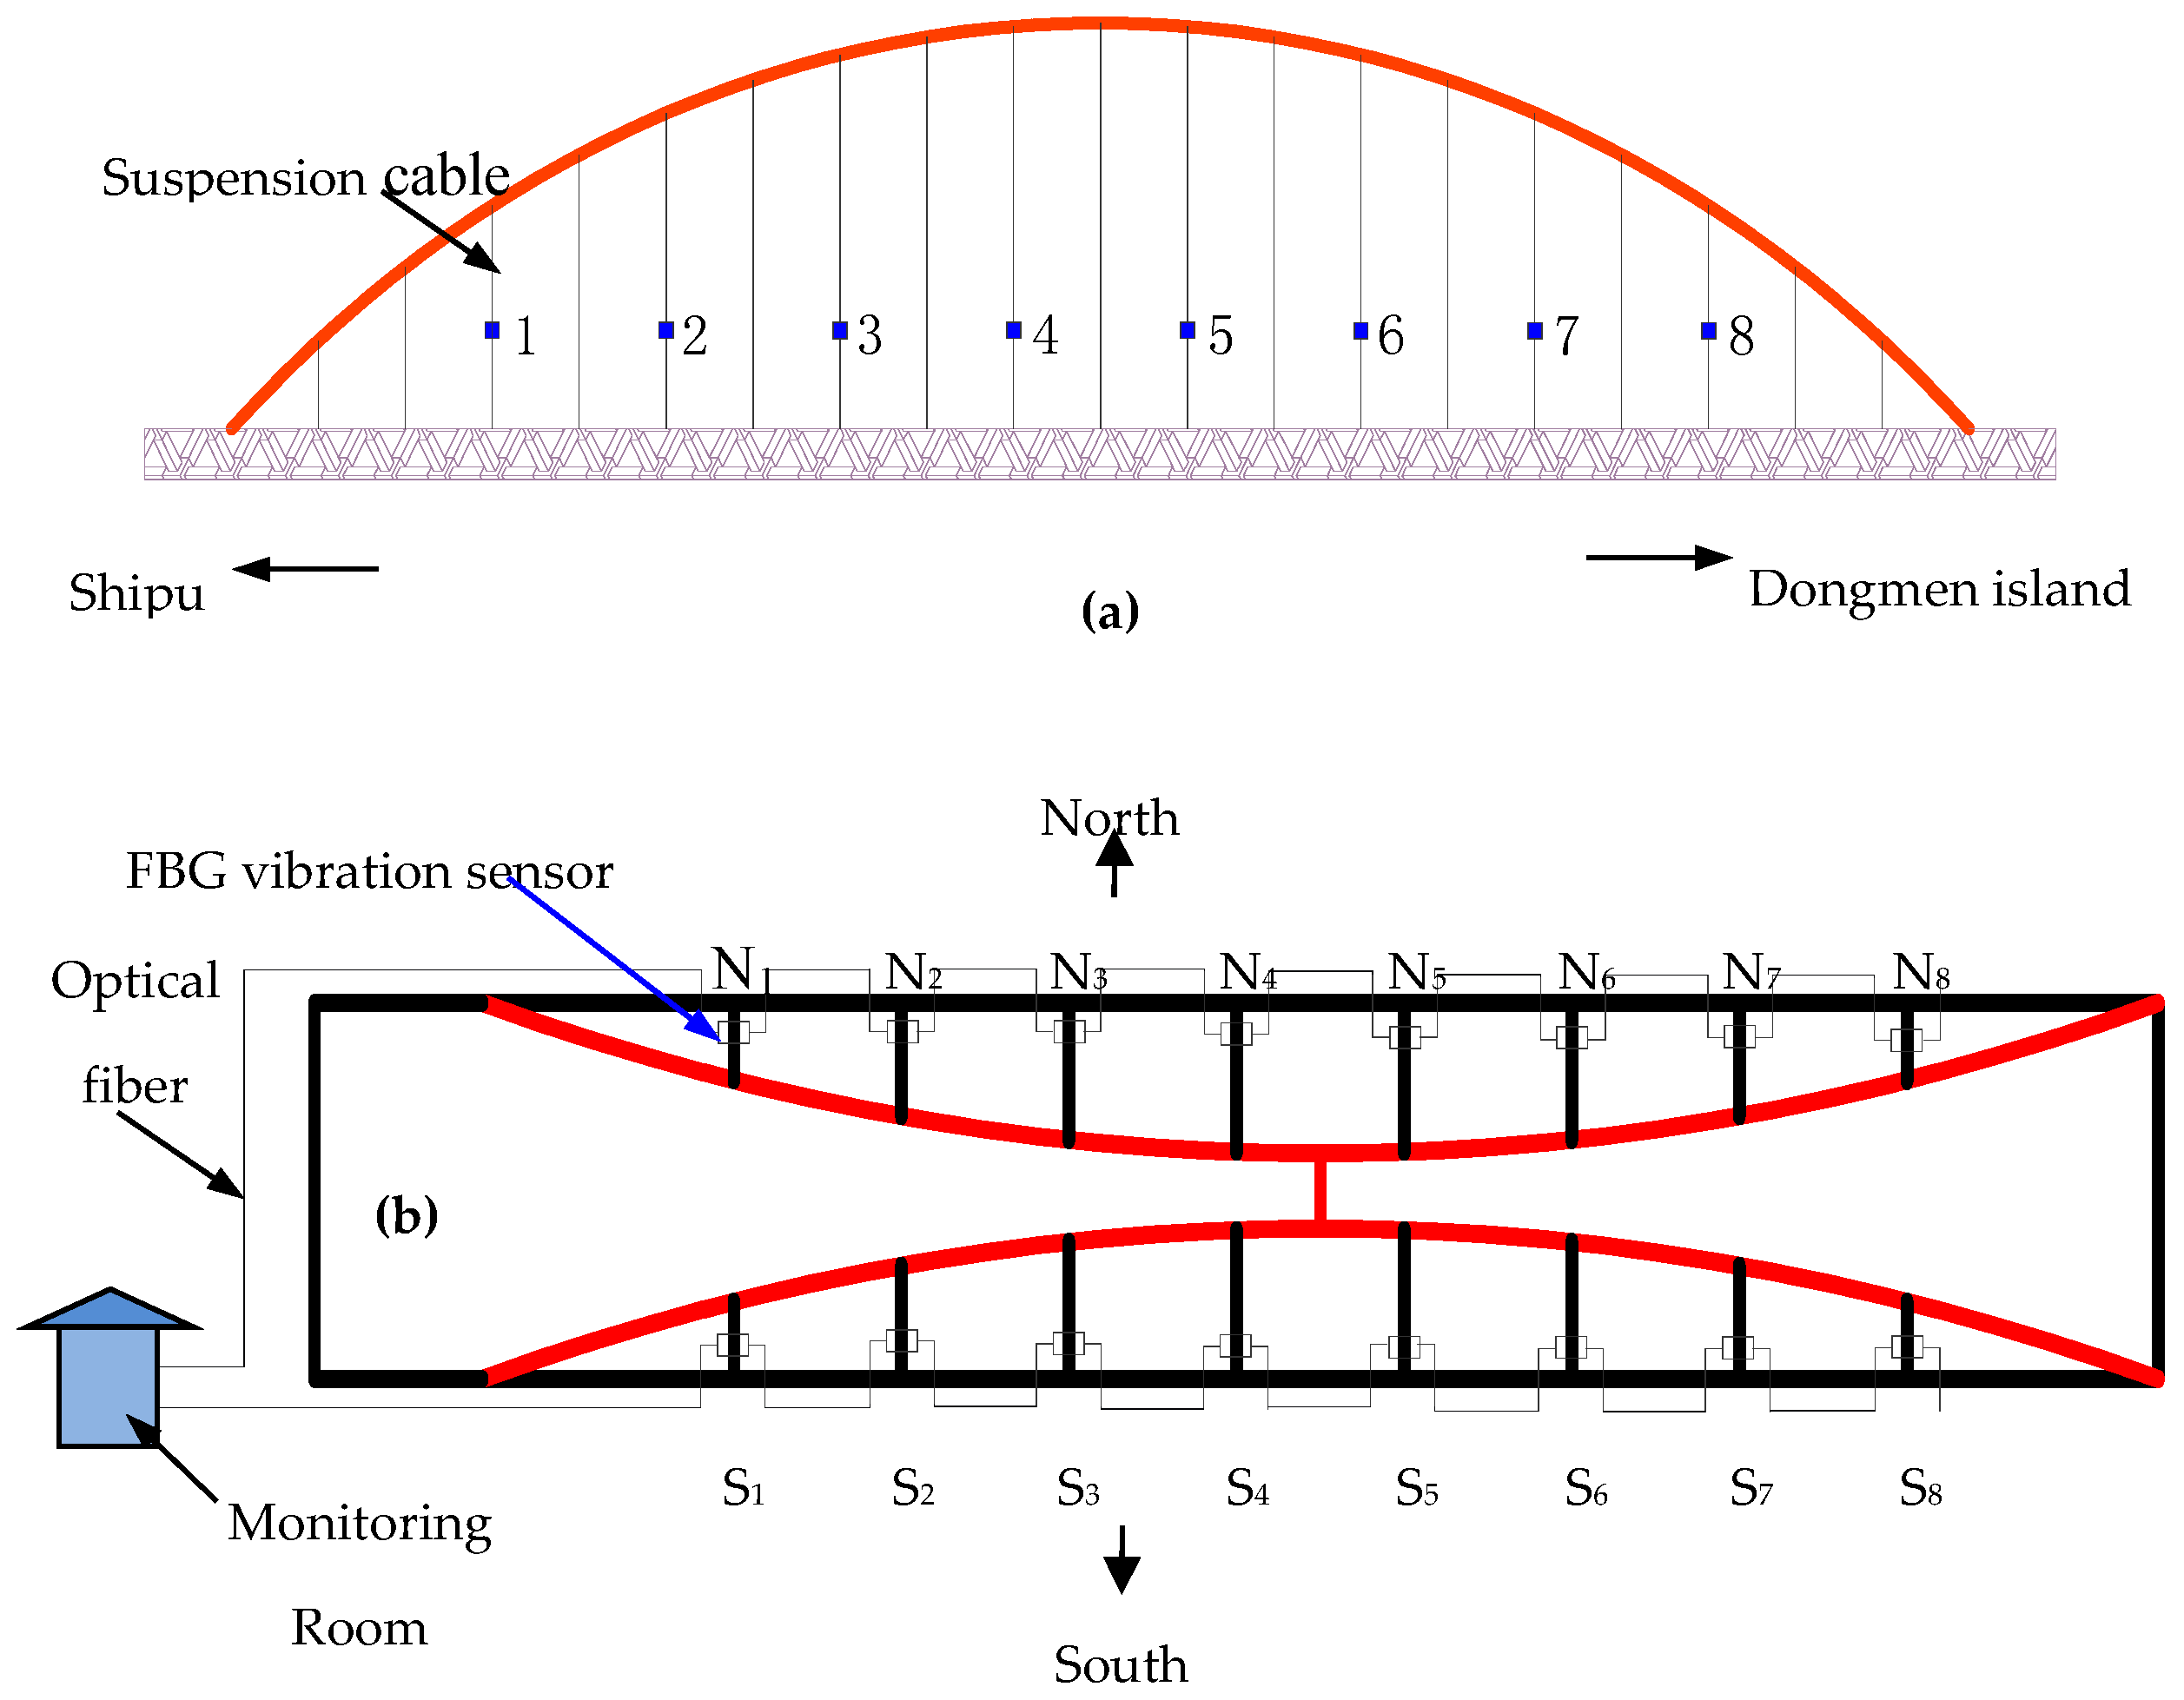
Figure 2.
Structural schematic diagram of the designed FBG sensor.

Figure 3.
Performance test of the FBG vibration sensor: (a) amplitude-frequency curve; (b) acceleration characteristics curve.
Figure 3.
Performance test of the FBG vibration sensor: (a) amplitude-frequency curve; (b) acceleration characteristics curve.

Figure 4.
Results of contrast experiment: (a) excitation frequency of 2 Hz; (b) excitation frequency of 5 Hz; (c) excitation frequency of 8 Hz.
Figure 4.
Results of contrast experiment: (a) excitation frequency of 2 Hz; (b) excitation frequency of 5 Hz; (c) excitation frequency of 8 Hz.
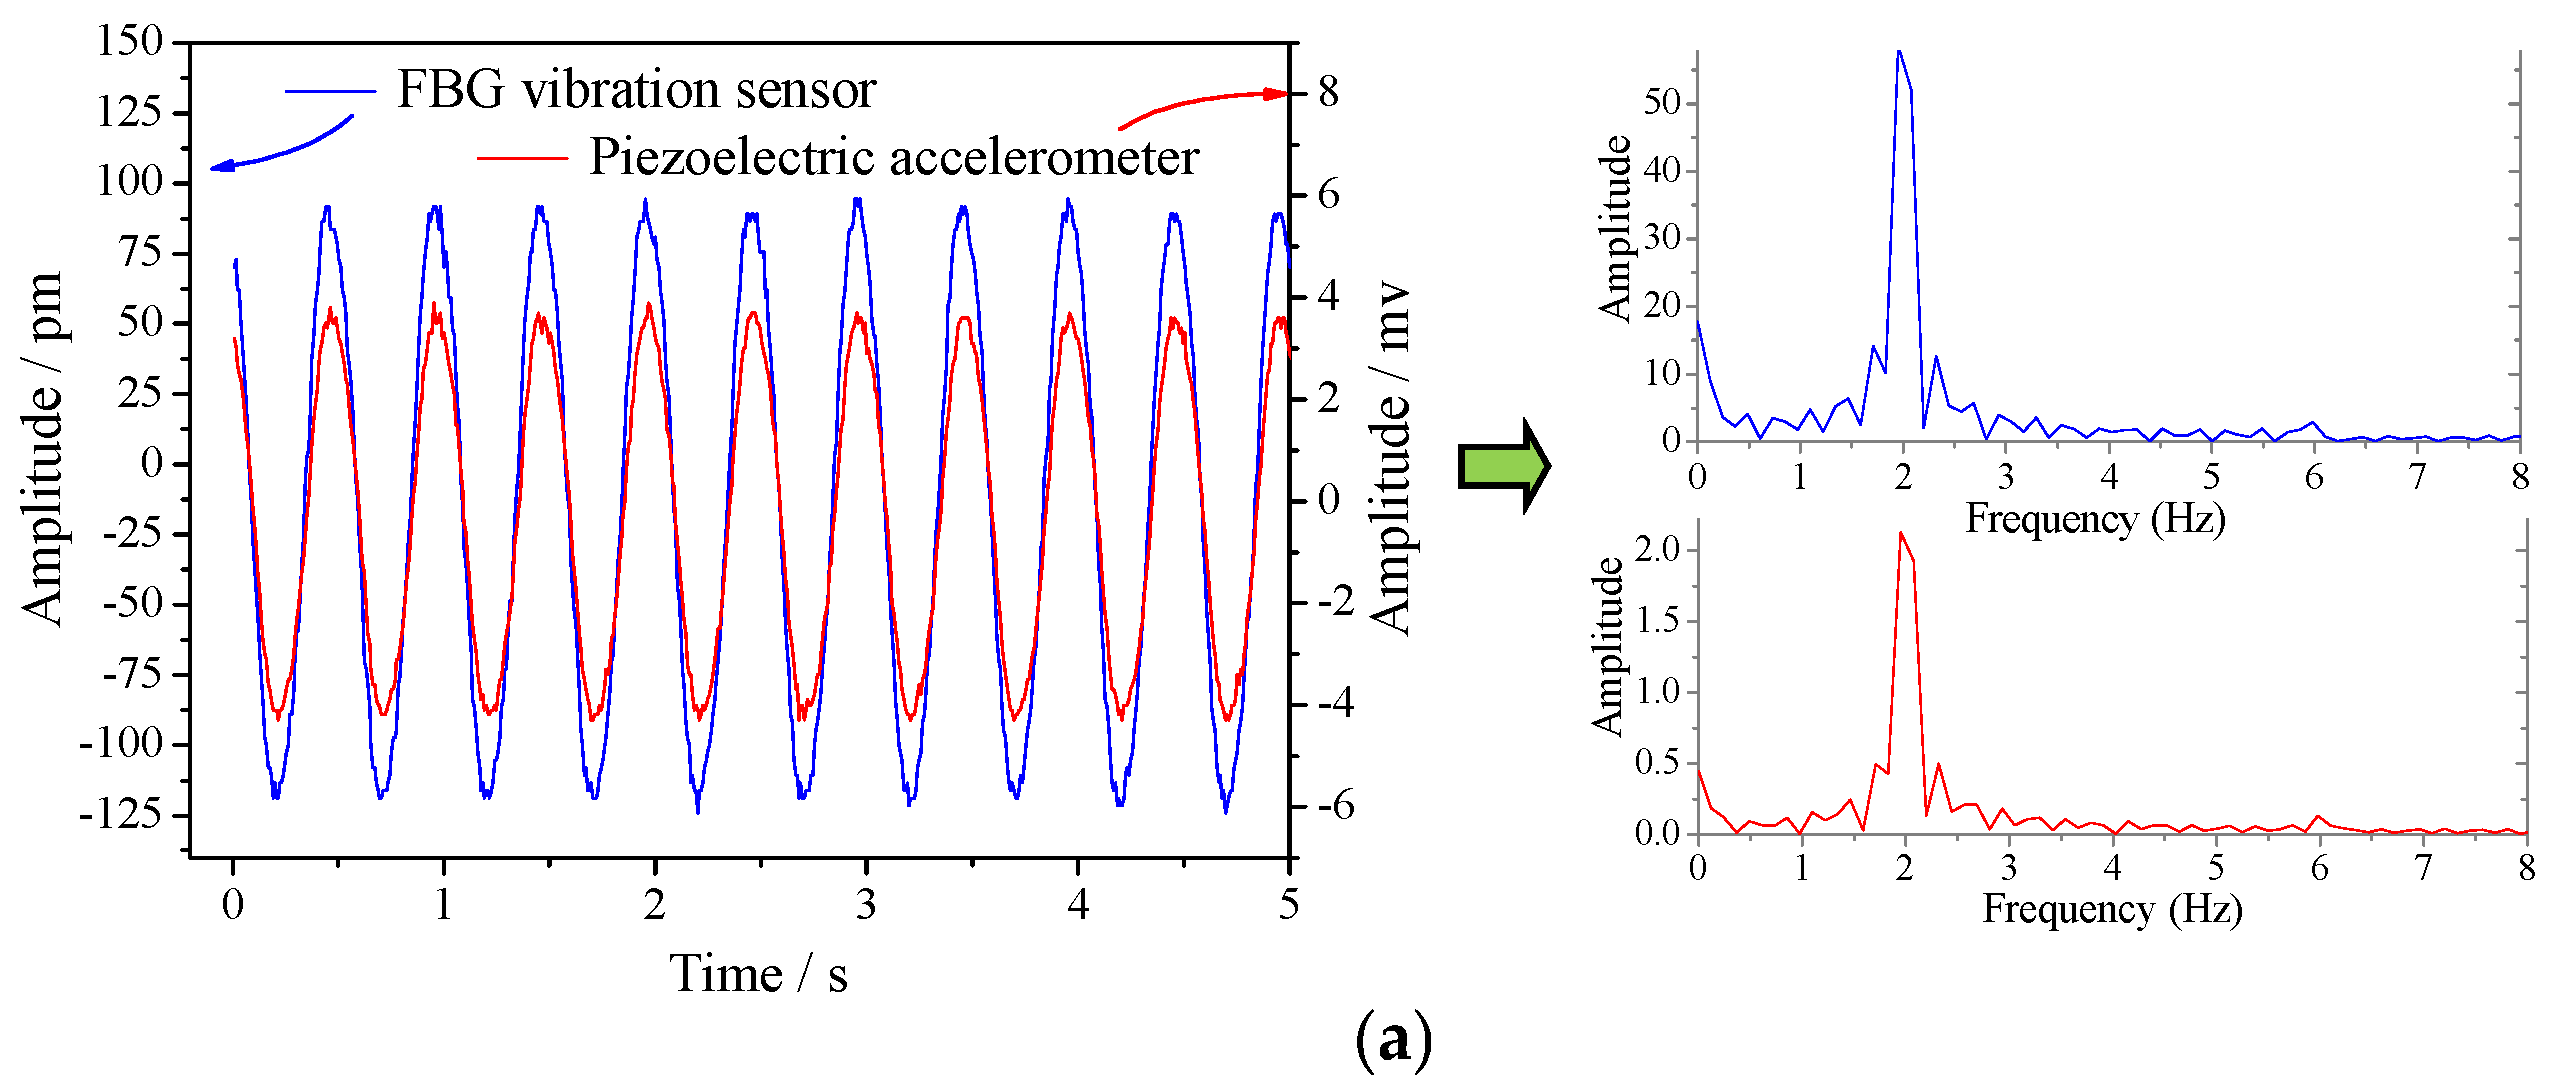
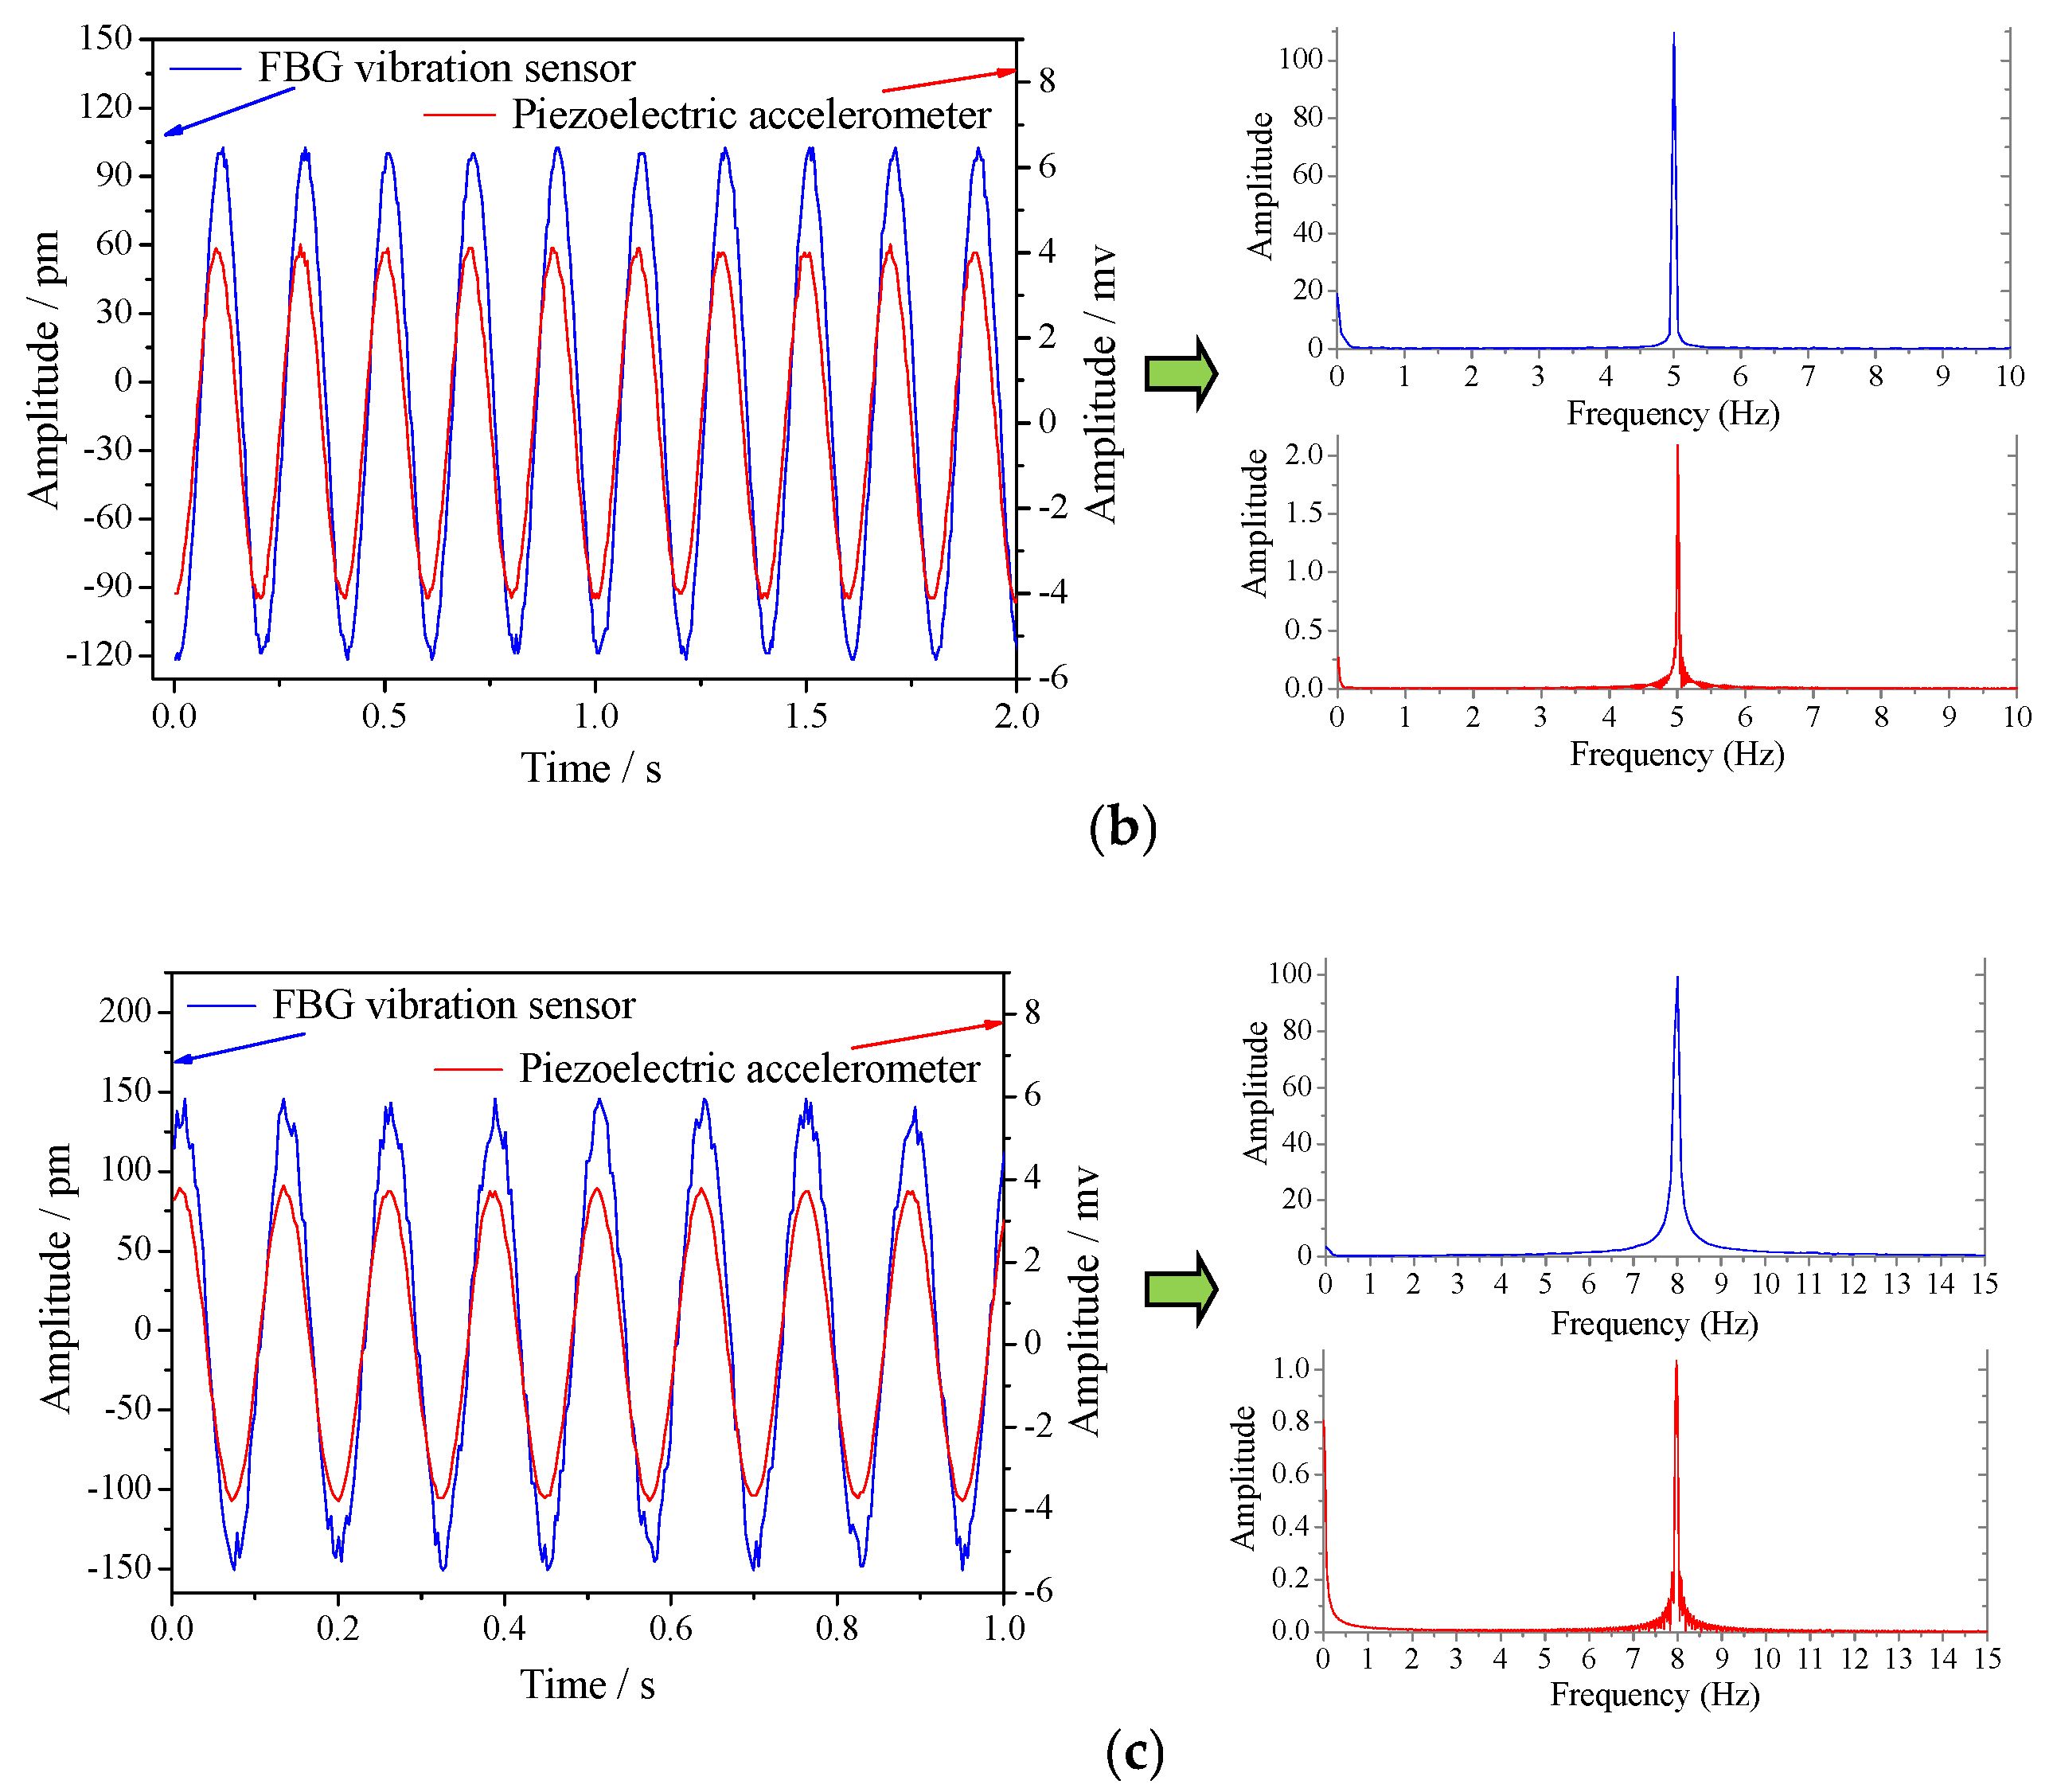
Figure 5.
Field mounted: (a) Photo of the FBG sensor; (b) photo of installed sensor on cable.
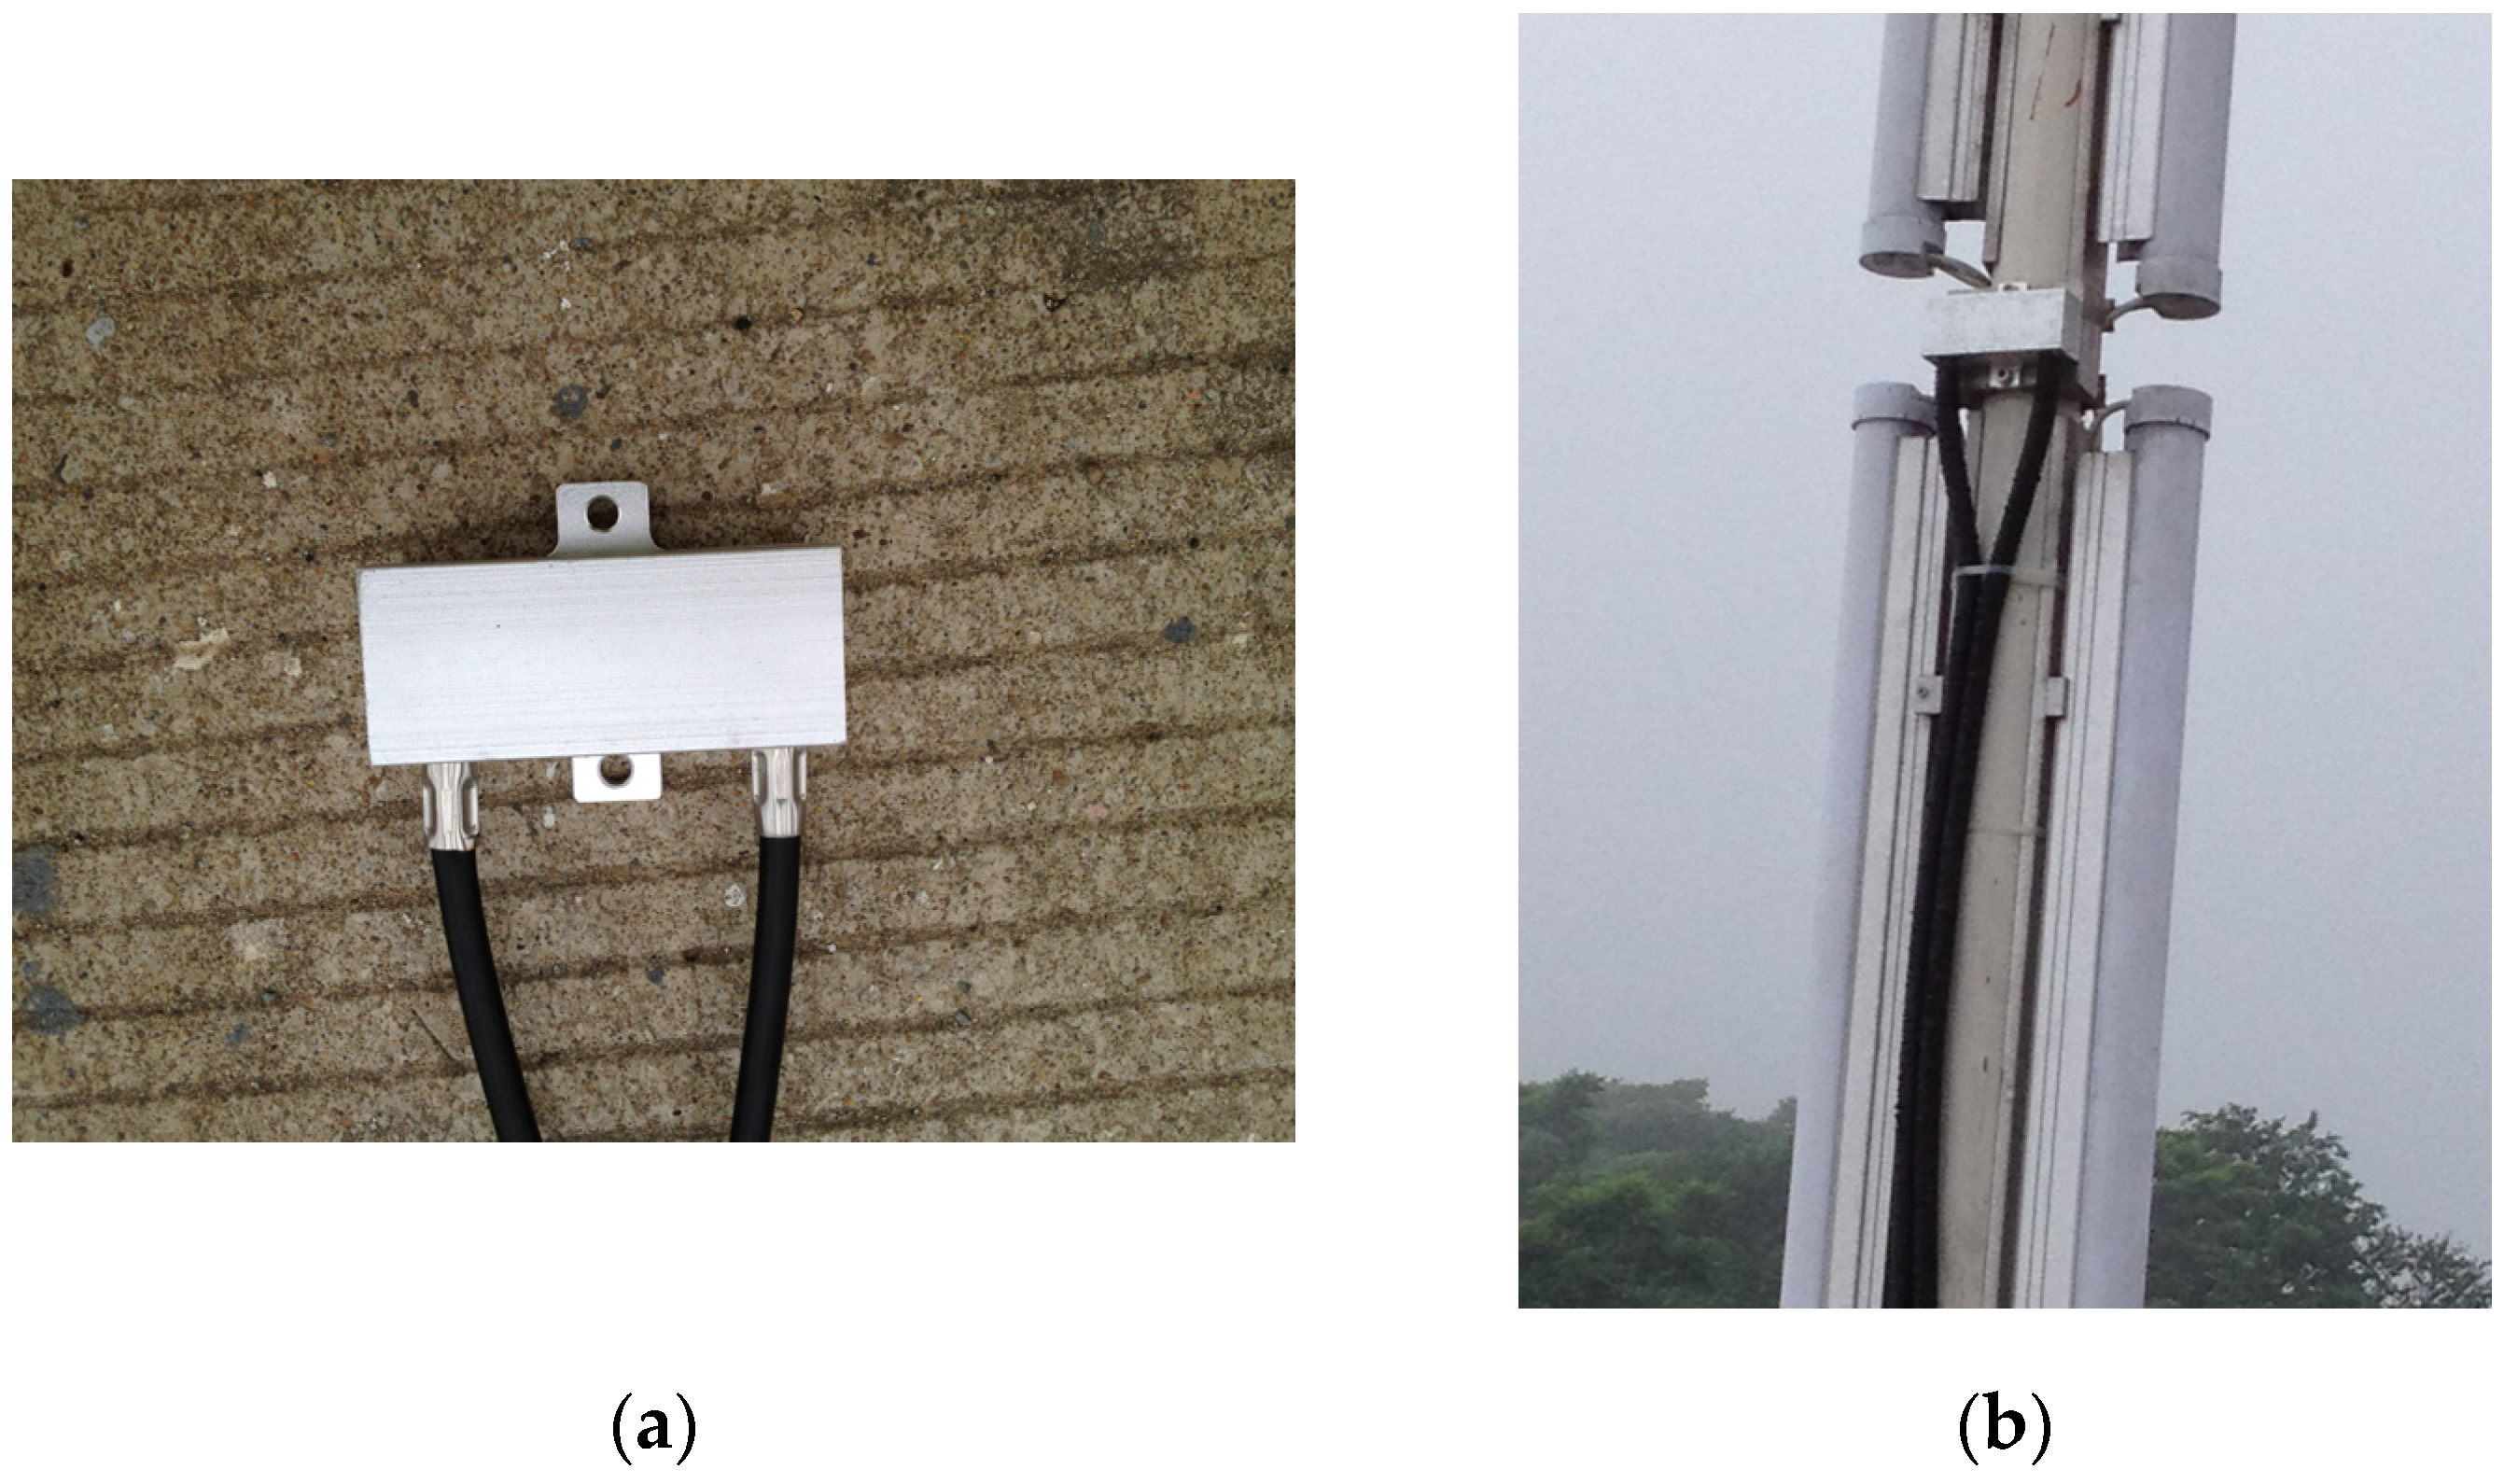
Figure 6.
Waveform of FBG sensor N1 for 160 s.

Figure 7.
Waveform and FFT spectrum of FBG sensor N1 for 0–80 s.

Figure 8.
Waveform and FFT spectrum of FBG sensor N1 for 80–160 s.

Figure 9.
Suspension cable force distribution data measured by FBG sensors: (a) south side suspension cables; (b) north side suspension cables.
Figure 9.
Suspension cable force distribution data measured by FBG sensors: (a) south side suspension cables; (b) north side suspension cables.

© 2017 by the authors. Licensee MDPI, Basel, Switzerland. This article is an open access article distributed under the terms and conditions of the Creative Commons Attribution (CC BY) license (http://creativecommons.org/licenses/by/4.0/).
Share and Cite
MDPI and ACS Style
Hu, D.; Guo, Y.; Chen, X.; Zhang, C. Cable Force Health Monitoring of Tongwamen Bridge Based on Fiber Bragg Grating. Appl. Sci. 2017, 7, 384. https://doi.org/10.3390/app7040384
AMA Style
Hu D, Guo Y, Chen X, Zhang C. Cable Force Health Monitoring of Tongwamen Bridge Based on Fiber Bragg Grating. Applied Sciences. 2017; 7(4):384. https://doi.org/10.3390/app7040384
Chicago/Turabian StyleHu, Dongtao, Yongxing Guo, Xianfeng Chen, and Congrui Zhang. 2017. "Cable Force Health Monitoring of Tongwamen Bridge Based on Fiber Bragg Grating" Applied Sciences 7, no. 4: 384. https://doi.org/10.3390/app7040384
Note that from the first issue of 2016, this journal uses article numbers instead of page numbers. See further details here.