
A Study on the Optimal Actuation Structure Design of a Direct Needle-Driven Piezo Injector for a CRDi Engine

1
Department of Mechanical Engineering, Graduate School, Soongsil University, Seoul 06978, Korea
2
Department of Mechanical Engineering, Soongsil University, Seoul 06978, Korea
*
Author to whom correspondence should be addressed.
Appl. Sci. 2017, 7(4), 320; https://doi.org/10.3390/app7040320
Submission received: 13 January 2017
/
Revised: 13 March 2017
/
Accepted: 14 March 2017
/
Published: 24 March 2017
(This article belongs to the Special Issue Internal Combustion Engines (ICE) for Ground Transport)
Abstract
:Recently, the high-pressure fuel injection performance of common-rail direct injection (CRDi) engines has become more important, due to the need to improve the multi-injection strategy. A multiple injection strategy provides better emission and fuel economy characteristics than a normal single injection scheme. The CRDi engine performance changes with the type of high-pressure electro-mechanical injector that is used and its injection response in a multi-injection scheme. In this study, a direct needle-driven piezo injector (DPI) was investigated, to optimize its actuation components, including the plate length, number of springs, and the elasticity of the spring between the injector needle and the piezo stack. Three prototype DPIs were proposed by this research. They were classified as Type 1, 2, and 3, depending on whether the injector needle was hydraulic or mechanical. Then, the optimal prototype was determined by conducting four evaluation experiments analyzing the maximum injection pressure, injection rate, spray visualization, and real engine combustion application. As a result, it was found that the Type 3 DPI prototype, with several pan-springs and plates, had the highest injection pressure, a steady injection rate, and the fastest spray speed. It also demonstrated the most effective emission reduction for a two-stage rapid spray injection in a single-cylinder CRDi engine. The Type 3 DPI displays an increased elasticity from its hydraulic needle that provides a synergy effect for improving DPI actuation.
1. Introduction
The combustion process in an automotive engine is never perfect and small amounts of more harmful emissions are also produced in internal combustion engines. In order to reduce engine emissions, modern automotive engines carefully control the amount of fuel that they burn. The thermal efficiency of a combustion engine is defined as the relationship between the total energy contained in the fuel, and the amount of energy used to perform useful work or generate kinetic energy. Carbon dioxide (CO2) emissions, as a product of combustion by bonding the carbon in the fuel with the oxygen in the air, are by far the largest amount of emissions produced by internal combustion engine vehicles. Until recently, they were thought to pose no immediate threat to the environment and the health of human beings. Therefore, CO2 has not been regulated in the same way as HC, CO, and NOx. However, due to recent concerns about the increasing production of greenhouse gases and the increasing use of fossil fuels, regulators have begun attempts to limit the release of CO2 and other greenhouse gases into the atmosphere. The ICCT (International Council on Clean Transportation) [1] says that most developed countries have set CO2 emissions targets for new vehicles. Compared to the EU’s target of 95 g CO2/km by 2020/2021, the US’s 97 g CO2/km by 2025 for passenger cars, Canada’s 97 g CO2/km by 2025, China’s 117 g CO2/km by 2020, and South Korea’s 97 g CO2/km by 2020, illustrate similar targets.
Recently, combustion engine vehicles with a high fuel economy have also been included as eco-friendly vehicles that have less harmful impacts on the environment. In general, modern practical engines are always compromised by trade-offs between different properties, such as efficiency, weight, power, exhaust emissions, or NVH (noise, vibration, harshness). Sometimes, the economy not only plays a role in the engine manufacturing cost, but also in the manufacturing and distributing of the fuel. Increasing the engine’s efficiency produces a better fuel economy. Reduced exhaust emissions have been strengthened in passenger cars and light duty trucks after EURO 1 was initiated in 1992. Europe adopted EURO 6 in 2013, and it was applied in South Korea in 2014. Nitrogen oxides (NOx) of 80% and particulate matters (PM) of 60% are now more tightened than EURO 5. Some countermeasure technologies have been developed for satisfying this regulation. Among them, clean diesel vehicles and combustion engine-based hybrid electric vehicles have been studied, requiring a great deal of high-tech concentration. Specifically, a common-rail direct injection system is at the core of clean diesel technology. This makes it possible to pressurize above 200 MPa and then spray fuel into the combustion chamber through an electro-hydraulic injector. This presents accurate and precise fuel spraying using electronic control and is a great development for clean diesel engines.
Typical solenoid-driven and piezo-driven fuel injectors can generate a favorable response and provide an effective injection in a common-rail direct injection system. These effects reduce exhaust emissions and improve the combustion performance in a clean diesel engine. Therefore, a rapid injector needle response and multiple injections are needed to obtain a high degree of freedom spray strategy, in order to improve diffusion combustion with a higher air to fuel (A/F) mixing ratio, reduce exhaust emissions, and increase engine performance. Research [2,3] has shown that five to seven multiple injections and rapid On/Off switching of the injector hole by the needle can freely control the shape of the injection rate. Daiji Ueda, etc., announced G4P (4th generation diesel piezo) injector concepts, structures, and hydraulic performances, using a rectangular injection rate and shorter multiple injection intervals. Also, they showed engine performance improvement results with G4P [2]. Arpaia, A., etc., reported that a numerical model for simulating a piezo indirect acting fuel injection system under a steady state and transient operating conditions was conducted through a commercial code [3]. Other papers [4], referring to the above result, showed that an injection mechanism with a high-pressure performance reduces not only harmful PM exhaust emissions, but also the auto-ignition combustion performance. However, the design of the piezo injector needs further improvement to increase the response of the injector needle.
In this study, a direct needle-driven piezo injector (DPI) based on the Delphi product [5] was considered to improve injection characteristics with a maximum injection pressure, injection response, and manufacturing simplicity. For investigation, three steps were followed in this study: spray visualization based on Mie-scattering, an injection rate measurement, and a compression ignition (CI) combustion experiment based on a single-cylinder CRDi engine. DPI prototype design concepts focused on an internal DPI constitution, depending on whether or not a hydrodynamic needle was used. This study investigates the injection characteristics and combustion performance of three prototype DPIs, to obtain practical results. The effects of the internal design structure of the direct needle-driven piezo-injector and its optimal design parameters on the spray formation and CI combustion are discussed experimentally.
2. Experimental Apparatus and Procedure
2.1. Design Concept of Prototype DPIs
By using a solenoid coil or a piezo stack as an actuator, diesel injectors have recently been designed in response to stringent emission regulations. A solenoid-driven injector, operated by peak and hold current control, is still commonly used for its cost effectiveness, reliability, and smaller unit size. However, this type of injector is likely to exhibit an injection delay. Therefore, a number of studies [6,7] have focused on the characteristics and injection flexibility of a piezo-driven injector.
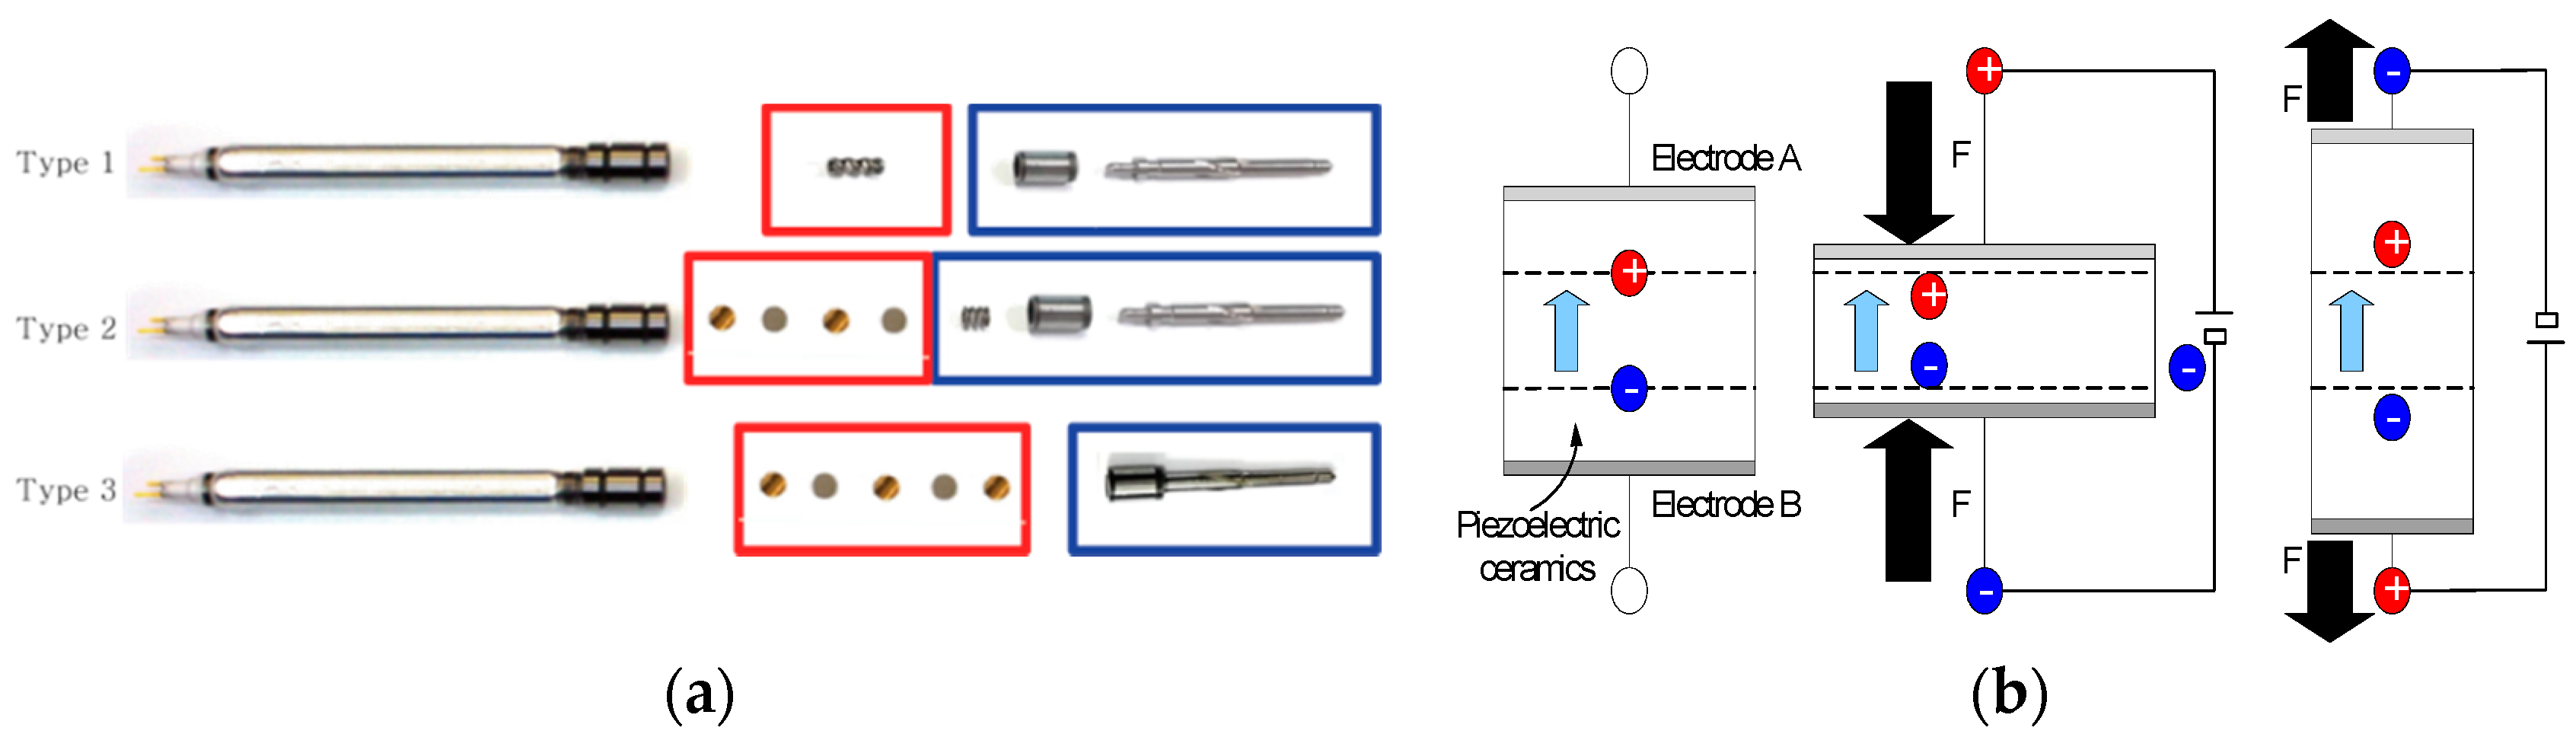
A DPI directly utilizes a longer piezo stack to lift the needle for injections. The longer piezo stack generates enough displacement for the lifting using an adapting amplifier located between the needle and the piezo stack. The elongation generated by the piezo stack is used to directly control the needle. During DPI operation, the piezo stack shrinks when its electric energy is discharged. This causes the needle to move upward and reveal previously blocked injector holes. Then, high-pressure fuel is injected through the injector holes. This allows the DPI to have a low fuel consumption by controlling various injection rates. Therefore, as shown in Figure 1, the prototype DPI design concepts in this study focused on the internal DPI construction with three types. Type 1 uses a needle body, a cylindrical shell, and a spring. This type is simple to make, produces a good response, and reduces the unit cost. Type 2 consists of pan-springs, plates, a needle body, a needle cylindrical shell, and a small spring. There is no cap to decrease the hydraulic influence and increase the needle response. Type 3 is constructed without limiting the number of pan-springs and plates. It is designed using a needle that has a needle body, a cylindrical shell, a spring, and cap. This design allows hydraulics to be used. This Type 3 design is used to analyze and study the injector influence by varying the number of plate springs and pressure plates.
2.2. Experimental Apparatus and Methods
2.2.1. Maximum Injection Pressure Measurement
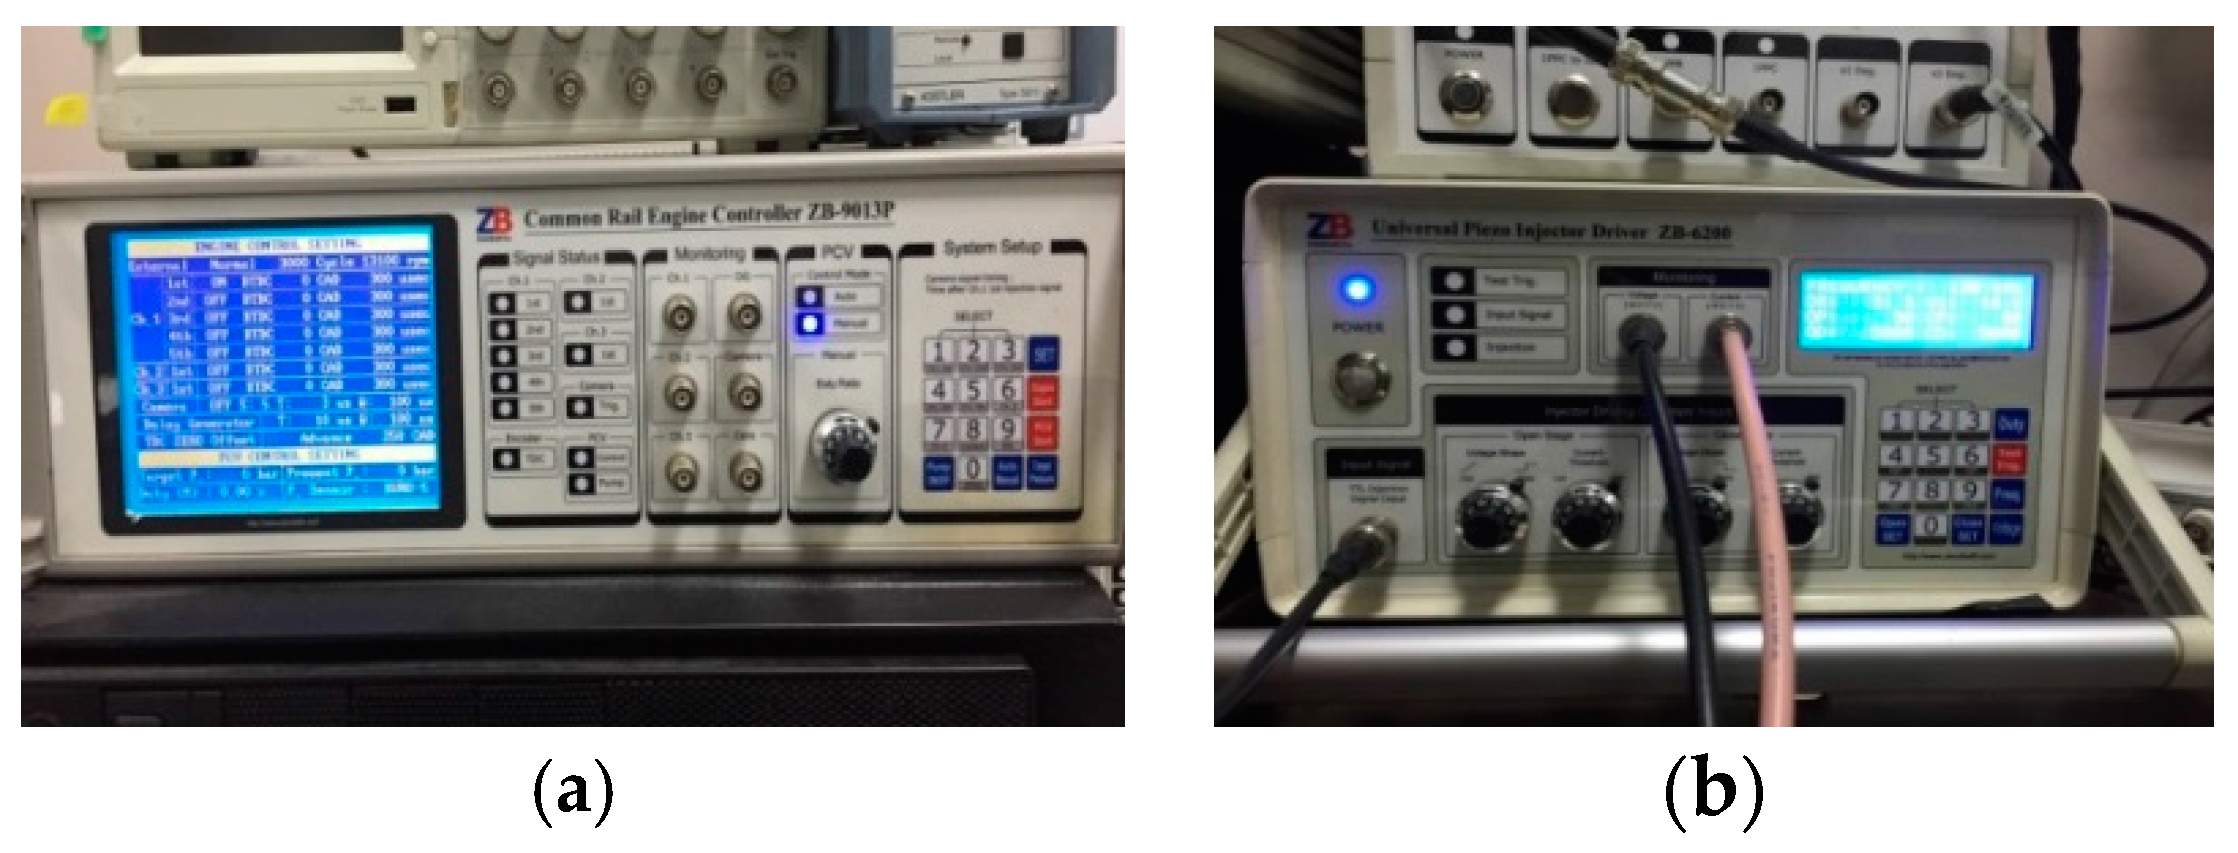
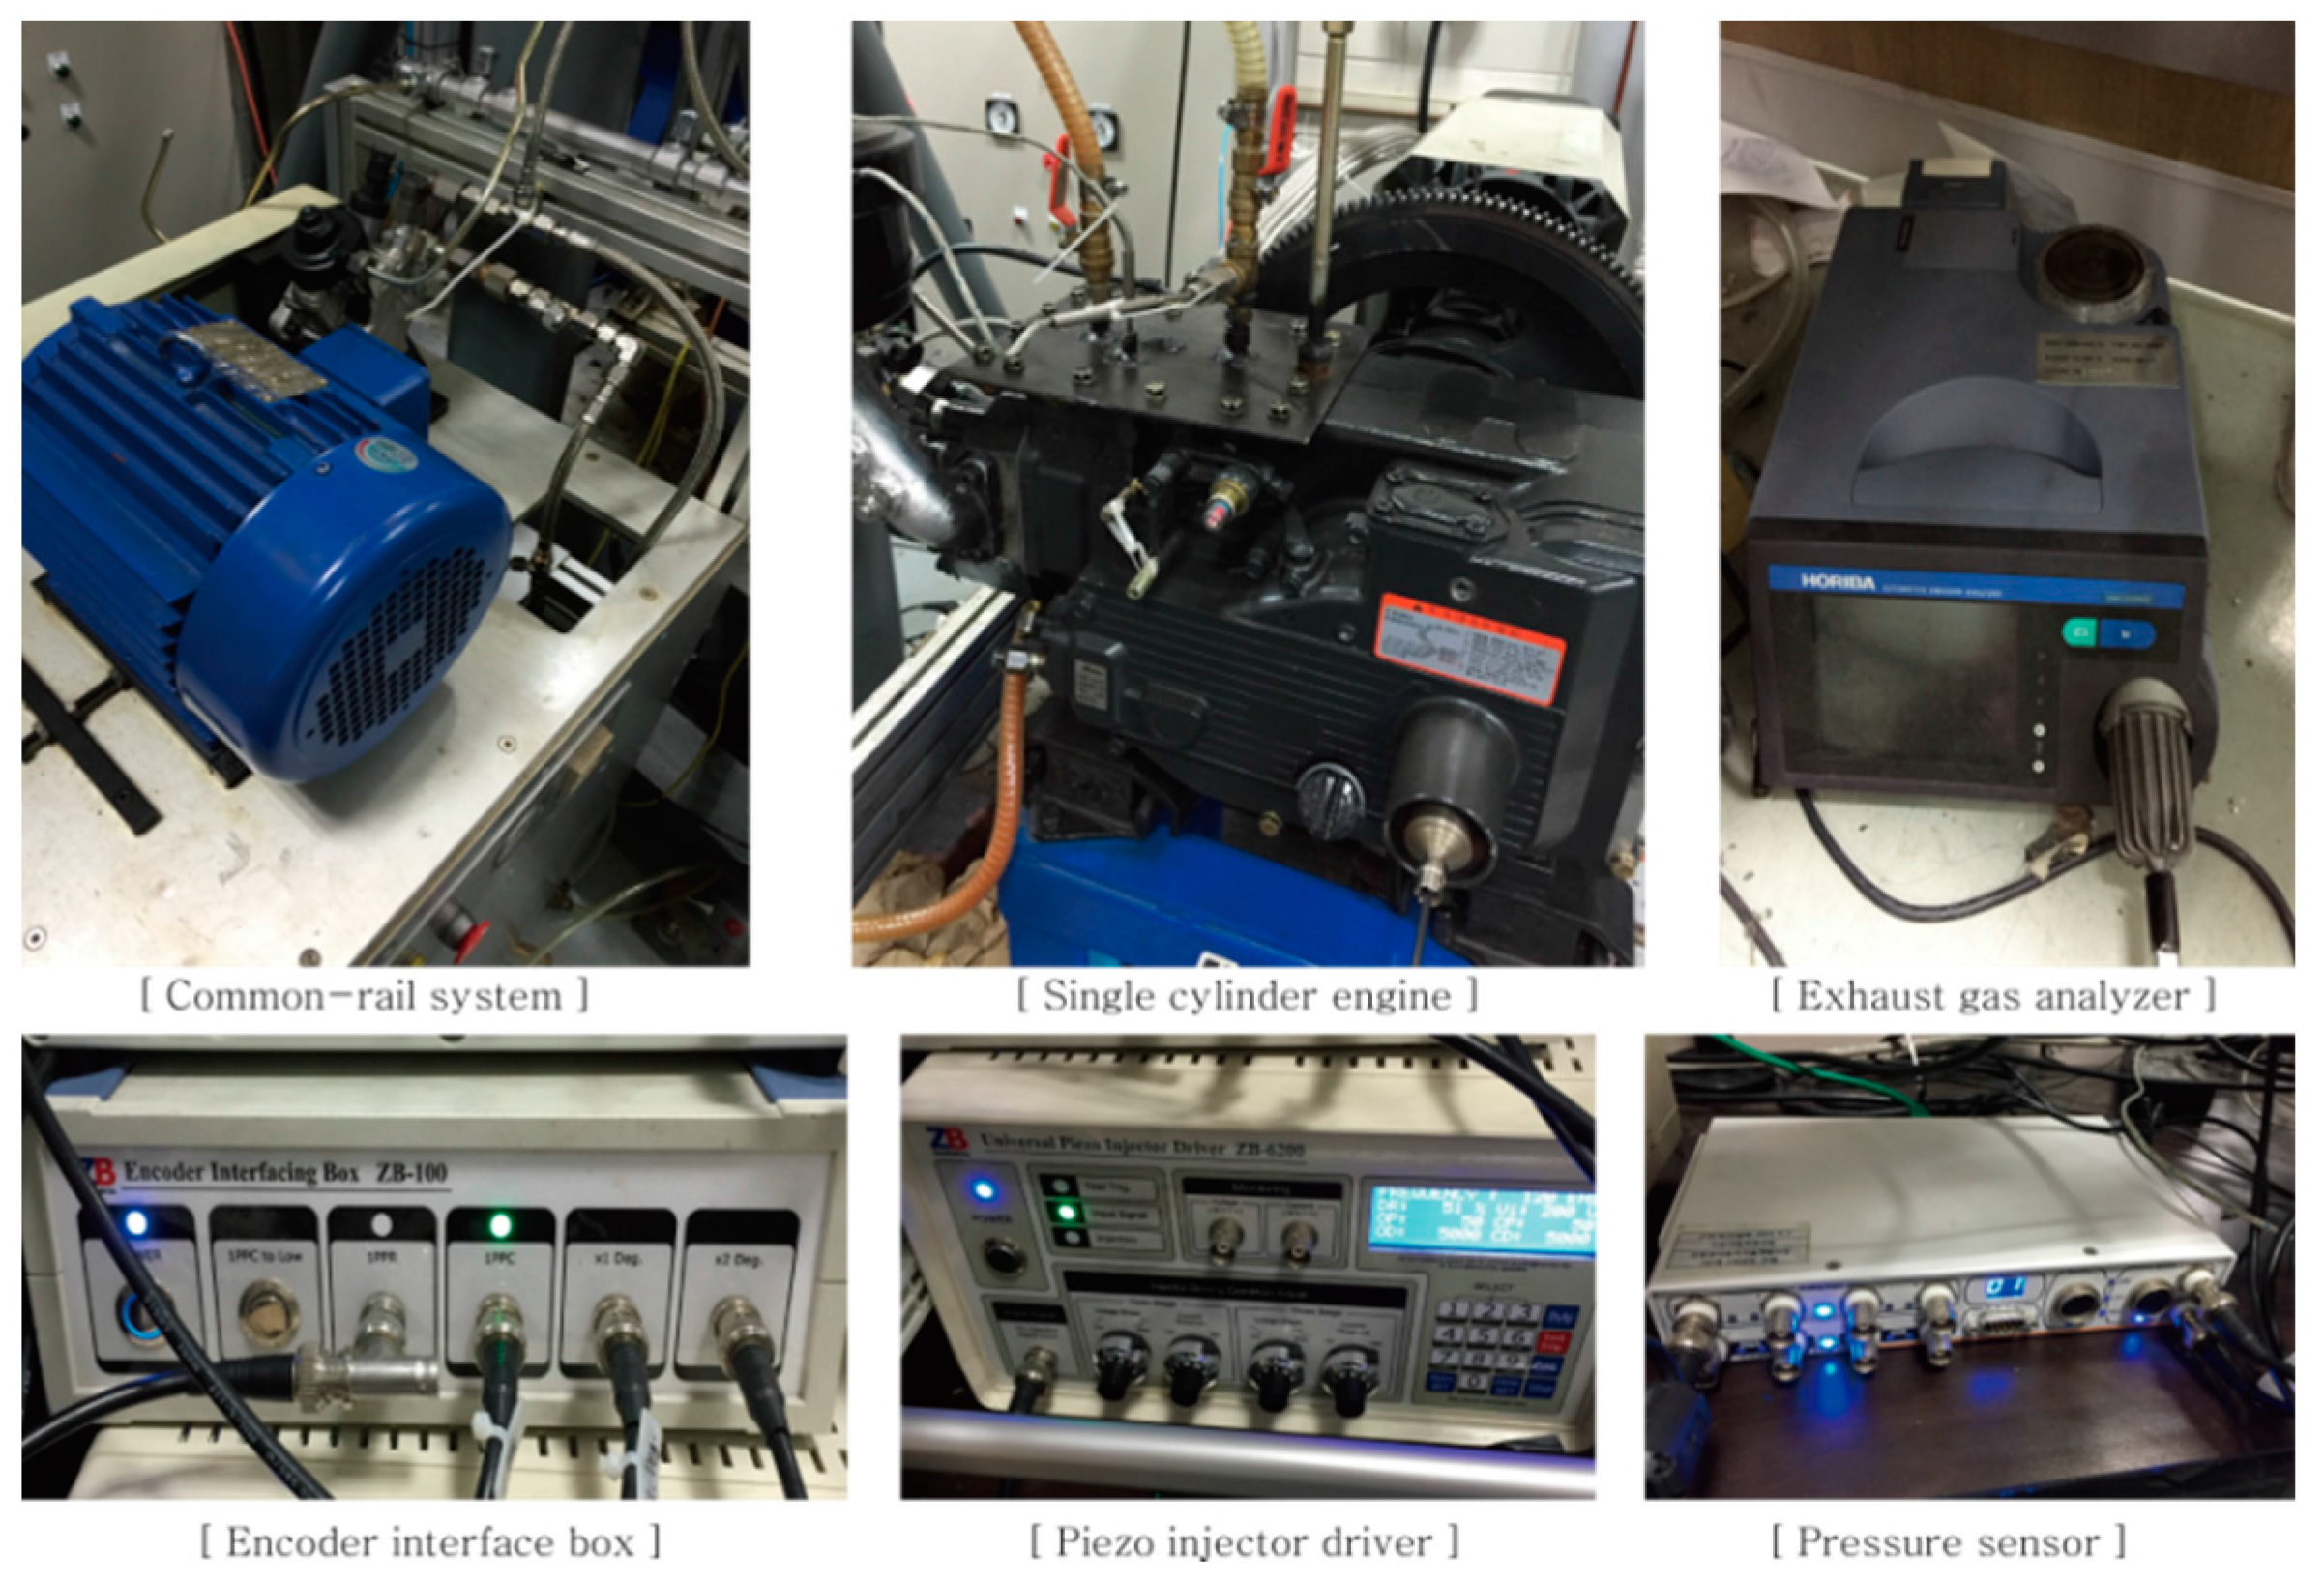
A 1.5 kW class 3-phase motor (Hyosung Co., Seoul, Korea) was used as a high-pressure injection pump for a common-rail system. It can pressurize up to 200 MPa, in order to inject at the maximum possible injection pressure, as listed in Table 1. A temperature sensor is placed inside the fuel tank to automatically turn on and off the radiator and a cooling fan is used to keep the temperature constant. As shown in Figure 2, the injection period and the injection pressure were controlled through the common rail controller (Zenobalti Co., Model:ZB-9013, Daejeon, Korea) and the universal piezo injector driver (Zenobalti Co., Model:ZB-6200, Korea).
2.2.2. Injection Rate Measurement
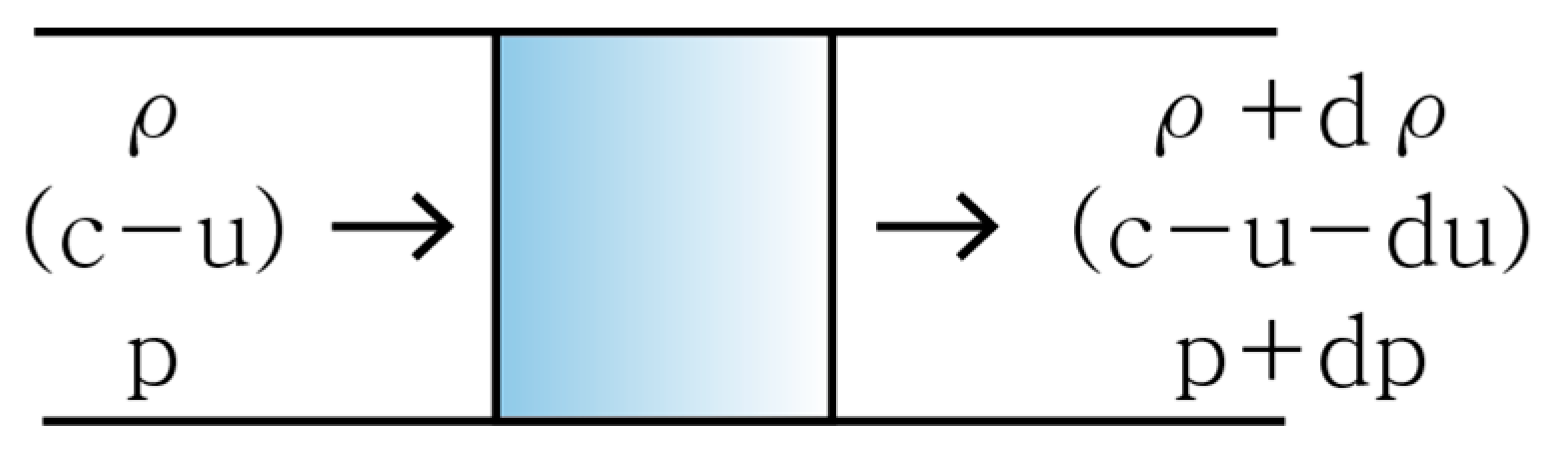
There are two methods which can be used to measure the injection rate. The Zeuch method obtains the injection rate after injecting fuel into the pressure vessel. With the Bosch-Tube method, fuel is injected into the pipe to detect the pressure change in the injection rate meter. Then, the injection rate is measured. In this study, the Bosch-Tube method was used [5]. The Bosch-Tube measurement principle involves feeding the fuel into the pipe with a cross-sectional area A and selecting the fuel control volume in the pipe flowing at the speed of sound as when the fuel in the pipe moves at a speed of u. The characteristics of the fuel moving inside can be expressed as shown in Figure 3. By knowing the sonic velocity and fuel density in the pipe and ascertaining the pressure change in the chamber, the injection rate can be calculated.
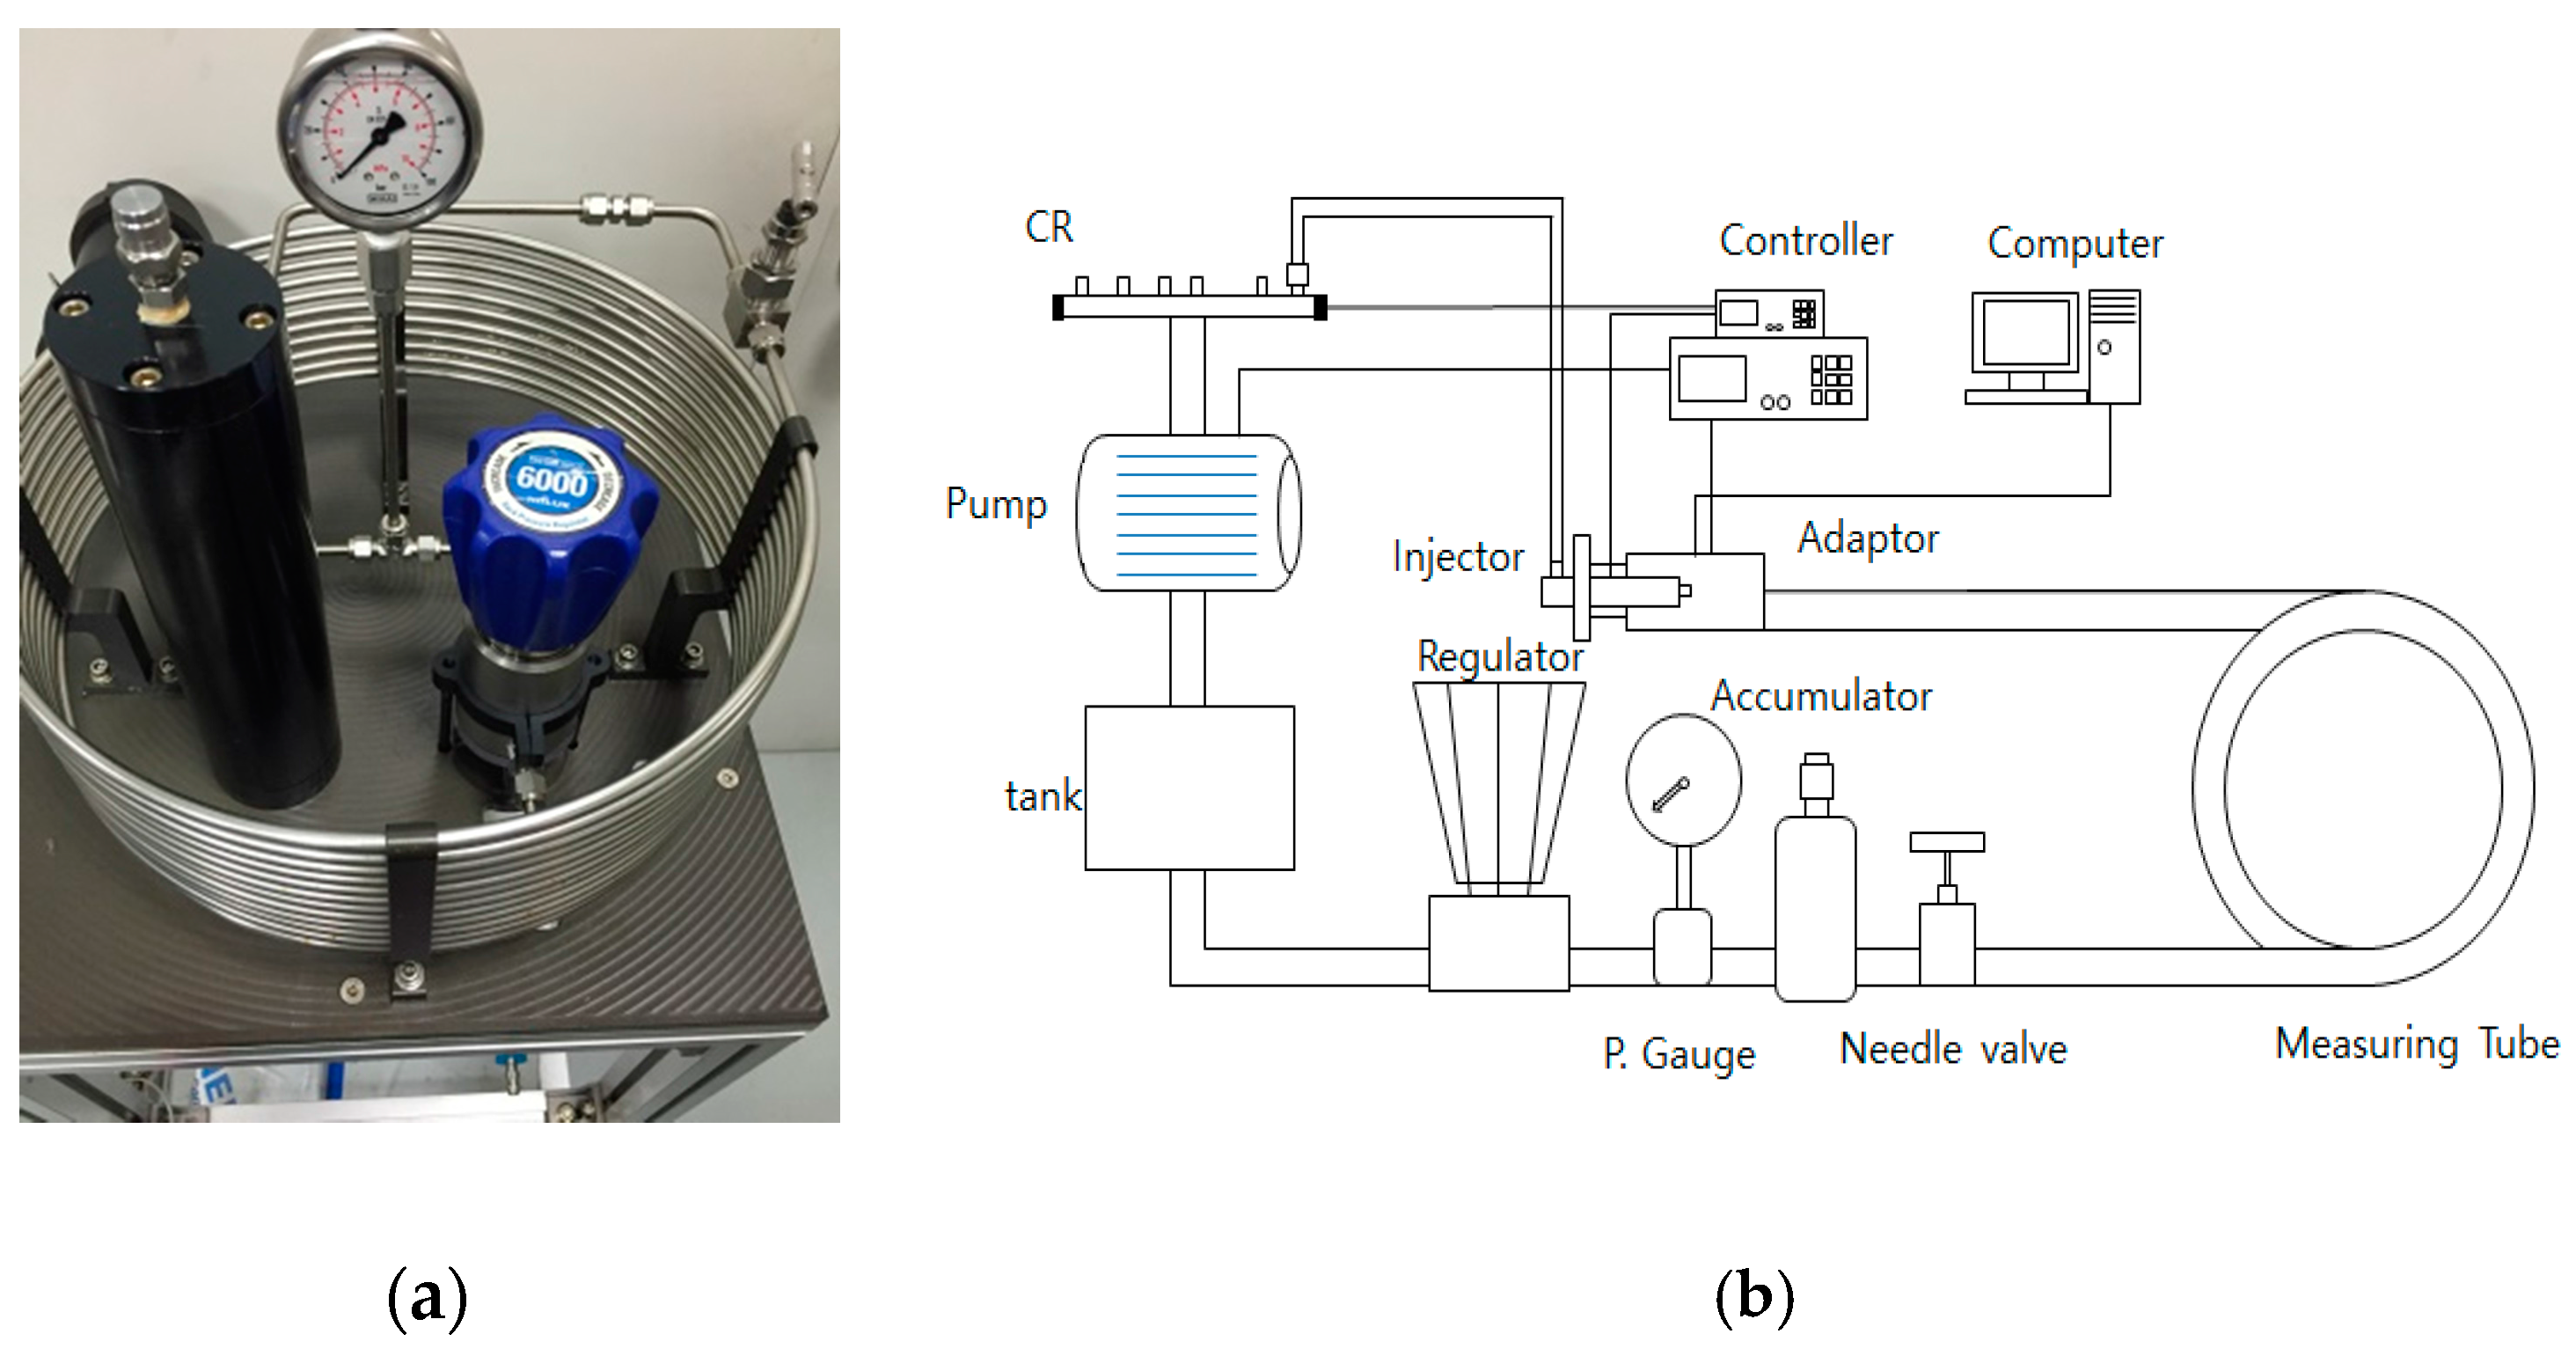
As shown in Figure 4, the injection rate measurement system consists of a measuring tube with a length of about 12.6 m, needle valve, accumulator, pressure gauge, and regulator. The injector is installed on the adapter in the injection rate measuring device and is connected to the common-rail to supply high-pressure fuel. When fuel injection starts, the injection rate is measured by passing the fluid through the pressure sensor (Kistler, Model:6052c, Winterthur, Switzerland) that is mounted on the adapter. The experimental conditions for the injection rate are expressed in Table 2.
2.2.3. Spray Visualization Measurement
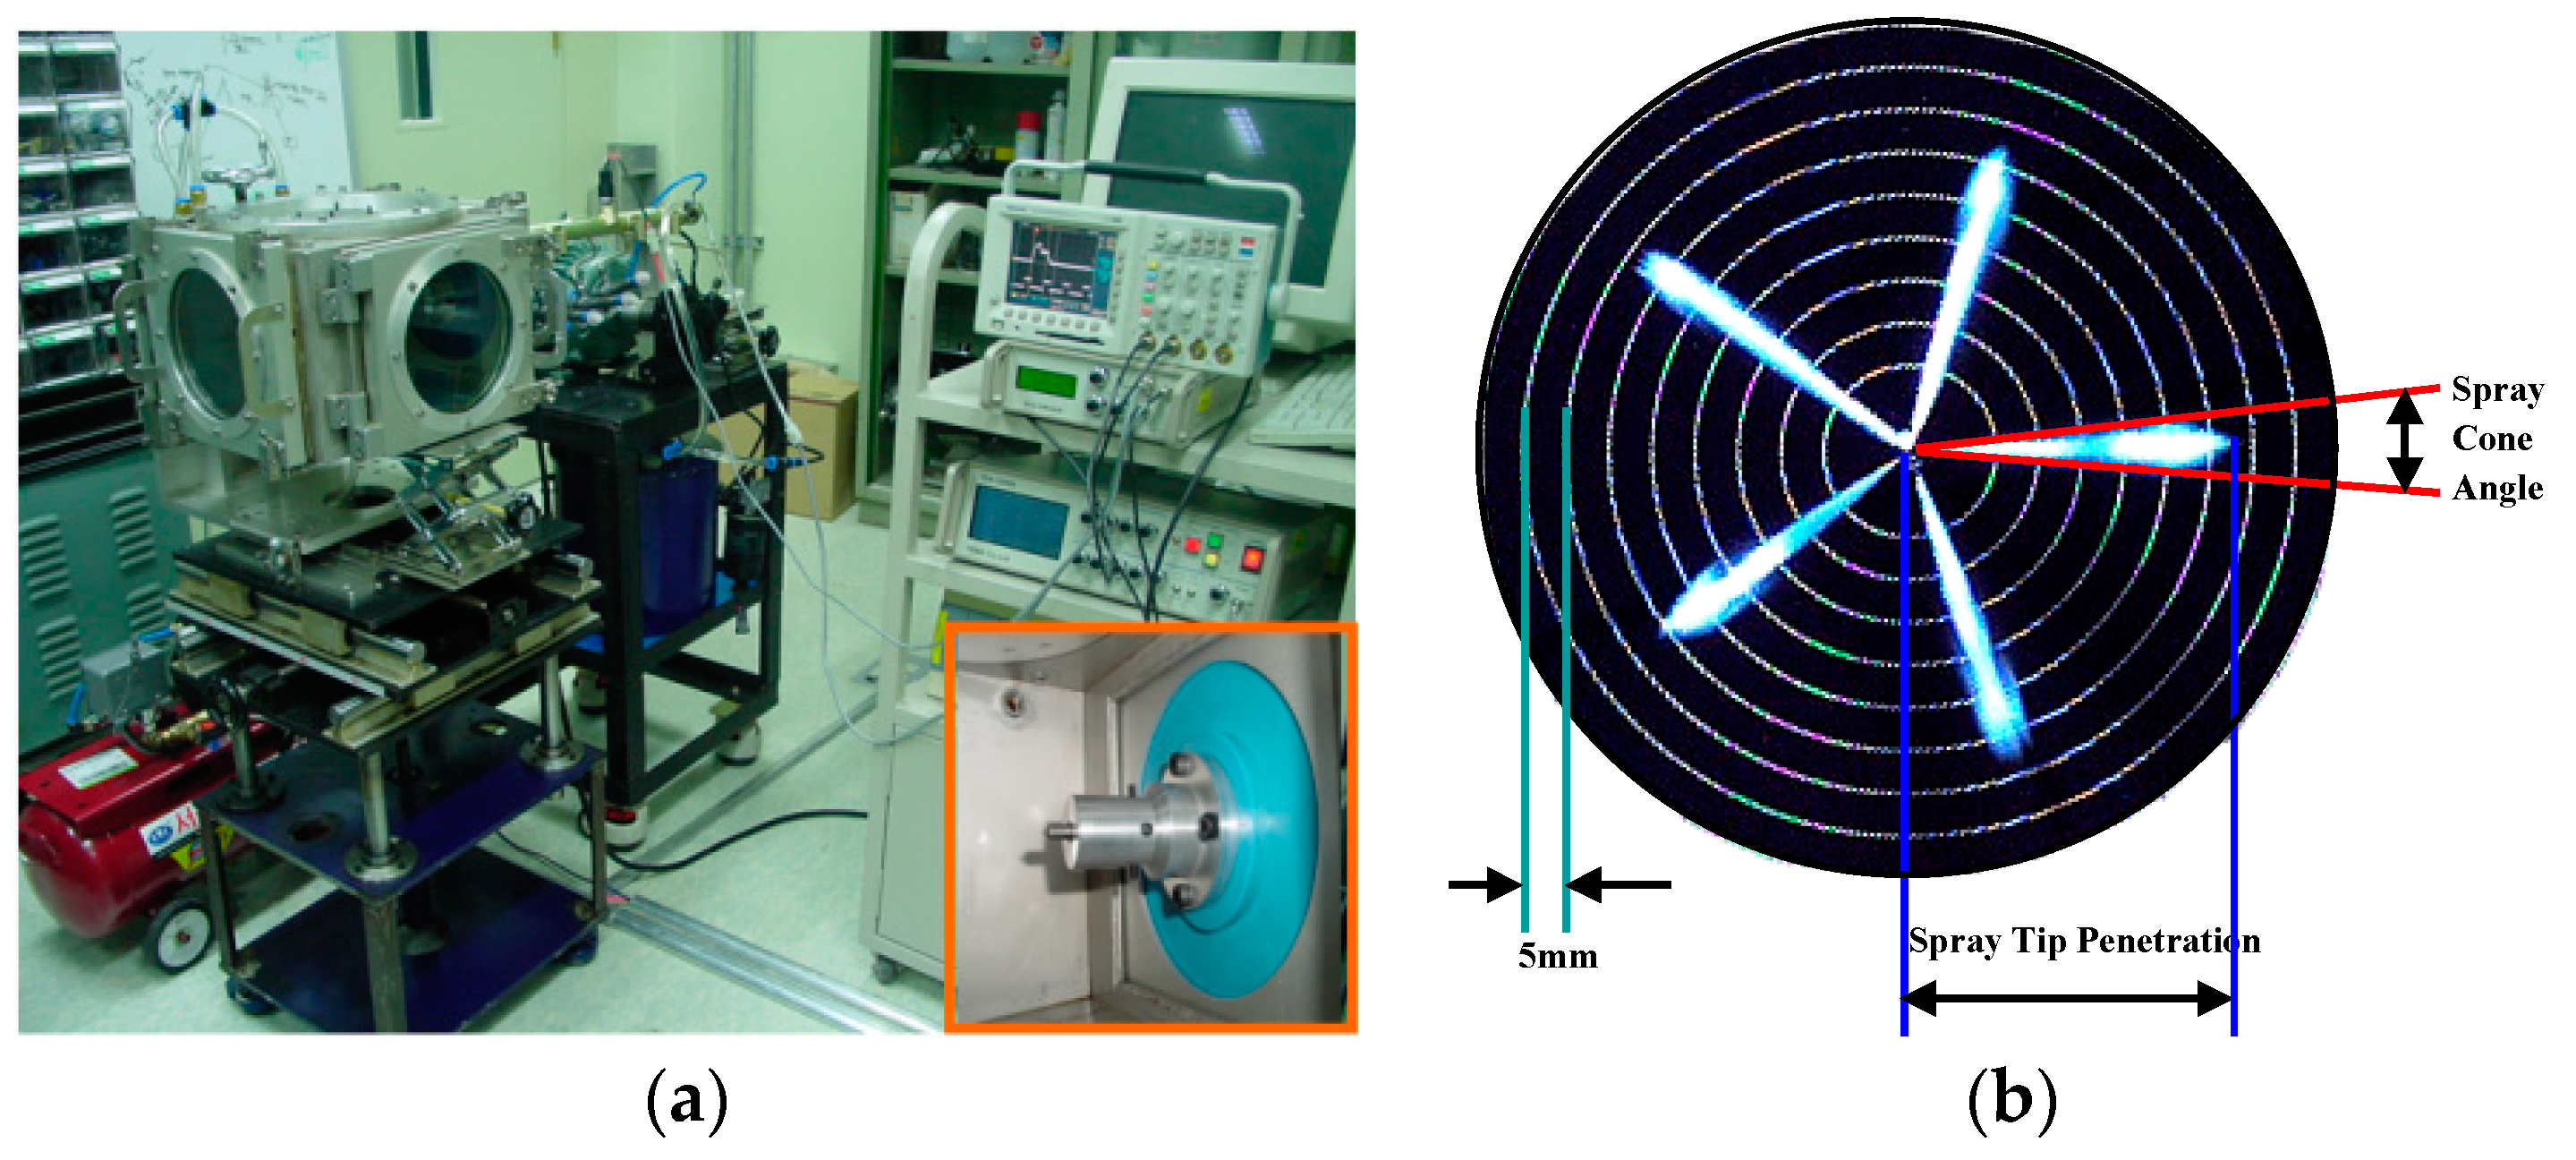
Spray visualization experiments were carried out in order to directly confirm the injection speed and behavior for each prototype. In this study, a static chamber with a volume of 885 cc was used, and images were taken with a high speed camera through a quartz glass window with a diameter of 108 mm and a thickness of 50 mm. This experiment was conducted at a normal temperature and pressure, and used a Bosch common-rail system. Since the prototype injector used in the experiment was a piezo-driven type, it was controlled using a universal piezo actuation driver (Zenobalti Co., Model:ZB-6200, Korea). Detailed specifications of the high-speed camera (Vision Research, Model:Phantom V7.3, Wayne, NJ, USA) used in this study are shown in Table 3. Direct lighting spray images were obtained using an 80 W LED light source. The experimental conditions of the spray visualization experiment are shown in Table 4. Figure 5 shows a schematic and actual picture of the injection test apparatus used in this experiment.
2.2.4. Real Engine Combustion System
The engine used in this study is a direct-injection type single-cylinder CI engine (Daedong Co., Model:ND10DE, Kyeongsan, Korea). Figure 6 shows the single-cylinder diesel engine system and its specifications are given in Table 5. Table 6 shows the combustion test conditions for the single-cylinder diesel engine. The emission performance of the most optimized DPI type and the conventional type was analyzed by measuring the exhaust gas through an exhaust gas measurement system (Horiba, Model:MEXA-554JKNOx, Kyoto, Japan). The main specifications of the exhaust gas measurement system are shown in Table 7.
3. Results and Discussion
3.1. Design Complexity and Specialized Knowledge in Needed for Each DPI Prototype
3.1.1. Type 1 DPI
In Type 1, the spring (70C hardened SW-C steel wire) was fabricated according to the wire thickness, outer diameter, number of spring revolutions, and length. It was inserted into the injector inner-body, and then the needle body and needle cylinder were also inserted. Experimental results showed that there is no problem in spraying up to the available injection pressure of 120 MPa. However, at 130 MPa, normal injection becomes intermittent. For this reason, the injector normally injected only 20 of the total injection signals.
As shown in Figure 7, each graph is divided into steel wire thicknesses of 0.7 mm and 0.8 mm. It is shown that the production spring constant (K) increases toward the right of the X-axis, and the actual number of injections continually increases. The reason for this is that the number of actual injections is expected to increase as the spring stiffness and K increases. The spring with high K becomes harder than the lower K springs, such that the pressure inside the injector provides the force to lift the injector needle. It was found that the best Type 1 performance was achieved by the spring with a steel wire thickness of 0.8 mm, outer diameter of 4.8 mm, five spring revolutions, and a length of 6 mm.
3.1.2. Type 2 DPI
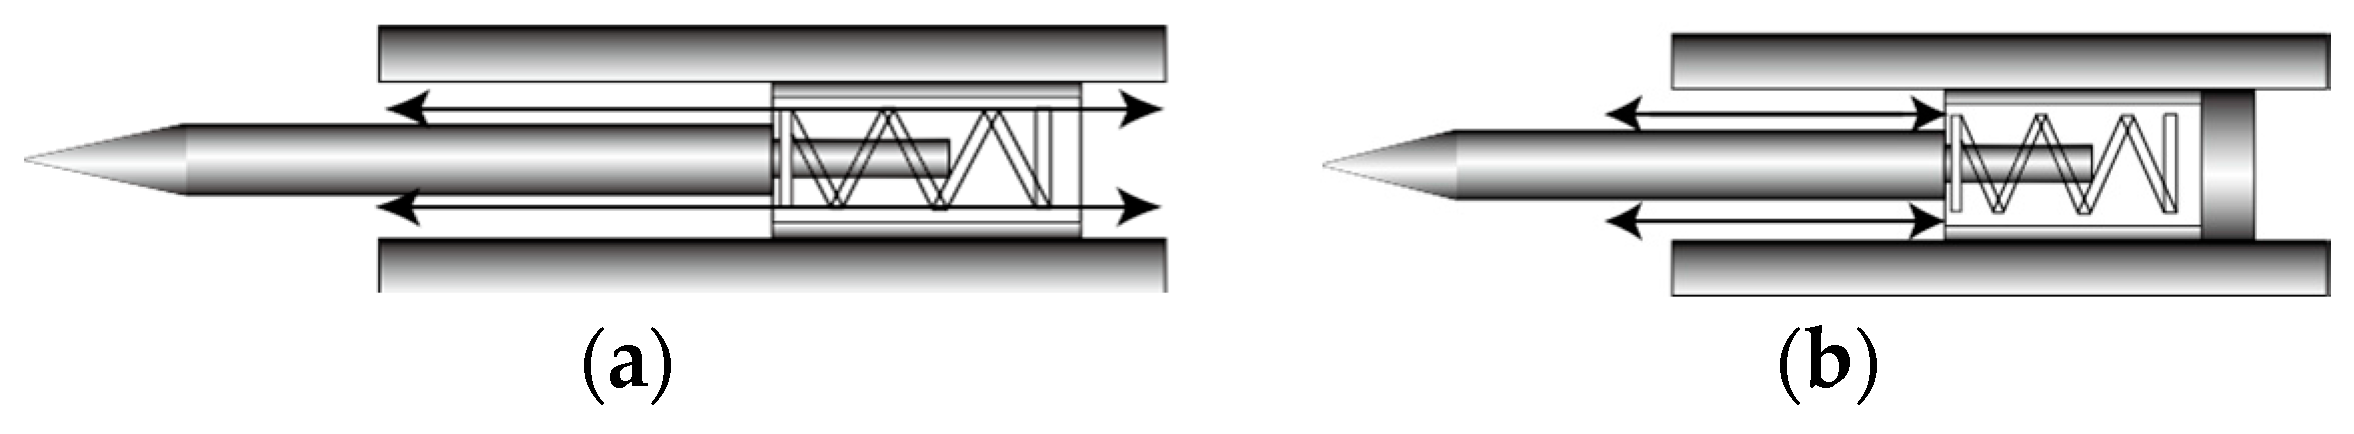
As shown in Figure 8, the total number of leaf springs and pressure plates is specified as a design parameter, and the needle part is assembled by inserting the needle body, cylinder, and spring. The number of leaf springs was reduced by one and three cases were analyzed. As shown in Figure 9, the Type 2 needle configuration allows fluid to move more freely than the conventional type. When hydraulic pressure is used in the conventional type, the needle moving distance is amplified and the needle can move with a small pressure force. However, the injection responsiveness is considered to be slow. Therefore, the design purpose of Type 2 is to increase the injection responsiveness by allowing pressured fluid to flow freely without hydraulic pressure, by taking advantage of the mechanical characteristics.
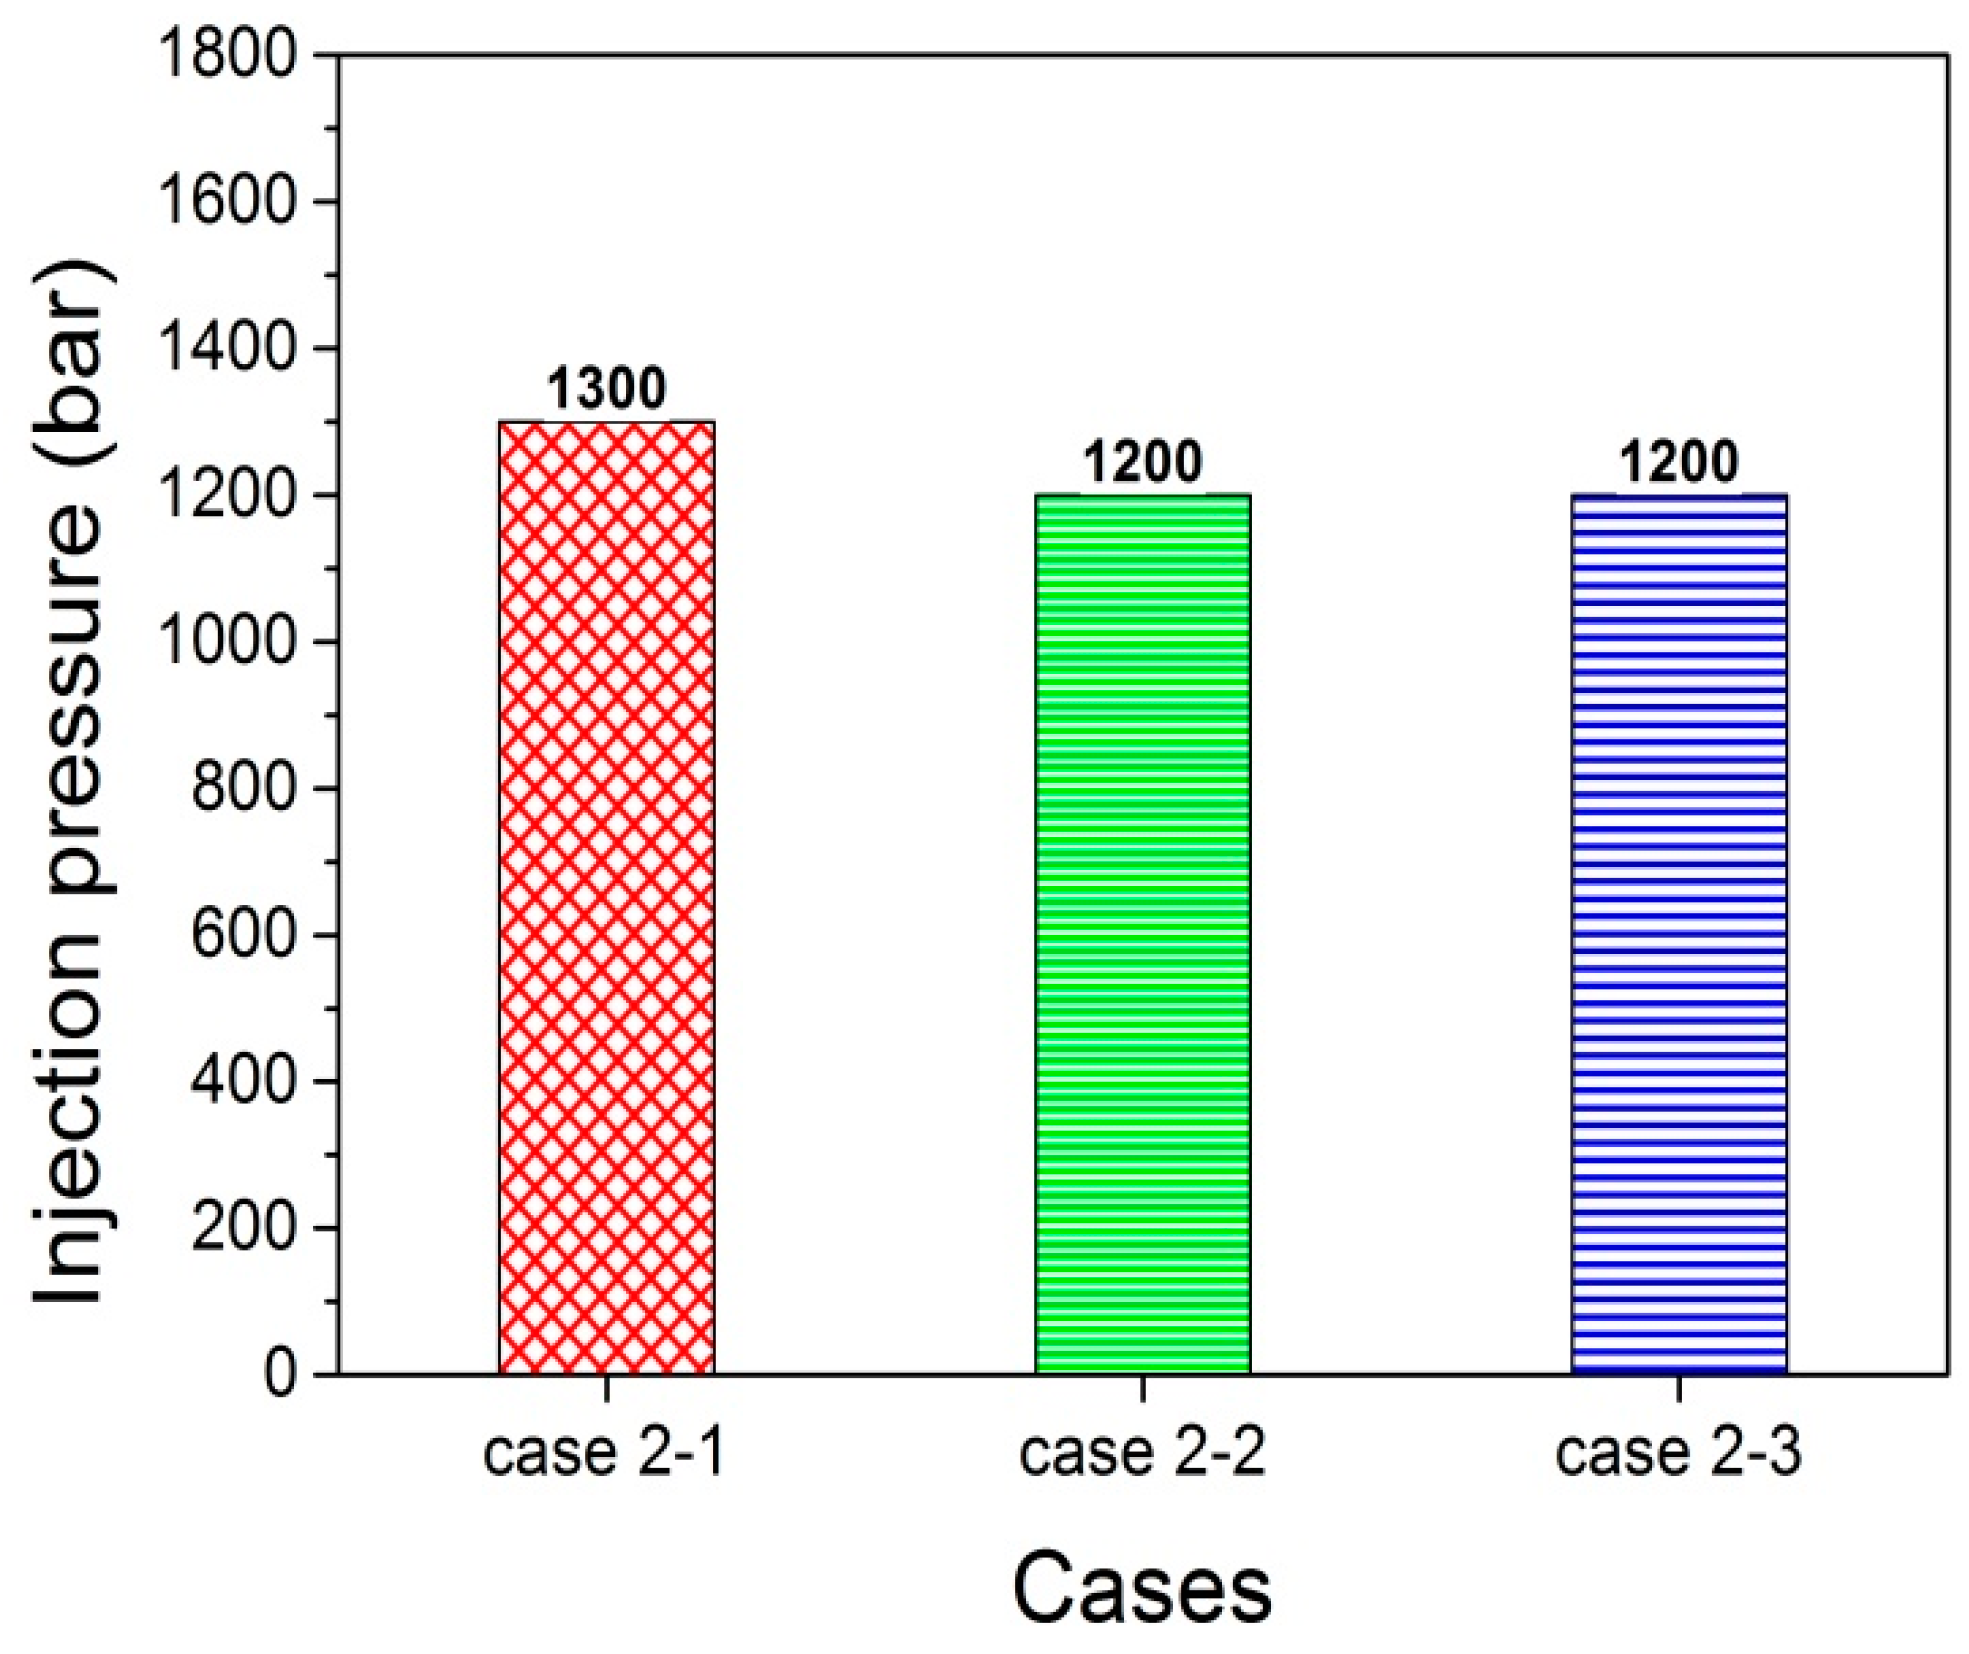
Case 2-1 in Figure 8 has an available maximum injection pressure of 130 MPa, as shown in Figure 10. The injection pressures of Case 2-2 and Case 2-3 were about 100 bar lower than Case 2-1. It was found that the available maximum injection pressure can be obtained, depending on the number of leaf springs. If one leaf spring in Type 2 is absent, the force for lifting the needle under CR high pressure is insufficient. However, when two leaf springs are provided, it becomes possible to lift the needle with a greater force, due to the increase in the elastic force. It is considered that the elastic force in the design of Type 2 is determined by the number of leaf springs.
3.1.3. Type 3 DPI
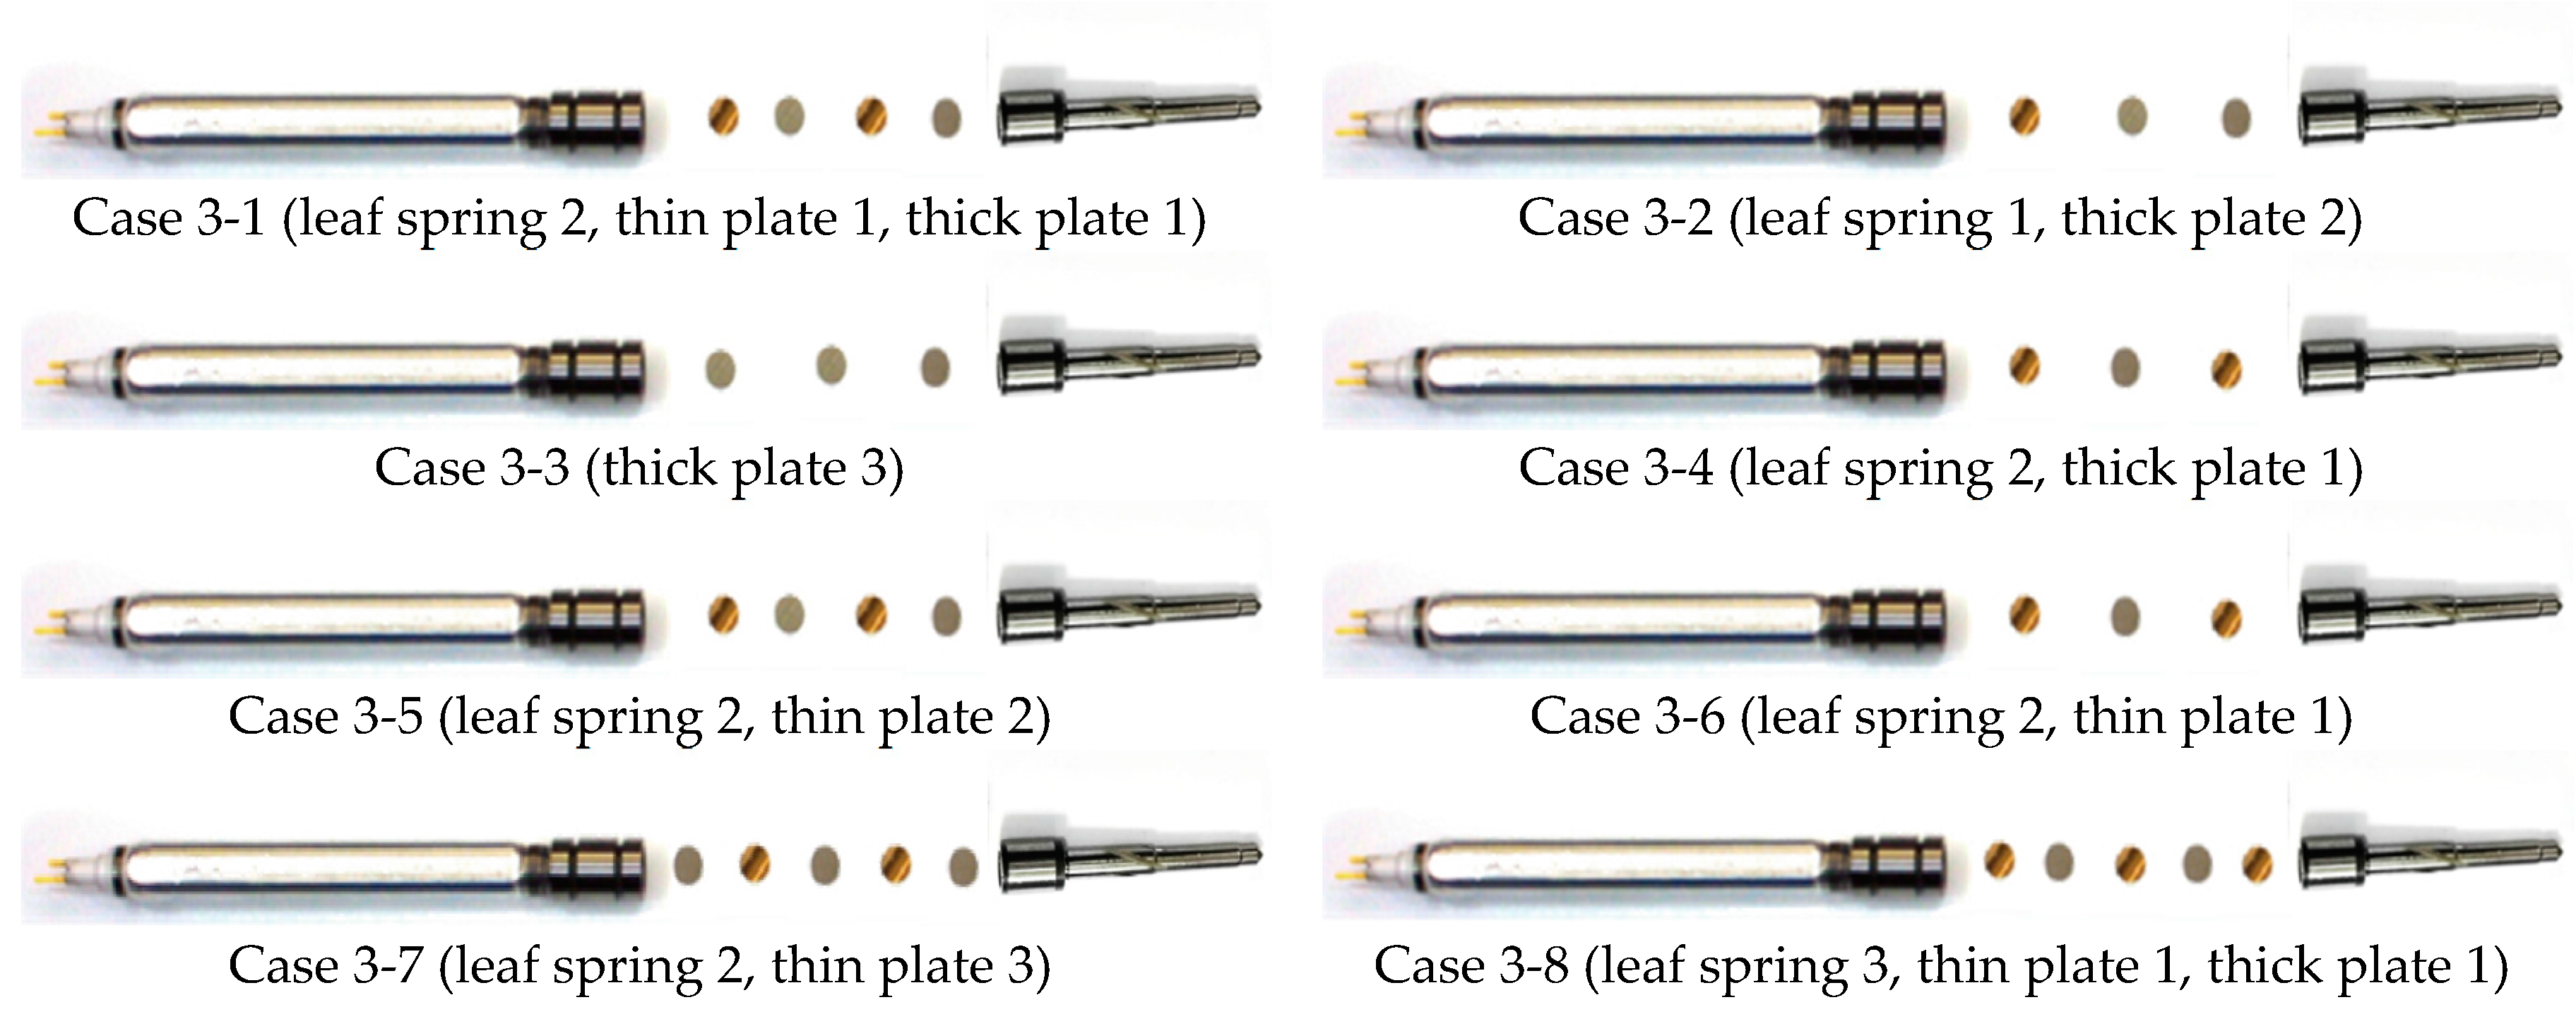
As shown in Figure 11, the Type 3 internal structure was analyzed by eight cases with different combinations of pressure plates and leaf springs, including the same nozzle configuration as a conventional type. In Type 3 DPIs, it was found that the available maximum injection pressure was 180 MPa in all cases, except Cases 3-3 and 3-6 in Figure 12. In Case 3-3 with 800 bar and Case 3-6, the pressured fuel leaked and the fuel spray could not be measured. It was thought that Case 3-3 did not inject more than 800 bar, due to the absence of a plate spring for amplifying the piezo stack force, as seen in the Type 2 DPI. Unlike Case 2-3 of Type 2, the reason for not injecting under 120 MPa is that there is not enough elasticity to use the needle’s hydraulic pressure. This indicates that when there is not a large enough elastic force, it is advantageous to spray only when using the needle mechanically, without any hydraulic pressure. In Case 3-6, the difference between Case 3-6 and Case 3-4 is the thickness of the pressure plate. The thickness of the thick pressure plate is 0.65 mm, and the thickness of the thin pressure plate is 0.3 mm. The total length of the variables, excluding the length of the needle and piezo stack, is 1.95 mm for Case 3-4 and 1.6 mm for Case 3-6. Therefore, it was found that the minimum length inside the injector must exceed 1.6 mm.
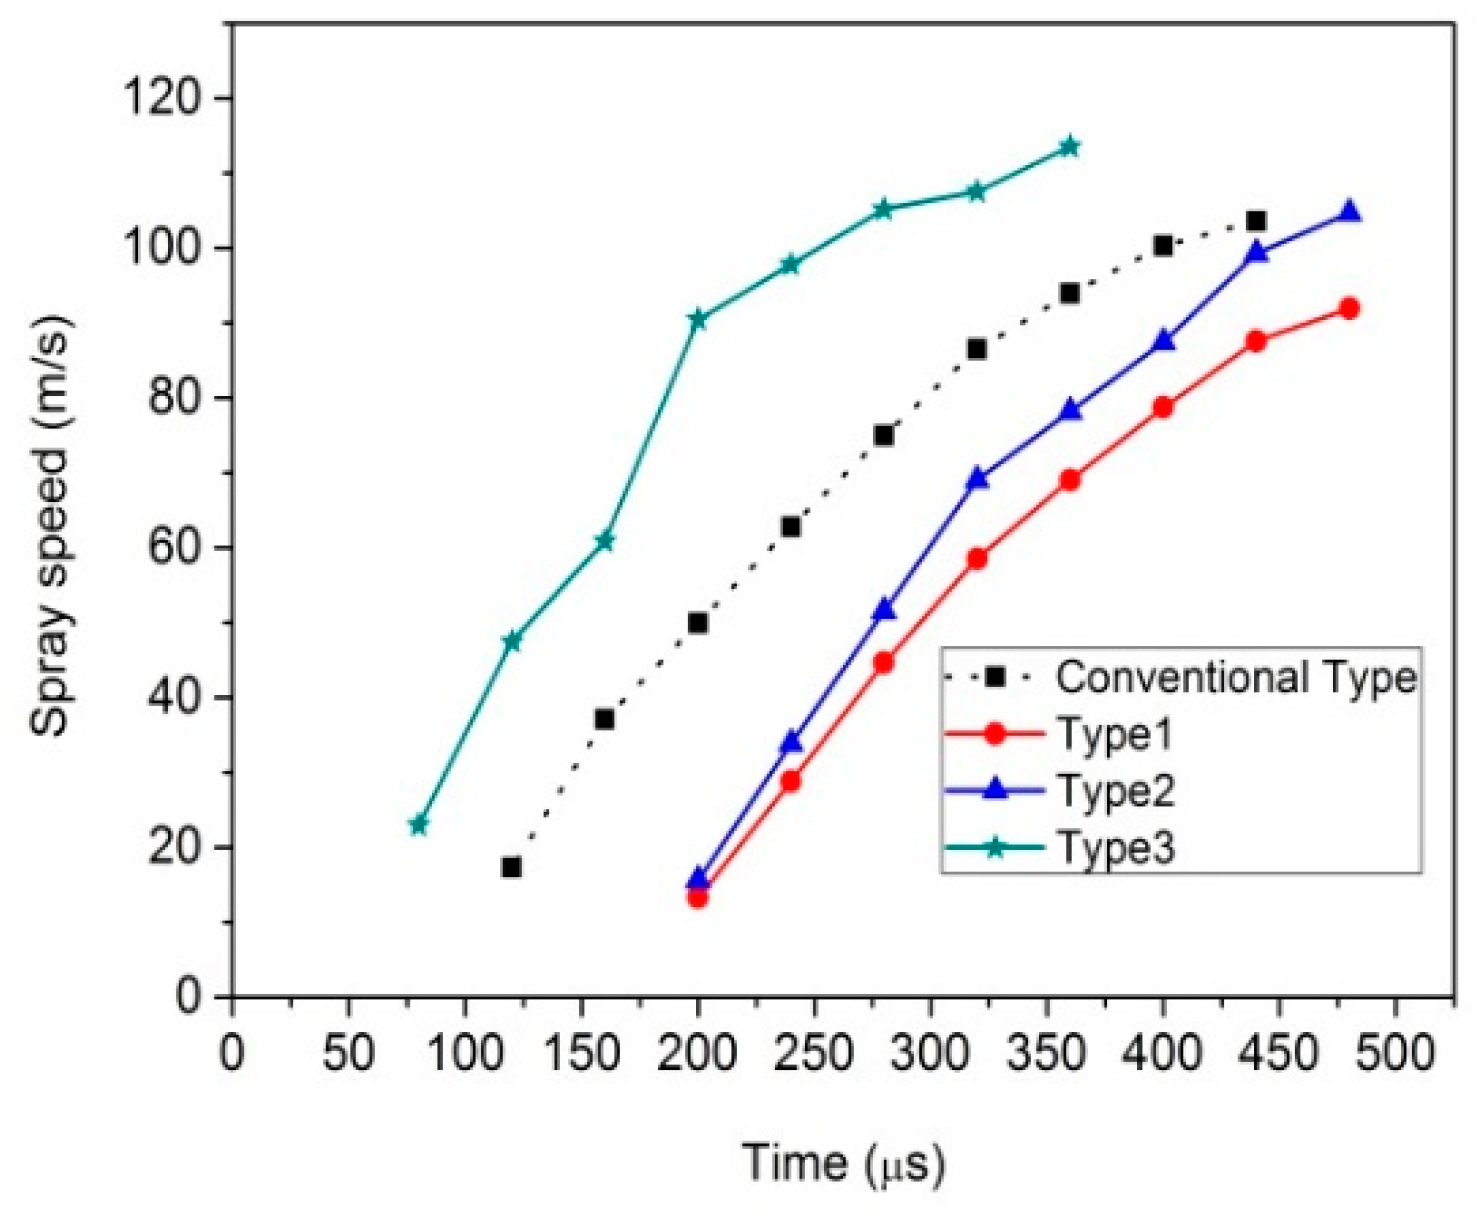
For Type 3 DPI Cases that have an injection performance of up to 180 MPa, spray images were acquired by a high-speed camera and the spray speed was compared, as shown in Figure 13. As known, the spray speed was derived by the definition of the spray tip penetration and spray cone angle, with the edge defined as a line of 80% transmittance of back-light in the raw spray images. It was found that Case 3-8 had the best spray performance with an average speed of 107.3 m/s, an observed-maximum speed of 144 m/s, and an SOI (start of injection) value of 80 µs. The observed-maximum speed in this study means that the spray has not reached the real maximum speed because the bore size of the test engine used in this study is 95 mm, as shown in Table 5, which is about the same as the 100 mm diameter disk shown in Figure 5b. In other words, the high speed camera shoots the fuel stream until it reaches the end of the disk and identifies the highest speed. When the fuel is injected into the cylinder, it is blocked by the inner wall of the cylinder and the maximum speed is not fully achieved in the real spray chamber.
In some Type 3 DPIs, as the elasticity increases, the needle movement is amplified and its moving speed increases. Therefore, it can be expected to have a good effect on two- or multi-injection schemes that are favorable for enhancing the air-fuel mixing rate of the diffusion combustion in the CI engine.
3.2. Comparison and Evaluation of Prototype DPIs
The following prototype DPIs were selected to compare the injection performance, spray, and combustion characteristics. (1) The Type 1 DPI has a 0.8 mm thick steel wire spring with an outer diameter of 4.8 mm, spring rate of five, and a length of 6 mm; (2) For the Type 2 DPI, Case 2-1 (two leaf springs + one thick pressure plate + one thin pressure plate) was selected; (3) For the Type 3 DPI, Case 3-8 (three plate springs + one thick pressure plate + one thin pressure plate) was selected.
3.2.1. Comparison of Maximum Injection Pressure Results
The maximum injection pressure with the representative Types 1, 2, and 3, is shown in Figure 14. The Type 3 DPI showed the highest injection pressure at 180 MPa. It was found that the hydraulic application required to build up needle movement is an essential element to obtain an injection performance at high pressures, over 130 MPa. As a result, it can be said that the Type 3 DPI prototype has a similar injection performance to the conventional type DPI, and it has a better flexibility for designing the internal structure of a direct needle-driven piezo-injector.
3.2.2. Comparison of Mie-Scattering Spray Image Results
In this study, LED back illumination for Mie-scattering was applied to make the initial liquid spray to full development spray visible. This enabled an accurate SOI determination and simultaneously measured the initial liquid portion of the spray. Additionally, this Mie scattering technique is suited to the spray characteristics in cold conditions, where there is insignificant vaporization [8,9]. The spray image was taken with an exposure time of 38 μs at a resolution of 320 × 320 pixels in 25,000 pps by a high-speed camera.
Figure 15 and Table 8 show the comparative results of the spray speeds with four different DPIs. The Type 1 and 2 DPI had observed-maximum speeds of 91 m/s and 104 m/s, respectively, with an average speed of 59 m/s and 67 m/s. In comparison to the conventional type, Types 1 and 2 have slower spray speeds and a slow SOI response of 200 μs. It is known that the motion condition of a DPI needle is highly affected by the response parameter [9]. Generally, this shows that the use of hydraulic pressure for needle movement enhances the response performance. In this study, Type 1 and 2 DPIs with the needle only being controlled by a mechanical mechanism, without the use of hydraulic pressure, at about 80 μs, would be slower than the conventional type in terms of the SOI response. In particular, by considering the internal actuation structure of Type 2 and the conventional type DPI, it can be seen that the plate spring and the pressure plate are key factors influencing the determination of the spray characteristics.
In the case of the Type 3 DPI, the observed-maximum spray speed is 113 m/s, the average speed is 80 m/s, and the SOI response is 80 μs. This value means that the Type 3 DPI has a fast needle movement, since about 40 μs would be faster than the conventional type DPI. In other words, the Type 3 DPI needle is able to start fuel injection at 80 μs, but the conventional type DPI is still closed, maintaining a needle state until the SOI timing is 120 μs.
As shown in Figure 16, there is an obvious difference in the spray characteristics with time after the start of the injection. As stated previously, the Type 3 DPI had a faster needle opening than the other three DPIs, so it displayed a rapid spray behavior until obtaining a full development spray. It is clear that the actuation structure of a direct needle-driven injector significantly affects the initial spray shape. This is due to hydraulic internal flow dynamics within the DPI nozzle. Therefore, when the needle response is relatively high, the spray tip fuel penetration increases in the liquid phase spray characteristics.
3.2.3. Comparison of Injection Rate Results
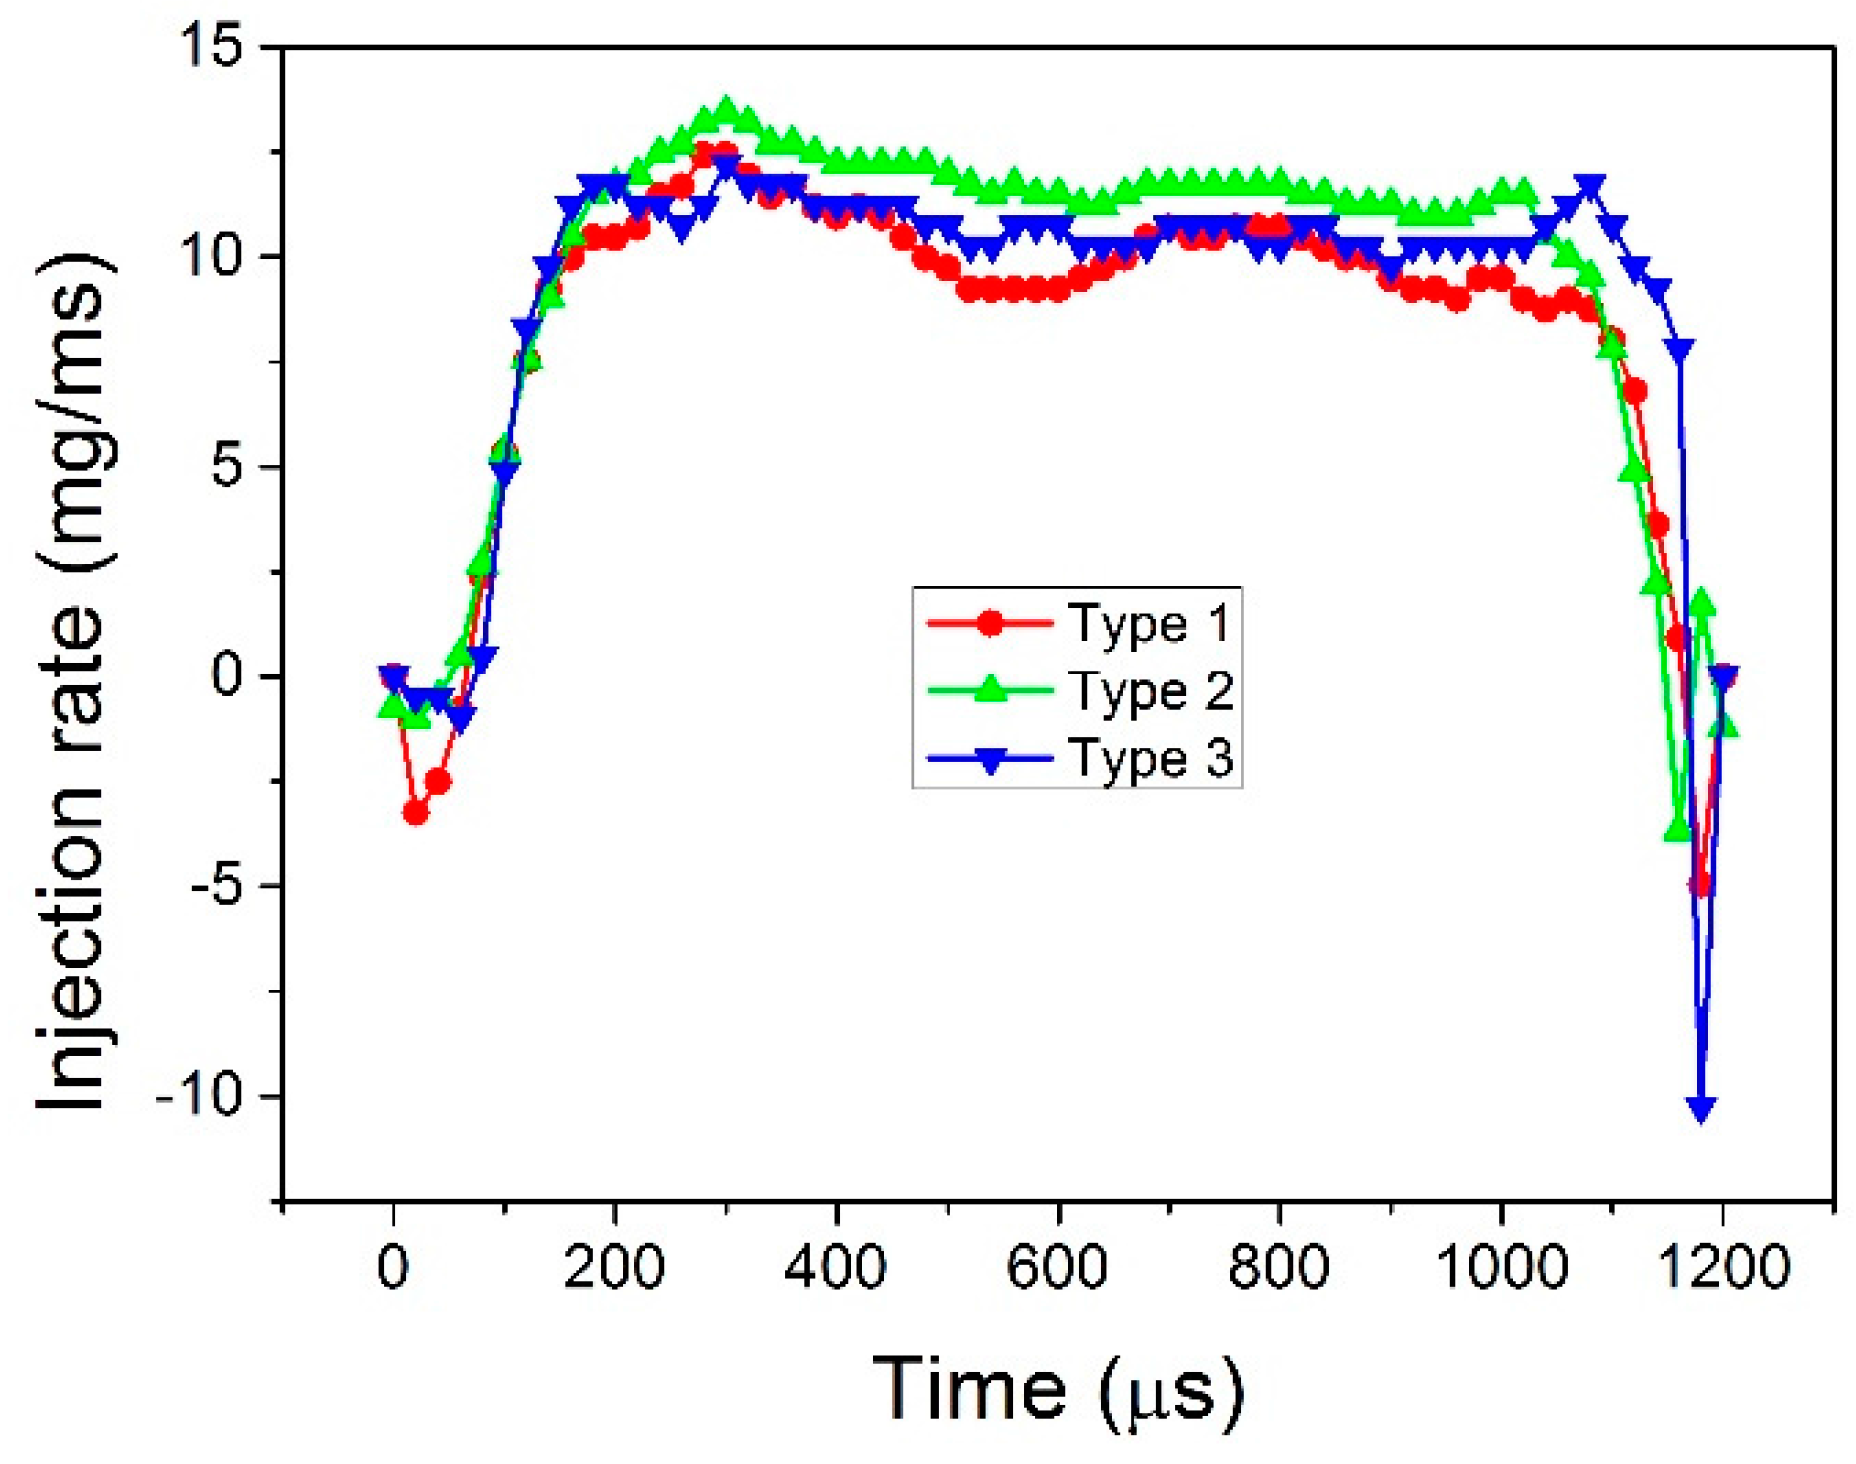
Figure 17 and Figure 18 compare the injection rate results between Types 1, 2, 3, and the conventional type DPI. To confirm the reliability of the injection rate meter, the injection rate obtained from the meter used in this study was first validated with reference data from Delphi [10]. It was observed that the injection quantity of the Type 1 DPI is 3.14 mg, which is relatively smaller than Type 2 or Type 3, as shown in Table 9. Since the spring constant K is relatively higher than the leaf spring, the length of the compressed spring is shortened when the needle is lifted, so the distance of travel of the needle in the Type 1 DPI is also shortened, and the injection quantity is expected to be reduced. In the case of Type 2, the injection amount is high after the start of injection, but then falls sharply. Compared to Type 3, the end of the injection (EOI) of the Type 2 DPI occurs early and pressured fuel moves freely in the needle. So, the Type 2 DPI has a higher injection rate than other DPI types, until it reaches the EOI. This is a key cause of decreasing injection quantity due to the quick closing operation.
However, the Type 3 DPI showed a more stable and sufficient injection rate than Type 1 and 2 DPIs. The shape of the injection rate of the Type 3 DPI is relatively horizontal and the fuel injection lasts for the longest time. This means that the Type 3 DPI has a favorable degree of freedom for controlling the injection amount and the injection shape in real injection mapping processes.
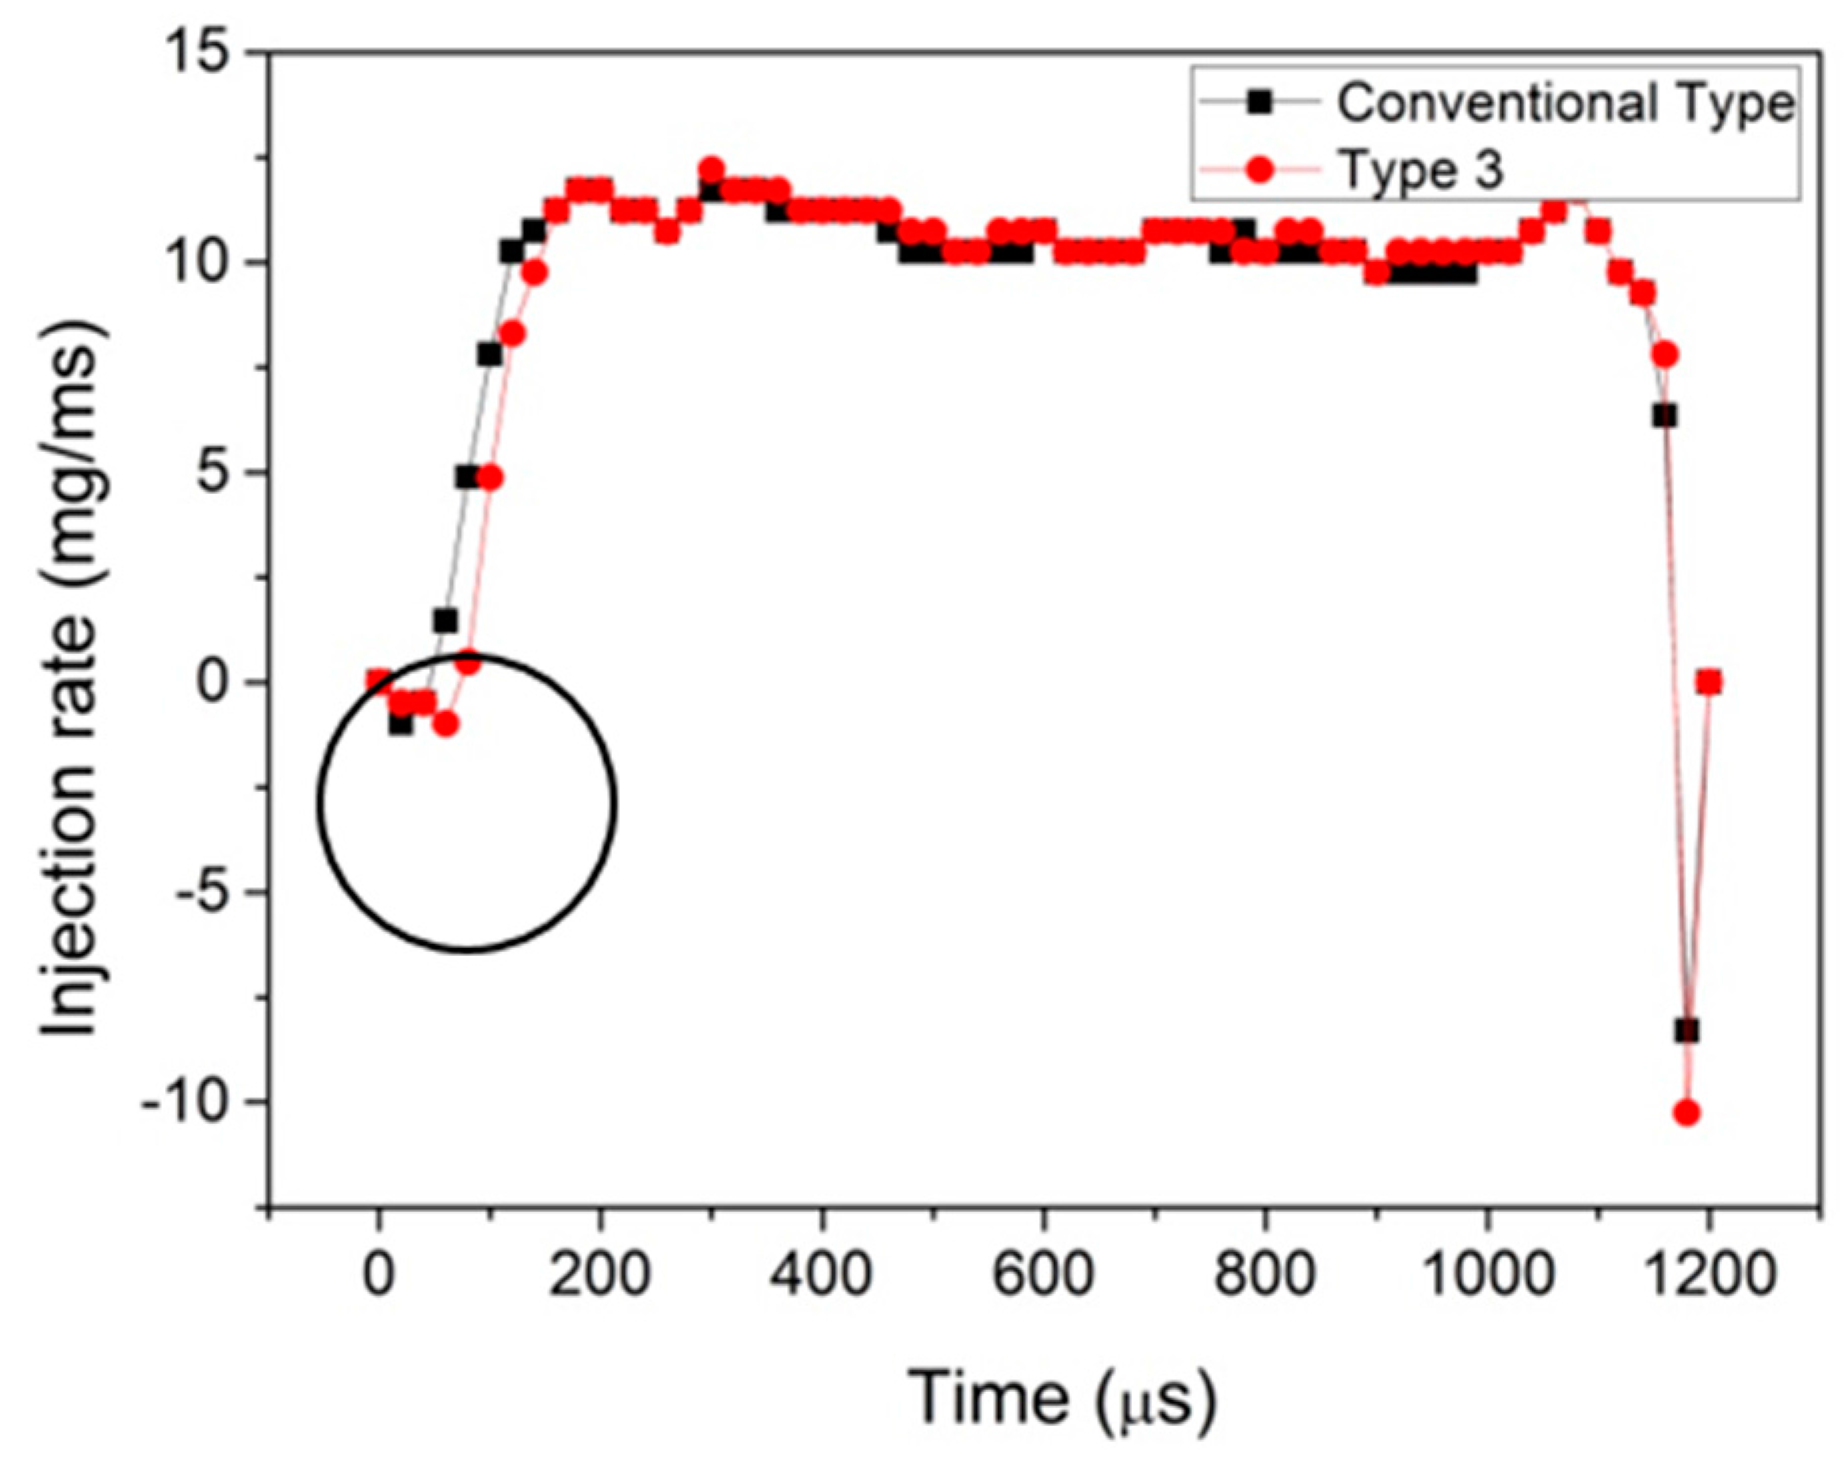
Figure 18 shows a comparison of the injection rates between the conventional type and the Type 3 DPI. As can be seen from this graph, the conventional type shows a shorter start of injection than Type 3. However, as compared with the results of Table 10, the injection rate and injection quantity do not show much deviation. This opinion is based on using a different observational method for the injection rate measurement system and the spray visualization measurement system. Moreover, the first “injection signature” marked with one circle in Figure 18 was detected for the Type 3 DPI. They show an almost equal injection performance, even if the Type 3 DPI has more simple structures in the design processes of the direct needle-driven piezo injector.
The effect of the injection rate on combustion is discussed in Section 3.2.4. It predicts that the Type 2 DPI has a higher NOx emission due to its higher injection quantity at the beginning of the combustion. It can be inferred that the Type 3 DPI might have the advantage of multiple injections, because the test results indicated that it had a lower injection delay and faster injection start, with a higher initial injection quantity. Therefore, a pilot injection strategy was applied and described, as shown in Figure 19b.
3.2.4. Comparison of Engine HC and NOx Emission Results
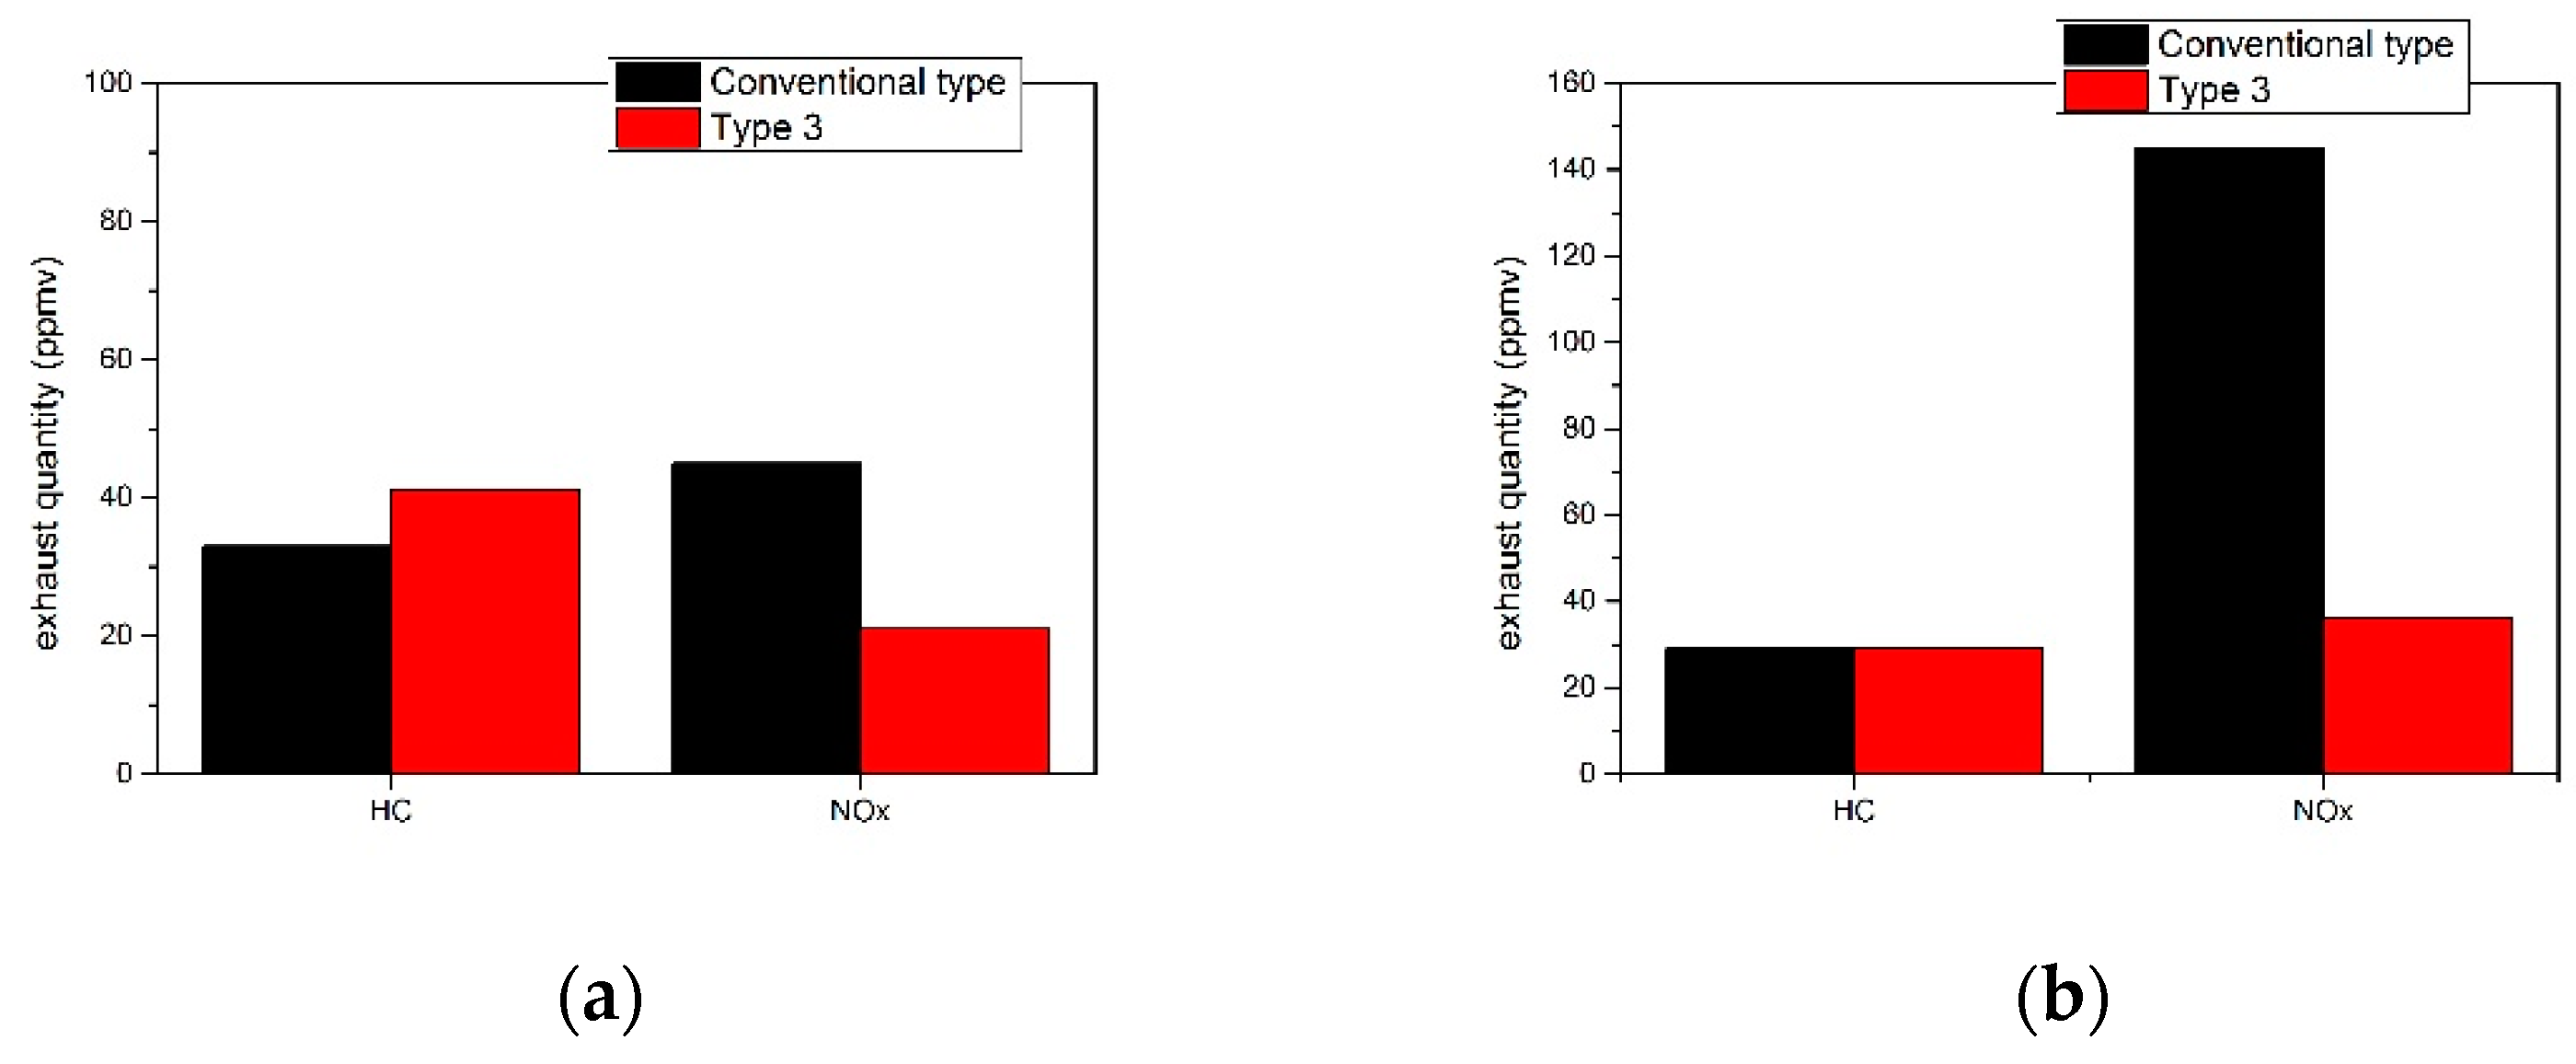
Figure 19 shows the diesel engine experimental results using the same conditions applied in previous chapters. The speed of the engine was maintained at 1200 rpm, and the injection timing was set to BTDC 10 CA in a single injection case and BTDC 15 CA and 5 CA in a two-injection stage (pilot/main) injection case. The fuel injected was 3 mg and 7 mg with the pilot and main injections, respectively. This was done to maintain the total fuel mass with the single injection experiment. By fixing the pilot injection timing at BTDC 15 CA, it was observed that the combustion characteristics and performance were influenced by the injection timing of the main injection. First, it was observed that HC and NOx emissions for the conventional type and the Type 3 DPI were different, regardless of single and two-injection stages. As shown in Figure 19a, in the case of the Type 3 DPI at the injection quantity of 7 mg/stroke, the HC emission increased by about 8 ppm, but the NOx value decreased by about 23 ppm, which is more than 50% lower than the conventional type DPI. However when the injection timing of BTDC 10 CA differs for the two-injection stage, as shown in Figure 19b. The NOx emission value is about 109 ppm, which is about 4.5 times more than the difference. The reason for this is that when the injection angle of the conventional type DPI is small, the injector response is relatively slow and any special distinction between the pilot injection stage and the main injection stage is not clear. Therefore, it is expected to have a similar effect to that of injecting at the injection stroke. Conversely, Type 3 can exhibit low NOx emission values with a relatively fast injection response and spray speed. This shows that HC and NOx emissions are significantly reduced in a two-stage injection scheme. The premixed combustion phase and the mixing controlled combustion phase were mostly affected by the injection rate, as stated in Section 3.2.3. It was observed that most of the fuel was injected rapidly following the injection signal at BTDC 15 CA, due to the characteristics of the DPI, a fast SOI, and a high injection rate. Therefore, the premixed combustion phase was promoted. Also, the rest of the remaining fuel was injected after the ignition. Therefore, the combustion was continuous, until the controlled combustion phase. As a result, the air-fuel mixture was saturated, and some fuel in the cylinder was not able to participate in combustion, remaining in an unburned condition. Later, the unburned fuel was used in the late combustion phase. Therefore, a multiple injection strategy could be advantageous in combustion performance assessments. In this sense, a Type 3 DPI specified as Case 3-8 (three plate springs + one thick pressure plate + one thin pressure plate) is a very useful measure for a FIE (fuel injection equipment) system in a newly clean CRDi diesel engine.
4. Conclusions
In this study, a direct needle-driven piezo injector (DPI) based on the Delphi product was considered to improve injection characteristics, including: a maximum injection pressure and injection response, and manufacturing simplicity. The effects of the injection response and spray characteristics on CI combustion emissions were investigated with three concept designs, in order to ascertain the optimal DPI actuation structure for a clean CRDi diesel engine. First, a maximum injection pressure test and a Mie-scattering spray visualization with a high-speed camera were carried out, to compare the realizable criteria for the prototype DPIs. Second, injection rates based on Bosch tube method were applied for each prototype DPI and compared with a conventional type DPI. Finally, diesel engine experiments were carried out to investigate HC and NOx emissions, and to investigate the engine adaptability and combustion performance of the Type 3 DPI prototype. This approach led to the following conclusions:
- (1)
- In internal design structure for a useful DPI needle response, it is very difficult to apply a high injection pressure over 130 MPa if the hydraulic pressure required to excite the needle’s initial state is not applied. From the maximum injection pressure test, it was concluded that a high DPI injection pressure depends on the number of leaf springs. If the leaf spring is not present, the DPI can’t spray more than 180 MPa, due to a lack of elasticity. As the number of leaf springs increases, the elasticity increases.
- (2)
- Type 1 and 2 DPI prototypes were conceptually designed with non-hydraulic needles. Therefore, they were able to spray up to a maximum injection pressure of 130 MPa. Type 1, with an internal coil spring, had a high spring constant K, which a shortened needle distance of travel and a reduced injection value. Type 2 had the highest injection rate due to free needle movement. However, the Type 3 DPI, with an optimal number of pan-springs, plates, and needle structure for available hydraulics, had a maximum injection pressure of 180 MPa and advantageous degrees of freedom for controlling the injection value and injection rate with a simpler structure in the design process for a direct needle-driven piezo injector.
- (3)
- In the spray visualization experiment, the Type 3 DPI showed the fastest spraying speed and responsiveness at an average speed, the observed-maximum speed, and the maximum SOI response. As a result, the key factor influencing the spray characteristics is whether the DPI plate spring and the pressure plate of the needle are controlled by a mechanical mechanism only, or by hydraulic pressure.
- (4)
- For the injection rate, the Type 3 DPI had a faster injection rate, which corresponded to the visualization results. Furthermore, by looking at the slope of the injection rate at the beginning and end, the Type 3 DPI had a relatively horizontal slope, and fuel injection lasted the longest.
- (5)
- In diesel engine experiments, relatively high fuel injection rates for the Type 3 DPI prototype generated un-burned emission gases such as HC. However, it had a lower injection delay and faster injection start, with a much higher initial injection quantity. Therefore, it is expected to demonstrate a great advantage for multi-stage injections, where a rapid response and the spraying speed are subdivided.
Acknowledgments
This research was supported by the CEFV (Center for Environmentally Friendly Vehicle) as Global-Top Project of KMOE (Ministry of Environment, Korea).
Author Contributions
Sangik Han, Juhwan Kim and Jinwook Lee conceived and designed the experiments; Sangik Han and Juhwan Kim produced prototype DPI; Sangik Han performed the experiments; Sangik Han and Jinwook Lee analyzed the data and wrote the paper. Jinwook Lee supervised and advised all parts.
Conflicts of Interest
The authors declare no conflict of interest.
References
- Jeong, Y.I.; Lee, J.W.; Cho, G.B.; Kim, H.S. Automotive and Environment; Publishing Department of Soongsil University: Seoul, Korea, 2010. [Google Scholar]
- Ueda, D.; Tanada, H.; Utsunomiya, A.; Kawamura, J.; Weber, J. 4th Generation Diesel Piezo Injector (Realizing Enhanced High Response Injector); SAE Technical Paper 2016-01-0846; SAE International: Warrendale, PA, USA, 2016. [Google Scholar]
- Arpaia, A.; Catania, A.; Ferrari, A.; Spessa, E. Development and Application of an Advanced Numerical Model for CR Piezo Indirect Acting Injection Systems; SAE Technical Paper 2010-01-1503; SAE International: Warrendale, PA, USA, 2010. [Google Scholar]
- Husted, H.; Piock, W.; Ramsay, G. Fuel Efficiency Improvements from Lean, Stratified Combustion with a Solenoid Injector. SAE Int. J. Engines 2009, 2, 1359–1366. [Google Scholar] [CrossRef]
- Kim, J.S. Effects of Injection Rate and Spray Characteristics of Piezo Injectors on Diesel Combustion. Master’s Thesis, Soongsil University, Seoul, Korea, 2015. [Google Scholar]
- Jo, I.; Jeong, M.; Kim, S.; Sung, G.; Lee, J. Experimental Investigation and Hydraulic Simulation of Dynamic Effects on Diesel Injection Characteristics in Indirect Acting Piezo-driven Injector with Bypass-Circuit System. Int. J. Autom. Technol. 2015, 16, 173–182. [Google Scholar] [CrossRef]
- Hardy, M.; Tolliday, A.; Delphi Technologies, Inc. Improvements Relating to Fuel Injector Control. Patent EP 2136062 A1, 2009. [Google Scholar]
- Karimi, K. Characterisation of Multiple-Injection Diesel Sprays at Elevated Pressures and Temperatures. Ph.D. Thesis, University of Brighton, Brighton, UK, 2007. [Google Scholar]
- Raul, P.; Jaime, G.; Michele, B.; Plazas, A.H. Study liquid length penetration results obtained with a direct acting piezo electric injector. Appl. Energy 2013, 106, 152–162. [Google Scholar]
- Detlev, S.; Stefan, Z.; Martin, H.; Derk, G.; Rainer, W.; Nigel, B. Delphi common rail system with direct acting injector. MTZ Worldw. 2008, 69, 32–36. [Google Scholar]
Figure 1.
DPI proposed by this study; (a) Three prototype DPIs, (b) Principle of the inverse piezo-electric effect.
Figure 1.
DPI proposed by this study; (a) Three prototype DPIs, (b) Principle of the inverse piezo-electric effect.

Figure 2.
Fuel injection control system; (a) Common-rail controller, (b) Injector driver.

Figure 3.
Control volume in the pipe to measure the injection rate.

Figure 4.
Injection rate measurement; (a) Injection rate measuring device, (b) Schematic diagram.

Figure 5.
Spray visualization measurement; (a) Visualization apparatus, (b) Definition of spray parameter.
Figure 5.
Spray visualization measurement; (a) Visualization apparatus, (b) Definition of spray parameter.

Figure 6.
Experiment system of single-cylinder diesel engine.

Figure 7.
Actual number of injections according to the thickness of the steel wire; (a) 0.7 mm, (b) 0.8 mm.
Figure 7.
Actual number of injections according to the thickness of the steel wire; (a) 0.7 mm, (b) 0.8 mm.
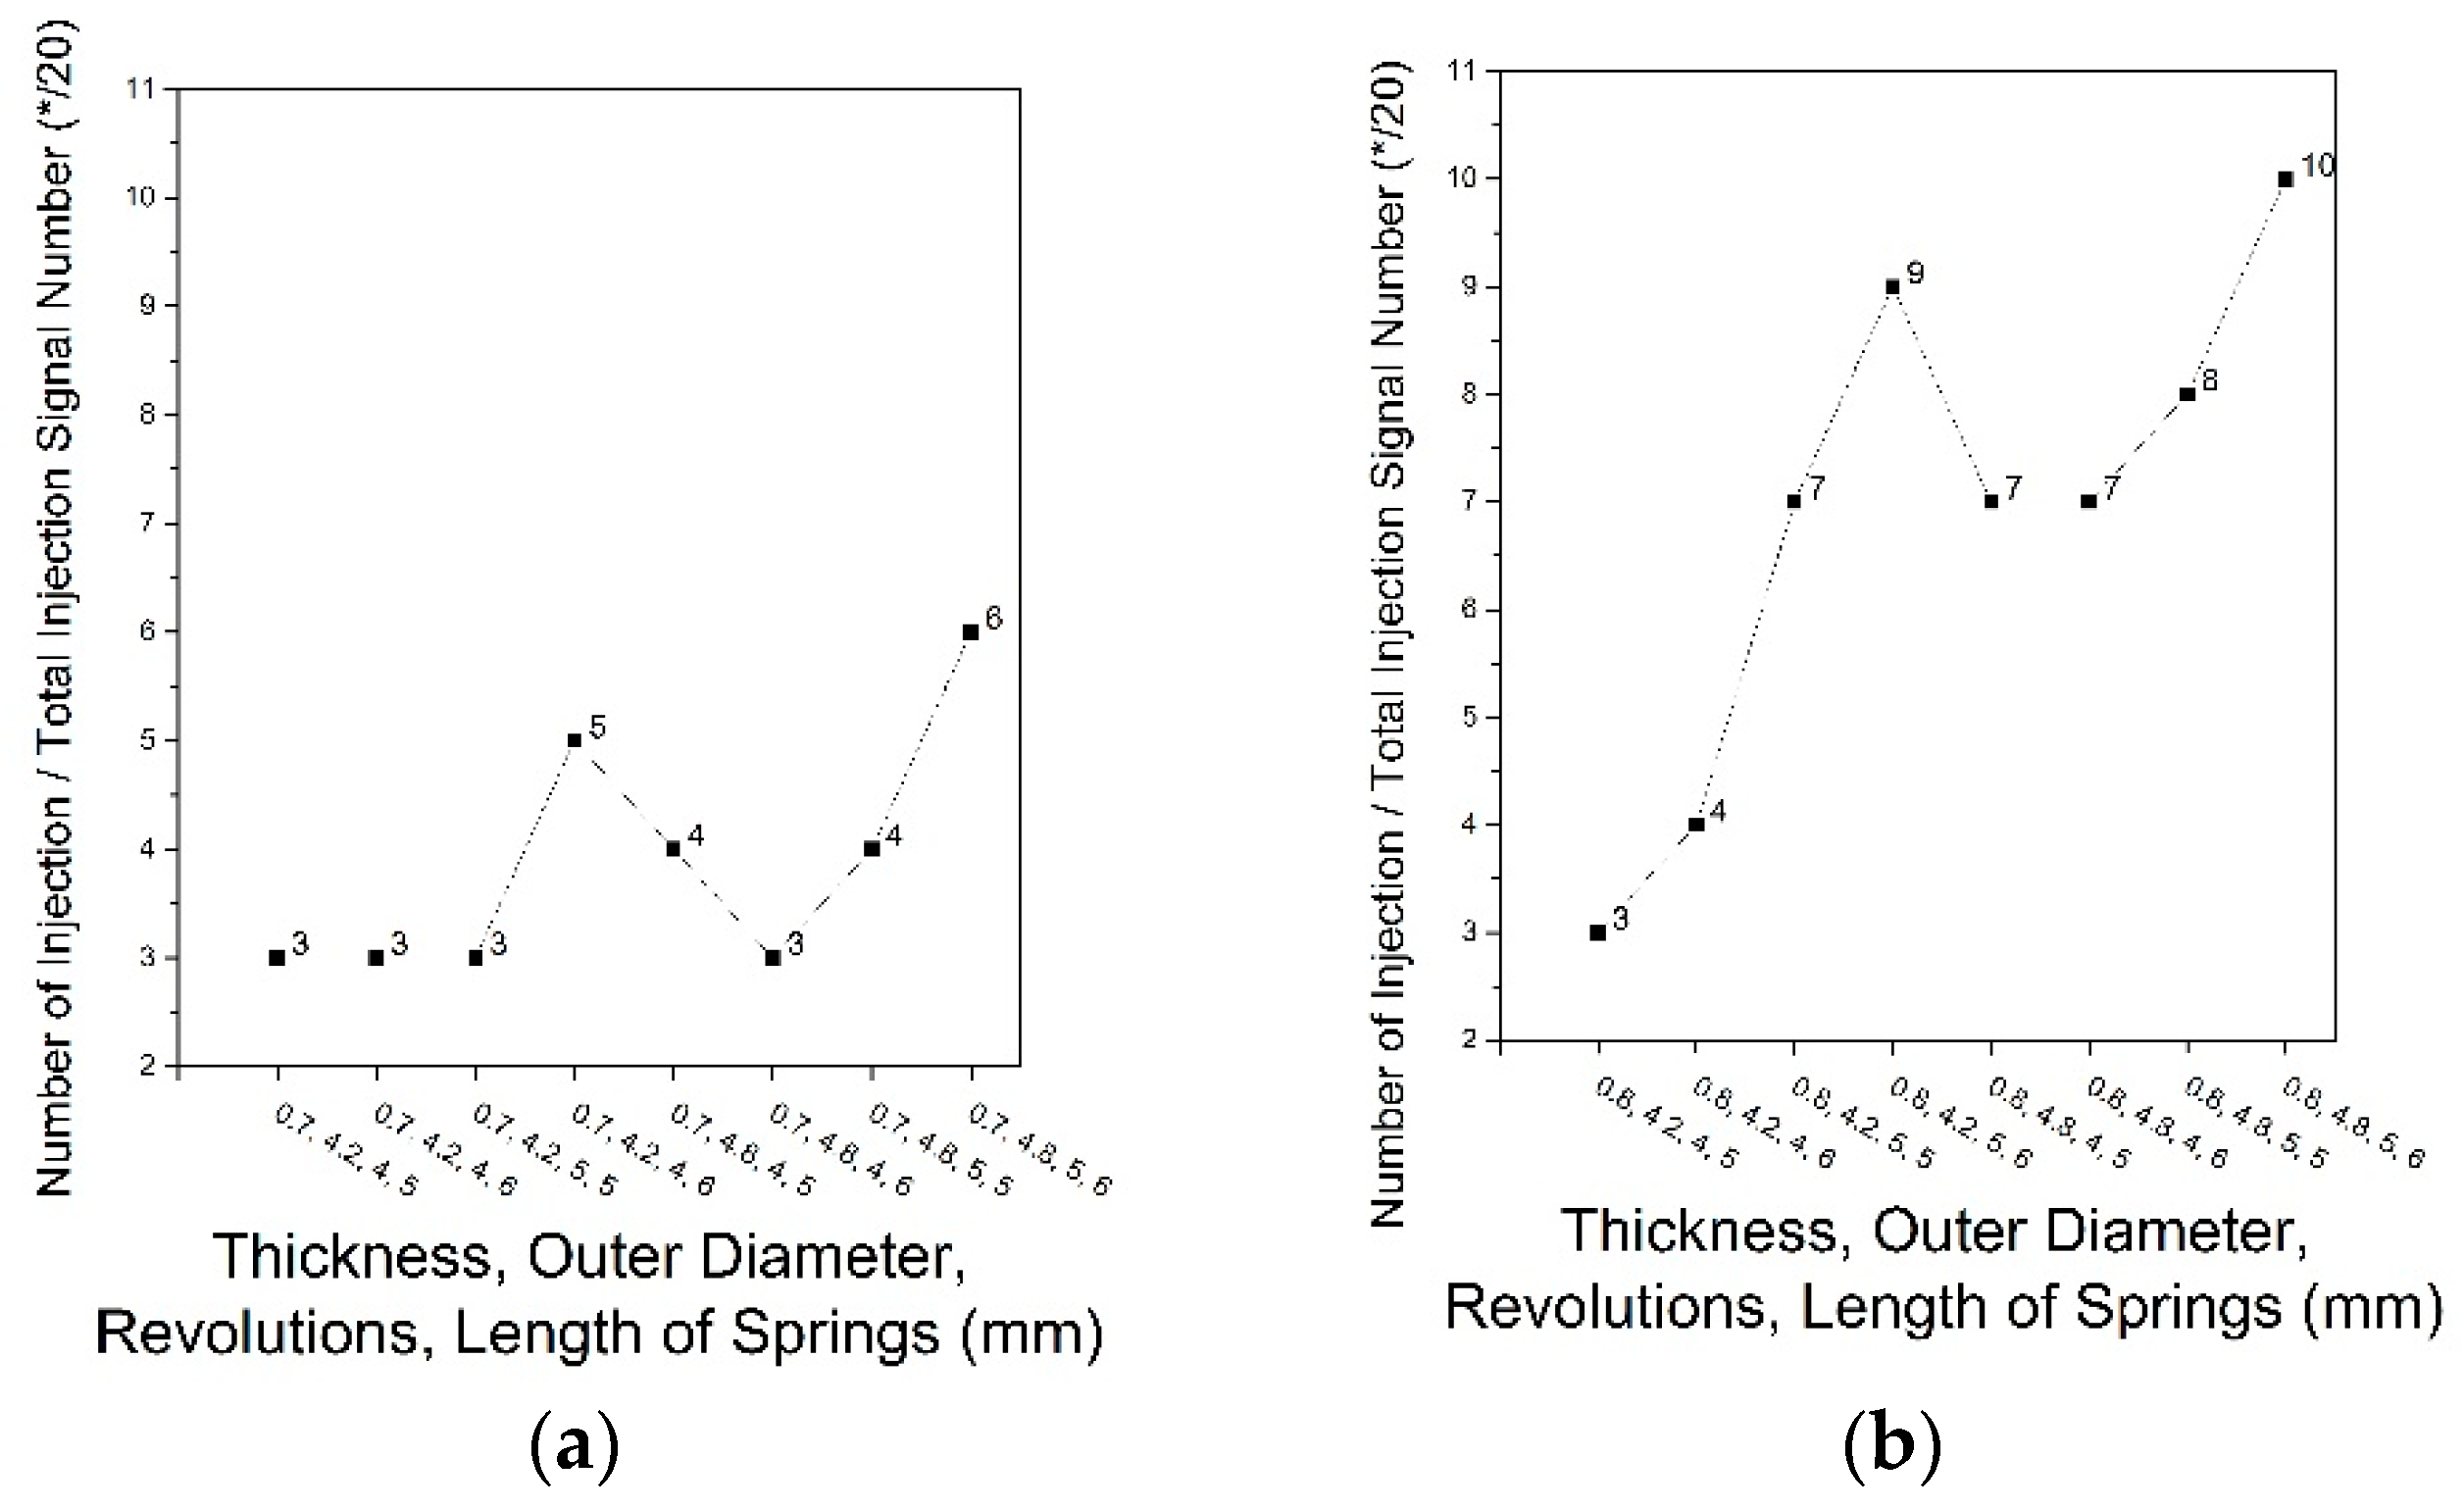
Figure 8.
Detailed designs of Type 2 DPIs.
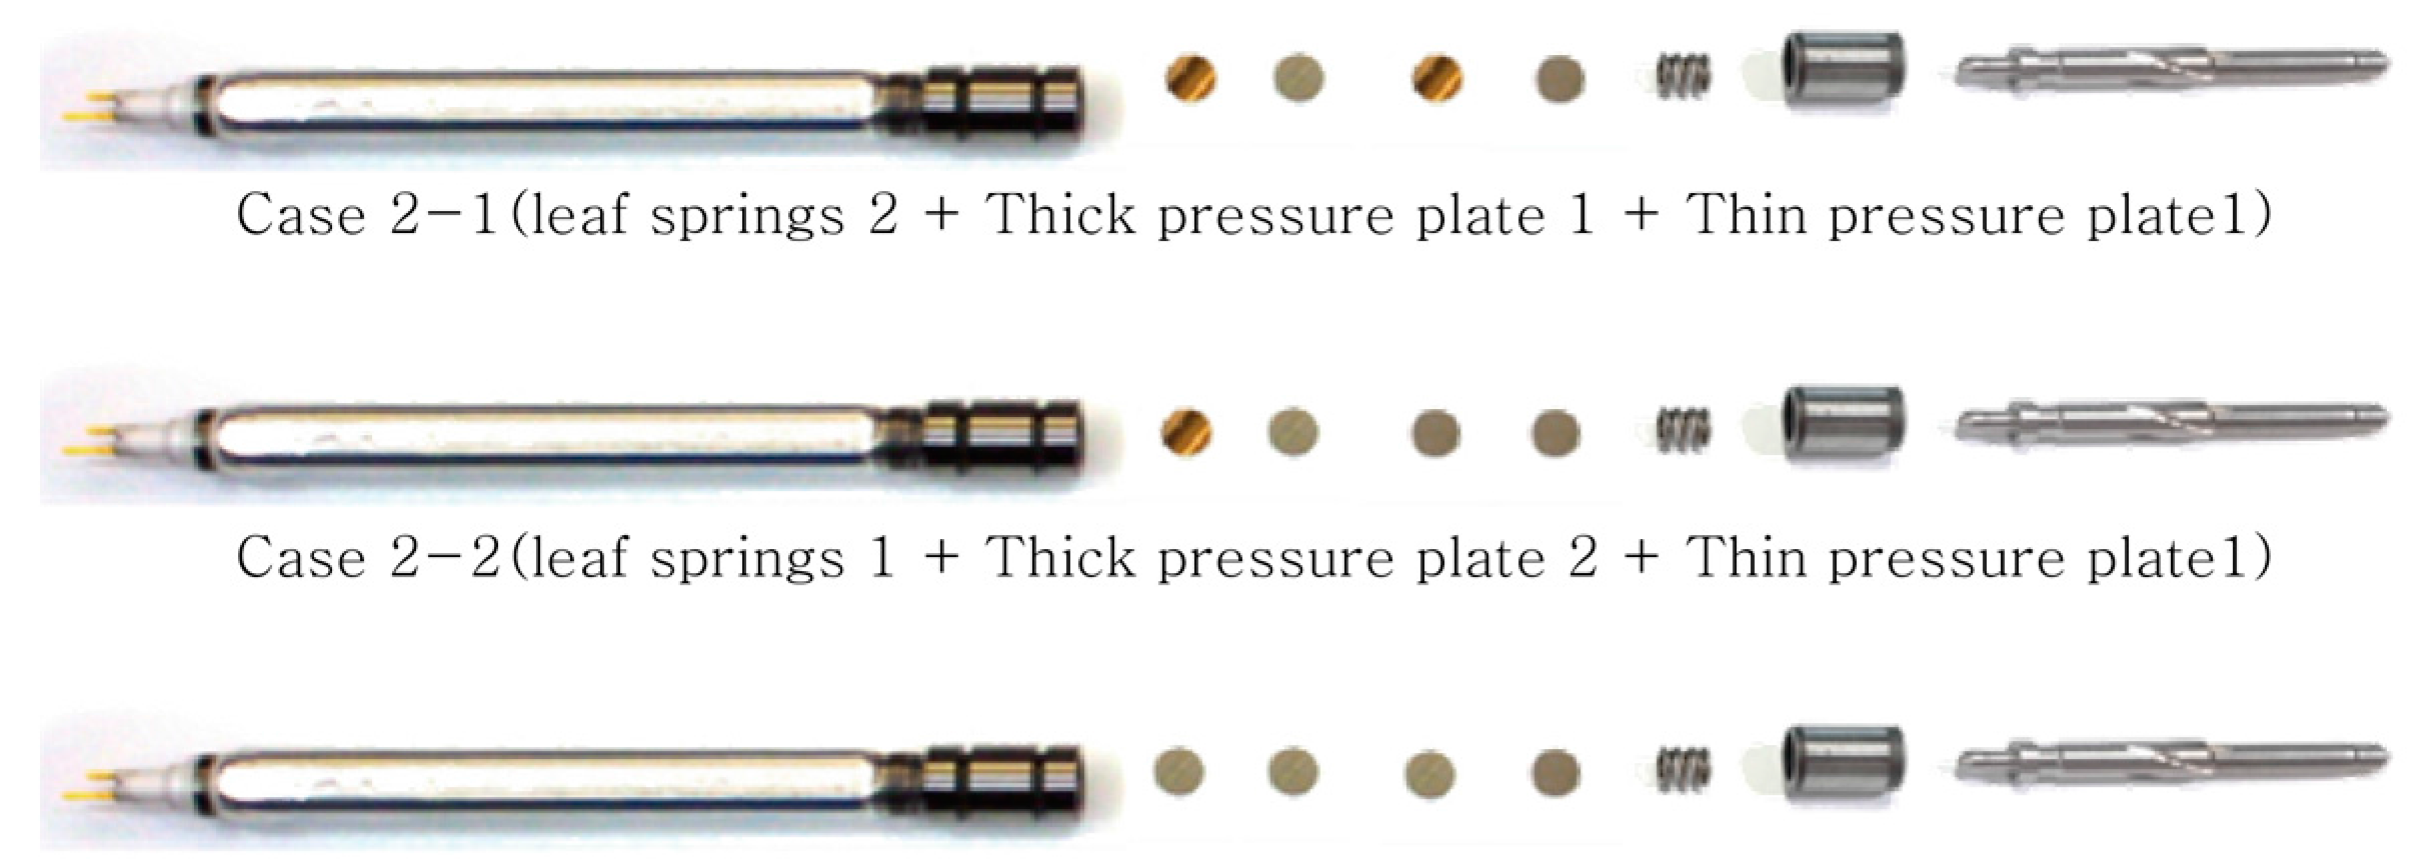
Figure 9.
Comparison of needle configuration; (a) Type 2, (b) Conventional Type DPI.

Figure 10.
Comparison of the maximum injection pressure of Type 2 DPIs.

Figure 11.
Detailed designs of Type 3 DPIs.

Figure 12.
Comparison of the maximum injection pressures of Type 3 DPIs.
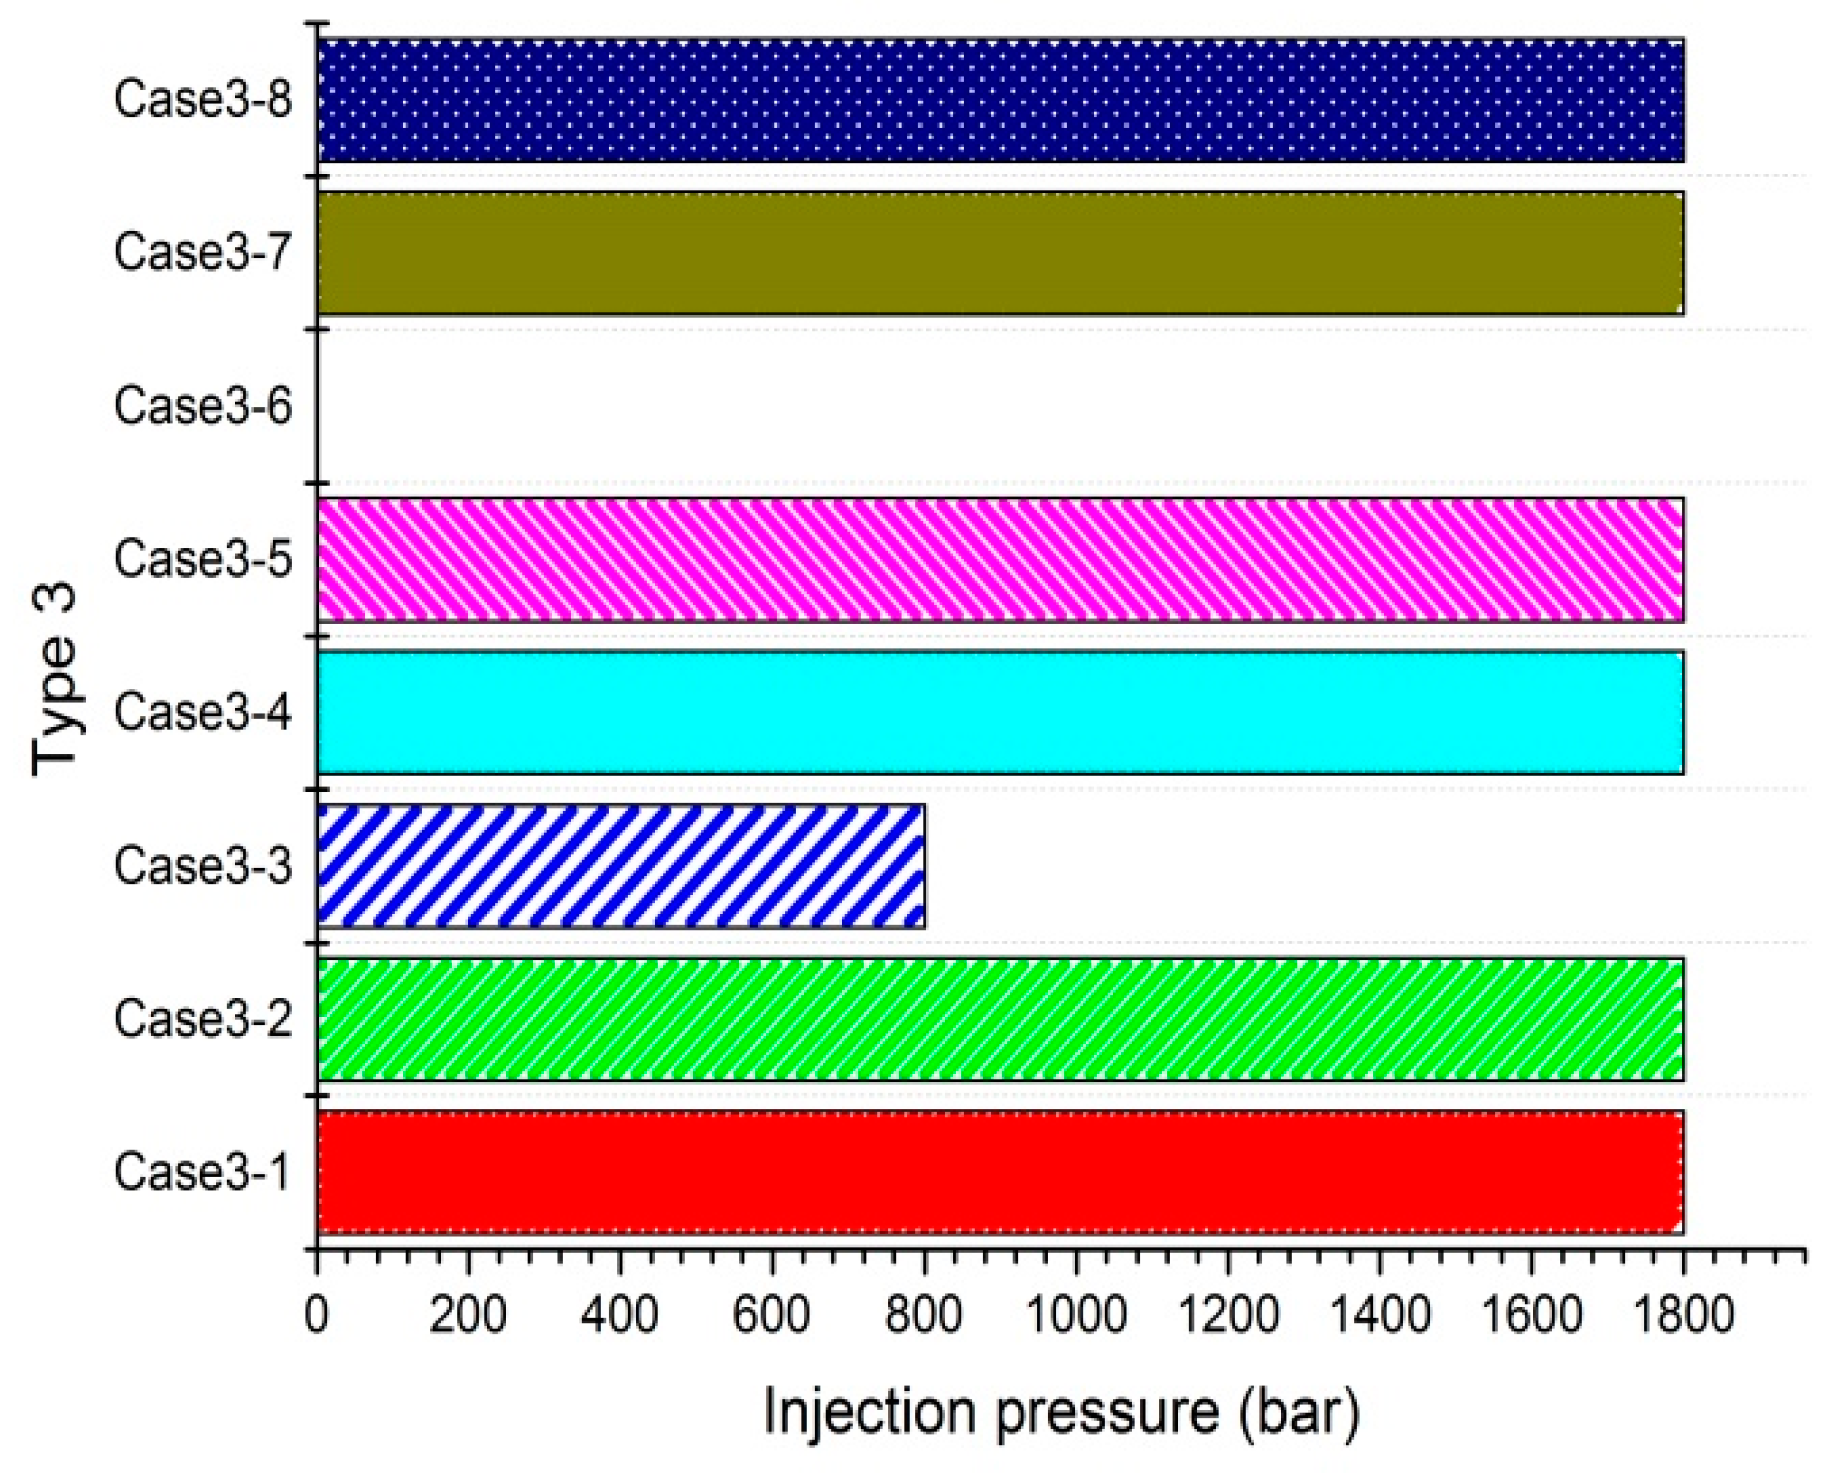
Figure 13.
Comparison of the spray speed results in Type 3 DPIs.
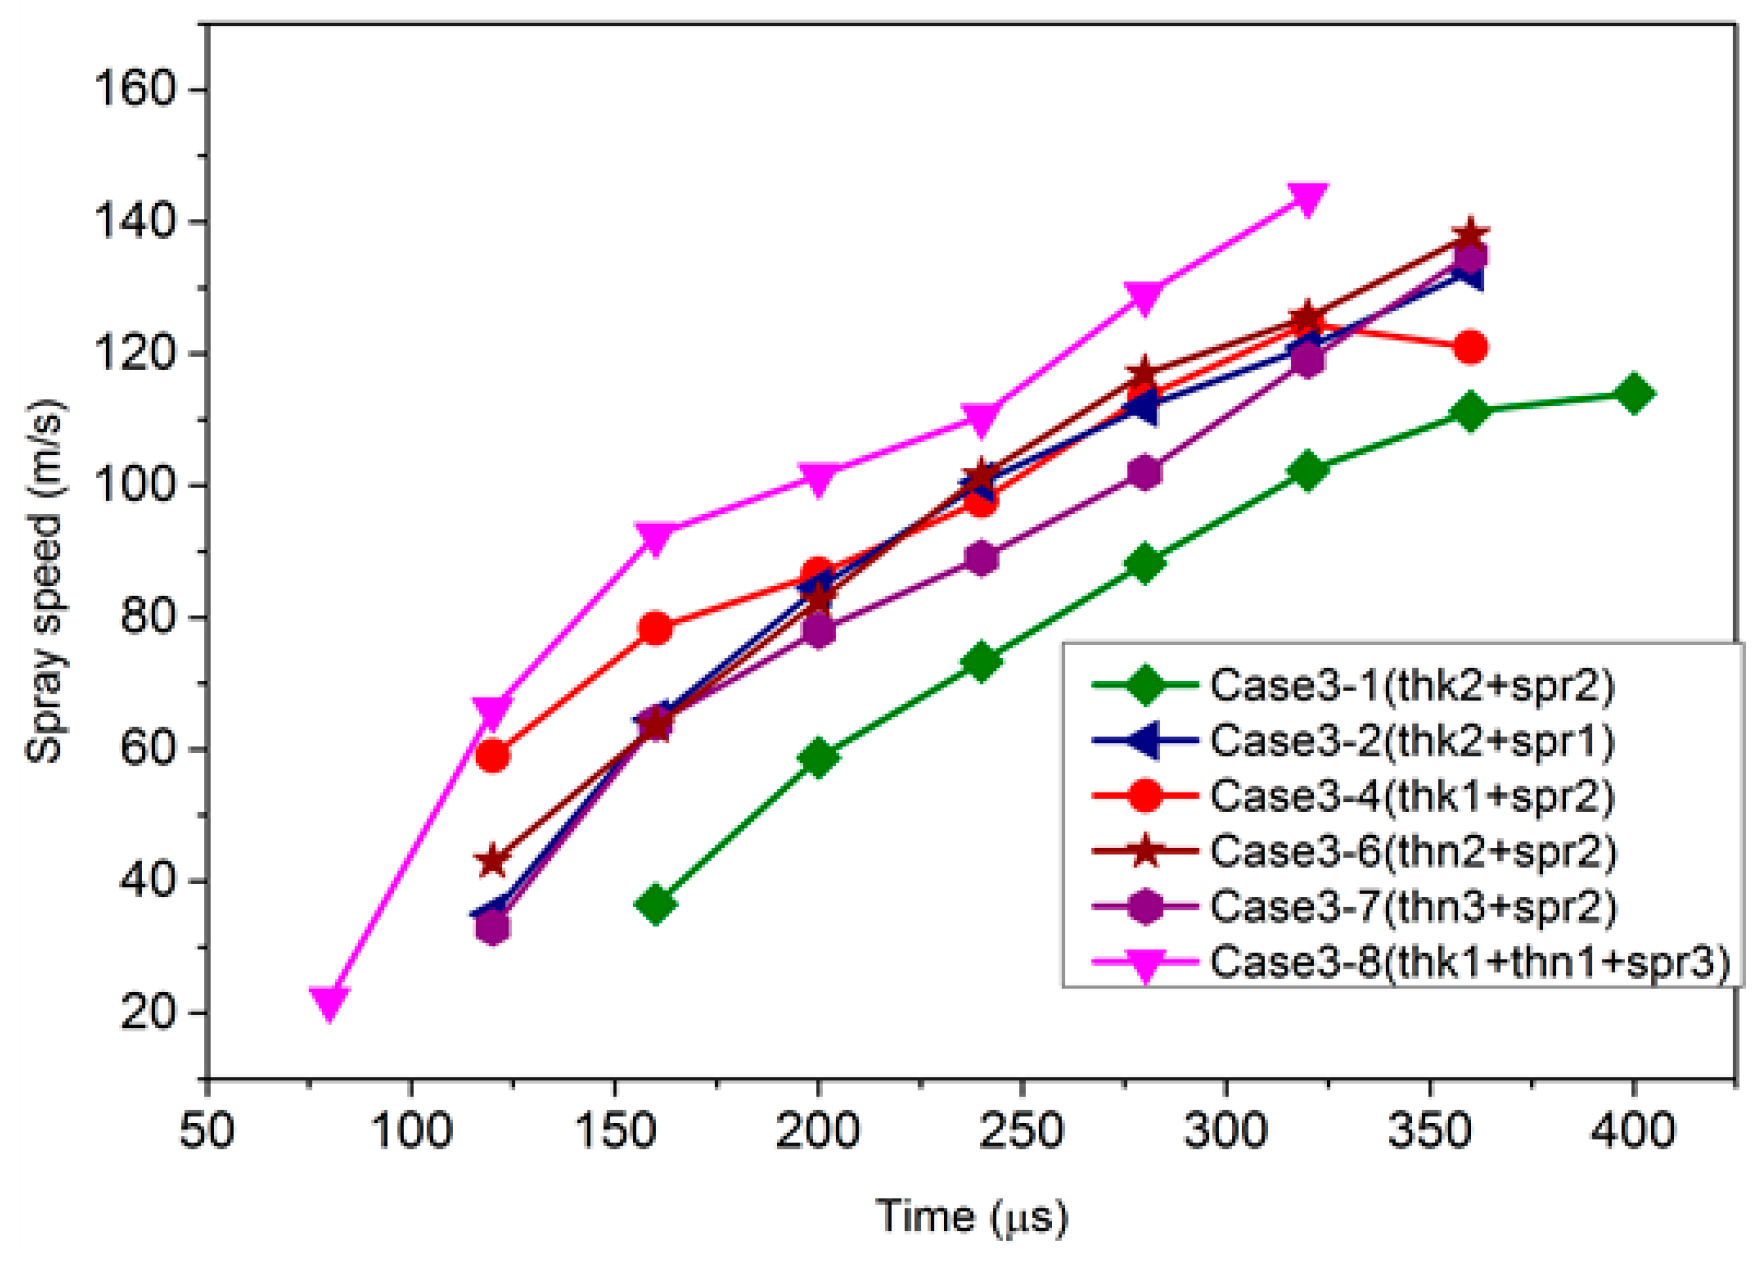
Figure 14.
Comparison of the maximum injection pressure for representative Type 1, 2 and 3 DPI.
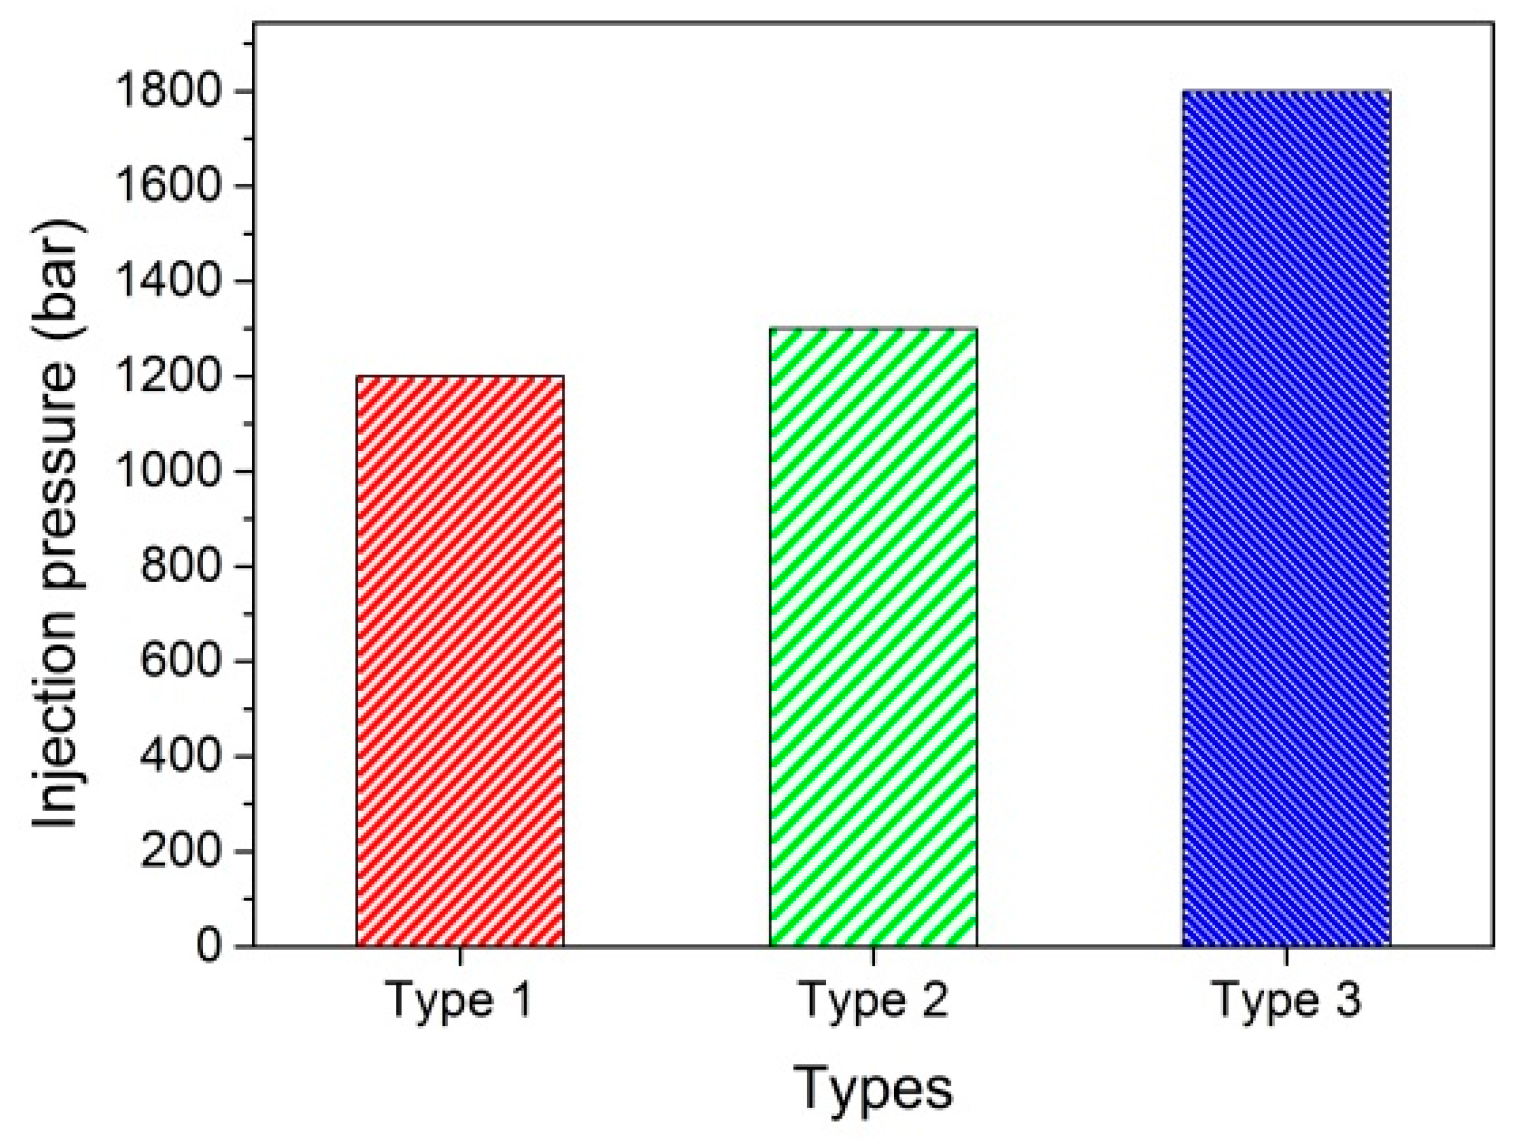
Figure 15.
Comparison of spray speed with various DPIs.

Figure 16.
Comparison of Mie-scattering spray image between conventional type and Type 3 DPI.
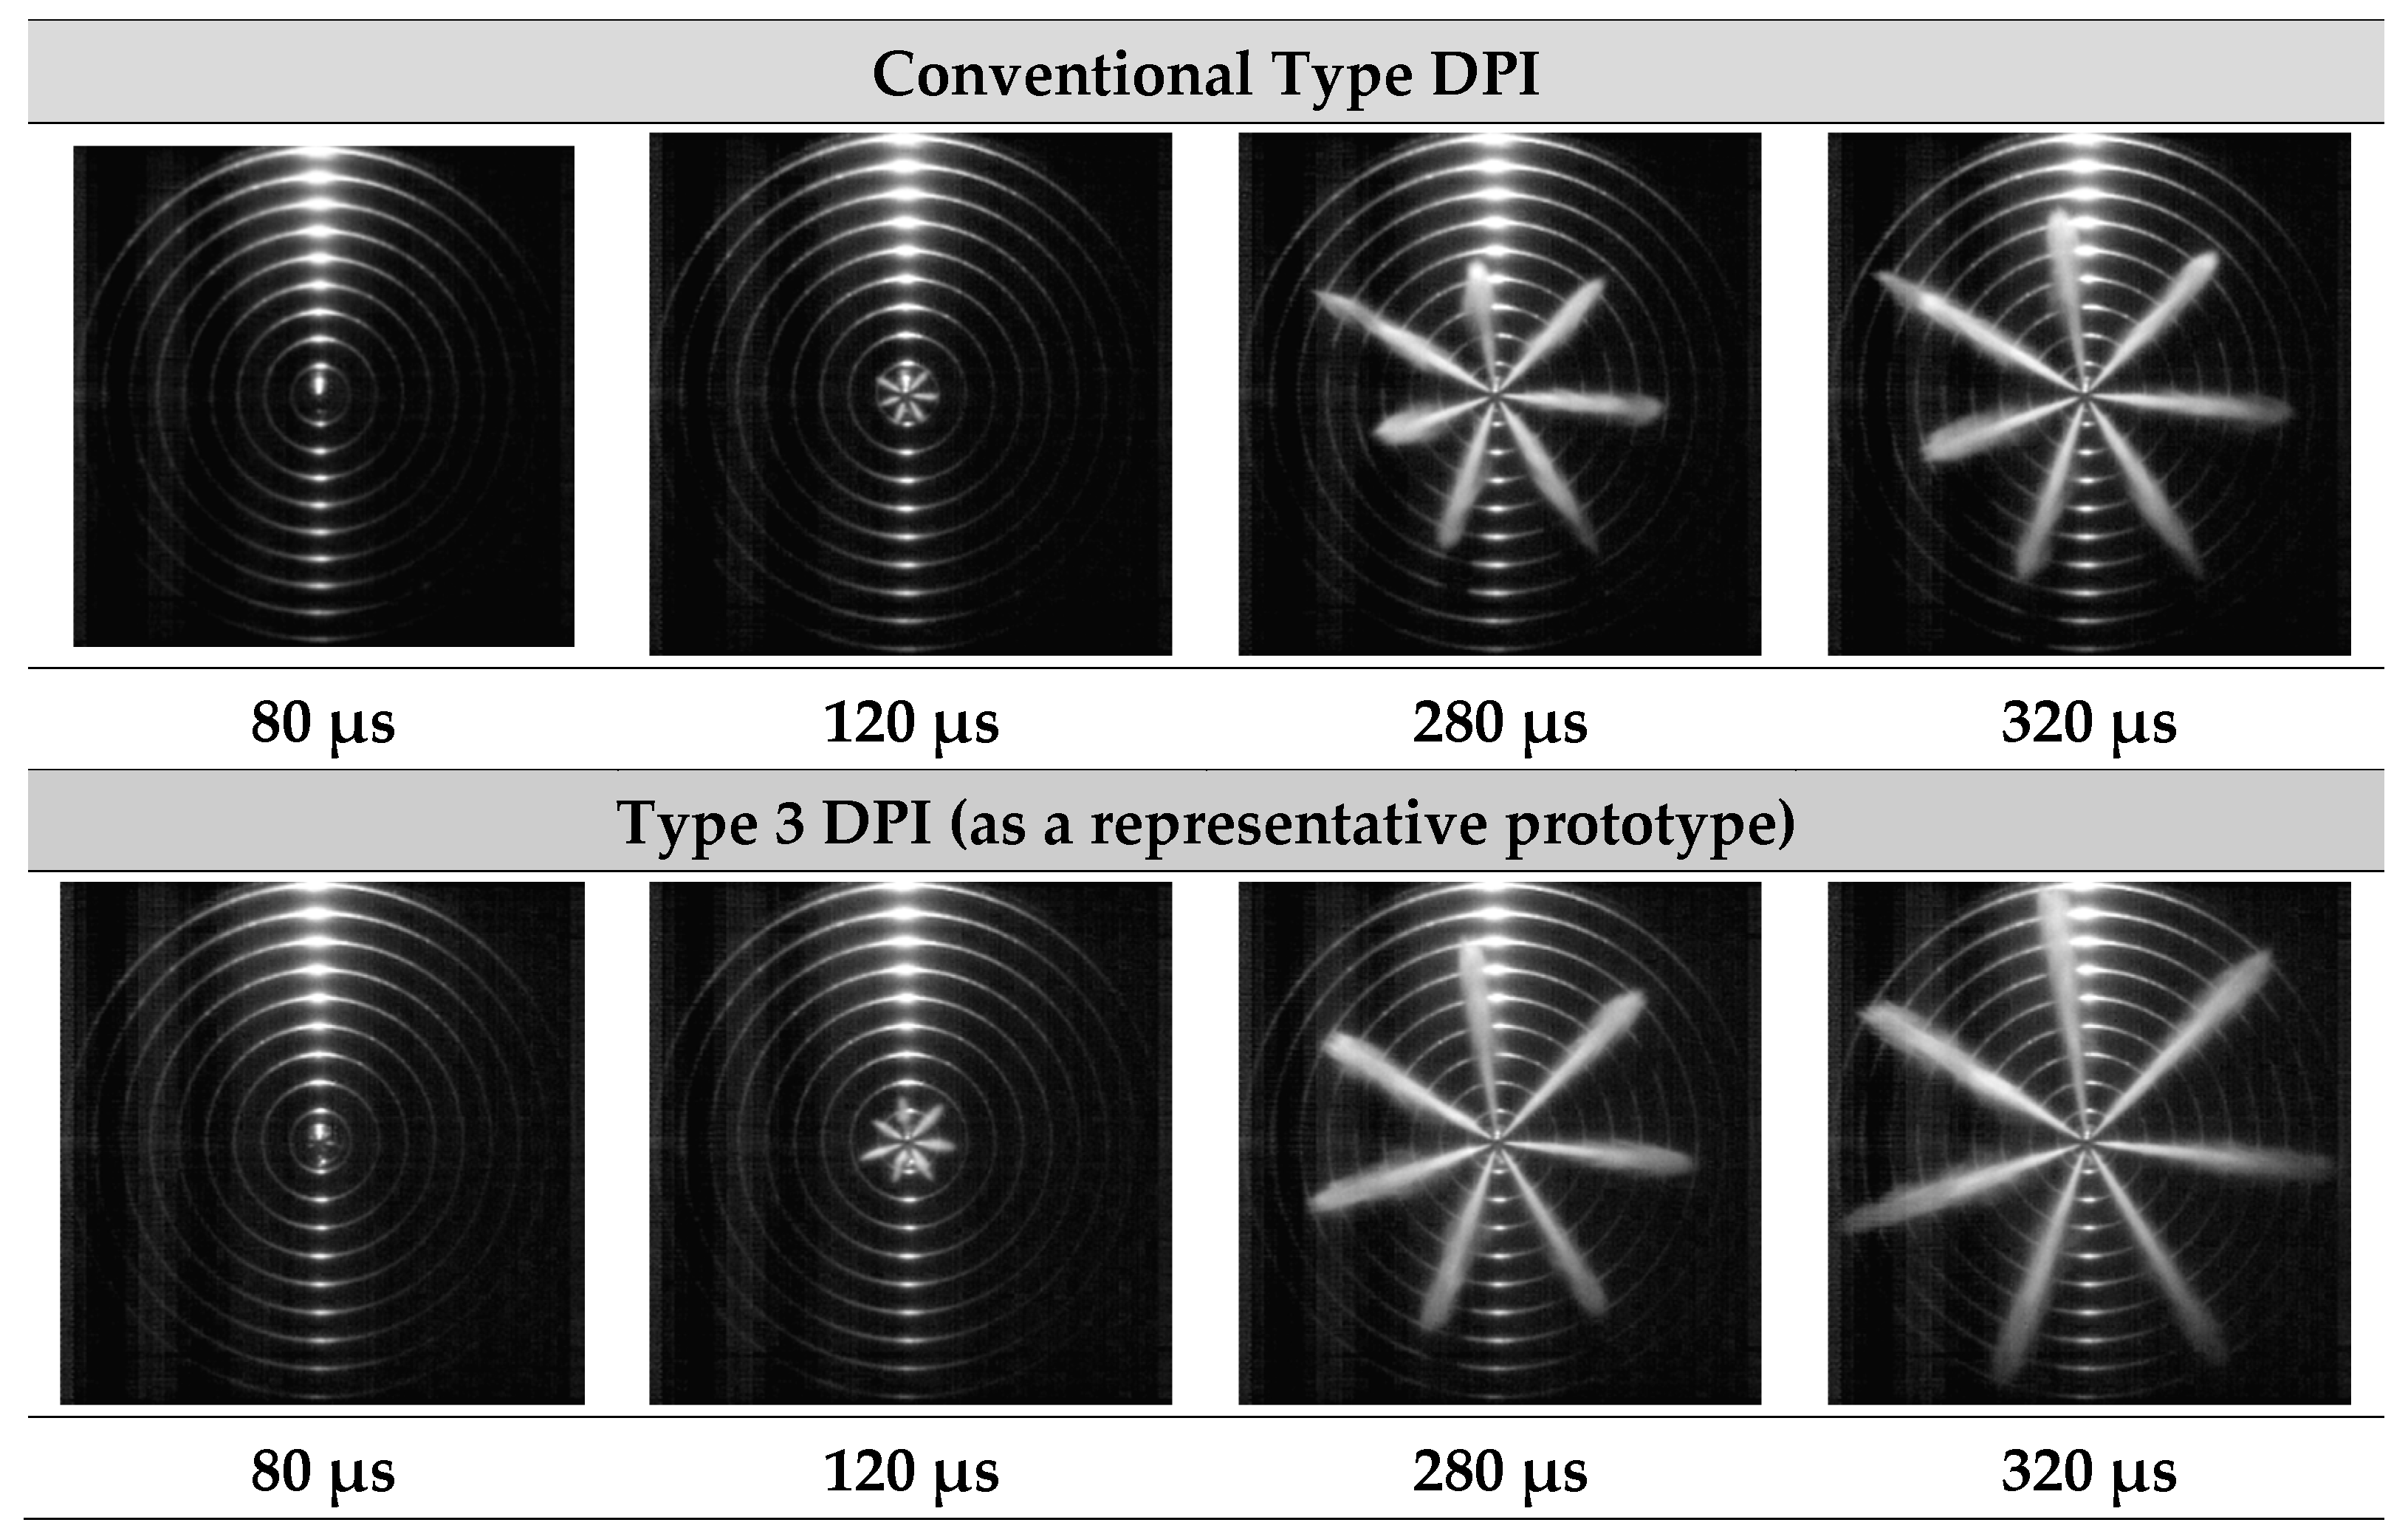
Figure 17.
Comparison of the injection rate with various DPIs.

Figure 18.
Comparison of the injection rate between conventional type and Type 3 DPI.

Figure 19.
Comparison of HC and NOx emissions between conventional type and Type 3 DPI; (a) 7 mg/stroke (injection quantity) and BTDC 10 CA (injection timing); (b) 3, 7 mg/stroke (pilot/main injection quantity) and BTDC 15, 5 CA (pilot/main injection timing).
Figure 19.
Comparison of HC and NOx emissions between conventional type and Type 3 DPI; (a) 7 mg/stroke (injection quantity) and BTDC 10 CA (injection timing); (b) 3, 7 mg/stroke (pilot/main injection quantity) and BTDC 15, 5 CA (pilot/main injection timing).


Table 1.
Experimental conditions for maximum injection pressure measurement.
| Item | Specification |
|---|---|
| Fuel | ULSD(Ultra-Low-Sulfur Diesel) |
| Injection duration (µs) | 1000 |
| Injection pressure (MPa) | 30~180 |
Table 2.
Experimental conditions for measuring injection rate.
| Properties | Specification |
|---|---|
| Fuel | ULSD |
| Tube length (m) | 12.607 |
| Tube area (m2) | |
| Injection pressure (MPa) | 30~180 |
| Duration (µs) | 1000 |
Table 3.
Specifications of the high-speed camera.
| Properties | Specification |
|---|---|
| Model | Phantom V7.3 |
| Max. resolution | 800 600 |
| Sensor type | 16 bit sensor |
| Max. PPS | 500,000 |
| Trigger source | TTL signal |
| Memory | 8 G DDR RAM |
Table 4.
Experimental conditions for spray visualization.
| Properties | Specification |
|---|---|
| Injection duration (µs) | 1000 |
| Injection Pressure (MPa) | 120 |
| Resolution (pixels) | 320 320 |
| Sample rate (frame per second) | 25,000 |
| Exposure (µs) | 40 |
| Ambient condition | 1 atm. 300 K |
Table 5.
Main specifications of the single-cylinder diesel engine.
| Properties | Specification |
|---|---|
| Engine type | Horizontal DI diesel engine |
| Bore Stroke (mm) | 95 95 |
| Displacement (cc) | 673 |
| Compression ratio | 18.0 |
| Valve type | SOHC (Single OverHead Camshaft) 2 valve |
| Combustion chamber type | Reentrant bowl-in-piston |
Table 6.
Engine combustion test conditions.
| Item | Specification |
|---|---|
| Engine speed (rpm) | 1200 |
| Injection quantity (mg/stroke) | 3, 7 |
| Injection timing (BTDC) | 5, 15, 20 |
Table 7.
Specifications of the exhaust gas measuring device.
| Item | CO | HC | CO2 | NOx | O2 |
|---|---|---|---|---|---|
| Measuring rage | 0.00~10.00% | 0~10,000 ppm | 0.00~20.00% | 0~5000 ppm | 0.00~25.00% |
| Repeatability | ± 0.06 | ± 12 | ± 0.5 | ± 7 | - |
| Measurement methods | NDIR | NDIR | NDIR | CLD | CLD |
| Responsibility | up to 10 s, 90% response | ||||
Table 8.
Comparison of spray characteristics with various DPIs.
| Item | Type 1 | Type 2 | Type 3 | Conventional Type |
|---|---|---|---|---|
| Max. speed (m/s) | 91 | 104 | 113 | 103 |
| Ave. speed (m/s) | 59 | 67 | 80 | 69 |
| SOI (μs) | 200 | 200 | 80 | 120 |
Table 9.
Comparison of the injection quantity with various DPIs.
| Type 1 | Type 2 | Type 3 | |
|---|---|---|---|
| Quantity (mg) | 3.14 | 3.53 | 3.56 |
Table 10.
Comparison of injection quantity between conventional type and Type 3 DPI.
| Conventional Type | Type 3 | |
|---|---|---|
| Quantity (mg) | 3.51 | 3.56 |
© 2017 by the authors. Licensee MDPI, Basel, Switzerland. This article is an open access article distributed under the terms and conditions of the Creative Commons Attribution (CC BY) license (http://creativecommons.org/licenses/by/4.0/).
Share and Cite
MDPI and ACS Style
Han, S.; Kim, J.; Lee, J. A Study on the Optimal Actuation Structure Design of a Direct Needle-Driven Piezo Injector for a CRDi Engine. Appl. Sci. 2017, 7, 320. https://doi.org/10.3390/app7040320
AMA Style
Han S, Kim J, Lee J. A Study on the Optimal Actuation Structure Design of a Direct Needle-Driven Piezo Injector for a CRDi Engine. Applied Sciences. 2017; 7(4):320. https://doi.org/10.3390/app7040320
Chicago/Turabian StyleHan, Sangik, Juhwan Kim, and Jinwook Lee. 2017. "A Study on the Optimal Actuation Structure Design of a Direct Needle-Driven Piezo Injector for a CRDi Engine" Applied Sciences 7, no. 4: 320. https://doi.org/10.3390/app7040320
Note that from the first issue of 2016, this journal uses article numbers instead of page numbers. See further details here.