Article

Hyperspectral Imaging as a Rapid Quality Control Method for Herbal Tea Blends

1
Department of Pharmaceutical Sciences, Faculty of Science, Tshwane University of Technology, Private Bag X680, Pretoria 0001, South Africa
2
SAMRC Herbal Drugs Research Unit, Faculty of Science, Tshwane University of Technology, Private Bag X680, Pretoria 0001, South Africa
*
Author to whom correspondence should be addressed.
Appl. Sci. 2017, 7(3), 268; https://doi.org/10.3390/app7030268
Submission received: 11 January 2017 / Revised: 21 February 2017 / Accepted: 1 March 2017 / Published: 8 March 2017
(This article belongs to the Special Issue Applications of Hyperspectral Imaging for Food and Agriculture)

Abstract

:
In South Africa, indigenous herbal teas are enjoyed due to their distinct taste and aroma. The acclaimed health benefits of herbal teas include the management of chronic diseases such as hypertension and diabetes. Quality control of herbal teas has become important due to the availability of different brands of varying quality and the production of tea blends. The potential of hyperspectral imaging as a rapid quality control method for herbal tea blends from rooibos (Aspalathus linearis), honeybush (Cyclopia intermedia), buchu (Agathosma Betulina) and cancerbush (Sutherlandia frutescens) was investigated. Hyperspectral images of raw materials and intact tea bags were acquired using a sisuChema shortwave infrared (SWIR) hyperspectral pushbroom imaging system (920–2514 nm). Principal component analysis (PCA) plots showed clear discrimination between raw materials. Partial least squares discriminant analysis (PLS-DA) models correctly predicted the raw material constituents of each blend and accurately determined the relative proportions. The results were corroborated independently using ultra-high performance liquid chromatography coupled to mass spectrometry (UHPLC-MS). This study demonstrated the application of hyperspectral imaging coupled with chemometric modelling as a reliable, rapid and non-destructive quality control method for authenticating herbal tea blends and to determine relative proportions in a tea bag.

Graphical Abstract

1. Introduction

The use of fresh and dried herbs for the preparation of herbal infusions (tisanes) that are popularly consumed for the pleasant taste and most importantly their perceived health benefits, dates back to antiquity. Today, tea is the most consumed beverage worldwide, second only to water. In 2013, the total retail sales of bagged, loose and concentrated teas in the United States increased by 5.9% reaching a figure of USD$1,751,055,302. In 2012, the total consumption of tea was shown to comprise of 85% black tea and 15% green tea, with oolong and white tea making up the remainder. The 2013 statistics for bagged, loose and concentrated tea annual sales reported sales of USD$579,974,381 for black tea (bags), an increase from 2012 of 2.5%. The sales of herbal beverage tea (bags), medicinal teas (bags) and African red tea (bags) increased by 11.0%, 15.4% and 3.5%, respectively. A trend towards the increased consumption of loose tea was noted, especially in specialty tea and coffee shops. This is reflected in the 11.1% increase in African ted tea (loose) sales for example [1]. Worldwide, the largest consumer of tea is China (1.6 billion pounds per year). However, the consumption per person statistics tells a different story. The top consumers of tea per person per year are Turkey (6.961 pounds), Ireland (4.831 pounds) and the UK (4.281 pounds) [2].
A widely accepted definition of a herbal tea is a non-caffeine-containing hot beverage prepared through infusion of any plant other than the leaves Camellia sinensis (L.) Kuntze or ‘true tea’. True teas including black, green, yellow and oolong teas are all prepared exclusively from Camellia sinensis (Theaceae) [3,4]. In recent years, consumers have become more health conscious, both in terms of prevention and treatment of disease, which has led to an escalation in the use and development of plant-based health products including herbal teas [5]. Herbal teas are important dietary sources of anti-oxidants, especially phenolic compounds, which are capable of preventing free-radical-induced damage in biological systems, thereby preventing disease manifestation and progression [4]. Herbal tea blends are mixtures of two or more plant species (herb or spice) with the same or different medicinal uses blended together. The quest to improve the aesthetic properties of herbal teas has seen the introduction of different herbal tea flavors such as vanilla, lemon and mint. More recently, the introduction of herbal tea ingredients to produce blends with the intention of improving health properties, taste and sometimes masking unpleasant herbal aromas has become popular [6]. The list of top herbal ingredients in herbal beverage teas (bags) include chamomile, mints, ginger, valerian, licorice, aloe and lavender etc. while the top herbal ingredients in medicinal tea (bags) include chamomile, senna, ginger, Echinacea, dandelion and kava, etc. [1].
On the “world’s biggest tea drinkers” list, South Africa occupies 11th place, with consumption of 1.789 pounds per person per year [2]. A number of plants have traditionally been used in South Africa as “teas”. Two Cape fynbos plants, rooibos (African red tea) and honeybush, widely cultivated in the Eastern and Western Cape have enjoyed commercial success. Rooibos tea is sold in more than 37 countries with 86% of the export market being represented by Germany, the Netherlands, the UK, Japan and the USA [7]. Anecdotal evidence reports the use of herbal teas such as rooibos and honeybush teas for the relief of colic, vomiting, stomach cramps, indigestion, heartburn and nausea [8,9]. Studies in support of these claims and other biological activities have been documented [7,10,11].
Herbal teas are mostly available on the market as ground or crushed loose products often packaged in tea bags. In this form it is difficult to verify the botanical origin of a product by its appearance [3]. Accidental contamination or deliberately substituting raw materials with a relative species or one of reduced economic value or undeclared fillers is a potential quality concern [12]. Thus, herbal tea authenticity is an issue of food quality and safety. An important aspect in quality control (QC) is to ensure that a product contains exactly what is claimed on the packaging or package insert, with regards to constituents and quantities. However, several reports have shown that most herbal products do not always meet this quality requirement as adulterants and sometimes incorrect botanical species not indicated on the label have been detected resulting in some products being withdrawn from the market. These quality control issues can be overcome by instituting cost-effective, routine quality control procedures during the manufacturing processes [13].
Chemical fingerprinting based on various analytical techniques has been used for the identification, authentication and evaluation of the quality of herbal medicines and related products. Some chromatographic techniques used for chemical fingerprinting include high-performance thin layer chromatography (HPTLC), high-performance liquid chromatography (HPLC), gas chromatography coupled to mass spectrometry (GC-MS) and liquid chromatography coupled to mass spectrometry (LC-MS) [10,14,15,16]. The advantages of these methods include good repeatability, wide applicability, and reasonable qualitative and quantitative capabilities [14]. These methods are however costly, require cumbersome sample preparation, skilled personnel and longer total analysis time.
Spectroscopy, on the other hand is a fast, accurate, more cost-efficient, non-destructive method that does not require sample preparation and it can be regarded as an alternative to traditional chemical analysis methods. Near-infrared (NIR) spectroscopic analysis has been implemented with success in the agricultural, petrochemical, textile and pharmaceutical industries [17]. NIR spectroscopy has been successfully applied to determine the quality of black tea through the prediction of moisture and theaflavin content [18]. Several methods to determine the quality of green tea using NIR spectroscopy and chemometric methods have been developed. Calibration models constructed could be used to predict the content of caffeine, epigallocathechin gallate (EGCG), epicatechin (EC), epigallogatechin (EGC) and epicatechin gallate (ECG) as well as total antioxidant capacity [17,19,20]. Diffusion reflectance Fourier transform mid-infrared spectroscopy in combination with chemometric discrimination methods has been applied with success to distinguish between twelve different tea varieties including several black, green and semifermented oolong teas [21].
Hyperspectral imaging (HSI) is a technique that combines spectroscopy and digital imaging technologies to capture the composition (spectral data) as well as spatial distribution of constituents within a sample of interest [13,22]. In the past decade, the technique has found applications for quality assessment of raw materials and products in various sectors such as agricultural, food and pharmaceutical industries [23,24]. Hyperspectral imaging is used to acquire a spectrum for each pixel in the imaging scene with the purpose of finding objects or identifying materials. The acquired image can then be analyzed using multivariate algorithms for visualization of chemical constituents and their distribution within a matrix [17]. In this study, HSI was investigated as a fast, visual and non-destructive technique in the differentiation of herbal tea raw materials. Furthermore, the technique was used to quantitatively determine the composition of herbal tea blends (bags). The following blends were investigated; (1) rooibos (Aspalathus linearis (Burm.f.) R. Dahlgren) and buchu (Agathosma betulina (P.J Berg.) Pill.); (2) green rooibos (A. linearis) and green honeybush (Cyclopia intermedia E. Mey.); and (3) rooibos (A. linearis) and cancer bush (Sutherlandia frutescens (L.) R.Br.). To validate the HSI results, an independent analytical technique, ultra-high performance liquid chromatography coupled to mass spectroscopy (UHPLC-MS) was used to compare the profiles of the raw materials and the tea bag blends through biomarker identification.

2. Materials and Methods

2.1. Sample Collection and Preparation

The individual raw materials including Aspalathus linearis (rooibos), Agathosma betulina (buchu), Sutherlandia frutescens (cancer bush) and Cyclopia intermedia (honeybush) as well as the various blended mixtures in tea bags were obtained from a tea manufacturing company in Clanwilliam (South Africa). The following blends were investigated; rooibos (fermented) and buchu, green rooibos (unfermented) and honeybush, and rooibos (fermented) and cancer bush. No sample preparation was done prior to analysis. Retention samples labeled TUT01–TUT09 were stored in the Department of Pharmaceutical Sciences, Tshwane University of Technology.

2.2. SWIR Hyperspectral Imaging Analysis

A sisuChema short wave infrared (SWIR) camera (Specim, Spectral Imaging Ltd., Oulu, Finland) equipped with ChemaDaq version 3.62.183.19 software (Specim, Spectral Imaging Ltd., Oulu, Finland) was used to acquire images of the raw materials. The imaging spectrograph of this pushbroom imaging system is connected to a 2D array mercury–cadmium–telluride (HgCdTe) detector. Quartz halogen lamps were employed as the light source. Images were captured in the range of 920–2514 nm using a high magnification lens (field of view: 50 mm; spatial resolution: 150 μm) with a frame rate of 100 Hz at an exposure of 3.0 ms. The resolution of 6–7 nm resulted in images consisting of 256 × 320 pixels [13].

2.2.1. Image Acquisition

Each raw material (individual species) was filled into a plastic container (8 mm in diameter) and the surface leveled using a spatula. For each tea blend investigated, three samples of each raw material were used to build the model. The samples were randomly placed on a mobile platform which entered the field of view when prompted for image capture. The tea bags (n = 3) were then imaged separately under the same conditions at room temperature. Each of the three tea bags was imaged six times and between each image capture the tea bag was shaken and turned, resulting in 18 replicate images per tea bag per blend. A three-dimensional hypercube (x, y, λ) was generated for each image where x and y represent spatial dimensions (number of pixels in rows and columns) and λ the spectral dimension [22]. The image was composed of several pixels where each pixel represented a complete spectrum containing point chemical information at a given wavelength. The X-data matrix was formed by the pixel reflectance values within the defined wave region and the wave numbers constituted the independent variables. Internal dark (0%) and white (100%) reference standards were used for image calibration and to correct variation in sample illumination from dark current from the camera and noise from uneven light intensity of different wavelength bands. The raw images were corrected automatically for white and dark references and converted to pseudo-absorbance (Analog to digital (A/D) converter counts to absorbance) using Evince™ (Version 2.5.0, Prediktera AB, Umeå, Sweden) [13,25,26,27].

2.2.2. Principal Component Analysis (PCA)

Spectral unfolding was performed to convert the 3D data cube to a 2D data matrix. Principal component analysis on mean centered data was performed and unwanted background and edge effects were removed using the interactive score image and score plots. The spectral data and loadings plot were used to identify noisy regions in the data which does not contribute to discrimination, i.e., 920–996 nm. Various spectral preprocessing methods such as multiplicative scatter correction (MSC), standard normal variate (SNV) and Savitsky–Golay smoothing, were tested on the model to enhance chemical differences by eliminating scattering, detector noise, optic effects and rough surfaces. The best model was identified as SNV and was therefore used in the final model. A PCA plot was constructed to display clustering patterns of the different samples in the reference image. A partial least squares discriminant analysis (PLS-DA) model was constructed for classification of raw materials and prediction of raw material constituents in the tea bags. The image matrix was then folded back into three-dimensional forms after classification analysis [13,28].

2.2.3. Partial Least Squares Discriminant Analysis

Partial least squares discriminant analysis (PLS-DA) is a supervised algorithm that aims to establish a relationship between the X data matrix and known class membership (Y). The model was constructed by assigning a class to each species in the PCA score image and each class was assigned a unique score color for differentiation. Cross-validation of the model was performed using the random exclusion method and the validation parameters were used to assess model performance. The PLS-DA model was used to predict the composition of raw material constituents in the tea bag images (external dataset). It was important to ensure that the number of pixels in the prediction image was very close to that in the calibration image so that the PLS-DA model would perform an accurate prediction of the external dataset [13,22]. Class prediction was achieved by matching the chemical information for each pixel in the tea bag to the raw materials in the calibration image. Where a match was found, the pixels in the tea bag would be assigned a color corresponding to the raw material in the PLS-DA calibration image.

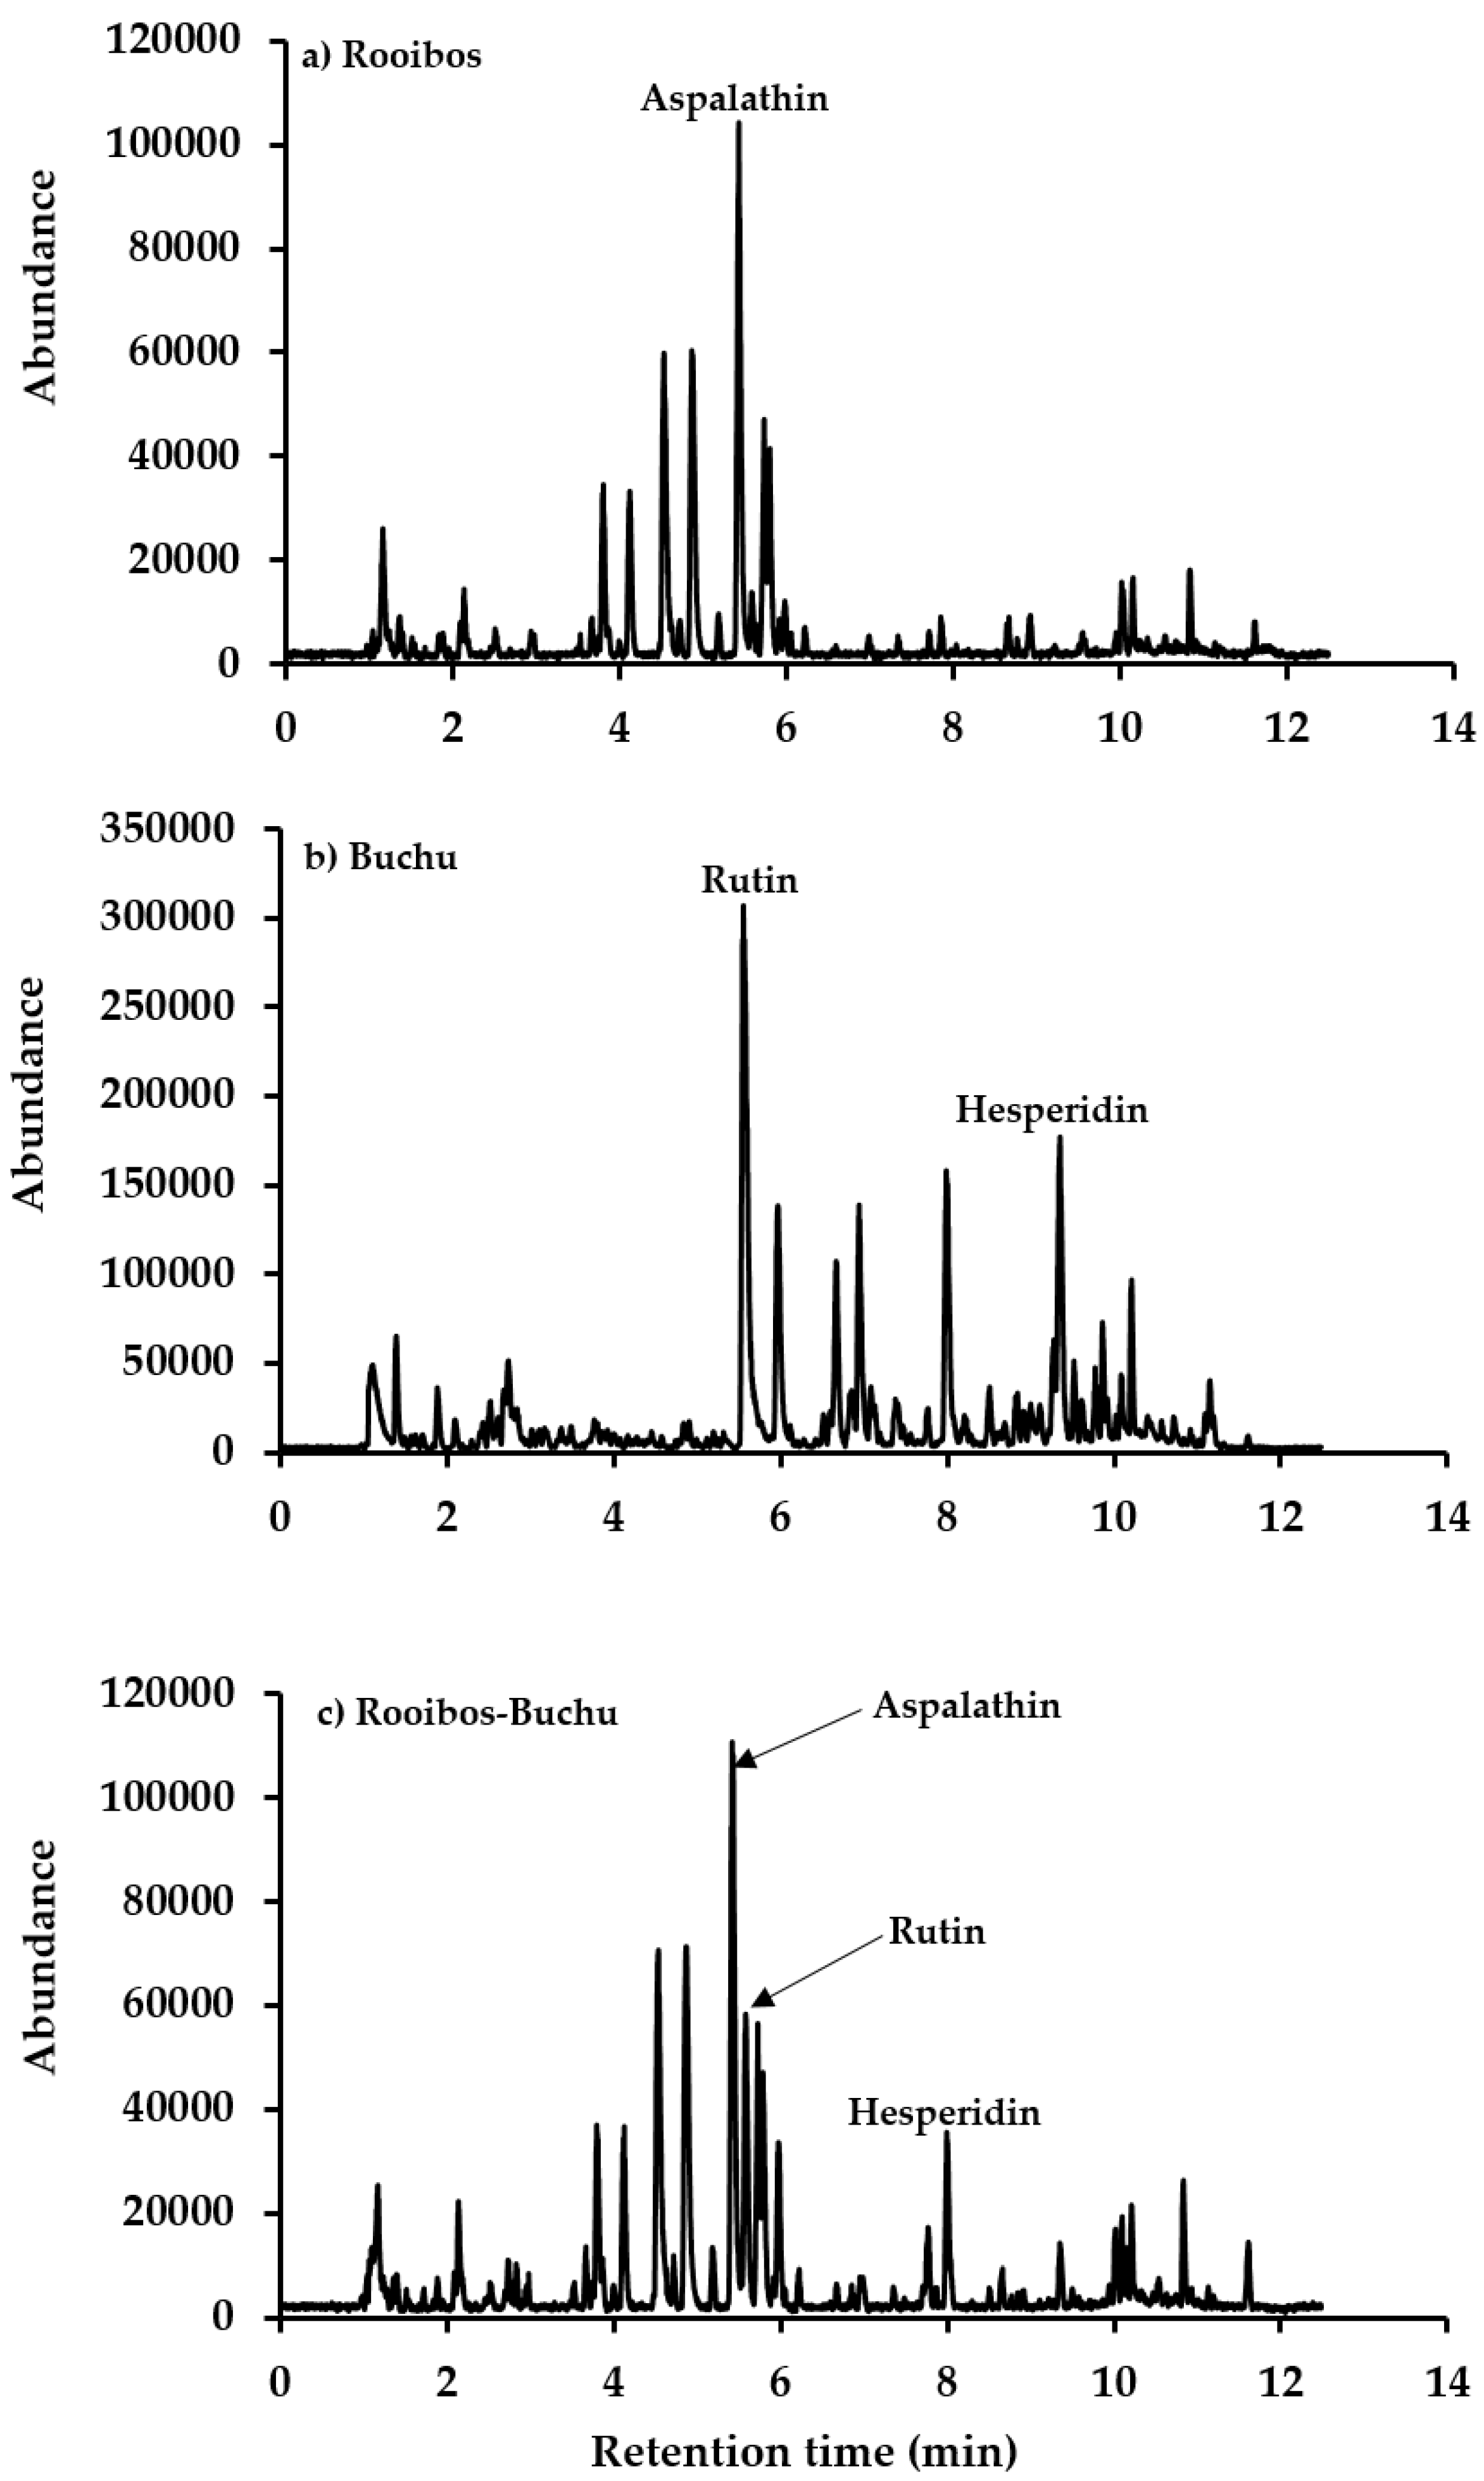
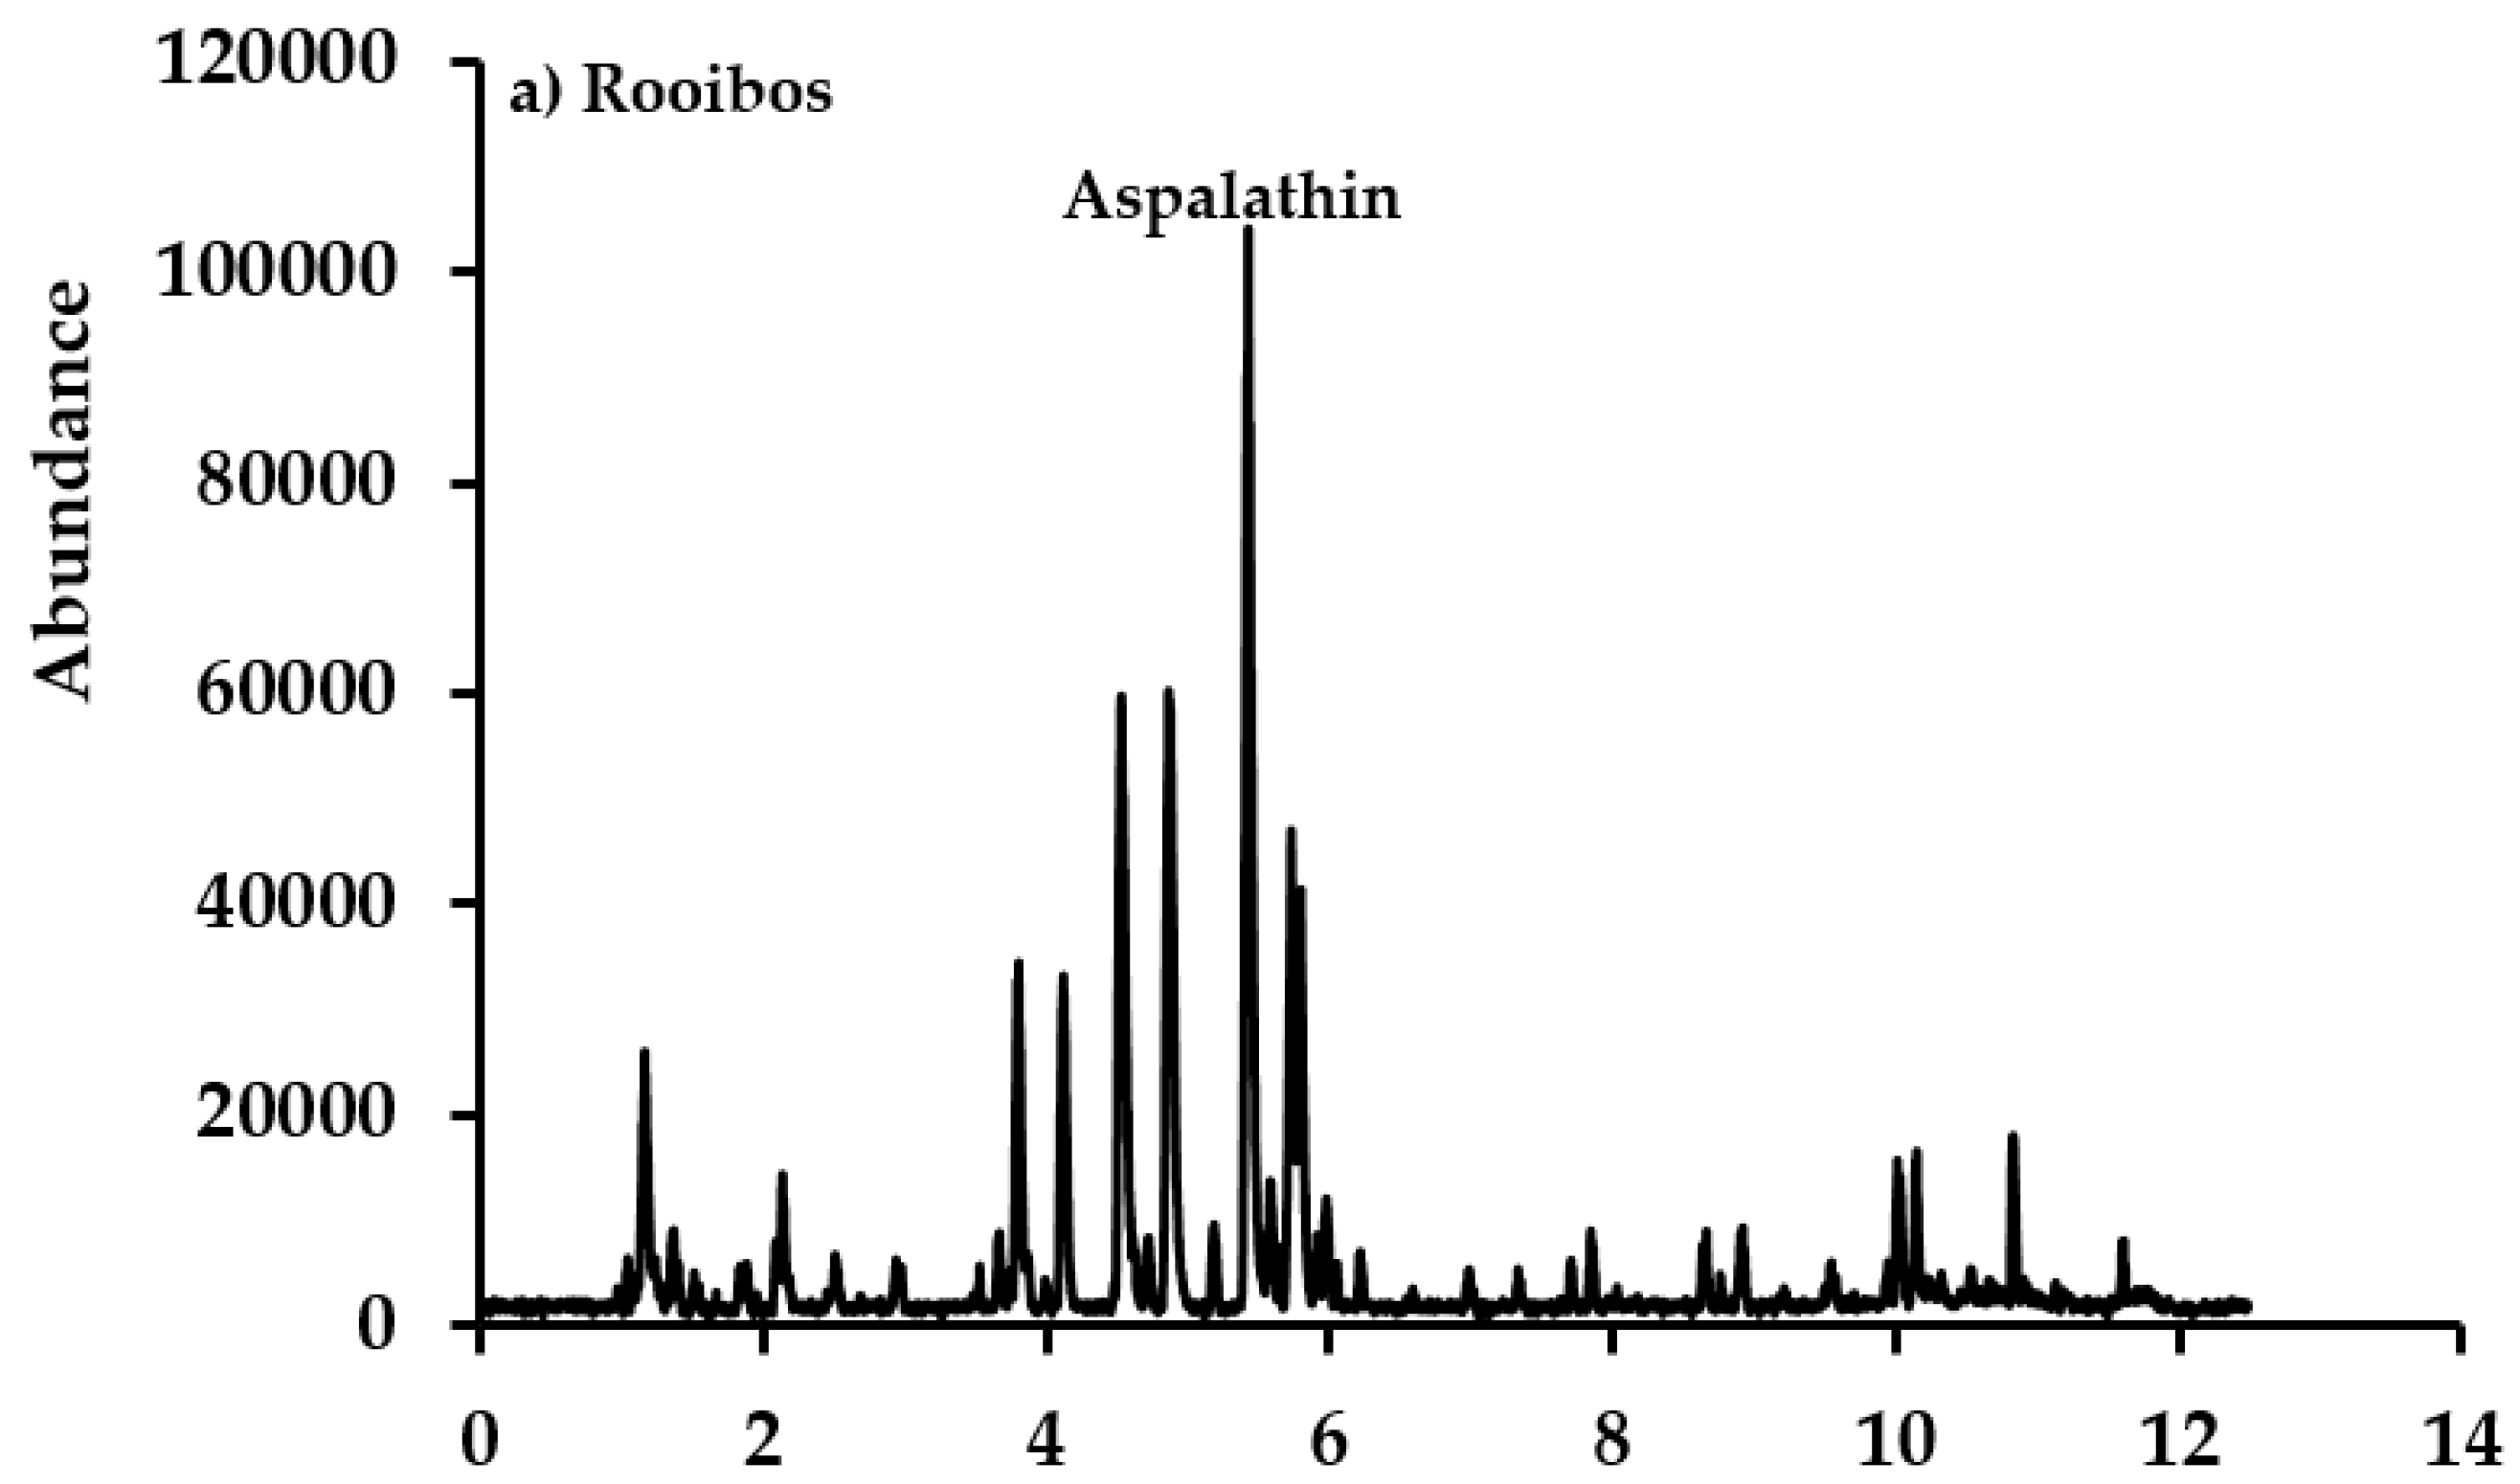
2.3. Ultra-High Performance Liquid Chromatography Mass Spectrometry (UHPLC-MS) Analysis

All solvents and chemicals were of HPLC grade (Merck Ltd., Darmstadt, Germany). Aqueous tea infusions were prepared for all samples; 50 mL of hot distilled water was poured on 2.5 g of raw material, sonicated for 10 min and steeped for 30 min. The extracts were cooled to room temperature, filtered and stored at −20 °C until analysis. For UHPLC-MS analyses, aliquots of the raw material infusions were thawed at room temperature and filtered through 0.22 μm syringe filters. All samples were analyzed within 24 h of sample preparation. UHPLC-MS analyses were performed on a Waters Acquity Ultra Performance Liquid Chromatographic system with a photodiode array (PDA) detector (Waters, Milford, MA, USA). Ultra-high performance liquid chromatography mass spectrometry (UHPLC) separation was achieved on an Acquity UHPLC BEH C18 column (150 mm × 2.1 mm inner diameter, 1.7 μm particle size, Waters) maintained at 40 °C. The chromatographic software MassLynx® (Version 4.1, Waters, Milford, MA, USA) was used for data acquisition and processing. The mobile phase consisted of 0.1% formic acid in water (solvent A) and acetonitrile (solvent B). N2 was used as the desolvation gas. The flow rate was 0.3 mL/min and gradient elution was as follows: 90% A: 10% B to 75% A: 25% B in 8 min, changed to 50% A:50% B in 2 min, maintained for 0.5 min and back to initial ratio in 0.2 min. The injection volume was 2.0 μL. The mass spectrometer was operated in a positive ion electrospray (ES) mode. The desolvation temperature was set to 450 °C at a flow rate of 600 L/h and the source temperature was 100 °C. The capillary and cone voltages were set to 3500 and 50 V, respectively. Data were collected between 100 and 1200 m/z (charge-to-mass-ratio).

3. Results and Discussion

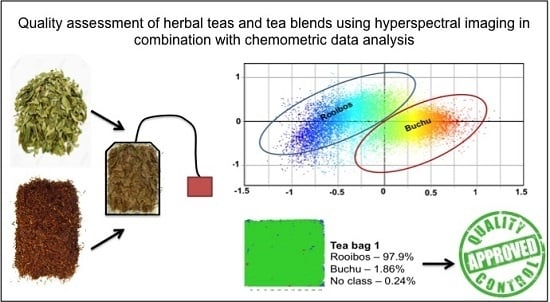
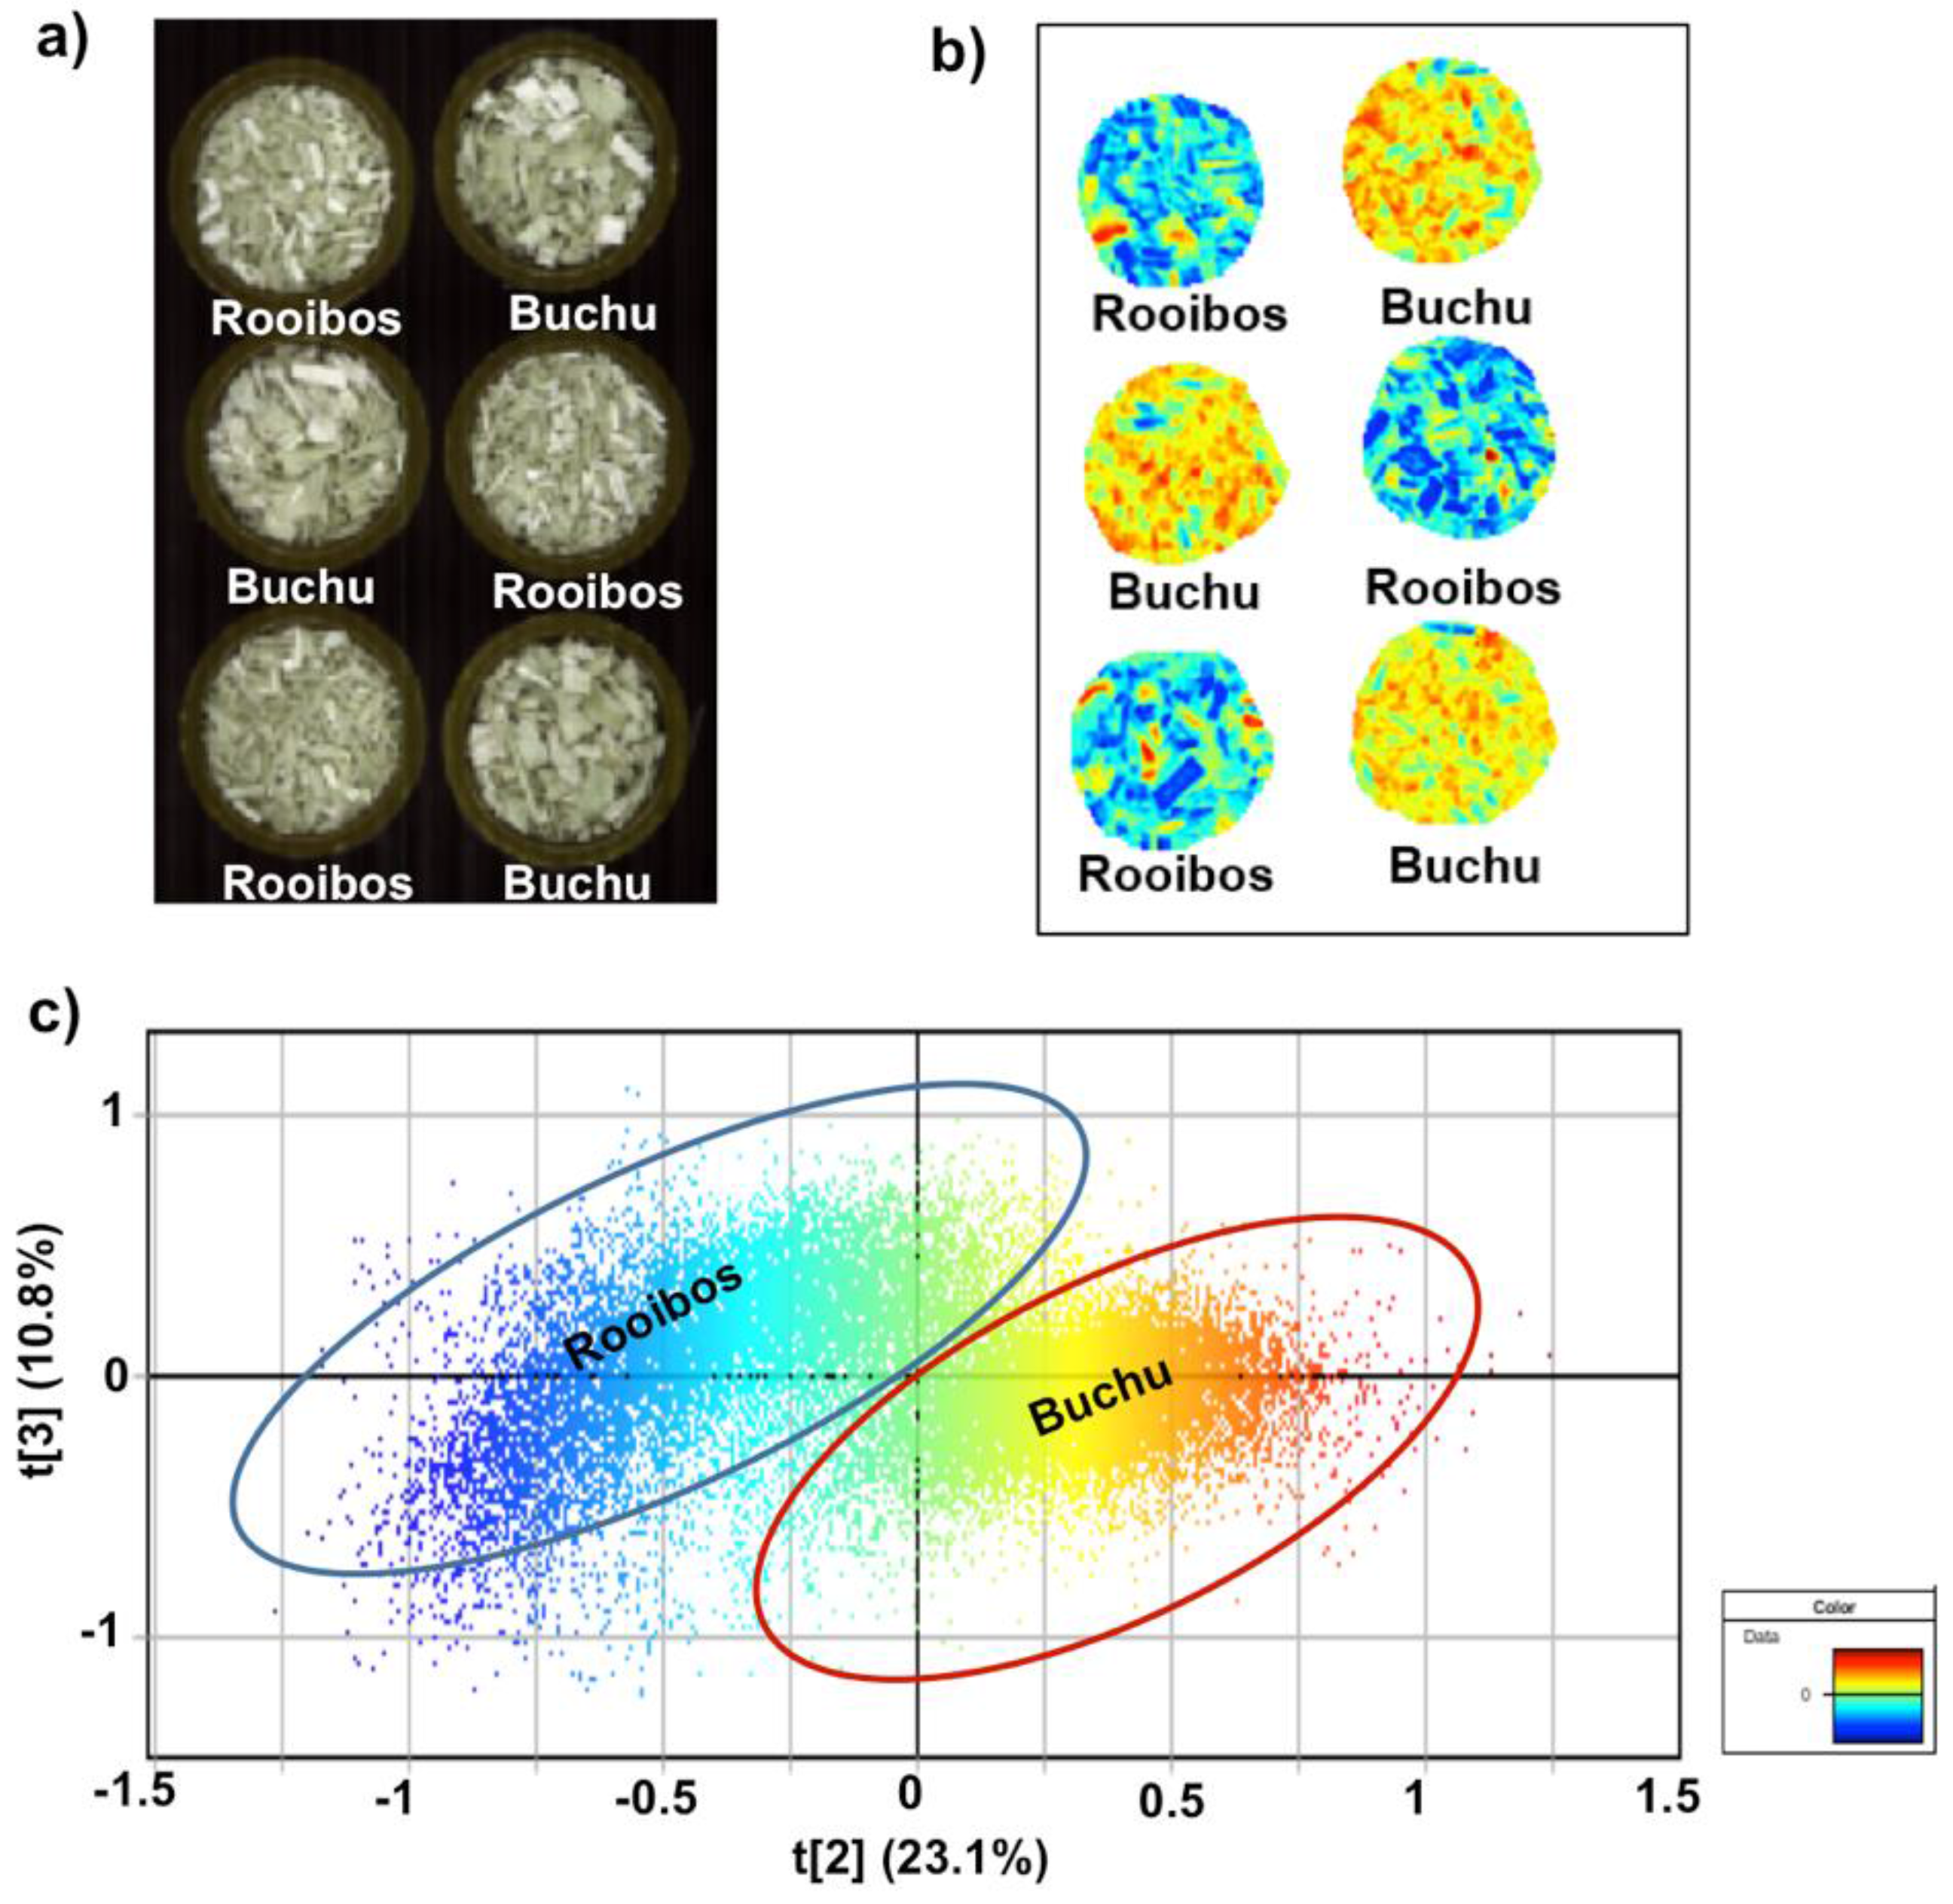
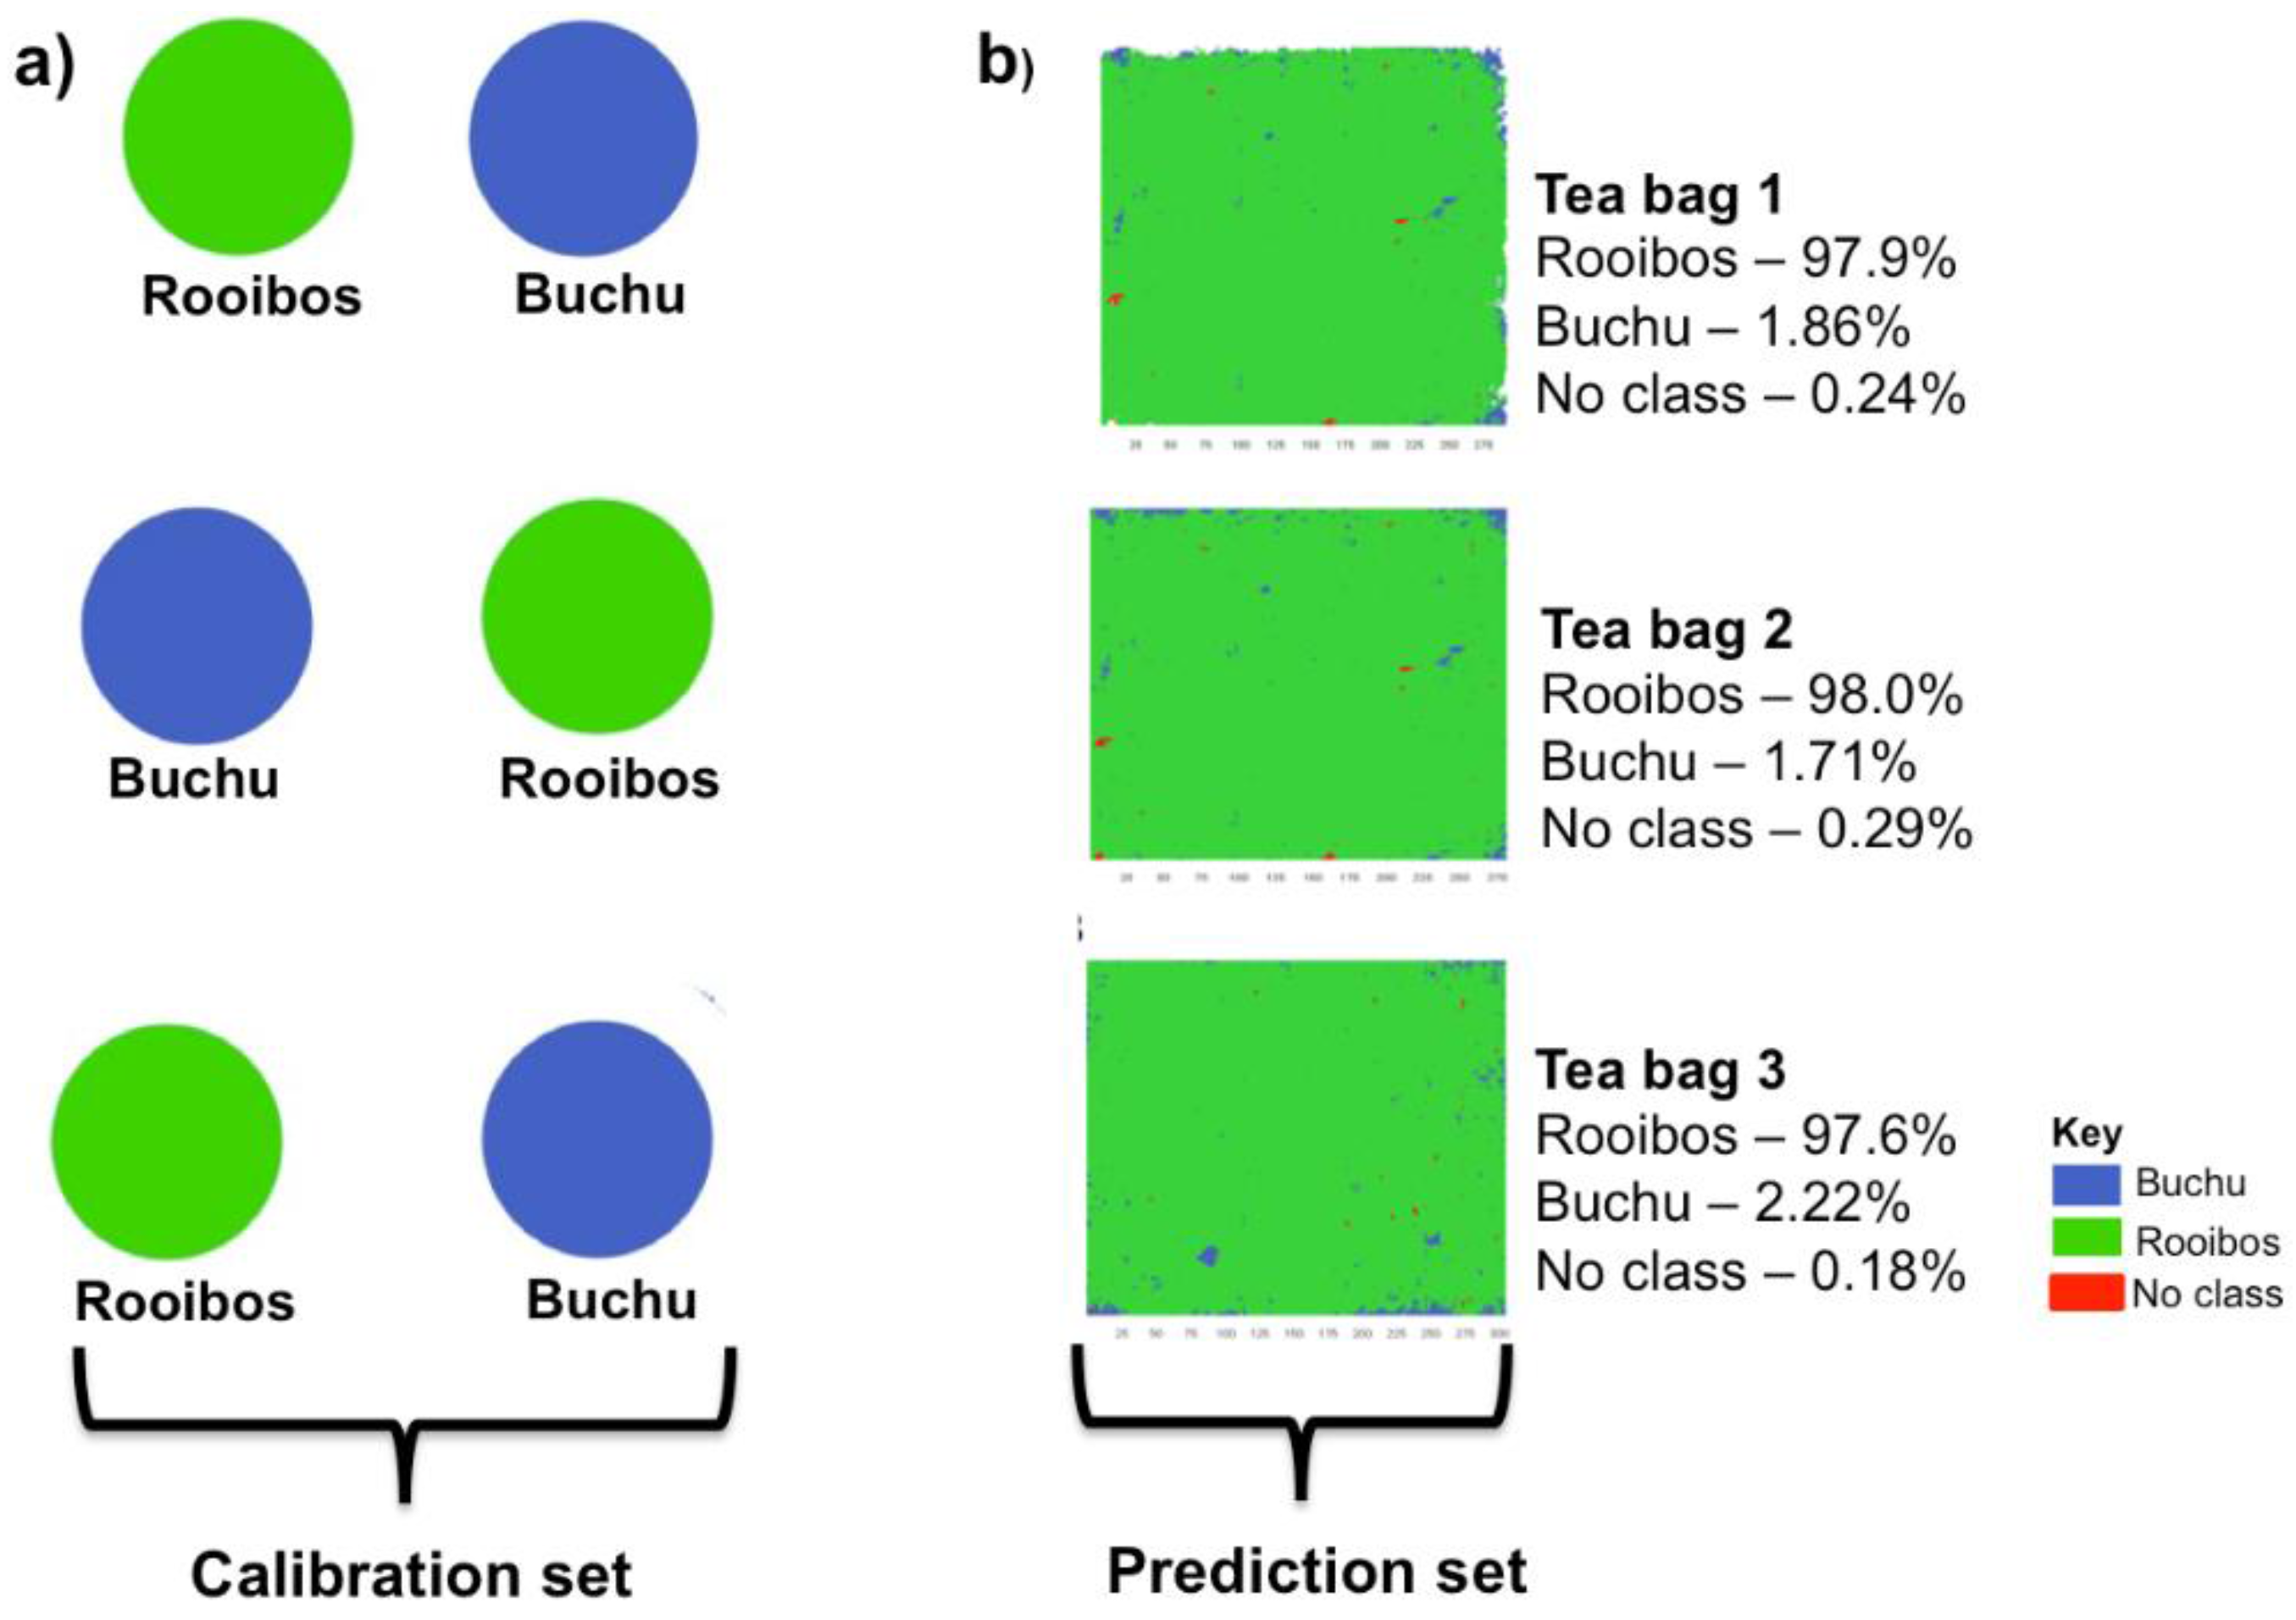
3.1. Rooibos and Buchu Blend

Figure 1a shows the hyperspectral RGB (red, green, blue) image of the two raw materials (rooibos and buchu) before multivariate image analysis. Visual inspection of the image does not show chemical differences between the two teas, hence the need to apply multivariate analysis tools to reveal the chemical information. Principal component analysis of the image was performed and the results obtained are displayed in the score image (Figure 1b) and the scatter plot (Figure 1c) constructed after image cleaning, mean centering and SNV correction of the data. The cumulative chemical variation modelled (R2Xcum) using three principal components (PCs) was 79.6% (R2Xcum = 0.796). The three principal components (PCs) were investigated to determine the direction in which maximum chemical variation between the two teas was most prominent. According to the three score images (t1, t2 and t3), principal component 2 (PC2) demonstrated the most variation which could be attributed to separation of the two species as demonstrated in Figure 1b. The score image of t2 showed clear chemical differences between rooibos and buchu raw materials as demonstrated by the different color score values. The buchu image showed higher score values (orange-red), while a yellow-blue color (lower score value) was observed for rooibos, confirming clear chemical differences between the two teas. In the score plot of the second and third component, it was possible to visualize two clear clusters representing buchu and rooibos raw materials along PC2 (Figure 1c). The variation modelled along principal component 2 (PC2) was 23.1% which explained the chemical variation between the two clusters while the 10.8% chemical variation observed along principal component 3 (PC3) might account for compositional differences within each tea/species. Due to the interactive nature of the score image and scatter plot, it was possible to color the pixels according to the score values as in the score image, enabling clear distinction of the buchu (PC2+) and rooibos (PC2−) clusters. Both Figure 1b,c demonstrate some degree of chemical overlap between the two species as evidenced by pixels of similar score values in both species.
Figure 2a is the PLS-DA Y-image of the raw materials following class assignment. The cumulative variation modelled in the X-matrix using three PLS factors was 76.7% (R2Xcum = 0.767) and 93.2% (R2Ycum = 0.932) in the Y-matrix. The cross-validation parameter Q2cum, which describes the predictive ability of the model, was 93.2% (Q2cum = 0.932) for the external dataset. The classification shown in the Y-image was then used to identify and quantify the raw material constituents in the tea bag blends. This was performed by introducing as an external dataset 18 tea bag images (3 bags × 6 images), scanned separately and introduced into the PLS‑DA for prediction. For illustration purposes, the visual prediction results of three tea bags are shown in the figures and the data for the repetitions is presented in Table 1. The prediction results correctly identified rooibos and buchu as the raw material constituents in the tea bag blends according to classification matches between the calibration samples and the prediction set (Figure 2b). Quantitatively, the model predicted rooibos as the main constituent accounting for >97% of the tea bag constituents while buchu accounted for <3% of the total composition in the three tea bags (Figure 2b). The percentage composition results were calculated from pixel abundance ratios obtained in a tabular form using Evince™ (Version 2.5.0, Prediktera AB, Umeå, Sweden). However, by making use of the pixel color coding, it is also visually clear that rooibos constitutes a higher proportion of the tea bag blend compared to buchu. Table 1 illustrates pixel abundance ratios of rooibos and buchu in the tea bag blends for all repetitions. The results compared well to the company formulation (97:3; rooibos:buchu) provided to assess the accuracy of HSI as a quality control method for the blend. The lowest proportion recorded for rooibos in a blend was 94.5% and a highest was 98.5%. For buchu, a lowest proportion value of 1.47% and highest value of 4.98% was recorded. The results demonstrate the accuracy of HSI with minimal deviation from the production ratios.
The UHPLC-MS method was used to qualitatively validate the results obtained using HSI by confirming the presence of the raw material marker molecules in the tea bag blends. The chromatographic profiles of rooibos, buchu and the tea bag blend and the results are presented in Figure 3. The marker compound for rooibos, aspalathin, was used to confirm that the raw material was rooibos (Figure 3a) and also to confirm the presence of rooibos in the tea bag blend (Figure 3c). Both rooibos raw material and the corresponding tea blend analyzed in the positive ion mode demonstrated similar chromatographic profiles, showing the presence of aspalathin at a retention time (Rt) of 5.43 min, as the major compound. A similar approach was used to confirm the identity of buchu raw material and the presence of buchu in the tea bag blend. Rutin (Rt = 5.56 min) and hesperidin (Rt = 7.99 min) which are marker molecules in buchu, were identified in the raw material (Figure 3b) and in the corresponding tea bag blend (Figure 3c). The results demonstrate that both HSI and UHPLC-MS were able to confirm the presence of the raw material constituents in tea bag blends.

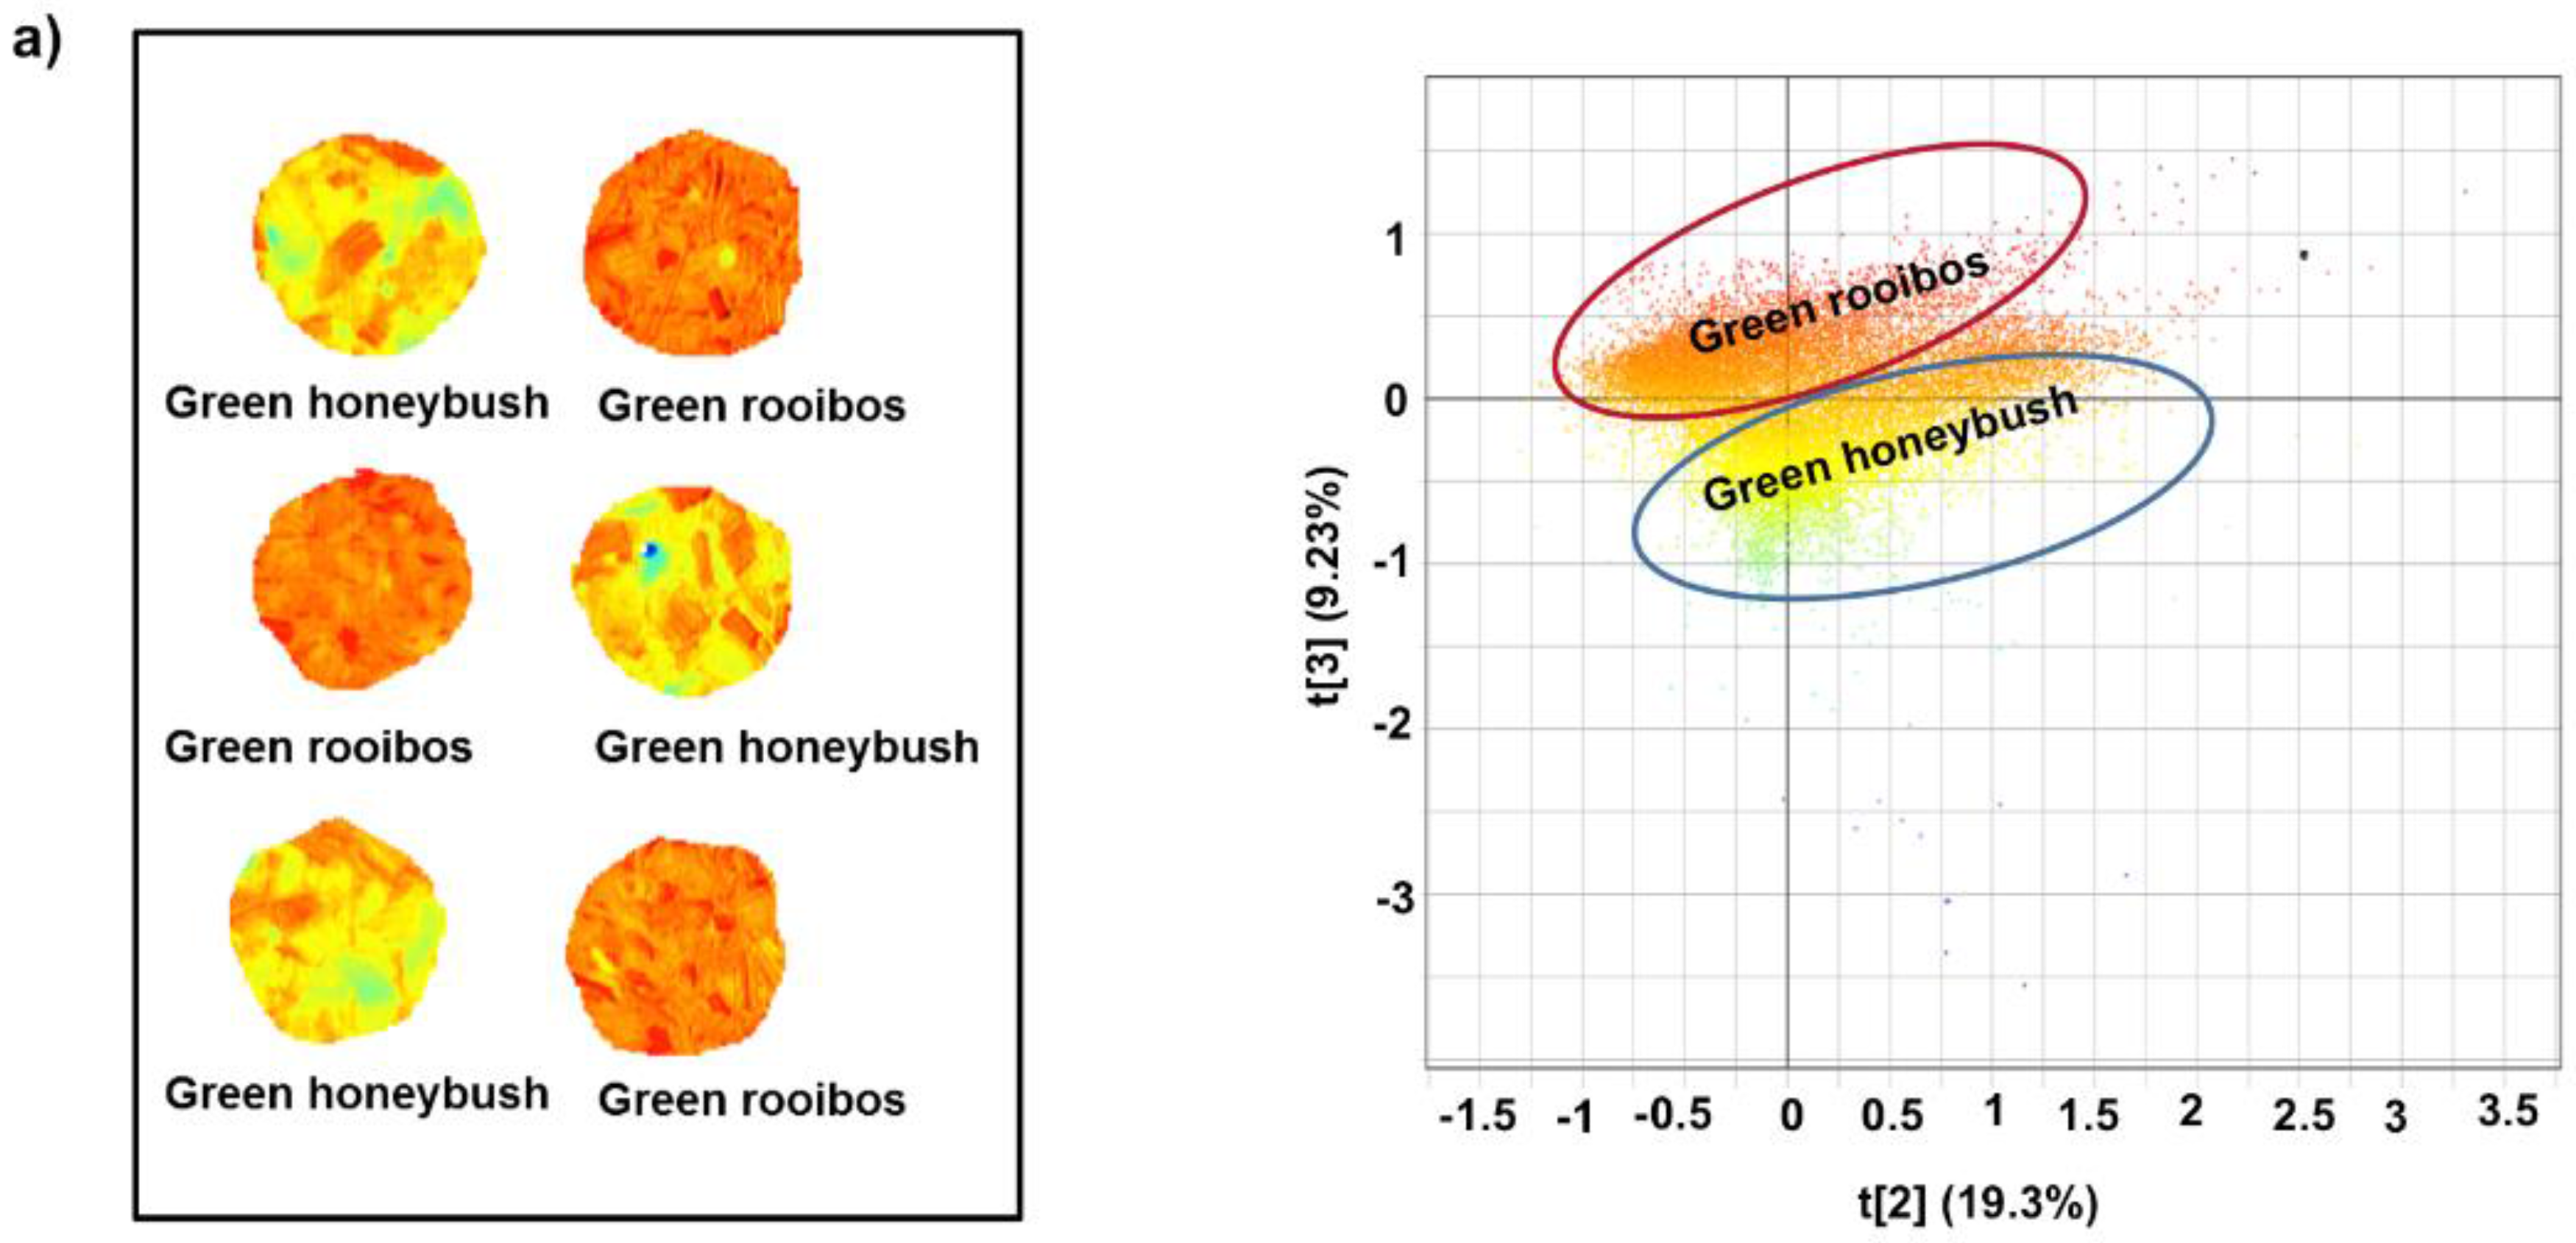
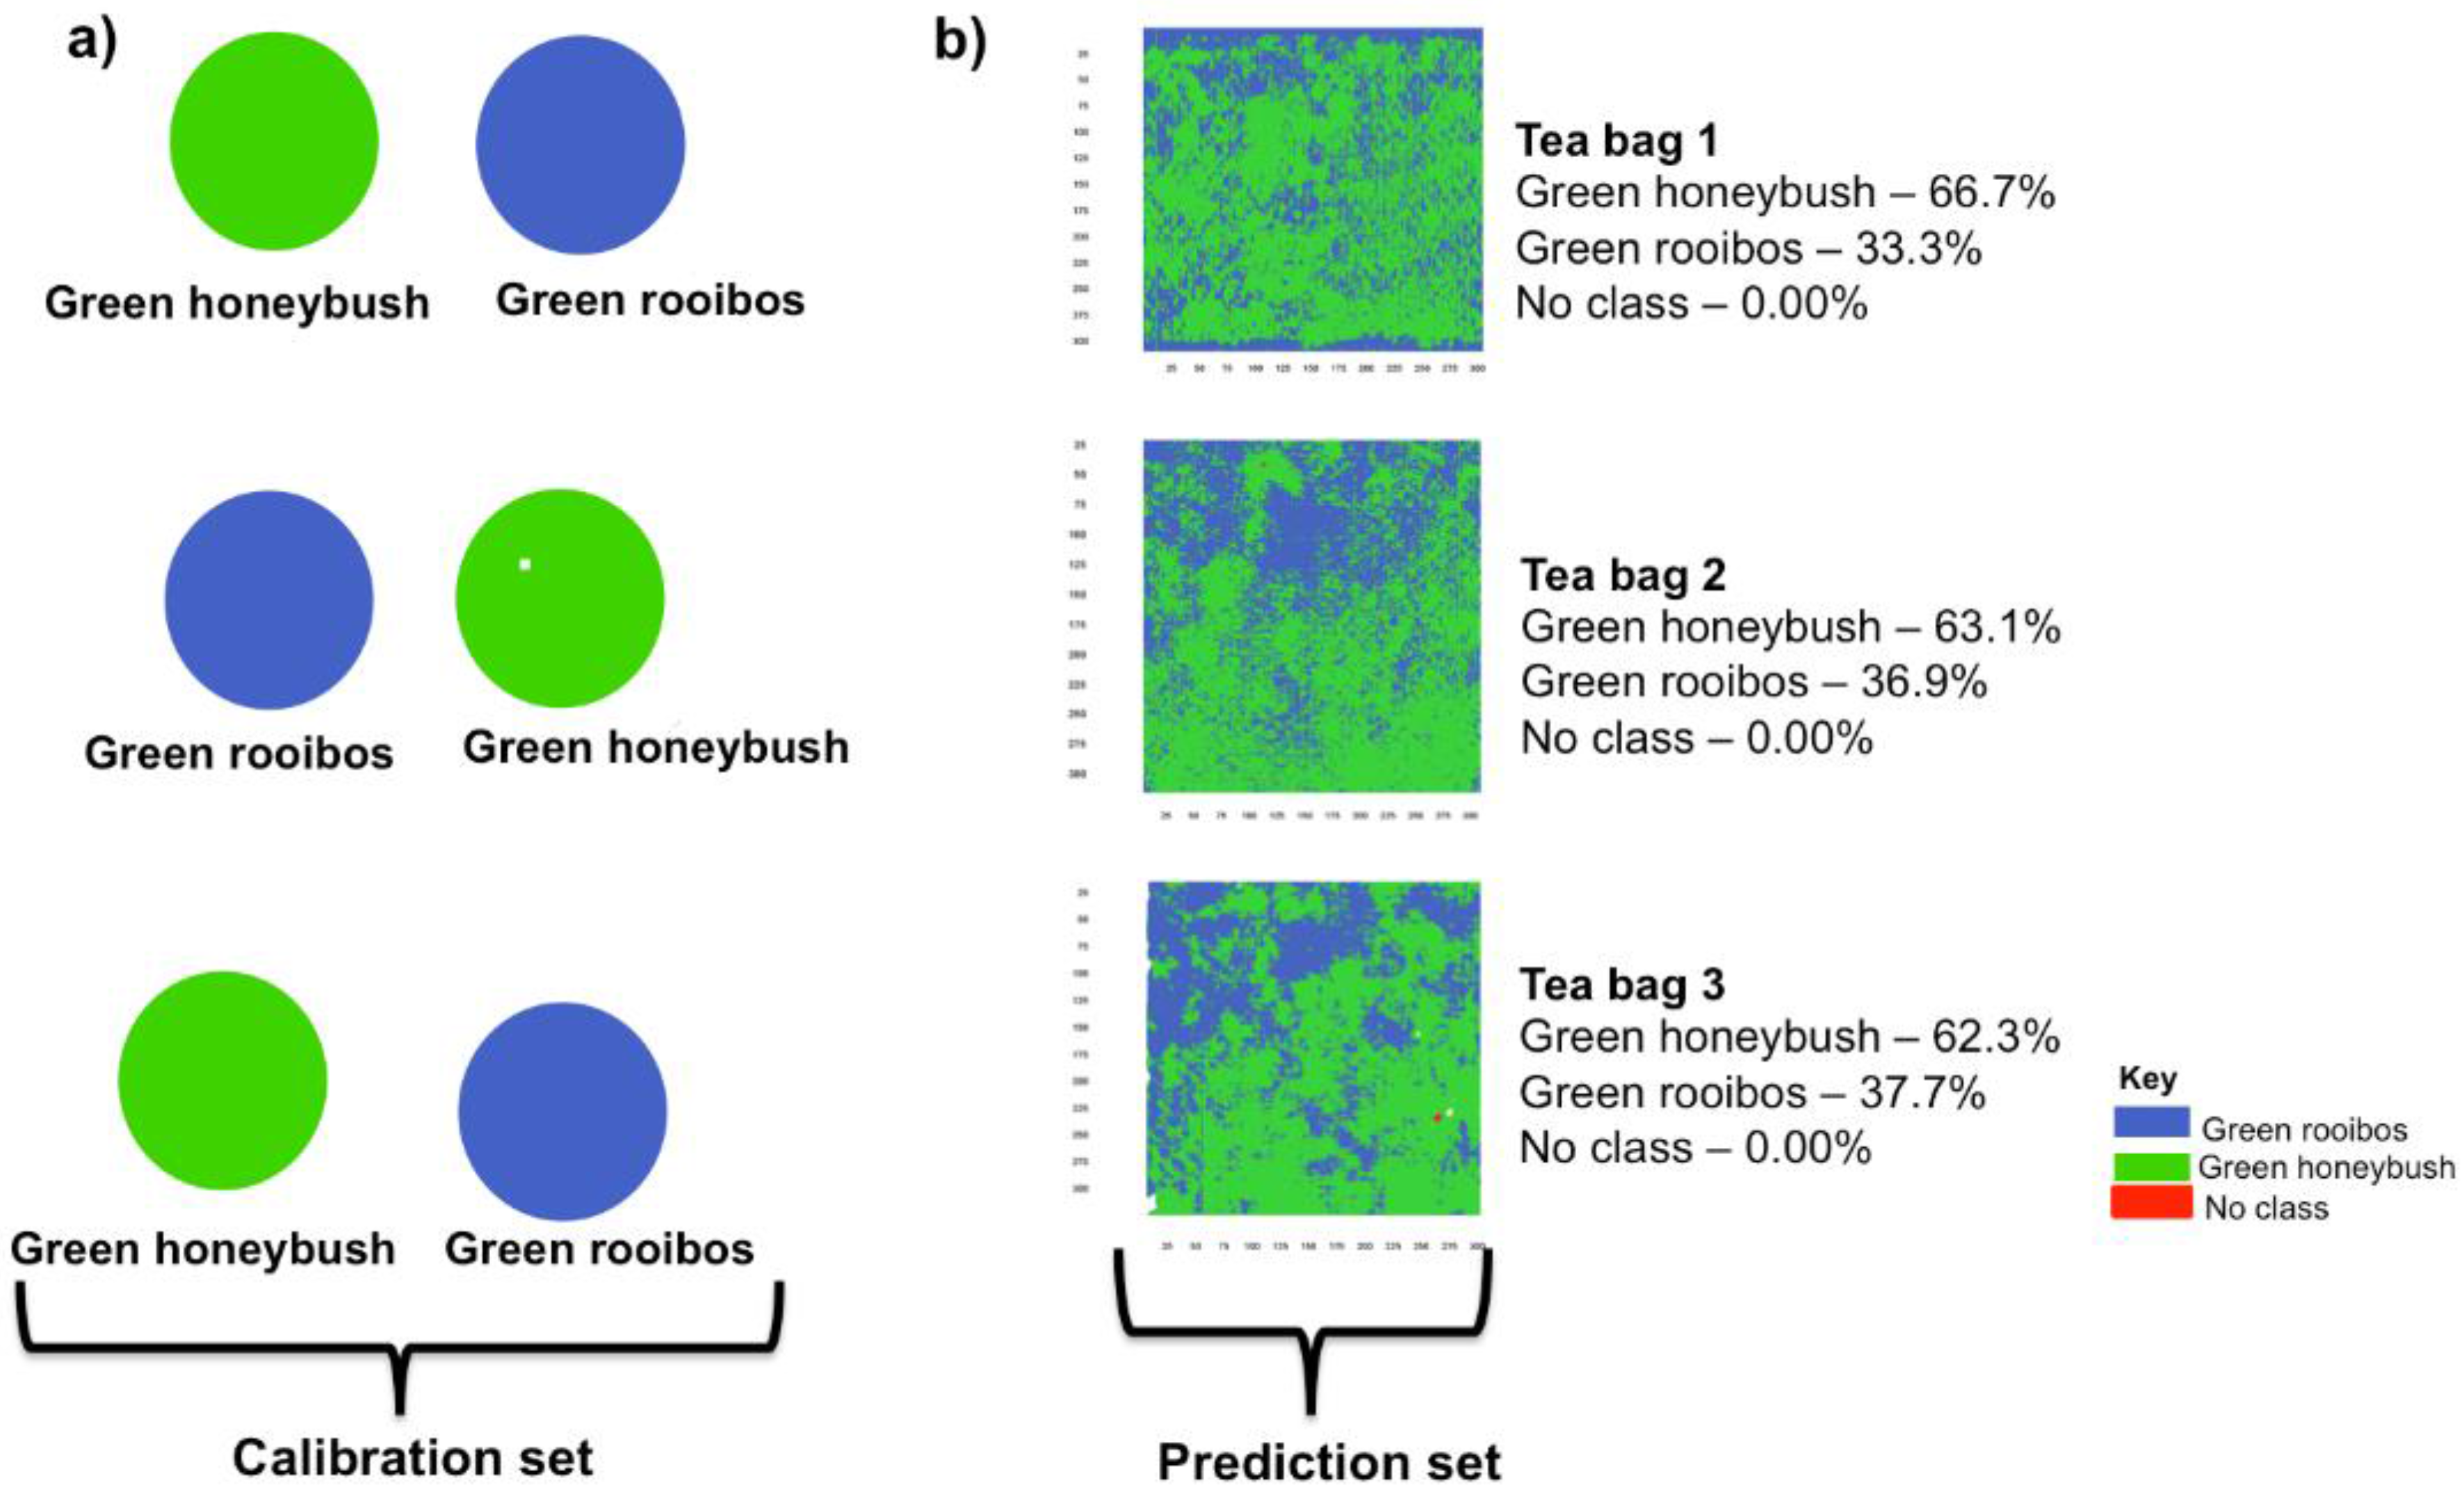
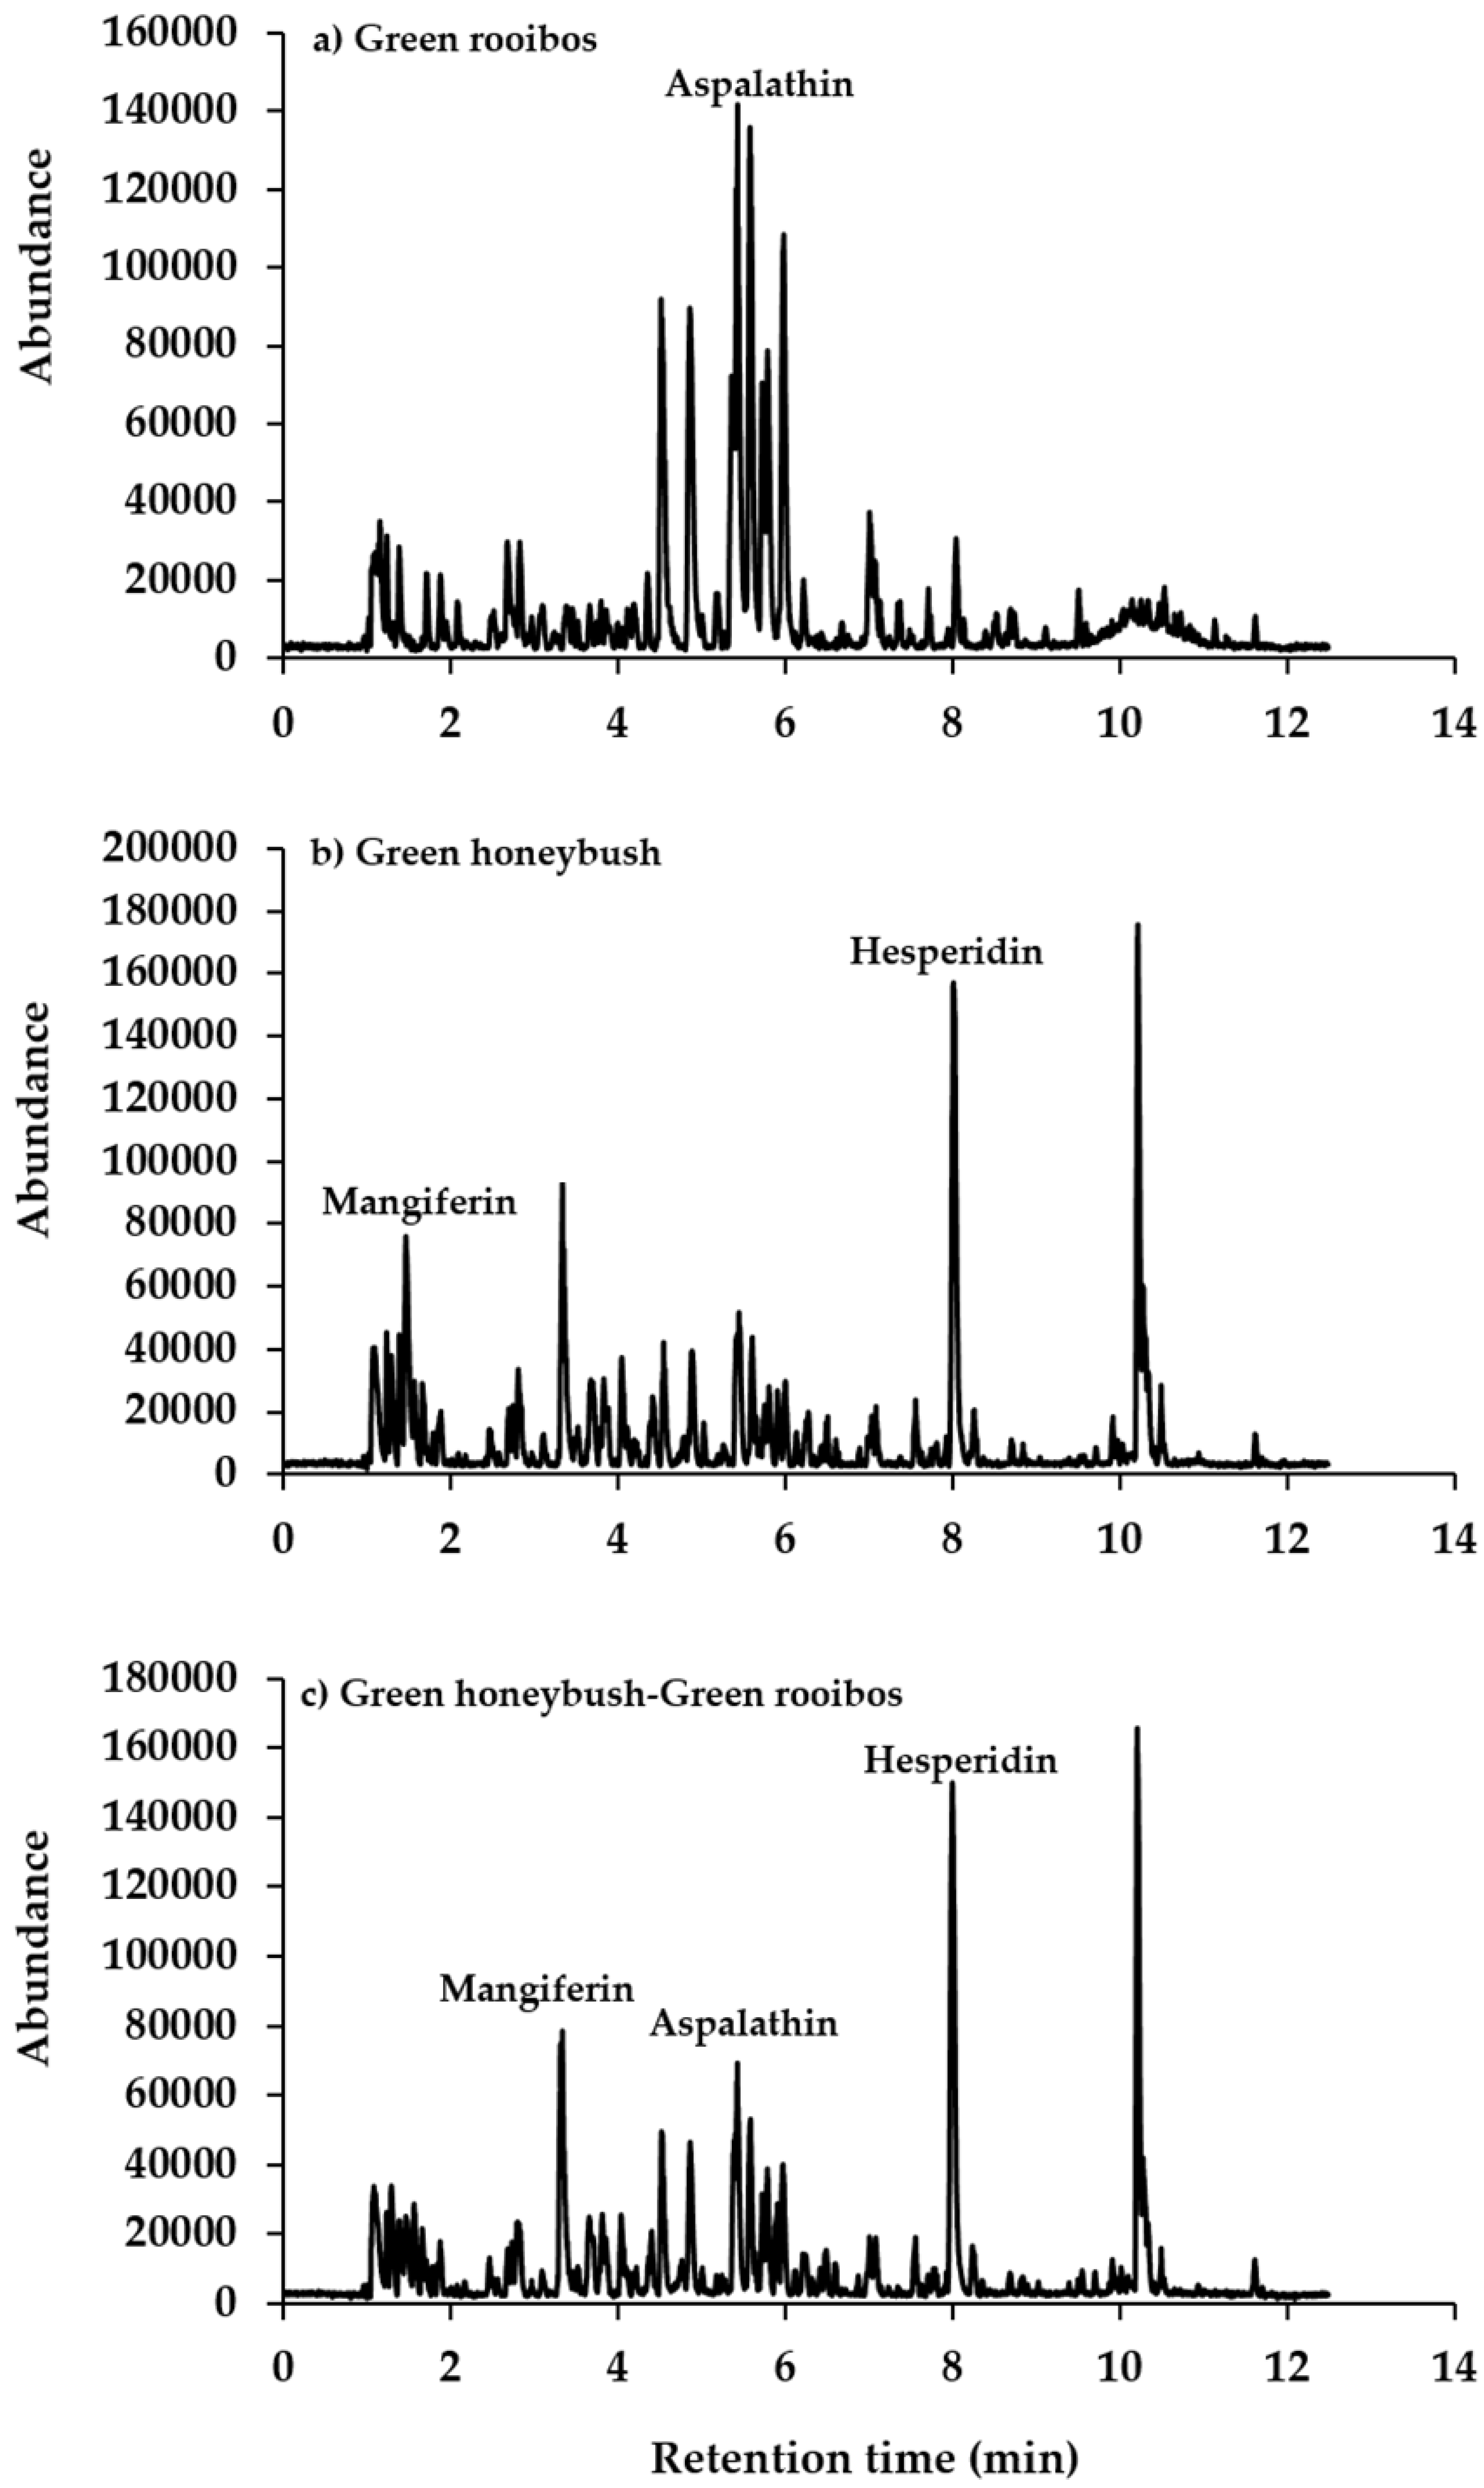
3.2. Green Rooibos and Green Honeybush Blend

The green rooibos and green honeybush blend is prepared in a 65:35 proportion to improve the taste and medicinal properties of the tea (green honeybush:green rooibos). Image analysis of the raw materials using principal component analysis (PCA) revealed clear chemical differences between the raw materials as demonstrated in the score image plot (Figure 4a) of the third principal component (PC). The direction of maximum variance that showed separation of the two species was along principal component 3 (PC3) while principal component 1 (PC1) and principal component 2 (PC2) did not clearly differentiate the species. In the score image, green honeybush was presented with a yellow-red color, while green rooibos showed an intense orange-red color (Figure 4a). The high score values for both species demonstrates greater chemical similarity between the two teas. The scatter plot clearly demonstrates that only 9.23% chemical variation is observed between green honeybush and green rooibos (t3 = 9.23%) (Figure 4b). The pixel clusters separated along t3 are based on color gradients, however a high degree of overlap is also observed, which could be due to chemical similarities between the teas such as the presence of chlorophyll [29] in the two raw materials. Altogether, the cumulative variation modelled using three principal components PCs was 79.0% (R2Xcum = 0.790).
Following the successful distinction between green rooibos and green honeybush raw materials using principal component analysis (PCA), a partial least squares discriminant analysis (PLS-DA) model was developed to predict the identity of raw material constituents in the tea bag blends. The cumulative variation modelled using three partial least squares (PLS) factors in the X-matrix was 92.1% (R2Xcum = 0.921) and the predictive ability of the model was 92.7% (Q2Ycum = 0.927) by cross-validation using a random method of exclusion. Figure 5a is a PLS Y-image comprising of calibration samples where each tea/species was assigned a different color. Eighteen tea bag images (3 tea bags × 6 images) were then introduced into the partial least squares discriminant analysis (PLS-DA) model as an external dataset. The tea bag constituents were predicted based on data from the calibration set and quantification was performed based on pixel abundance. Figure 5b is the prediction image of three tea bag blends where the tea bag constituents were qualitatively and quantitatively predicted using the developed partial least squares discriminant analysis (PLS‑DA) model. Qualitatively, the predictions show that all three tea bags contained green honeybush and green rooibos only (Figure 5b). Quantitative predictions showed that the two raw materials are present in proportions within range of the company formulation (65:35; green honeybush:green rooibos); tea bag 1 (66.7%:33.3%), tea bag 2 (63.1%:36.9%) and tea bag 3 (62.3%:37.7%). All the regions within the analyzed tea bags could be correlated to the calibration data, therefore unclassified regions were not observed. Results for all 18 images show that the lowest proportion observed was 53.60%:45.20% and the highest proportion was 94.10%:5.89% (Table 1). This may be due to the following: HSI captures spatial distribution of up to 2 mm in depth and so inadequate mixing would be captured. For this reason, bags were shaken and turned as randomly, one species might end up on the surface. Secondly, pixel overlap, which demonstrates some chemical similarities, were noted. This overlap could result in misallocation of pixel information where closely related species are concerned.
To confirm the presence of green honeybush and green rooibos in the tea bag blend using UHPLC-MS, chromatographic profiles of the raw materials and the tea bag were determined and compared using the same method. Figure 6a is the chromatogram of green rooibos where the marker compound aspalathin with a retention time (Rt) of 5.43 min was identified in the positive ion mode. The green honeybush chromatogram also displayed the marker compounds mangiferin (Rt = 3.34 min) and hesperidin (Rt = 8.02), in the positive ion mode (Figure 6b). The presence of both raw materials in the tea bag blend was confirmed by the occurrence of all three marker compounds aspalathin (Rt = 5.43 min), mangiferin (Rt = 3.34 min) and hesperidin (Rt = 8.02 min) in the chromatographic profile of the tea bag blend (Figure 6c). When comparing the three chromatograms, it is clear that the tea bag blend is similar to green honeybush, which may be due to the occurrence of this species/tea in higher proportions (65%) compared to green rooibos (35%). The UHPLC-MS results support the HSI findings showing the presence of both species.

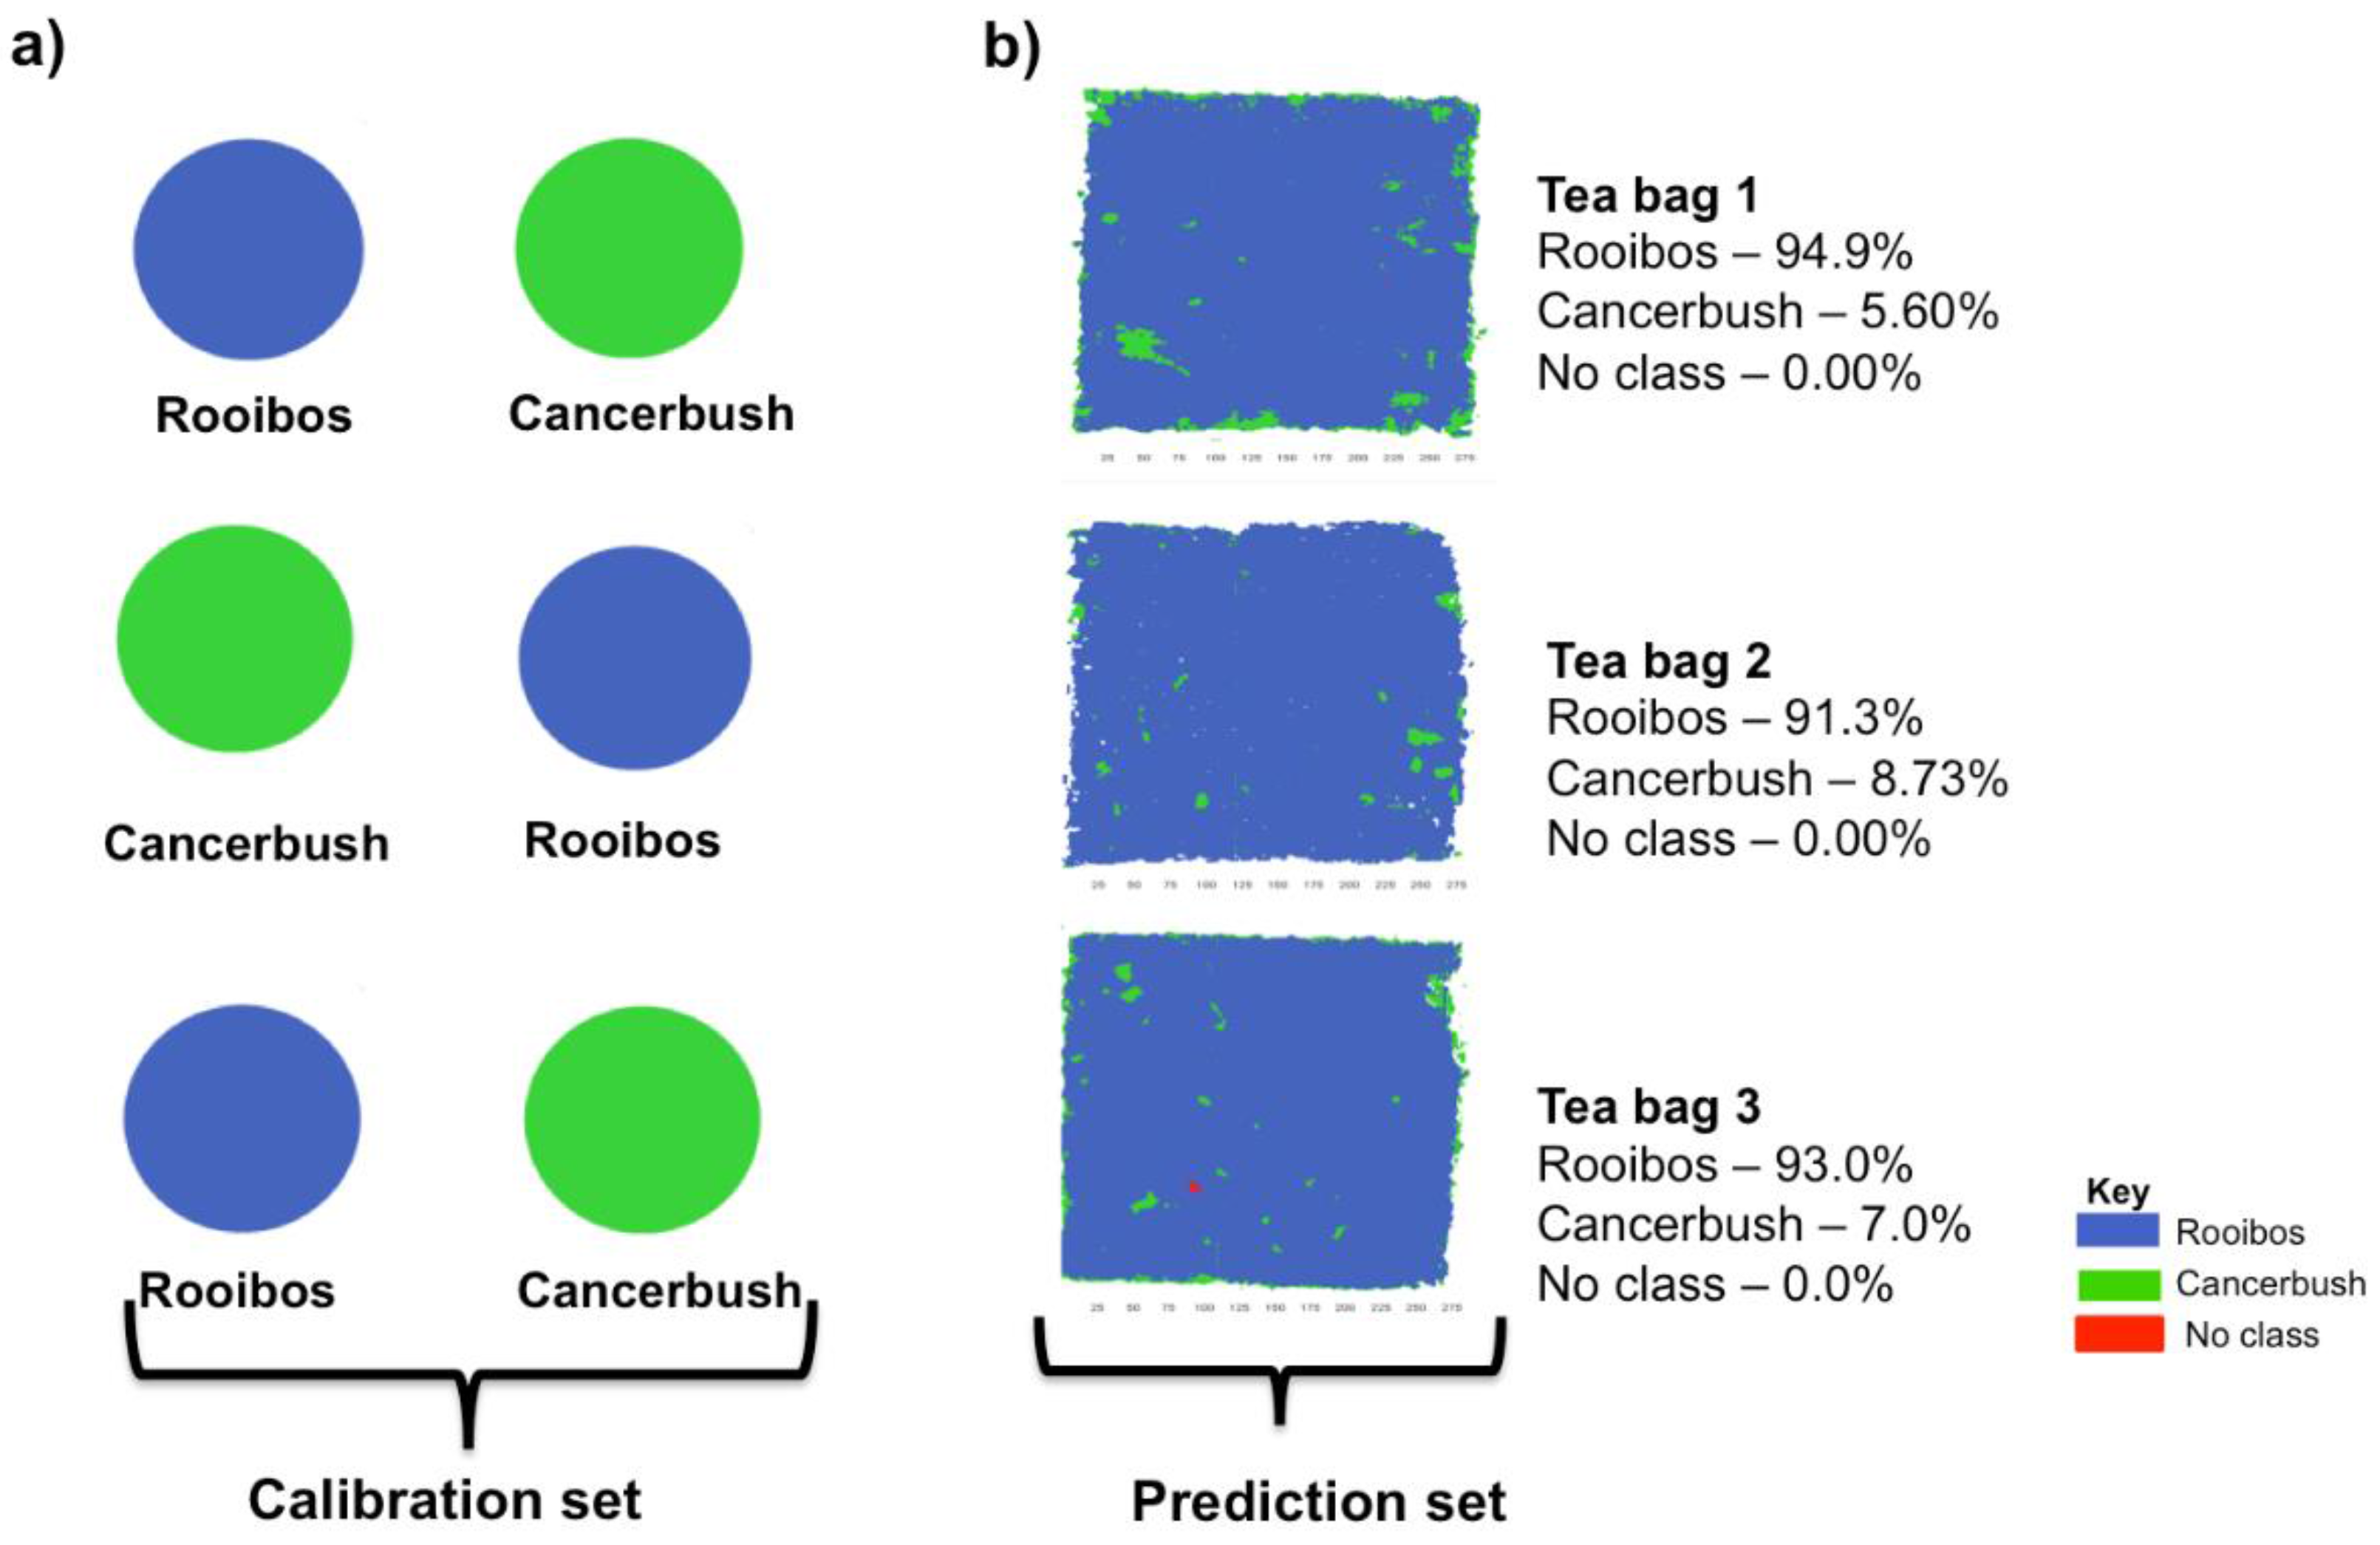
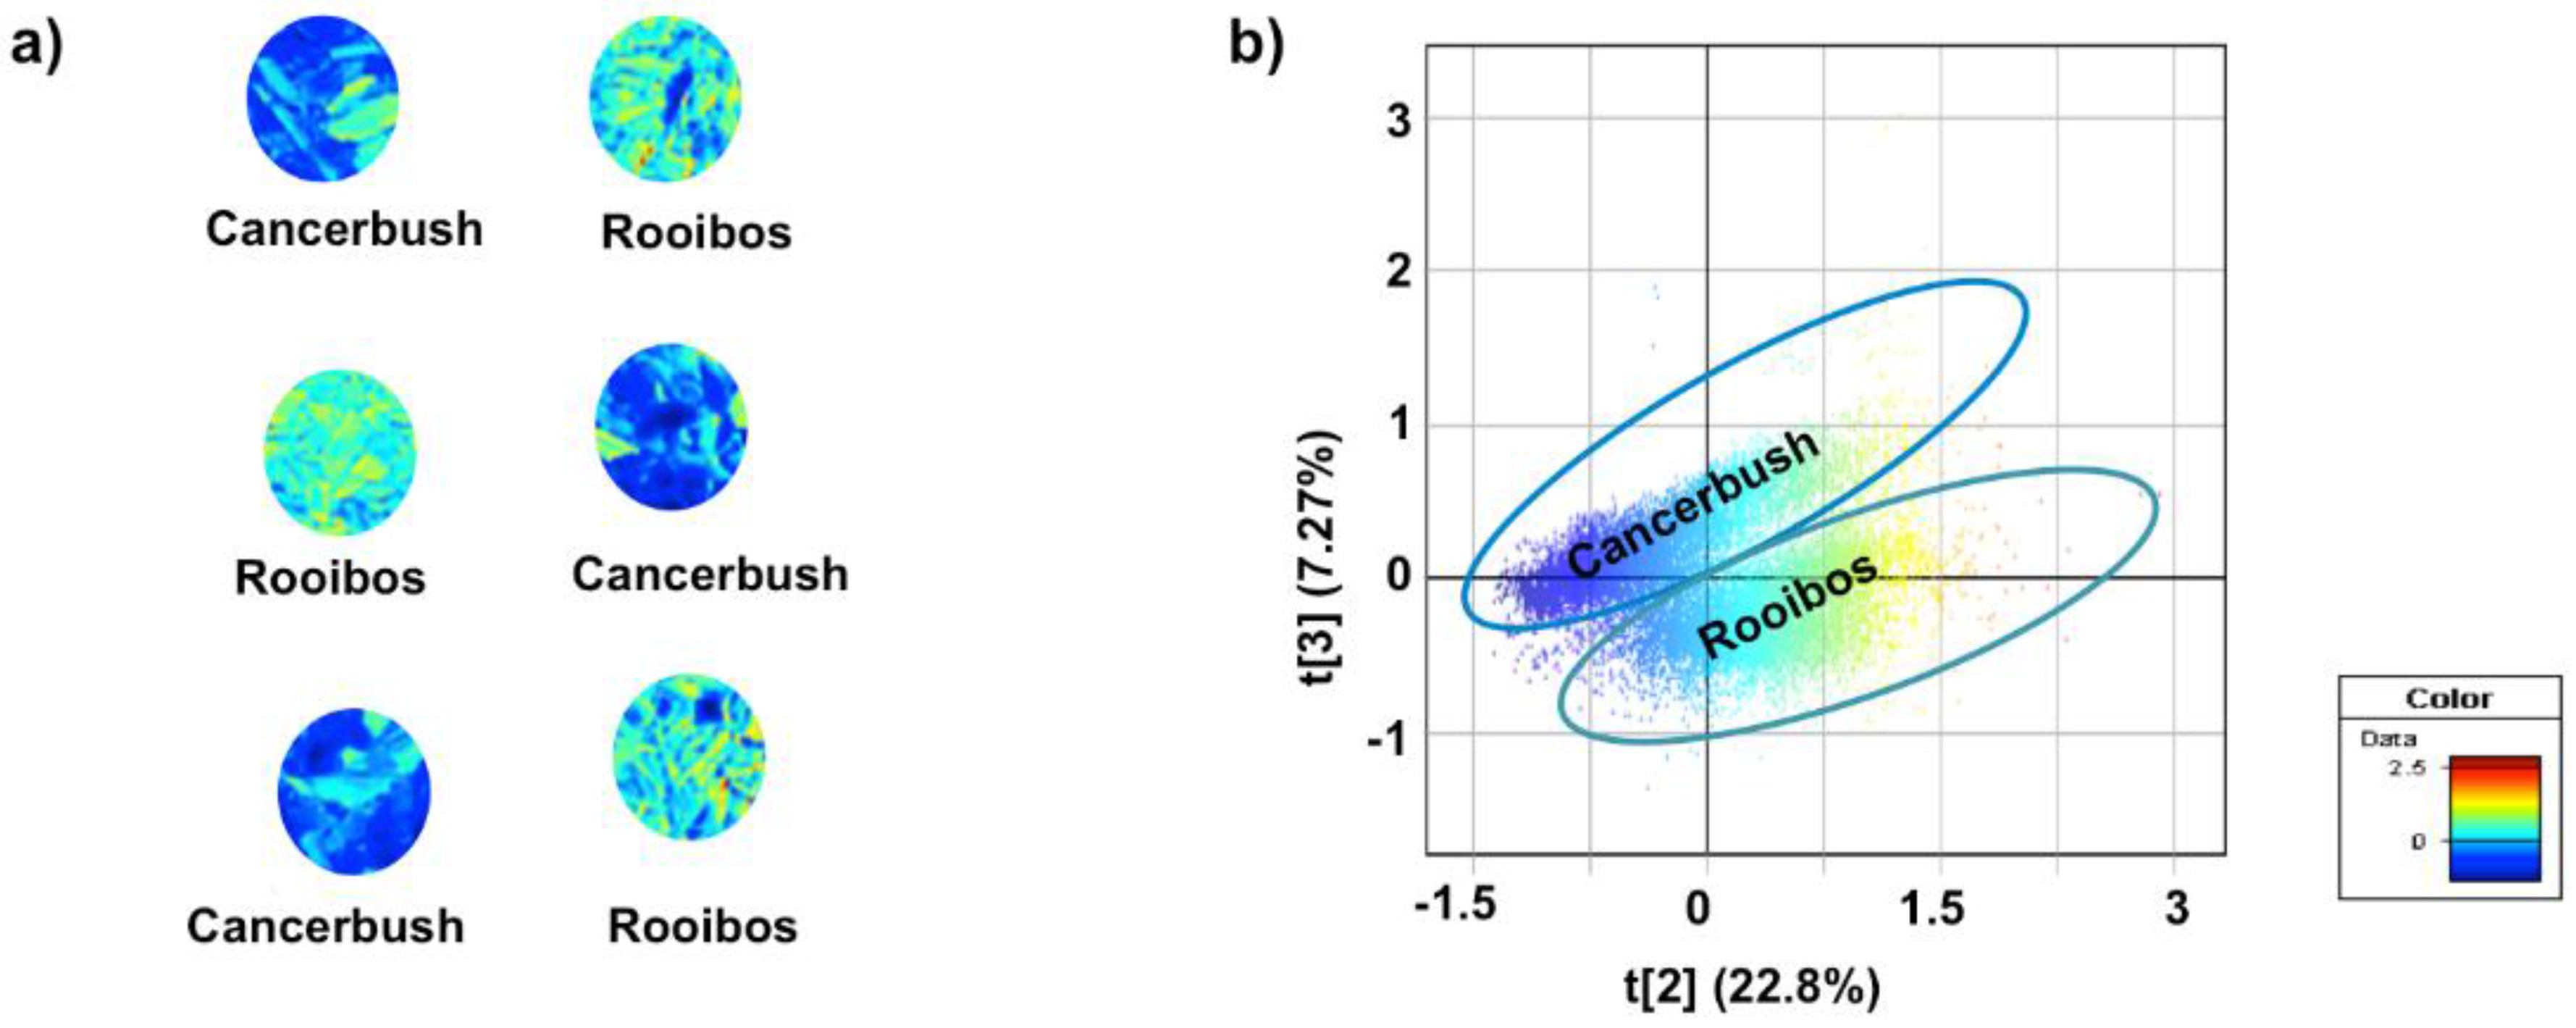
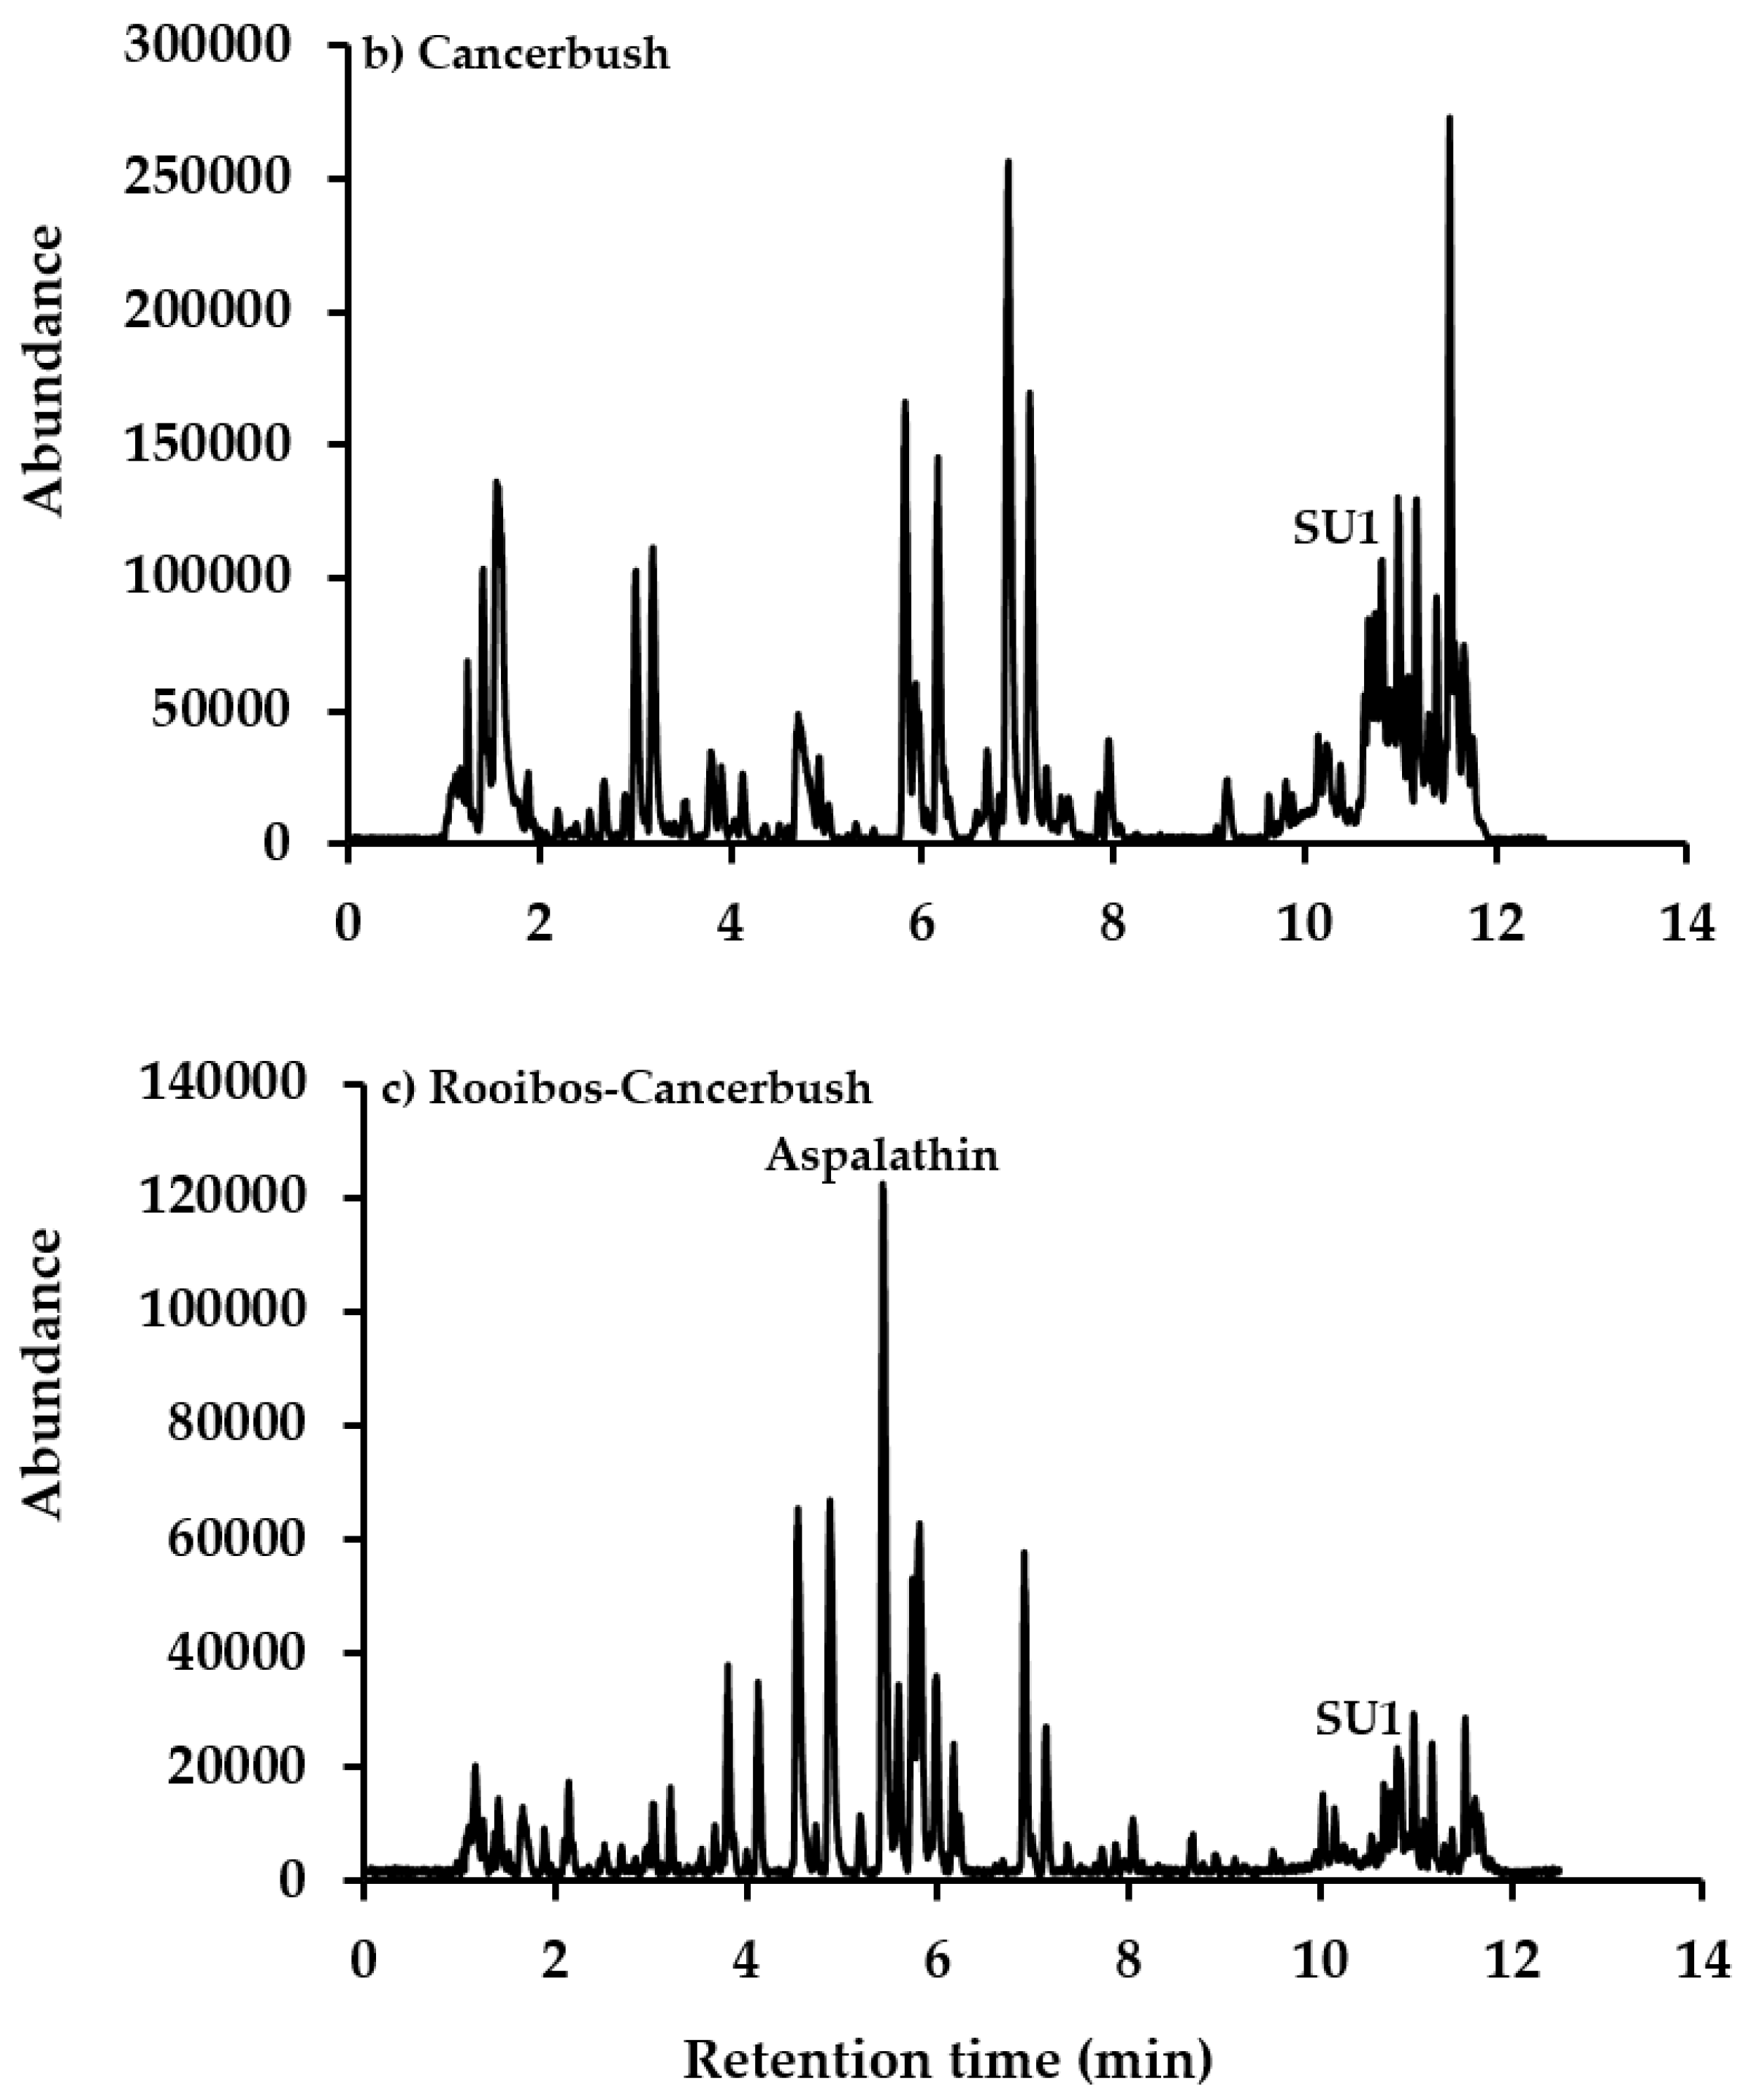
3.3. Rooibos and Cancer Bush Blend

Principal component analysis of the image constituting cancer bush and rooibos raw materials was performed. The results demonstrated chemical differences between the two teas most observable along principal component 3 (PC3). The score image shows different color intensities for the two species where cancer bush had lower score values, with a dark blue color and rooibos showed slightly higher score values represented by a light blue-green color (Figure 7a). These differences were also displayed in the scatter plot where two clear pixel clusters can be observed along principal component 3 (PC3), each representing a different species (Figure 7b). When colored according to the score values, which correspond to the score image, the two clusters could be clearly assigned to cancer bush (PC3+) and rooibos (PC3−) with 7.27% chemical variation. In the principal component 2 (PC2) direction, which explained 22.80% of variation in the data, clear color gradients could be observed in the scatter plot illustrating the occurrence of various chemical compounds within each species (Figure 7b). Cumulatively, 79.5% (R2Xcum = 0.795) chemical variation was modelled using three principal components (PCs).
Using the developed principal component analysis score image, each raw material was assigned to a class and a supervised PLS-DA model was constructed. A three component PLS-DA model describing 79.3% (R2Xcum = 0.793) chemical variation with 91.3% (Q2Ycum = 0.93) predictive ability estimated by cross-validation was obtained. Figure 8 shows the PLS Y-image where the calibration samples are assigned different colors, each representing a particular species. The calibration set was then used to predict raw material constituents in the tea bag blend and according to pixel abundance the proportion of each raw material was determined. Figure 8b shows both qualitative and quantitative predictions of the tea bag constituents. The image clearly displays the presence and spatial distribution of cancer bush and rooibos in all three tea bags (Figure 8b). The prediction results show that tea bag 1 contained 94.9% of rooibos and 5.60% of cancer bush, tea bag 2 had 91.3% of rooibos and 8.73% of cancer bush while tea bag 3 contained 93.0% of rooibos and 7.0% of cancer bush. Table 1, which illustrates the results for all 18 tea bag images, shows that all the predictions were accurate with minimum deviation from the production formulation which is 96:4 (rooibos:cancer bush). The lowest proportions recorded were 89.4%:10.6% and the highest proportion was 98.6%:1.4%.
Ultra-high performance liquid chromatography mass spectroscopy (UHPLC-MS) was used to identify marker molecules of each of the species and to confirm their presence in the tea bag blends. Chromatograms representing the raw materials (rooibos and cancer bush) and the tea blend are illustrated in Figure 9. Aspalathin (Rt = 5.43 min) was identified as the major constituent in the chromatographic profiles of both rooibos (Figure 9a) and the tea bag blend (Figure 9c) when analyzed in the positive ion mode. Chromatographic profiles of cancer bush confirm the presence of SU1, which is the marker compound in cancer bush. Figure 9b shows the presence of SU1 (Rt = 10.80 min) in the raw material and the same compound was also identified in the tea bag blend (Figure 9c). These results confirm that cancer bush was included in the tea bag blend.

4. Conclusions

A holistic quality control approach which is particularly important in the herbal products industry has been previously demonstrated by several researchers. The non-destructive differentiation of raw materials/species to ensure the authenticity of raw material included in herbal products has been investigated [13,22,26]. Quantitatively, although not as accurately as other conventional techniques such as chromatography, adulteration has been successfully detected in commercial products using this technique [30,31]. As far as herbal teas are concerned, the use of HSI in their quality control is fairly new with only a few studies documented. Kelman et al. [23] reported on the successful application of HSI using visible light for the classification of different Chinese teas namely; China black, Lung Ching, Tikuanyin, Yunnan and Jasmine. In another study, different grades of green tea were qualitatively assessed using NIR hyperspectral imaging spectroscopy [32]. It is clear that there is promise in the use of HSI for quality control, mostly due to the rising popularity in herbal tea consumption, existence of various brands of different qualities, varying prices and more recently the introduction of tea blending.
The three examples discussed demonstrated the application of HSI in the differentiation of raw materials and their subsequent identification in tea bag blends. With the aid of powerful chemometric algorithms it was possible to quantitatively determine the proportion of each raw material constituent by simply scanning a tea bag and introducing the image into the PLS-DA calibration model. The robustness of these models was demonstrated by the accuracy of predicting replicates. As HSI does not require sample preparation, all the tea bags were analyzed intact and this did not compromise the prediction results. These results show how spatial information is retained, something not possible with conventional methods of analysis.
Although UHPLC-MS is a popular method for quality control, the need for sample preparation and targeting of marker constituents to ensure the identity of a raw material is expensive, and requires standards and skilled personnel. Method optimization for each tea/species is a complex process which requires time. Using HSI, this was not necessary as all the species could be analyzed using the same instrumental parameters. Quantitative determinations in chromatography are always a drawback as most standards for targeted analysis are not readily available for herbal products. Vibrational spectroscopy has the advantage of not requiring standards to confirm the identity of a particular component since the whole spectral signature is used. The greatest analytical challenge in the quality control of herbal tea bag blends is the complexity. Often several species are combined in the tea bag formulation, which implies that diverse chemistries are superimposed in the consumer product. Due to this complexity, a single UHPLC method may not be sufficient to identify unique biomarkers, implying that one formulation would need to be analyzed on different analytical platforms using different chromatographic parameters. Furthermore, although the identification of biomarkers can confirm the presence of a species, it cannot provide information on the proportion of each species in the blend. All these factors make HSI a favorable tool in quality control systems where short turnaround times are of particular importance, and in the herbal products industry, where standards are not readily available and specifications not clearly documented.

Acknowledgments

The authors would like to thank Colette Cronje from Rooibos Limited (Clanwilliam, South Africa) for providing the raw materials and tea bag blends. The National Research Foundation (South Africa) and Tshwane University of Technology are thanked for their financial support. No funding for covering the costs to publish in an open access journal was received.

Author Contributions

Majolie Djokam performed the experiments, analyzed the data and was the main author of the manuscript. Maxleene Sandasi analyzed the data and contributed to the writing and editing of the manuscript. Weiyang Chen developed the UHPLC-MS method, performed the experiments and analyzed the data. Alvaro Viljoen conceived the concept and Alvaro Viljoen and Ilze Vermaak designed the experiments, analyzed data and contributed to the writing and editing of the manuscript.

Conflicts of Interest

The authors declare no conflict of interest.

References

  1. Keating, B.; Lindstrom, A.; Lynch, M.E.; Blumenthal, M. Sales of Tea & Herbal Tea Increase 5.9% in United States in 2013. HerbalEGram 2014, 11. Available online: http://cms.herbalgram.org/heg/volume11/11November/TeaMarketReport.html?ts=1415729734&signature=a7e7b30e947490d53d11df28f1d4bd61 (accessed on 26 June 2016). [Google Scholar]
  2. Ferdman, R.A. Where the World’s Biggest Tea Drinkers Are. 2014. Available online: http://qz.com/168690/where-the-worlds-biggest-tea-drinkers-are/ (accessed on 27 June 2016).
  3. Xanthopoulou, A.; Ganopoulos, L.; Kalivas, A.; Osathanunkul, M.; Chatzopoulou, P.; Tsaftaris, A.; Madesis, P. Multiplex HRM analysis as a tool for rapid molecular authentication of nine herbal teas. Food Control 2015, 60, 113–116. [Google Scholar] [CrossRef]
  4. Zegarac, J.P.; Samec, D.; Piljac, A. Herbal teas: A focus on antioxidant properties. In Tea in Health and Disease Prevention; Preedy, V.R., Ed.; E-Publishing Inc.: London, UK, 2013; pp. 129–140. [Google Scholar]
  5. Viljoen, A.M.; Vermaak, I. Special Issue—Quality control. S. Afr. J. Bot. 2012, 82, 1–3. [Google Scholar] [CrossRef]
  6. Cano, J.H.; Volpato, V. Herbal mixtures in the traditional medicine of Eastern Cuba. J. Ethnopharmacol. 2004, 90, 293–316. [Google Scholar] [CrossRef] [PubMed]
  7. Joubert, E.; De Beer, D. Rooibos (Aspalathus linearis) beyond the farm gate: From herbal tea to potential phytopharmaceutical. S. Afr. J. Bot. 2011, 77, 869–886. [Google Scholar] [CrossRef]
  8. Van Wyk, B.E.; Van Oudtshoorn, B.; Gericke, N. Medicinal Plants of South Africa, 1st ed.; Briza Publications: Pretoria, South Africa, 1997; p. 290. [Google Scholar]
  9. Watt, J.M.; Breyer-Brandwijk, M.G. The Medicinal and Poisonous Plants of Southern Africa, 1st ed.; E&S Livingstone: Edinburgh, UK, 1932; p. 70. [Google Scholar]
  10. He, X.; Li, J.; Zhao, W.; Liu, R.; Zhang, L.; Kong, X. Chemical fingerprint analysis for quality control and identification of Ziyang green tea by HPLC. Food Chem. 2015, 171, 405–411. [Google Scholar] [CrossRef] [PubMed]
  11. Li, H.; Li, F.; Yang, F.; Fang, Y.; Xin, Z.; Zhao, L.; Hu, Q. Size effect of Se-enriched green tea particles on in vitro antioxidant and antitumor Activities. J. Agric. Food Chem. 2008, 56, 4529–4533. [Google Scholar] [CrossRef] [PubMed]
  12. Newmaster, S.G.; Grguric, M.; Shanmughanandhan, D.; Ramalingam, S.; Ragupathy, S. DNA barcoding detects contamination and substitution in North American herbal products. BMC Med. 2013, 11, 222. [Google Scholar] [CrossRef] [PubMed]
  13. Vermaak, I.; Viljoen, A.; Lindström, S.W. Hyperspectral imaging in the quality control of herbal medicines—The case of neurotoxic Japanese star anise. J. Pharm. Biomed. Anal. 2013, 75, 207–213. [Google Scholar] [CrossRef] [PubMed]
  14. Deng, J.; Yang, Y. Chemical fingerprint analysis for quality assessment and control of Bansha herbal tea using paper spray mass spectrometry. Anal. Chim. Acta 2013, 785, 82–90. [Google Scholar] [CrossRef] [PubMed]
  15. Yang, D.Z.; An, Y.Q.; Jiang, X.L.; Tang, D.Q.; Gao, Y.Y.; Zhao, H.T.; WU, X.W. Development of a novel method combining HPLC fingerprint and multi-ingredients quantitative analysis for quality evaluation of traditional chinese medicine preparation. Talanta 2011, 85, 885. [Google Scholar] [CrossRef] [PubMed]
  16. Tian, R.T.; Xie, P.S.; Liu, H.P. Evaluation of traditional Chinese herbal medicine: Chaihu (Bupleuri Radix) by both high-performance liquid chromatographic and high-performance thin-layer chromatographic fingerprint and chemometric analysis. J. Chromatogr. A 2009, 1216, 2150–2155. [Google Scholar] [CrossRef] [PubMed]
  17. Chen, Q.; Zhao, J.; Chaitep, S.; Guo, Z. Simultaneous analysis of main catechins contents in green tea (Camellia sinensis (L.)) by Fourier transform near infrared reflectance (FT-NIR) spectroscopy. Food Chem. 2009, 113, 1272–1277. [Google Scholar] [CrossRef]
  18. Hall, M.N.; Robertson, A.; Scotter, C.N.G. Near-infrared reflectance prediction of quality, theaflavin content and moisture content of black tea. Food Chem. 1988, 27, 61–75. [Google Scholar] [CrossRef]
  19. Luypaert, J.; Zhang, M.H.; Massart, D.L. Feasibility study for the using near infrared spectroscopy in the qualitative and quantitative of green tea, Camellia sinensis (L.). Anal. Chim. Acta 2003, 487, 303–312. [Google Scholar] [CrossRef]
  20. Zhang, M.H.; Luypaert, J.; Xu, Q.S.; Massart, D.L. Determination of total antioxidant capacity in green tea by NIRS and multivariate calibration. Talanta 2004, 62, 25–35. [Google Scholar] [CrossRef]
  21. Budı́nová, G.; Vláčil, D.; Mestek, O.; Volka, K. Application of infrared spectroscopy to the assessment of authenticity of tea. Talanta 1998, 47, 255–260. [Google Scholar] [CrossRef]
  22. Sandasi, M.; Vermaak, I.; Chen, W.; Viljoen, A.M. Hyperspectral imaging and chemometric modelling of Echinacea—A novel approach in the quality control of herbal medicines. Molecules 2014, 19, 13104–13121. [Google Scholar] [CrossRef] [PubMed]
  23. Kelman, T.; Ren, J.; Marshall, S. Effective classification of Chinese tea samples in hyperspectral imaging. Artif. Intell. Res. 2013, 2, 87–96. [Google Scholar] [CrossRef]
  24. Qin, J.; Chao, K.; Kim, M.S.; Lu, R.; Burks, T.F. Hyperspectral and multispectral imaging for evaluating food safety and quality. J. Food Eng. 2013, 118, 157–171. [Google Scholar] [CrossRef]
  25. Yu, K.; Zhao, Y.; Li, X.; Shao, Y.; Zhu, F.; He, Y. Identification of crack features in fresh jujube using Vis/NIR hyperspectral imaging combined with image processing. Comput. Electron. Agric. 2014, 103, 1–10. [Google Scholar] [CrossRef]
  26. Shikanga, A.E.; Viljoen, A.M.; Vermaak, I.; Combrinck, S. A novel approach in herbal quality control using hyperspectral imaging: Discriminating between Sceletium tortuosum and Sceletium crassicaule. Phytochem. Anal. 2013, 24, 550–555. [Google Scholar] [CrossRef] [PubMed]
  27. Manley, M.; Du Toit, G.; Geladi, P. Tracking diffusion of conditioning water in single wheat kernels of different hardness by near infrared hyperspectral imaging. Anal. Chim. Acta 2011, 686, 64–75. [Google Scholar] [CrossRef] [PubMed]
  28. Gowen, A.A.; O’Donnell, C.P.; Cullen, P.J.; Downey, G.; Frias, J.M. Hyperspectral imaging—An emerging process analytical tool for food quality and safety control. Trends Food Sci. Technol. 2007, 18, 590–598. [Google Scholar] [CrossRef]
  29. Loranty, A.; Rembiałkowska, E.; Rosa, E.A.S.; Bennett, R.N. Identification, quantification and availability of carotenoids and chlorophylls in fruit, herb and medicinal teas. J. Food Compos. Anal. 2010, 23, 432–441. [Google Scholar] [CrossRef]
  30. Tankeu, S.; Vermaak, I.; Chen, W.; Sandasi, M.; Viljoen, A.M. Differentiation between two “fang ji” herbal medicines, Stephania tetrandra and the nephrotoxic Aristolochia fangchi, using hyperspectral imaging. Phytochemistry 2016, 122, 213–222. [Google Scholar] [CrossRef] [PubMed]
  31. Sandasi, M.; Vermaak, I.; Chen, W.; Viljoen, A.M. Skullcap and Germander: Preventing potential toxicity through the application of hyperspectral imaging and multivariate image analysis as a novel quality control method. Planta Med. 2014, 80, 1329–1339. [Google Scholar] [CrossRef] [PubMed]
  32. Zhao, J.; Chen, Q.; Cai, J.; Ouyang, Q. Automated tea quality classification by hyperspectral imaging. Appl. Opt. 2009, 48, 3557–3564. [Google Scholar] [CrossRef] [PubMed]
Figure 1. (a) Hyperspectral red, green, blue (RGB) image of rooibos and buchu raw materials prior to multivariate analysis; (b) Principal component analysis (PCA) score image of t2 demonstrating distinct color amplitudes for the two teas and (c) score scatter plot (t2 vs. t3) illustrating two distinct pixel clusters colored according to score values corresponding to the two teas.
Applsci 07 00268 g001
Figure 2. (a) Partial least squares-discriminant analysis Y-image showing classification of the raw materials in the calibration set and (b) the prediction set showing the proportion of raw constituents colored according to the predicted class.
Applsci 07 00268 g002
Figure 3. (a) Ultra-high performance liquid chromatography mass spectroscopy (UHPLC-MS)-ES+ chromatograms showing the marker compound aspalathin (Rt = 5.43 min) identified in rooibos and (b) marker compound rutin (Rt = 5.56 min) and hesperidin (Rt = 7.99 min) in buchu and (c) markers compounds rutin and hesperidin and aspalathin in the tea bag blend. Rt: retention time
Applsci 07 00268 g003
Figure 4. (a) Principal component analysis score image of t3 demonstrating distinct color amplitudes for the raw materials, green honeybush and green rooibos and (b) the score scatter plot (t2 vs. t3) illustrating two distinct pixel clusters colored according to score values.
Applsci 07 00268 g004
Figure 5. (a) Partial least squares-discriminant analysis Y-image showing classification of the raw materials in the calibration set and (b) the prediction set comprising tea bags colored according to the predicted classes.
Applsci 07 00268 g005
Figure 6. (a) UHPLC-MS-ES+ chromatograms showing the marker compound aspalathin (Rt = 5.43 min) identified in green rooibos and (b) mangiferin (Rt = 3.34 min) and hesperidin (Rt = 8.02 min) in green honeybush and (c) all three compounds in the tea bag blend.
Applsci 07 00268 g006
Figure 7. (a) Score image of rooibos and cancer bush after PCA analysis and (b) the corresponding scatter plot (t2 vs. t3) colored according to t2 score values.
Applsci 07 00268 g007
Figure 8. (a) Partial least squares-discriminant analysis Y-image showing classification of rooibos and cancer bush in the calibration set and (b) the tea bag blends colored according to predicted classes.
Applsci 07 00268 g008
Figure 9. (a) UHPLC-MS-ES chromatograms showing the marker compound aspalathin (Rt = 5.43 min) identified in rooibos and (b) the marker SU1 (Rt = 10.80 min) identified in cancer bush raw material, and (c) the two marker compounds in the tea bag blend.
Applsci 07 00268 g009aApplsci 07 00268 g009b
Table 1. Percentage pixel abundance results of raw material constituents compared to the company formulation in 18 replicate tea bag blends.
Tea Bag BlendRaw Material ConstituentsCompany Formulation (%)AveStd devHyperspectral Imaging Percentage Pixel Abundance in Tea Bag Tea Bags
123456789101112131415161718
Rooibos and buchuRooibos97.0097.09±1.1297.9098.0097.6098.5097.7098.4096.0094.5095.6096.6096.9098.0097.5096.9095.5096.7097.0098.30
Buchu3.002.68±1.051.861.712.221.472.081.243.684.984.053.132.961.792.442.694.243.122.821.70
No class-0.23±0.140.230.270.150.080.210.380.350.570.360.260.160.200.090.410.230.010.230.04
Green rooibos and green honeybushGreen honeybush65.0080.33±17.5262.3053.6054.8075.1063.1058.3082.5058.7094.1091.5088.8076.6088.8081.2066.7073.3083.7071.40
Green rooibos35.0019.47±17.3237.7043.6045.2024.8036.9041.7017.5041.305.898.5111.2023.4011.2018.8033.3026.7016.3028.60
No class-0.06±0.100.030.010.020.110.010.000.000.020.030.020.000.000.000.000.000.000.050.02
Rooibos and cancer bushRooibos96.0094.40±2.8598.6095.7096.1095.3091.396.3089.4097.7096.6090.0097. 0094.4091.3092.1093.4092.9098.2092.90
Cancer bush4.005.58±2.861.404.243.834.658.703.5910.602.343.399.962.995.608.737.926.637.151.757.12
No class-0.02±0.020.010.010.050.050.000.070.000.000.000.040.010.000.000.010.030.000.030.00
Ave: average; Std dev: Standard deviation.

