Article

Multi-Temporal Remotely Sensed Data for Degradation Dynamics in Linxia Rangeland, Northwest China

1
College of Resources and Environment, Shandong Agricultural University, Tai’an 271018, China
2
Key Laboratory of Land Surface Pattern and Simulation, Institute of Geographic Sciences and Natural Resources Research, Chinese Academy of Sciences, Beijing 100101, China
*
Author to whom correspondence should be addressed.
Appl. Sci. 2017, 7(3), 241; https://doi.org/10.3390/app7030241
Submission received: 27 October 2016 / Revised: 17 December 2016 / Accepted: 23 January 2017 / Published: 3 March 2017

Abstract

:
The importance of accurately monitoring rangeland degradation dynamics over decades is increasing in Linxia rangeland, the birthplace of the Yellow River in China. Since 2000, the Chinese government has implemented the “Grain for Green” program and enforced a grazing ban in Gansu province, one of the most degraded provinces, to mitigate the problem of rangeland degradation. The effects of these policies are controversial and have become a topic of public concern. In this study, a grading system was established for the estimation of Linxia rangeland degradation. Degrees of rangeland degradation were interpreted and the spatio-temporal dynamics of the degraded rangeland through several study periods were mapped and monitored using the Linear Spectral Mixture Analysis method on Landsat Thematic Mapper (TM)/ETM+ (Enhanced Thematic Mapper Plus) images for the years of 1996, 2001, 2006, and 2011. The results demonstrated that the time around the year 2001 appeared to be a turning point of the rangeland degradation reversion course, as the rangeland degradation reversed significantly since 2001. From 1996 to 2001, the total degraded area in Linxia rangeland increased from 2922.01 km2 to 3048.48 km2 (+4.33%), and decreased by 4.54% to 2909.97 km2 in 2011; the non-degraded rangeland gradually increased from 602.74 km2 to 710.01 km2, an increase of 17.80%. Degraded rangeland vegetation was restored significantly during 2001–2011: the area of slightly degraded rangeland increased by 3.71% and 3.83% annually during 2001–2006 and 2006–2011 intervals, respectively, and the area of moderately and severely degraded rangeland decreased annually by 4.77% and 2.41% from 2001 to 2006, and 4.58% and 0.81% during 2006–2011, respectively. These results indicated that the “Grain for Green” program and grazing ban policy, together with other ecological impacting factors, helped reverse the rangeland degradation and promote the rehabilitation of rangeland vegetation.

1. Introduction

The degradation of rangeland in semi-arid and dry sub-humid regions due to climate change and/or human activity has long been an issue attracting public concern, especially in northwest China. By the end of 2011, the area of rangeland in China was 39.30 million km2, accounting for 41.70% of its territory. However, more than 90% of China’s rangeland is subject to various degrees of degradation [1], and rangeland degradation has become a serious issue that results in ecological and socio-economic ramifications. Accurate mapping and monitoring of rangeland degradation are essential for further assessing and combating the increasing problem [2]. Since the 1980s, remotely sensed data has gradually become the main data source of research in rangeland degradation, which can provide multi-temporal and various spatial scale information of rangeland degradation [3,4,5,6,7,8,9].
The Linxia rangeland is located in the ecotone of farming-grazing, in northwest China. As the first renowned rangelands in the headstream of Yellow river, Linxia rangeland was once known for being a flourishing, prosperous, and productive ecosystem in the 1800s. However, since the 1980s, overgrazing and excessive cultivation gradually deteriorated its ecological sustainability, which led to adverse impacts to the middle and lower reaches of the Yellow River. To combat the worsening issue, the Chinese government implemented two protection policies, the “Grain for Green” program and a grazing ban, which has been in place since 2000, to convert cultivated farmland back to rangeland and promote the rehabilitation of rangeland vegetation in the ecotone of farming-grazing. Until recently, no study has been done to accurately detect and precisely monitor the dynamics of the Linxia rangeland. In the present study, a rangeland gradation system for the years of 1996, 2001, 2006, and 2011 was established based on multi-temporal Landsat images and field survey, and the Linear Spectral Mixture Analysis (LSMA) methods were selected to interpret the data from the four periods (1996, 2001, 2006, and 2011).

2. Materials and Methods

2.1. Study Region

The selected study region extends from 101°46′ to 103°31′ E and 34°36′ to 35°51′ N with an area of about 11,870 km2 (Figure 1). It is occupied by five administrative units (i.e., Linxia City, Linxia County, Jishishan Autonomous County, Hezheng County, and Xiahe County), which are distributed on one Landsat Thematic Mapper (TM) remotely sensed image. Owning to the location on the northeast edge of the Qinghai-Tibet Plateau, the altitude of the study region rises from 1685 m above sea level (a.s.l.) in the northeast to 4618 m a.s.l. in the southwest. The river basins define the main drainage network of the study region, generally dividing it into two main ecological zones: irrigation farmland and alpine rangeland. Irrigation farmland is mainly distributed in the northeast low altitude region, whereas in the southwest part of the study region where the elevation it typically upwards of more than 2500 m a.s.l., the local climate pattern is cold and relatively humid; in this region the annual average temperature is less than 0 °C, and the annual precipitation ranges from 350 mm to 620 mm, which is conducive to the growth of alpine meadow. Located in the ecotone of farming-grazing, which is also the transitional region of the sub-humid region and alpine zone, Linxia rangeland is a relatively fragile ecological system and vulnerable to rangeland degradation.

2.2. Data and Preprocessing

Four Landsat TM (Thematic Mapper) images acquired in 1996, 2001, 2006, and 2011 were selected as the main data sources to analyze the effects before and after the implementation of the two rangeland protection policies; the images were selected for their cloud-free high quality and similar climate condition (Table 1). These images, downloaded from the United States Geological Survey (USGS, http://glovis.usgs.gov), were selected from images obtained during summer and autumn (July–August) when vegetation generally reaches their maximum growth during the region’s growing season [6]. All the study images were rectified to a UTM (Universal Transverse Mercator) projection (Zone 48N, Datum: WGS-84) using at least 45 well-distributed ground control points (GCPs) for each image and cubic convolution resampling [10] with the root mean square errors (RMSEs) less than 0.25 pixels (7.5 m). In addition, the land use map of 1995 and 2000 covering the study region, together with the China-Brazil Earth Resources Satellite CCD (Charge-coupled Device) image on 23 August 2007 (19.5 m spatial resolution) and recorded data in field survey in July 2012 were selected as auxiliary sources information for the four years, respectively.

2.3. Rangeland Gradation System

Since 1984, multiple governments and organizations have set up various evaluating systems to monitor land use degradation; most of them contain dozens of indicators, which are not compatible with remotely sensed images and can only be derived from field investigation. In this study, combining the characteristics of rangeland and the interpretability of images, vegetation coverage and bare-land rate were selected as the indicators of rangeland degradation. Based on previous indicator studies [6,11,12,13] and China’s national standard “parameters for degradation, sandification and salification of rangelands” (GB19377–2003), Linxia rangeland was graded into the following four categories: non-degraded rangeland (Non-DR), slightly degraded rangeland (Sl-DR), moderately degraded rangeland (M-DR), and severely degraded rangeland (Se-DR). Combining the rangeland type and conditions of the study region, the remotely sensed gradation system of rangeland degradation was refined, as shown in Table 2.

2.4. LSMA Method

Due to the NDVI (Normalized Difference Vegetation Index) and other vegetation indexes being highly affected by seasonal vegetation changes and rainfall variation [14,15], the rangeland degradation results tend to be overestimated in sparse vegetation areas. Here, the LSMA (Linear Spectral Mixture Analysis) method was selected to extract the vegetation coverage and bare-land rate in the study region for its simplicity, effectiveness, and interpretability [14,16]. In LSMA, the reflectance of each image pixel is presented as a linear combination of the reflectance of each endmember and its residual [17], which can be presented as Equation (1).
R b = i = 1 n f i R i , b + e b
where i = 1, 2, …, n is the endmember, b = 1, 2, …, m represents the spectral band, nm + 1; R b is the reflectance of pixels for each band, R i , b is the reflectance of endmember i at band b , and e b is the residual. Among all the parameters, f i is the one to be determined, it represents the best fit fraction of endmember i in the pixel, which minimizes the RMSEs calculated by Equation (2); the RMSE should be as small as possible. In addition, all f i are subject to the unity constraint of Equation (3).
RMSE = 1 n ( i = 1 n e b )
i = 1 n 2 f i = 1 ,   f i 0
The accurate application of LSMA techniques requires delineation of meaningful and accurate endmembers [18]. Before the LSMA techniques were processed, a mask was made for other land cover types (e.g., water body, farmland, human settlements) by visual interpretation to remove their spectral interference. Then a comprehensive field investigation covering the study region was conducted in July 2012 to identify suitable sites for developing a spectral library from the images. Images for the four years were then spectral normalized [19], and Minimum Noise Fraction and Purity Pixel Index transformation were conducted to locate the “pure” endmembers of shade, vegetation, and bare-land by iteratively testing different endmember combinations [20,21]. The endmembers were then input into the VIPER tool (http://www.vipertools.org) to produce vegetation and bare-land fraction maps for each image. The fraction constraints for endmembers were set between 0 and 1, and the RMSEs constraint was set to ≤0.10. The vegetation and bare-land fraction maps for the four years extracted by LSMA were summarized and are shown in Figure 2 and Figure 3. The vegetation and bare-land fractional results were overlapped on the hillshade base map, which was extracted from the digital elevation model (DEM) data using the topographical analysis tools in ArcGIS (version 10.1, Environmental Systems Research Institute, Redlands, CA, USA). For both the vegetation and bare-land layers, white light potions represented high vegetation/bare-land covered regions, and dark parts indicated the opposite.

2.5. Validation

A ten-day intensive field study in July 2012 was conducted to establish a rangeland degradation classification system for Linxia rangeland and to evaluate the accuracy of LSMA using the bare-land ratio data as a reference. During the fieldwork, 108 groups of ground truth spectral information were obtained and recorded. Except the points for endmember selection, 50 points were selected for validation. The accuracy of LSMA method was estimated by scatterplot correlation and linear fitting by comparing estimated bare-land rate in each point with recorded ground truth data (Figure 4). Meanwhile, the validation results for the other three years (1996, 2001, and 2006) were estimated by comparison with visual interpretation results and reference data in 50 pixels, which were evenly and randomly selected from the masked images.

3. Results

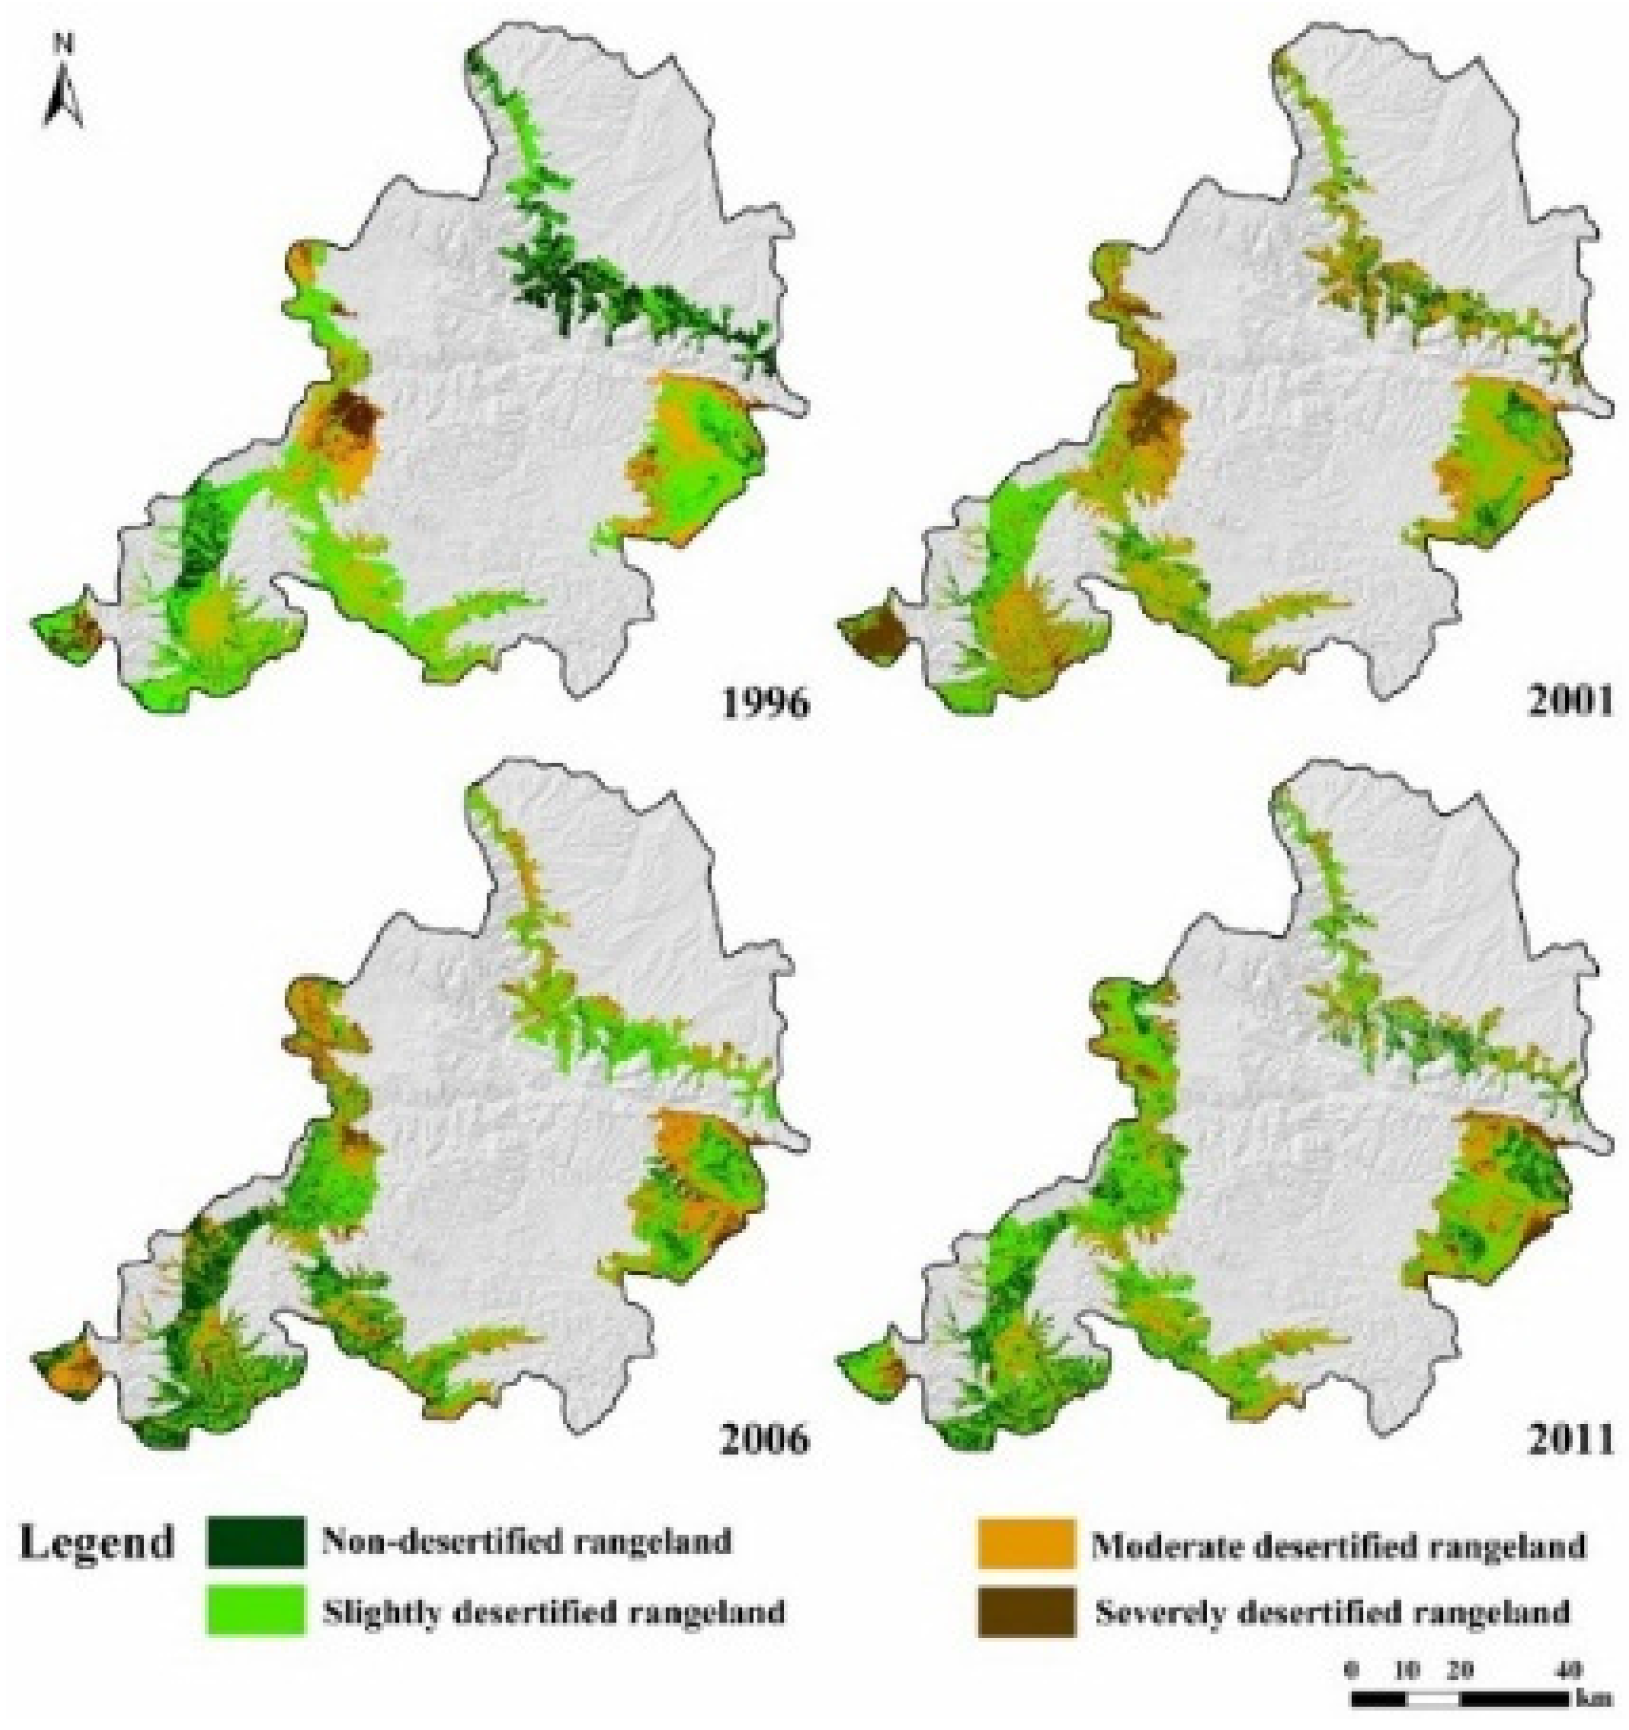
3.1. Rangeland Degradation from 1996 to 2011

The results generated using the LSMA method and remotely sensed derived system of rangeland degradation (Table 2) for the study years are shown in Figure 5, and the individual degraded rangeland statistics are summarized in Table 3.
In 2011, the total area of rangeland in the study region was 3619.98 km2, which increased by 17.89% compared with that of 1996. Though the rangeland area in 2001 reduced by 38.88 km2 since 1996, it extended steadily thereafter. In combining the classification maps from the four years and results of the three levels of degradation (Sl-, M-, and Se-DR) rangeland from 1996 to 2011, the total area for the three levels of degraded rangeland in 1996 was 2922.01 km2, accounting for 24.76% of the study region. During the 1996–2001 study interval, the degraded rangeland extended by 126.47 km2 relative to the area observed for 1996, Se-DR and M-DR areas increased 129.20 and 484.85 km2, an increase of 51.13% and 46.62%, respectively; conversely, the Sl-DR area reduced by 487.58 km2. However, since 2001, the degraded rangeland area decreased constantly to 2909.97 km2, resulting in a decrease of 138.51 km2 as of 2011. This may have an important correlation with the “Grain for Green” program and the grazing ban pursued by the Chinese government since 2000. During the period of 2001–2011, both Se-DR and M-DR areas showed a decreasing trend. Additionally, the Sl-DR area increased steadily to 1613.04 km2 in 2011, resulting in an increase of 471.25 km2.
The constant decreasing trend in the total degraded rangeland, Se-DR and M-DR areas, together with the steady increase in Sl-DR area from 2001 to 2011 indicate that the rangeland degradation in the study region reversed during the 2001–2011 period. After the “Grain for Green” program and grazing ban policy were implemented since 2000, rangeland vegetation was in a state of rehabilitation, and the rangeland ecosystem has achieved notable improvement.

3.2. Annual Change Rate of Degraded Rangeland

To further evaluate the change patterns of rangeland degradation, the annual change rate of degraded rangeland was obtained for the three study intervals (Table 4).
During the 1996–2001 interval, the area of Sl-DR decreased with an annual decrease rate of 5.98%, and the annual increase rate of M-DR and Se-DR was 9.32% and 10.22%, respectively. However, the opposite situation was illustrated after 2001, namely, the area of the Sl-DR began to increase, and the annual change rates of M-DR and Se-DR turned to be negative. The increase rate of Sl-DR for 2001–2006 and 2006–2011 intervals was 3.71% and 6.38%, respectively, which means that the increase pace gradually accelerated. On the other hand, the decrease rate of M-DR and Se-DR gradually slowed down from 2001 to 2011; the annual M-DR reduction rate was 4.77% from 2001 to 2006 and 2.41% during 2006–2011; similarly, the decreasing rate of Se-DR for the two intervals was 4.58% and 0.81%, respectively. The decrease in the area of M-DR and Se-DR suggested that the “Grain for Green” and grazing ban policies implemented since 2000 in the study region played important roles in the recovery of rangeland vegetation and the reversal of the rangeland degradation trend.

3.3. Spatial Dynamics of Rangeland Degradation

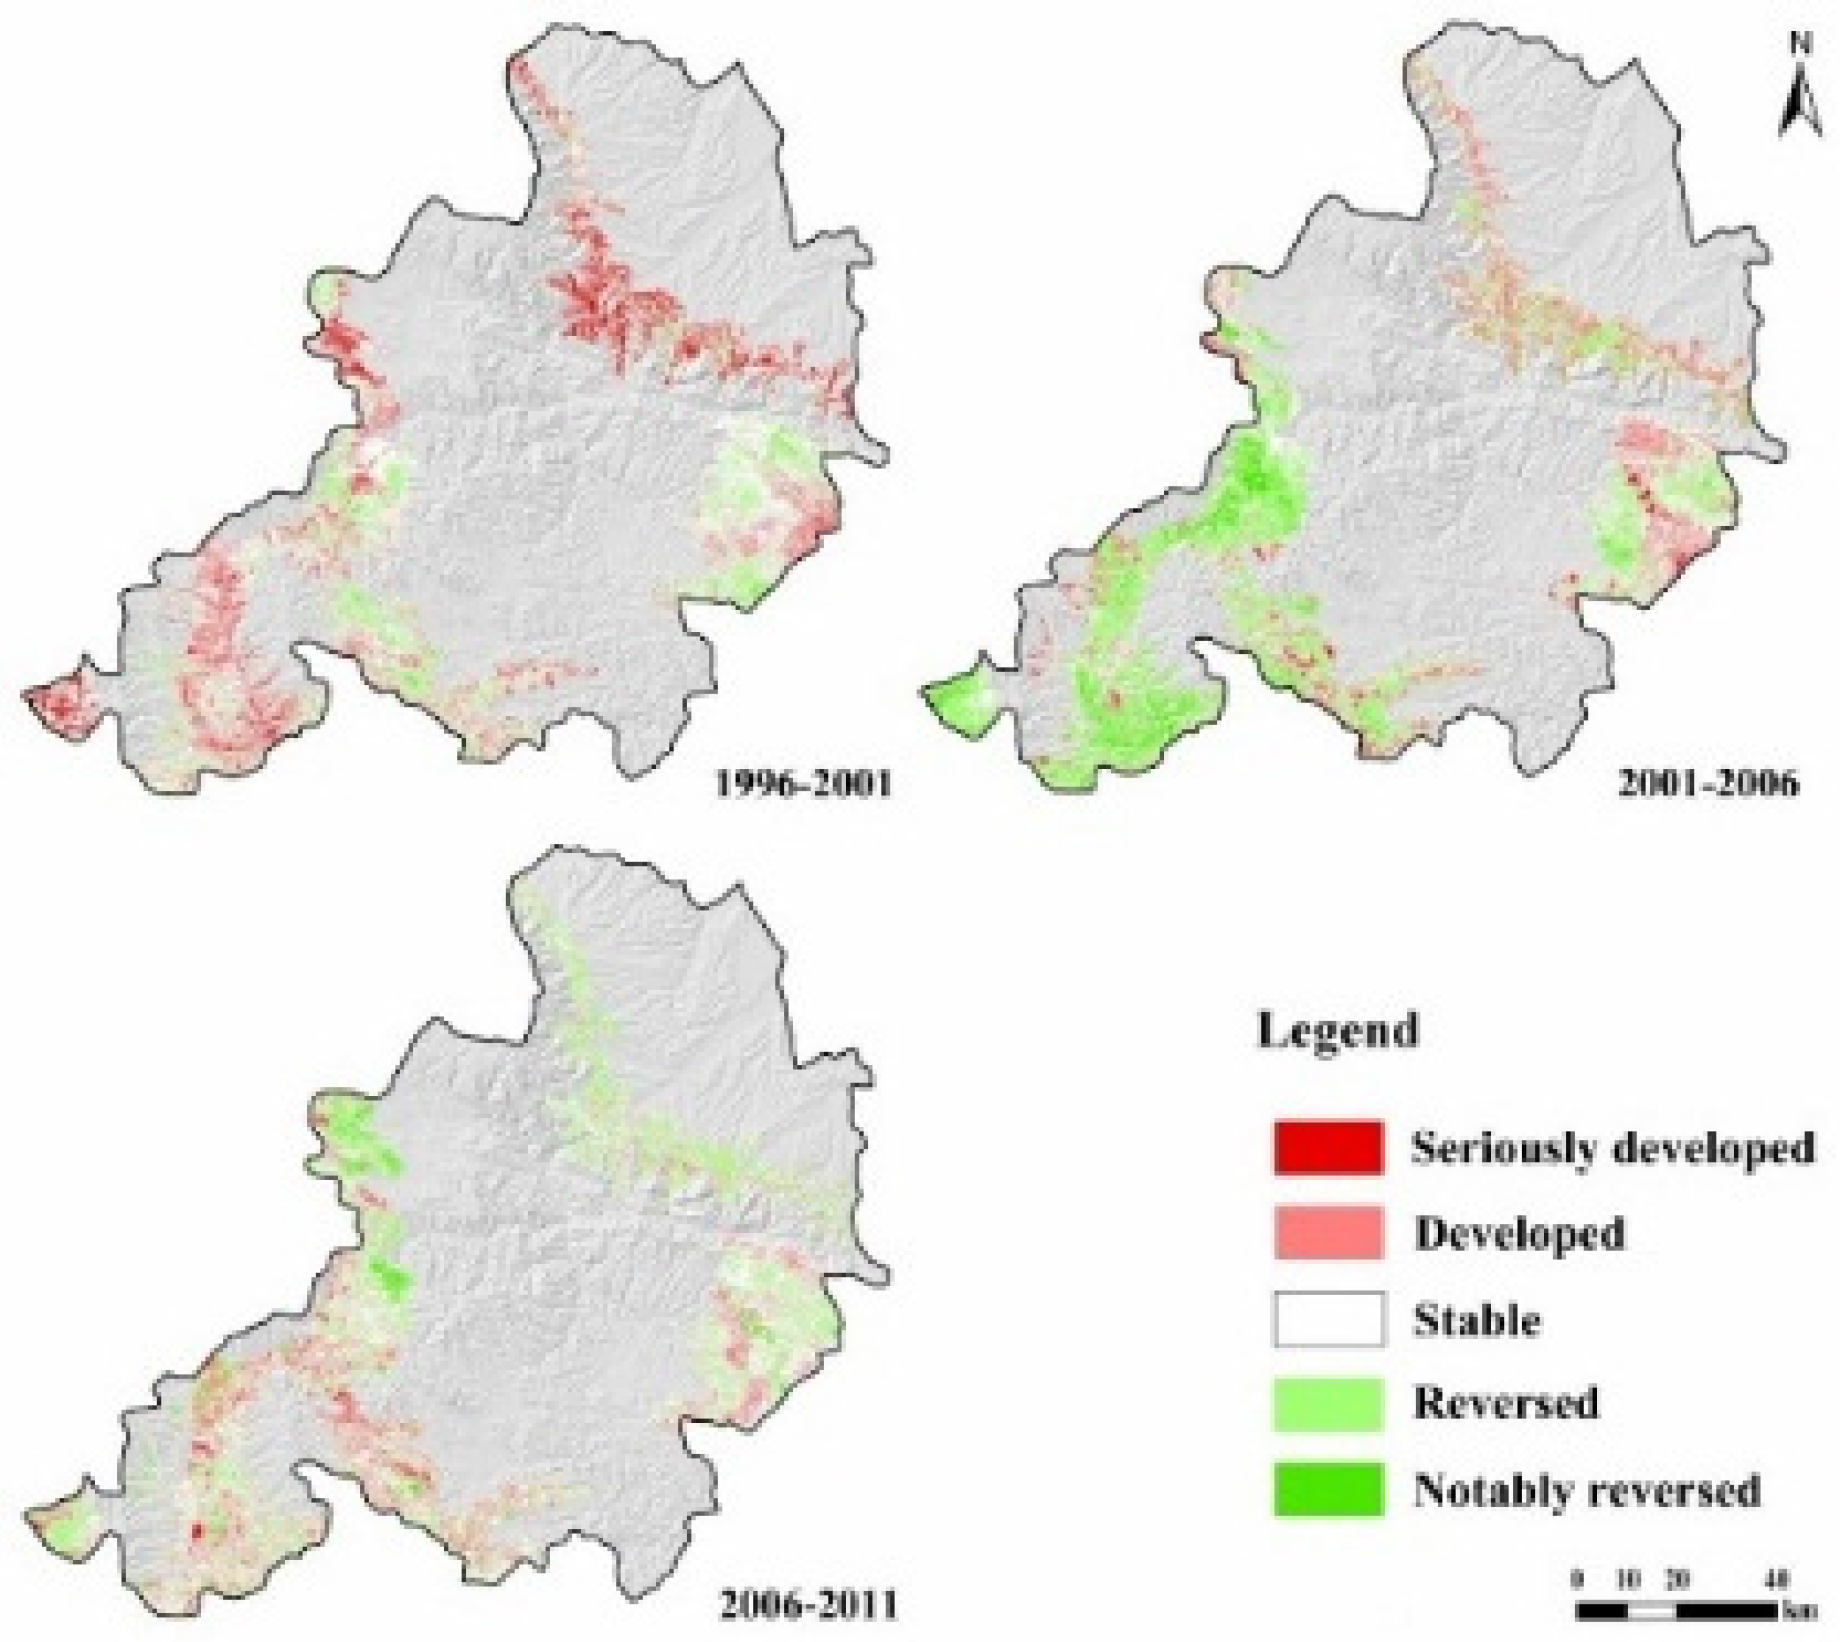
Although rangeland degradation change statistics can be generated by other measures, such as census tracts, they shed little light on where the rangeland degradation changes are occurring. However, by constructing a change detection map, the advantages of remote sensing could be fully appreciated. Using raster calculation, spatial change maps of rangeland degradation were constructed (Figure 6) for each study interval, and the elements of maps were defined as follows: (1) a one-level increase of degradation during study interval indicates “developed” (e.g., a change from Non-DR to Sl-DR); (2) a cross-level increase indicates “seriously developed” (e.g., a change from Non-DR to M-DR). Conversely, a one-level decrease indicates “reversed”; and a cross-level decrease indicates “notably reversed”. No change between two study periods was expressed as “stable” (Li et al., 2011). Meanwhile, to further evaluate the results of degraded rangeland conversions, matrices of degraded rangeland from 1996 to 2001, 2001 to 2006, and 2006 to 2011 were created (Table 5, Table 6 and Table 7). Unchanged pixels in this table are located along the major diagonal of matrix and conversion values were calculated by area (km2).
From 1996 to 2001, 532.36 and 102.19 km2 of Sl-DR converted to M-DR and Se-DR, and 169.92 and 102.22 km2 of M-DR changed into Sl-DR and Se-DR, respectively. The amount of Se-DR area that changed into Sl-DR and M-DR was relatively small (16.27, and 4.63 km2, respectively) (Table 5). Meanwhile, 176.87, 185.82, and 4.63 km2 of Non-DR converted to Sl-DR, M-DR, and Se-DR, respectively.
In the first study interval (1996–2001), only 283.36 km2 of degraded rangeland was either reversed or notably reversed, with the change being dispersedly distributed in the study region. Conversely, 1104.49 km2 of rangeland was developed or notably developed, which was widely distributed in the study region. In this period, due to overgrazing and lack of effective policy guidance, the total area of developed and seriously developed degraded rangeland was 3.90 times that of the reversed and notably reversed degraded rangeland, which indicates that during the 1996–2001 interval, rangeland degradation in the study region was in a state of deterioration (Figure 6).
In the second period (i.e., from 2001 to 2006), 283.12 km2, 3.17 km2, and 453.29 km2 of Sl-DR changed to M-DR, Se-DR, and Non-DR, respectively, with the largest proportion changing to Non-DR among study periods. An area of 122.79 km2 of M-DR changed to Se-DR, and 646.93 km2 of M-DR changed to Sl-DR, which is 5.27 times the area that changed to Se-DR. In addition, 50.80 and 172.03 km2 of Se-DR changed to Sl-DR and M-DR, respectively (Table 6), which was much greater than the total area changed during the previous interval.
In this period (2001–2006), 1480.22 km2 of degraded rangeland was reversed or notably reversed and was mainly distributed in western Xiahe County; an area of 698.28 km2 of DR was developed in the study region (Figure 6). The area of reversed degraded rangeland vegetation that expanded was twice the size of the area that developed and seriously developed area narrowed, showing that the implementation of “Grain for Green” program and grazing ban policies have effectively promoted vegetation rehabilitation in degraded area.
In the last study interval (2006–2011), 225.39, 9.42, and 343.24 km2 of Sl-DR were converted to M-DR, Se-DR, and Non-DR, respectively; 87.65 km2 of M-DR changed to Se-DR, and 408.79 km2 of M-DR converted to Sl-DR, which is 2.35 times the change to Se-DR. Areas of 45.08 and 99.18 km2 changed from Se-DR to Sl-DR and M-DR, respectively, which is slightly less than the area converted during the previous period (Table 7). However, it should be noted that rangeland in Xiahe County seemed to be seriously developed, which was in contrary to the change trend of the rest study area.
From 2006 to 2011, 921.81 km2 of DR was reversed or notably reversed, which was less than in the second period (2001–2006); the reversed area was mainly distributed in Linxia City. Meanwhile, 747.71 km2 of degraded rangeland was developed or seriously developed, which was mainly distributed in the west of Xiahe County (Figure 6). The area of degradation development and notable development was smaller than that of reversal and notable reversal, indicating that the rangeland in the study region was still recovering from degradation.

4. Discussion

In this study, multi-temporal images with similar acquisition time and climate situation in Linxia rangeland were selected to improve the comparability between study intervals. The results show that during the study period degraded rangeland area in the study region experienced an overall increase-to-decrease trend. Rangeland degradation is affected by various factors, including population increases and climate change [22,23,24], and human exploitation and policy [4,25,26]. In terms of climate change, for the special location of Linxia rangeland in the ecotone and transitional region, precipitation and temperature were the main natural factors influencing the rangeland degradation in the study region [6,27]. During the study period, Linxia rangeland experienced an overall wetting and cooling trend with the average annual precipitation trending upward (10.80 mm/10a) and temperature going downward (−0.05 °C/10a, Figure 7). Climate in the study region was changing in a direction conducive to the restoration of rangeland vegetation. However, Se-DR and M-DR areas increased 51.13% and 46.62% in the area during 1996–2001, which indicated that climate alone may not reverse the trend of rangeland degradation. Whereas on the other hand, since Gansu province implemented the “Grain for Green” program, the Three-North Shelterbelt Forest Program, and the region-wide grazing ban in 2000, the rangeland vegetation has continually been restored, and rangeland degradation has been effectively controlled. Together with climate change and other ecological measures, the implementation of policies was effective to support vegetation rehabilitation and degradation reversion in the Linxia rangeland.
Furthermore, we noted that there was a significant decrease in area of reversed and notably reversed rangeland degradation in the third study interval (2006–2011) in comparison to that observed for 2001–2006; additionally, the area of Non-DR decreased by 54.51 km2 from 2006 to 2011, which indicates that the degradation conversion pace in the study region slowed down during the 2006–2011 interval. In addition to the climate change impacts, a field analysis found that during the initial years since the rangeland degradation protection measures were implemented, due to the pressure of policy enforcement, a large area of fertile cultivated farmland was converted back to rangeland, in order to achieve the set tasks. Meanwhile, the local herdsmen were prohibited to graze in their traditional rangelands during the grazing ban period; furthermore, they were suggested to move down to the settlements where they had to impound their livestock with a maximum of 22.7 yuan per Mu as subsidy (approximate $3.5 per 667 m2). Once the policy enforcement and supervision power weakened, the rangeland may be reconverted back to cultivation [28] or be rapidly overloaded by grazing, which may cause conflicts and violent events in the process of land use transition. These problems exist universally in the farming-grazing ecotone of China. Decision makers need to seriously consider the local situation and adjust policies appropriately (e.g., protect the existing fertile farmland, improve the subsidy standard, and implement rotational grazing in order to ensure the policy better targets its goals while maintaining ethnic harmony).

5. Conclusions

With the increasing complexity of human impacts on the environment, accurate assessment of the extent and degree of rangeland degradation is essential to establishing efficient environmental management strategies. Using remote sensing and field survey data, we assessed the spatial and temporal dynamics of rangeland degradation in Linxia rangeland, northwest China, before and after the implementation of the “Grain for Green” program and a grazing ban policy. The results indicate that rangeland protection policies and the positive effects of climate variation jointly resulted in the rehabilitation of the rangeland vegetation and reversion of rangeland degradation.
The results confirm the potential of the LSMA method to provide accurate and efficient means to map and analyze spatio-temporal dynamics of degraded rangeland. Compared with the conventional census ways, information derived from remotely sensed image can quantify, and in doing so, lead to a better understanding of the nature of rangeland degradation dynamics, in addition to determining where areas of rehabilitation or degradation are occurring. As reliable and current data are still lacking for the Linxia rangeland, further study using the LSMA method and high-resolution remotely sensed images are recommended.

Acknowledgments

The authors would like to thank the editor and anonymous reviewers for their constructive comments and suggestions which have substantially improved the quality of this manuscript. This study was supported by National Basic Research Program of China (2012CB955304), Postdoctoral Research Foundation (010/76562) and Youth Innovation Research Program of Shandong Agricultural University (010/24150).

Author Contributions

X.Y. and C.L. conceived and designed the experiments; X.Y. performed the experiments; G.Z. analyzed the data; X.Y. wrote the paper.

Conflicts of Interest

The authors have declared that no competing interests exist.

References

  1. State Forestry Administration. 2011. Available online: http://www.forestry.gov.cn/uploadfile/main/2011-1/file/2011-1-5-59315b03587b4d7793d5d9c3aae7ca86.pdf (accessed on 5 January 2011).
  2. Reynolds, J.F.; Smith, D.M.S.; Lambin, E.F.; Turner, B.L., II; Mortimore, M.; Batterbury, S.P.J.; Downing, T.E.; Dowlatabadi, H.; Fernández, R.J.; Herrick, J.E.; et al. Global desertification: Building a science for dryland development. Science 2007, 316, 847–851. [Google Scholar] [CrossRef] [PubMed]
  3. Bruegger, R.A.; Jigjsuren, O.; Fernández-Giménez, M.E. Herder observations of rangeland change in mongolia: indicators, causes, and application to community-based management. Rangel. Ecol. Manag. 2014, 67, 119–131. [Google Scholar] [CrossRef]
  4. Harris, R.B. Rangeland degradation on the qinghai-tibetan plateau: A review of the evidence of its magnitude and causes. J. Arid Environ. 2009, 74, 1–12. [Google Scholar] [CrossRef]
  5. Huang, F.; Wang, P. Grassland change in west northeast china plain from spot-vegetation time series data analysis. Proc. SPIE Int. Soc. Opt. Eng. 2009, 7492. [Google Scholar] [CrossRef]
  6. Li, J.; Yang, X.; Jin, Y.; Yang, Z.; Huang, W.; Zhao, L.; Gao, T.; Yu, H.; Ma, H.; Qin, Z.; et al. Monitoring and analysis of grassland desertification dynamics using Landsat images in Ningxia, China. Remote Sens. Environ. 2013, 138, 19–26. [Google Scholar] [CrossRef]
  7. Li, X.L.; Gao, J.; Brierley, G.; Qiao, Y.-W.; Zhang, J.; Yang, Y. Rangeland degradation on the qinghai-tibet plateau: Implications for rehabilitation. Land Degrad. Dev. 2013, 24, 72–80. [Google Scholar] [CrossRef]
  8. Shen, X.; Zhou, D.; Fei, L.I.; Zhang, H. Vegetation change and its response to climate change in grassland region of china. Sci. Geogr. Sin. 2015, 35, 622–629. [Google Scholar]
  9. Warren, P.L.; Hutchinson, C.F. Indicators of rangeland change and their potential for remote sensing. J. Arid Environ. 1984, 7, 107–126. [Google Scholar]
  10. Reichenbach, S.E.; Haake, K. Cubic convolution for one-pass restoration and resampling. In Proceedings of the IEEE IGARSS ’96 International Geoscience and Remote Sensing Symposium: Remote Sensing for a Sustainable Future, Lincoln, NE, USA, 27–31 May 1996; Volume 3, pp. 1597–1599.
  11. Middleton, N.; Thomas, D. World Atlas of Desertification, 2nd ed.; Routledge: Abingdon-on-Thames, UK, 1997. [Google Scholar]
  12. Wang, T.; Wu, W.; Xue, X.; Zhang, W.M.; Han, Z.W.; Sun, Q.W. Spatial–temporal changes of sandy desertified land during last 5 decades in northern China. Acta Geogr. Sin. 2004, 59, 203–212. [Google Scholar]
  13. Zhu, Z.; Chen, G. Sandy Desertification of China; Science Press: Beijing, China, 1994. [Google Scholar]
  14. Dawelbait, M.; Morari, F. Monitoring desertification in a Savannah region in Sudan using Landsat images and spectral mixture analysis. J. Arid Environ. 2012, 80, 45–55. [Google Scholar] [CrossRef]
  15. Wessels, K.J.; van den Bergh, F.; Scholes, R.J. Limits to detectability of land degradation by trend analysis of vegetation index data. Remote Sens. Environ. 2012, 125, 10–22. [Google Scholar] [CrossRef]
  16. Elmore, A.J.; Mustard, J.F.; Manning, S.J.; Lobell, D.B. Quantifying vegetation change in semiarid environments: Precision and accuracy of spectralmixture analysis and the normalized difference vegetation index. Remote Sens. Environ. 2000, 73, 87–102. [Google Scholar] [CrossRef]
  17. Ichoku, C.; Karnieli, A. A review of mixture modeling techniques for sub-pixel land cover estimation. Remote Sens. Rev. 1996, 13, 161–186. [Google Scholar] [CrossRef]
  18. Symeonakis, E.; Drake, N. Monitoring desertification and land degradation over sub-Saharan Africa. Int. J. Remote Sens. 2004, 25, 573–592. [Google Scholar] [CrossRef]
  19. Yang, J.; Weisberg, P.J.; Bristow, N.A. Landsat remote sensing approaches for monitoring long-term tree cover dynamics in semi-arid woodlands: Comparison of vegetation indices and spectral mixture analysis. Remote Sens. Environ. 2012, 119, 62–71. [Google Scholar] [CrossRef]
  20. Franke, J.; Roberts, D.A.; Halligan, K.; Menz, G. Hierarchical multiple endmember spectral mixture analysis (MELSMA) of hyperspectral imagery for urban environments. Remote Sens. Environ. 2009, 113, 1712–1723. [Google Scholar] [CrossRef]
  21. Ghrefat, H.A.; Goodell, P.C. Land cover mapping at Alkali Flat and Lake Lucero, White Sands, New Mexico, USA using multi-temporal and multi-spectral remote sensing data. Int. J. Appl. Earth Obs. Geoinform. 2011, 13, 616–625. [Google Scholar] [CrossRef]
  22. Han, L.; Zhang, Z.; Zhang, Q.; Wan, X. Desertification assessments in the hexi corridor of northern china’s gansu province by remote sensing. Nat. Hazards 2015, 75, 2715–2731. [Google Scholar] [CrossRef]
  23. Kassahun, A.; Snyman, H.A.; Smit, G.N. Impact of rangeland degradation on the pastoral production systems, livelihoods and perceptions of the somali pastoralists in eastern ethiopia. J. Arid Environ. 2008, 72, 1265–1281. [Google Scholar] [CrossRef]
  24. Pricope, N.G.; Husak, G.; Lopez-Carr, D.; Funk, C.; Michaelsen, J. The climate-population nexus in the east african horn: Emerging degradation trends in rangeland and pastoral livelihood zones. Glob. Environ. Chang. 2013, 23, 1525–1541. [Google Scholar] [CrossRef]
  25. Milton, S.J.; Siegfried, W.R. A conceptual model of arid rangeland degradation. Bioscience 1994, 44, 70–76. [Google Scholar] [CrossRef]
  26. Li, W.; Li, Y.; Gongbuzeren. Rangeland Degradation Control in China: A Policy Review. The End of Desertification? Springer: Berlin, Germany, 2016; pp. 491–511. [Google Scholar]
  27. Chen, F.; Weber, K.T. Assessing the impact of seasonal precipitation and temperature on vegetation in a grass-dominated rangeland. Rangel. J. 2014, 36, 185–190. [Google Scholar] [CrossRef]
  28. Uchida, E.; Xu, J.; Rozelle, S. Grain for green: Cost-effectiveness and sustainability of China’s conservation set-aside program. Land Econ. 2005, 81, 247–264. [Google Scholar] [CrossRef]
Figure 1. Location of the study region.
Applsci 07 00241 g001
Figure 2. Vegetation fractional results for 1996, 2001, 2006 and 2011, with light areas on the maps indicating highly vegetated regions.
Applsci 07 00241 g002
Figure 3. Bare-land fractional results for the four years, with light areas on the maps indicating bare-land covered regions.
Applsci 07 00241 g003
Figure 4. A correlation of field recorded bare-land fraction and the estimated data extracted by LSMA (Linear Spectral Mixture Analysis). The linear fitting for the validation is statistically significant at p < 0.001.
Applsci 07 00241 g004
Figure 5. Rangeland degradation from 1996 to 2011 for the Linxia rangeland.
Applsci 07 00241 g005
Figure 6. Rangeland degradation spatial dynamics for Linxia rangeland during 1996–2001, 2001–2006, and 2006–2011. The base map was the hillshade result of digital elevation model (DEM) topographical analysis.
Applsci 07 00241 g006
Figure 7. Annual change in temperature and precipitation of the study region from 1996 to 2011. The black line is drawn according to the climate data from Linxia meteorological station, gray lines are the change trends of three study intervals (1996–2001, 2001–2006, 2006–2011), and the red dot lines represent the three-point running average.
Applsci 07 00241 g007
Table 1. Metadata of Landsat Thematic Mapper (TM)/ETM+ (Enhanced Thematic Mapper Plus) images cover the Linxia rangeland, northwest China.
YearPath/RowLandsat Scene IDAcquisition DateSpatial Resolution (m)
1996131/35LT51310351994200BJC0019 July 199630
2001131/35LT51310352001203BJC0022 July 200030
2006131/35LT51310352006217IKR006 August 200630
2011131/35LT51310352011199IKR0018 July 201130
Table 2. Remote sensing derived system of rangeland degradation in the study region. Non-DR, non-degraded rangeland; Sl-DR, slightly degraded rangeland; M-DR, moderately degraded rangeland; and Se-DR, severely degraded rangeland.
TypeVegetation Coverage (%)Vegetation PatternBare-Land Rate (%)Bare-Land Pattern
Non-DR>80No shrub or inedible grass <20Almost no land bare
Sl-DR50–60Shrub or inedible grass become the main accompany species30–45Bare-land sporadically exists
M-DR30–50Shrub or inedible grass become the dominant species45–60Relatively large area bare-land exists
Se-DR<30Sparse vegetation or no edible meadow>60Bare-land dominates the landscape
Table 3. Summary of degraded rangeland area statistics in 1996, 2001, 2006, and 2011 for Linxia rangeland.
Degraded Rangeland Type1996200120062011
Area (km2)%Area (km2)%Area (km2)%Area (km2)%
Non-DR602.7417.10437.3912.55764.5221.44710.0119.62
Sl-DR1629.3746.231141.7932.751353.8237.961613.0444.56
M-DR1039.9729.501524.8243.751153.4232.341014.4428.02
Se-DR252.677.17381.8710.95294.428.26282.497.80
Total3524.15100.003485.87100.003566.18100.003619.98100.00
Table 4. Annual change rate of degraded rangeland from 1996 to 2011 (positive values mean an increase, negative values represent a decrease).
Degraded Rangeland Type1996–2001 (%)2001–2006 (%)2006–2011 (%)
Sl-DR−5.98+3.71+3.83
M-DR+9.32−4.77−2.41
Se-DR+10.22−4.58−0.81
Table 5. Rangeland degradation changes (km2) from 1996 to 2001 in Linxia rangeland.
20011996
-Sl-DRM-DRSe-DRNon-DR
Sl-DR777.37169.9216.27176.87
M-DR532.36738.6759.64185.82
Se-DR102.19102.22171.884.63
Non-DR194.3521.561.62217.03
Table 6. Rangeland degradation changes (km2) from 2001 to 2006 in Linxia rangeland.
20062001
-Sl-DRM-DRSe-DRNon-DR
Sl-DR369.23646.9350.80257.61
M-DR283.12627.08172.0327.53
Se-DR3.17122.79120.684.06
Non-DR453.29119.5137.66147.71
Table 7. Rangeland degradation changes (km2) from 2006 to 2011 in Linxia rangeland.
20112006
-Sl-DRM-DRSe-DRNon-DR
Sl-DR683.10408.7945.08404.06
M-DR225.39613.9299.1812.86
Se-DR9.4287.65144.588.03
Non-DR343.2422.313.21331.38

