Article

Experimental Investigation on Soft Galloping and Hard Galloping of Triangular Prisms

1
State Key Laboratory of Hydraulic Engineering Simulation and Safety, Tianjin University, Tianjin 300072, China
2
Department of Civil Engineering, Case Western Reserve University, Cleveland, OH 44106, USA
*
Author to whom correspondence should be addressed.
Appl. Sci. 2017, 7(2), 198; https://doi.org/10.3390/app7020198
Submission received: 15 November 2016 / Revised: 19 January 2017 / Accepted: 13 February 2017 / Published: 17 February 2017

Abstract

:
The studies currently on soft galloping (SG) and hard galloping (HG) are scarce. In this study, SG and HG of spring-mounted triangular prisms in a water channel are investigated experimentally. A power take-off system (PTO), a spring system, additional weights, and different triangular prisms were used to achieve the variations in damping coefficient c, system stiffness K, oscillation mass m and section aspect ratios α, respectively. The present paper proves that the VIV (vortex-induced vibration) lower branch can be observed in the SG response. In SG response, VIV branches are incomplete while the galloping branch is complete, and galloping can be self-initiated only in the self-excited region. On the contrary, in HG response, VIV branches are complete, the galloping branch is incomplete, and galloping can only be initiated by external excitation at a velocity exceeding the critical velocity. As c and m increase, or K and α decrease, the oscillation mode of a triangular prism gradually transitions from SG to CG (critical galloping), and continues to HG. The amplitude in VIV branch is the main reason causing the onset of galloping in SG response. A critical damping coefficient cc, which is dependent on m, K and α, is proposed to predict the occurrences of SG, CG and HG. When c < cc, SG occurs; when c > cc, HG occurs; when c = cc, CG occurs.

1. Introduction

The phenomenon of flow-induced motion (FIM) can be frequently observed in many engineering structures such as long-spanned bridges [1], marine risers [2], power-transmission cables [3], etc. Vortex-induced vibration (VIV) is one of the most common FIM phenomena, which usually occurs due to the alternating shedding of vortices from either side of the bluff body [4]. VIV is a self-excited and self-limited motion with a limited amplitude and limited resonant flow velocity range (lock-in range). It is usually observed in the motion of circular cylinders immersed in steady flow. Numerous publications have already investigated the characteristics of VIV for an elastically mounted cylinder in steady flow, illustrating that the VIV response was strongly dependent on the mass, the damping, and Reynolds number [5,6,7,8,9]. In addition to the circular cylinder, other prisms such as square prism and triangular prism also presented VIV responses. Nemes et al. [10,11] reported that the incident angle had a significant influence on the performance of square prisms. When the incident angle was 45 degrees (diamond cross-section), the square prism presented a self-limited motion (which was VIV). In Ding’s numerical results [12], the triangular prism with a low mass ratio could undergo the VIV initial branch at a low flow velocity. This phenomenon has been confirmed by Zhang [13] and Yan [14].
Contrary to VIV, galloping, as another common FIM phenomenon, is a self-excited but not self-limited motion, which is characterized with a higher amplitude, lower frequency, and broader resonant flow velocity range. It usually occurs in the motion of prisms with sharp sections at a high flow velocity, and is commonly induced by the instability of lift force caused from the periodic variation of attack angle [15]. Thus far, the studies of galloping were not as complete as the studies of VIV, owing to the diversity of the cylinder cross-sections and the complexity of the galloping itself. Most researchers such as Nemes et al. [10,11] and Barrero-Gil et al. [16] concentrated on the studies of square or rectangular prisms, while only limited studies focused on the triangular prism due to the complexity of this prism. Actually, research on the dynamics of triangular prism is very valuable in many engineering fields such as aerodynamics, fluid-structure interactions (FIS), offshore structures and renewable energy fields. Alonso et al. [17,18,19] focused on the responses of triangular prisms based on the Glauert-Den Hartog criterion [20] and dynamical tests in wind tunnels. They concluded that the stability of galloping for triangular prisms strongly depended on the incident flow orientation and the aspect ratio as well as the mass and damping.
In view of the huge destruction caused by FIM on engineering structures, many researchers [1,2,3] have devoted a great deal of effort to predicting and suppressing FIM over the past few decades. Nevertheless, researchers found that the high-quality renewable energy in FIM could be harnessed by using some new devices such as the piezoelectric transducer [21,22] or VIVACE (Vortex-Induced Vibration for Aquatic Clean Energy) in recent years [23,24]. Following that, an increasing number of FIM academics began studying approaches to enhancing the FIM (especially the amplitude) of cylinders. From 2011 to 2013, Chang [25], Park [26], and Ding et al. [27] developed the PTC (passive turbulence control) system to alter the surface roughness of circular cylinders in order to convert more hydrokinetic energy to electrical energy in a broader velocity range. By adjusting height and edge angle of the roughness trip, the circular cylinder presented the galloping response at a high velocity and the power efficiency was raised from 22% [24] to 28% [27]. Compared with the circular cylinder with PTC, the triangular prism exhibited a great advantage in energy extraction. Ding’s [12] numerical results have shown that the harness efficiency could reach 20%. Recently, Zhang [28] established a combined system of oscillation and power take-off (PTO) to investigate the energy extraction of an equilateral triangular prism in water flow. More than expected, the maximum amplitude of the prism reached 2.71D in galloping zone and the maximum energy conversion efficiency reached 40.44%. These results indicated that the triangular prism might harness more energy from FIM.
In both Park’s research [26] and Zhang’s research [28], an interesting galloping phenomenon was observed. When the cylinder was applied with a threshold initial displacement, which was approximately one diameter, the hard galloping (HG) response was observed at a high velocity (in VIV lower branch). However, for an initial displacement less than one diameter, HG could not be observed. That means that HG was not a self-excited galloping. In contrast, when the edge angle of PTC is at an appropriate value or the damping is low enough, the circular cylinder with PTC or the triangular prism could be self-initiated to galloping with no initial displacements or external forces. This phenomenon was named soft galloping (SG) as opposed to the HG.
The information currently available about HG and SG is still scarce. As far as we know, only Park [26] and Zhang [28] occasionally found HG under certain conditions. Fewer studies about the relationship between SG and HG were performed. Moreover, while the configuration of the oscillation system was changed, prisms presented two different HG modes: hard galloping 1 (HG1) and hard galloping 2 (HG2). This phenomenon indicated that the physical parameters (such as damping, mass, stiffness, and cross-section aspect ratio) had great impacts on the oscillation mode of triangular prisms. As reported by previous research [12,13,14,25,26,27,28], triangular prisms have great advantages in energy extraction, especially at the galloping branch. However, HG cannot be self-initiated without external excitation, which means the energy in HG can hardly be harnessed. Consequently, the lack of investigation on the occurrence conditions of SG and HG seriously restricts the development in the energy extraction in FIM of triangular prisms.
The objective of the present study is to investigate the characteristics of SG and HG responses of triangular prisms in water by experimental methods. In Section 2, the PTO system is introduced to adjust the system damping coefficient c; a spring system is established to adjust the system stiffness K; additional weights are used to adjust the system mass m; and different triangular prisms are used to achieve the variation in section aspect ratio α. Next, the corresponding parameters of the experimental setup are deduced and verified. The complete SG and HG responses under conditions of increasing or decreasing flow velocity and applying or not applying a threshold initial displacement are exhibited in Section 3. In Section 4, the evolutions of oscillation mode of triangular prisms with the variations of c, K, m and α are analyzed. In Section 5, the occurrence conditions of SG and HG are revealed. Finally, the conclusions are summarized.

2. Experimental Methods

2.1. Water Channel and Flow Velocity

The experiments were conducted in the recirculating water channel at the State Key Laboratory of Hydraulic Engineering Simulation and Safety of Tianjin University (SKL-HESS), as seen in Figure 1. The water channel includes a tank, a power section, a wide section, a bend section, a contraction section, and a narrow section. The water in the channel is forced to circulate by a tubular pump powered by a 90 kW motor. A frequency conversion controller (FCC) is used to achieve variation in the flow velocity. The experimental setup is established at the narrow section. The length of test section is approximately 15 m, the width is 1 m, and the depth is 1.5 m. The water depth is 134 cm.
In this section, the increasing and decreasing flow velocities are compared. The velocity varied by adjusting the frequencies of the FCC. The velocities were measured using the Pitot tube with a differential pressure transmitter. The accuracy of the differential pressure transmitter is within ±0.1% of the linear available range 6 kPa, and the resolution is within 0.01% FS (Full Scale). The test results of the increasing and decreasing velocities are plotted in Figure 2.
It can be observed that the flow velocity increases linearly with the increase of the frequency of FCC, and the maximum flow velocity is approximately 1.80 m/s. Moreover, the curves of flow velocity against increasing and decreasing frequencies of FCC basically coincide, indicating that it is reasonable to vary the flow velocity by adjusting the frequencies of FCC.

2.2. Oscillation System

The oscillation system consists of a frame, two linear guide ways, a transmission, triangular prisms, and springs, as seen in Figure 3a. The material of the frame is steel. It is located on the top of the test section of the water channel. The linear guide ways are fixed on the frame in the vertical direction to the incoming flow. The transmission includes two side struts and a connective structure. The side struts, which are made of duralumin plate, are rigidly connected with the prisms, which are immersed in the water. The connective structure is joined with the side struts and springs and constrained to move on the linear guide ways in the vertical direction by four linear bearings. Each side of the upper and the lower extensional springs is suspended vertically on the frame and the connection structure. Based on the oscillation system mentioned above, the free oscillation of prisms in vertical direction can be achieved.
A magnetic induction displacement transducer (Figure 3a) is fixed on one side of the frame to measure the oscillating displacement. The measurement range is from 0 to 800 mm with an accuracy within ±0.05% and a resolution of 0.001% FS. The rod of the transducer is fixed on the top of the transmission. All data are collected at a 50 Hz sampling rate.

2.3. Variation in Damping

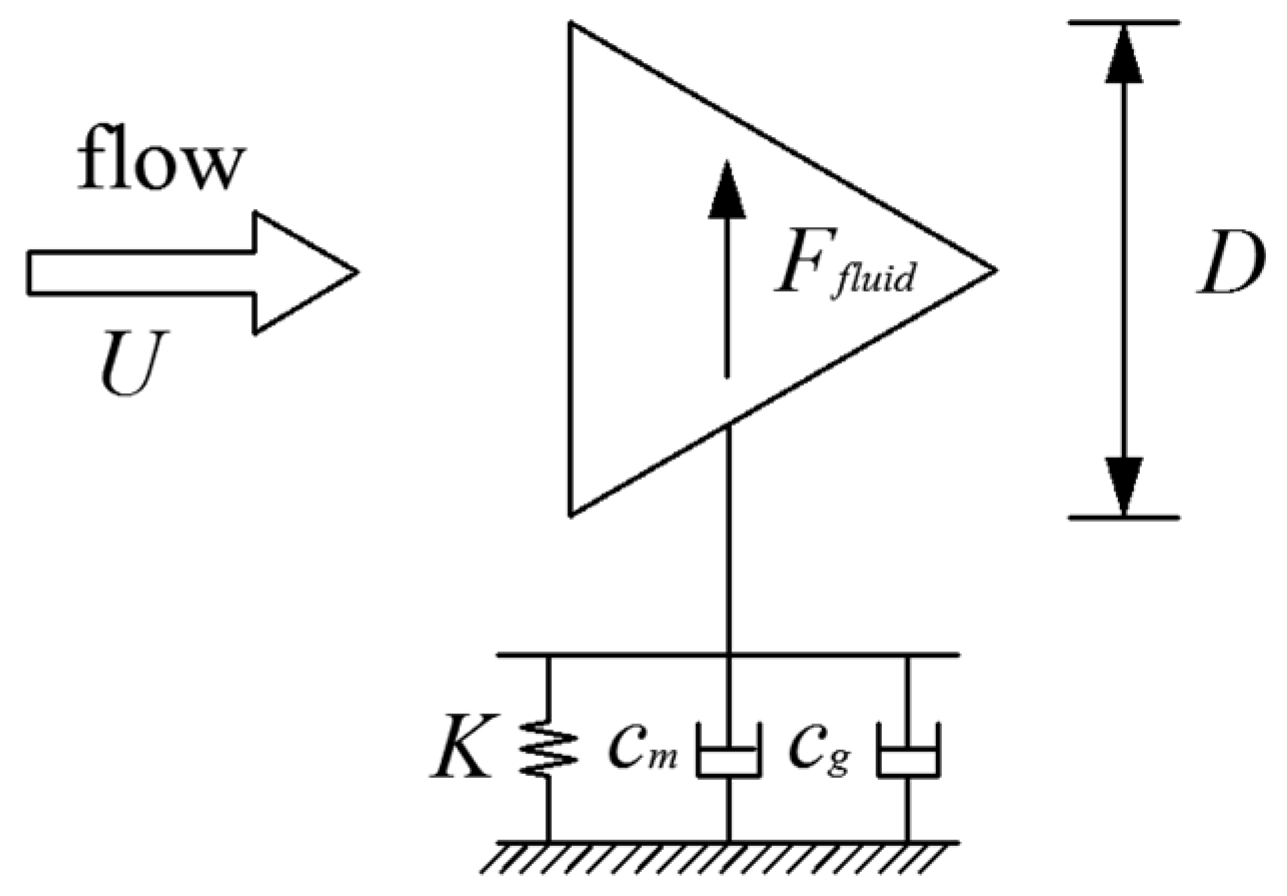
When a spring-mounted triangular prism is acted by the vertical flow force Ffluid, the motion of the prism in the vertical-direction can be expressed as
m y ¨ + c y ˙ + K y = F fluid y ^
where m, c and K are the mass, the damping coefficient, and the stiffness of the oscillation system, respectively. y ¨ , y ˙ and y are the acceleration, the velocity, and the displacement of the prism, respectively. y ^ is the unit normal vector in the transverse direction. Generally, Ffluid can be decomposed into viscous and inviscid components [29].
In this paper, the variation in damping coefficient is implemented by adjusting the load resistance RL in the power take-off system (PTO). The PTO has been introduced by Zhang [
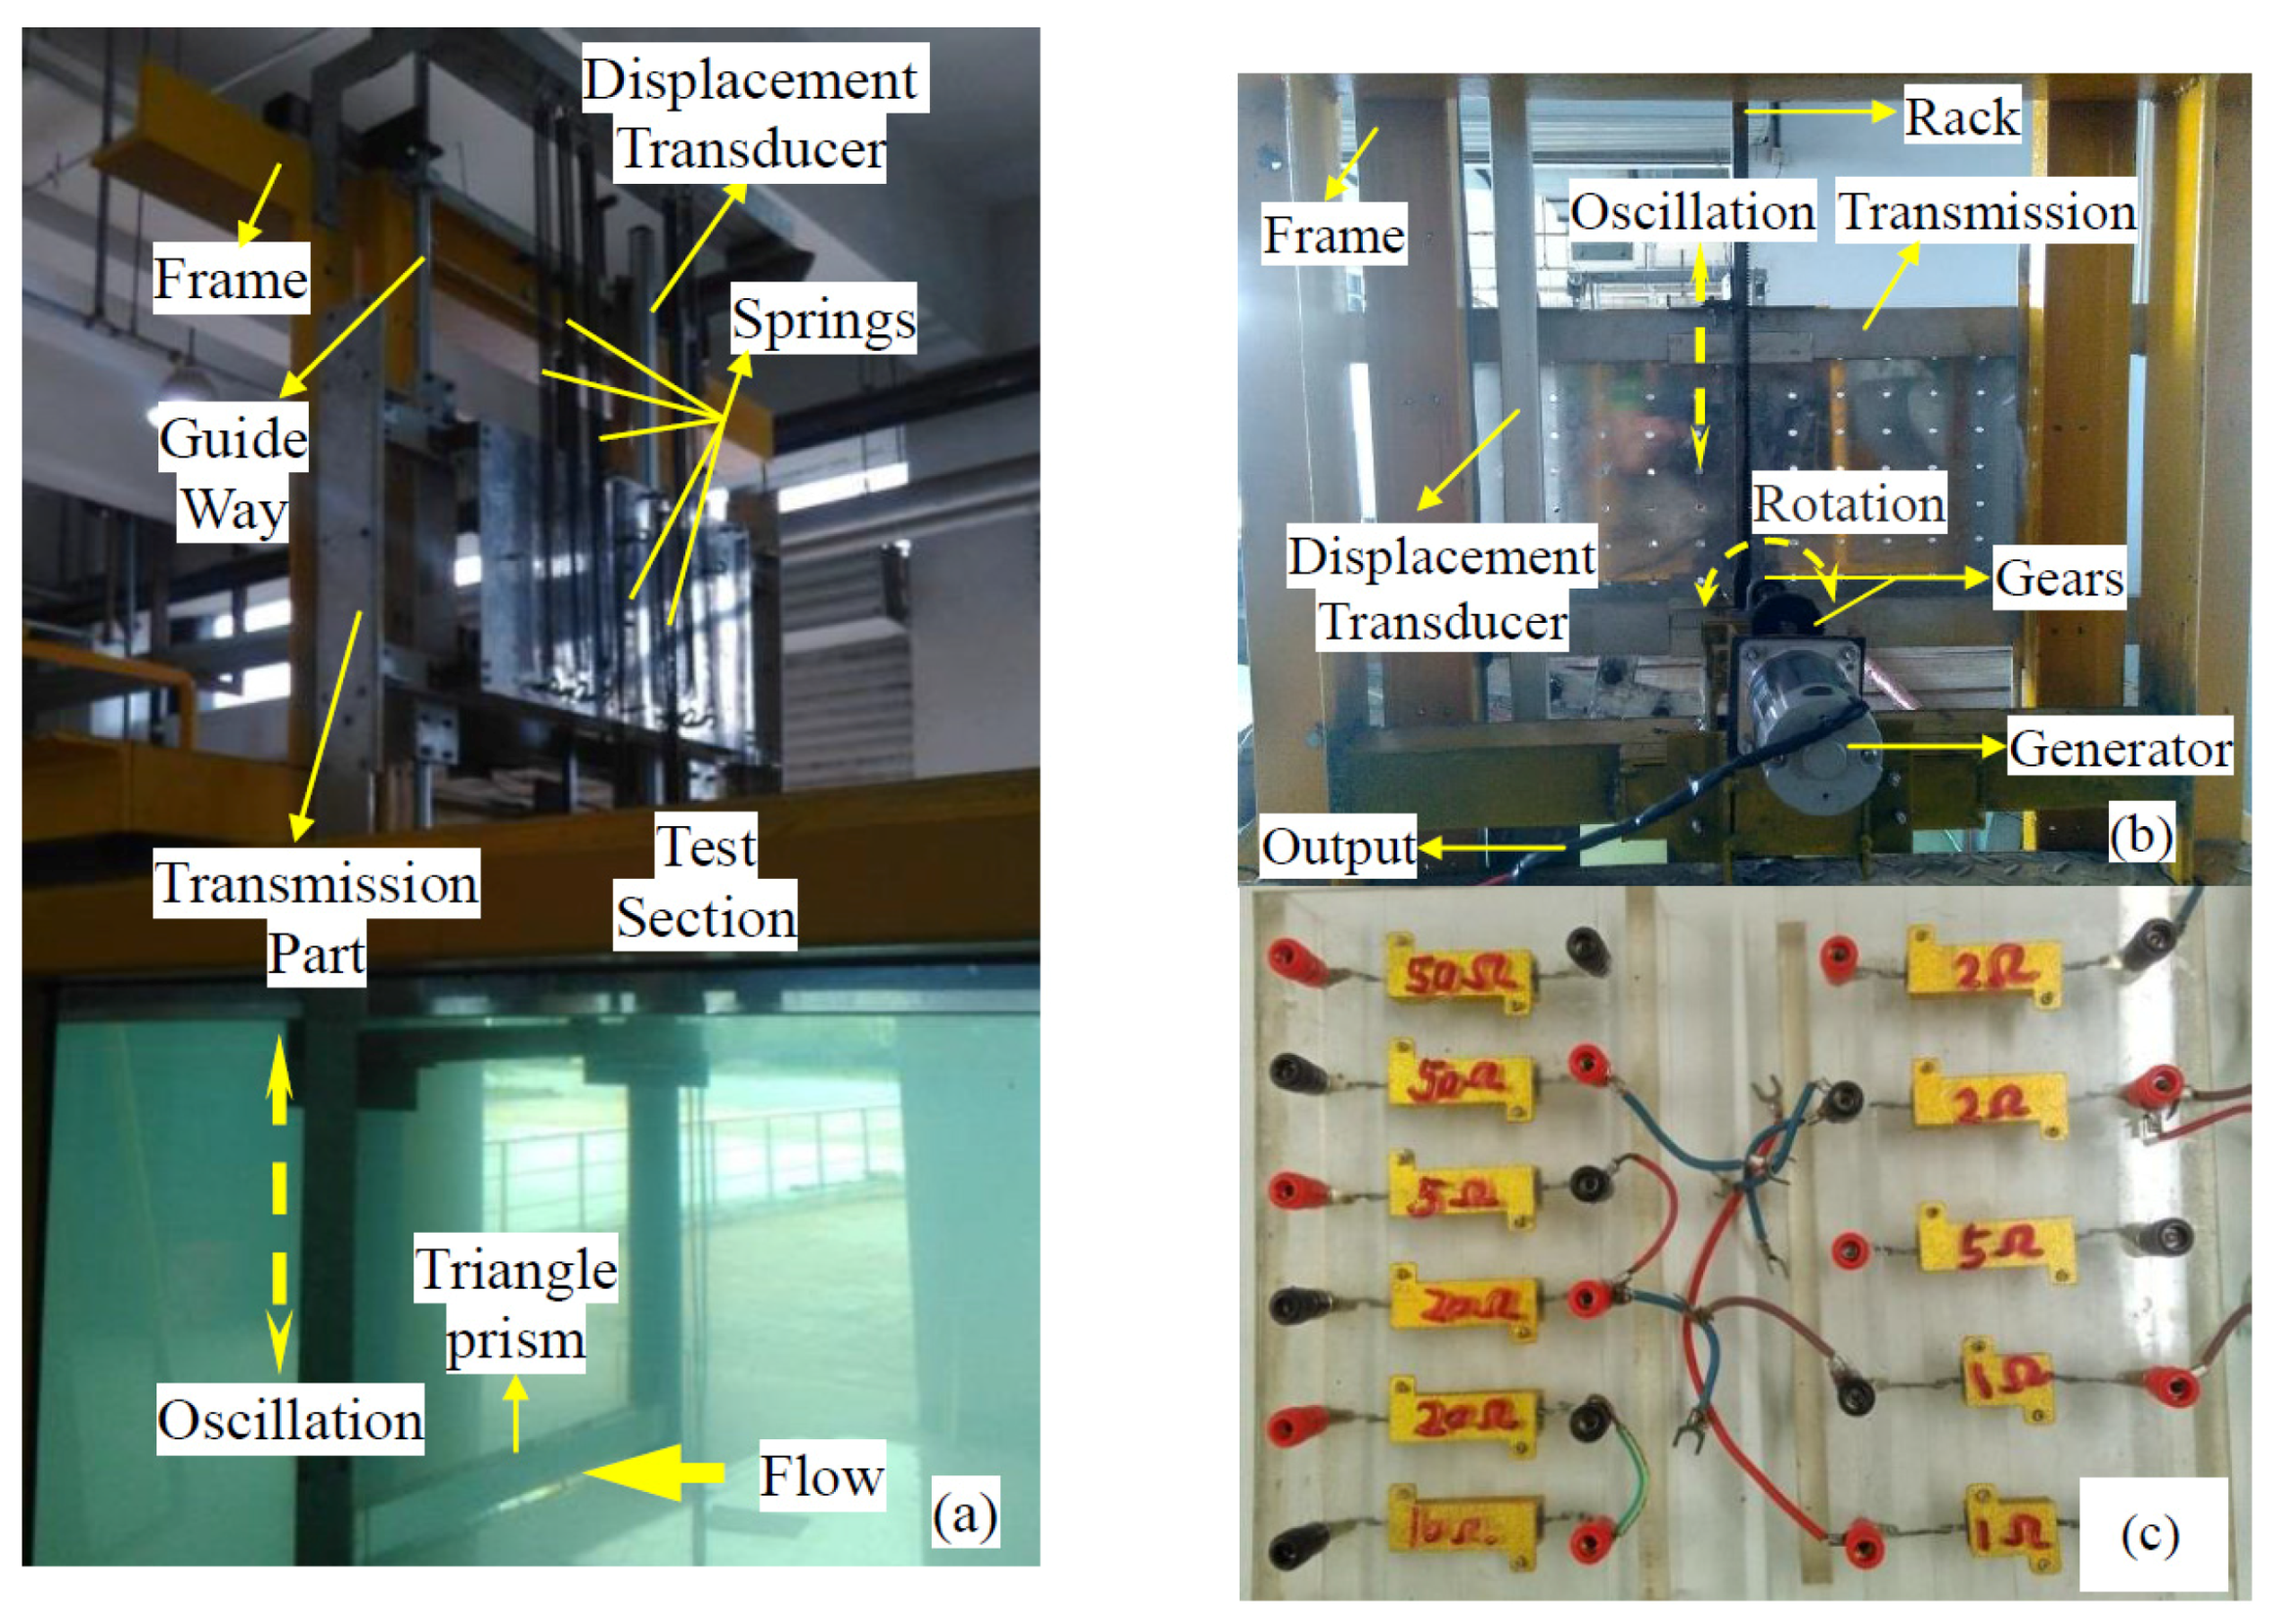
28]. The components of the PTO and the load resistance are illustrated in Figure 3b,c.
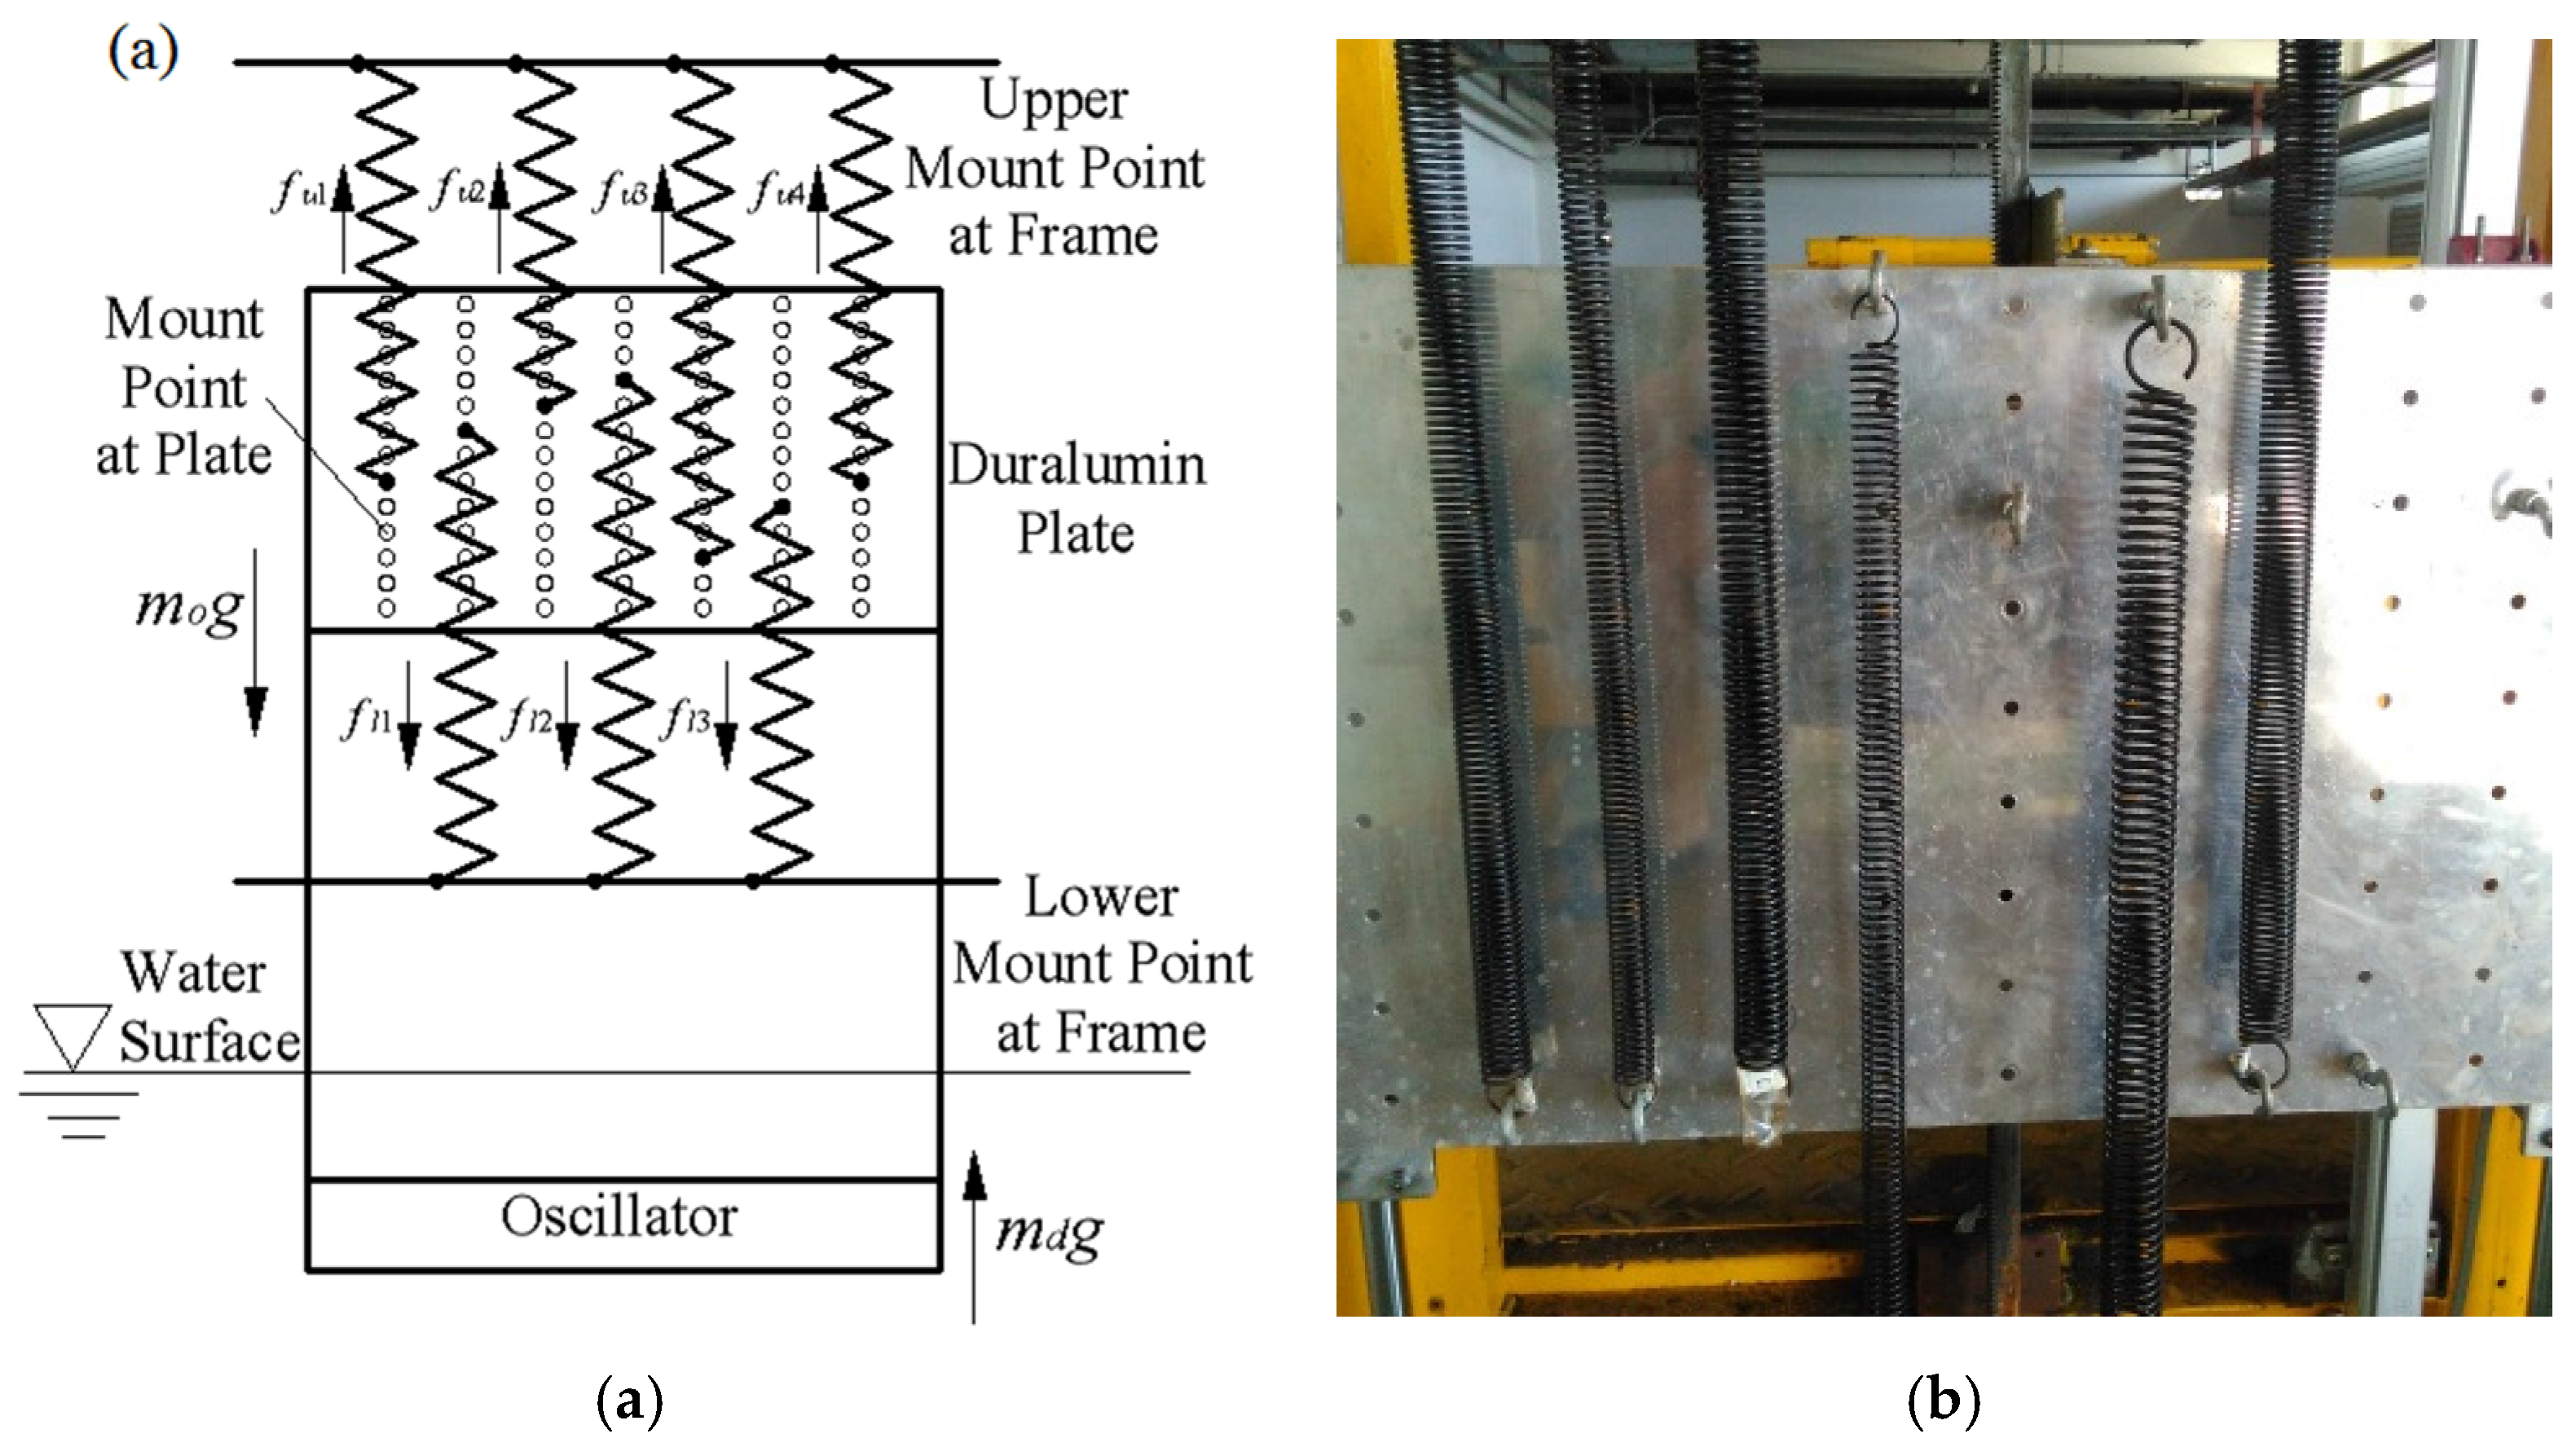
In the PTO system, the rack is fixed on the transmission, and meshes with gear group to convert the linear oscillatory mechanical motion of the prism in FIM to a rotational oscillatory motion of gear. In addition, the gear group meshes with the gear of the generator to drive the rotor to rotate. When a generator runs, the wire loop, which is cutting across the magnetic induction lines, yields an induction current, resulting in an electromotive force that always resists the motion of the oscillator. As the magnitude of the electromagnetic force depends on the rotational motion of the rotor, which is related to the motion of the prism, the electromagnetic force can be regarded as part of the system damping force. In summary, the motion of the spring-mounted triangular prism with PTO can be simplified as in Figure 4.
The system damping coefficient c, which is the sum of mechanical damping coefficient cm and the electromagnetic damping coefficient ce, can be expressed as the following equation.
c = c m + c e
The mechanical damping coefficient cm is dependent on the mechanical friction in the gears, the PTO system and linear bearings. The electromagnetic damping coefficient ce, which includes the generator damping coefficient cgen and harness damping coefficient charn, is dependent on the generator internal resistance R0 and the external load resistance RL. The expression of ce can be written as
c e = c gen + c harn = β 2 B 2 l 2 R 0 ( R 0 + R L ) 2 + β 2 B 2 l 2 R L ( R 0 + R L ) 2 = β 2 B 2 l 2 R 0 + R L
where B is the magnetic flux density, and l is the length of the wire cutting the magnetic field perpendicularly to the field lines. β is the speed ratio of gear group, which is associated with the radius of the gears and rotor.
In order to simplify the following analysis, two dimensionless parameters are introduced for the first time in this paper: the load resistance ratio R * and the short circuit equivalent damping coefficient c 0 * .
R * is the ratio of external load resistance RL to the inner resistance of the generator R0, which can be expressed as
R * = R L / R 0
c 0 * is the ratio of system damping coefficient c at the short circuit (S/C) case to the mechanical damping coefficient cm , which can be expressed as
c 0 * = c c m | R L = 0 = 1 + β 2 B 2 l 2 c m R 0
Substituting Equations (3)–(5) into Equation (2), the simplified equation of the system damping coefficient c can be obtained as
c = c m ( R * + c 0 * R * + 1 )
As shown in Equation (6), in the oscillation system with PTO, the system damping coefficient c is a function of parameters cm, c 0 * and R * . cm and c 0 * are related to the system itself and can be regarded as the internal factors. R * is impacted by the external load resistance and can be regarded as the external factor. In the present experiment, PTO is based on a fixed-magnetic generator, cm and c 0 * consequently maintain constants. Therefore, c is just a function of R * , illustrating that the variation in c can be achieved by adjusting R * .
Furthermore, the radius and the rotational inertia of the gears and rotor in PTO system have a great influence on the mass of the oscillation system. Zhang [28] has proved that this impact can be considered as an equivalent mass m eqe . Hence, the mass of oscillation system can be expressed as
m = m o + m eqe
where m o is the original mass of the oscillation system, which is the sum of prism mass m pri , mass of transmission m tra , and one-third of the spring mass m spr [23].
The physical parameters were verified by free-decay tests prior to the experiments. All the damping tests were performed in air at K = 1200 N/m and mo = 16.622 kg. The average measured value of inner resistance of the generator R0 is 3.3 Ω.
In the test process, every configuration was repeated four times to guarantee the accuracy of results. The final results were determined using a simple averaging method. According to the measured displacements, the system damping ratio ζ could be calculated using the logarithmic decrement method:
ζ = ln η 2 π = 1 2 π ( A i A i + 1 )
where Ai denotes the amplitude in the ith peak of displacement.
Additionally, the natural frequencies fn were extracted from the time histories of the displacements using FFT (Fast Fourier Transformation). Since the prisms are immersed in air, the added mass can be negligible due to the low density and the viscosity of air. The mass of oscillation system can be calculated by the following expression.
m = K / ( 2 π f n ) 2
The damping coefficient c of the oscillation system can be calculated by the following expression.
c = 2 ζ m K
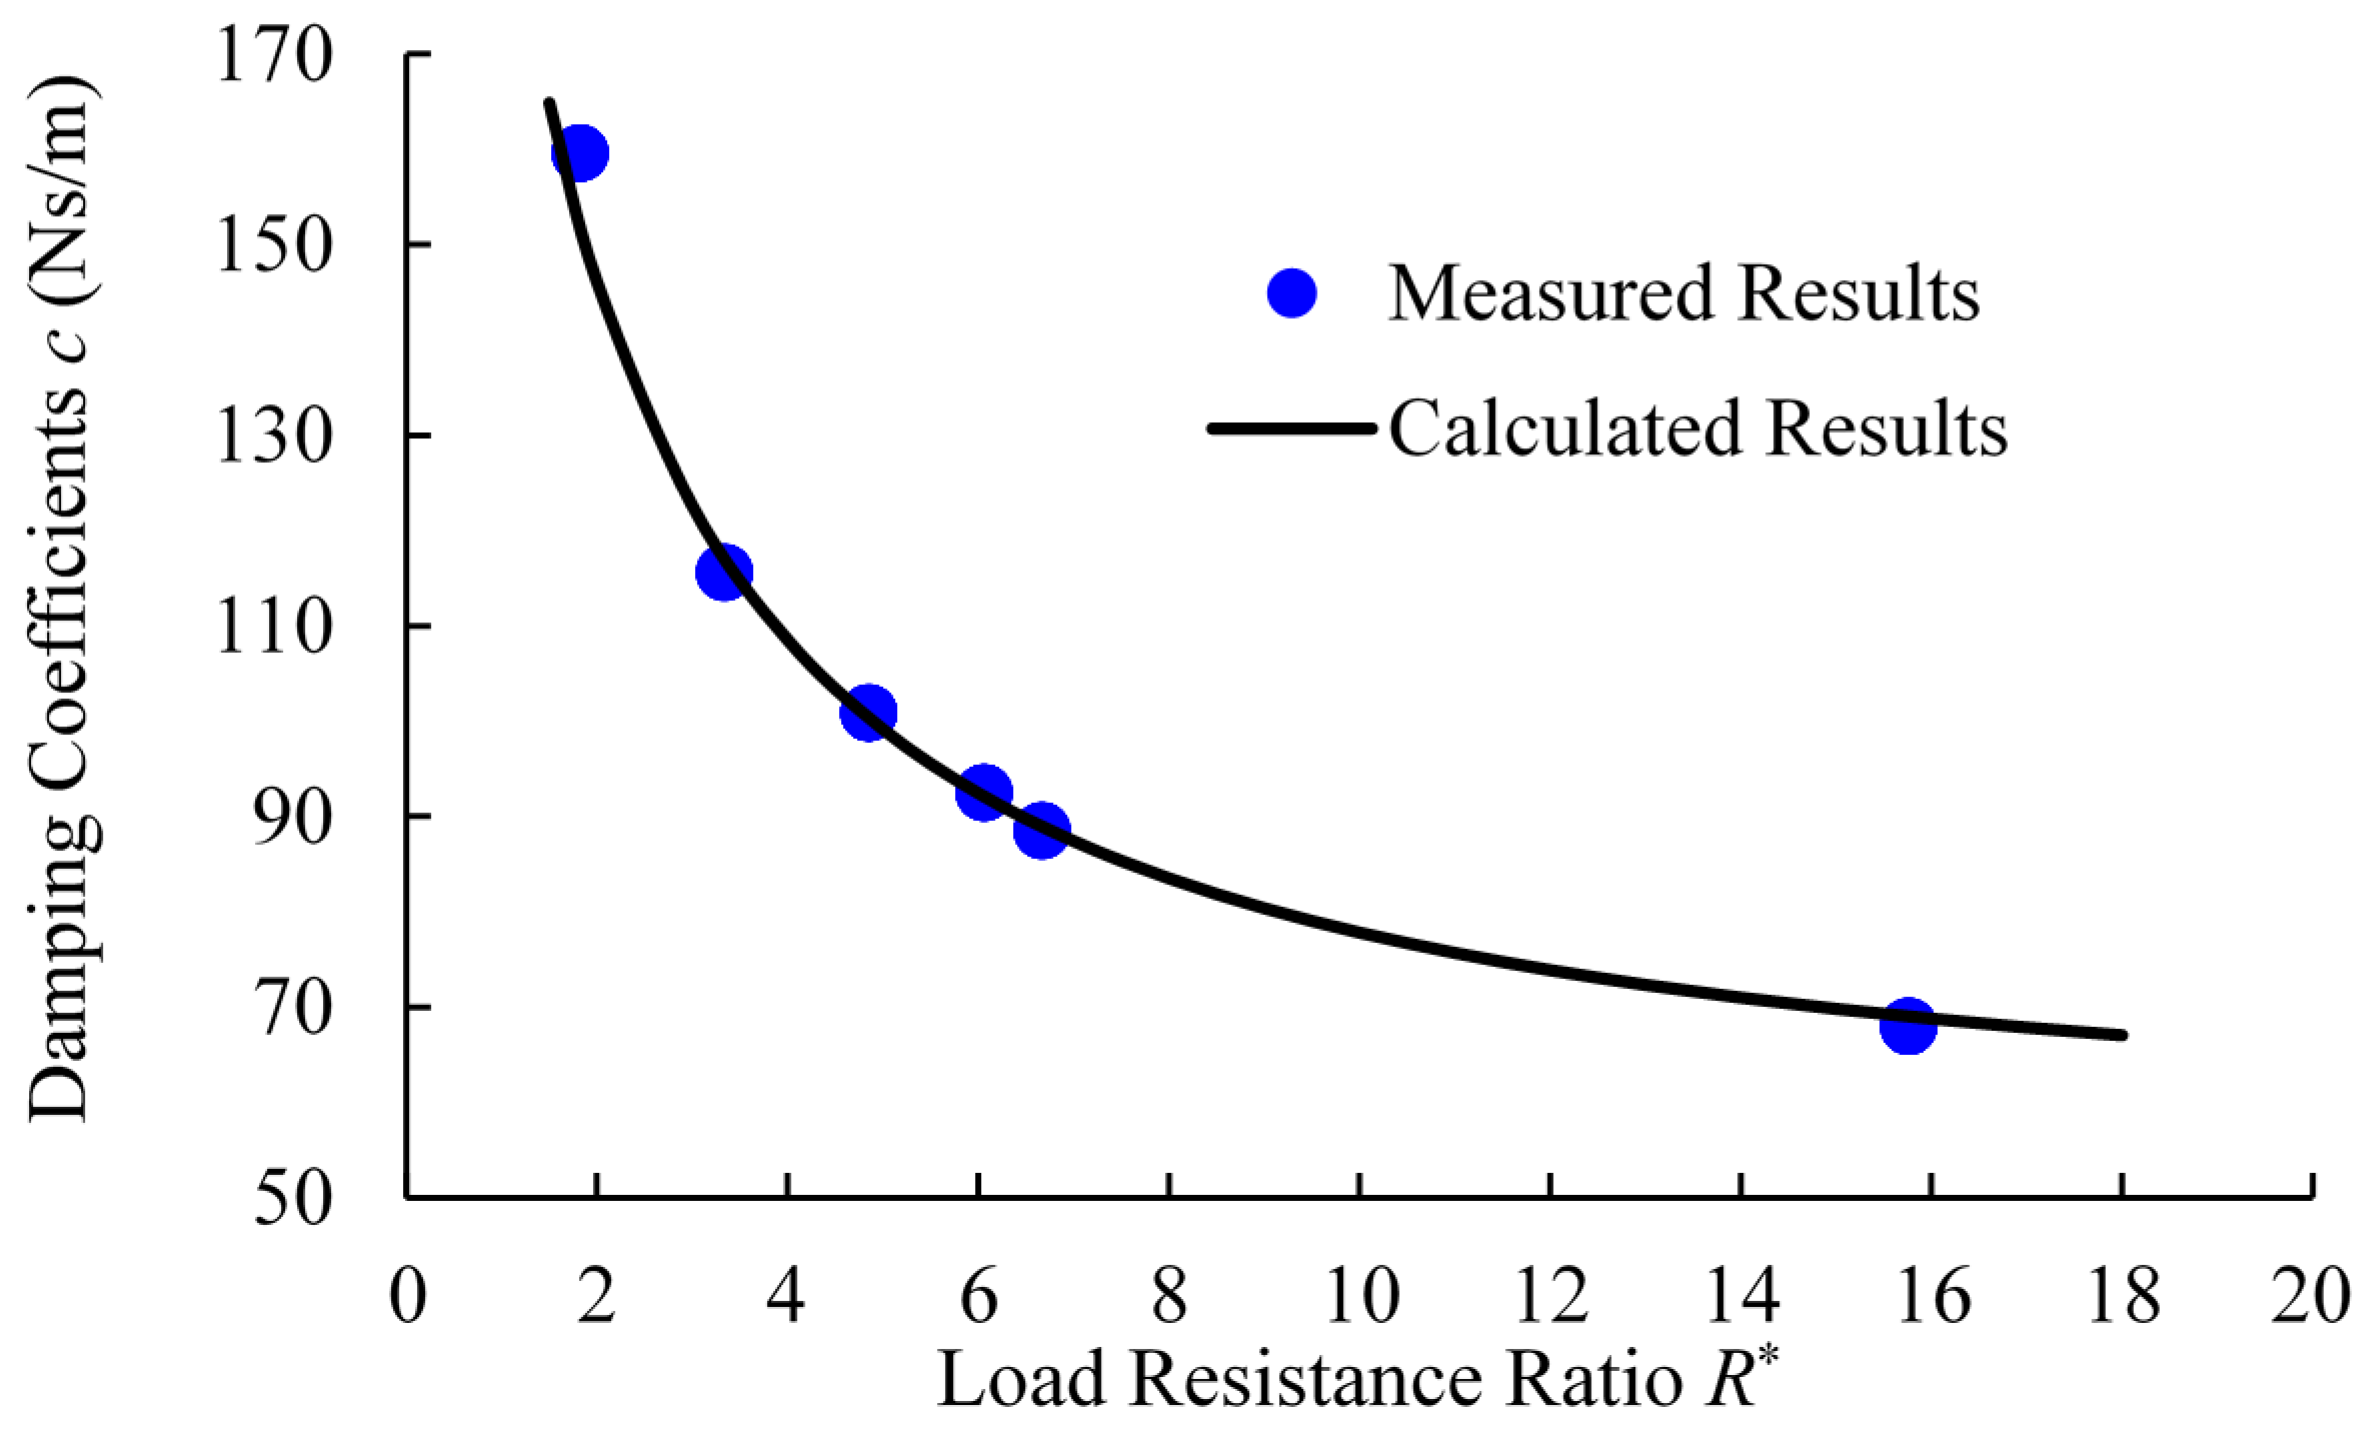
The results of free-decay tests are listed in Table 1 and Figure 5. In the table, the external load resistance RL, the damping ratio ζ, and the natural frequency fn are measured; the load resistance ratio R*, mass of the oscillation system m, damping coefficient c, and the short-circuit equivalent damping coefficient c 0 * are calculated using the measured data.
As shown in Table 1, m and c 0 * remain approximately constant when R* varies from 6 to 52 Ω. The average of m is 32.90 kg, and the average of c 0 * is 6.393. The mechanical damping ratio ζm can be obtained at the open circuit (O/C) case where R* goes to infinity. The value of ζm is 0.132, which is also presented in Table 1. Then the mechanical damping coefficient cm can be calculated as 52.22 N·s·m−1. The trends of c versus R* based on the test results and calculated results are plotted in Figure 5. The calculated results are obtained by Equation (6). The two curves agree very well.
The above results from the free-decay tests indicate that using the PTO to control the damping coefficient is reasonable.

2.4. Variation in Stiffness

In most of the previous studies [5,6,7], the variation in system stiffness is achieved by adjusting physical springs. But the change of springs has a great impact on the equilibrium position of the prism immersed in water due to the buoyancy and gravity. In order to solve this problem, some scholars changed the layout of the direction of the cylinder, and some developed virtual system such as VCK (virtual damper-spring system) [30,31] to vary system stiffness.
In the present investigation, a new spring system is established to solve the problem mentioned above. The components of the system are shown in Figure 6. A duralumin plate is rigidly fixed on the transmission. Multiple columns with equally spaced mount points are arranged longitudinally on the duralumin plate. The corresponding mount points are also arranged at the upper section and lower section of the frame. The upper mount point, the mount points in the columns, and the lower mount point are in a vertical line. During the experiment, the upper side of the lower springs and the lower side of upper springs can be selected as the best mount point to suspend.
According to the linear superposition principle of spring stiffness, different system stiffnesses can be implemented by using different groups of springs. The stiffness of a spring group with n springs is the sum of each spring stiffness kspr,i. The requirements in the following expressions need to be satisfied by hanging the springs.
i = 1 N f u i j = 1 M f u j = ( m o m d ) g
f u i = k u i Δ x u i ;   f l i = k l i Δ x l i
i = 1 N k u i + j = 1 M k u j = K
where kui and klj denote the stiffness of the ith upper extensional spring and jth the lower extensional spring, respectively. Δxui and Δxlj denote the extended lengths of the ith upper extensional spring and jth the lower extensional spring, respectively. N and M denote the total numbers of the upper extensional springs and the lower extensional springs. md is the displaced mass of the prism [23].
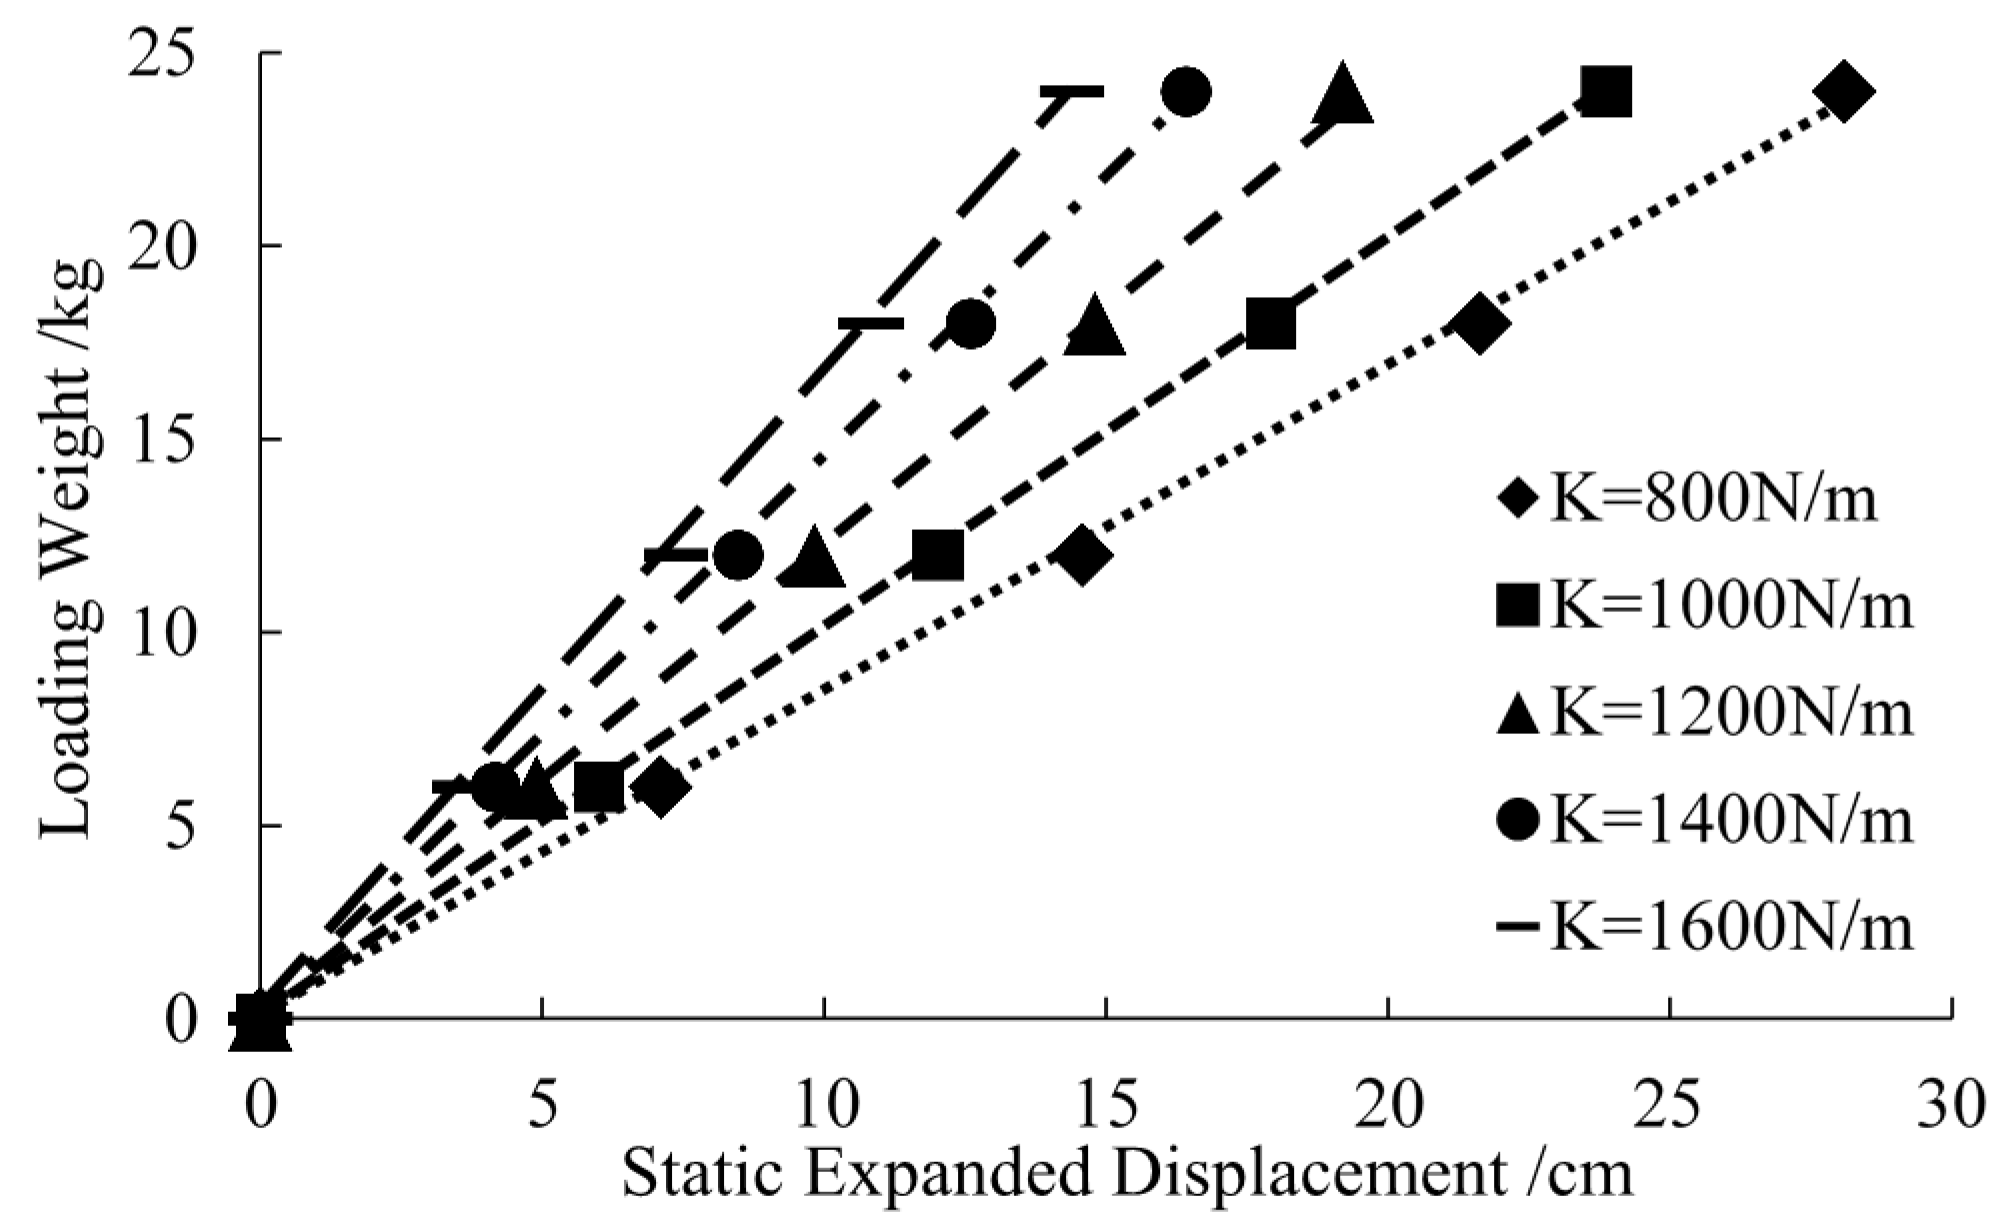
In order to ensure the accuracy of the spring system, the linearity of five spring groups were verified by loading different weights. The weight varied from 0 to 24 kg, and the variations of the loading weight versus the measured static expanded displacement in different configurations are depicted in Figure 7. The relationships between the loading weight and static expanded displacement are obviously linear, indicating that the stiffness has a great linearity.
The mechanical damping ratios ζm, the mechanical damping coefficients cm, the natural frequency of the oscillation system fn, and the mass of oscillation m are verified using the free-decay tests as well. All the tests were performed in air at the open circuit (O/C) configuration. The original mass mo is 16.622 kg, and the test methods and the calculation of the corresponding parameters are all similar to the description in Section 2.3. The results are listed in Table 2. As the system stiffness K varies from 800 to 1600 N/m, the mechanical damping ratio ζm decreases, the natural frequency fn increases, while the mechanical damping coefficients cm and the mass of oscillation system m remain approximately constant. The averages of cm and m are 51.258 N·s·m−1 and 32.90 kg, respectively. In summary, all the above results indicate that the variation in stiffness using the spring system is reasonable.

2.5. Variation in Mass

In the present experiments, the variation in mass is achieved by adding or subtracting additional weight. The material of the additional weight is high-density lead in order to reduce the space occupied by the weight. Moreover, the additional weight is fixed in the center of the transmission part by screws to keep balance of the oscillation system.
Just as in Section 2.4, the mechanical damping ratios ζm, the mechanical damping coefficients cm, the natural frequency of the oscillation system fn, and the mass of the oscillation m are verified using the free-decay tests. The test methods, test configurations and calculations of corresponding parameters are all the same as those in Section 2.4. The results are listed in Table 3, in which mo-cal is the calculated original mass calculated by the following expression.
m o-cal = m m add
where, madd is the mass of the additional weight illustrated in Table 3.
In Table 3, as the mass of the additional weight madd varies from 0 to 11.73 kg, the mechanical damping ratio ζm and the natural frequency fn both decrease, the mass of oscillation system m increases, while the mechanical damping coefficients cm and the calculated original mass mo-cal remain approximately constant. The averages of cm and mo-cal are 52.485 N·s·m−1 and 16.49 kg, respectively. mo-cal is very close to mo, which is measured as 16.622 kg.
The above results indicate that the variation in mass of oscillation using the additional weight is reasonable.
In this paper, the displaced mass md of the regular triangular prism is 3.897 kg. The mass ratios can be obtained and the details are presented in Table 3.

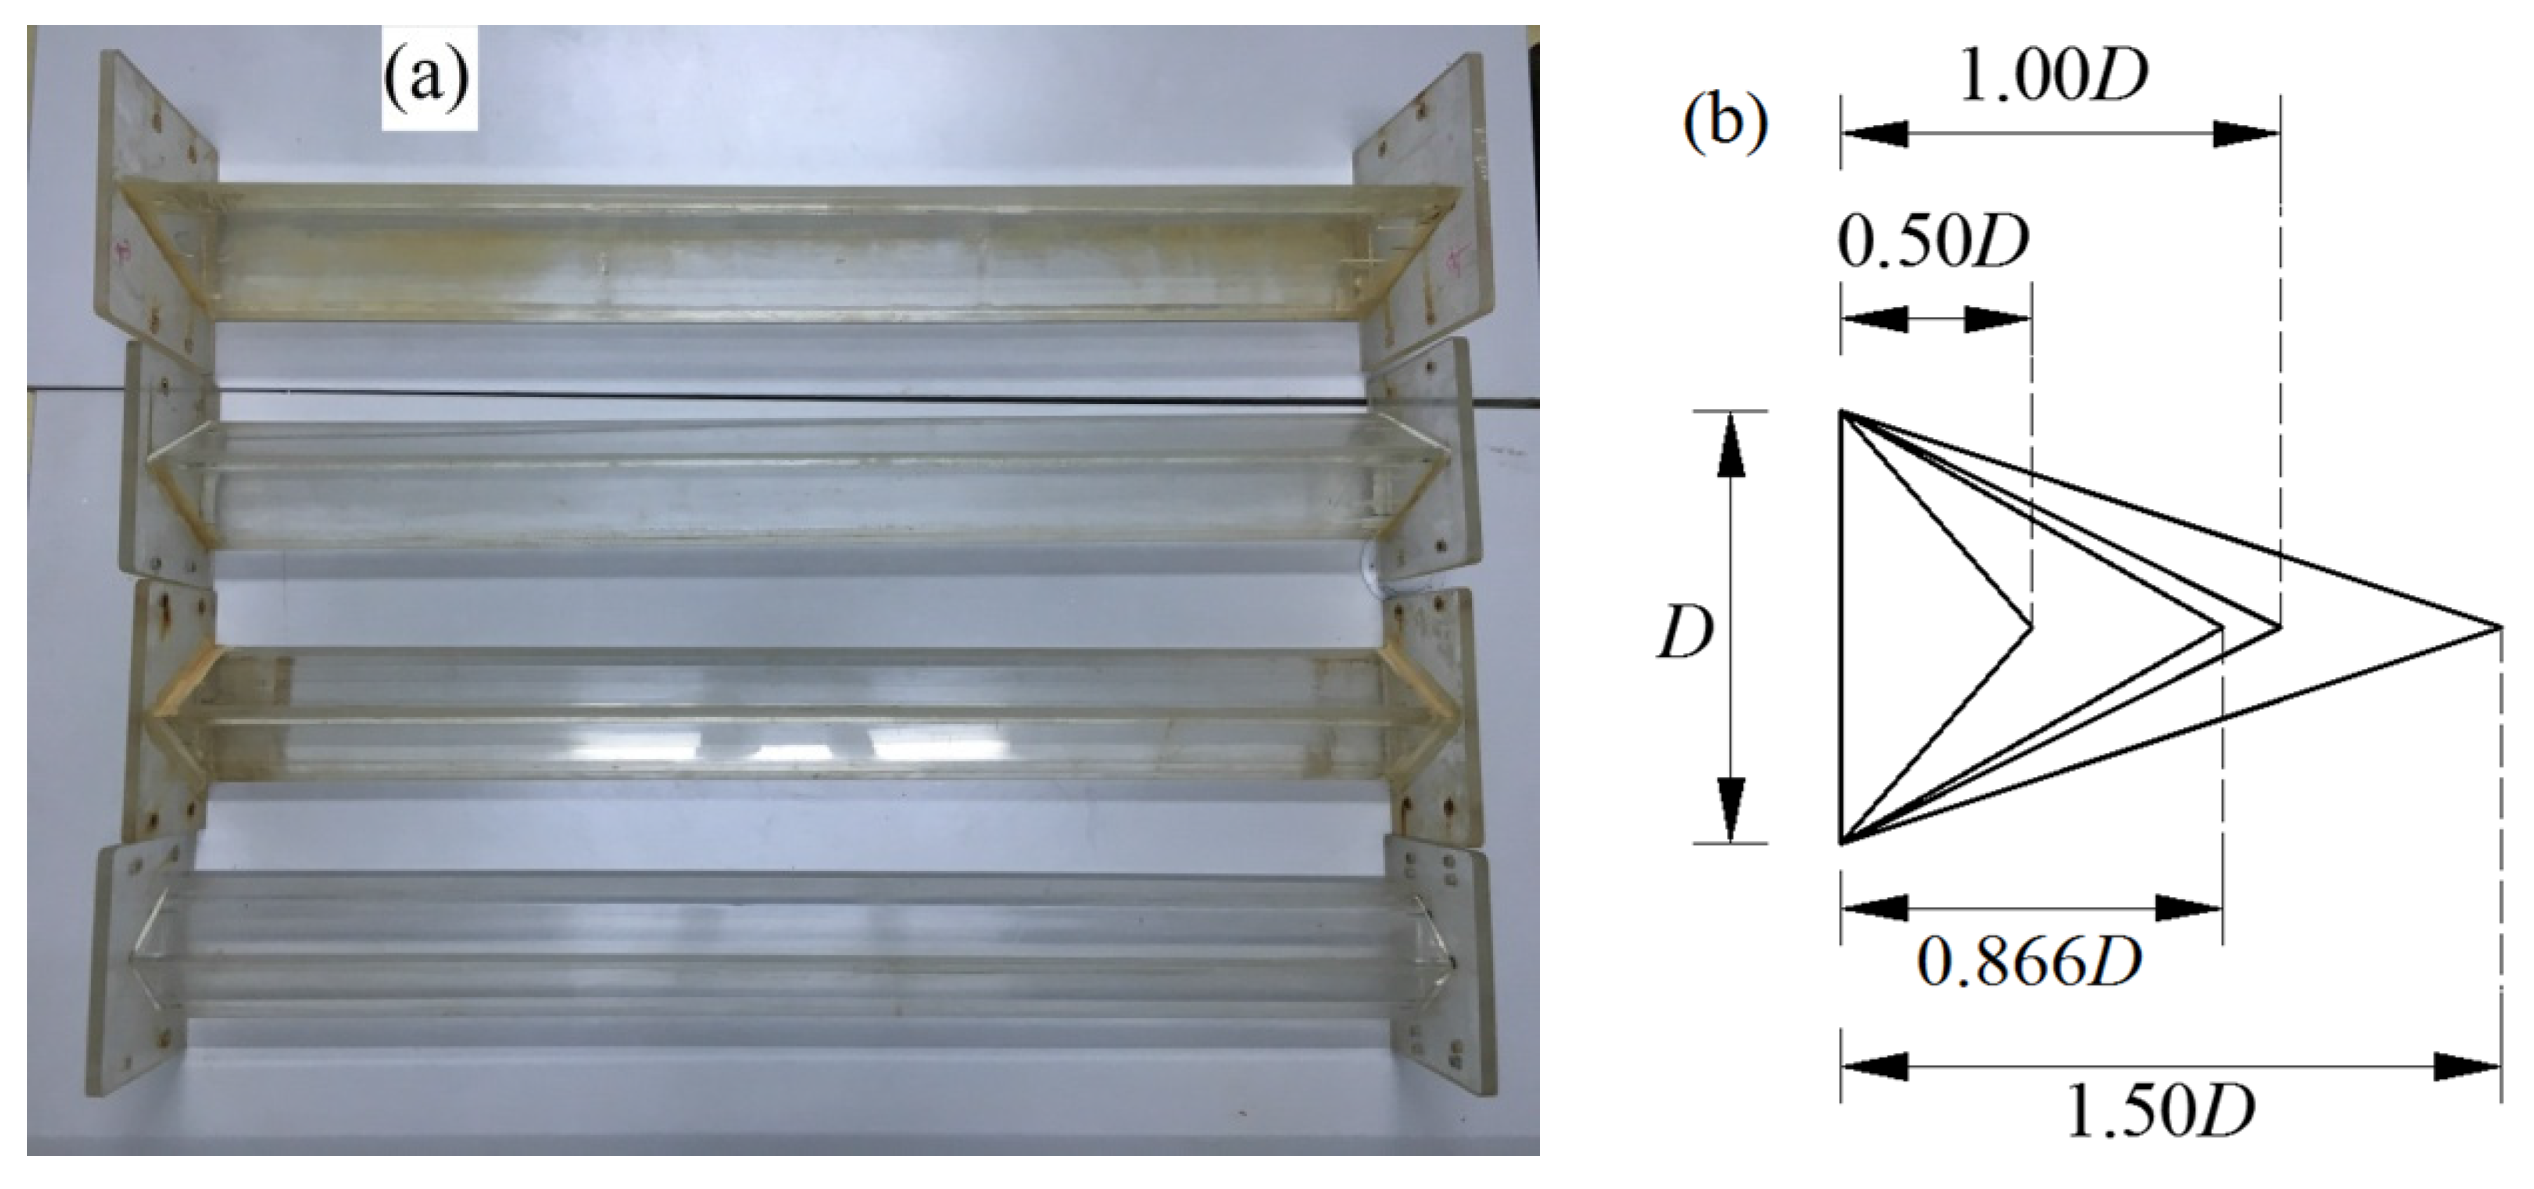
2.6. Triangular Prisms and Validation

The experimental prisms are all isosceles triangular prisms made of 10 mm Plexiglas plate. The characteristic dimensions D of the prisms are all 10 cm; the lengths L are approximately 0.9 m. In order to reduce the boundary effects on the prisms, two end plates are attached on the two end sides of the prisms, and the gaps between the end plates and the walls of the channel are less than around 3 cm [32,33].
In this paper, the isosceles triangular prisms with different section aspect ratios α are investigated. The section aspect ratio α is the ratio of the height of the triangular cross-section to the length of the base.
α = H / D
Four triangular prisms with different section aspect ratios—0.5, 0.866, 1 and 1.5—are produced. When the aspect ratio is α = 0.866, the section of the prism is the regular triangular. The prisms and the variation of aspect ratios are shown in Figure 8.
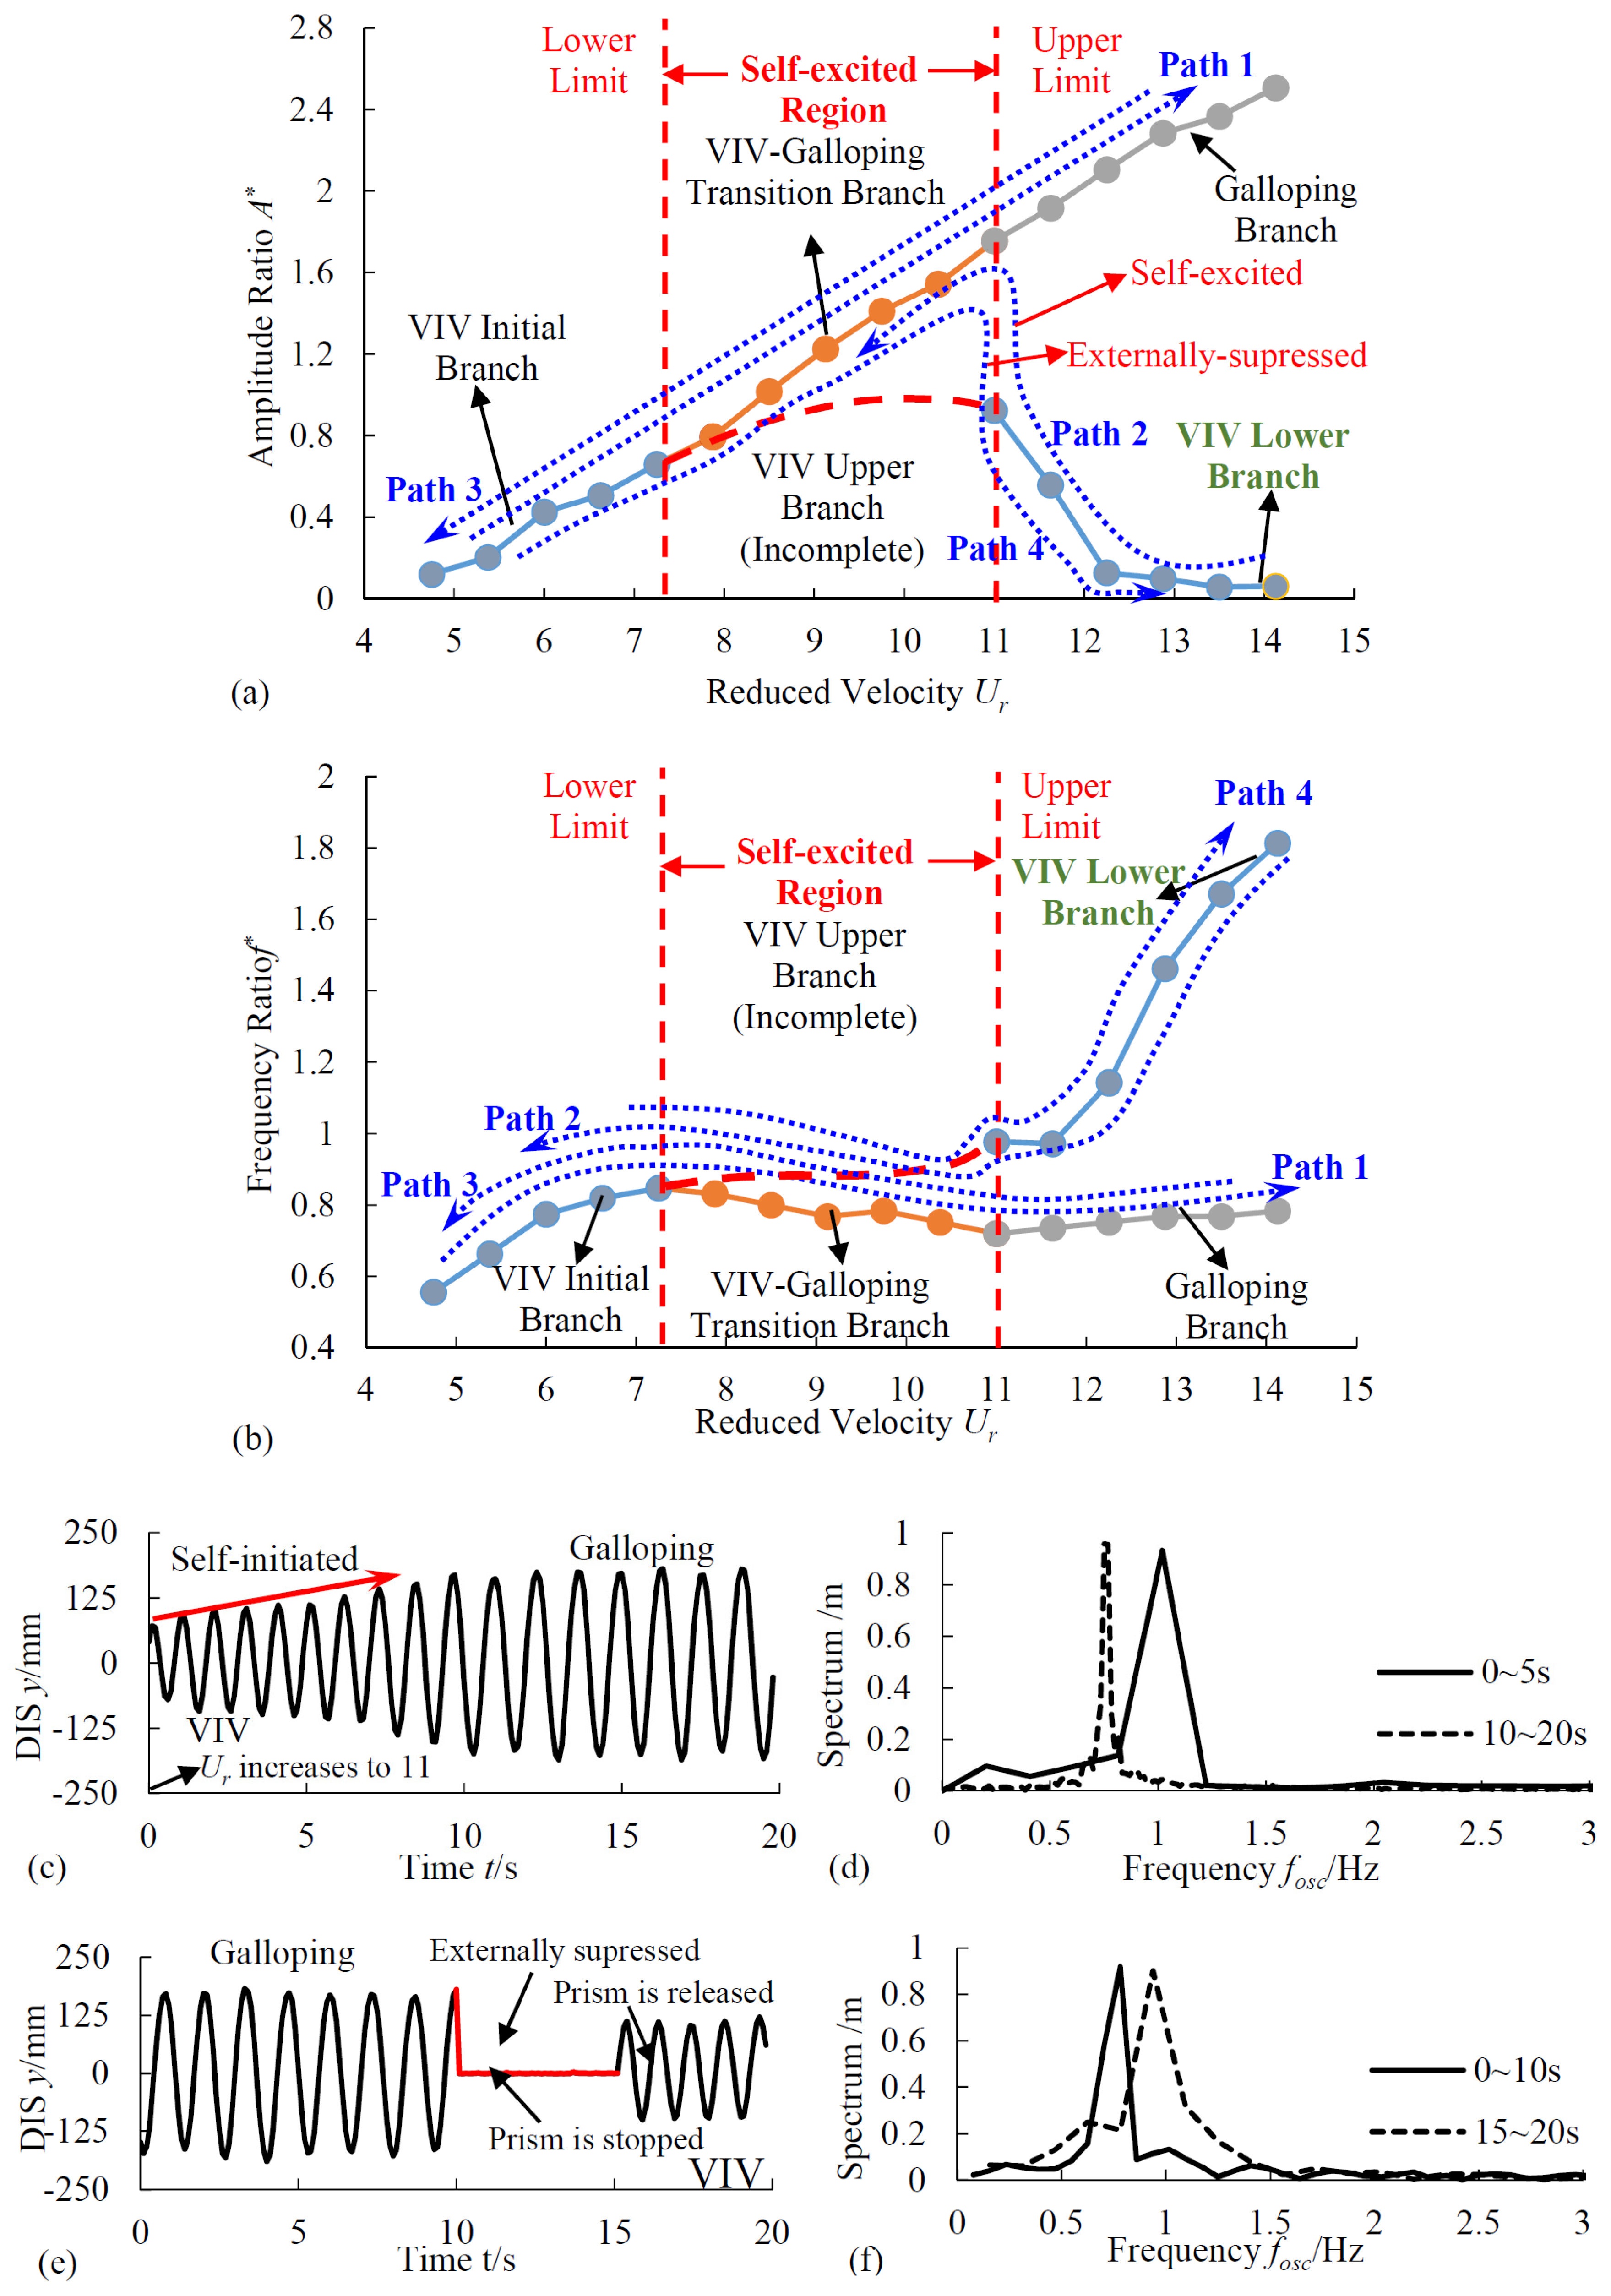
For triangular prisms, the incident angles strongly affect the responses because of the non-axis symmetry of the cross-section. This paper does not focus on the influence of incident angles of the oscillation, so only one incident angle, in which the base of the cross-section is vertical to the coming flow, is taken into account. Fully developed transverse galloping can be achieved at this incident angle when the flow velocity is high enough.
It should be noted that the differences in section aspect ratios may cause the differences in oscillation mass. In order to keep the same natural frequency fn for different prisms, additional weights are used to balance the differences in the prisms’ mass.
In the present experiment, we used the established oscillation system, which had been introduced by Zhang et al. [28]. The details of validation had also been described in Zhang et al.’s research [28].

3. Results of Complete Soft Galloping (SG) Responses and Complete Hard Galloping (HG) Responses

In previous studies, SG and HG responses of triangular prisms were observed by increasing the flow velocity. Few studies concentrated on the responses of decreasing the flow velocity or applying external excitation. In this section, the FIM experiments of triangular prisms were performed under the conditions of increasing and decreasing flow velocity and conditions of applying or not applying external excitation. In-depth analysis of the complete responses of SG and HG are conducted.

3.1. Soft Galloping (SG)

Figure 9 shows the typical complete SG responses of a regular triangular prism. The physical parameters corresponding to the SG responses are listed in Table 4. The descriptions of A*, f* and Ur are listed in the Abbreviations.
According to Figure 9, several typical SG response paths can be summarized as follows.

3.1.1. Response Path 1: Increasing Velocity and No Manual External Excitation

As the flow velocity increases, the triangular prism enters into the vortex-induced vibration (VIV) initial branch, followed by the VIV-galloping transition branch and finally the galloping branch, accompanied with a monotonically increasing amplitude. In the response path, the galloping can be self-excited by the VIV. For 4.75 < Ur < 7.25, A* and f* are both small but increase rapidly, indicating that the prism undergoes the VIV initial branch. The oscillation is induced by the vortex shedding, but the oscillation and vortex shedding are not synchronized well. When Ur increases to the range 7.25 < Ur < 11, A* continuously increases from 0.66 to 1.76, f* increases to the maximum value 0.848 and then starts reducing, indicating that the prism undergoes VIV upper branch changes and initiates changes from VIV to galloping (VIV-galloping transition branch). The oscillation is induced by the combined forces of vortex shedding and unstable lift. When Ur > 11, A* remains the monotonically increasing trend without any sign of suppression. Meanwhile, f* levels at approximately 0.76, albeit with a slightly increasing trend, indicating that the prism undergoes the galloping branch. The oscillation is mainly induced by the lift force instability. This SG response path with the above characteristics were also found by Ding [12], Zhang [13,28] and Yan [14].

3.1.2. Response Path 2: Decreasing Velocity and No Manual External Excitation

When the flow velocity reduces from a high velocity with no manual external excitation acting on the prism at the beginning, response path 2 can be observed. This response path is was found for the first time in the present experiment and has since been proven by numerous tests. When Ur is in the range of 12.25 < Ur < 14.125, A* is too small (only at 0.1–0.2) but f* >> 1. Then, as Ur is reduced to 11, A* is raised to 0.923, accompanied with a decrease of f* from 1.814 to 1, indicating that the prism undergoes the VIV lower branch. The oscillation is induced by the vortex shedding with a bad synchronization. As Ur is continuously reduced to 11, A* jumps up to 1.755, and f* drops to 0.720, indicating that the prism is spontaneously initiated from VIV (lower branch) to galloping. The transition process is clearly observed in Figure 9c,d. As Ur further decreases from 11 to 0, the prism undergoes the VIV-galloping transition branch followed by the VIV initial branch. The corresponding responses of A* and f* are the same as those observed in response path 1.
According to path 2, new conclusions can be drawn as follows: (a) In addition to the three branches mentioned in the previous studies [12,13,14,28], the VIV lower branch could also be observed in the SG responses of the triangular prism when the velocity decreases and no external excitation acts on the prism; (b) When the flow velocity is reduced to a specific value (Ur = 11 in the present experiment), the prism can also be self-initiated from VIV to galloping.

3.1.3. Response Path 3: Decreasing Velocity and Applying a Threshold Initial Displacement

When the flow velocity reduces from a high value, and the prism is manually pushed by a threshold initial displacement (exceeding 1 × D), a large amplitude (A* ≈ 2.6) and low frequency (f* ≈ 0.7) can be observed, indicating that the prism is undergoing the galloping branch. Then as Ur decreases, A* monotonically decreases, and f* slightly decreases to 0.720 and then increases to 0.832 and rapidly drops finally. This reveals that the prism experiences the galloping branch, the VIV-galloping branch and VIV initial branch successively. It is noted that the response path 3 is completely coincident with path 1 but in the opposite direction.

3.1.4. Response Path 4: Increasing Velocity and Applying an External Force at a Certain Velocity

When the flow velocity increases from 0, the prism first enters the VIV initial branch and then the VIV-galloping transition branch, which is similar to path 1. However, if there is an appropriate instantaneous external force acting on the prism to suppress its motion at a specific velocity (Ur = 11), the prism enters into the VIV lower branch, accompanied by a sudden collapsing in amplitude (A* is from 1.8 to 0.9) and a sudden jump in frequency (f* is from 0.7 to 1.0) (Figure 9d,e). Then for Ur > 11, even if Ur continues to increase, the prism cannot be self-excited to galloping. It can be seen that the responses in path 4 are completely coincident with those in path 2.

3.1.5. Summary

In addition to the four typical response paths mentioned above, there are lots of response paths in SG response. In all the response paths, an interesting Ur region, which is from 7.25 to 11, is observed. In this region, the prism can be self-excited from VIV to galloping in any cases. On the contrary, for Ur < 7 or Ur > 11, the prism cannot be self-excited from VIV to galloping. Especially for Ur > 11, the prism can go into the galloping branch by applying a threshold initial displacement. Therefore, the Ur region from 7.25 to 11 is the self-excited region where the prism can be self-initiated from VIV to galloping. Moreover, the flow velocities of Ur = 7.25 and Ur = 11 are the upper and lower limits of the self-excited region, respectively. It is noteworthy that the self-excited region has first been found in the present experiment and its upper and lower limits are the key characteristics to distinguish the SG and HG.
In conclusion, the complete response characteristics of SG can be summarized as follows: (a) The VIV lower branch can be observed in SG response; (b) The VIV upper branch cannot be observed due to the existence of the self-excited region (VIV-galloping transition branch); (c) When Ur is in the self-excited region, the prism has the ability to be self-initiated from VIV to galloping; and (d) When Ur exceeds the upper limit of the self-excited region, the prism loses its self-initiated ability.

3.2. Hard Galloping (HG)

Figure 10 shows typical complete HG responses of a regular triangular prism. The physical parameters corresponding to the HG responses are listed in Table 5. The descriptions of A*, f* and Ur are listed in the Abbreviations.
According to Figure 10, several typical HG response paths can be summarized as follows.

3.2.1. Response Path 1: Increasing Velocity and No Manual External Excitation

In response path 1, the triangular prism experiences the VIV initial branch, followed by the VIV upper branch and ending with the VIV lower branch, indicating that the prism only presents the characteristics of VIV, which is consistent with the response of a smooth circular cylinder reported by previous studies [14,23,24]. For 4.75 < Ur < 7.25, A* and f* are both small but increase rapidly, indicating that the prism undergoes the VIV initial branch. When Ur reaches the range of 7.25 < Ur < 11, A* first increases to the maximum value 0.710 and then decreases to 0.327 at Ur = 11. Correspondingly, f* is basically maintained at 1 with a slight upward trend, revealing that the prism undergoes the VIV upper branch (lock-in range) and is mainly driven by the lift forces of vortex shedding. For Ur > 11, A* rapidly collapses down to about 0.1 while f* increases rapidly (f* > 1). In this range, the oscillation and the vortex shedding are not synchronized well, demonstrating that the prism undergoes the VIV lower branch (desynchronization).

3.2.2. Response Path 2: Decreasing Velocity and No Manual External Excitation

When the flow velocity reduces from a high velocity with no manual external excitation has acted on the prism at the beginning, response path 2 can be observed. Obviously, response path 2 is completely coincident with path 1 but in the opposite direction. As Ur decreases, the prism experiences the VIV lower branch, the VIV upper branch and the VIV initial branch successively and presents the same characteristics in each branch as those in path 1.
We can conclude from response paths 1 and 2 that the triangular prism without external excitation cannot be self-excited from VIV to galloping, regardless of increasing or decreasing the flow velocity.

3.2.3. Response Path 3: Decreasing Velocity and Applying a Threshold Initial Displacement

When the flow velocity reduces from a high value (Ur = 14.125), and the prism is manually pushed by a threshold initial displacement (exceeding 1 × D), the prism first enters the galloping branch accompanied with a high A* (2.4) and a low f* (0.78). As Ur decreases from 14.125 to 11.625, A* monotonically decreases to 1.799, and f* basically maintains at 0.78 with a slight downward trend, indicating that the prism experiences the galloping branch. This characteristic is the same with SG response path 3 (shown in Figure 9). Nevertheless, when Ur is reduced lower than 11.625, the response of the prism is totally different from SG response path 3. When Ur reaches 11.625, oscillation is suddenly suppressed, the oscillation mode is dramatically transitioned from galloping to VIV, accompanied by a sudden collapse in A* from 1.799 to 0.184, and there is a sudden jump in f* from 0.78 to 1.029. The transition process is clearly observed in Figure 10c,d. As Ur continues to decrease, the prism experiences VIV upper branch and VIV initial branch and only presents the characteristics of VIV. It is noted that, even with a threshold initial displacement to push the prism for Ur < 11.625, the prism cannot be initiated to galloping.

3.2.4. Response Path 4: Increasing Velocity and Applying a Threshold Initial Displacement

When the flow velocity increases from 0, the prism first undergoes the VIV initial branch and then the VIV upper branch, which is similar to path 1. However, if a threshold initial displacement is given to push the prism at Ur = 11.625, oscillation is suddenly enhanced, the oscillation mode is dramatically transitioned from VIV to galloping (as seen in Figure 10e,f), accompanied by a sudden jump in A* from 0.184 to 1.799, and there is a sudden collapse in f* from 1.029 to 0.78. Response path 4 is completely coincident with path 3.

3.2.5. Summary

Similar to SG, besides the above four typical response paths, there are lots of response paths in HG as well. In all HG response paths, the lowest Ur for the onset of galloping is 11.625. This value has been verified by numerous tests. When Ur is less than 11.625, the prism only exhibits characteristics of VIV in all cases. When Ur exceeds 11.625 (including 11.625), the prism can be initiated to galloping by an appropriate instantaneous push on the prism. Therefore, Ur = 11.625 is the critical velocity needed to separate the galloping and VIV zones. In the galloping zone, galloping can be initiated by external excitation; while in the VIV zone, galloping cannot be initiated in any case.
In conclusion, the complete response characteristics of HG can be summarized as follows: (a) The VIV branches are complete, but the VIV-galloping transition branch and galloping branch are incomplete; (b) The self-excited region disappears, and a critical velocity appears instead; (c) The prism cannot be self-initiated from VIV to a galloping in any case; (d) When Ur is beyond the critical velocity, galloping can be initiated by appropriate external excitation.

4. Results of Oscillation Mode under Different Parameters

In Park’s [26] research, the SG and HG responses of the circular cylinder combined with PTC were observed at different levels of surface roughness. In Zhang’s research [28], two HG (HG1 and HG2) responses of triangular prism were observed due to the difference in system damping. Therefore, the mechanical parameters of the oscillation system and cross-section parameters of the prism inevitably have great impacts on the oscillation mode of the triangular prism.
It is well known that the core parameters of an oscillation system are the damping coefficient c, the system stiffness K and the mass of oscillation system m. Additionally, the cross-section parameter of triangular prism is considered as the section aspect ratio α. In this section, the impacts of the four parameters on the oscillation mode of the triangular prism are investigated by numerous tests and illustrated in Section 4.1, Section 4.2, Section 4.3 and Section 4.4. The evolution of the oscillation mode is summarized in Section 4.5 according to Section 4.1, Section 4.2, Section 4.3 and Section 4.4.

4.1. Different Damping Coefficients

The complete responses of the regular triangular prism at different damping coefficients c are plotted in Figure 11. Different damping coefficients were obtained by varying the load resistances of PTO. In this figure, the system stiffness K = 1400 N/m, the system mass m = 32.81 kg, the descriptions of A*, f*, Ur, LL, UL and CV are listed in the Abbreviations.
For 52.22 N·s·m−1c < 92.52 N·s·m−1, the complete galloping branches, the VIV-galloping transition branches and the self-excited regions can be clearly observed, whereas the VIV upper branches cannot be clearly observed. Moreover, as c increases, the VIV branches gradually become complete while the VIV-galloping branches get narrower and eventually disappear. Correspondingly, the LL (lower limit of self-excited region) increases from 6.625 to 7.875, but the UL (upper limit of self-excited region) decreases from 13.5 to 11, leading to the reduction of the self-excited region. It indicates that the prism in these damping cases experiences SG responses. Meanwhile, as the damping increases, the ability of triangular prism to be self-excited from VIV to galloping is weakened.
For 92.52 N·s·m−1 < c ≤ 225.85 N·s·m−1, the complete VIV branches—which consist of the initial branch, upper branch and lower branch, the incomplete galloping branches, and the critical velocity (CV)—can be clearly observed. On the contrary, the VIV-galloping transition branch and the self-excited region both disappear. Moreover, as c increases, the CV increases from 10.375 to 14.125, and the galloping branch is gradually narrowed and eventually disappears, thus revealing that the prism in these damping cases experiences the HG responses. Meanwhile, the ability of the triangular prism to be externally excited from VIV to galloping is also weakened as the damping increases.
For c = 92.52 N·s·m−1, an interesting response consists of the complete VIV branches, and the complete galloping branch can be clearly observed. In the response, VIV and galloping branches intersected at Ur = 9.125, accompanied by A*, essentially reaching the peak (0.876) of VIV branch and f* before starting to drop down to 0.832. In addition, exclusively at Ur = 9.125, the prism is self-initiated from VIV to galloping; for Ur > 9.125, the prism can be initiated to galloping only by an appropriate external excitation. Ur = 9.125 is actually the coincidence velocity of UL, LL and CV.
According to the definitions of oscillation modes in Zhang’s [28] research, in the present experiments, the oscillation mode at 92.52 N·s·m−1 < c < 225.85 N·s·m−1 is HG2, while the oscillation mode at c = 92.52 N·s·m−1 is HG1.
In the present study, the SG responses (52.22 N·s·m−1c < 92.52 N·s·m−1) are shown to have the VIV lower branch, and the VIV branches gradually become complete as the damping increases. Meanwhile, the HG responses (92.52 N·s·m−1 < c ≤ 225.85 N·s·m−1) exhibit the complete VIV branches. We can thus conclude that the HG1 mode is actually the critical oscillation mode between the SG mode and HG (or HG2) mode. This critical oscillation mode can be observed only at a certain condition. Therefore, HG1 can be renamed as critical galloping (CG).
According to the above analysis, the impacts of damping coefficients c on the oscillation modes of triangular prisms can be summarized as follows. When the damping is low, the oscillation mode of triangular prism is SG; as the damping gradually increases, the oscillation mode gradually transitions from SG to CG, followed by HG. Related to the oscillation mode, the corresponding characteristics presented in each mode can be summarized as follows: (a) As the damping increases, the LL increases although the UL decreases as well as the self-excited region. Until the oscillation mode is transitioned from SG to CG, the LL and UL coincide, the self-excited region disappears, and the CV occurs. As the damping continues to increase, the CV continues to increase; (b) As the damping increases, the VIV branches gradually become complete, while the VIV-galloping branch and galloping branch gradually become incomplete. As the damping increases to a high value, the galloping branch disappears due to the limitation of velocity range.
Therefore, the ability of the triangular prism to be excited (including self-excited and externally excited) from VIV to galloping is gradually weakened as the damping increases.

4.2. Different Stiffnesses

In order to reveal the impact of K on the oscillation mode, five complete responses of the regular triangular prism under different K are compared in Figure 12. In this figure, the system mass is m = 32.81 kg, and the damping coefficients are c = 92.52 N·m·s−1. The descriptions of A*, f*, Ur, LL, UL and CV are listed in the Abbreviations.
According to Figure 12, the following characteristics can be found.
For 800 N/m ≤ K < 1200 N/m, the prism undergoes the HG responses which consist of the complete VIV branches and incomplete galloping branches. In the responses, CV are observed, but the VIV-galloping transition branches and the self-excited regions cannot be observed. Moreover, as K increases, the CV drops from 11.625 to 10.375, and the galloping branch is gradually widened thereby modifying to low velocity, i.e., the ability of the triangular prism to be externally excited from VIV to galloping is enhanced as the stiffness increases.
When K increases to 1200 N/m, the prism exhibits the CG response which consists of the complete VIV branches and complete galloping branch. In the responses, CV is exactly equal to the coincidence velocity (Ur = 8.87) of UL, LL. Although self-excited regions still cannot be observed at this stiffness, the prism can be self-excited from VIV to galloping at the coincidence velocity Ur = 8.87.
When K enters into the range of 1200N/m < K ≤ 1600 N/m, the oscillation mode of the prism transitions from CG to SG. In the responses, the complete galloping branches and the VIV-galloping transition branches are observed. However, the VIV branches are incomplete. Moreover, as K increases, the LL decreases from 7.875 to 7.25 while the UL increases from 11 to 12.25, leading to the expansion of the self-excited region and illustrating that the ability of the triangular prism to be self-excited from VIV to galloping is enhanced as the stiffness increases.
According to the above analysis, the impacts of system stiffness K on the oscillation modes of triangular prisms can be summarized as follows. When the stiffness is low, the oscillation mode of triangular prism is HG; as the stiffness gradually increases, the oscillation mode gradually transitions from HG to CG, followed by SG. Therefore, the ability of the triangular prism to be excited (including the self-excited and externally excited) from VIV to galloping is gradually enhanced as the stiffness increases.

4.3. Different Masses

In addition to the damping and stiffness, the system mass m also plays an important role in the FIM performance of the triangular prism. In order to reveal the impact of m on the oscillation mode, three complete responses of the regular triangular prism under different m are compared in Figure 13. In this figure, the damping coefficients are c = 92.52 N·m·s−1, and the system stiffness K = 1400 N/m. The descriptions of A*, f*, Ur, LL, UL, and CV are listed in the Abbreviations.
According to Figure 13, the following characteristics can be found.
For m = 36.71 kg, the prism undergoes the SG responses which consist of the incomplete VIV branches, VIV-galloping transition branch and galloping branch. In the responses, the self-excited region is observed accompanied with LL = 7.875 and UL = 10.375.
When m increases to 40.61 kg, the prism exhibits the CG response which consists of the complete VIV branches and complete galloping branch. In the responses, UL and LL coincide at Ur = 8.5, which is equal to CV. Although the prism can be self-excited from VIV to galloping at Ur = 8.5, the self-excited region has already disappeared.
When m increases to 44.44 kg, the oscillation mode of prism transitions from CG to HG. In the responses, the complete VIV branches and the incomplete galloping branch are observed. Correspondingly, CV increases from 8.5 to 11.625.
According to the above analysis, the impacts of system mass m on the oscillation modes of triangular prisms can be summarized as follows. When the mass is low, the oscillation mode of is SG; as the mass increases, the oscillation mode gradually transitions from SG to CG, followed by HG. Therefore, the ability of a triangular prism to be excited (including the self-excited and externally excited) from VIV to galloping is gradually weakened as the stiffness increases.

4.4. Different Section Aspect Ratios

Several previous studies [17,18,19] have shown that section aspect ratio α has a great impact on the attack angle of the triangular prism, thus causing the change in the lift instability of the prism. In this section, four complete responses of triangular prisms with different α varying from 0.5 to 1.5 are compared in Figure 14. Especially the cross-sectional shape is the regular triangular when α = 0.866. In this figure, the damping coefficients are c = 100.92 N·m·s−1, the system stiffness K = 1200 N/m, and the system mass m = 32.81 kg. The descriptions of A*, f*, Ur, LL, UL, and CV are listed in the Abbreviations.
According to Figure 14, the following characteristics can be found.
For 0.5 ≤ α ≤ 0.866, the prism undergoes the HG responses which consist of the complete VIV branches and incomplete galloping branches. In the responses, the critical velocities (CV) are observed while the VIV-galloping transition branches and the self-excited regions cannot be observed. Moreover, as α increases, the CV drops from a high velocity (which cannot be measured due to the limitation of the velocity range) to 11.537, and the galloping branch is gradually widened and develops into a low velocity, thereby indicating that the ability of a triangular prism to be externally excited from VIV to galloping is enhanced as the section aspect ratio increases.
When α enters into the range of 1 ≤ α ≤ 1.5, the oscillation mode of the prism transitions from HG to SG. In the responses, the complete galloping branches and the VIV-galloping transition branches are observed and the VIV branches are incomplete. Moreover, as α increases, the LL decreases from a high velocity (which cannot be measured due to the limitation of the velocity range) to 11.846 while the UL increases from 7.208 to 9.104, leading to an expansion of the self-excited region and indicating that the ability for a triangular prism to be self-excited from VIV to galloping is enhanced as the section aspect ratio increases.
It is noted that CG is not observed at this case because of the limitation of the triangular prisms. According to the developments of the HG and SG with the variation of α, we can infer that CG should occur at the range of 0.866 < α < 1.
According to the above analysis, the impacts of section aspect ratio α on the oscillation modes of triangular prisms can be summarized as follows. When the section aspect ratio is low, the oscillation mode of triangular prism is HG; as the ratio gradually increases, the oscillation mode gradually transitions from HG to CG, followed by SG. Therefore, the ability of the triangular prism to be excited (including the self-excited and externally excited) from VIV to galloping is gradually enhanced as the section aspect ratio increases.

4.5. Conclusions on Oscillation Mode

According to Section 4.1, Section 4.2, Section 4.3 and Section 4.4, the evolution of the oscillation mode for triangular prisms with variations of dampings, stiffnesses, mass and section aspect ratios can be summarized in Figure 15. The corresponding characteristics of branches, self-excited regions, critical velocities, and the ability to be self-excited to galloping are also summarized in Figure 15.
As the damping and mass increase, or the stiffness and the section aspect ratio decrease, the oscillation mode of a triangular prism gradually transitions from SG to CG and continues to HG; the ability to be excited from VIV to galloping is continuously weakened. Correspondingly, the VIV branches, especially the VIV upper branch, gradually become complete; the galloping branch, including the VIV-galloping transition branch, gradually becomes incomplete. Meanwhile, the upper limit of the self-excited region decreases, the lower limit increases, the region narrows and gradually disappears. The critical velocity appears and gradually increases.

5. Discussion on Occurrence of SG and HG

In natural currents, such as streams, rivers, ocean currents or tides, the flow velocity is always changing. For the FIM power generation equipment, if the prism cannot guarantee a continuous good oscillation in different flow velocity, its energy is useless.
According to the previous analysis, the triangular prism cannot be self-initiated to galloping in HG response unless giving an external force; on the contrary, the prism can be self-initiated to galloping in SG response due to the self-excited region. Thus, for the energy conversion with fix-magnetic PTO based on triangular prism, the damping, stiffness, mass and section aspect ratio should be adjusted to ensure the prism presenting the SG response.
In this section, the reason for the onset of galloping and the occurrence conditions of SG and HG are discussed in order to guide the selection of parameters for energy extraction.

5.1. Direct Reason Why Onset of Galloping in SG Can Occur

The reduced velocity Ur and the amplitude ratio at the lower limit of self-excited region (or the onset of VIV-galloping transition branch) are listed in Table 6 according to Figure 11, Figure 12 and Figure 13.
The following results can be clearly summarized from Table 6. As c and m increase, or K decreases, Ur at the lower limit of self-excited region monotonically increases (from 6.625 to 9.125, from 7.25 to 8.867, from 7.85 to 8.5). On the contrary, regardless of the variations of c, K, and m, A* is always maintained at an approximate constant of 0.8. Actually, the two results reveal that the amplitude of VIV is a direct reason for the self-excited galloping phenomenon in SG response. When the amplitude reaches a sufficient high value of approximately 0.8, the prism starts to transition from VIV to galloping.
Since the VIV amplitude is the direct reason behind the induction of galloping in the SG response, the evolution of SG and HG can be explained as follows. As seen in Figure 11, Figure 12, Figure 13 and Figure 14, when c and m increase, or K and α decrease, A* at the same Ur in VIV branches reduces, resulting in the failure to induce galloping. As we know, VIV is a self-limited motion. When the response is in the initial branch and upper branch, the amplitude increases with the increase of velocity. When the response goes into the lower branch, the amplitude declines rapidly. If the amplitude can be increased high enough to induce the galloping before declining, the SG response can be observed. Otherwise, the galloping cannot be induced and the HG response is observed.
Therefore, the phenomenon of SG and HG observed by Park, and the phenomenon of HG1 and HG2 observed by Zhang, can all be explained by the amplitude of VIV.
It is noted that, for the prism at α = 1 and at α = 1.5, the onset amplitudes (A* = 0.730 and A* = 0.323) are lower than that at α = 0.866 (A* ≈ 0.8). This is mainly caused by the change of lift force owing to the change of wake mode. This issue will be discussed in detail in future studies.

5.2. Occurrence Conditions of SG and HG

It can be seen from the previous analysis that the self-excited characteristics of the galloping strongly depend on the amplitude of the vortex-induced vibration. Meanwhile, the amplitude of the vortex-induced vibration depends on the damping coefficient, stiffness, the mass of the oscillation system, and the section aspect ratio of the prism. In order to reveal the occurrence condition of soft galloping and hard galloping, a series of experiments with different configurations were conducted. The results are plotted in Figure 16.
In this figure, the ordinates are all damping coefficient c, the abscissas are the system stiffness K, the mass of oscillation m, and the section aspect ratio α, respectively. In the legends, H(V) and H represent the hard galloping. In H(V) region, no galloping branch can be observed in the range of test velocity, due to the limitation of the experimental setup. S represents the soft galloping and C represents the critical galloping. In the S region, the galloping can be self-excited by VIV. In the H and H(V) regions, the galloping cannot be self-excited by VIV, but can be excited by a given threshold’s initial displacement. In the C region, the galloping can be self-excited by VIV only at the critical velocity.
In the figure, as K increases from 800 to 1600 N/m, the corresponding c of CG gradually increases from 68 to 116 N·s·m−1. Meanwhile, as m increases from 32 to 45 kg, the corresponding c of CG gradually decreases from 96 to 72 N·s·m−1. Additionally, as α increases from 0.5 to 1.5, the corresponding c of CG rapidly increases from 48 to 192 N·s·m−1. These results indicate that a higher stiffness and section aspect ratio, or a lower mass will cause SG damping range expansion.
By analyzing the test data, the experiential expression to determine the occurrence of CG is obtained as follows
c c = 1.5 m d ( K m ) 0.766
cc is the critical damping coefficient. Once the section aspect ratio of the prism, stiffness and mass of the oscillation system are determined, the critical damping coefficient cc can be confirmed. It is noted that the displaced mass md is dependent on section aspect ratio ( m d = 0.5 ρ D H L = 0.5 ρ α D 2 L ).
Based on Equation (16), the calculated critical damping coefficients cc-cal are obtained and listed in Table 7. Meanwhile, the test critical damping coefficients cc-mea are listed in Table 7 as well. It is observed that the calculated results agree well with the test results, indicating Equation (16) is reasonable.
Therefore, the oscillation mode of triangular prism can be predicted by Equation (16). While c > cc, HG responses can be observed; while c < cc, SG responses can be observed; while c = cc, CG responses can be observed.

6. Conclusions

The soft galloping (SG) and hard galloping (HG) of spring-mounted triangular prisms with D = 10 cm and L ≈ 0.9 m in water flow were investigated experimentally. A power take-off system (PTO), a spring system, additional weights, and different triangular prisms were introduced to achieve the variations in damping coefficient c, system stiffness K, oscillation mass m and section aspect ratio α, respectively. Corresponding parameters related to the experimental setup were then deduced and verified by free-decay tests. Based on the experimental setup, the complete SG and HG responses of triangular prisms were exhibited and analyzed. The evolution of the oscillation mode of prisms by varying c, K, m, and α were revealed afterwards. Based on numerous experimental results, the reason for self-excited galloping was explained and the occurrence conditions of SG and HG were demonstrated. The following conclusions can be drawn from the present paper.
(a)
In an oscillation system with PTO, the damping coefficient c is a function of mechanical damping coefficient cm, short-circuit equivalent damping coefficient c 0 * and load resistance ratio R * . Among them, cm and c 0 * are the internal factors which are dependent on the oscillation system, R * is the external factor which is dependent on the external load resistance RL. For fixed-magnetic PTO, cm and c 0 * remain constant; c is only related to R * . As R * increases, c gradually decreases and then levels off at cm.
(b)
Complete soft galloping (SG) responses: The present paper proves that the vortex-induced vibration (VIV) lower branch can also be observed in the SG response by decreasing the flow velocity in addition to the VIV initial branch, VIV-galloping transition branch and developed galloping branch. In the complete SG responses, a self-excited region exists. When Ur is in the self-excited region, the triangular prism can be self-initiated from VIV to galloping, regardless of velocity increase or decrease.
(c)
Complete hard galloping (HG) responses: VIV branches, which consist of the initial, the upper and the lower branch are complete. However, the VIV-galloping transition branch disappears and the galloping branch is incomplete. There is no self-excited region: instead, there is critical velocity (CV). The triangular prism cannot be self-initiated from VIV to galloping in any cases, but when Ur is beyond CV, galloping can be initiated by appropriate external excitation.
(d)
Complete critical galloping (CG) responses: CG is the critical oscillation mode between SG and HG. In the responses, the VIV branches and the galloping branch are all complete and intersect at a specific flow velocity (For equilateral triangular prism, Ur ≈ 9). Although the self-excited region cannot be observed, the prism can also be self-initiated from VIV to galloping only at the specific flow velocity.
(e)
Evolution of oscillation mode: As c and m increase, or K and α decrease, the oscillation mode of a triangular prism gradually transitions from SG to CG, continues to HG, and ends in VIV. The VIV branches, especially the upper branch, gradually become complete while the galloping branches including the VIV-galloping transition branch gradually become incomplete. Meanwhile, the self-excited region narrows and gradually disappears. The critical velocity (CV) appears and gradually increases. As a result, the ability to be excited (self and external) from VIV to galloping is continuously weakened.
(f)
The amplitude in VIV branches is the direct reason for the onset of the galloping in SG response. In the present study, the amplitude ratio A* of the equilateral triangular prism corresponding to the onset of galloping is approximately 0.8. In order to predict the occurrences of SG, CG and HG, a parameter called critical damping coefficient cc is proposed and verified by numerous experimental results. When c < cc, SG occurs; when c > cc, HG occurs; when c = cc, CG occurs.

Acknowledgments

This work is supported by the National Key Research and Development Program of China (Grant No. 2016YFC0401905). All workers from the State Key Laboratory of Hydraulic Engineering Simulation and Safety of Tianjin University are acknowledged. The authors are also grateful for the assistance of the anonymous reviewers.

Author Contributions

Jijian Lian and Xiang Yan designed the experiments; Xiang Yan, Jun Zhang and Quanchao Ren performed the experiments; Xiang Yan and Fang Liu analyzed the data; Xiang Yan built and wrote the majority of the manuscript text; all authors reviewed the manuscript. Yang Xu made contributions to the structure and language of the manuscript.

Conflicts of Interest

The authors declare no conflict of interest.

Abbreviations

AAverage of the amplitudes under continuous oscillation for 30 s
A*Amplitude ratio A/D
cSystem damping coefficient cm + ce
ceElectromagnetic damping coefficient
cmMechanical damping coefficient
c 0 * Short-circuit equivalent damping coefficient c/cm
DProjection width of the prism in the direction of incoming flow
fnNatural frequency in air
foscPrime frequency of oscillation
f*Frequency ratio, fosc/fn
HHeight of the triangular cross section
KSystem stiffness
LPrism length
mSystem mass mo + meqe
maddMass of additional weight
mdDisplaced mass πρD2L/4
moOriginal mass, prism mass, transmission mass and 1/3rd of spring mass
meqeEquivalent mass related to radius and rotational inertia of gears and rotor
m*Mass ratio m/md
RLLoad resistance
R0Inner resistance of PTO
R*Load resistance ratio
UIncoming flow velocity
UrReduced velocity, U/(D·fn)
αSection aspect ratio H/D
𝛽Speed ratio of gear group
ζSystem damping ratio
ζmMechanical damping ratio
ρWater density
CVCritical velocity
LLLower limit of self-excited region
ULUpper limit of self-excited region
PTOPower take-off system

References

  1. Li, H.; Laima, S.; Zhang, Q.Q.; Li, N.; Liu, Z.Q. Field monitoring and validation of vortex-induced vibrations of a long-span suspension bridge. J. Wind Eng. Ind. Aerodyn. 2014, 124, 54–67. [Google Scholar] [CrossRef]
  2. Trim, A.D.; Braaten, H.; Lieb, H.; Tognarelli, M.A. Experimental investigation of vortex-induced vibration of long marine risers. J. Fluids Struct. 2005, 21, 335–361. [Google Scholar] [CrossRef]
  3. Kumar, R.A.; Sohn, C.H.; Gowda, B.H. Passive control of vortex-induced vibrations: An overview. Recent Pat. Mech. Eng. 2008, 1, 1–11. [Google Scholar] [CrossRef]
  4. Blevins, R.D. Flow-Induced Vibration, 3th ed.; Van Nostrand Reinhold: New York, NY, USA, 1990. [Google Scholar]
  5. Williamson, C.H.K.; Govardhan, R. Vortex-induced vibrations. Annu. Rev. Fluid Mech. 2004, 36, 413–455. [Google Scholar] [CrossRef]
  6. Khalak, A.; Williamson, C.H.K. Fluid forces and dynamics of a hydroelastic structure with very low mass and damping. J. Fluids Struct. 1997, 11, 973–982. [Google Scholar] [CrossRef]
  7. Khalak, A.; Williamson, C.H.K. Motions, forces and mode transitions in vortex-induced vibrations at low mass-damping. J. Fluids Struct. 1999, 13, 813–851. [Google Scholar] [CrossRef]
  8. Govardhan, R.; Williamson, C.H.K. Modes of vortex formation and frequency response of a freely vibrating cylinder. J. Fluids Mech. 2000, 420, 85–130. [Google Scholar] [CrossRef]
  9. Raghavan, K.; Bernitsas, M.M. Experimental investigation of Reynolds number effect on vortex induced vibration of rigid circular cylinder on elastic supports. Ocean. Eng. 2011, 38, 719–731. [Google Scholar] [CrossRef]
  10. Nemes, A.; Zhao, J.S.; Jacono, D.L.; Sheridan, J. The interaction between flow induced vibration mechanisms of a square cylinder with varying angles of attack. J. Fluids Mech. 2012, 710, 102–130. [Google Scholar] [CrossRef] [Green Version]
  11. Zhao, J.S.; Leontini, J.S.; Jacono, D.L.; Sheridan, J. Fluid structure interaction of a square cylinder at different angles of attack. J. Fluids Mech. 2014, 747, 688–721. [Google Scholar] [CrossRef]
  12. Ding, L.; Zhang, L.; Wu, C.M.; Mao, X.R.; Jiang, D.Y. Flow induced motion and energy harvesting of bluff bodies with different cross sections. Energy Convers. Manag. 2015, 91, 416–426. [Google Scholar] [CrossRef]
  13. Zhang, J.; Xu, G.B.; Liu, F.; Lian, J.; Yan, X. Experimental investigation on the flow induced vibration of an equilateral triangle prism in Water. Appl. Ocean Res. 2016, 61, 92–100. [Google Scholar] [CrossRef]
  14. Yan, X.; Lian, J.; Liu, F. Model tests on flow-induced motion of oscillators with different cross sections. J. Tianjin Univ. 2016, 49, 1–8. (In Chinese) [Google Scholar]
  15. Alonso, G.; Meseguer, J. A parametric study of the galloping stability of two dimensional triangular cross-section bodies. J. Wind Eng. Ind. Aerodyn. 2006, 94, 241–253. [Google Scholar]
  16. Barrero-Gil, A.; Fernandez-Arroyo, P. Maximum vortex-induced vibrations of a square prism. Wind Struct. 2013, 17, 107–121. [Google Scholar] [CrossRef]
  17. Alonso, G.; Sanz-Lobera, A.; Meseguer, J. Hysteresis phenomena in transverse galloping of triangular cross-section bodies. J. Fluids Mech. 2012, 33, 243–251. [Google Scholar] [CrossRef] [Green Version]
  18. Alonso, G.; Meseguer, J.; Pérez-Grande, I. Galloping instabilities of two dimensional triangular cross-section bodies. Exp. Fluids 2005, 38, 789–795. [Google Scholar] [CrossRef]
  19. Alonso, G.; Meseguer, J.; Pérez-Grande, I. Galloping stability of triangular cross sectional bodies: A systematic approach. J. Wind Eng. Ind. Aerodyn. 2007, 95, 928–940. [Google Scholar] [CrossRef]
  20. Den Hartog, J.P. Mechanical Vibrations, 4th ed.; McGraw-Hill: New York, NY, USA, 1956. [Google Scholar]
  21. Muralt, P. Ferroelectric thin films for micro-sensors and actuators: A review. J. Micromech. Microeng. 2000, 10, 136–146. [Google Scholar] [CrossRef]
  22. Mehmood, A.; Abdelkefi, A.; Hajj, M.R.; Nayfeh, A.H.; Akhtar, I.; Nuhait, A.O. Piezoelectric energy harvesting from vortex-induced vibrations of circular cylinder. J. Sound Vib. 2013, 332, 4656–4667. [Google Scholar] [CrossRef]
  23. Bernitsas, M.M.; Raghavan, K.; Ben-Simon, Y.; Garcia, E.M.H. VIVACE (vortex induced vibration aquatic clean energy): A new concept in generation of clean and renewable energy from fluid flow. J. Offshore Mech. Arct. Eng. 2008, 130, 041101. [Google Scholar] [CrossRef]
  24. Bernitsas, M.M.; Raghavan, K.; Ben-Simon, Y.; Garcia, E.M.H. The VIVACE converter model tests at high damping and reynolds number around 105. J. Offshore Mech. Arct. Eng. 2009, 131, 639–653. [Google Scholar] [CrossRef]
  25. Chang, C.C.; Kumar, R.A.; Bernitsas, M.M. VIV and galloping of single circular cylinder with surface roughness at 3.0 × 10⁴ ≤ Re ≤ 1.2 × 10⁵. Ocean Eng. 2011, 38, 1713–1732. [Google Scholar] [CrossRef]
  26. Park, H.; Kumar, R.A.; Bernitsas, M.M. Enhancement of flow-induced motion of rigid circular cylinder on springs by localized surface roughness at 3.0 × 10⁴ ≤ Re ≤ 1.2 × 10⁵. Ocean Eng. 2013, 72, 403–415. [Google Scholar] [CrossRef]
  27. Ding, L. Research on Flow Induced Motion of Multiple Circular Cylinders with Passive Turbulence Control. Ph.D. Thesis, Chongqing University, Chongqing, China, 2013. [Google Scholar]
  28. Zhang, J.; Liu, F.; Lian, J.; Yan, X.; Ren, Q. Flow induced vibration and energy extraction of an equilateral triangle prism at different system damping ratios. Energies 2016, 9, 938. [Google Scholar] [CrossRef]
  29. Bearman, P.W. Vortex shedding from oscillating bluff bodies. Annu. Rev. Fluid Mech. 1984, 16, 195–222. [Google Scholar] [CrossRef]
  30. Lee, J.H.; Xiros, N.; Bernitsas, M.M. Virtual damper-spring system for VIV experiments and hydrokinetic energy conversion. Ocean Eng. 2011, 38, 732–747. [Google Scholar] [CrossRef]
  31. Sun, H.; Kim, E.S.; Bernitsa, M.P.; Bernitsas, M.M. Virtual spring-damping system for flow-induced motion experiments. J. Offshore Mech. Arct. Eng. 2015, 137, 061801. [Google Scholar] [CrossRef]
  32. Szepessy, S.; Bearman, P.W. Aspect ratio and end plate effects on vortex shedding from a circular cylinder. J. Fluid Mech. 1992, 234, 191–217. [Google Scholar] [CrossRef]
  33. Szepessy, S. On the control of circular cylinder flow by end plates. Eur. J. Mech. B 1993, 12, 217–244. [Google Scholar]
Figure 1. Layout of recirculating water channel system.
Applsci 07 00198 g001
Figure 2. Comparison of increasing and decreasing flow velocity.
Applsci 07 00198 g002
Figure 3. Experimental setup: (a) Oscillation system and triangular prism; (b) Power take-off system (PTO); (c) Load resistance.
Applsci 07 00198 g003
Figure 4. Simple schematic of the spring-mounted triangular prism with PTO in coming flow.
Applsci 07 00198 g004
Figure 5. Damping coefficient of the oscillation system c versus load resistance ratio R*.
Applsci 07 00198 g005
Figure 6. Illustration of system stiffness: (a) Force diagram; (b) Actual device.
Applsci 07 00198 g006
Figure 7. Linearity verification of system stiffness.
Applsci 07 00198 g007
Figure 8. The triangular prisms. (a) The physical models; (b) Different section aspect ratios.
Applsci 07 00198 g008
Figure 9. Complete SG responses; (a) Amplitude ratio A* versus reduced velocity Ur; (b) Frequency ratio f* versus reduced velocity Ur; (c) Time history of displacement at Ur = 11 in Path 2; (d) Spectrum of displacement at Ur = 11 in Path 2; (e) Time history of displacement at Ur = 11 in Path 4; (f) Spectrum of displacement at Ur = 11 in Path 4.
Applsci 07 00198 g009
Figure 10. Complete SG responses; (a) Amplitude ratio A* versus reduced velocity Ur; (b) Frequency ratio f* versus reduced velocity Ur; (c) Time history of displacement at Ur = 11.625 in Path 3; (d) Spectrum of displacement at Ur = 11.625 in Path 3; (e) Time history of displacement at Ur = 11.625 in Path 4; (f) Spectrum of displacement at Ur = 11.625 in Path 4.
Applsci 07 00198 g010aApplsci 07 00198 g010b
Figure 11. Oscillation modes under different damping coefficients c: (a) Amplitude ratio A* versus reduced velocity Ur; (b) Frequency ratio f* versus reduced velocity Ur.
Applsci 07 00198 g011
Figure 12. Oscillation modes under different stiffnesses K: (a) Amplitude ratio A* versus reduced velocity Ur; (b) Frequency ratio f* versus reduced velocity Ur.
Applsci 07 00198 g012
Figure 13. Oscillation modes under different mass m: (a) Amplitude ratio A* versus reduced velocity Ur; (b) Frequency ratio f* versus reduced velocity Ur.
Applsci 07 00198 g013
Figure 14. Oscillation modes under different section aspect ratios α: (a) Amplitude ratio A* versus reduced velocity Ur; (b) Frequency ratio f* versus reduced velocity Ur.
Applsci 07 00198 g014
Figure 15. Evolution of the oscillation mode for triangular prism.
Applsci 07 00198 g015
Figure 16. Occurrence maps of SG, CG and HG: (a) Map with variations of c and K; (b) Map with variations of c and m; (c) Map with variations of c and α.
Applsci 07 00198 g016
Table 1. The complete results in free-decay test by varying the load resistance.
RLR*ζfn/Hzm/kgc/N·s·m−1 c 0 *
61.8180.4000.95733.17159.646.797
113.3330.2920.96532.66115.636.262
164.8480.2520.95533.35100.926.454
206.0610.2320.95933.0392.526.448
226.6670.2220.95933.0388.566.334
5215.7580.1720.96732.4868.006.061
∞ (O/C)0.1320.96632.5652.22-
Average--0.96132.90-6.393
Table 2. The complete results in free-decay test by varying the system stiffness.
K/N·m−1ζmcm/N·s·m−1fn/Hzm/kg
8000.16151.9400.79132.43
10000.13950.3000.88132.63
12000.13252.2230.96632.56
14000.12051.3601.04432.55
16000.11150.4691.12432.10
Average-51.258-32.45
Table 3. The complete results of the free-decay test by varying the mass of oscillation system.
madd/kgζc/N·s·m−1fn/Hzm/kgmo-cal/kgm*
0.000.13252.2230.96632.5615.948.36
3.910.12251.5280.90736.9216.399.47
7.800.11952.9800.86041.0816.6610.54
11.730.11453.2090.81945.3216.9611.63
Average-52.485--16.49-
Table 4. The physical parameters corresponding to soft galloping (SG) responses.
ItemsValues
K/N·m−11400
m/kg32.81
fn/Hz1.040
c/N·s·m−192.52
ζ0.215
Table 5. The physical parameters corresponding to hard galloping (HG) responses.
ItemsValues
K/N·m−132.81
m/kg1400
fn/Hz1.040
c/N·s·m−1115.63
ζ0.270
Table 6. Corresponding parameter at the lower limit of self-excited region.
c/N·s·m−1K/N·m−1m/kgUrA*
52.22140032.816.6250.753
68.00140032.817.2500.839
88.56140032.817.8750.795
92.52140032.819.1250.876
52.22160032.817.2500.806
52.22140032.817.8750.795
52.22120032.818.8670.812
52.22140036.717.8750.786
52.22140040.618.5000.805
Table 7. Comparison of calculated and tested critical damping coefficients.
αmd/kgK/N·m−1m/kgcc-cal/N·m·s−1cc-mea/N·m·s−1Error/%
0.8663.89780032.8867.3968.000.9
0.8663.897100032.8879.9678.551.8
0.8663.897120032.8891.9492.520.6
0.8663.897140032.88103.46100.922.5
0.8663.897160032.88114.61115.630.9
0.8663.897120036.9284.1382.891.5
0.8663.897120041.0877.5278.551.3
0.8663.897120045.3271.9069.024.0
0.5002.250120032.8853.0852.221.6
1.0004.500120032.88106.17105.940.2
1.5006.750120032.88159.25199.7225.4

