Article

Strain Transfer Analysis of a Clamped Fiber Bragg Grating Sensor

1
School of Civil Engineering, Shenyang Jianzhu University, Shenyang 110168, China
2
Centre for Infrastructural Monitoring and Protection, School of Civil and Mechanical Engineering, Curtin University, Kent Street, Bentley WA 6102, Australia
3
School of Civil Engineering, Qingdao University of Technology, Qingdao 266033, China
*
Author to whom correspondence should be addressed.
Appl. Sci. 2017, 7(2), 188; https://doi.org/10.3390/app7020188
Submission received: 25 November 2016 / Revised: 24 January 2017 / Accepted: 10 February 2017 / Published: 15 February 2017
(This article belongs to the Special Issue Structural Health Monitoring (SHM) of Civil Structures)

Abstract

:
Clamped fiber Bragg grating (FBG) sensors have been widely applied in engineering strain measurements due to their advantages of high flexibility and efficiency. However, due to the existence of the interlayer, the strain measured by the encapsulated FBG sensor is not equal to the strain of the host material, which causes strain measurement errors. In this paper, the strain transfer analysis of a clamped FBG sensor based on the shear-lag theory is conducted to improve the accuracy of strain measurements. A novel theoretical model for the axial strain distribution of a clamped FBG sensor is proposed. It is also discussed how the gauge ratio and interlayer thickness affect the strain transfer rate. The accuracy of the proposed theoretical model is verified by experimental tensile tests. The theoretical value of the strain transfer rate matches well with the tested value.

Graphical Abstract

1. Introduction

Fiber Bragg grating (FBG) sensors have attracted wide attention from the civil and mechanical research community because of its many merits such as small size, high sensitivity, and immunity to electromagnetic interference [1]. In common practice, a bare optical fiber is encapsulated into a capillary tube with adhesives for real structural monitoring applications. Due to the interaction effect between different materials with different mechanical properties, the strain measured by FBG sensors is smaller than that of the strain of the host material. The error caused by the strain transfer rate between the host material and the FBG sensor cannot be ignored, especially in real applications. Recently, some research has concentrated on analyzing the strain transfer rate of FBG sensors and the accuracy of strain measurements from FBG sensors has been continually improved. Nanni et al. [2] considered that when the elastic modulus of the interlayer was equal to the optical fiber, the maximum strain of the host material was transferred by the interlayer. Pak et al. [3] proposed a theoretical model for the coated optical fiber embedded in composite materials. Results revealed that when the elastic modulus of the coated layer was equal to the average elastic modulus of the host material and optical fiber, the maximum strain can be sensed by the FBG sensor. Ansari et al. [4] acquired a theoretical expression describing strain transfer rate (α) based on the shear-lag theory, which was suitable for short fiber composites. Moreover, the theoretical results were verified through a series of experiments involving white light interferometry. On the other hand, Li et al. [5] assumed the same strain change rate between the gauge length center and the host material, amending Ansari’s results to obtain the actual strain with better accuracy [4]. It also revealed that the maximum strain transfer ratio occurred in the middle of the optical fiber sensor. Moreover, Li et al. [6] discussed the influencing parameters on strain transfer rate. Sun et al. [7] made an improvement on Li’s study by taking into account temperature variations and nonaxial stresses. Yuan et al. [8] evaluated the interaction between the matrix and optical fiber, giving the distributions of interfacial shearing stress. To achieve the accurate surface strain monitoring of the host material, Chai et al. [9] established the mechanical model of the surface FBG sensor and derived a general expression of the relation between the FBG sensor strain and the host material strain. Zhou et al. [10] presented the strain transfer mechanism and the error modification theory of an embedded FBG sensor. Zhou et al. [11] also studied the long-term service performance of FBG strain sensors embedded in concrete structures. The creep constitutive relation of concrete was introduced to analyze the strain transfer and the finite element method was used to verify the theoretical analysis results. Chen et al. [12] studied the transfer efficiency of substrate package FBG sensors, established the strain transfer model and compared it with experimental tests. A package mode of beryllium bronze was put forward and analyzed by using finite element analysis software ANSYS (ANSYS 16.0, ANSYS Inc., Pittsburgh, PA, USA). Calculation results show that characteristics of strain transfer of beryllium bronze package is normal, but it has a good protection performance for FBG sensors. Tan et al. [13] investigated the strain transfer factors of a pasted FBG under bending parts, establishing a pasted FBG strain transfer model by theoretical analysis. The strain transfer parameters were analyzed by a simulated analysis method. Experimental and simulation results show that the length and the middle layer thickness have the dominating effect on the strain transfer rate of FBG sensors. Wan et al. [14] reported that the relationship between the matrix strain and the surface-attached fiber strain is governed by the effectiveness of shear transfer through the adhesive and polymeric coating.
It should be noted that in the abovementioned previous studies, the strain transfer analysis theories are based on the models of surface pasted or embedded FBG sensors. This paper proposes an innovative strain transfer model for a clamped FBG sensor. The axial strain distribution principle of the optical fiber in consideration of the gauge length and interlayers is developed. The theoretical analysis results are verified by experimental tensile tests.

2. Basic Theory

An FBG sensor consists of a fiber core, cladding layers and coating layers. The main component of the fiber core is SiO2, which is usually mixed with some infinitesimal amount of GeO2 to change the refractive index of the sensor. As the refractive index of the fiber core is larger than that of the cladding layer, the light is totally reflected through the fiber core to achieve a long distance transmission of the signal with little energy loss. When the broadband light is transmitted to an FBG sensor, the light with a specific wavelength is reflected, which is satisfied with the Bragg condition [15,16], that is,
λ B = 2 n e f f Λ
where λ B , n e f f and Λ are the FBG wavelength, the refractive index of the fiber core and the FBG period, respectively.
When the strain and temperature change simultaneously, the wavelength shift equation is expressed as follows:
Δ λ / λ = [ ( 1 P e ) ε + ( α + ξ ) Δ T ]
where Δ λ is the FBG wavelength shift; P e is the FBG strain-optic coefficient; α is the FBG thermal expansion coefficient; ξ is the FBG thermo-optic coefficient; and Δ T is the temperature variation [17].

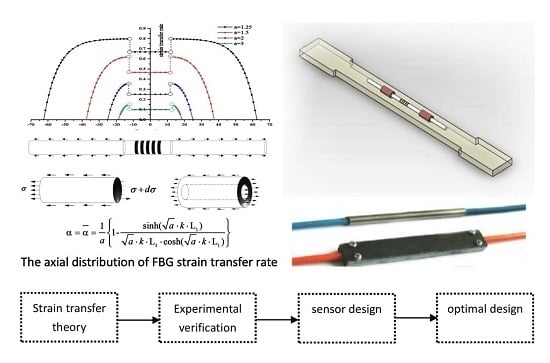
3. Theoretical Strain Transfer Analysis

A clamped FBG sensor model comprises an m-segment and an n-segment of the fiber, as shown in Figure 1, where the m-segment is glued, and the n-segment is unrestrained. The m-segment length is defined as the interlayer length, and the n-segment length as the gauge length. A, B, C, D points are boundary points of interlayer. A micro unit of an m-segment is shown in Figure 2, and a mechanical model of a micro unit of the interlayer is shown in Figure 3. Three appropriate assumptions are applied in this study to simplify the model,
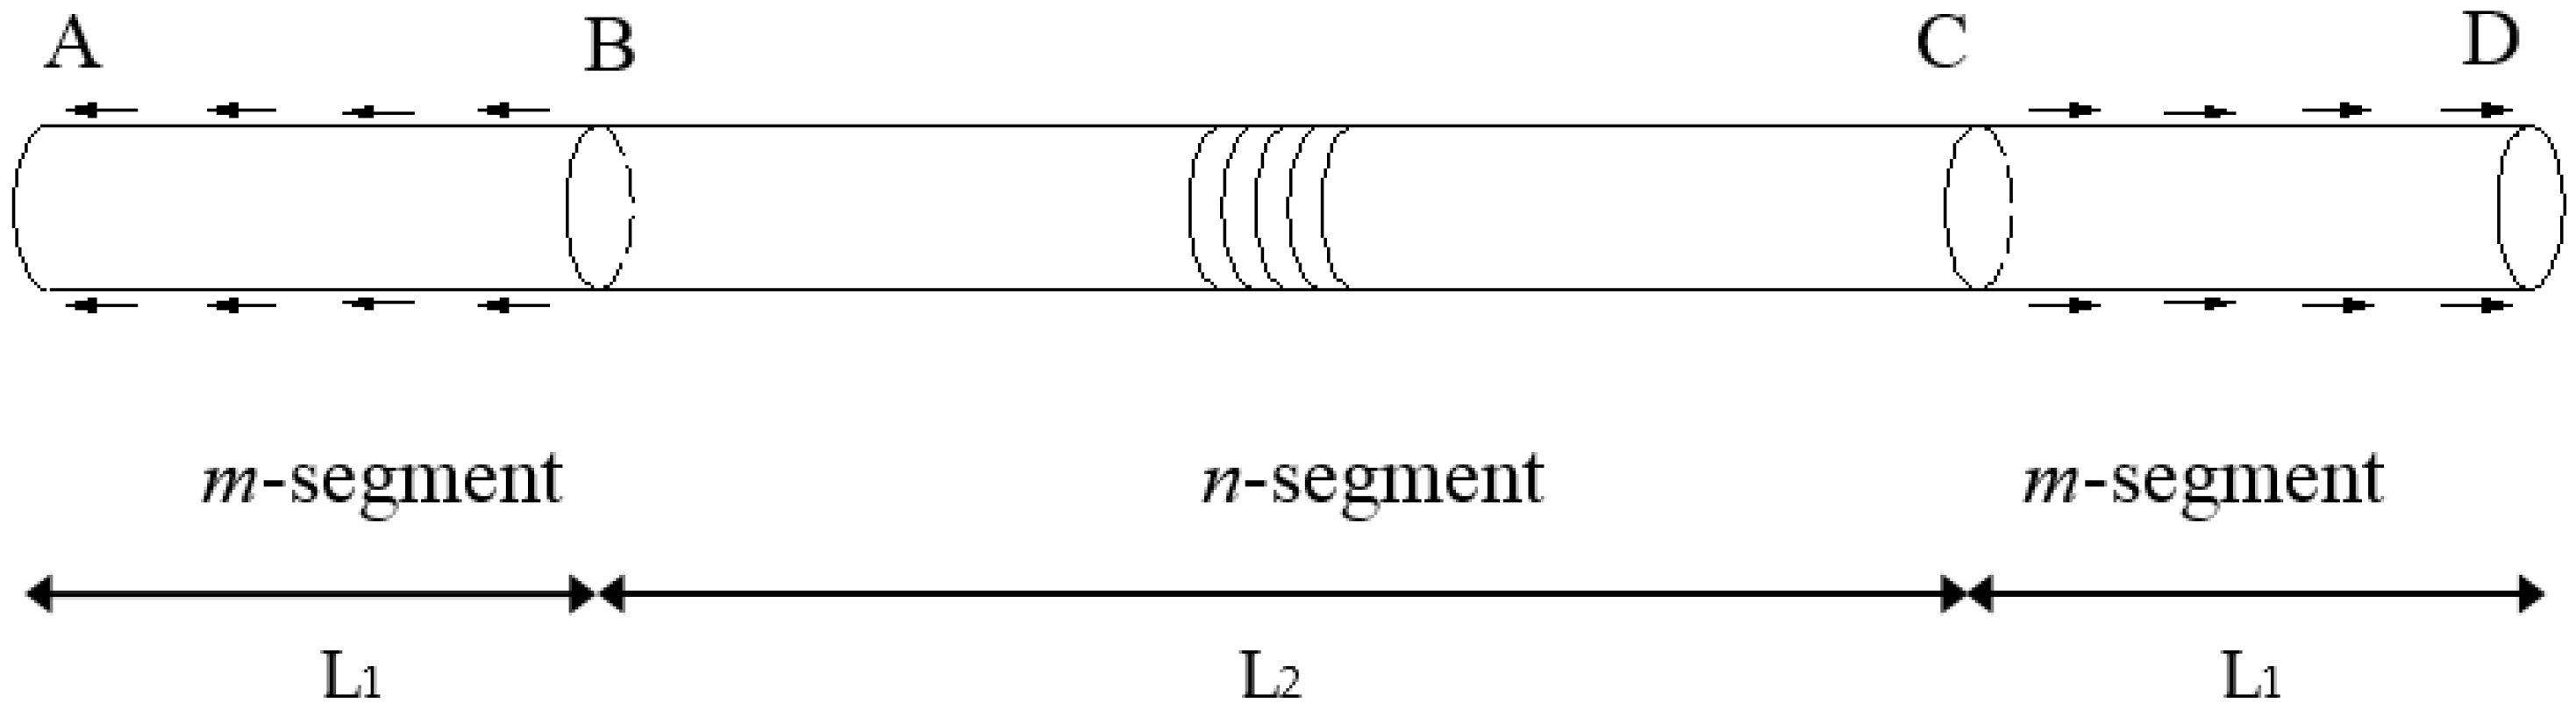
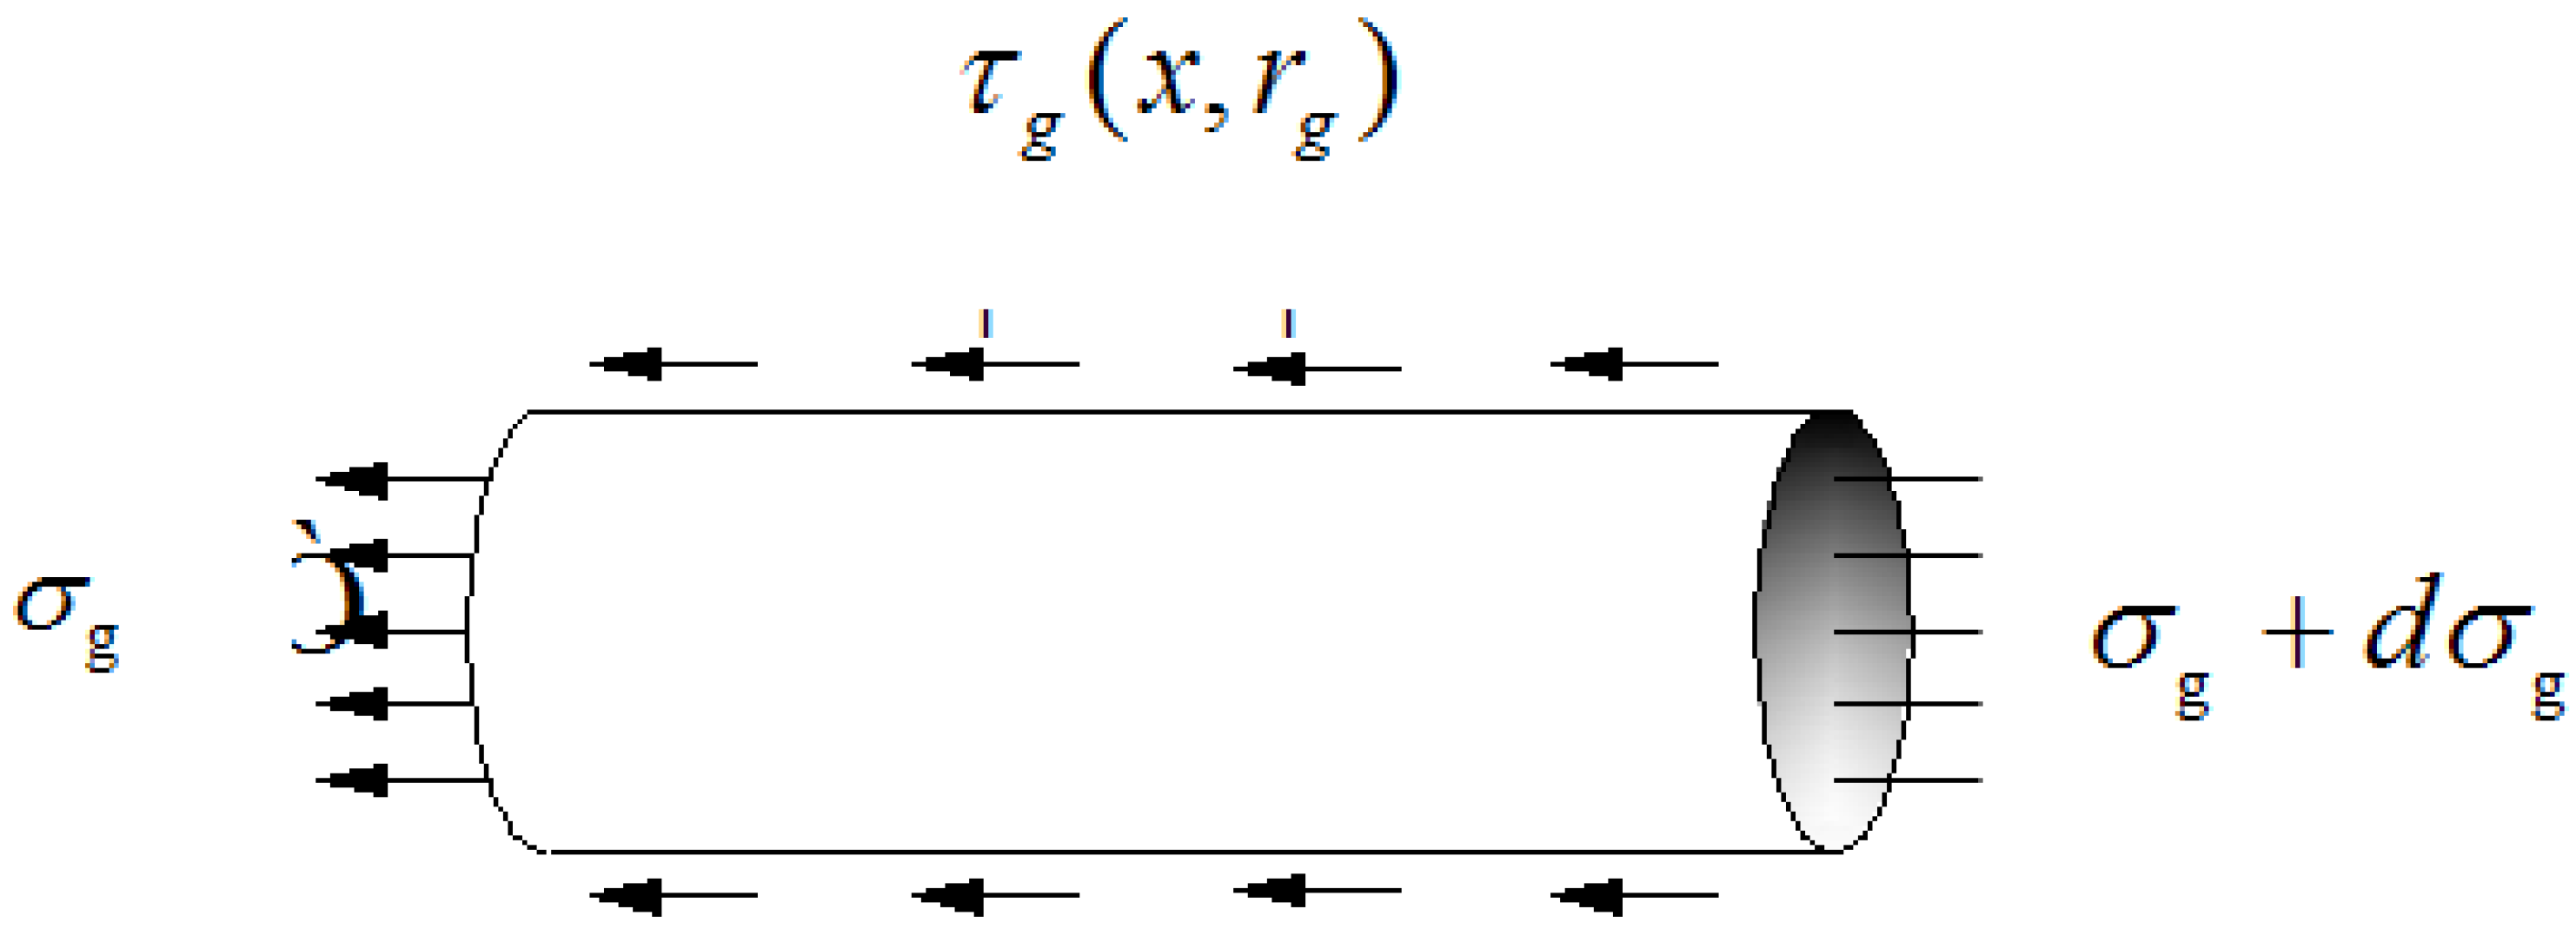
  • The optical fiber is linearly elastic with its m-segment and n-segment having the same mechanical properties. The mechanical properties of optical fiber are impacted by taking advantage of phase masks and ultraviolet irradiation methods when processing FBG writing. The FBG sensor does not carry the external force directly, and the axial strain is supposed to transfer from the host material to the optical fiber by the interlayer shear deformation.
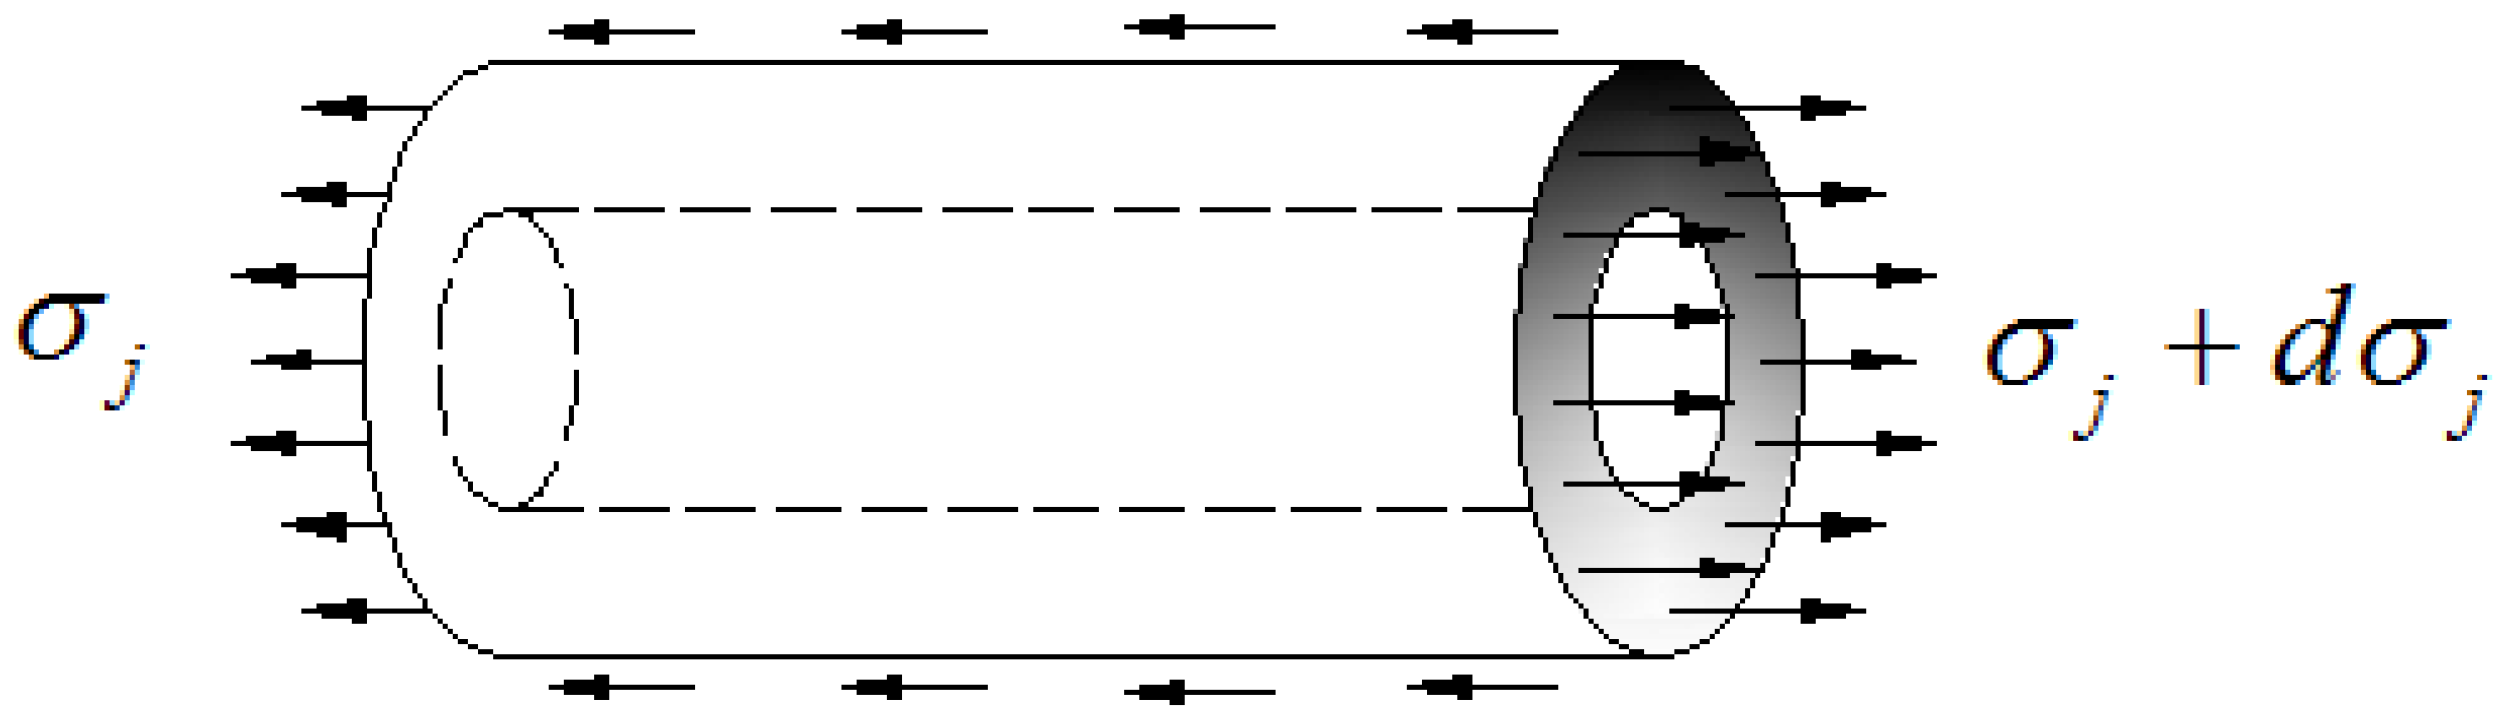
  • The interlayer is a hollow cylinder, which is homogeneously coated on the fiber surface to undergo the shear deformation, regardless of its axial deformation.
  • There is no relative slip between the FBG sensor and the interlayer.

3.1. Strain Transfer Rate Distribution of the m-Segment of the Optical Fiber

The origin of the coordinate system is selected as point B to show the mechanical model of the micro unit of the m-segment from Figure 2, and the following equation can be obtained:
2 π r g τ g ( x , r g ) dx + π r g 2 d σ g = 0
d σ g d x = 2 τ g ( x , r g ) r g
where σ g , τ g ( x , r g ) and r g are the fiber normal stress, the fiber surface shear stress and the fiber radius, respectively. Similarly, the equation can be modified as:
2 π r j τ j ( x , r j ) d x 2 π r g τ g ( x , r g ) d x + π ( r j 2 r g 2 ) d σ j = 0
τ j ( x , r j ) = r g r j τ g ( x , r g ) r j 2 r g 2 2 r j d σ j dx
By substituting Equation (4) into Equation (6), the following formula can be obtained:
τ j ( x , r j ) = r g 2 2 r j d σ g dx r j 2 r g 2 2 r j d σ j dx
τ j ( x , r j ) = E g r g 2 2 r j ( d ε g dx + r j 2 r g 2 2 r j E j E g d ε j dx )
The optical fiber and interlayer have the same strain change rate. Therefore, the following approximation equation can be obtained as:
d ε g dx d ε j dx
Due to the large difference in the elastic modulus between the optical fiber and the interlayer, their mechanical relationship can be simplified as:
r j 2 r g 2 2 r j E j E g d ε j dx ο ( d ε g dx )
Submitting Equations (9) and (10) into Equation (8), we have:
τ j ( x , r j ) = r g 2 2 r j d σ g dx = r g 2 2 r j E g d ε g dx
The interlayer produces the shear deformation, which can be described as:
τ j ( x , r ) = G j γ ( x , r ) G j du dr
where τ j ( x , r j ) , r j , u, γ , E j , G j are the surface shear stress, the interlayer radius, the axial displacement, the shear strain, the elastic modulus and the shear modulus of the interlayer, respectively. E g is the elastic modulus of optical fiber,
r g r i τ j ( x , r ) dr = u j u i G j du
where u i and ri are the matrix displacement and the inner radius of steel pipe, respectively; and u j is the fiber displacement comprising the longitudinal deformations of the m-segment and the n-segment.
r g r i τ j ( x , r ) dr = r g r i ( r g 2 2 r j E g d ε g dx ) dr
As can be seen from Figure 1, the displacement compatibility equation is proposed as follows, derived from Equations (13) and (14),
u i u g u g L 1 L 2 2 = E g 2 G j r g 2 ln ( r i r g ) d ε g dx = 1 k 2 d ε g dx
where u g , L1, L2 are the displacement of the m-segment of the optical fiber, the interlayer length and the gauge length, respectively. In the tests, fiber is encapsulated in the steel pipe by using adhesive. The inner radius of steel pipe is equal to the radius of interlayer, which can be measured as:
G j = E j 2 ( 1 + μ )
in which µ is Poisson ratio; and,
k 2 = 1 ( 1 + μ ) E g E j r g 2 ln ( r i r g )
where a = 1 + L 2 2 L 1 , a is defined as the gauge ratio parameter. Then we have the following equation from Equation (15):
u i a u g = 1 k 2 d ε g dx
Taking the derivation of Equation (18) with respect to x, the second-order differential equation is shown as follows:
d ε g 2 dx 2 a k 2 ε g = k 2 ε i
The general solution of this differential equation is:
ε g ( x ) = C 1 e a k x + C 2 e a k x + ε i a
where C 1 and C 2 are two integral constants. As point A and point D have no constraints, the boundary conditions can be expressed as:
ε g ( L 1 ) = ε g ( L 1 ) = 0
The integral constants are acquired as:
C 1 = C 2 = ε i 2 a cosh [ a k L 1 ]
The strain transfer rate distribution of the m-segment of the optical fiber is:
α m ( x ) = ε g ( x ) ε i = 1 a { 1 cosh ( a k x ) cosh ( a k L 1 ) }

3.2. Strain Transfer Rate Distribution of the n-Segment of the Optical Fiber

The average strain transfer rate is the average strain in the affixed range of the optical fiber divided by the matrix strain. Average strain transfer rate of the n-segment is:
α ¯ = ε g ¯ ε i = 0 L 1 ε g ( x ) d x ε i L 1 = 1 a { 1 sinh ( a k L 1 ) a k L 1 cosh ( a k L 1 ) }
According to the equivalent section method, equilibrium equations of B+ and B− sections are presented as follows:
E g ε g 2 ( x ) π r g 2 = E g ε g ¯ ( x ) π r g 2
ε g 2 ( x ) = ε g ¯ ( x )
The strain transfer rate of a clamped FBG sensor is equal to the average strain transfer rate in the range of affixed optical fiber:
α = α ¯ = 1 a { 1 sinh ( a k L 1 ) a k L 1 cosh ( a k L 1 ) }
The m-segment of the optical fiber is constrained by the interlayer with uniformly distributed surface shear stress, generating the non-uniform axial strain as observed in Equation (23). Because there are no constraints, the n-segment of the optical fiber has a constant section stress with the uniform axial strain as shown in Equation (27). For clamped FBG sensors, the strain transfer rate is equal to the average strain transfer rate in the affixed range of optical fiber. In contrast, the strain transfer rate of an embedded FBG sensor is equal to maximum strain transfer rate along the optical fiber.

4. Theoretical Analysis Results

4.1. Strain Transfer Rate of a Clamped FBG Sensor

Table 1 lists the physical parameters and mechanical properties of materials, which will be used in the following analysis. Strain transfer rate distribution of the m-segment of the optical fiber is from Equation (23), while the other part is calculated from Equation (27). The 0 point in Figure 4 is located in the middle of the fiber, which is different from the previous point. The strain transfer rate distribution curve of a clamped FBG sensor with different gauge ratios is demonstrated in Figure 4. Those parameters are consistent with Table 1. The curve is composed of two parts: a symmetric curve and a straight line. The region from A to B of the curve shows an increasing trend for the maximum strain transfer rate. The strain transfer rate keeps constant in the region of B–C. The strain measurement of a clamped FBG sensor is equal to the average strain of the bonded range, which reveals the actual stress state of the matrix.
When gauge ratio parameters are equal to 1.25, 1.5, 2 and 3, the maximum strain transfer rates are respectively 79.63%, 61.87%, 35.63% and 14.54%, and the average strain transfer rates are 66.82%, 46.66%, 25.04% and 9.91%, respectively. Considering the influence from the gauge length of the optical fiber, when the gauge ratio parameter is larger, the strain rate is lower. As a result, it is predicted that the strain transfer rate of a clamped FBG sensor could be improved if the gauge ratio parameter is reduced. Therefore, increasing the interlayer length and decreasing the gauge range are proposed as measures to improve the strain transfer rate.

4.2. Main Factors Affecting the Strain Transfer Rate

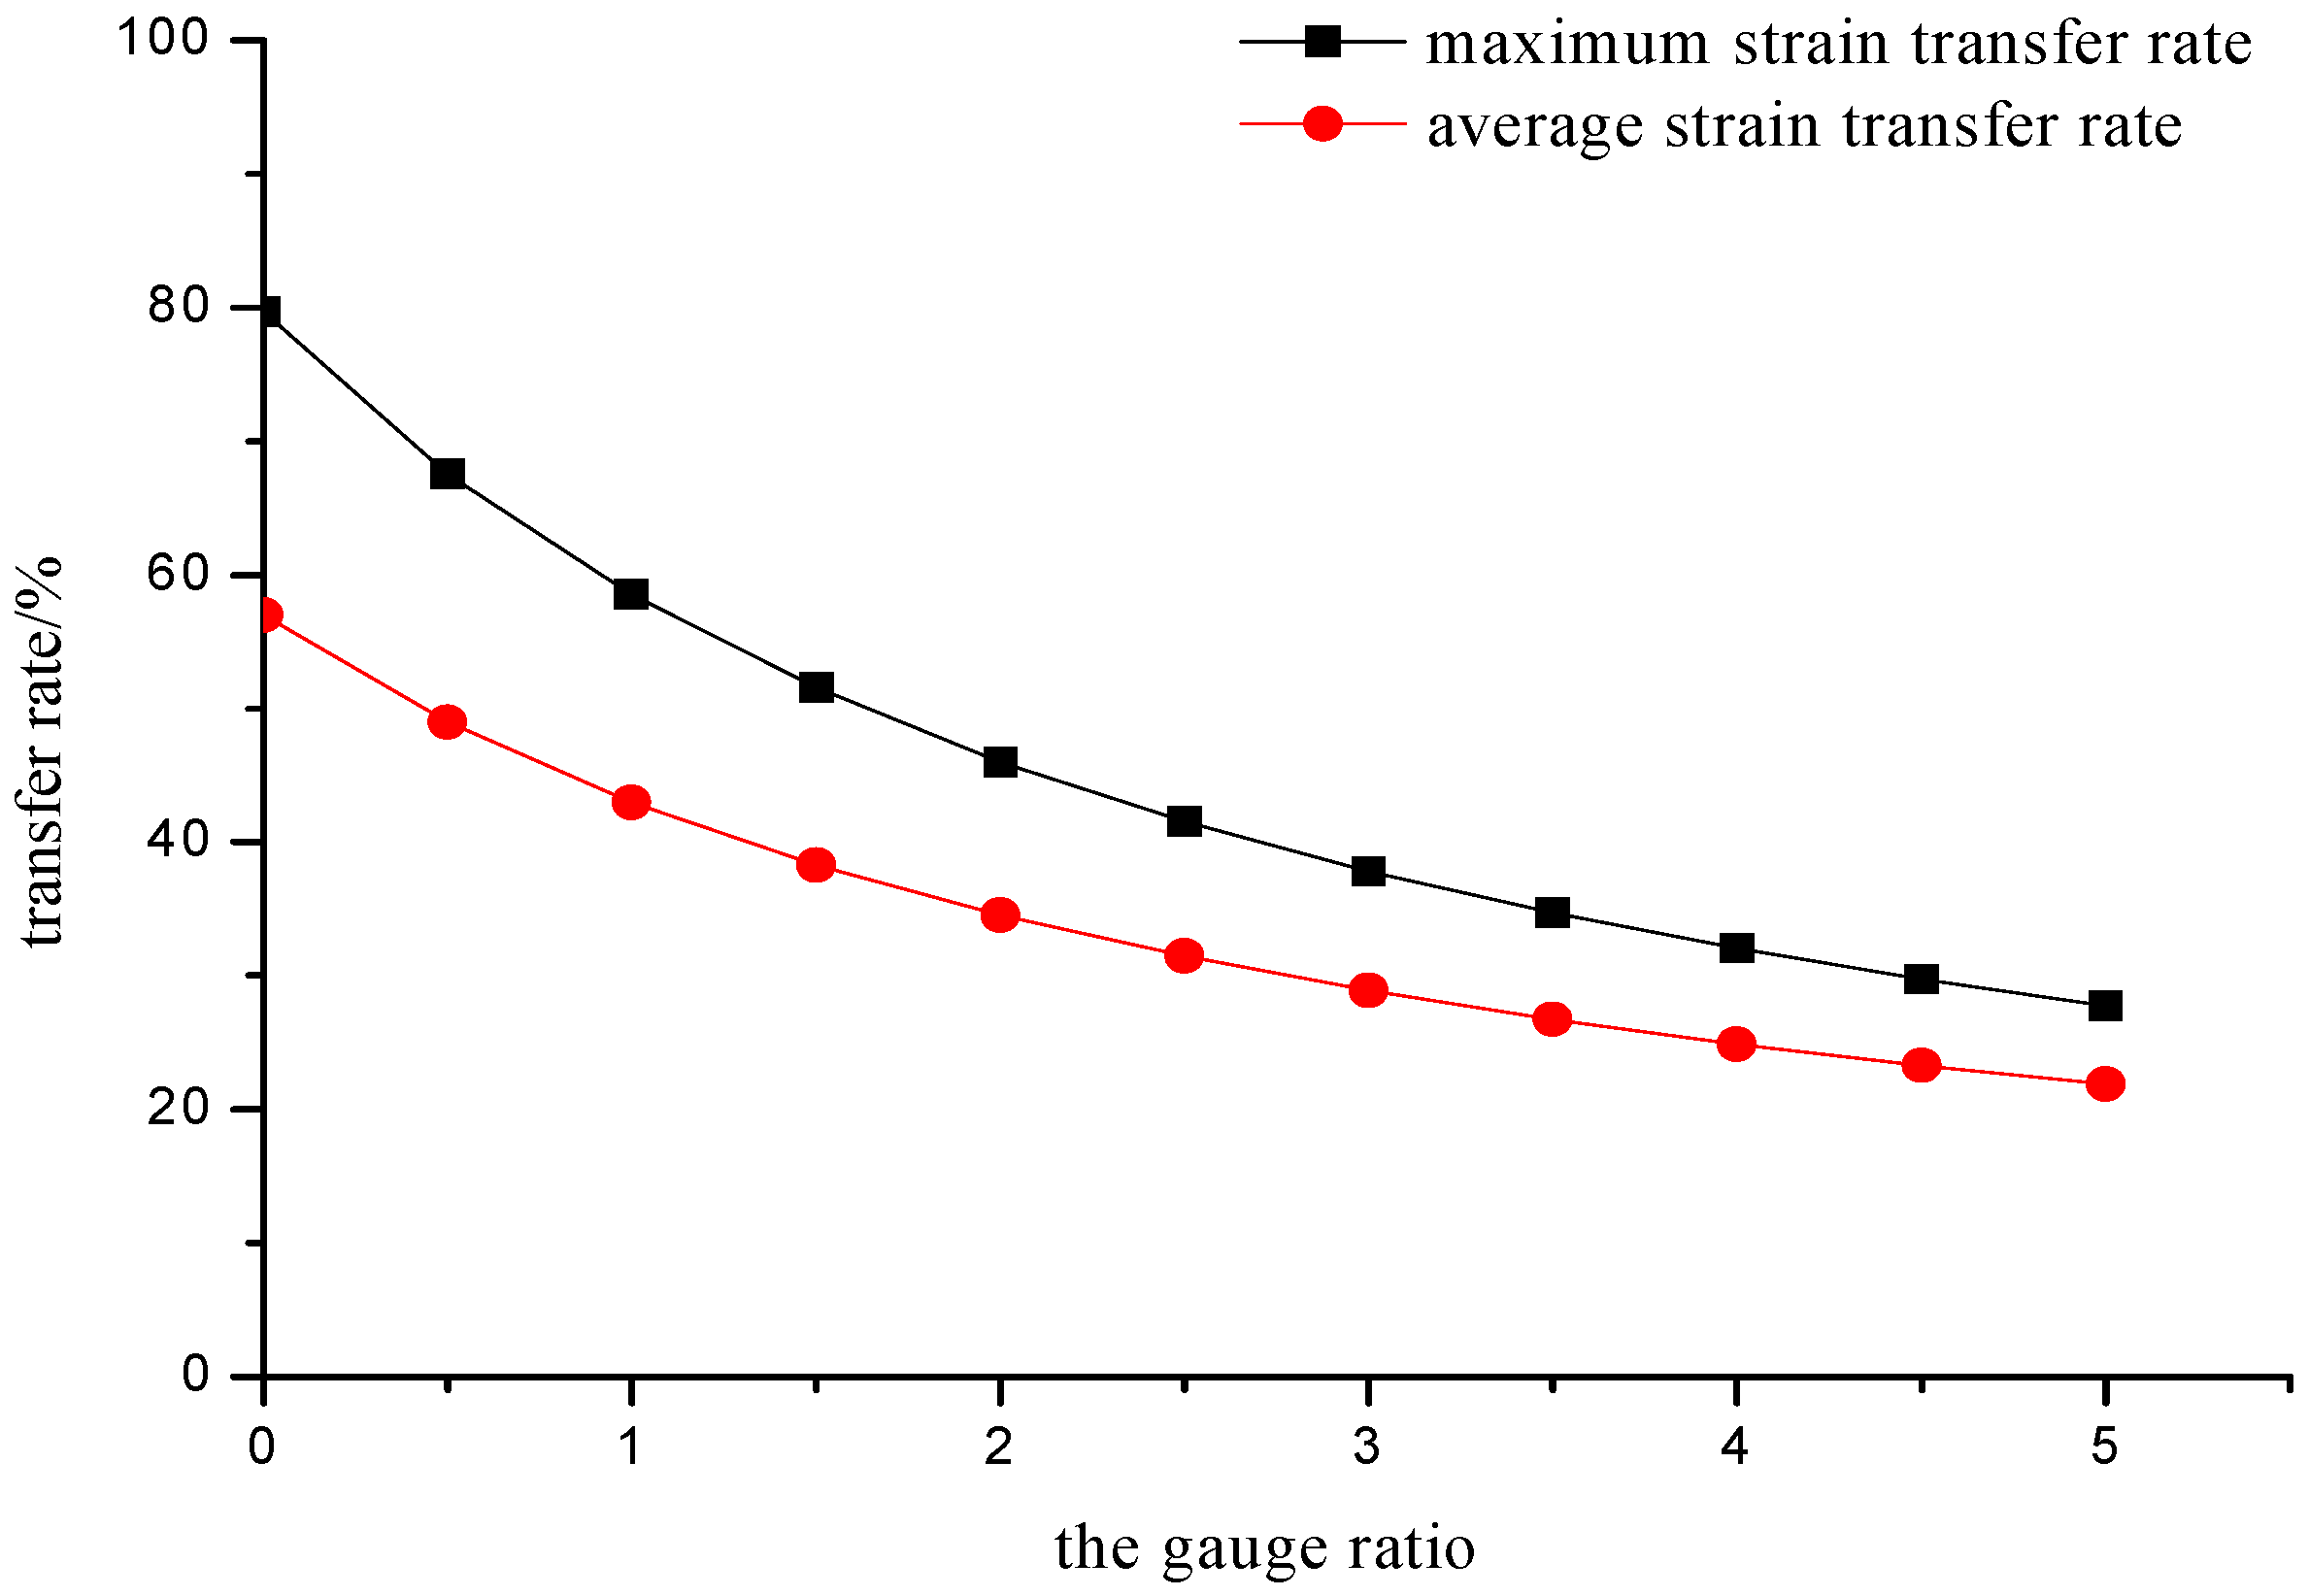
4.2.1. Effect of the Gauge Ratio

Based on the previous theoretical analysis, the gauge ratio is an important factor that can affect the strain transfer rate. FBG strain transfer rate vs. gauge ratio curve is shown in Figure 5, based on the default parameters as shown in Table 1. The gauge ratio is a value of the gauge length divided by the interlayer length. It can be seen from Figure 5 that the maximum and average strain transfer rates increase with the reduction of the gauge ratio. In order to obtain the accurate strain using a clamped FBG sensor, the gauge ratio should be reduced appropriately in the process of sensor fabrication.

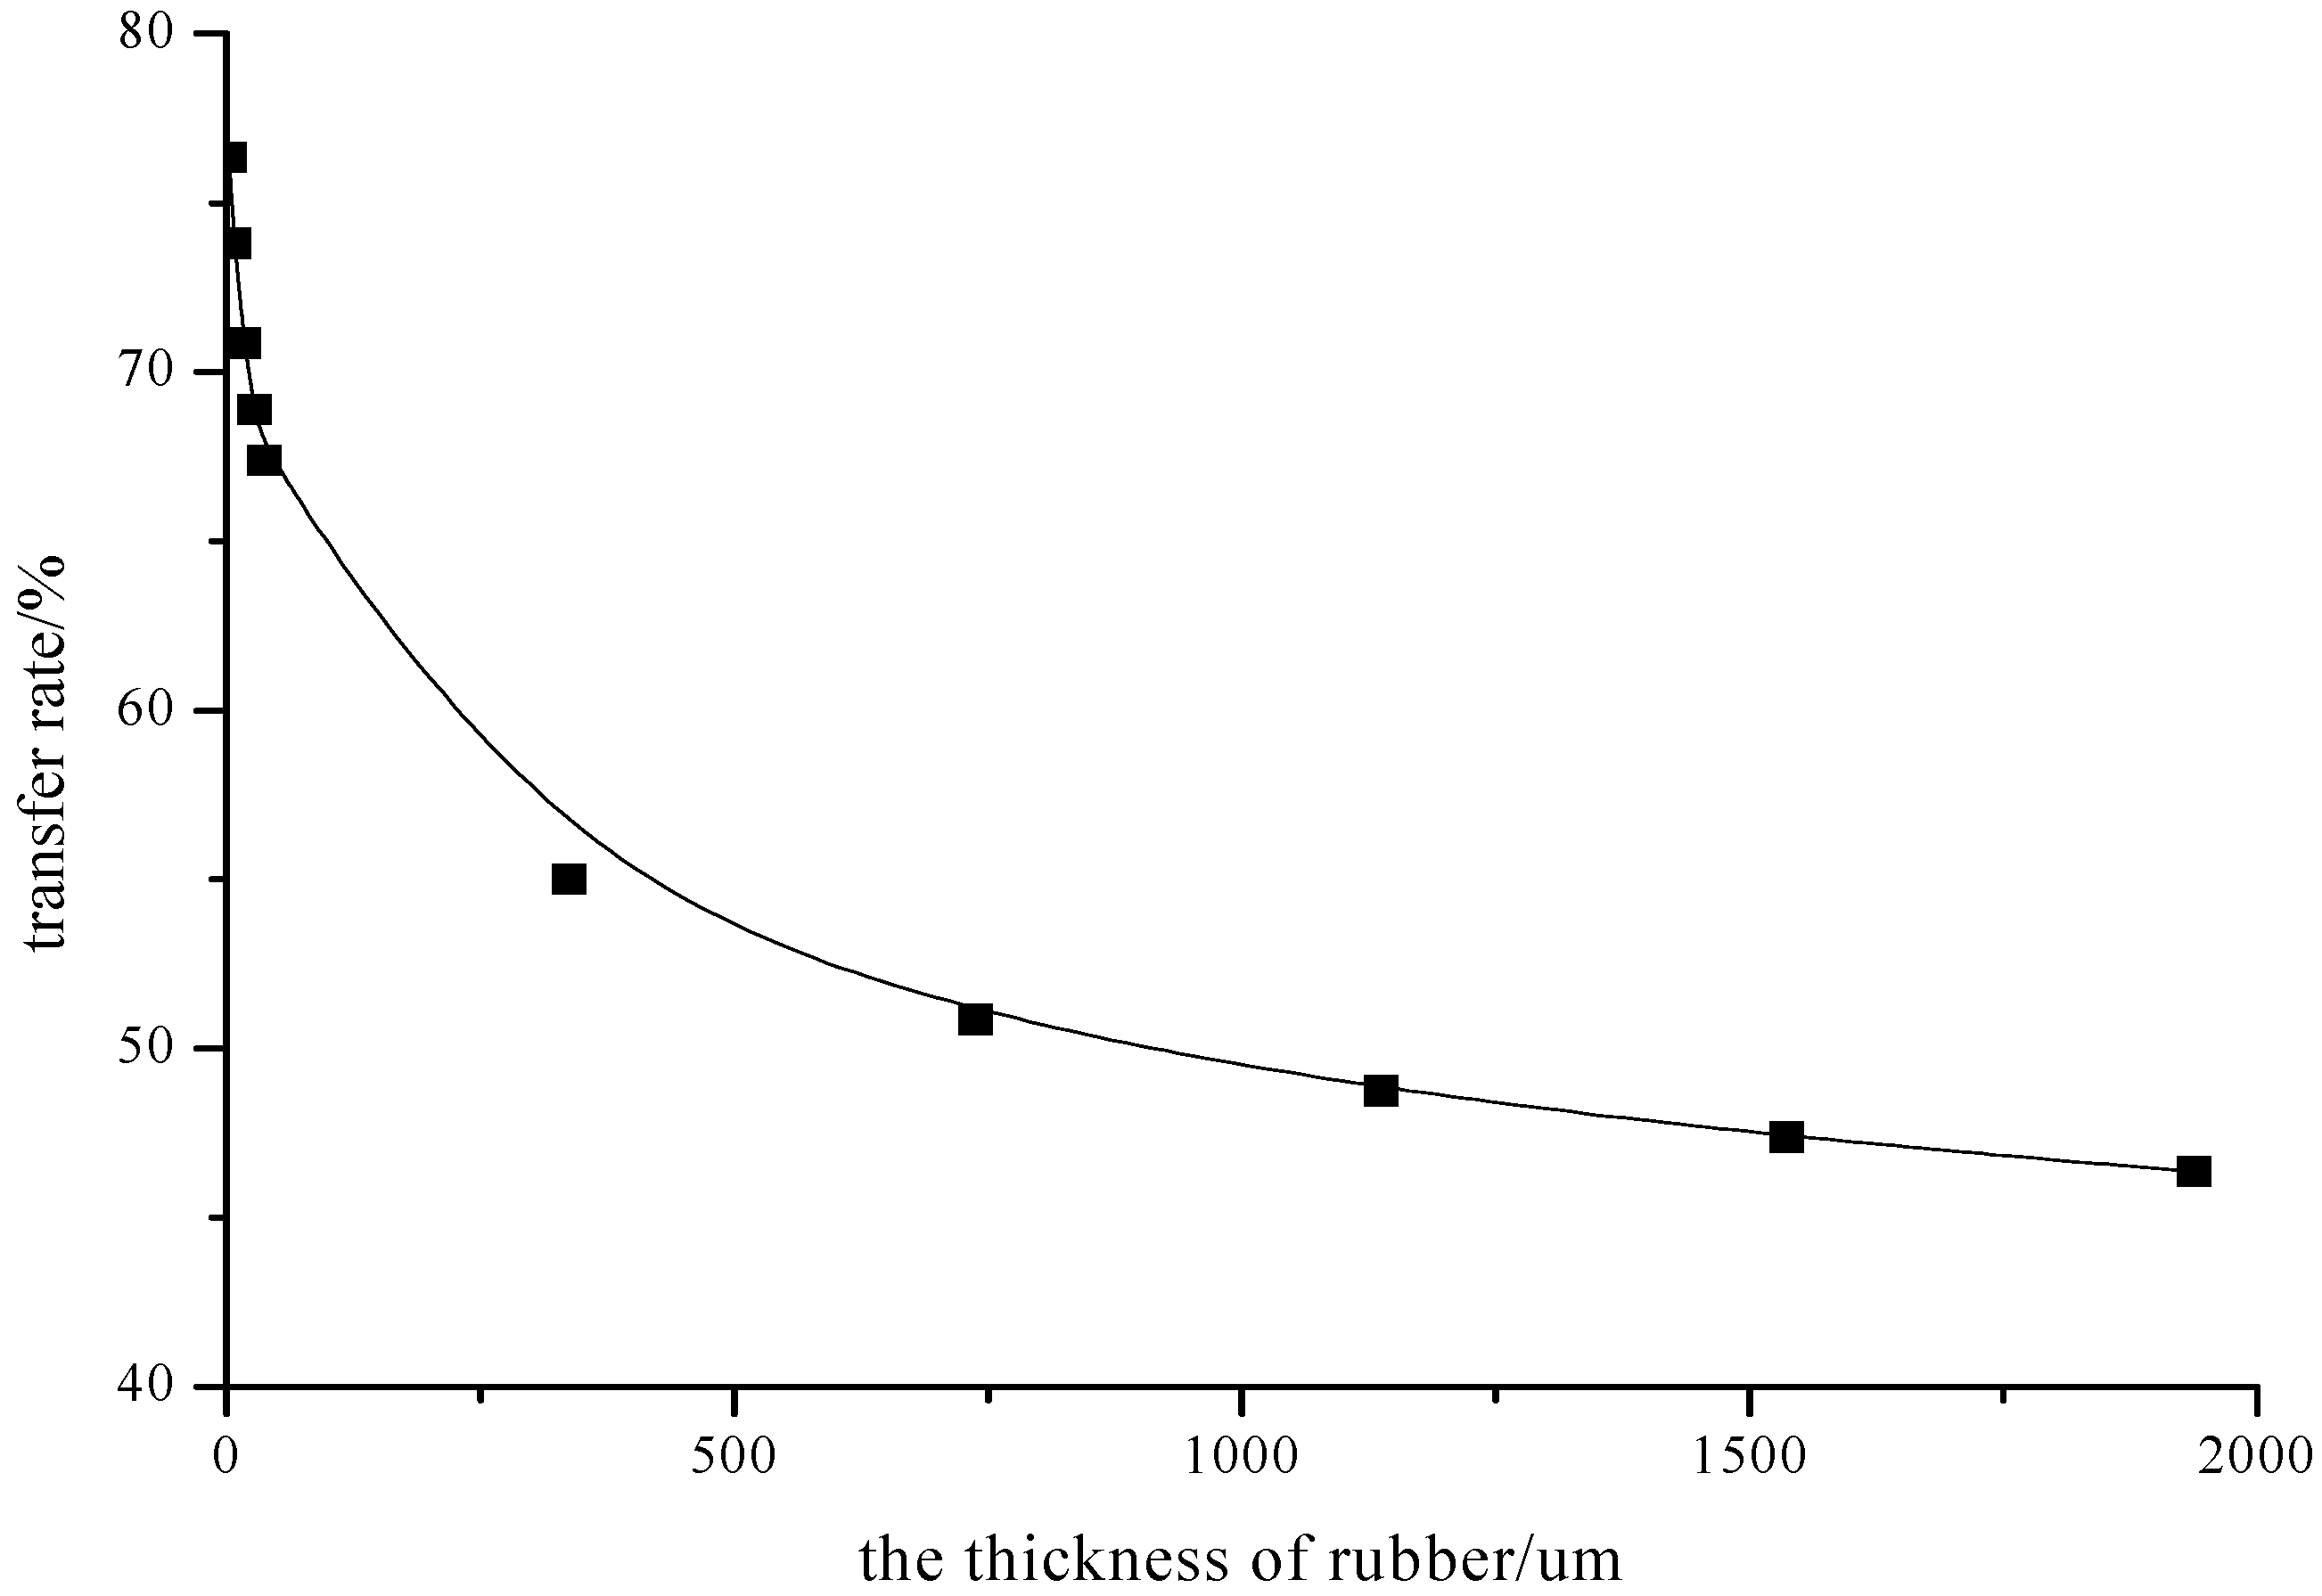
4.2.2. Effect of the Interlayer Thickness

Due to the shear deformation of the interlayer under external stress, interlayer thickness is an important influencing factor. Figure 6 shows the relationship between the interlayer thickness and the strain transfer rate of a clamped FBG sensor. Interlayer thickness is equal to the radius of the interlayer minus the radius of the optical fiber, that is, the interlayer thickness depends on the diameter of the steel pipe. When the interlayer thicknesses are 2.5 μm, 7.5 μm, 17.5 μm, 27.5 μm, 37.5 μm, 337.5 μm, 737.5 μm, 1137.5 μm, 1537.5 μm and 1937.5 μm, the strain transfer rates are 76.36%, 73.80%, 70.85%, 68.89%, 67.38%, 55%, 50.86%, 48.76%, 47.38% and 46.37%, respectively. With the increase of the interlayer thickness, the strain transfer rate decreases accordingly. This tendency becomes slower with a larger thickness. Reducing the thickness of the interlayer contributes to increasing the strain transfer rate. However, in the actual encapsulation processing, if the interlayer thickness is too small, it will be hard to inject adhesive and cement to bond the optical fiber. In the following experimental tests, the inner radius of the capillary tube is selected as 500 μm and the interlayer thickness is 440 μm.

5. Experimental Verification

Based on the strain transfer rate model, a clamped FBG sensor is designed for experimental tensile tests. A bare FBG sensor, as shown in Figure 7, is bonded into a capillary tube along the axis, with a tube diameter of 1 mm, a length of 25 mm, and a gauge length of 12.5 mm, respectively. The matrix material is shown in Figure 8. The other experimental parameters are adopted by the default parameters from Table 1. Epoxy adhesive 353ND is used, curing at 70 °C for half an hour. As can be seen from Figure 8, a strain gauge, a bare FBG sensor and a clamped FBG sensor are bonded on the matrix with a section size of 10 mm × 40 mm.
Loading steps by universal testing machine are as follows:
(1).
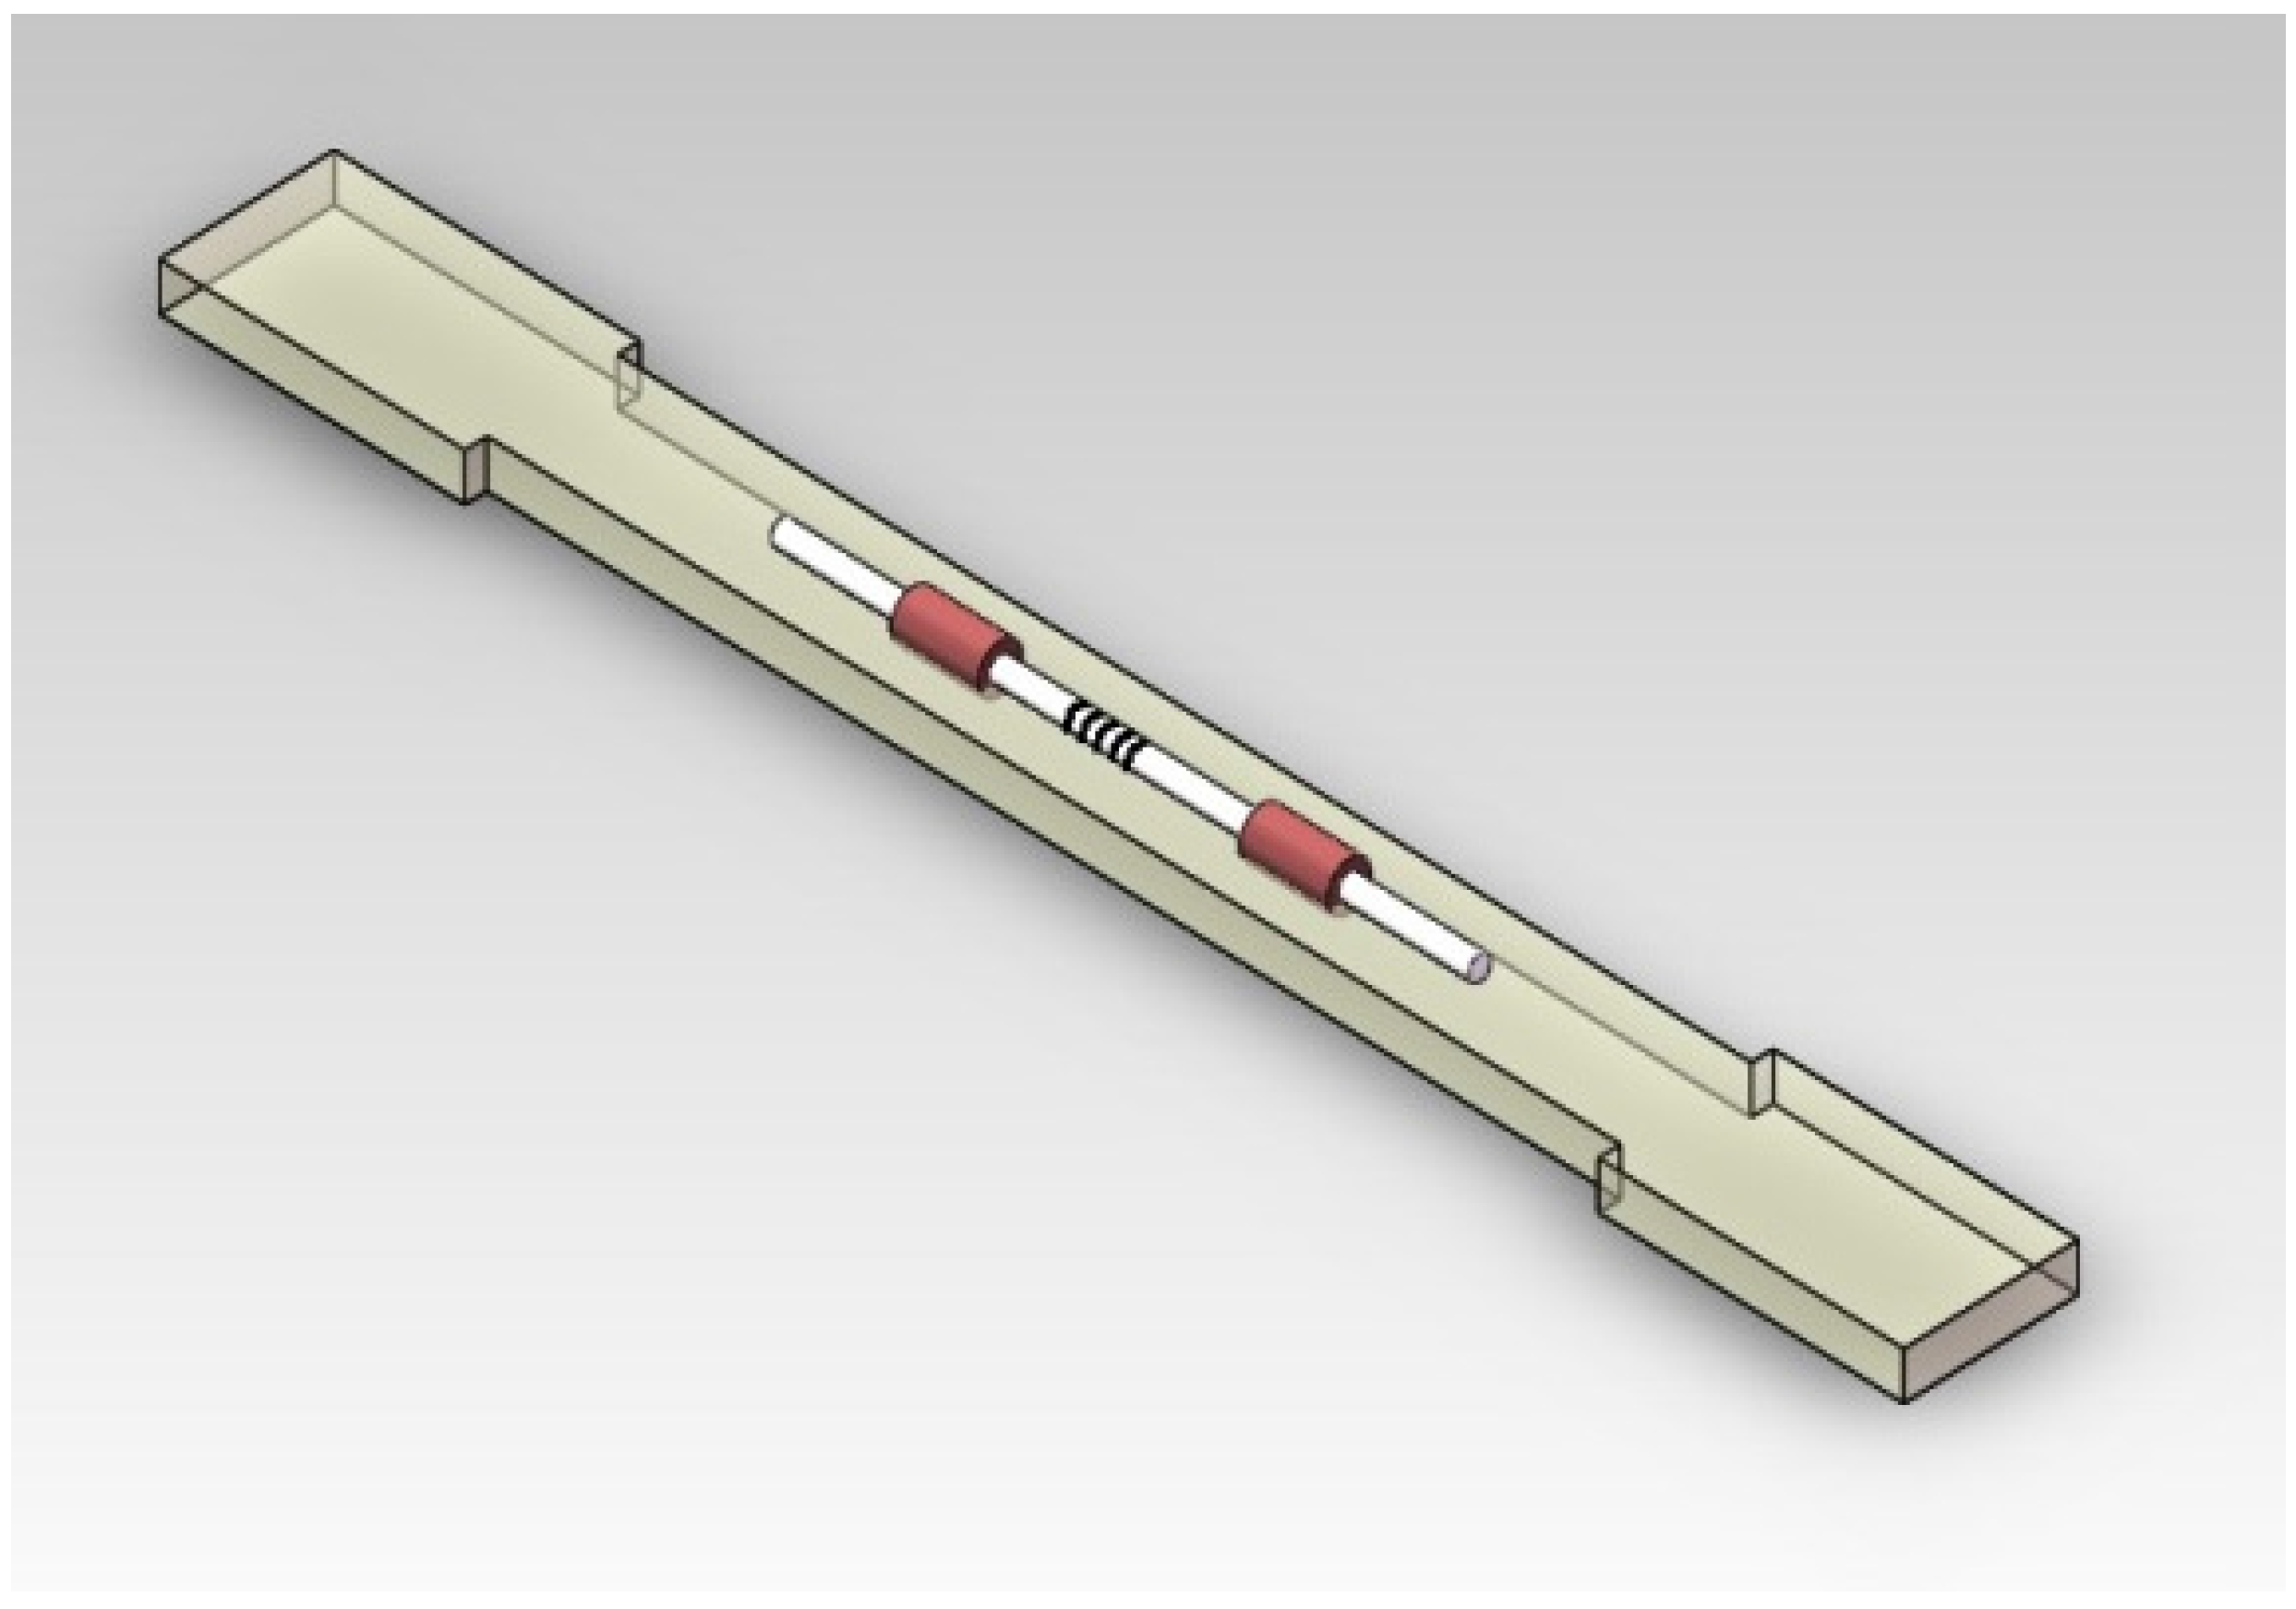
Specimen is clamped by supports on the testing machine. The pre-loading applied to the specimen is 30 kN, and the step loading is 5 kN every ten seconds until the total loading of 60 kN.
(2).
In ten seconds pause time, the resistances of the strain sensor and FBG demodulators are acquired as the immediate data.
Since the regression correlation coefficient R2 is more than 0.99, the calibration curve of the clamped FBG sensor measurement is linear. The linear calibration equation is expressed as y = 0.00086x + 1528.15, as shown in Figure 9. The calibration equation of the bare FBG sensor measurement is y = 0.00123x + 1528.02 as shown in Figure 10.
The average strain transfer rate of the clamped FBG sensor is equal to the encapsulated FBG sensor strain divided by the matrix strain, which is measured by the demodulator. α , ε e , ε m , Δ λ e , K ε are the test value of the average strain transfer rate of a clamped FBG sensor, the encapsulated FBG sensor strain, the matrix strain, the clamped FBG sensor wavelength shift, and the strain sensitivity coefficient of a bare FBG sensor, respectively. The experimental test value of the average strain transfer rate of a clamped FBG sensor can be obtained as follows:
α = ε e ε m = Δ λ e K ε ε m = 0.00086 0.00123 = 69.9 %
The theoretical value of the average strain transfer rate can be calculated from the following formula, by using the parameters in Table 1.
α ¯ = 1 a { 1 sinh ( a k L 1 ) a k L 1 cosh ( a k L 1 ) } = 64.6 %
The average strain transfer rate of the clamped FBG sensor from the experimental test is 69.9% and the theoretical result is 64.6%. The error is less than 5%, indicating a good agreement, and the theoretical model is demonstrated to be suitable for the strain transfer analysis of the clamped FBG sensor. However, the possible reasons why the theoretical result is a little smaller than the test result are discussed as follows:
(1)
Parameter error: The strain transfer rate of the theoretical model involves the elastic modulus of the optical fiber, shear modulus of the interlayer, Poisson ratio, etc. This may generate errors because of the difference between the used and actual values in testing conditions.
(2)
Model error: Some assumptions of the theoretical model lead to model errors. For example, the defect of the n-segment optical fiber appears in the writing process, which could alter the mechanical properties.
(3)
Test error: This is one important error source including sensor zero drift, asynchronous acquisition and the artificial reading error.

6. Conclusions

Theoretical analysis of the strain transfer rate of a clamped FBG sensor not only provides the secondary correction method of the matrix strain, but also lays the foundation for the clamped FBG sensor design including the sensitivity coefficient calibration and optimal design. This paper develops a theoretical model which describes the strain relationship between the matrix and the clamped FBG sensor, considering the effects of the gauge ratio and the interlayer thickness. It is observed from the analysis results that a decrease in the gauge ratio or the interlayer thickness can obtain a larger strain transfer rate. Experiment tests are carried out to verify the effectiveness and accuracy of the proposed theoretical model, which can be extended to other encapsulation types of FBG sensors.

Acknowledgments

The work described in this paper was supported by National Natural Science Foundation of China (51578347), Program for Liaoning Innovative Research Team in University (LT2015023), Natural Science Foundation of Liaoning Province (2015020578), Liaoning Bai Qian Wan Talents Program (2014921045).

Author Contributions

Li Sun, Jun Li and Chunwei Zhang developed the strain transfer theory; Chuang Li and Xiaosu Ding performed the tests. All authors wrote the paper.

Conflicts of Interest

The authors declare no conflict of interest.

References

  1. Sun, L.; Chen, C.; Sun, Q. Experimental and finite element analyses on the corrosion of underground pipelines. Sci. China Technol. Sci. 2015, 58, 1015–1020. [Google Scholar] [CrossRef]
  2. Nanni, A.; Yang, C.C.; Pan, K.; Wang, J.S.; Michael, R.R. Fiber-optic sensors for concrete strain/stress measurement. ACI Mater. J. 1991, 88, 257–264. [Google Scholar]
  3. Pak, Y.E. Longitudinal shear transfer in fiber optic sensors. Smart Mater. Struct. 1992, 1, 57–62. [Google Scholar] [CrossRef]
  4. Ansari, F.; Libo, Y. Mechanics of bond and interface shear transfer in optical fiber sensors. J. Eng. Mech. 1998, 124, 385–394. [Google Scholar] [CrossRef]
  5. Li, D.; Li, H.N. Strain transferring analysis of embedded fiber Bragg grating sensors. Acta Mech. Sin. Chin. Ed. 2005, 37, 435–441. [Google Scholar]
  6. Zhou, G.; Li, H.; Ren, L.; Li, D. Influencing parameters analysis of strain transfer in optic fiber Bragg grating sensors. SPIE Proc. 2006, 6179. [Google Scholar] [CrossRef]
  7. Sun, L.; Hao, H.; Zhang, B.; Ren, X.; Li, J. Strain Transfer Analysis of Embedded Fiber Bragg Grating Strain Sensor. J. Test. Eval. 2016, 44. [Google Scholar] [CrossRef]
  8. Yuan, L.; Zhou, L. Sensitivity coefficient evaluation of an embedded fiber-optic strain sensor. Sens. Actuators A 1998, 69, 5–11. [Google Scholar] [CrossRef]
  9. Zhang, G.; Jing, C.; Li, X.; Mi, X.; Li, Y.; Hao, L. Research on strain transfer of surface fiber grating sensor. Laser Optoelectron. Prog. 2014, 1, 52–57. [Google Scholar] [CrossRef]
  10. Zhou, Z.; Li, J.L.; Ou, J.P. Interface strain transfer mechanism and error modification of embedded FBG strain sensors. J. Harbin Inst. Technol. 2006, 1, 49–55. [Google Scholar]
  11. Zhou, Z.; Wang, Q.; Hao, X. Strain transfer analysis of the FBG sensor considering the creep of the concrete host. China Meas. Test 2016, 42, 1–32. [Google Scholar]
  12. Chen, H.; Guo, Y. Strain transfer analysis and experimental research of substrate package fiber grating sensor. Transducer Microsyst. Technol. 2016, 35, 38–41. [Google Scholar]
  13. LI, T.; Tan, Y. Strain transfer factors of pasted FBG on bending part surface. Opt. Precis. Eng. 2015, 23, 1254–1264. [Google Scholar]
  14. Wan, K.T.; Leung, C.K.Y.; Olson, N.G. Investigation of the strain transfer for surface-attached optical fiber strain sensors. Smart Mater. Struct. 2008, 17, 035037. [Google Scholar] [CrossRef]
  15. Ho, S.C.M.; Ren, L.; Li, H.; Song, G. Dynamic fiber Bragg grating sensing method. Smart Mater. Struct. 2016, 25, 025028. [Google Scholar] [CrossRef]
  16. Rodriguez-Cobo, L.; Cobo, A.; Lopez-Higuera, J.M. Embedded compaction pressure sensor based on Fiber Bragg Gratings. Measurement 2015, 68, 257–261. [Google Scholar] [CrossRef]
  17. Tang, C.; Wang, T.X.; Huang, W.M.; Sun, L.; Gao, X.Y. Temperature sensors based on the temperature memory effect inshape memory alloys to check minor over-heating. Sens. Actuators 2016, 238, 337–343. [Google Scholar] [CrossRef]
Figure 1. Mechanical model of clamped fiber Bragg grating (FBG).
Applsci 07 00188 g001
Figure 2. Mechanical model of m-segment micro unit.
Applsci 07 00188 g002
Figure 3. Mechanical model of interlayer micro unit.
Applsci 07 00188 g003
Figure 4. The axial distribution of FBG strain transfer rate.
Applsci 07 00188 g004
Figure 5. Gauge ratio-FBG strain transfer rate.
Applsci 07 00188 g005
Figure 6. Interlayer thickness vs. strain transfer rate of a clamped FBG sensor.
Applsci 07 00188 g006
Figure 7. Bare FBG sensor.
Applsci 07 00188 g007
Figure 8. Matrix material.
Applsci 07 00188 g008
Figure 9. Calibration curve from tests on a clamped FBG sensor.
Applsci 07 00188 g009
Figure 10. Calibration curve from tests on a bare FBG sensor.
Applsci 07 00188 g010
Table 1. Physical and mechanical parameters.
Parameter/UnitSymbolValue
Elastic modulus of optical fiber/MPaEg72,000
Elastic modulus of interlayer/MPaEj30
Poisson ratioµ0.48
Radius of optical fiber/μmrg62.5
Interlayer thickness/μmh440
Gauge ratio parameterA1.25
Interlayer length/mmL125

