1. Introduction
To improve heat efficiency and avoid excessive current which may deteriorate the quality of welding seam, double-wire submerged arc welding was proposed in the middle of the last century [
1], and then was commonly employed in many relative occasions. However, because submerged arc welding employs granular materials as shield, it can only be applied in flat position of welding. To overcome this limitation, double-wire metal inert-gas (MIG) arc welding was then proposed, and increasingly employed in both of academic and practical industrial areas [
2,
3].
During past decades, the introduction of automation and robotic operation in industry required real-time monitoring and control of the welding process [
4]. To improve the double-wire MIG arc welding system and obtain products with more satisfactory quality, as well as more stable welding process, many scholars and engineers took much effort to explore how to improve the efficiency to achieve the goals during the process. Li et al. [
5] studied the modeling and controlling of the consumable double-wire MIG arc welding process, and concluded that the process offered unique advantages but required appropriate control to materialize the advantages, and then they selected proper inputs and outputs for an interval model control system and obtained a desired welding process. Reis et al. [
6] evaluated the influence of parameters of adjacent arcs in double-wire MIG arc welding and single arc in gas tungsten arc welding (GTAW) on the occurrence of arc interruption, then confirmed that proper distances between the adjacent arcs and intervals between the current pulses can eliminate the arc interruptions. Niu et al. [
7] studied the effect of peak of pulse voltage on the metal transfer and welding seam formation by means of a self-designed experimental platform, and then concluded that the effect of peak of leading wire current on metal transfer was significant, high peak of pulse voltage could induce good welding seam, but excessive voltage might deteriorate the quality of welding seam. Moinuddin et al. [
8] conveyed new observations on the arc stability in anti-phase synchronized synergic-pulsed two-wire MIG arc welding, and concluded that the separation of arcs in time by anti-synchronization and a synergic pulsed can be better utilized to control the arc instability. Shi et al. [
9,
10] studied twin wire indirect arc by simulation and experiments with different arc lengths, and then obtained the characteristics of arc under welding currents with different values during the process. Ding et al. [
11] established a three-dimensional (3D) model to explore the effect of welding current on the arc plasma behavior, and then conducted actual experiments to compare the simulation results and obtained a good agreement. All of the these previous works showed that the application of double-wire MIG arc welding can play an important role in current practical industry and be focused by more and more relative researchers and agencies.
As for the control action, majority of previous works focused on the current waveforms control because it was a main operation during the process. For the leading wire current and trailing wire current, there were some different forms, such as having the same frequencies but inverse phases (SFIP), or having the same frequencies together with the same phases (SFSP). Generally, previous works considered that, although the noise was small and the process steady, welding penetration was small when the SFIP was employed [
12]. In other work, Ueyama et al. [
13] used a method of delay the pulse off timing of trailing arc by 0.4–0.5 ms from that of leading arc, to prevent adverse effects caused by electromagnetic interactions between two adjacent arcs to prevent arc interruption. In this work, SFSP was used. In addition, Ueyama et al. [
14] found that if the peak period of trailing current was delayed by 0.5 ms compared to the leading current, more satisfactory welding quality and more stable welding process would be obtained. In our previous work [
15], the SFIP form was used, and symmetrical transition periods were added. Then the welding process was much steadier, and the welding seams with more much satisfactory quality can be obtained.
More works focused on improving the current waveforms control to eliminate the negative phenomena and obtain welding seam with satisfactory quality, however, the work cannot change the working frequency of two wires currents, and the process did not concern the effects if the two currents were not symmetrical. In this work, we tried to change one wire current by means of multi-frequency modulation, through a series of theoretic analysis, experimental validations and corresponding result analyses by auxiliary mathematical tools, such as orthogonal experiments, probability density function, and range analysis, were conducted. Corresponding results showed that the proposed multi-frequency waveform control method can improve the double-wire MIG arc welding technology, not only in process stability, but also in obtaining beautiful welding seam with satisfactory quality.
The rest of this paper is organized as follows. In
Section 2, the principle of the double-wire MIG arc welding is outlined.
Section 3 introduces the proposed multi-frequency current waveform control method, based on the previous employed methods. Then,
Section 4 provides the experimental setup and program.
Section 5 gives the detailed experimental procedures, and experimental results and corresponding analyses. In this section, other auxiliary mathematical tools are introduced and applied in the experiments. Finally,
Section 6 offers some concluding remarks and suggestions for future work.
2. Principle of Double-Wire MIG Arc Welding
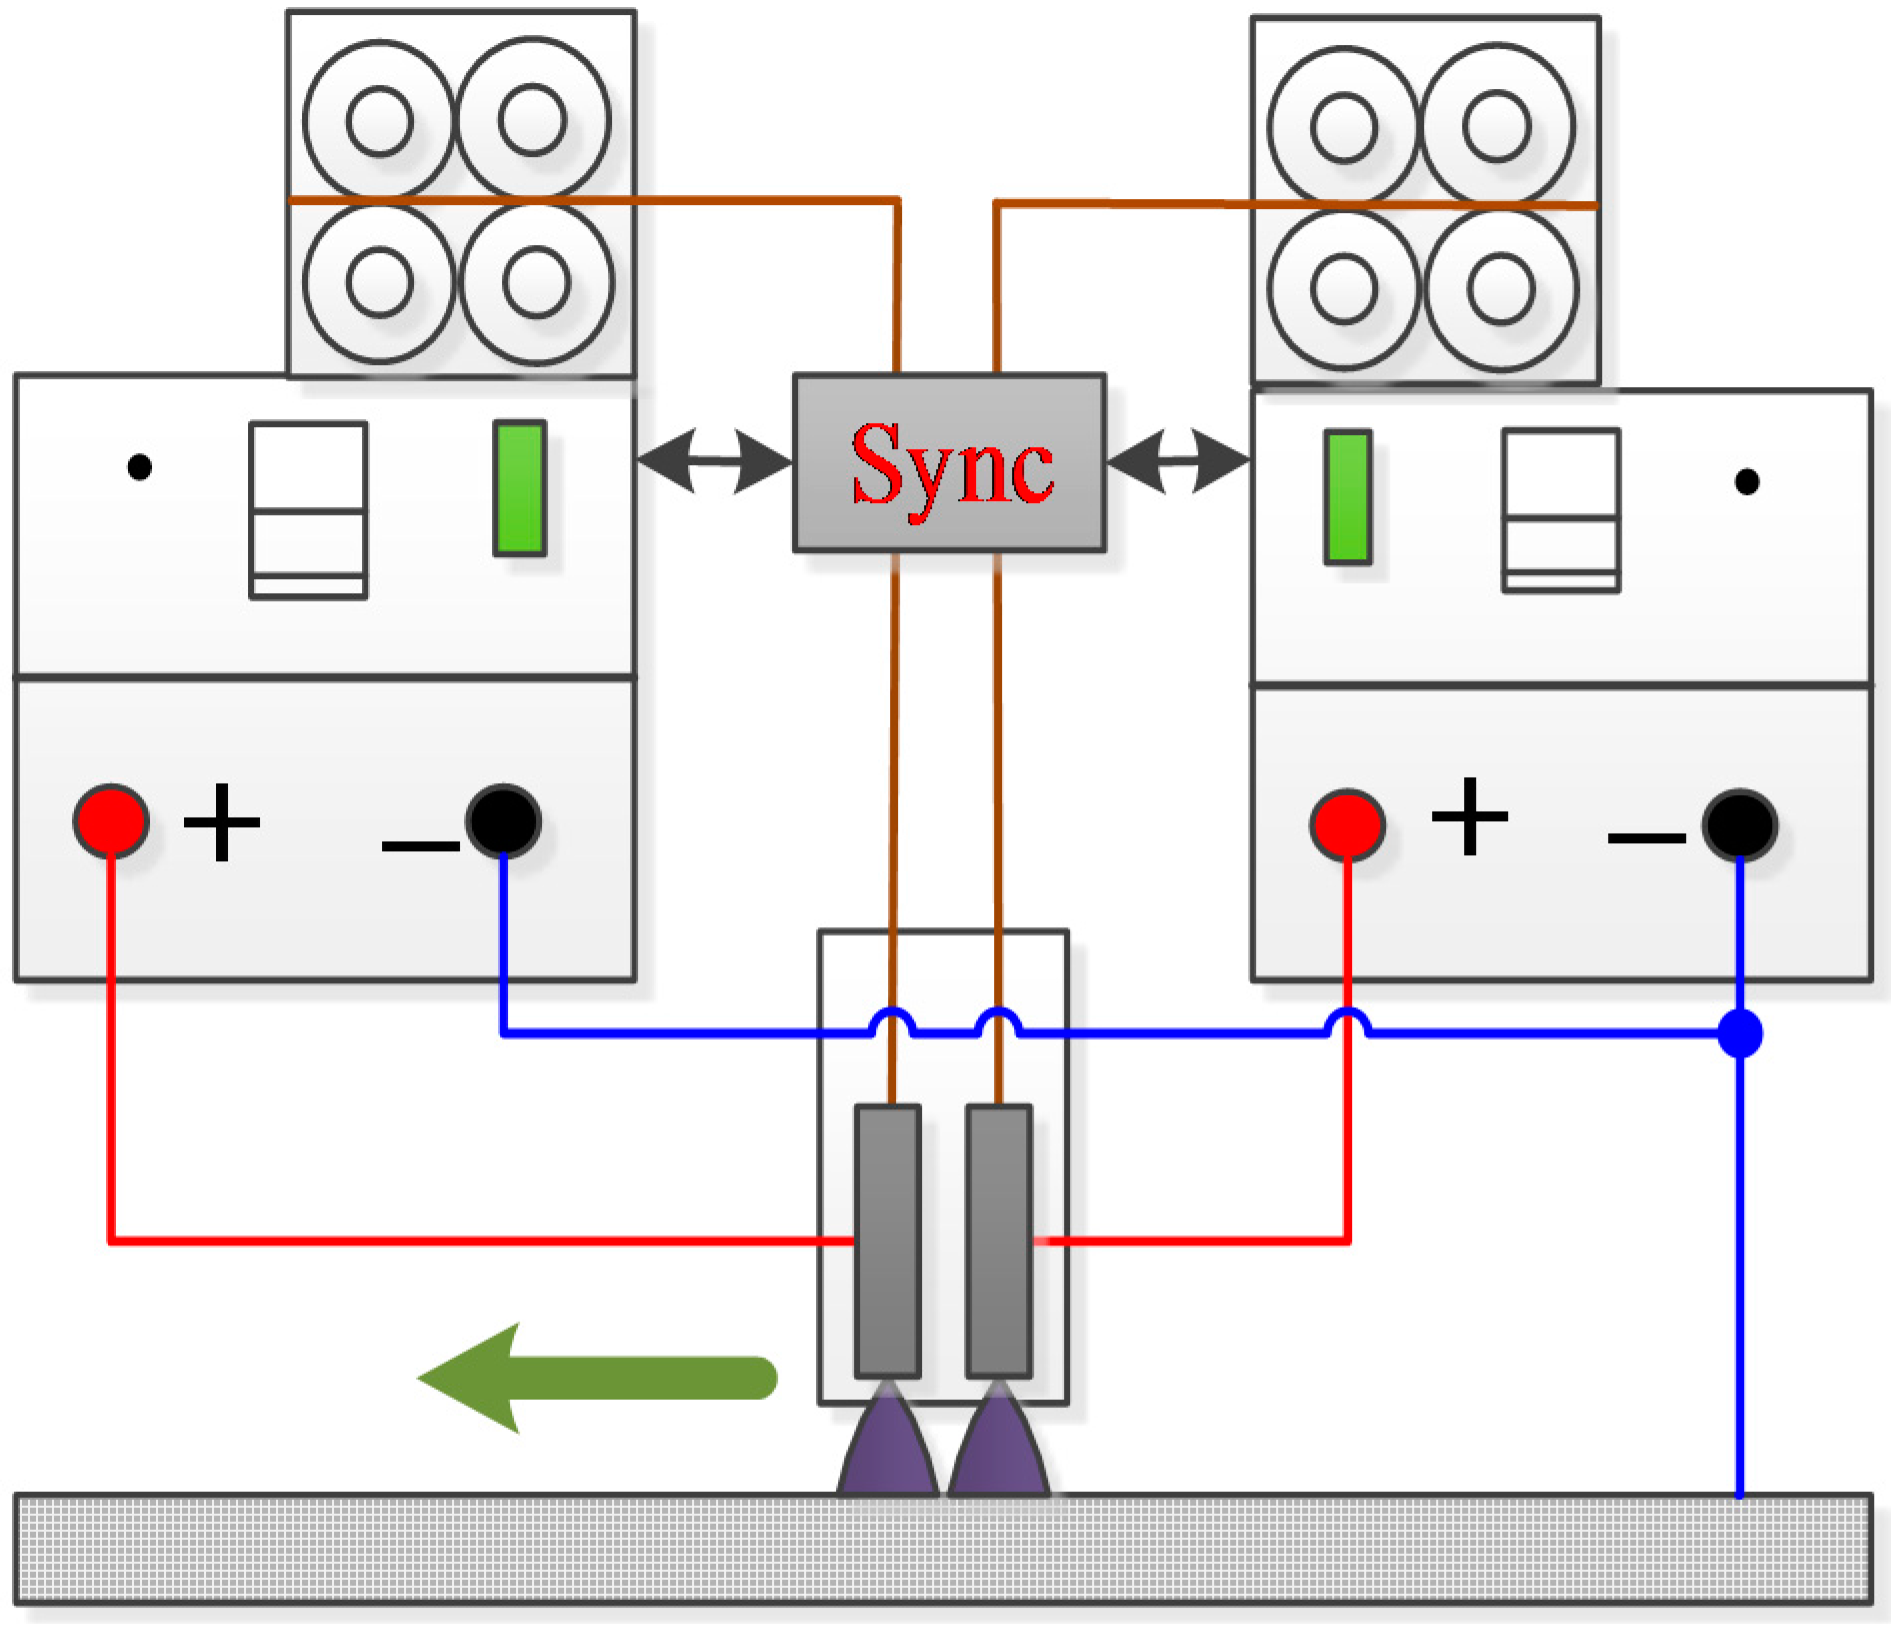
Double-wire MIG arc welding facility is composed of two separated welding power sources and corresponding two wire feeders. Currently, the most commonly employed is the Tandem double-wire technology, whose schematic is shown in
Figure 1. This technology put the two separated wires in a specially-designed welding gun in a predetermined pattern. During the working process, two wires are fed by two individual separated welding power sources, and insulated from each other. Then, the two power sources collaborate via a center control system. Apart from the wire feed rate, all of the other operational parameters are independent from each other, including the diameters and materials of the wires, whether or not feeding the wires by impulse signals, and so on. Under the circumstance, the electrical arcs can be controlled in an optimal pattern, and the mutual interference between two arcs can be as low as possible, under the precondition that the arcs were steadily stricken [
16].
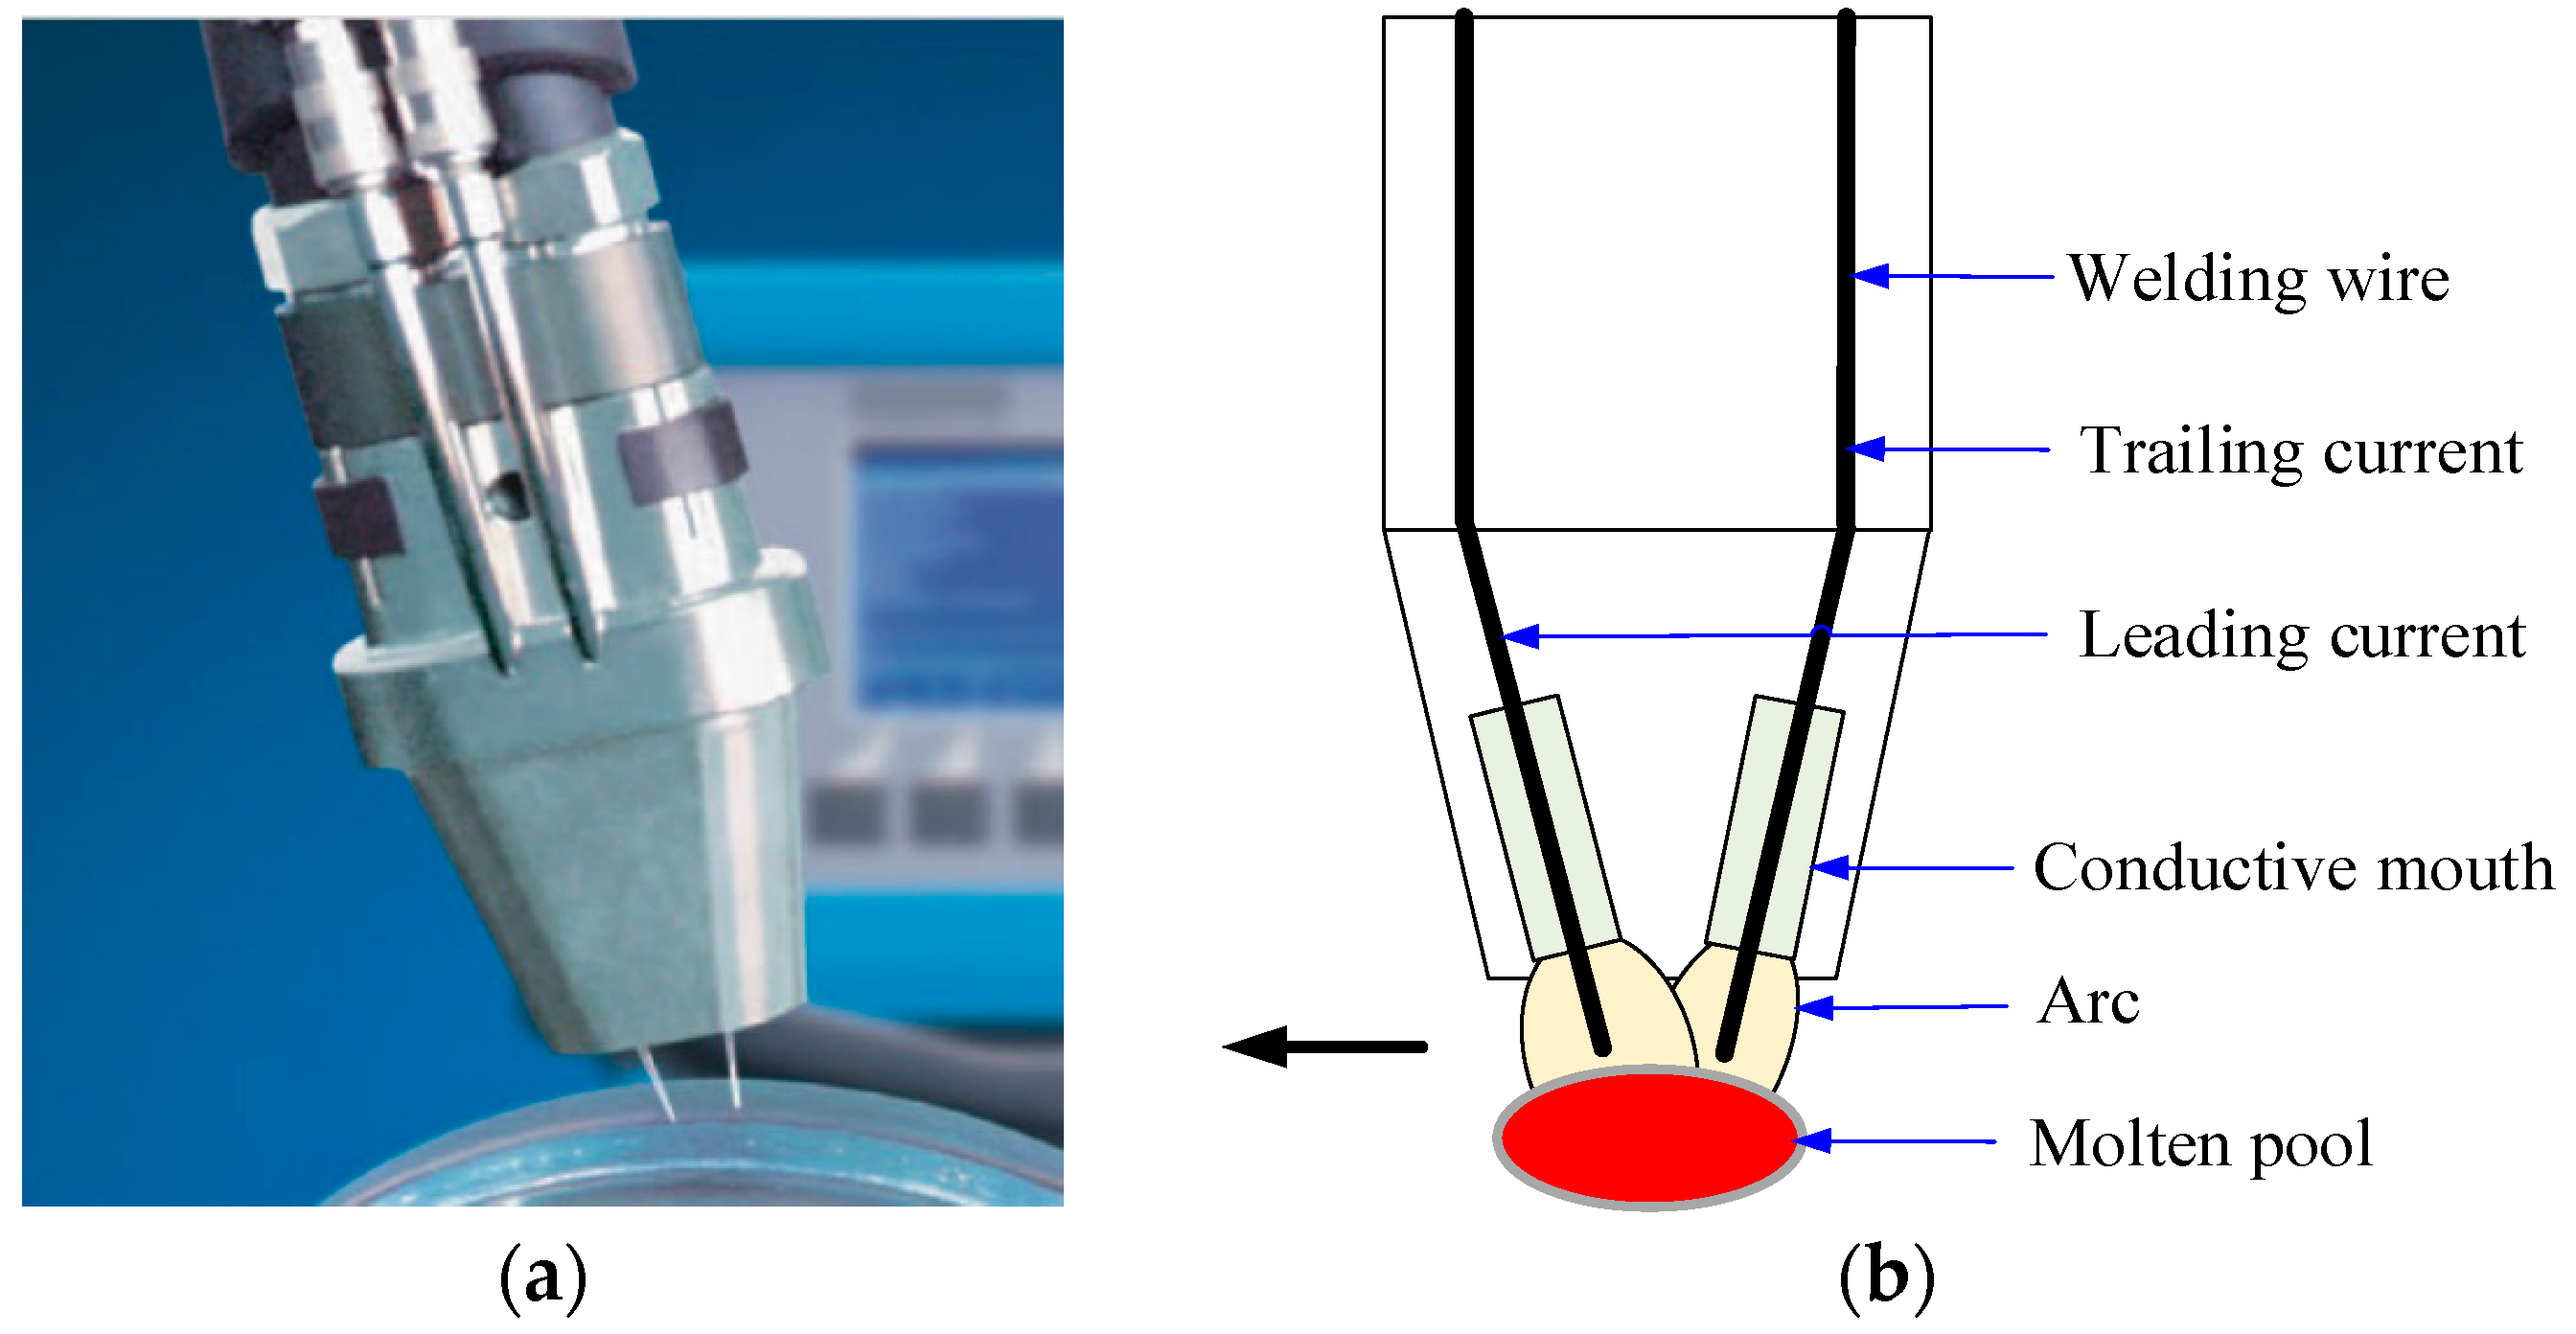
Figure 2 shows the welding touch and corresponding welding pool of a double-wire MIG arc welding.
Figure 2a is a typical structure of the tandem welding gun. Two electrical nozzles are separated and independently feed the corresponding wires. Because the welding gun is so heavy and has a very high rate, double-wire MIG arc welding operation is usually realized by means of robotics or other relative automatic welding facilities.
Figure 2b shows the welding pool of the double-wire MIG arc welding, which can clearly show the working process. The two welding wires are leading wire and trailing wire. The front one is the leading wire with a large value of current and is used to backing welding to increase the welding penetration, while the other is the trailing wire and used to optimize the cover of the welding seam. During the process, the leading wire and trailing wire are working in the same welding pool. The heat generated by one wire can affect the other. In other words, the heat from leading wire can melt the trailing wire, while the heat from the trailing wire can increase the melting rate of the leading wire. Hence, this is a mutually promoting process. Under the circumstance, the deposited amount of the welding operation can be further increased, while the heat supplying to the parent metal can be decreased. This conduction can benefit the final quality of welding product under the same power supplied.
During the pulse welding process, the welding current is switched between high-level value and low-level value, and then a welding arc with the form of current pulse is generated [
17]. Two wires can induce two welding electrical arcs working during the process. Then, the pulse current generates a continuous welding seam which links all the welding spots. Each spot in the welding seam is generated by the welding current in peak value. High-level current is used for striking arc, and named as peak current in practice. Then, the current is switched to low-level, named the background current. The base value current is used to hold the arc and avoid the arc unsuccessfully striking again. In double-wire MIG arc welding process, the pulse currents are generated between leading wire and trailing wire, and the center control system adjusts both of the two waveforms to realize predetermined welding schedule.
3. Proposed Multi-Frequency Double-Wire Impulse Welding Method
During the double-wire MIG arc welding process, the distance between two wires is very small, generally 8–12 mm. The mutual electromagnetic force between the two electrical arcs can induce some unsteady phenomena and may change the electrical arc. If the change is very large, arc interruption, irregular metal transfer or considerable expulsion may occur during the process [
15].
To reduce the mutual interference between two welding wires, the effect of the electromagnetic force on the process should be seriously considered. Ueyama et al. [
18] established an equation to calculate the electromagnetic force between two wires as follows:
where
F is the electromagnetic force, which is Lorentz force;
IL is the leading current;
IT is the trailing current;
0 is the permeability of free space;
DE is the distance between the two wires; and
rT is the radius of the trailing arc column. This equation indicates that the product of the currents of the two wires can determine the electromagnetic force under the condition that the other physical conditions remain unchanged. Hence, proper control action for the current waveform of each wire can not only determine the heat efficiency and quality of welding seam, but also influence the stability of the welding process.
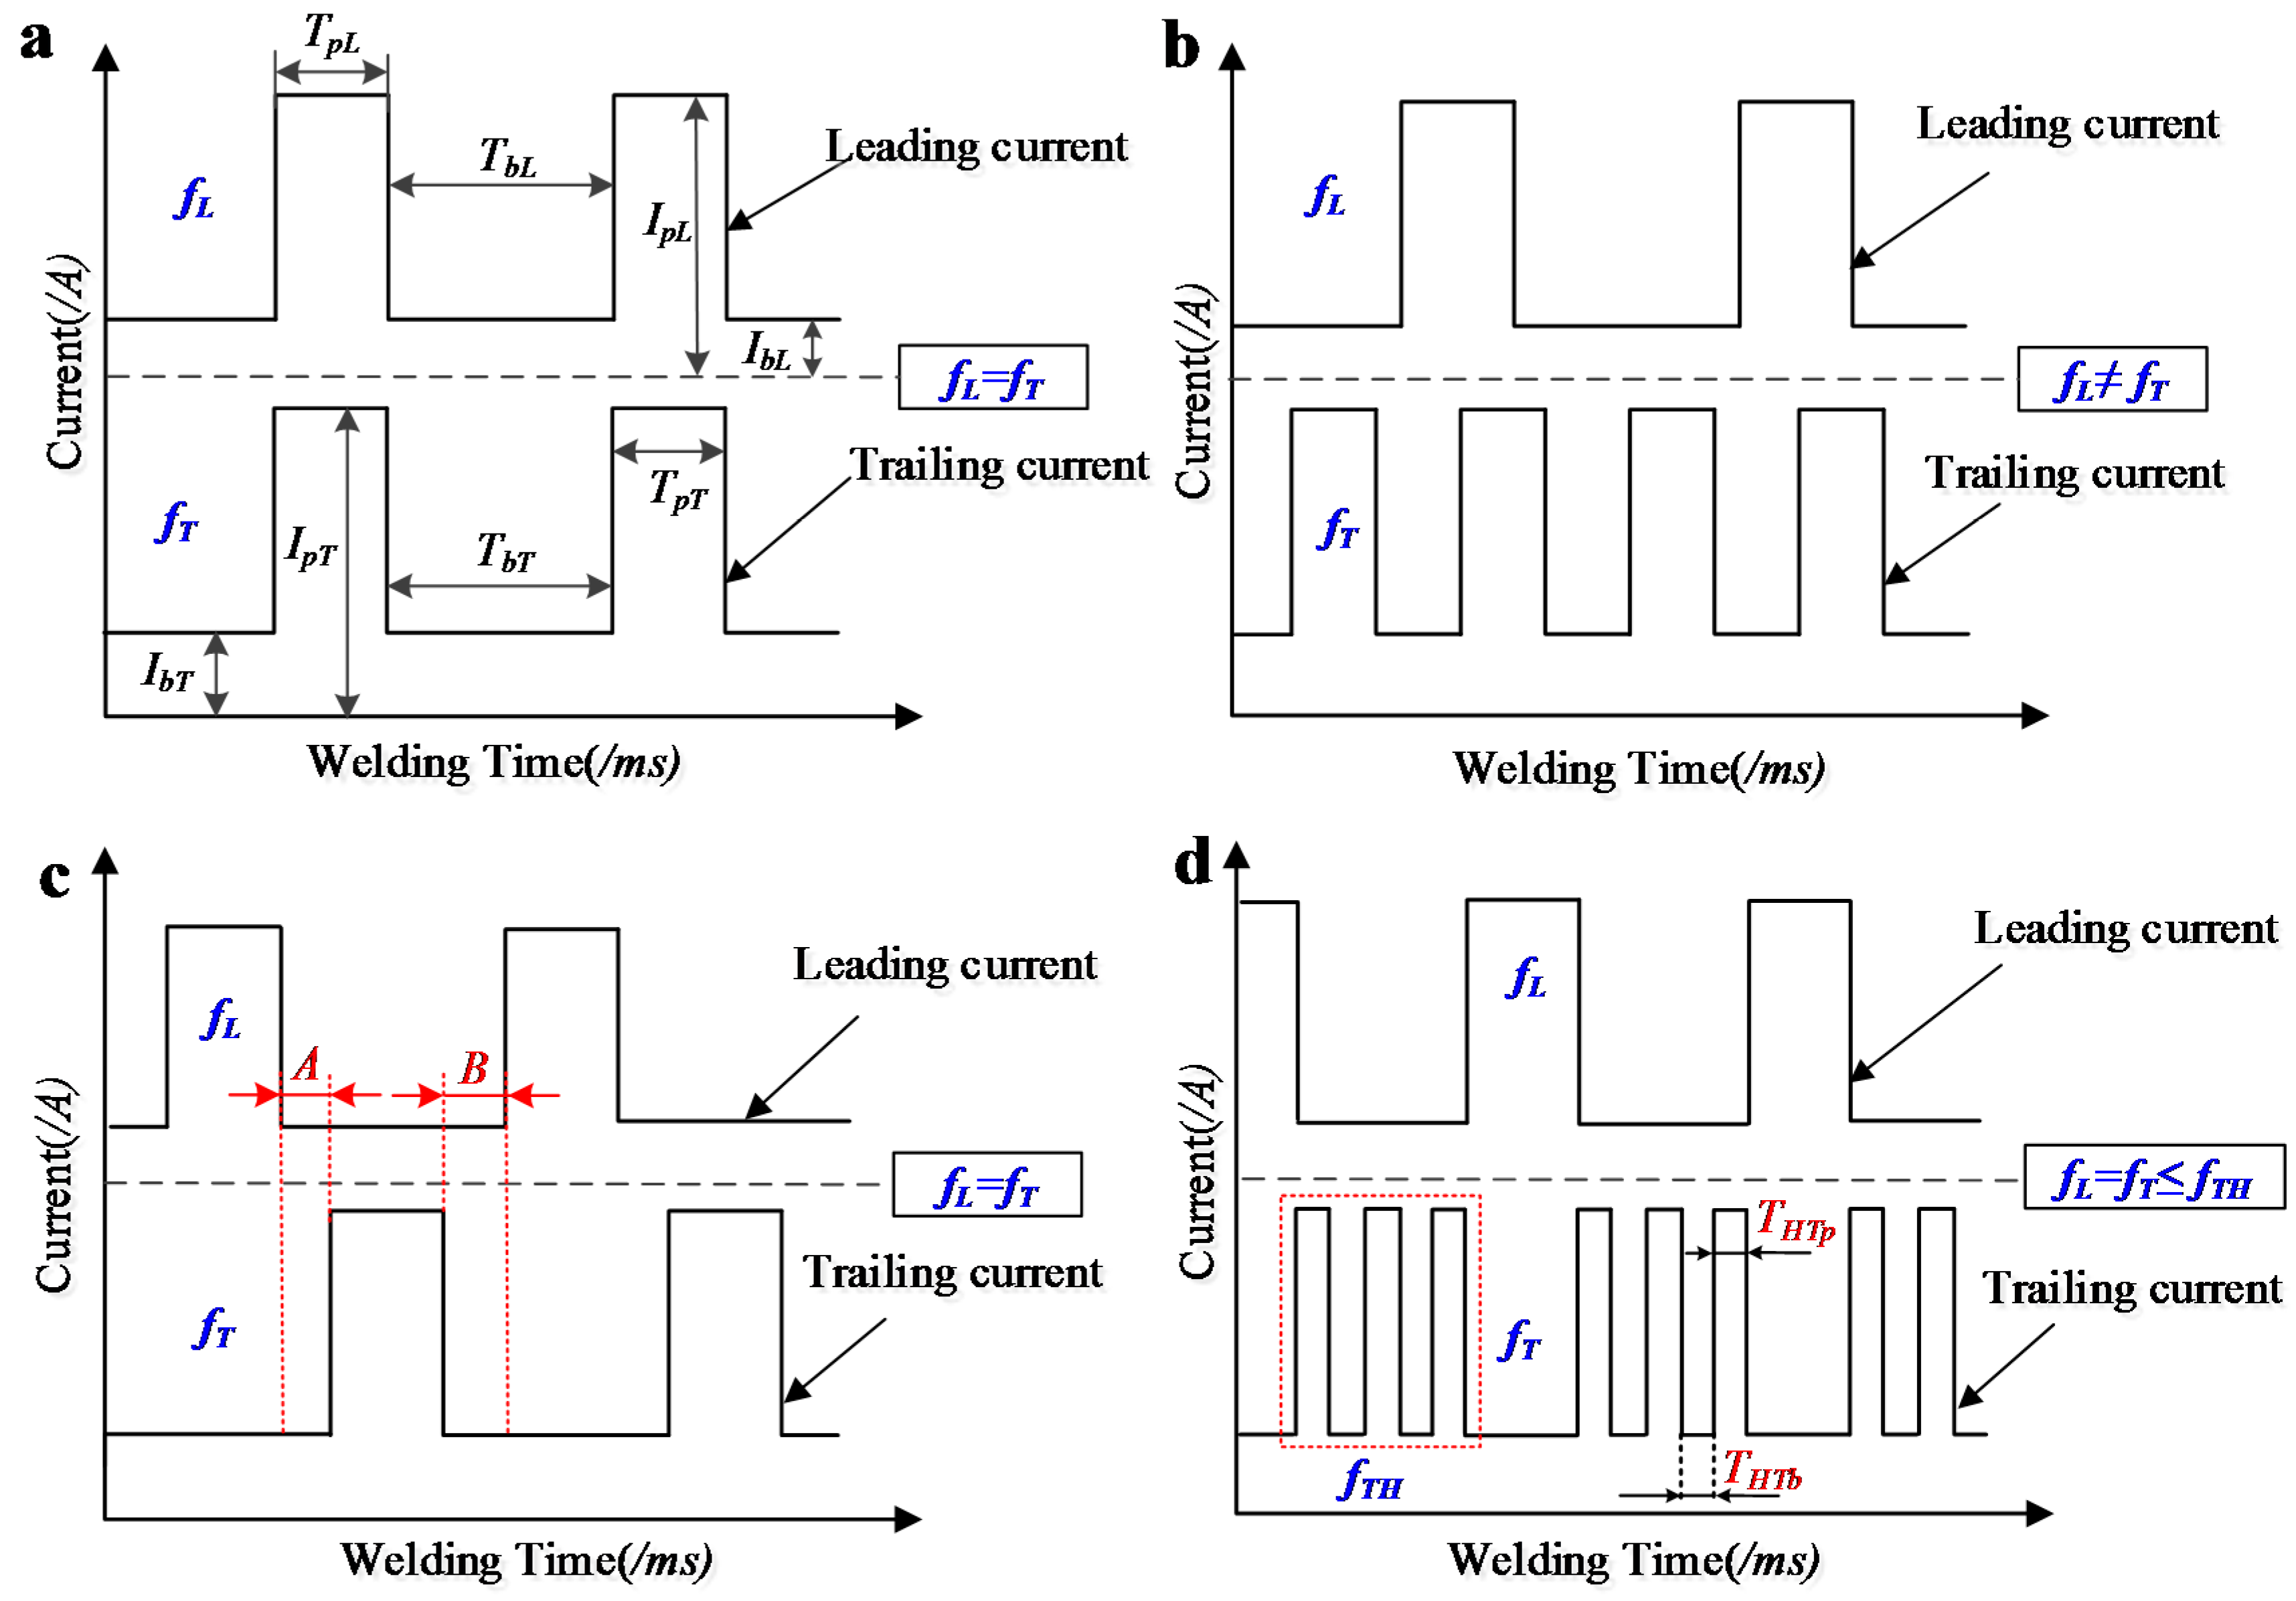
Generally, there are three different relations between the current waveforms of two wires, as shown in
Figure 3a–c. In the figure,
fL and
fT are, respectively, the pulses frequencies of the leading wire and trailing wire. Apart from the frequencies, there are some other important variables, such as peak current of leading wire (
IpL), base current of leading wire (
IbL), peak current of trailing wire (
IpT), base current of trailing wire (
IbT), peak time of leading wire (
TpL), base time of leading wire (
TbL), peak time of leading wire (
TbL), peak time of trailing wire (
TpT), and base time of trailing wire (
TbT). The mathematical descriptions of the two frequencies are as follows:
Figure 3a shows that the current waveform of leading wire and the current waveform of trailing wire have the same frequency together with the same phase. Because the two arcs have the same phase, there is large electromagnetic force which has significant mutual interferences.
Figure 3b shows another case where the two types of current waveforms have random frequencies and random phases. The mutual interference may still exist, in addition, because the phase change and the metal transfer are irregular, the change of electromagnetic force is also irregular, which make the welding process difficult to properly control. To reduce the influence resulting from the electromagnetic force, the case which the two current waveforms have the same frequencies but inverse phases is commonly employed in reality. The phase of the current waveforms have difference of 180°, and under this circumstance, the mutual electromagnetic force may be one fourth of that in
Figure 3a. In addition, the influence on metal transferring process in this case is much less.
In addition, the duration of the currents holding the peak values should not be too long, otherwise, irregularity of metal transferring process and unsteady welding process may occur. Hence, the currents should be in base values for a certain time. However, when the two currents were in the base values at the same time, such as in Stage A and Stage B in
Figure 3c, arc interruption may occur because the heat delivery was less, at the same time the welding process is unstable.
Considering the different situations above and combining electromagnetic theories, relative experiments and corresponding analyses [
19,
20,
21], a new multi-frequency double-wire waveform control method (
Figure 3d) was proposed in this work. It can be seen from the figure that when the leading wire current switched from peak stage to base stage after one cycle, the central control system gave out a signal which made the trailing wire current turning from base stage to peak stage. In addition, the pulse of trailing wire current can be modulated to be a high-frequency pulse set which is composed of some high-frequency pulses. After one cycle, when the trailing wire current turned from peak stage to the base stage, the central control system made the leading wire current turning from base stage to peak stage. This process was a circling process and guaranteed the electrical arcs from the two wires are steadily stricken, and avoiding appearance of mutual interference.
This new current waveform control method required two new variables, trailing wire high-frequency peak time
THTp and trailing wire high-frequency base time
THTb. Moreover, the trailing wire current peak modulation frequency
fTH can be deducted from the above two times. The mutual relations between those variables can be shown as follows:
In addition, a duty cycle (
DC), which denoted the ratio between the time of high current and the whole time, was also commonly used to describe the current waveform in double-wire MIG arc welding. We employed
DCL and
DCT to describe the duty cycles of leading wire and trailing wire currents, respectively; the mathematical descriptions are as follows:
It can be obviously observed that:
According to above analyses, this new current waveform control method may have the following advantages:
- (a)
In this method, the trailing wire current can be switched between peak stage and base stage with the frequency of fTH, which can help improve the cover of the welding seam and form regular fish-scale grain.
- (b)
The process of switching between peak stage and base stage of the trailing wire can stir the welding pool, the gas inside the pool would be much adequately discharged, hence the air holes could be decreased. In addition, the heat delivery for the parent metal was also decreased, and it can prevent the excessive inflation of surface of the parent metal. Moreover, it can make the makeup of the welding seam more regular and compact.
- (c)
This method can decrease the duration when both of the leading wire current and trailing wire current were in the base stage; meanwhile, the duration may be more dispersive by means of high frequency modulation. It can decrease the possibility of appearance of some unsteady phenomena, such as arc interruption. Hence, the stability of welding process can be improved.
- (d)
Because the frequency at which the peak stage of trailing wire current appears was increased, the heat dissipation when the leading wire current was in the base stage was decreased, which can make the leading wire hold a continuous thermal supply and increase the deposition rate during the process. Hence, this method can improve the thermal efficiency under the condition that current peak and current base were unchanged.
4. Experimental Setup and Program
4.1. Experimental Setup
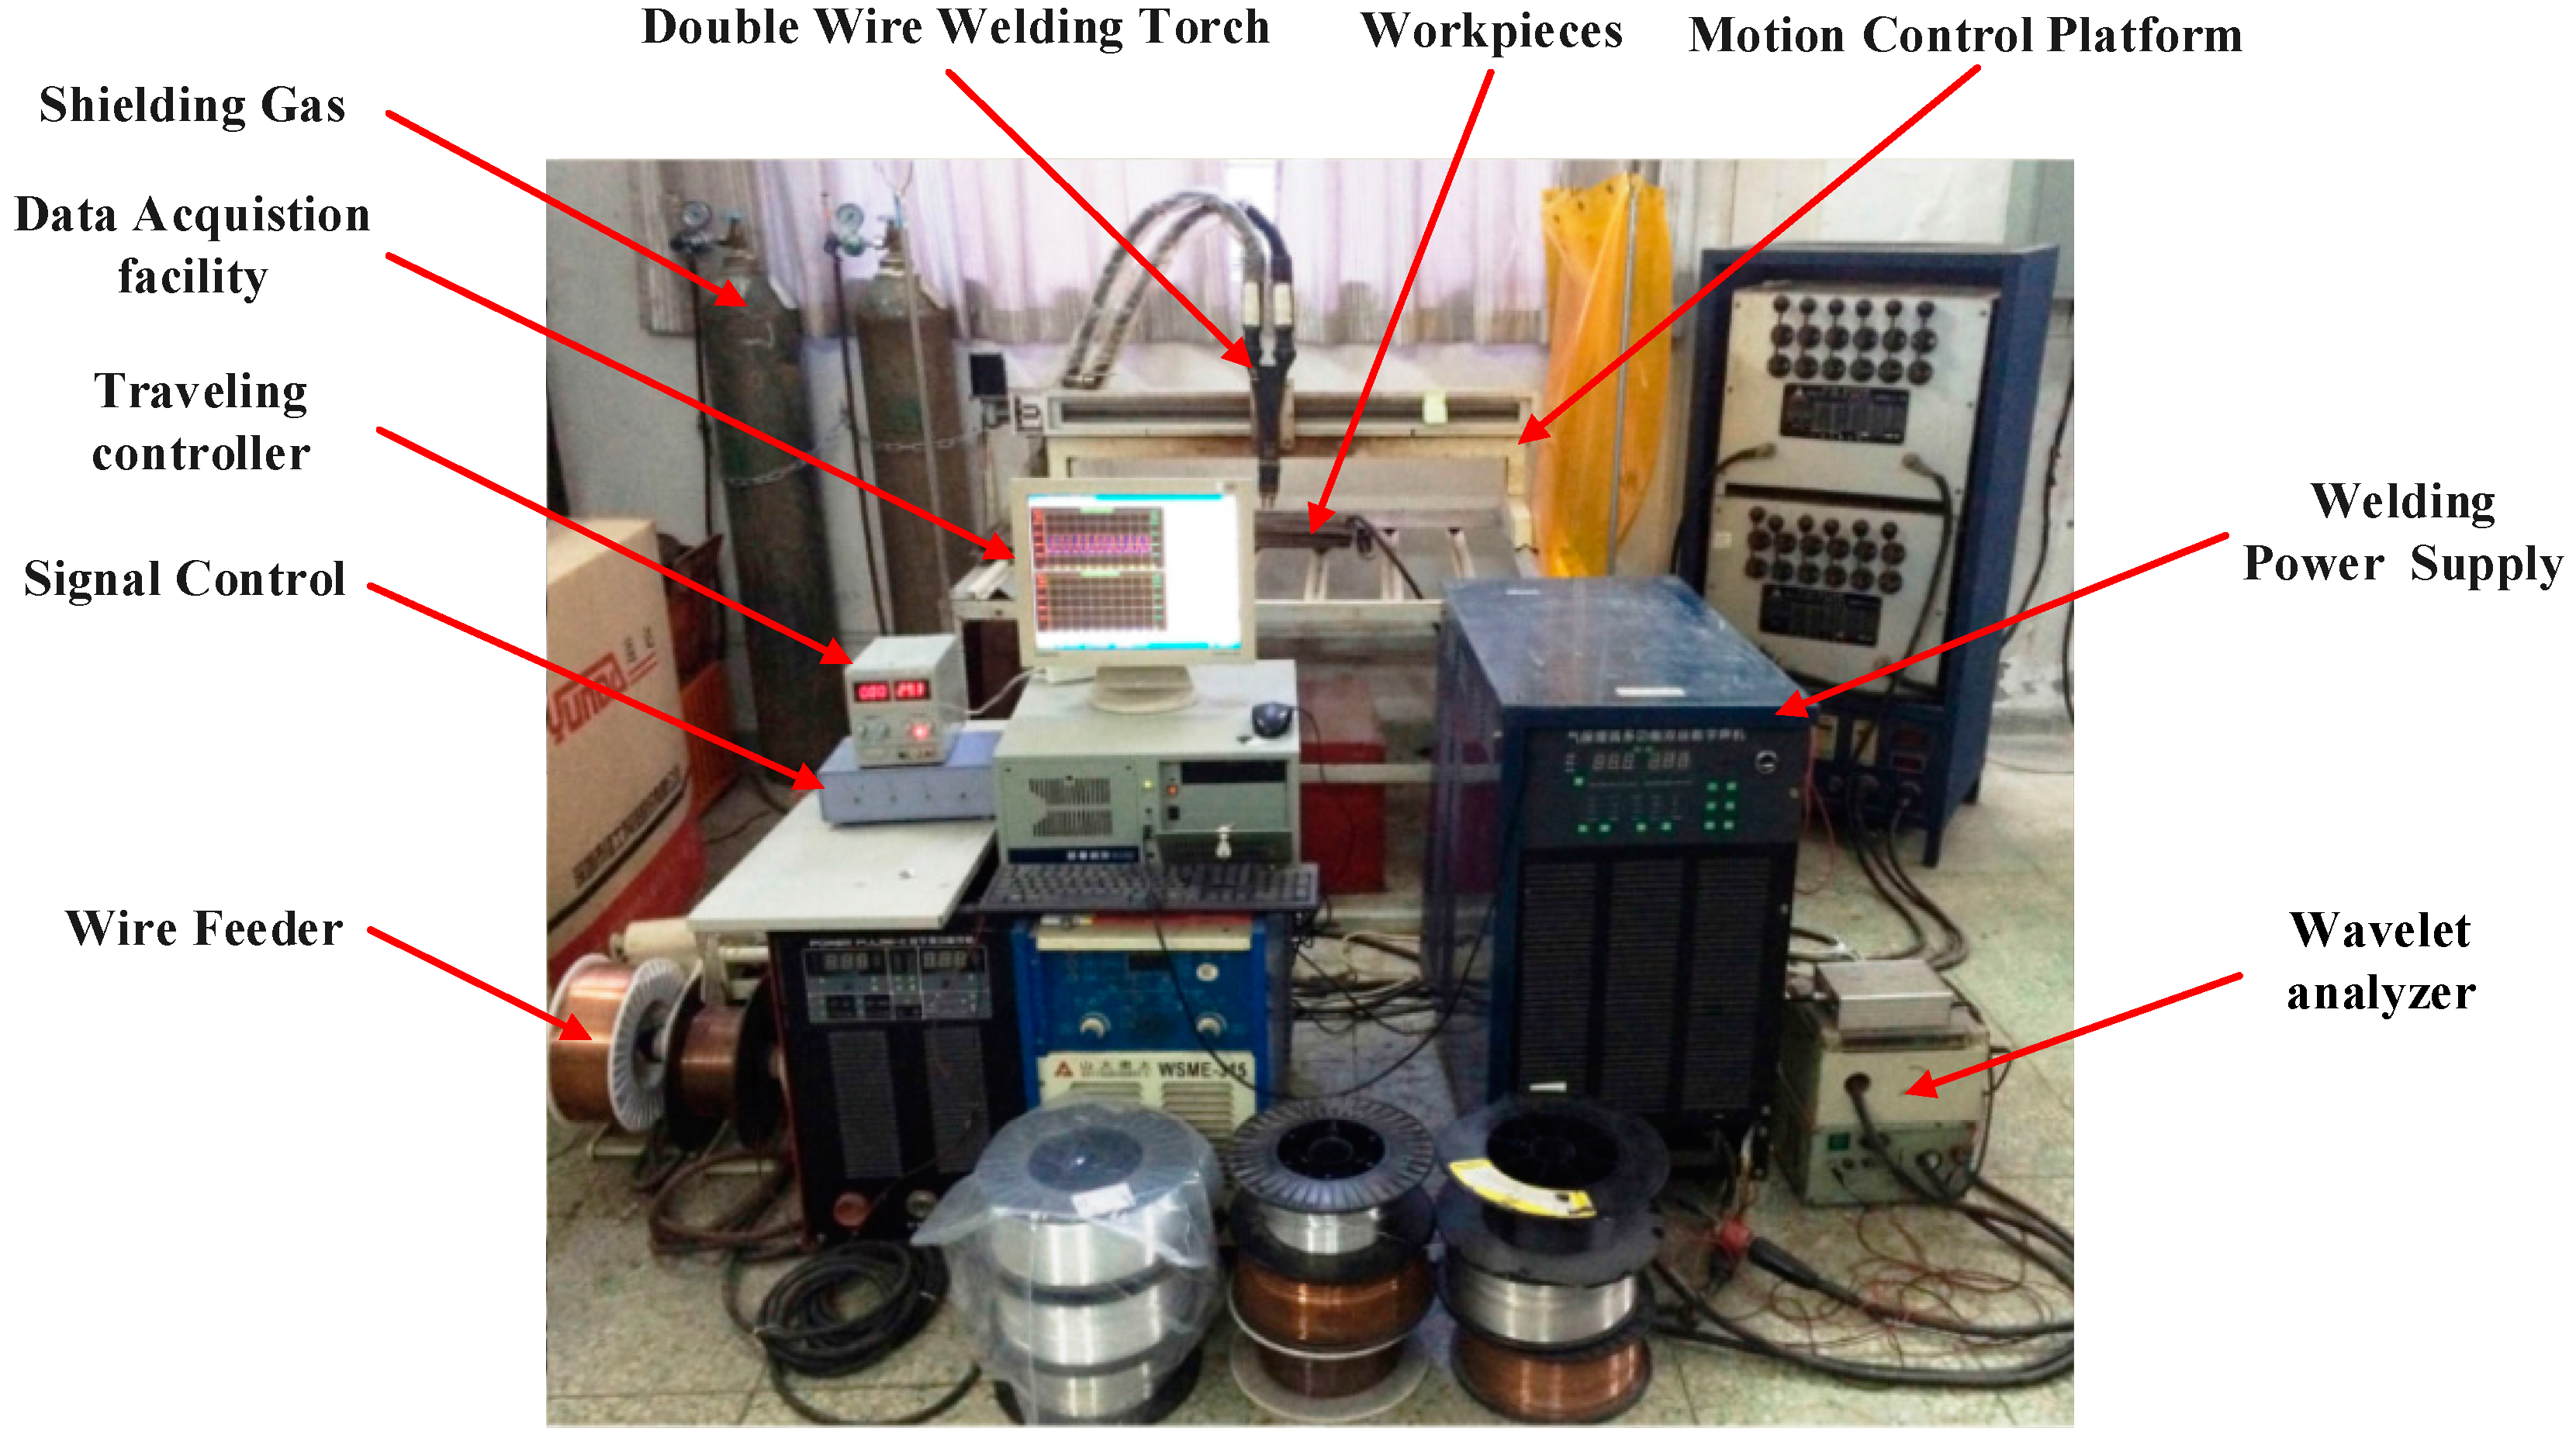
To validate the proposed method and obtain more satisfactory welding products, corresponding experiments are conducted. The experimental platform is mainly composed of a Digital Signal Processor (DSP) integrated double-wire MIG arc welding power source, a traveling controller, a welding test bench, a dynamic arc wavelet analyzer, a wire feeder, a welding gun and a motion control platform. During the welding process, the welding gun is fixed on the motion control platform, and its movement is driven by the control platform.
Figure 4 shows the experimental platform employed in this work.
During the experiments, after several trials, proper experimental conditions were chosen as follows: the peak of the leading wire current was 340 A, while the base was 78 A; the duration of the leading wire current in peak stage was 5.2 s; the base of the trailing wire current was 78 A; the parent metal was Q235 steel with 8 mm of thickness; welding wire was H08Mn2SiA (Φ = 1.0 mm); shielding gas was pure argon (flow 15 L/min); wire stretch was 12.0 mm; and the distance between the two terminates of the wire was 8.0 mm. In addition, bead-on-plate welding was used, and the speed of the traveling equipment was 1.0 m/min.
4.2. Experimental Program
To validate the effect of the proposed multi-frequency waveform control method for double-wire MIG arc welding on the stability of the welding process and quality of the welding seam, the following procedures were conducted:
Step 1: By varying the number of high frequency modulation pulses NfTH, duty cycle of trailing wire high frequency modulation pulse DCTH, duration of leading wire current in base value TbL, and peak current of trailing wire IpT while other conditions unchanged, the ranges of these four parameters by means of ultimate experiments can be obtained, and then their individual levels can also be confirmed. Finally, the detailed experimental program can be designed. The discipline of the effects of the different variables on the welding quality can be obtained.
Step 2: According to the orthogonal analyses, an array of variables which had optimal levels can be chosen to do actual validation, then the corresponding orthogonal results can be employed to validate the proposed method. In addition, other mathematical analysis tools can be employed to analyze the experiments and provide support for the orthogonal results.
Step 3: Photos of actual welding seam are provided to validate the results.
5. Experimental Results and Analyses
5.1. Experiments of the Proposed Multi-Frequency Waveform Control Method
In this work, the effects of four parameters,
NfTH,
DCTH,
TbL, and
IpT, on the welding quality could be explored by means of experiments. Firstly, the maximum and minimum values of each parameter can be found. To complete this task, orthogonal experiments were employed. Orthogonal experiments are an important engineering experimental method which is commonly used to evaluate the system with multiple factors and levels. Because the double-wire MIG arc welding process involves some parameters with different values, the orthogonal experiments were employed to confirm which values for each parameter can obtain the products with best quality. In this method, some important parameters are selected as different factors to perform orthogonal experiments. The selection can reduce the workload and involve corresponding methods to analyze the results, so that more reliable results can be obtained [
15,
19,
22,
23].
In the experiments, as for the four parameters,
NfTH,
DCTH,
TbL, and
Ip, each parameter had four levels. Then, for the ranges of each parameter, four equal intervals were divided. In addition, the range of duty cycle was divided by the reciprocal value; for example, four equal intervals were 1/2.5, 1/3, 1/3.5, 1/4. Hence, orthogonal experiment table
L16 (4
5) was employed according to the design principle of the orthogonal experiments. Three experiments were conducted for each condition.
Table 1 shows the levels and corresponding values of the parameters after several experiments and analyses.
The experimental results were collected by our self-designed dynamic arc wavelet analyzer, and then the electrical signals were intuitively analyzed by means of transient current waveform, voltage-current probability density distribution, transient energy graph, and other relative tools. In addition, combining the phenomena observed during the welding process and quality obtained under different parameters combination, the welding quality can be quantitatively described by combining the entropy calculation of stability of electrical signals, probability density distribution evaluation and arc sound stability evaluation, then each quality score can use a mean value of three experiments, as detailed illustrated in the previous works [
20,
24].
Table 2 shows the experimental parameters and corresponding quality scores.
In the 16 experiments above, the variation range of average currents values of two wires were as follows: ILav = 109–160 A, and ITav = 120–170 A.
According to these experiments, most experiments were stable. Especially, when the NfTH equaled to 3, the experiments could be successfully conducted with satisfactory welding quality under the condition of unchanged traveling rates and wires feed rates, and no failures of striking arc or arc interruption appear. It showed that the ranges in which parameters can be adjusted in this new method are very large, thus parameter matching is more convenient than that of others.
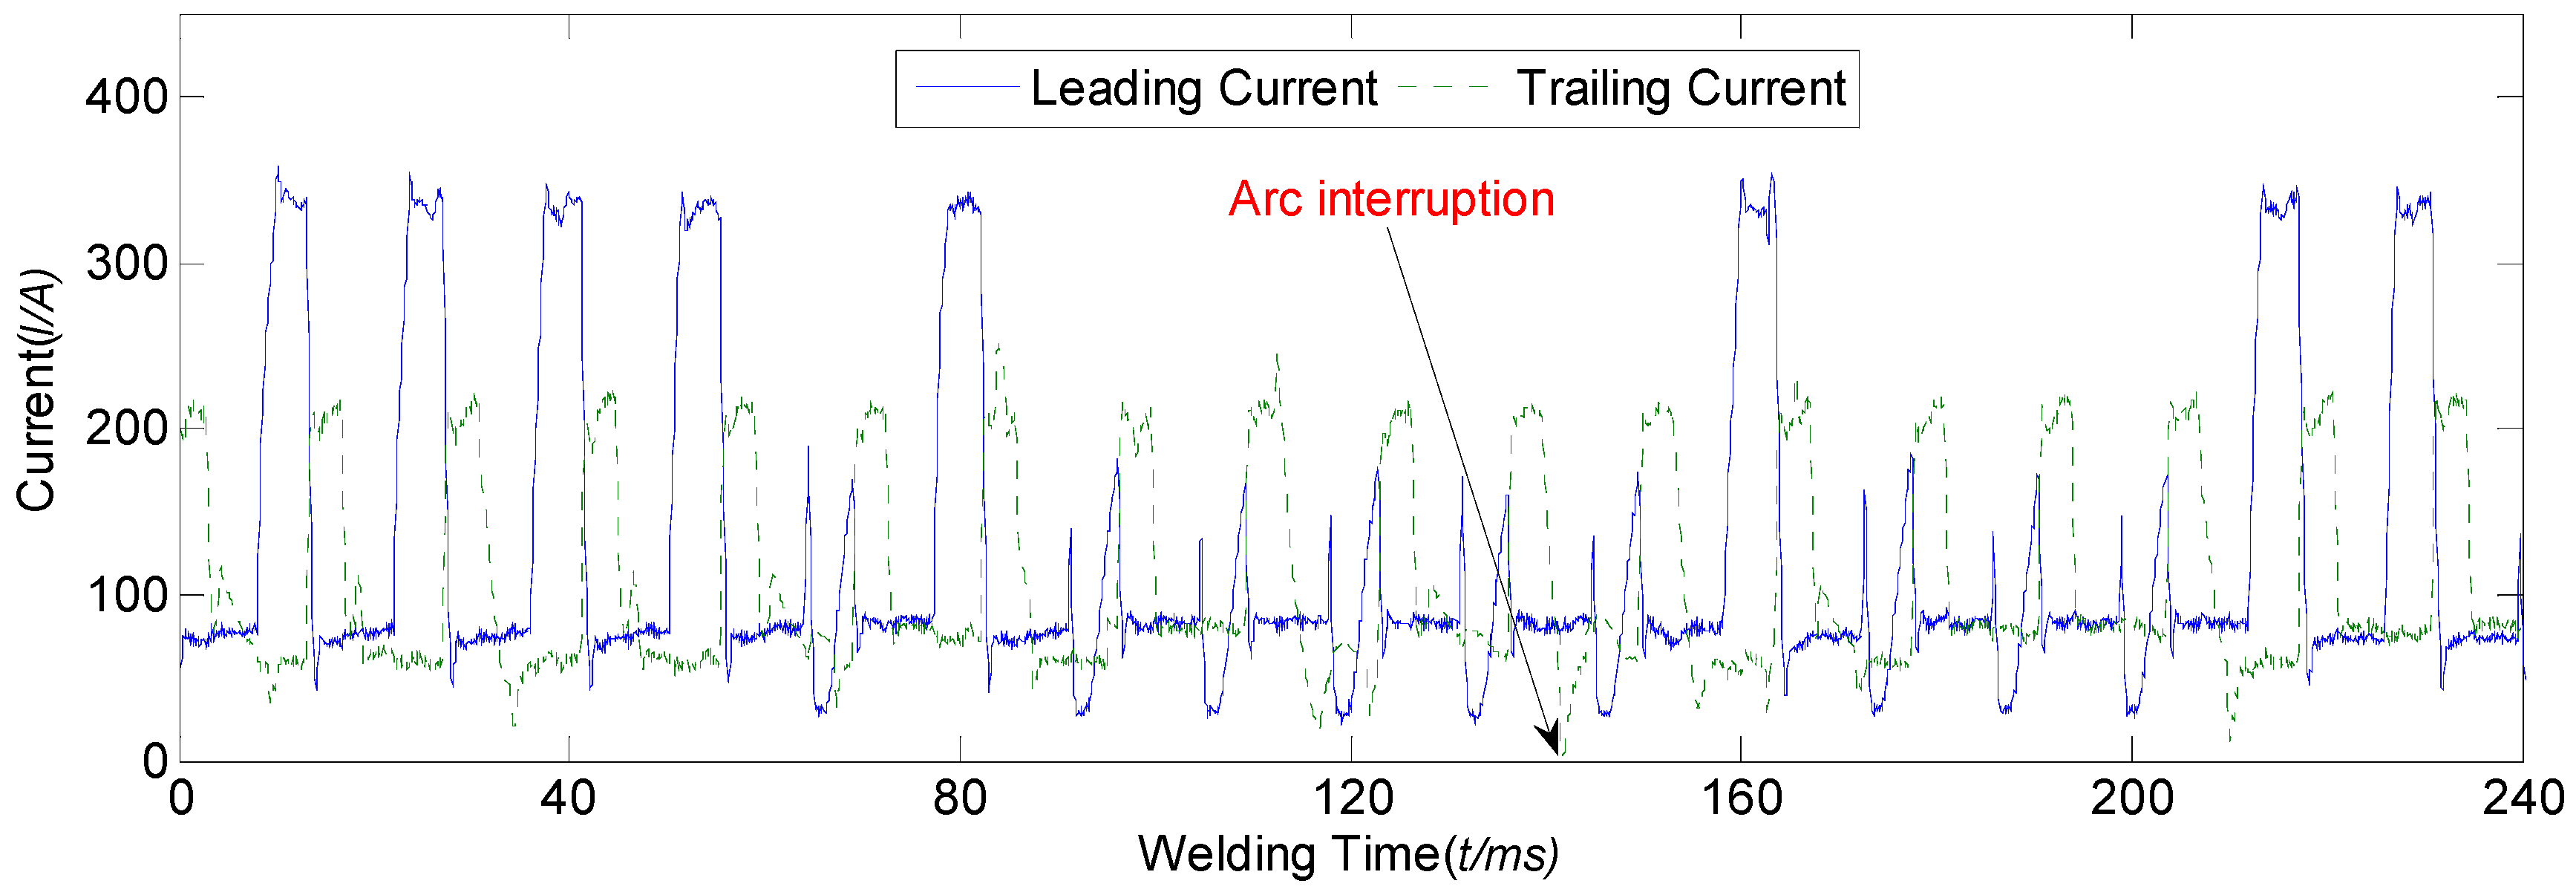
On the other hand, the worst welding quality was obtained from experiment 1 according to
Table 2, whose transient current waveforms are shown in
Figure 5. It could be observed that the arc interruption occurred at 142 ms. At that time, the leading wire current cannot achieve the peak stage, while the base stage of the trailing wire current was relatively stable. In addition, some short circuit phenomena appeared during the process. All of these phenomena showed that this experiment was unstable.
5.2. Process and Quality Analyses Using Probability Density Function
Apart from the figure of transient voltage and current waveforms, the welding current probability density function (pdf) can be also employed to evaluate the welding stability [
25,
26].
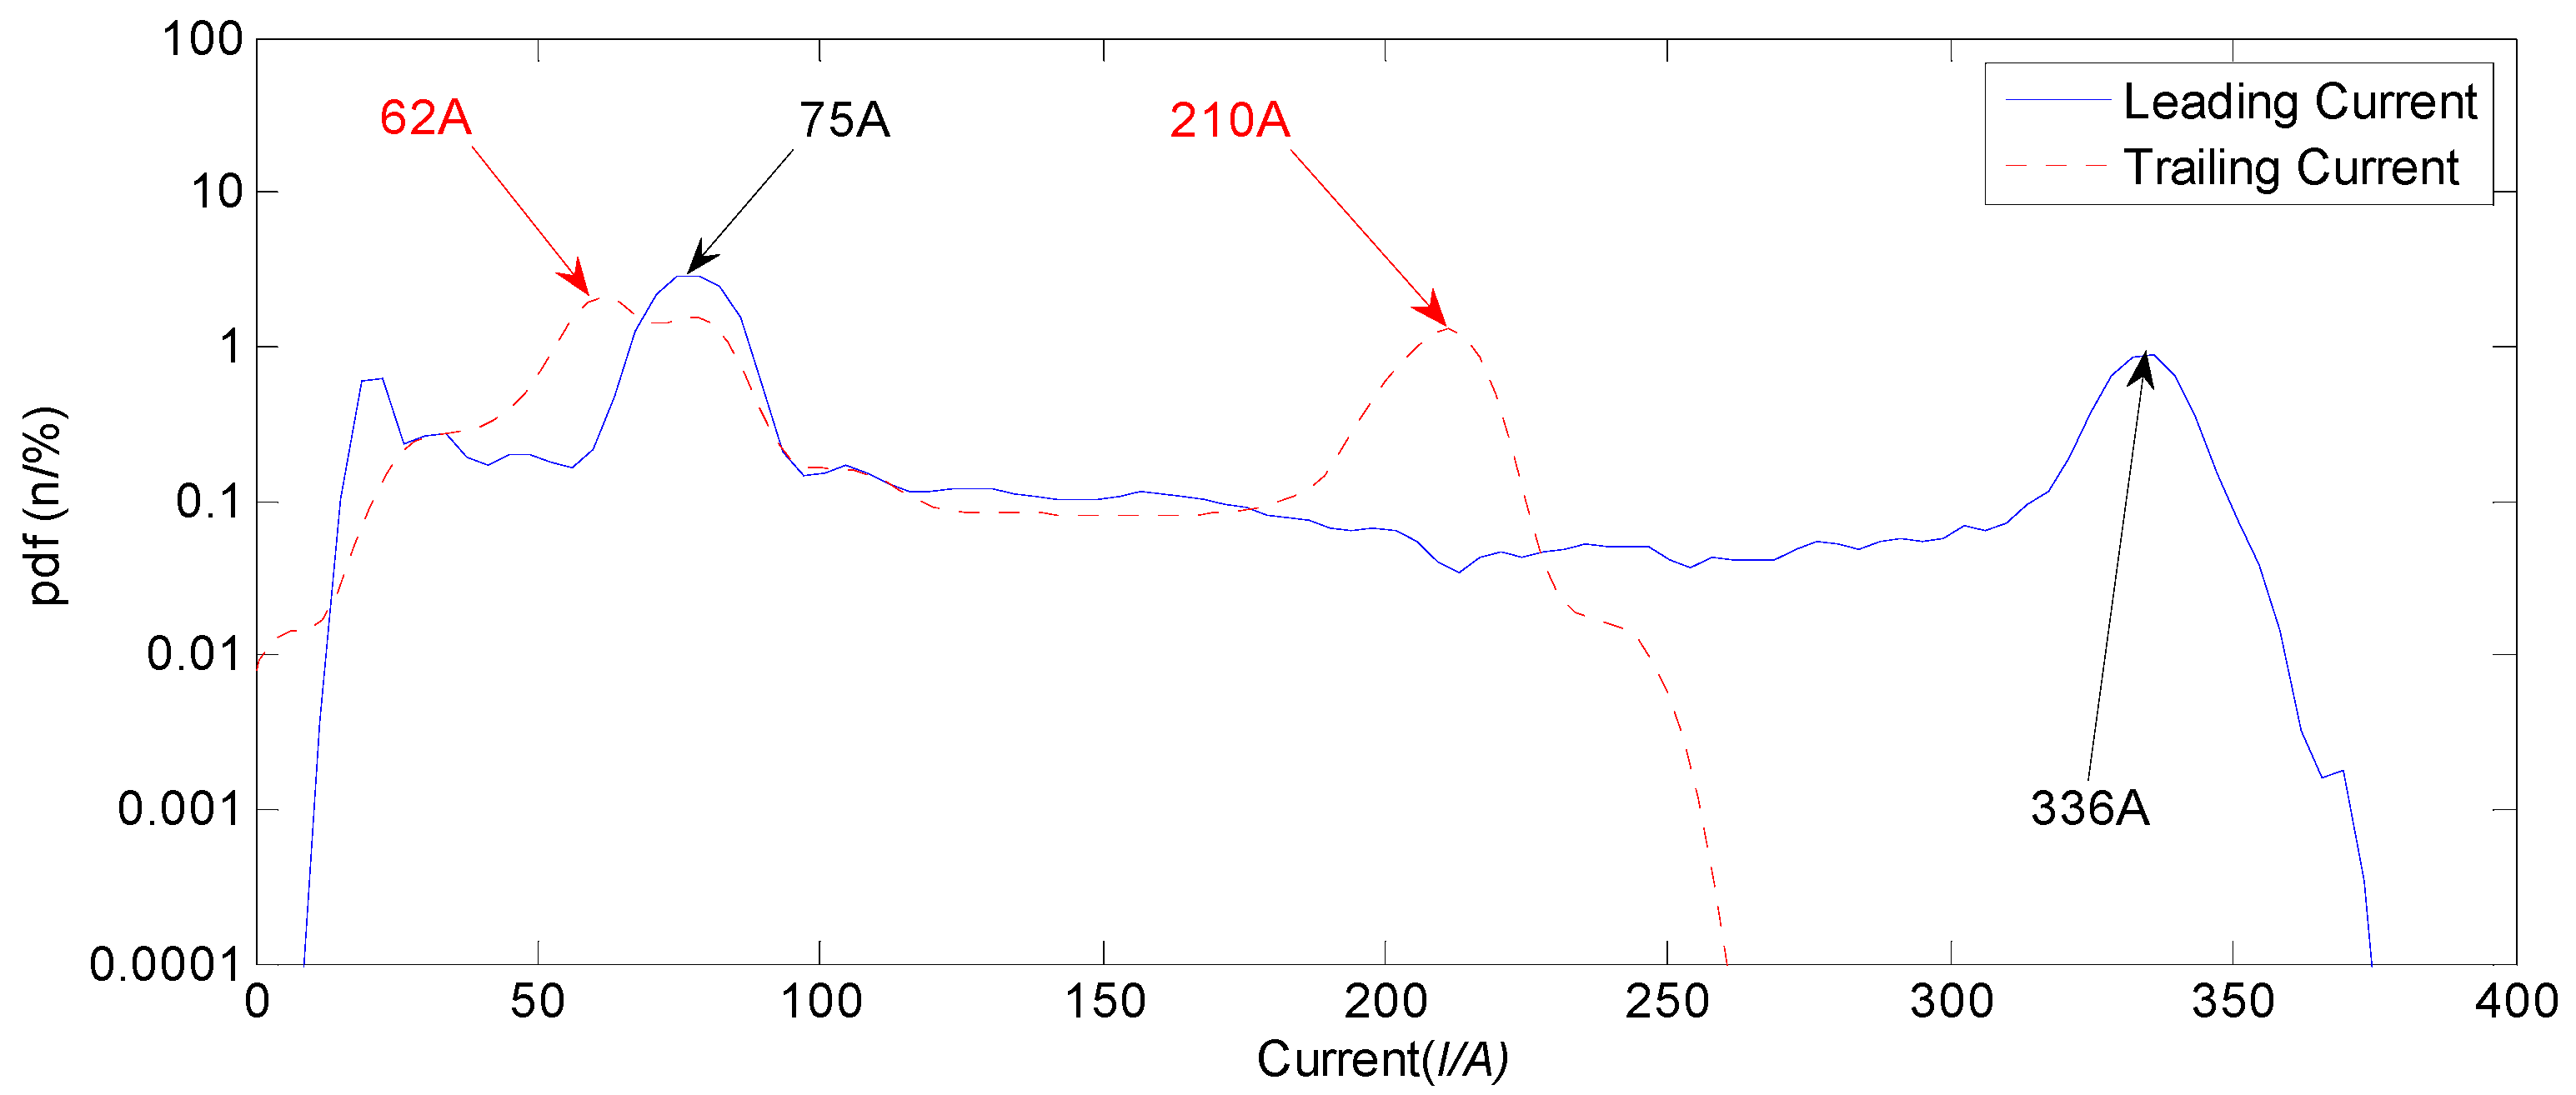
Figure 6 shows the pdf of experiment 1. It can be observed that the pdf of leading current was 1% around 20 A, which showed that the current sharply varied when arc interruption occurred at trailing current and the possibility of small current appearing increased. Two small convex peaks appeared at 75 A and 336 A in pdf curve of leading current, the corresponding setting value of the base of leading wire and peak of leading wire were, respectively, 78 A and 340 A, which showed the differences were very small. The two convex peaks were gentle, and the pdf of 75 A was 2.86%, while the pdf of 336 A was only 0.88%, and the pdf between peak and base was beyond 0.1%, which showed that the overall current distribution was dispersive. The pdf curve of trailing current also had two convex peaks at 62 A and 210 A. The first convex peak was broad and the maximum pdf value was 2.12%. However, the pdf was 1.5% between 55 A and 80 A of trailing current, which showed that the current in the base stage was unstable, and the current was very dispersive. The difference between actual value 62 A and setting value 78 A was large. It may because that the current was unstable when arc interruption occurred, which increased the possibility of small current appearing. The second convex peak was also gentle with low slope, which showed that current distribution was not concentrative and the switch between base stage and peak stage was not prompt. Hence, it can be shown that, in experiment 1, the welding current distribution was dispersive and the welding process was unstable.
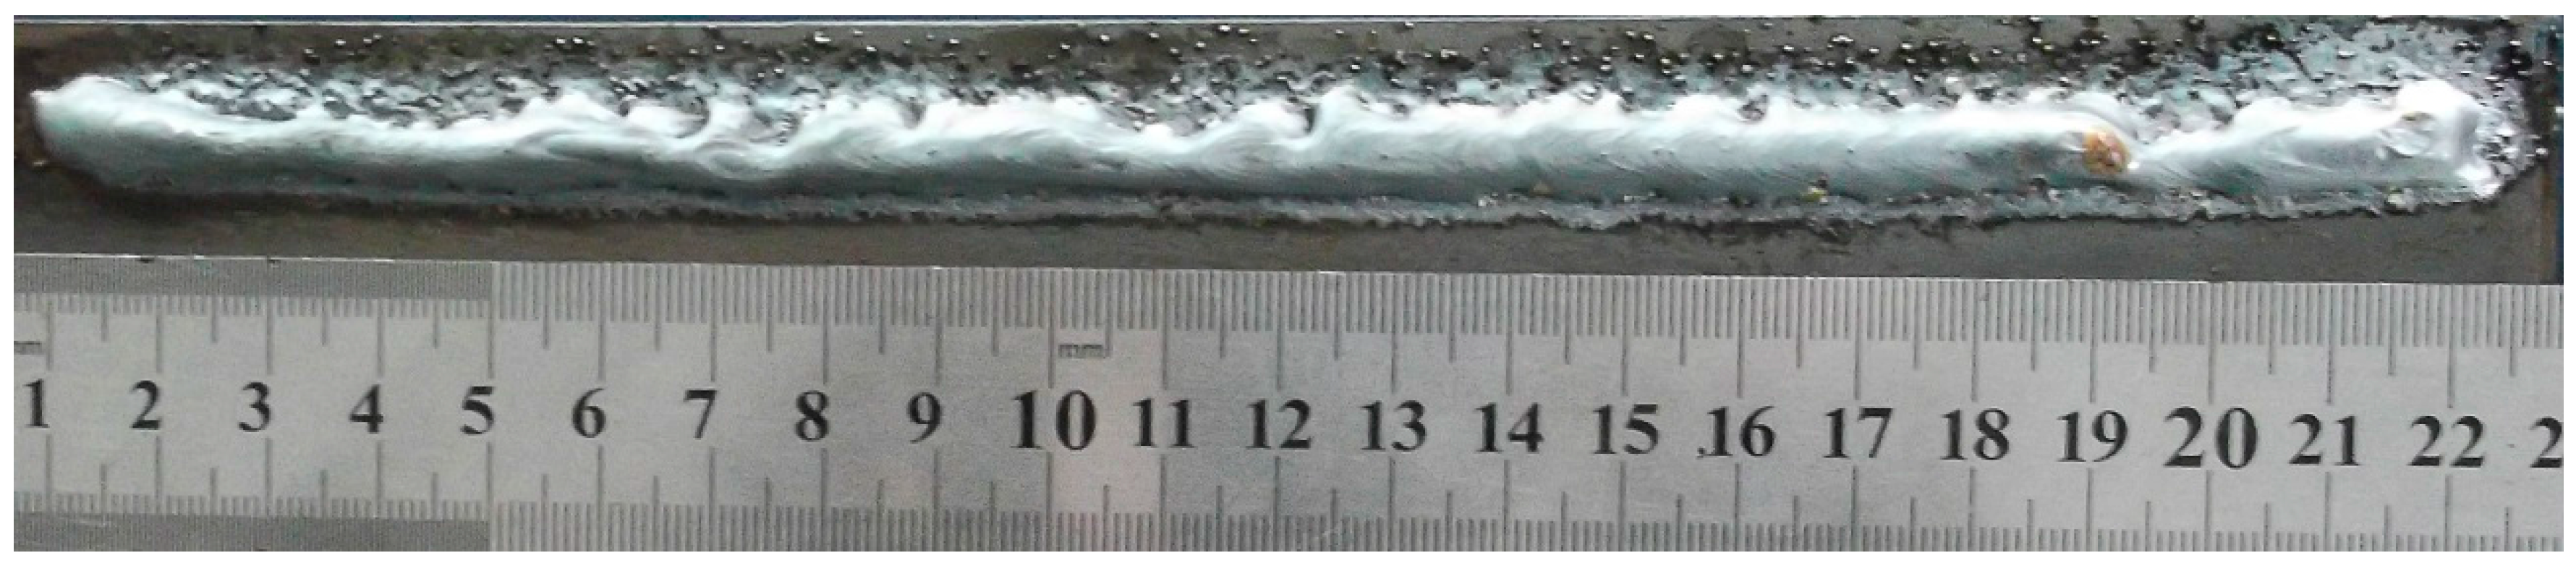
The corresponding welding seam in
Figure 7 shows that quality of welding seam was not satisfactory, and the phenomena of arc interrupt and undercut frequently appeared. Because the heat for metal transfer was not enough, the welding seam was not sufficiently formed. The defects appeared at 6–7 cm and 11 cm. In addition, some splashes occurred during the process, and the surface of the seam was poorly smooth.
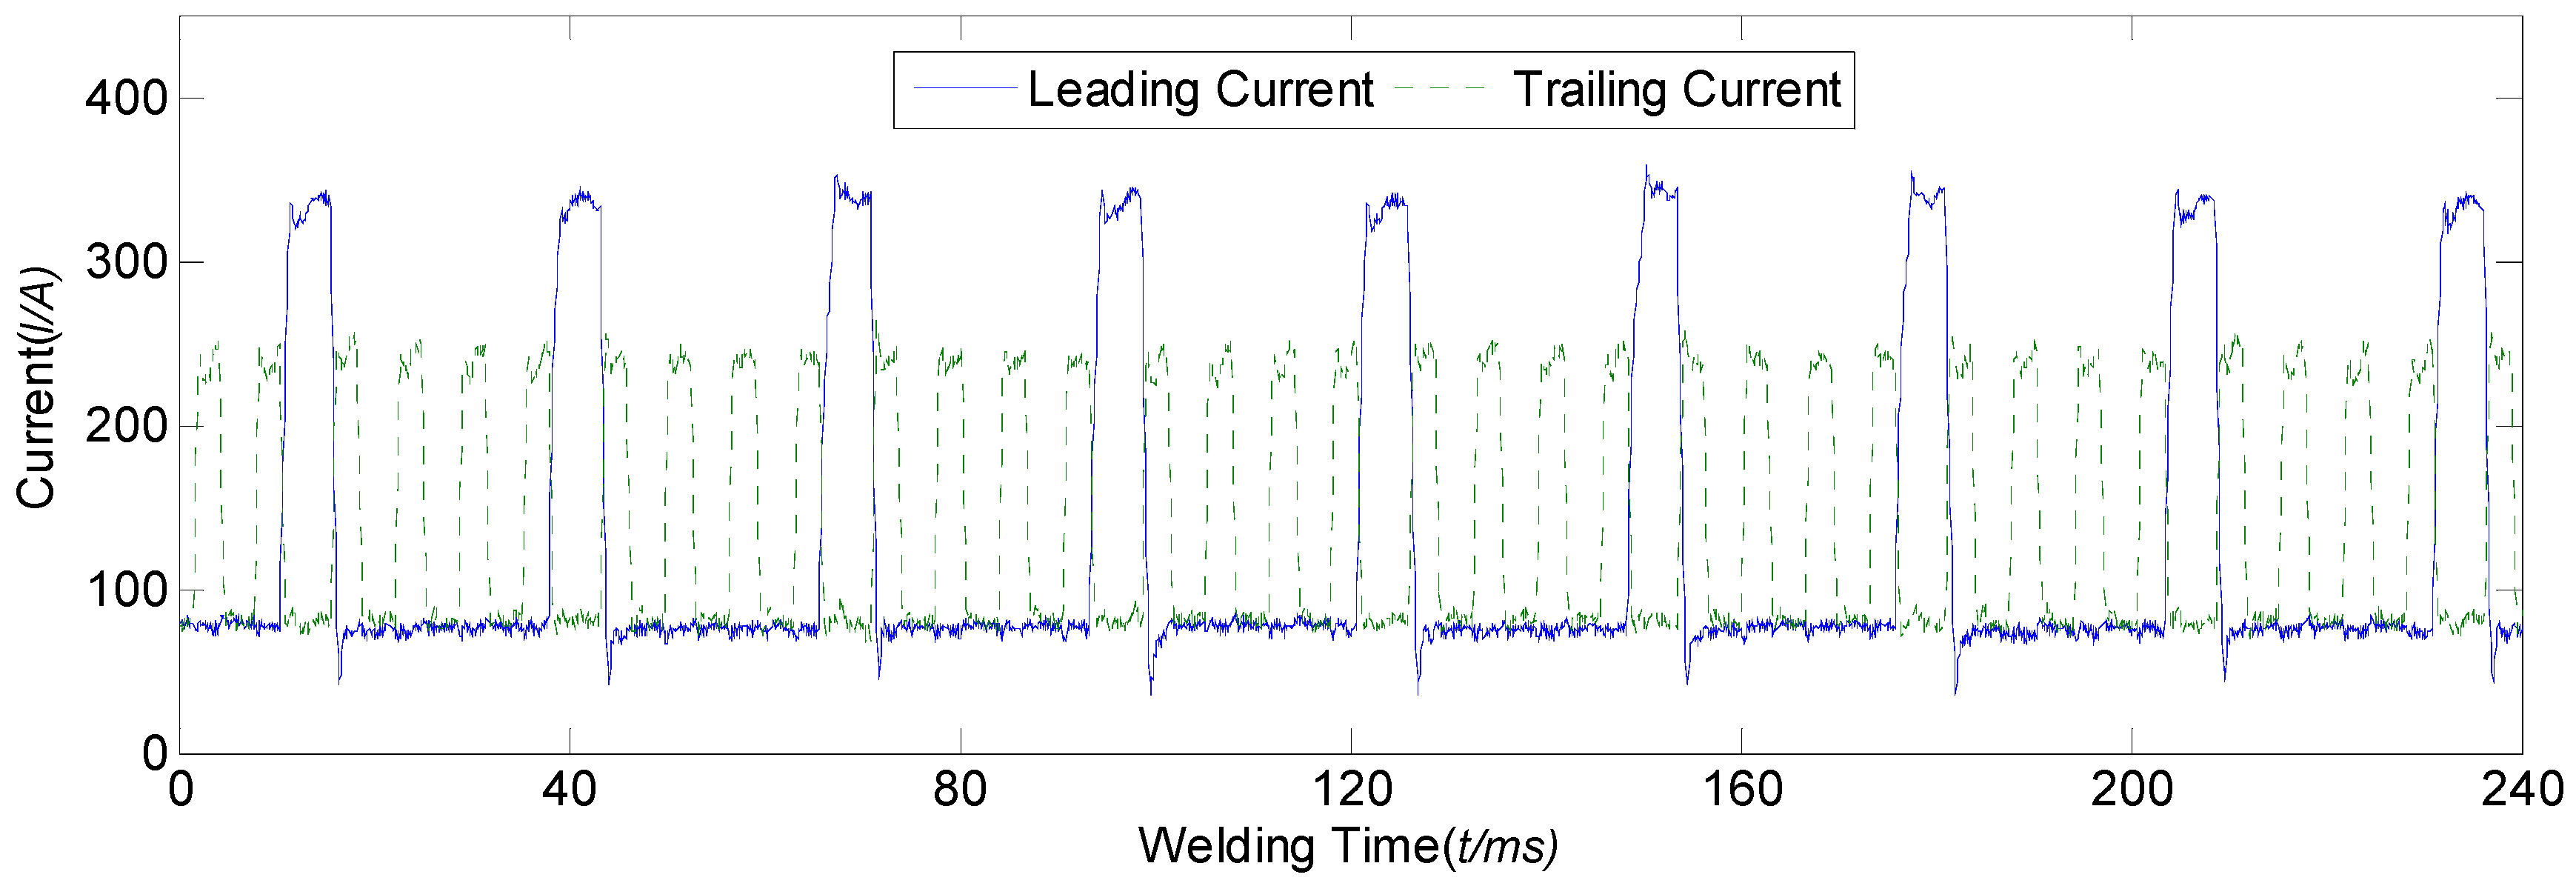
The best welding quality was obtained from experiment 13 according to
Table 2. Transient current waveforms in
Figure 8 shows that the currents were much more regular than that of experiment 1, and no arc interruption and short circuit occurred during the process.
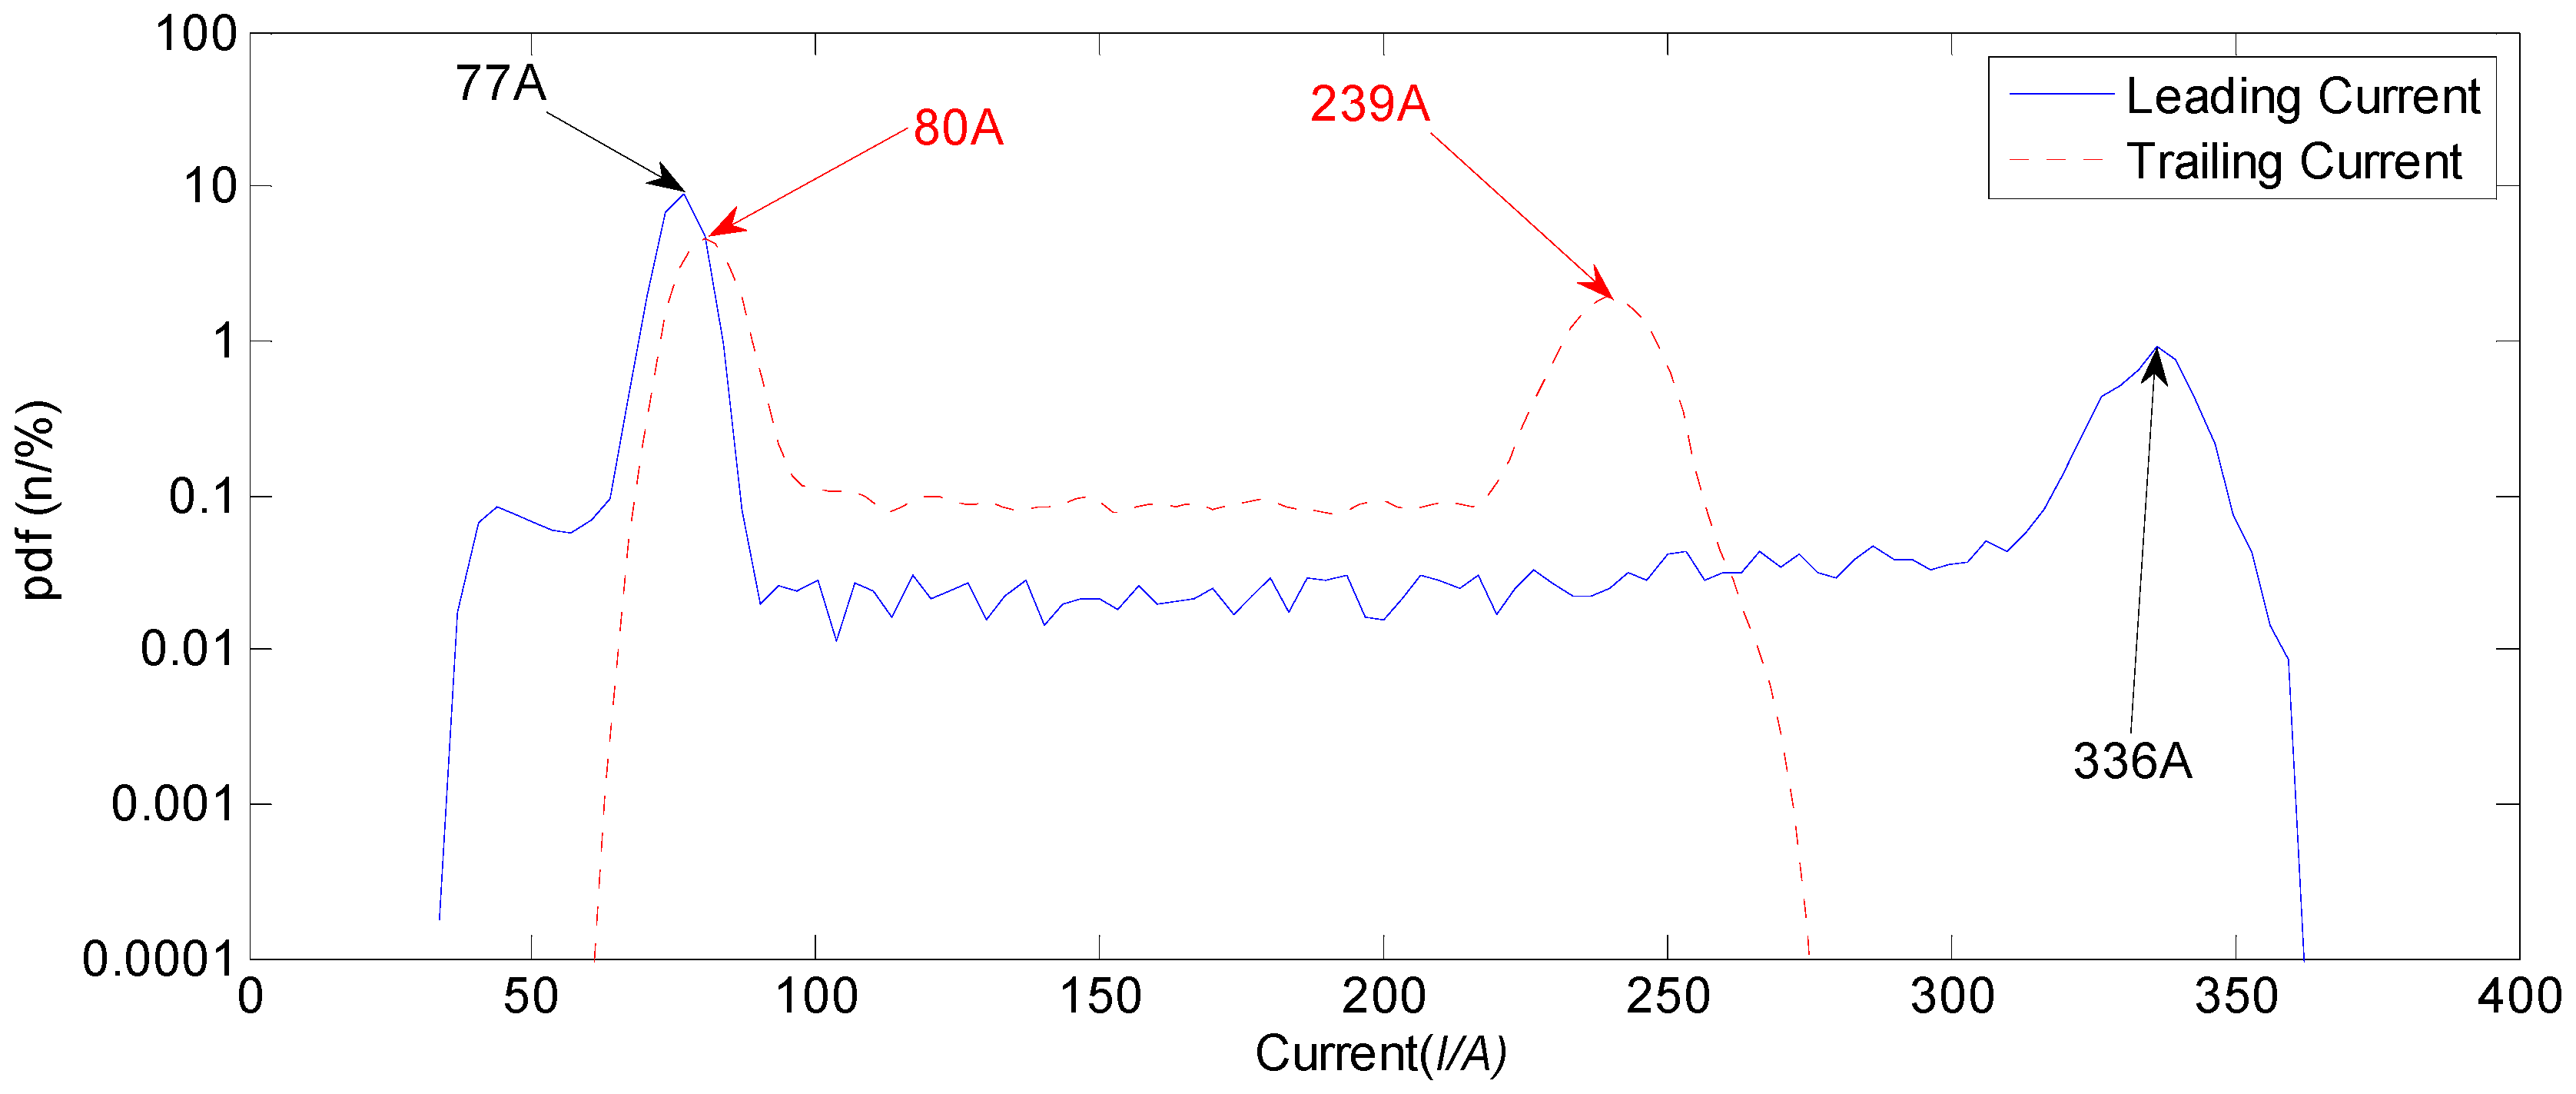
Corresponding pdf of the currents is shown in
Figure 9. It can be seen that leading current had two convex peaks at 77 A and 336 A, which corresponded, respectively, to the currents in base stage and peak stage. The pdf of 77 A in the curve was 8.79%, and the convex peak was steep and narrow, which showed that leading current in base stage was concentrative with small variation, corresponding to a stable welding process. The pdf of 336 A in the curve was 0.88%, and slope was steeper than that in
Figure 6. The corresponding pdf between two peaks was between 0.01% and 0.1%. The pdf of current in peak value was small, which was because the
DCT of experiment 1 was 36.6%, while the value in experiment 13 was only 19.8%. It is because its duty cycle was much smaller than that of experiment 1, and the corresponding pdf was also decreased.
According to
Figure 9, the maximum pdf of trailing current in base stage appeared when the current was 80 A, the convex peak was also steep, and the shape was uniform with that of trailing current in base stage. Moreover, the second convex peaks had a difference, which denoted that peak of the trailing current was smaller, whose value was 239 A. However, the shapes of two convex peaks were uniform and the slopes were steep, which showed that the switch between peak stage and base stage was prompt. The pdf between 100 A and 210 A was about 0.1%, which denoted that the signal was stable, and the possibility of current between peak stage and base stage was low. All of these denoted that the welding process of experiment 13 was stable.
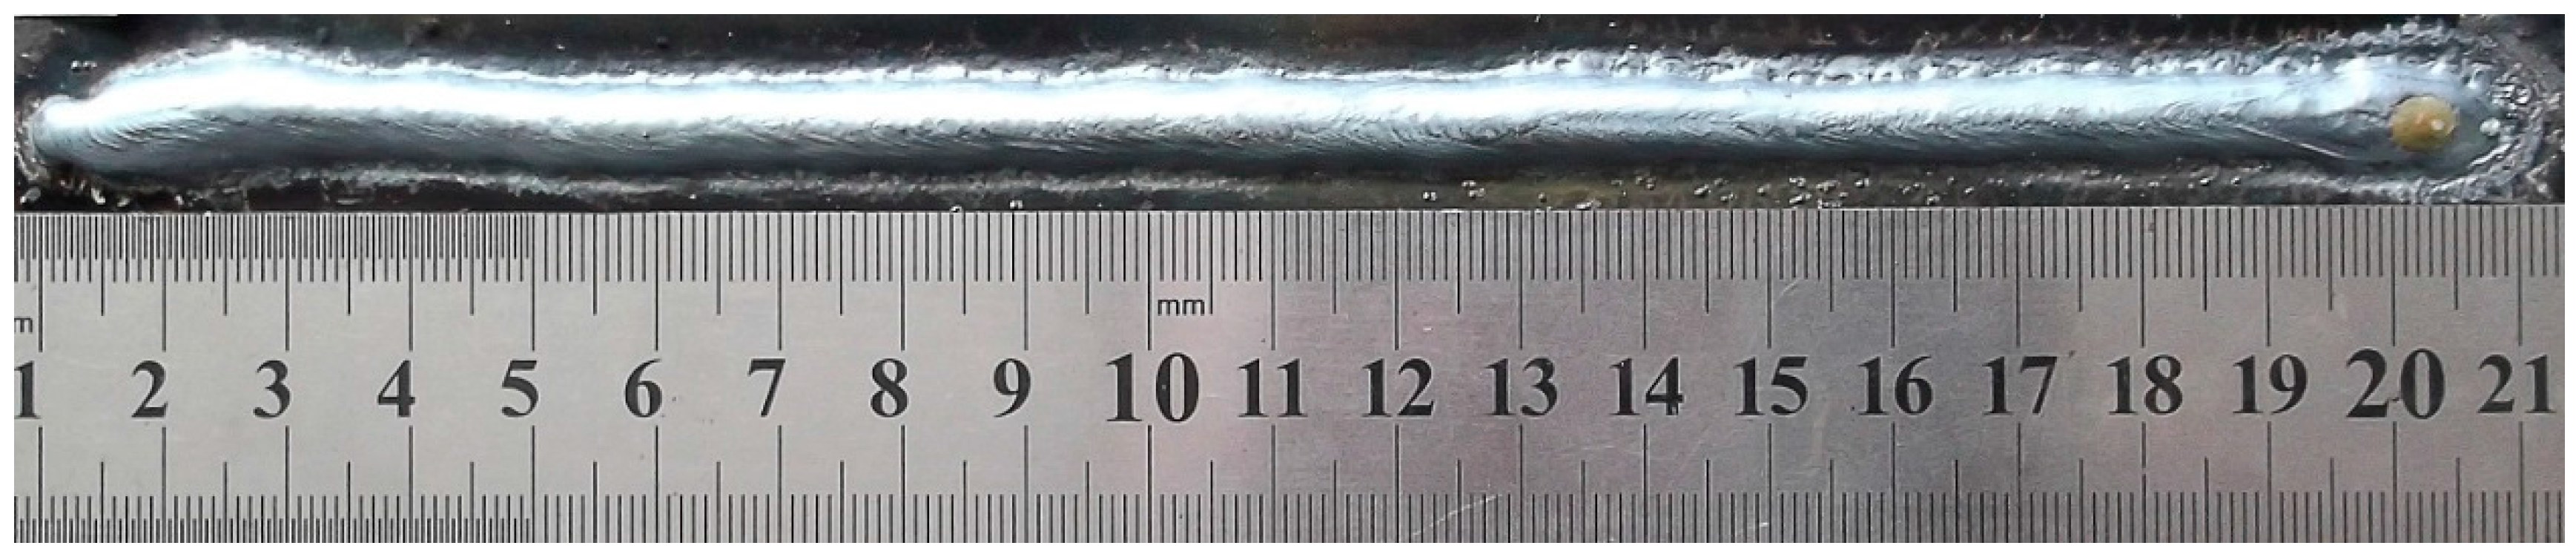
The corresponding welding seam of experiment 13 is shown in
Figure 10, and it can be observed that the quality of the welding seam was very high with smooth surface, and the compact fish-scale grain distributed on the seam. Moreover, no splash appeared during the process.
According to the experimental results and corresponding analyses, the proposed multi-frequency waveform control method can obtain satisfactory welding quality under proper parameter combinations. However, the effect of each parameter on the welding quality cannot be clearly shown, and can be further explored by means of other experiments and analyses.
5.3. Seeking an Optimum Parameter Combination
To explore the effect of different parameters on the welding quality and process, range analysis can be employed in this work [
23]. The results are shown in
Table 3. In the table, the data in
Ij,
IIj,
IIIj and
IVj represented the sum of the experimental results at level 1–4;
kj was the number of replicates of the same level in the
jth column, in this work,
kj = 4;
Ij/
kj,
IIj/
kj,
IIIj/
kj, and
IVj/
kj were the mean values of the experimental results corresponding to each level in the
jth column; and
Dj was the range, and could be calculated using the following equation:
According to
Table 3,
NfTH was the most significant parameter influencing the welding quality.
Dj achieved 26.75. The following was
IpT, whose
Dj value was 17.25. The effects of
IpT and
DCTH were relatively smaller. It can be concluded that the selection of
NfTH was the most important for obtaining satisfactory welding products during the process.
Then, to intuitively explore the variation tendency of each parameter, the values in
Table 3 can be plotted together, as shown in
Figure 11.
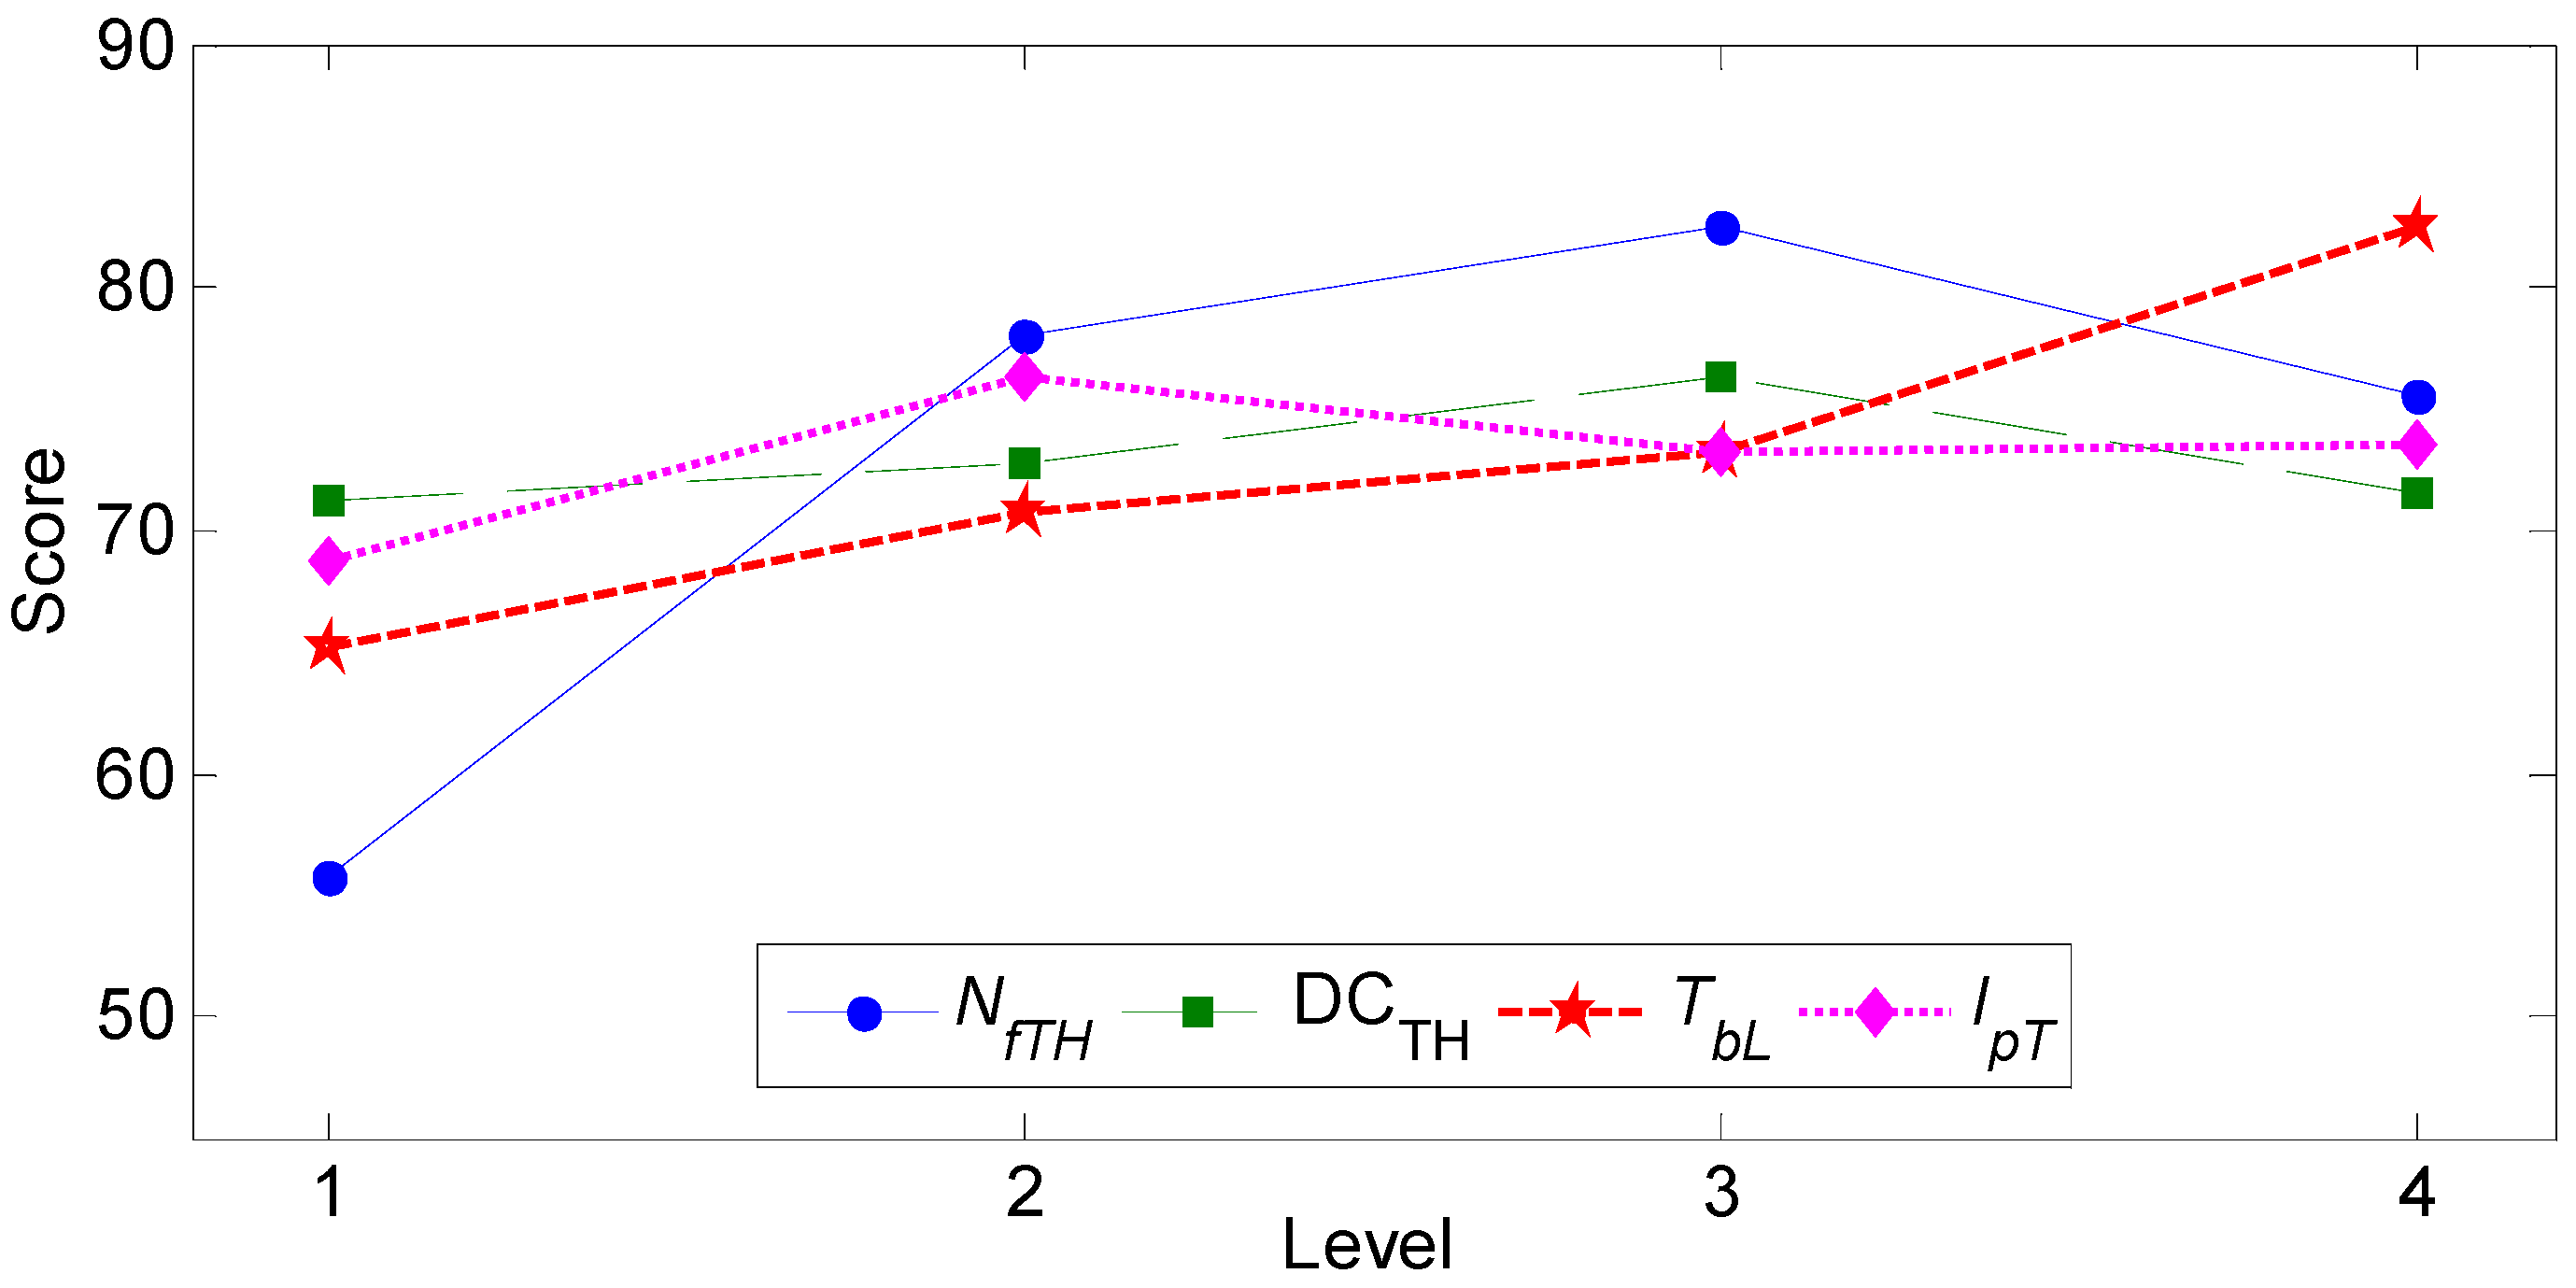
It can be observed in
Figure 11 that when the
NfTH equaled 3, the best welding quality could be obtained. Smaller values meant lower effect of the frequency modulation, while larger value may induce the switch of the current so frequently that the welding process may be unstable. The effect of
DCTH was not remarkable, the welding quality was a little better, and it might because that the variation range of
DCTH was not large enough. During the experiments, the value ranged from 0.25 to 0.40, which varied within 37.5%, hence, the effect was not significant. The effect of
TbL on the welding quality was monotonely increased: larger
TbL meant much better welding quality. The results in
Figure 11 denoted that the value of
IpT should not be too large, and the medium value can obtain better result.
According to the above experiments and corresponding analyses, in the orthogonal experiments, higher scores denoted that more satisfactory welding quality could be obtained. Hence, the best operational parameter selection should be a combination which can increase the scores of welding quality in each level. As shown in
Table 3 and
Figure 11, the average scores of
NfTH,
DCTH,
TbL and
IpT achieved the highest values at levels 3, 3, 4 and 2, respectively. Under this circumstance, the optimal parameter combination can be obtained according to the following parameter values:
- ①
The number of high frequency modulation pulses NfTH at level 3:3;
- ②
Duty cycle DCTH at level 3:0.29;
- ③
Duration of leading wire current in base value TbL at level 4.21 ms; and
- ④
Peak current of trailing wire IpT at level 2:240 A.
It is anticipated that the chosen values are the optimal combination for the experiments and offer the welding seam with maximum quality.
5.4. Experiment Verification
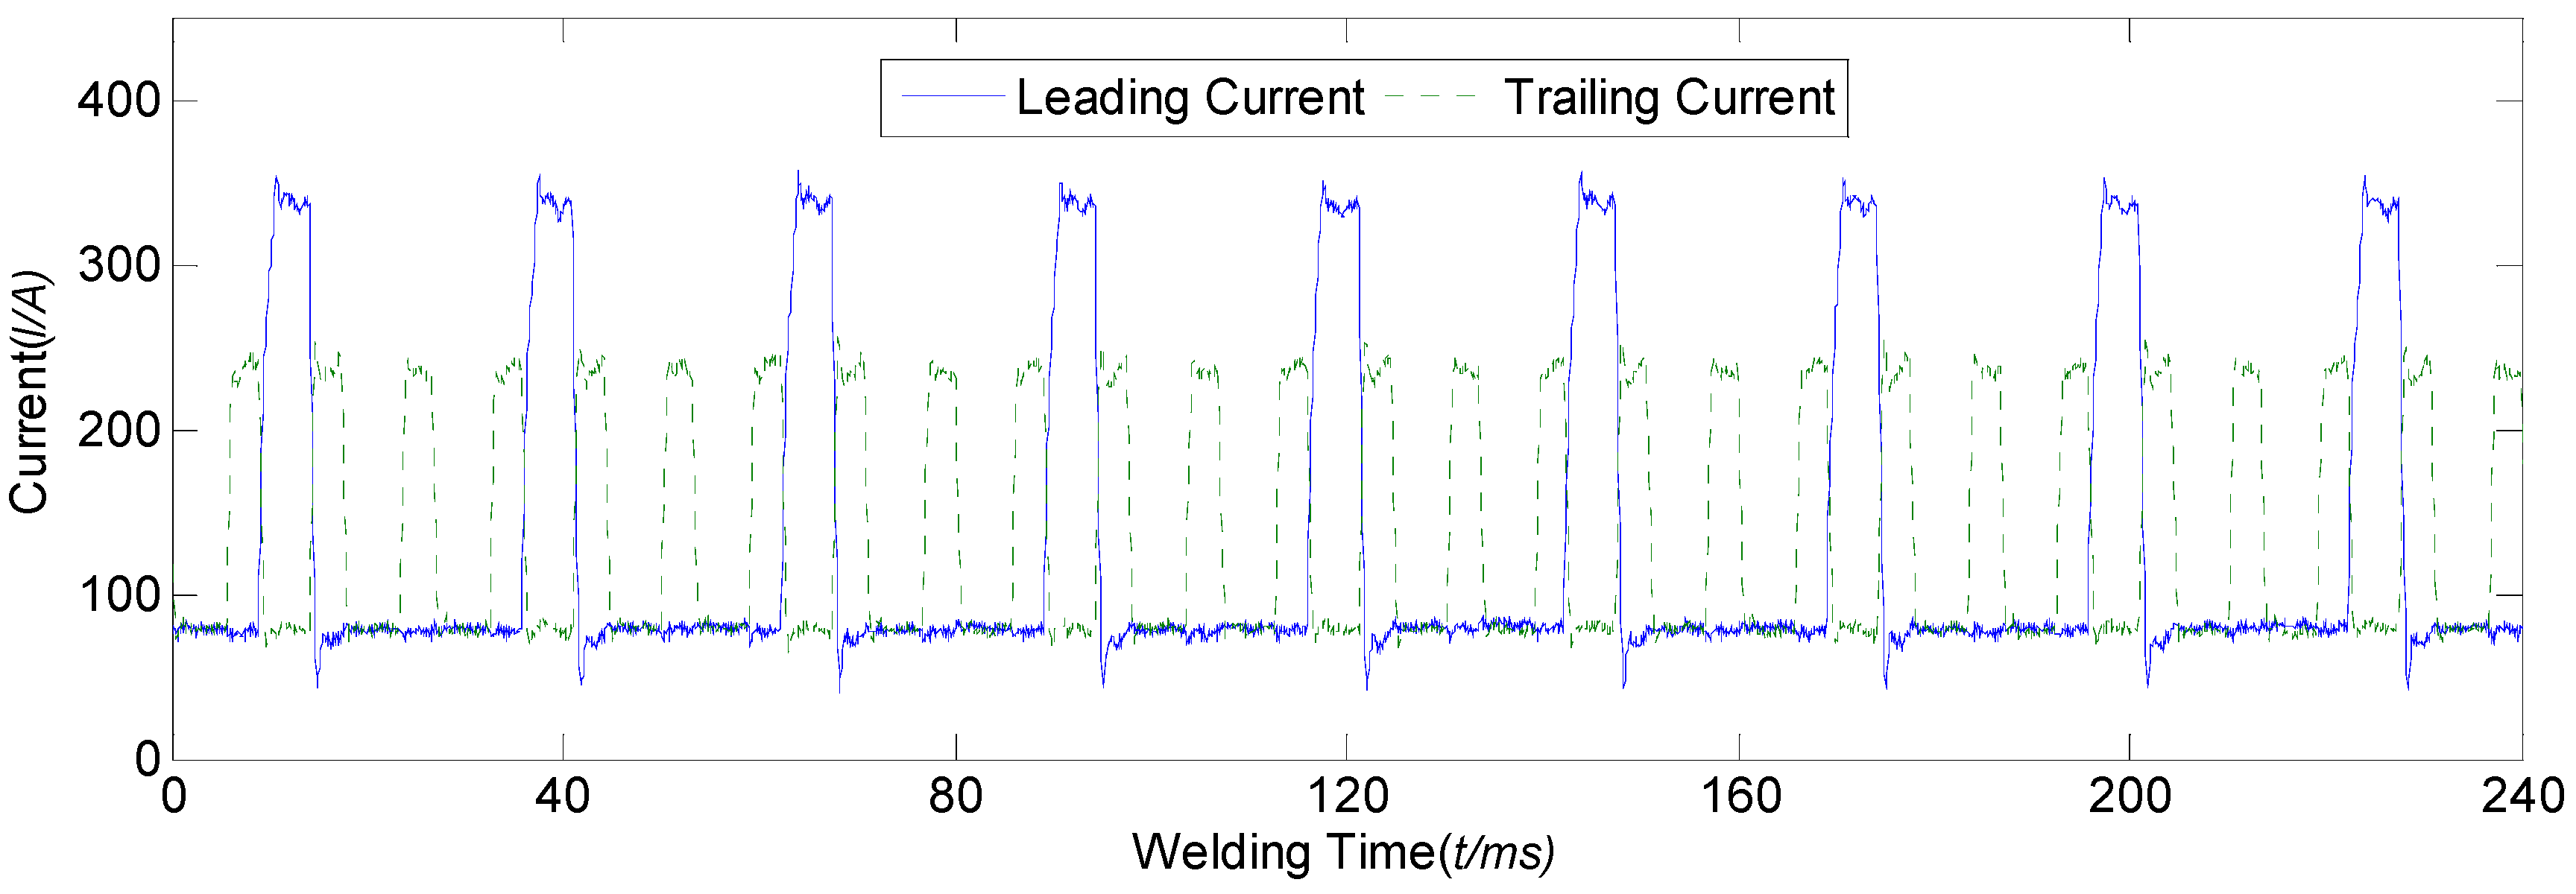
Then, the above parameter combination can be verified by actual experiment, whose current waveform is shown in
Figure 12.
It can be seen from
Figure 12 that the current waveform was regular, without current mutation occurred. Moreover, the sound during the process was also gentle.
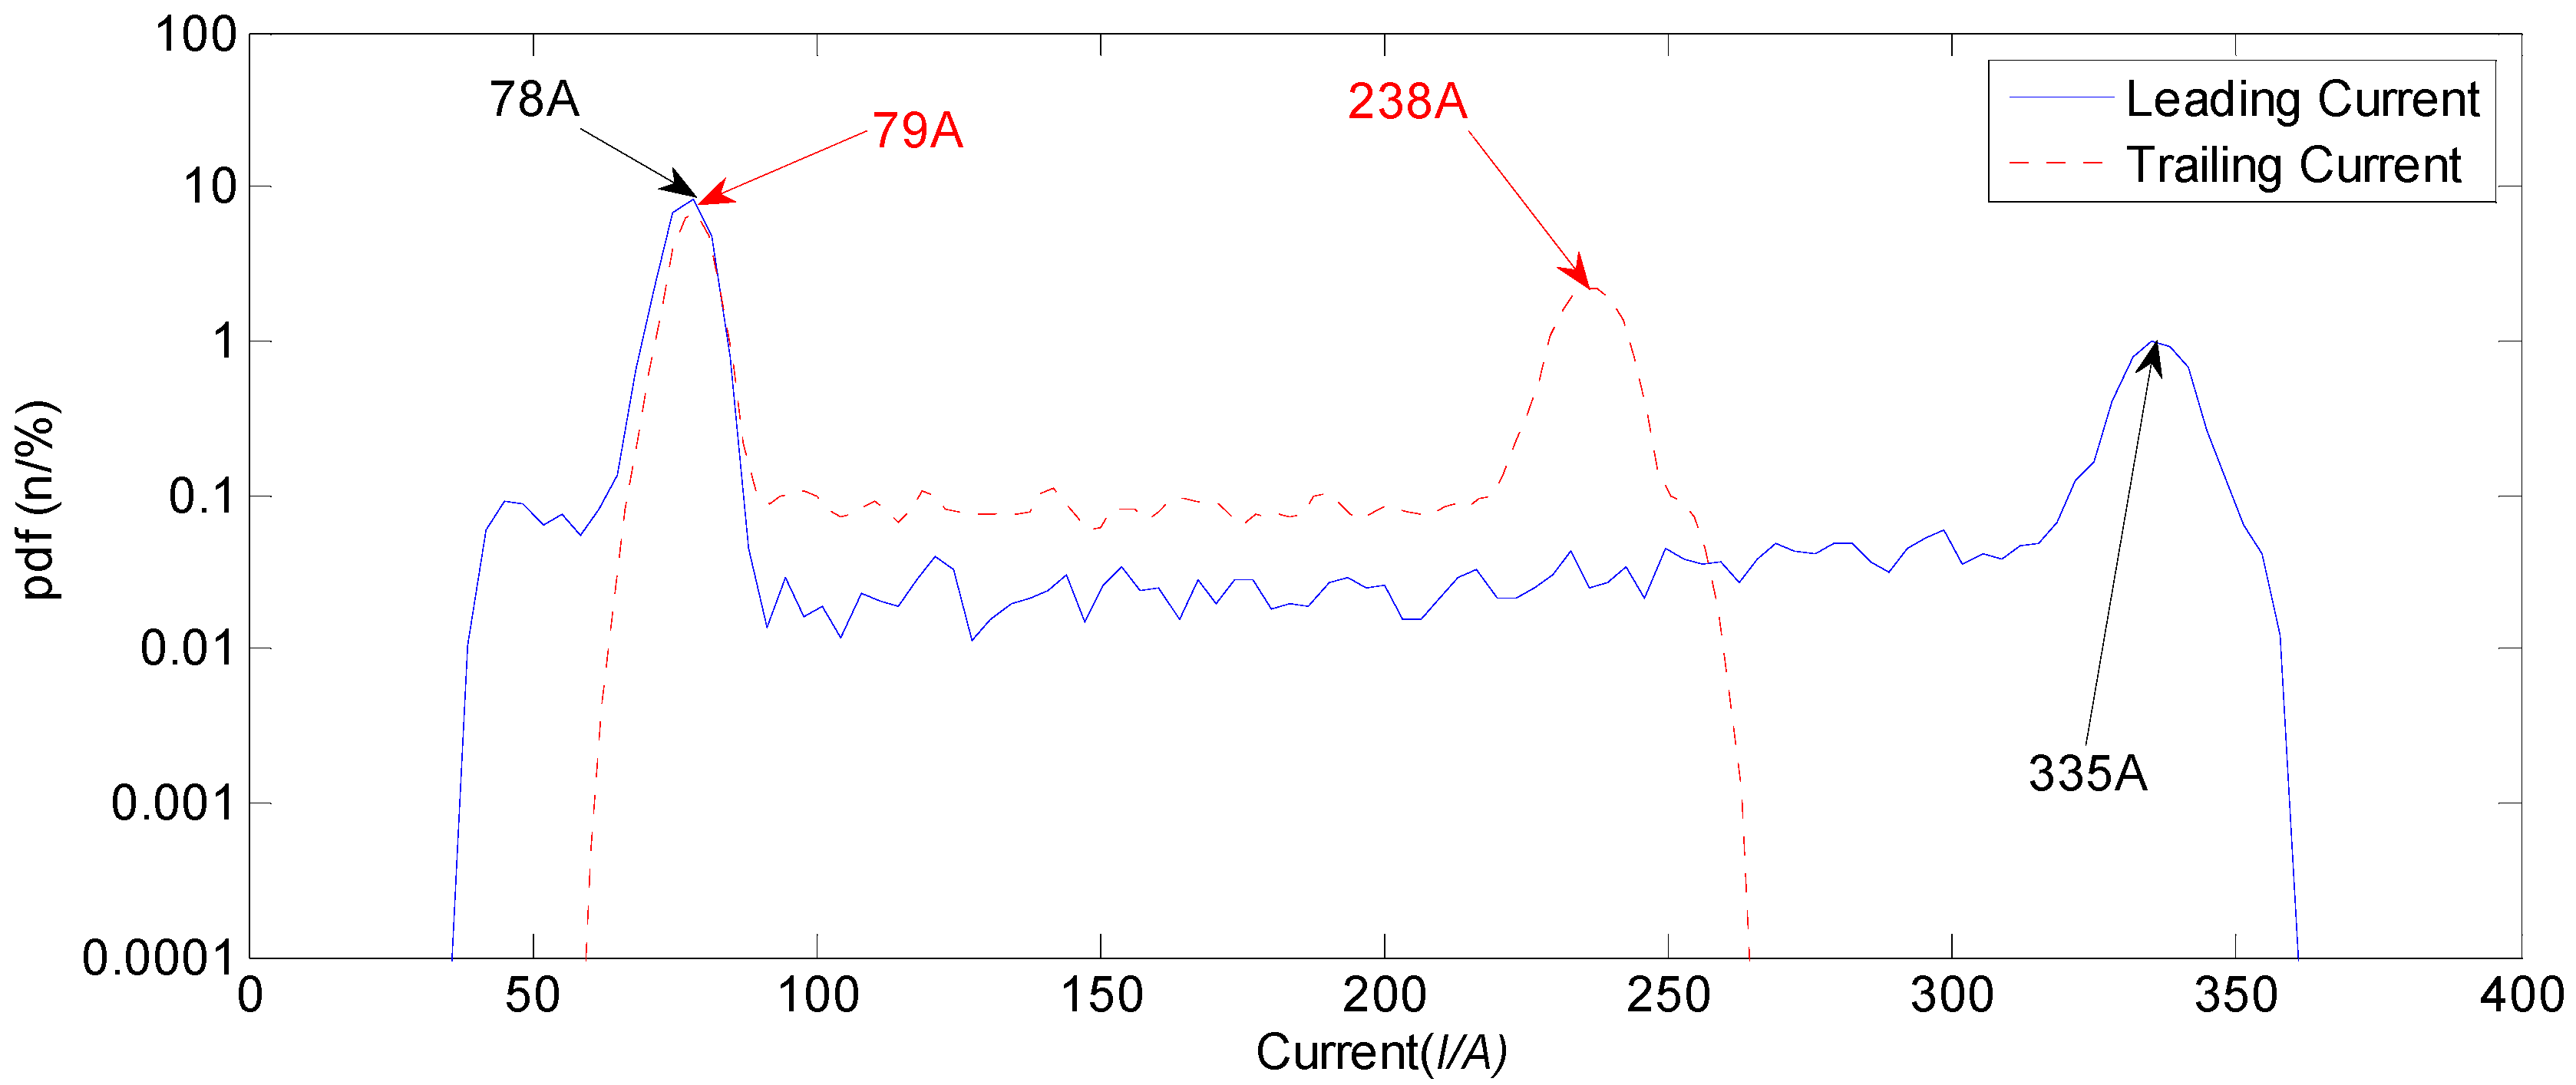
Corresponding pdf figure is shown in
Figure 13. Two convex peaks appeared at 78 A and 335 A in the pdf curve of leading current. The pdf value at 78 A was 8.24%, and the convex peak was high and narrow. The pdf between two peaks was about 0.05%. The maximum convex peak in the trailing current in base stage was 79 A, where the corresponding pdf value was 6.79%. Two convex peaks were approximately coincident and were steep, which denoted that both the currents of leading and trailing wire in base stages in this experiment were sufficiently concentrative. In addition, the maximum pdf value of trailing wire current in peak stage appeared at 238 A, where the convex peak was also steep, and the shape was uniform with that of leading current in peak stage.
According to
Figure 6,
Figure 9 and
Figure 13 and corresponding analyses, the variation information of pdf can show the stability of welding process. If the welding current was unstable, the convex peak between currents in peak stage and base stage was gentle, while pdf value of the convex peak was relatively small, however, the pdf value between currents in peak stage and base stage was large. If the welding current was stable, the convex peak was relatively steep, while the pdf value of the convex peak was large, and the pdf value between currents in peak stage and base stage was relatively small. This means that the switch between currents in peak stage and in base stage was prompt. In addition, the pdf value of the convex peaks of the trailing current was about 0.1% in
Figure 9 and
Figure 13, and the corresponding value for leading current was about 0.05%. The reason for this phenomenon was a multi-frequency modulation stage was added, which made the frequency of the switch between currents in peak stage and base stage of trailing wire increase, hence, the possibility density of the trailing current between in peak stage and base stage was slightly increased. However, the pdf curve in this stage was smooth and the values were uniform, which meant that the welding process was much more stable.
The welding seam is shown in
Figure 14. It can be seen that the surface of welding seam was beautiful with clear fish-scale grain. No other defect or abnormal phenomenon appeared during the process. The quality of welding seam was similar with that of experiment 13.
Thus, a series of experiments and corresponding analyses showed that the satisfactory result can be obtained, which denoted that the proposed new control method and orthogonal experiments, as well as the analysis method, were reliable and can well serve the actual welding production.
6. Conclusions and Future Works
In this work, a new current waveform control method for double-wire MIG arc welding was proposed to improve the stability of welding process and the quality of welding seam. During the welding process, the mutual electromagnetic force between two electrical arcs may induce some abnormal phenomena, such as arc interruption, irregular metal transfer or considerable expulsion. To obtain a stable welding process and welding products with satisfactory quality, a multi-frequency modulation was added to the trailing wire current waveform under the situation that the two wires currents waveforms had the same frequency but inverse phases. This new conduction can improve the welding seam formation, decrease the possibility of arc interruption appearing, and improve the heat efficiency. Then, actual experiments were conducted to validate the method by our self-designed platform and other relative facilities. During the process, orthogonal experiments and corresponding analysis method were employed to seek an optimal parameter combination. As for the four important parameters, the number of high frequency modulation pulses NfTH, duty cycle of trailing wire high frequency modulation pulse DCTH, duration of leading wire current in base value TbL, and peak current of trailing wire IpT, it can be seen that the first parameter was the most important element to determine the welding quality, then the following is IpT, and the effects of other two parameters were relatively smaller. The optimal parameters combination were employed and final experimental results showed that the satisfactory welding seam can be obtained. The welding seam was so beautiful and no abnormal phenomenon occurring during the process, which showed that the proposed multi-frequency waveform control method and corresponding analyses can achieve satisfactory performance in actual application.
In the future, we will continue working to seek more reliable methods to improve the proposed method; for example, other parameters can be added to explore how they affect the stability of the process and the quality of welding seam. Moreover, we will also try to apply this new method to other welding processes, such as metal active gas (MAG) welding process, and improve the current operation. In addition, the analysis method in this work can be simplified and the optimal parameter combination can be quickly confirmed for each case.


