Article

Field Monitoring of Deformations and Internal Forces of Surrounding Rocks and Lining Structures in the Construction of the Gangkou Double-Arched Tunnel—A Case Study

1
Key Laboratory of Transportation Tunnel Engineering, Ministry of Education, Southwest Jiaotong University, Chengdu 610031, Sichuan, China
2
China Railway Eryuan Engineering Group Co., Ltd., Chengdu 610031, Sichuan, China
*
Author to whom correspondence should be addressed.
Appl. Sci. 2017, 7(2), 169; https://doi.org/10.3390/app7020169
Submission received: 20 November 2016 / Revised: 29 January 2017 / Accepted: 5 February 2017 / Published: 11 February 2017
(This article belongs to the Special Issue Structural Health Monitoring (SHM) of Civil Structures)

Abstract

:
Double-arched tunnel is a special and complex underground structure which needs to be monitored carefully during construction. Taking the Gangkou tunnel as the engineering background, this paper presents a case study of field monitoring of a representative double-arched tunnel. Typical cross sections were chosen in each class of surrounding rock masses in the tunnel area and different types of sensors were embedded in designed locations, and the deformations and forces of both surrounding rocks and lining structures were monitored systematically. The dynamic evolution as well as the spatial distribution characteristics of the monitoring data including the internal displacements of surrounding rocks and the contact pressures between surrounding rocks and primary linings, the axial forces in rock bolts and the internal forces in both steel arches and secondary linings were analyzed. The monitoring and analysis results show that the deformations and forces of both surrounding rocks and lining structures are directly related to the construction procedures, geological conditions and locations in the double-arched tunnel. According to the results, some reasonable suggestions were provided for the improvement of the tunnel construction. This study will provide useful reference and guidance for the design, construction and monitoring of similar engineering projects in future.

1. Introduction

Double-arched tunnel is a kind of special parallel tunnel structure which is quite different from the separated tunnel and the small spacing tunnel, and there is a central division wall which supports both the left and the right tunnel arches. At present, the double-arched tunnel has been successfully and widely applied in railway, highway and subway engineering, especially in those areas under complicated geological and topographic conditions when there are difficulties in the application of the separated tunnel [1,2,3]. Owing to the large span of the double-arched tunnel and its complex structure as well as the frequent stress conversion between surrounding rocks and tunnel linings, the construction of the double-arched tunnel is quite challenging with great difficulties and high risks. Engineering accidents, such as failures and collapses of surrounding rocks are prone to occur in the construction of the double-arched tunnel, which, therefore, has received wide attention from scholars and engineers in the field of tunnel engineering [4,5,6,7].
Among many tunnelling construction methods, the new Austrian tunnelling method (NATM) [8] is the most popular method used in the construction of the double-arched tunnel, which has proved to be a very economical and flexible mode of construction [9]. The NATM is a technique through which the drilling and blasting method is adopted to excavate a tunnel in rock, and a shotcrete liner and rock bolts are used as a main support system [10,11]. The most important of all, based on the concept of “as-built or during-excavation classification system”, the NATM requires dynamic observations of the geological conditions of excavation faces and the performance of underground supporting structures such as the linings [12]. Rock mass classification systems most commonly RMR [13] and Q system [14] are utilized to translate these observed data to provide an estimate of the required excavation methods and support system components during tunneling [15]. As we can see, field monitoring is the core of the new Austrian tunnelling method and plays an irreplaceable role in judging the stability of surrounding rocks and evaluating the rationality and safety of supporting structures [16,17,18].
Current researches regarding the monitoring strategies for NATM tunnels tend to estimate forces and stresses in the linings by using the back analysis from the monitored displacements based on the proposed thin shell-theory [19,20,21,22,23]. However, there are still some notable exceptions by using direct stress measurement on condition of proper installation of the monitoring equipment. For example, Bonapace measured radial earth pressure by means of pressure cells to check the compatibility of soil fracture grouting and the NATM technique [22]. Based on the direct monitoring strategy, many scholars have made plenty of researches with respect to the field monitoring of the tunnel construction by NATM. However, these monitoring objects mainly concentrate in the single-arched tunnel, researches referring to the systematic field monitoring aiming at the double-arched tunnel are relatively few [24,25].
In this paper, the Gangkou double-arched tunnel in the Jinhua-Wenzhou expressway (Zhejiang Province, China) provided the engineering background and monitoring of the deformations and internal forces of both surrounding rocks and supporting structures was carried out. The field monitoring revealed the internal displacements of surrounding rocks, the contact pressures between surrounding rocks and primary linings, the axial forces in rock bolts and the internal forces in steel arches and secondary linings. The aims of this research are as follows: (1) to obtain the state of the forces and deformations of surrounding rocks, and to judge the stability of surrounding rocks and tunnel linings and to make timely warnings of possible engineering accidents in the tunnel construction; (2) To obtain the stress strain state of supporting structures, to optimize supporting types and parameters, to offer reasonable excavating methods corresponding to different classes of surrounding rocks and to ensure the safety and quality of the double-arched tunnel during construction.

2. Field Monitoring Project

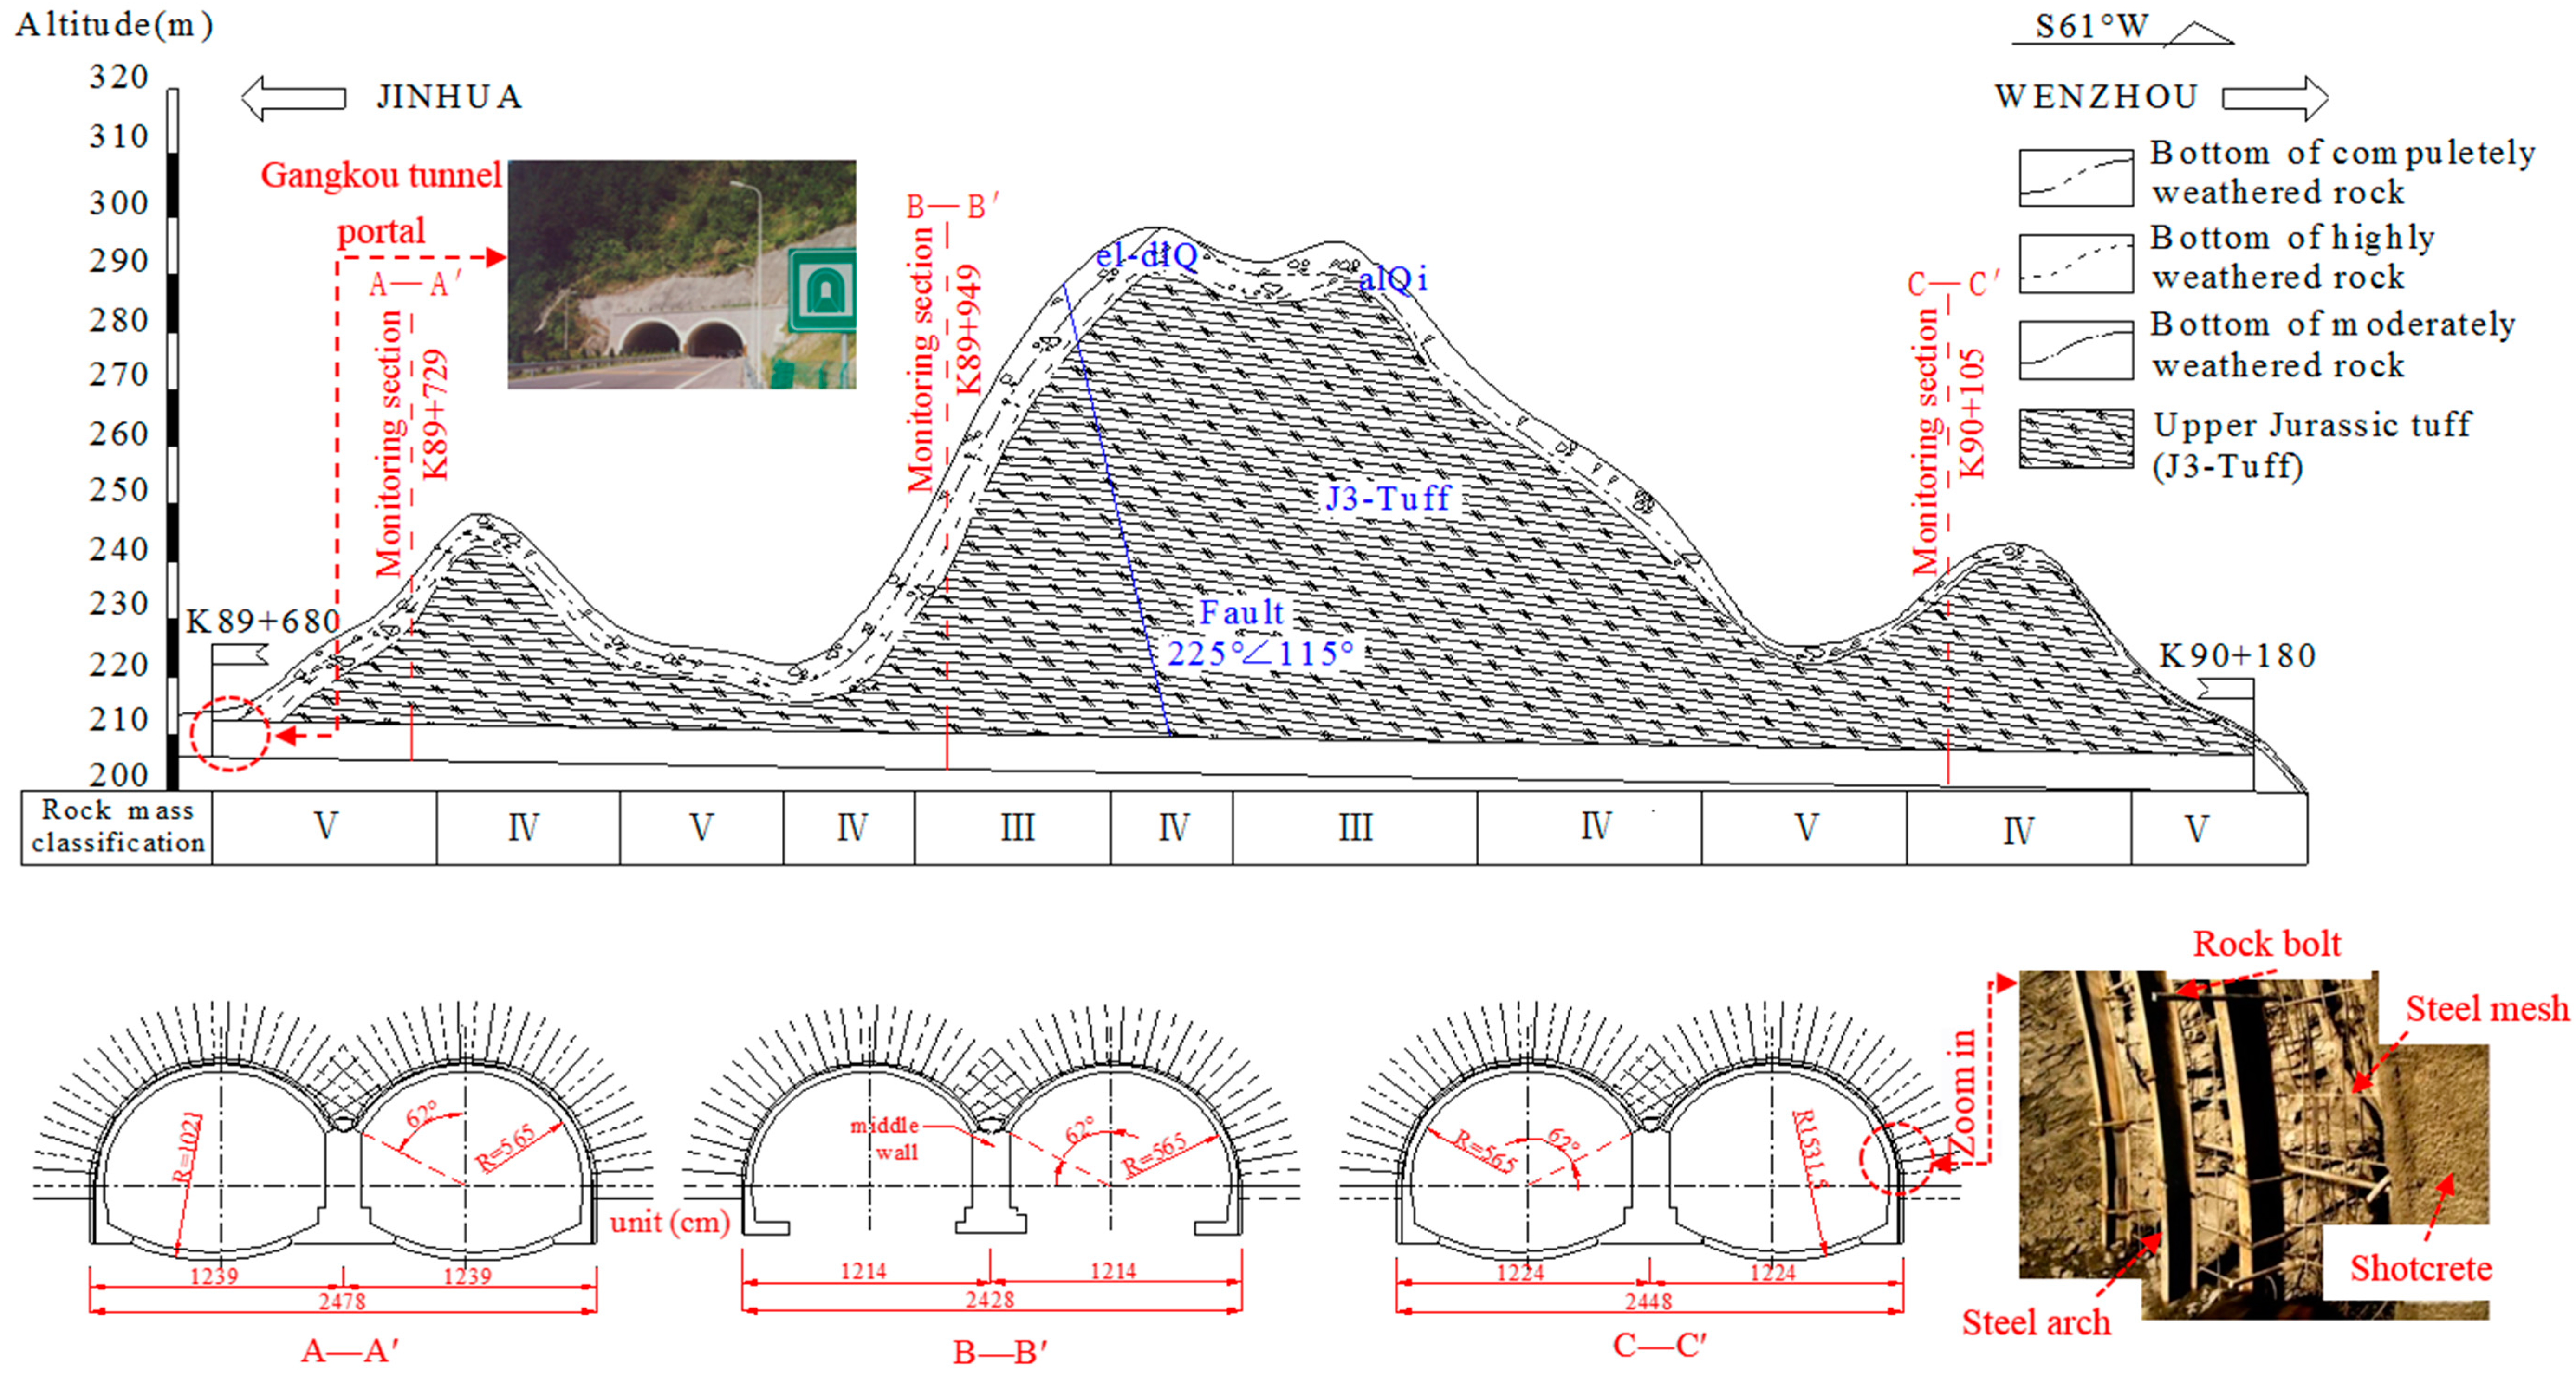
2.1. General Situation

The Gangkou double-arched tunnel was excavated by the new Austrian tunnelling method (NATM). The NATM is a construction technique which takes rock bolts and shotcrete as main supporting measures and emphasizes on timely supporting to control both deformations and stress relaxation of surrounding rocks and carries out field monitoring of the stresses and deformations of surrounding rocks and supporting structures to guide the design and excavation of tunnels. The Gangkou tunnel is 500 m long and it is located between K89+680 and K90+180 in the Jinhua-Wenzhou highway. According to the engineering geologic investigation data, the lithology in the tunnel region is hard and dense tuff with blocky structures as well as good anti-weathering ability. The discontinuities are well-developed in the rock masses in the tunnel region including a fault and tectonic joints. The fault, oriented 225/115, is located approximately in the middle of the tunnel line. Although the rock masses in the fault zone and its affected zone are quite fragmentized and the rock quality designation (RQD) in the area ranges from 25% to 30%, the width of the fault is no more than 0.5 m, hence it has only a limited influence on the stability of the rock mass in this area. In addition, there are three sets of shear joints, the orientations of which are respectively 39/52, 230/70 and 90/75. The groundwater mainly consisting of the Quaternary pore phreatic water and the bedrock fissure water is of shortage. Figure 1 presents the longitudinal and selected cross sections of the Gangkou double-arched tunnel.
According to the well-known RMR classification system of rock masses [26] and analysis on the data obtained from the geological prospecting, the surrounding rock masses in that area can be classified into three categories: class III, class IV and class V. Detailed physical and mechanical parameters of these three different classes of rock masses are shown in Table 1.

2.2. Tunnel Structure

The structures of the Gangkou tunnel vary a great deal in different classes of surrounding rocks. Figure 1 shows the geometric dimensions of the double-arched tunnel in different classes of rock masses. In the primary lining in the class III surrounding rocks, the grouted rock bolts which are made up of hot-rolled ribbed bar (HRB) round steel with length of 250 cm and yield strength of 33.5 MPa were fixed in surrounding rocks of main tunnels after excavating each one by spacing of 120 × 100 cm2 in longitudinal and circumferential directions, the diameter and length of which are 25 mm and 250 cm respectively. I-shape joist steel arch with weight of 16.9 kg/m and cross-sectional area of 21.5 cm2 was arranged by longitudinal spacing of 250 cm and round bar with diameter of 8 mm was adopted as steel mesh by spacing of 20 × 20 cm2 in longitudinal and circumferential directions. The sprayed concrete was used with thickness of 25 cm and compressive strength of 25 MPa (C25). Moreover, the secondary lining adopted the model-building reinforced concrete with compressive strength of 35 MPa (C35) and thickness of 35 cm and the deformed steel bar with diameter of 22 mm was adopted as main reinforcement in the concrete by longitudinal spacing of 20 cm. Besides, composite waterproof layer was fixed between primary and secondary lining, with thickness of 1.5 mm. Detailed support parameters in class IV and V surrounding rocks are respectively shown in Table 2 and Table 3.

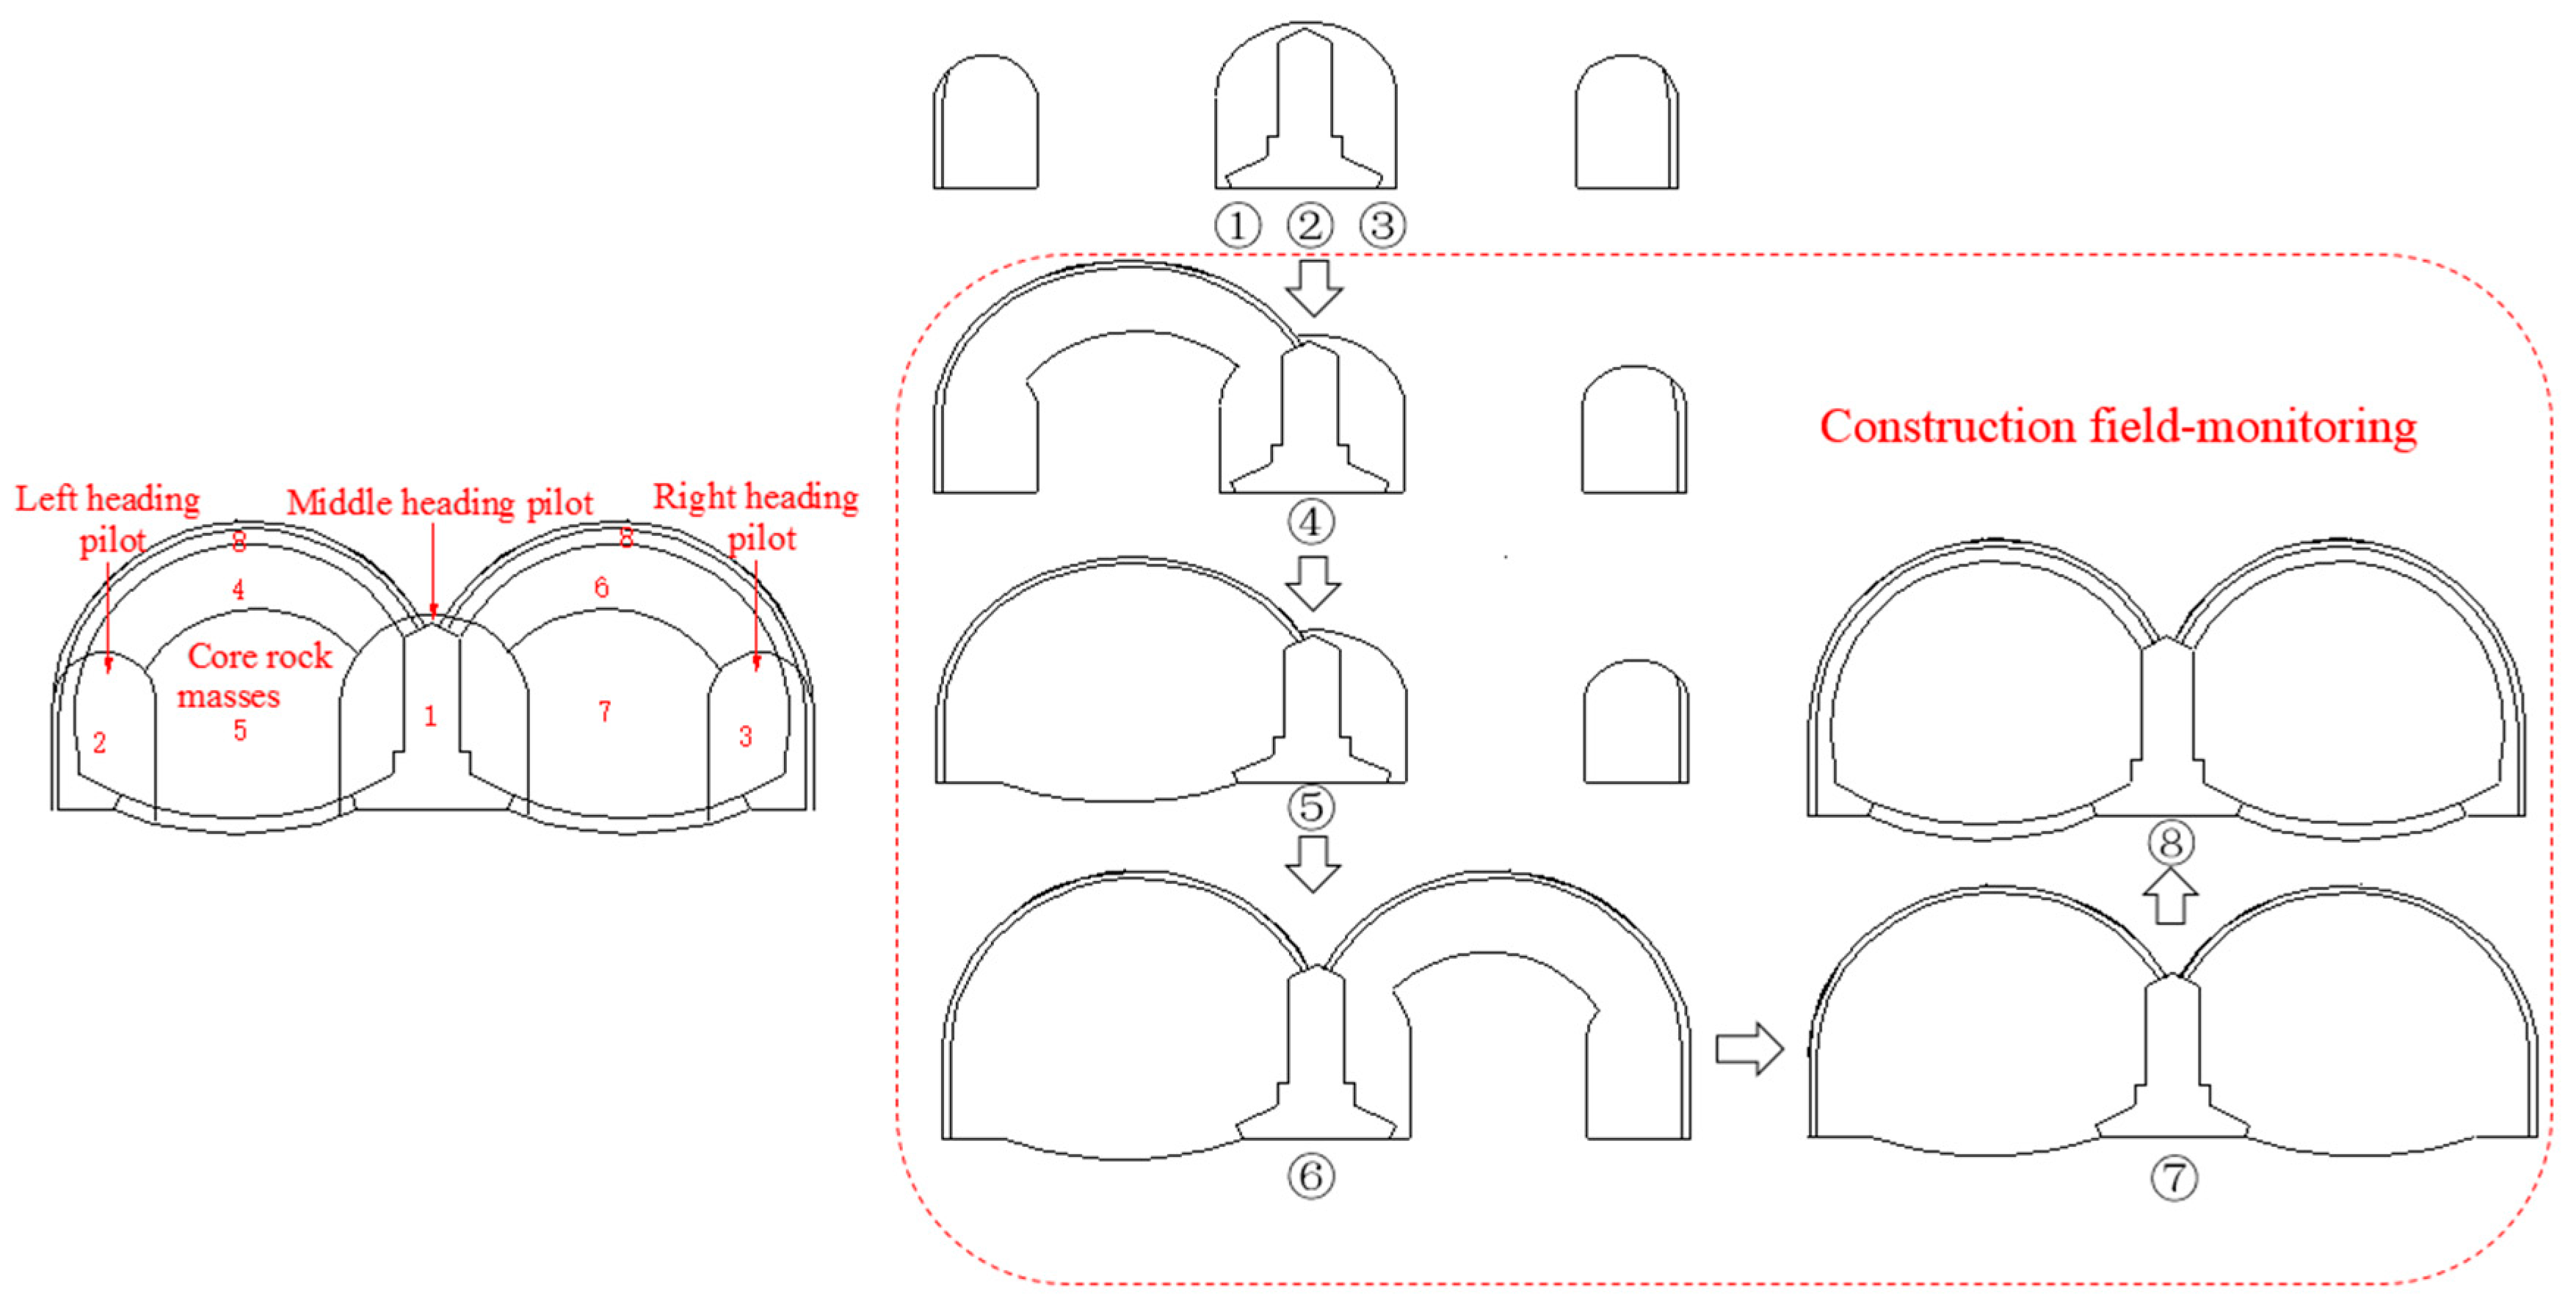
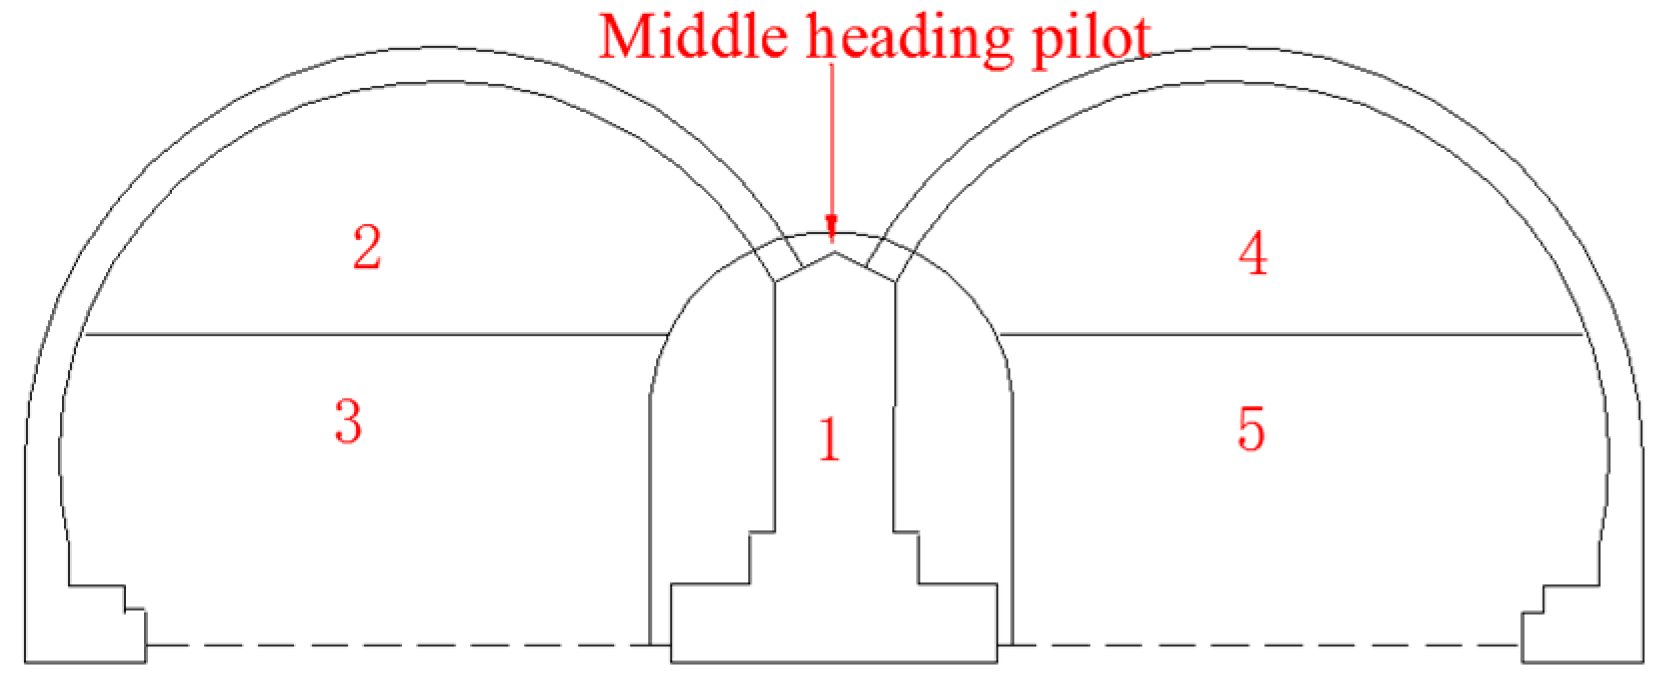
2.3. Tunnel Construction

Typical drilling and blasting method was applied for the excavation of the double-arched tunnel. The cross section of the tunnel was excavated partially in several stages with minor advance being controlled at about 0.5 m in each cycle of drilling and blasting. Millisecond blasting technique was achieved by high-precision digital electronic detonator and the delay time between each interval was controlled with a range from 5 to 8 ms, making for better blasting effect and minimization of the blasting vibration strength. The diameter of each blast hole is designed to be 42 mm and the blast hole depth ranges from 0.7 to 1.9 m depending on its location. Rock emulsion explosive was adopted with density ranging from 950 to 1300 kg/m3 and velocity of detonation (VOD) ranging from 3500 to 4500 m/s. To prevent overbreak in perimeter, smooth blasting was achieved by using the explosive cartridge with diameter of 25 mm in contour blast holes. While in other blast holes, the cartridge with diameter of 32 mm was adopted.
Two different construction methods including the three heading excavation method (class IV and class V) and the central heading excavation method (class III) were applied respectively in the construction process (see Figure 2 and Figure 3). Figure 2 demonstrates the construction sequences for constructing the double-arched tunnel in class IV and V rock masses by the three heading excavation method, also named as three-pilot drift heading method, in which the middle drift and twin-side drifts were excavated prior to excavating the main tunnels in order to reduce the disturbance of unstable surrounding rock. As shown in Figure 2, the numbers of 1–7 represents the construction steps and the red dotted-line box denotes the construction stages where field monitoring was carried out. Step 1: excavate the middle drift and construct the vertical middle wall; Steps 2, 3: excavate the twin-side drifts; Step 4: excavate upper bench and support the primary lining of the left main tunnel; Step 5: excavate core rock masses and construct the inverted arch of the left tunnel; Similarly, Step 6: excavate upper bench and support the primary lining of the right main tunnel; Step 7: excavate core rock masses and construct the inverted arch of the right tunnel; After all these steps above, both the secondary linings of the left and right tunnels are constructed. The advance footage of each construction cycle is 2.4 m. Figure 3 shows the construction procedures of the double-arched tunnel in class III rock masses by the middle heading pilot method.

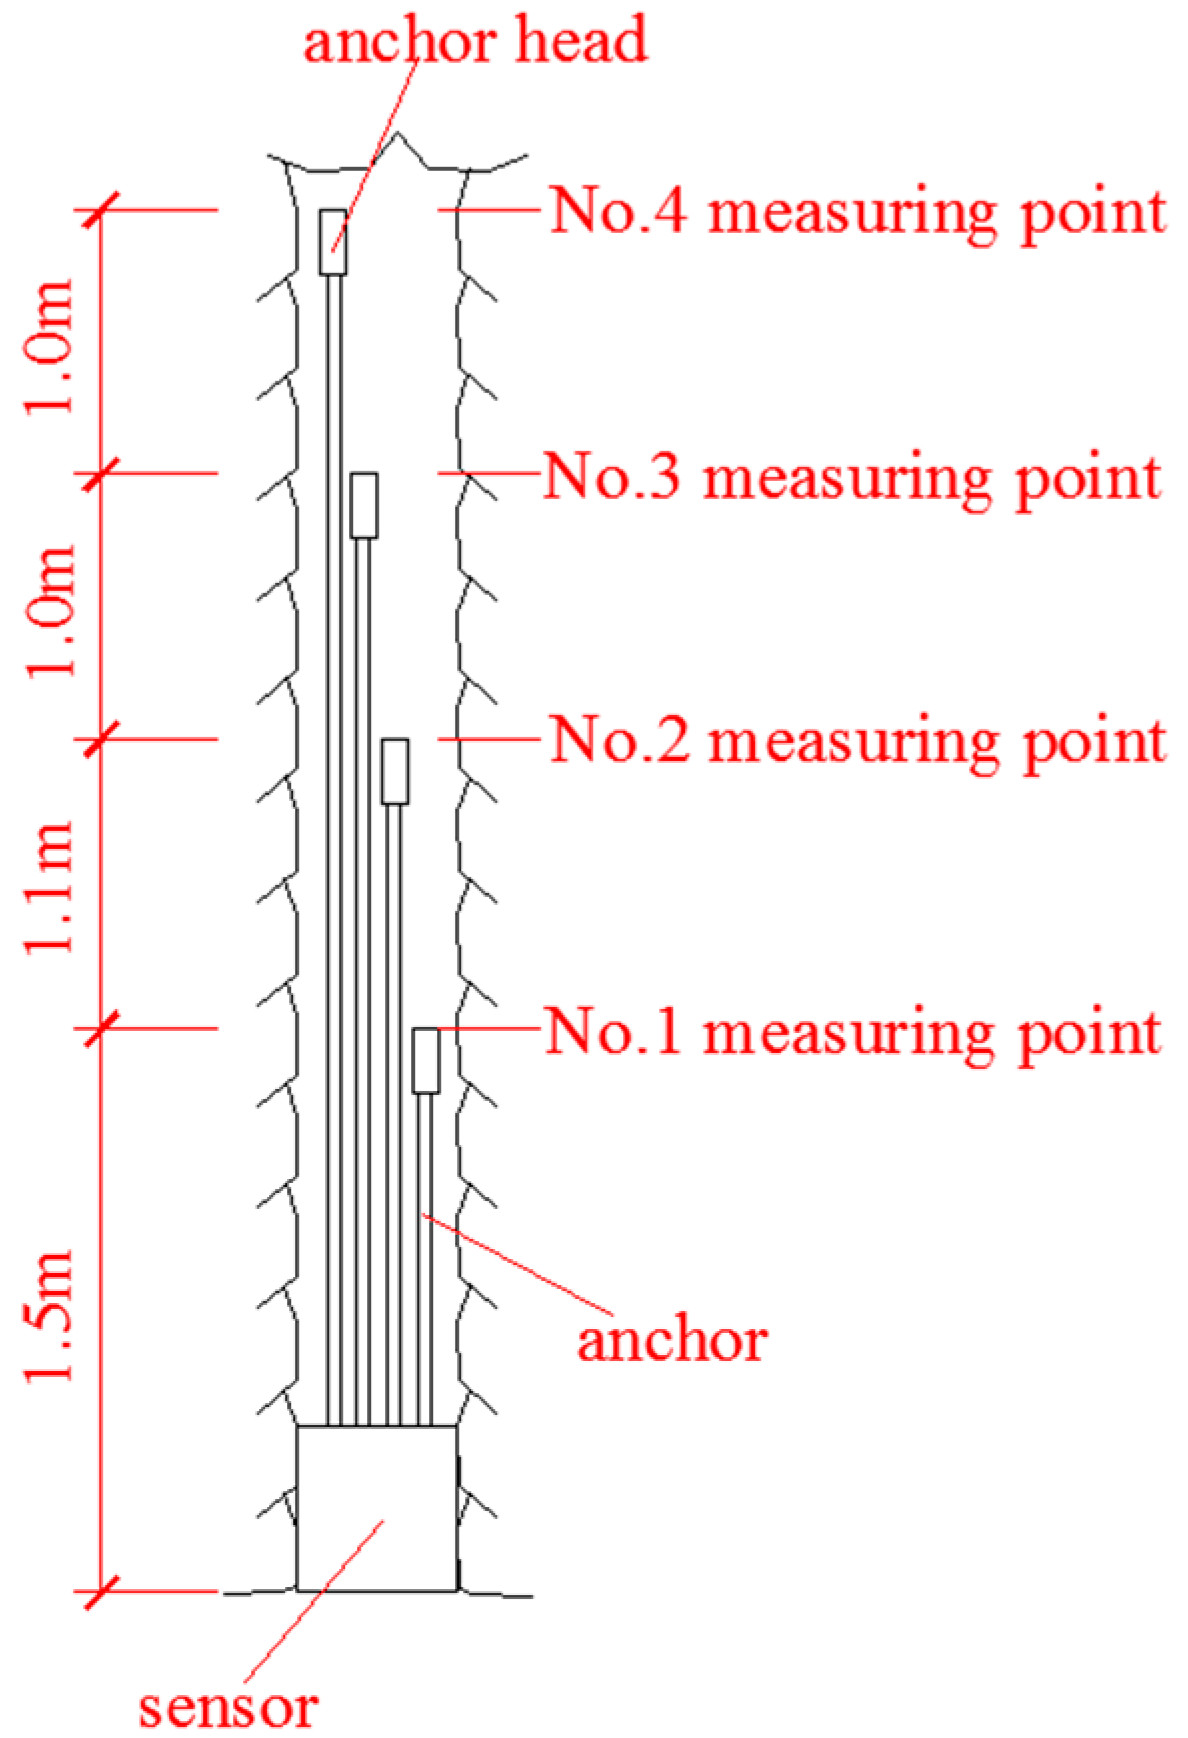
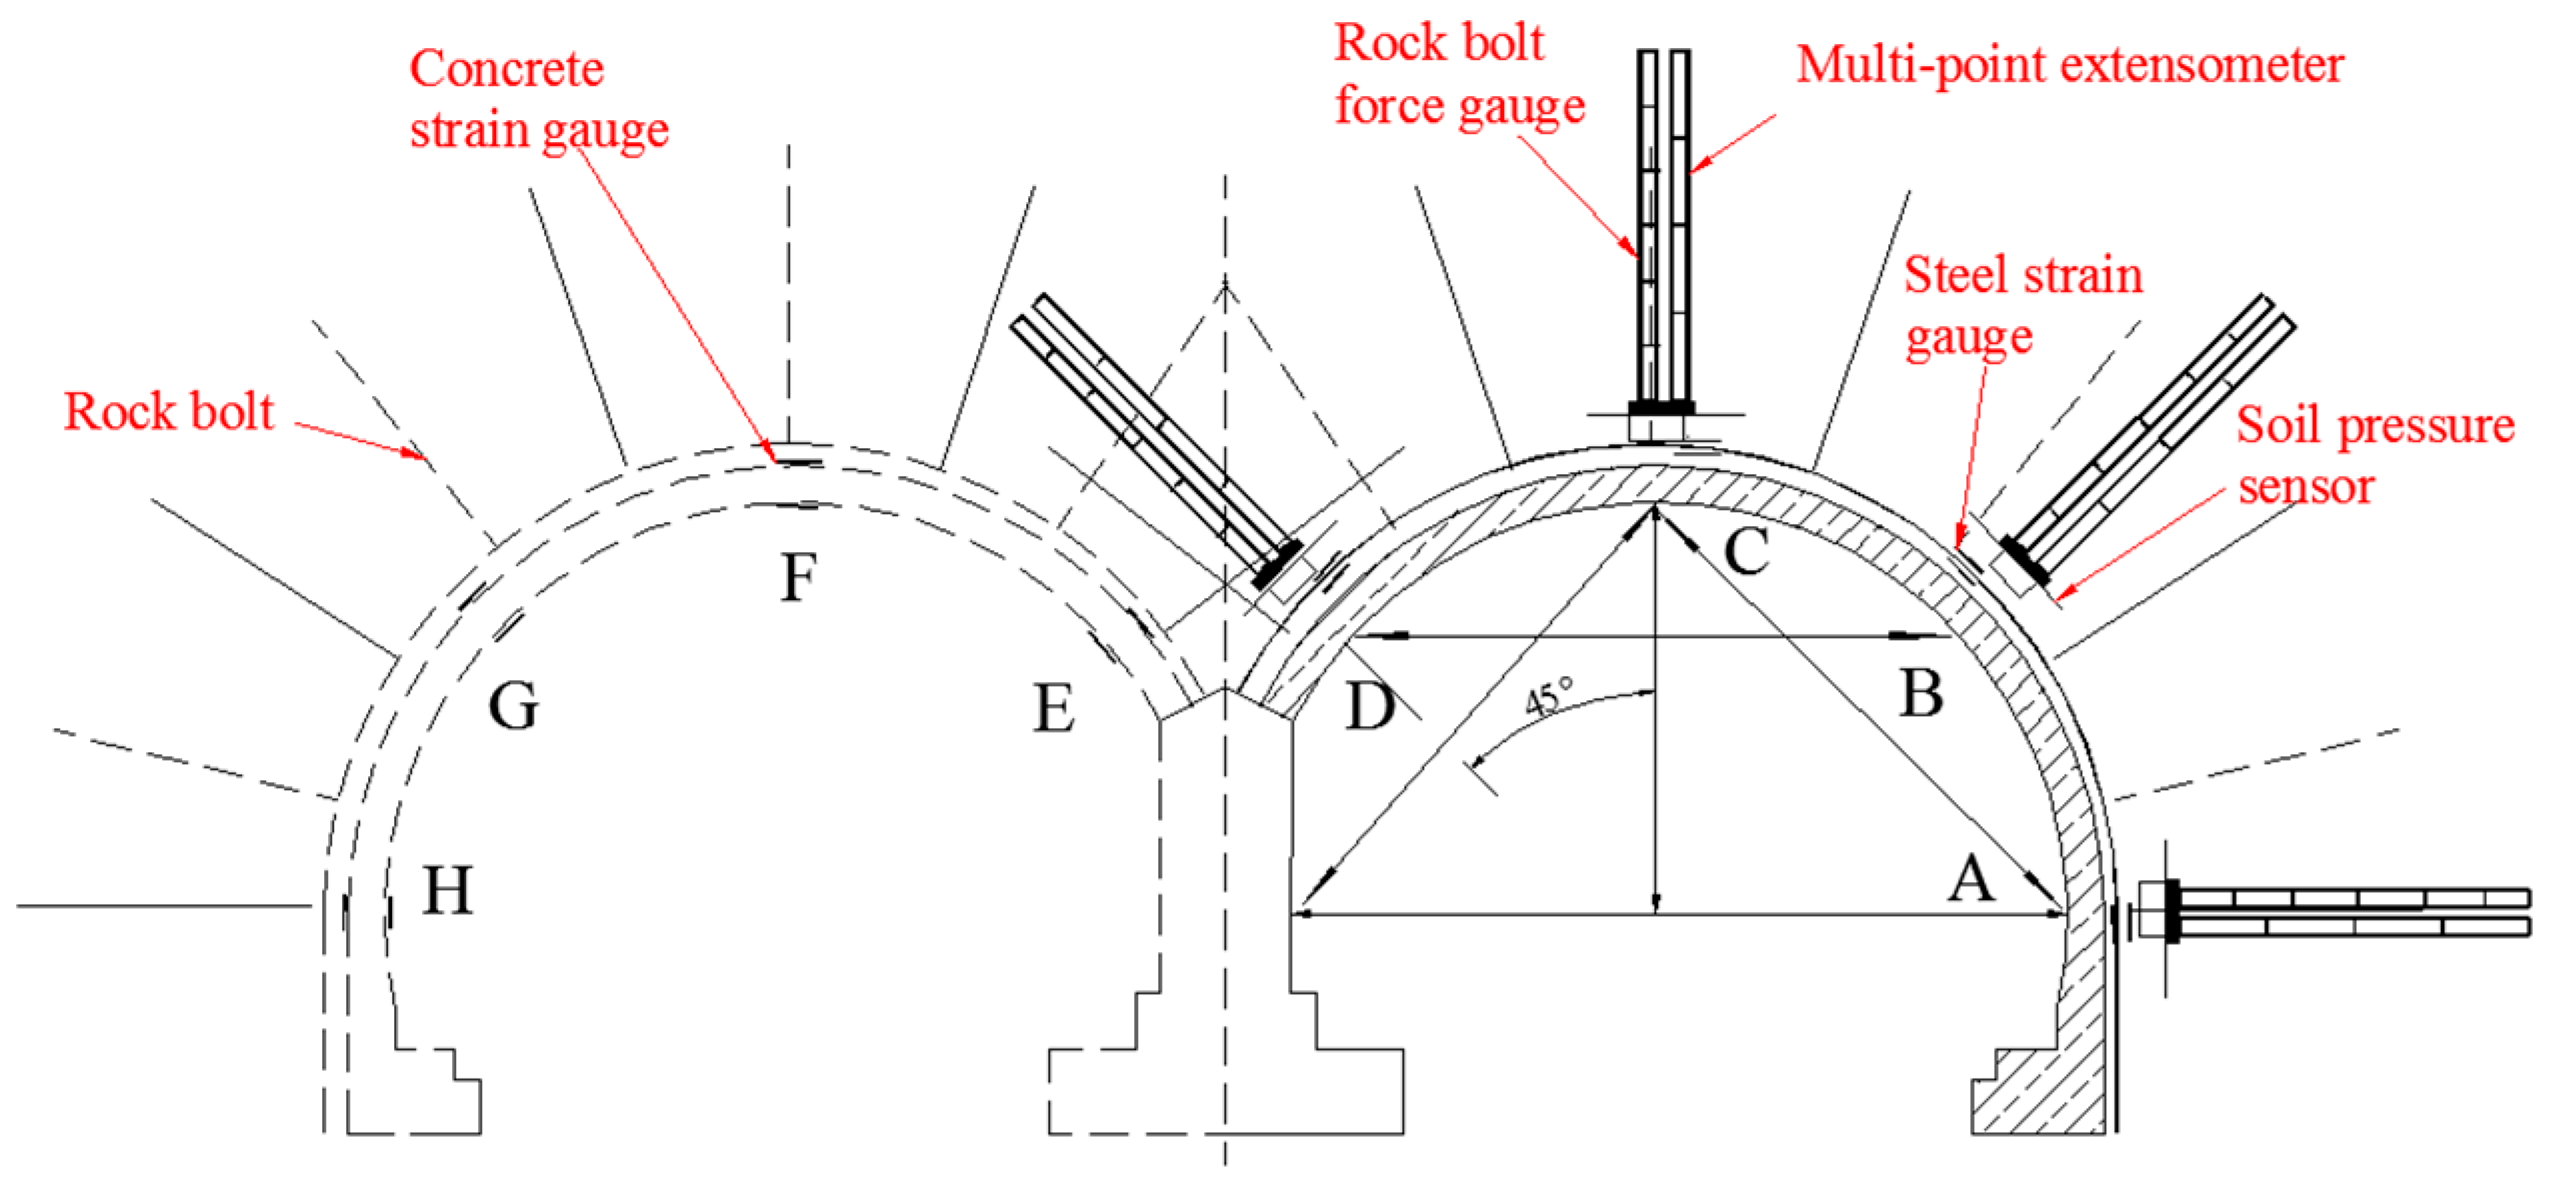
2.4. Monitoring Parameters and Methods

During the construction of the Gangkou tunnel, the internal displacements of surrounding rocks were measured by the multi-point extensometers (see Figure 4), the contact pressures between surrounding rocks and primary linings were directly measured by the vibrating-wire pressure cells and the axial forces in rock bolts were obtained by the vibrating-wire bolt force gauges (see Figure 5). In addition, the vibrating-wire steel strain gauges (see Figure 6) were adopted to measure the strains on the upper and the lower flanges of the I-shaped steel arches and then on basis of the assumption that the stresses are distributed linearly in the cross section of the steel, the stresses can be calculated through the stress-strain relationship according to the classical mechanics of materials, as shown in Equation (1).
N 1 = 1 2 E 1 ( ε i n n e r + ε o u t e r ) A ; M 1 = 1 2 E 1 ( ε i n n e r ε o u t e r ) W
where, N1 and M1 represent the axial force and the bending moment in the steel arch respectively; E1 denotes the elastic modulus of the I-shaped joist steel, being equal to 210 GPa; εinner and εouter are respectively the measured strain values on the upper and the lower flanges of the I-shaped steel arch and the tensile strain is regarded to be positive while the compressive strain is negative; A represents the cross-sectional area of the No. 14 I-shaped joist steel which is equal to 21.5 cm2, W is the section modulus in bending of the joist steel, being equal to 102 cm3.
Furthermore, the internal forces in the secondary linings were obtained through the calculation of the strains measured by the embedded concrete strain gauges (see Figure 7). The internal forces in the secondary linings can be calculated by Equation (2). In the practical application, the internal forces can be obtained from the observed strains by computer programming. Detailed monitoring parameters and methods are presented in Table 4.
N 2 = 1 2 E 2 ( ε i n n e r + ε o u t e r ) b h ;   M 2 = 1 12 E 2 ( ε i n n e r ε o u t e r ) b h 2
where, N2 and M2 respectively denote the axial force and the bending moment to be calculated; E2 denotes the elastic modulus of the secondary lining; ε i n n e r and ε o u t e r are respectively the measured strain values on the inner and outer side of the secondary lining; b and h respectively represent the per unit length and the thickness of the secondary lining.

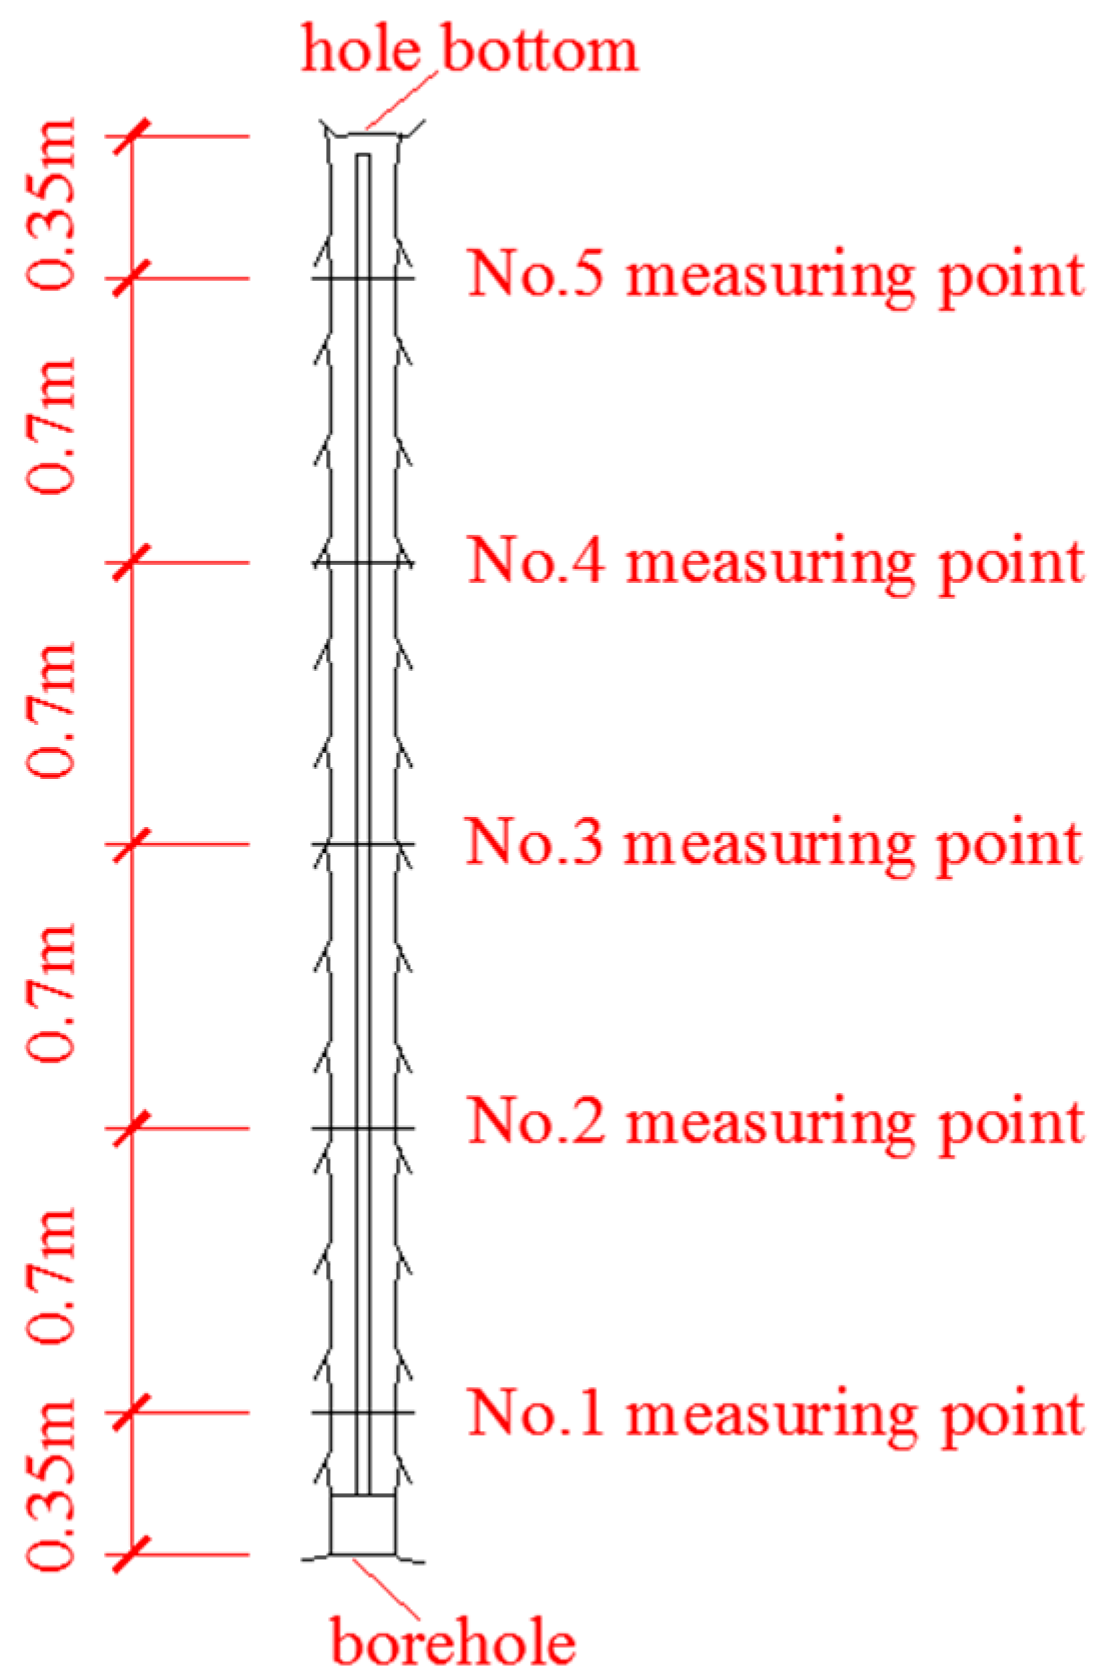
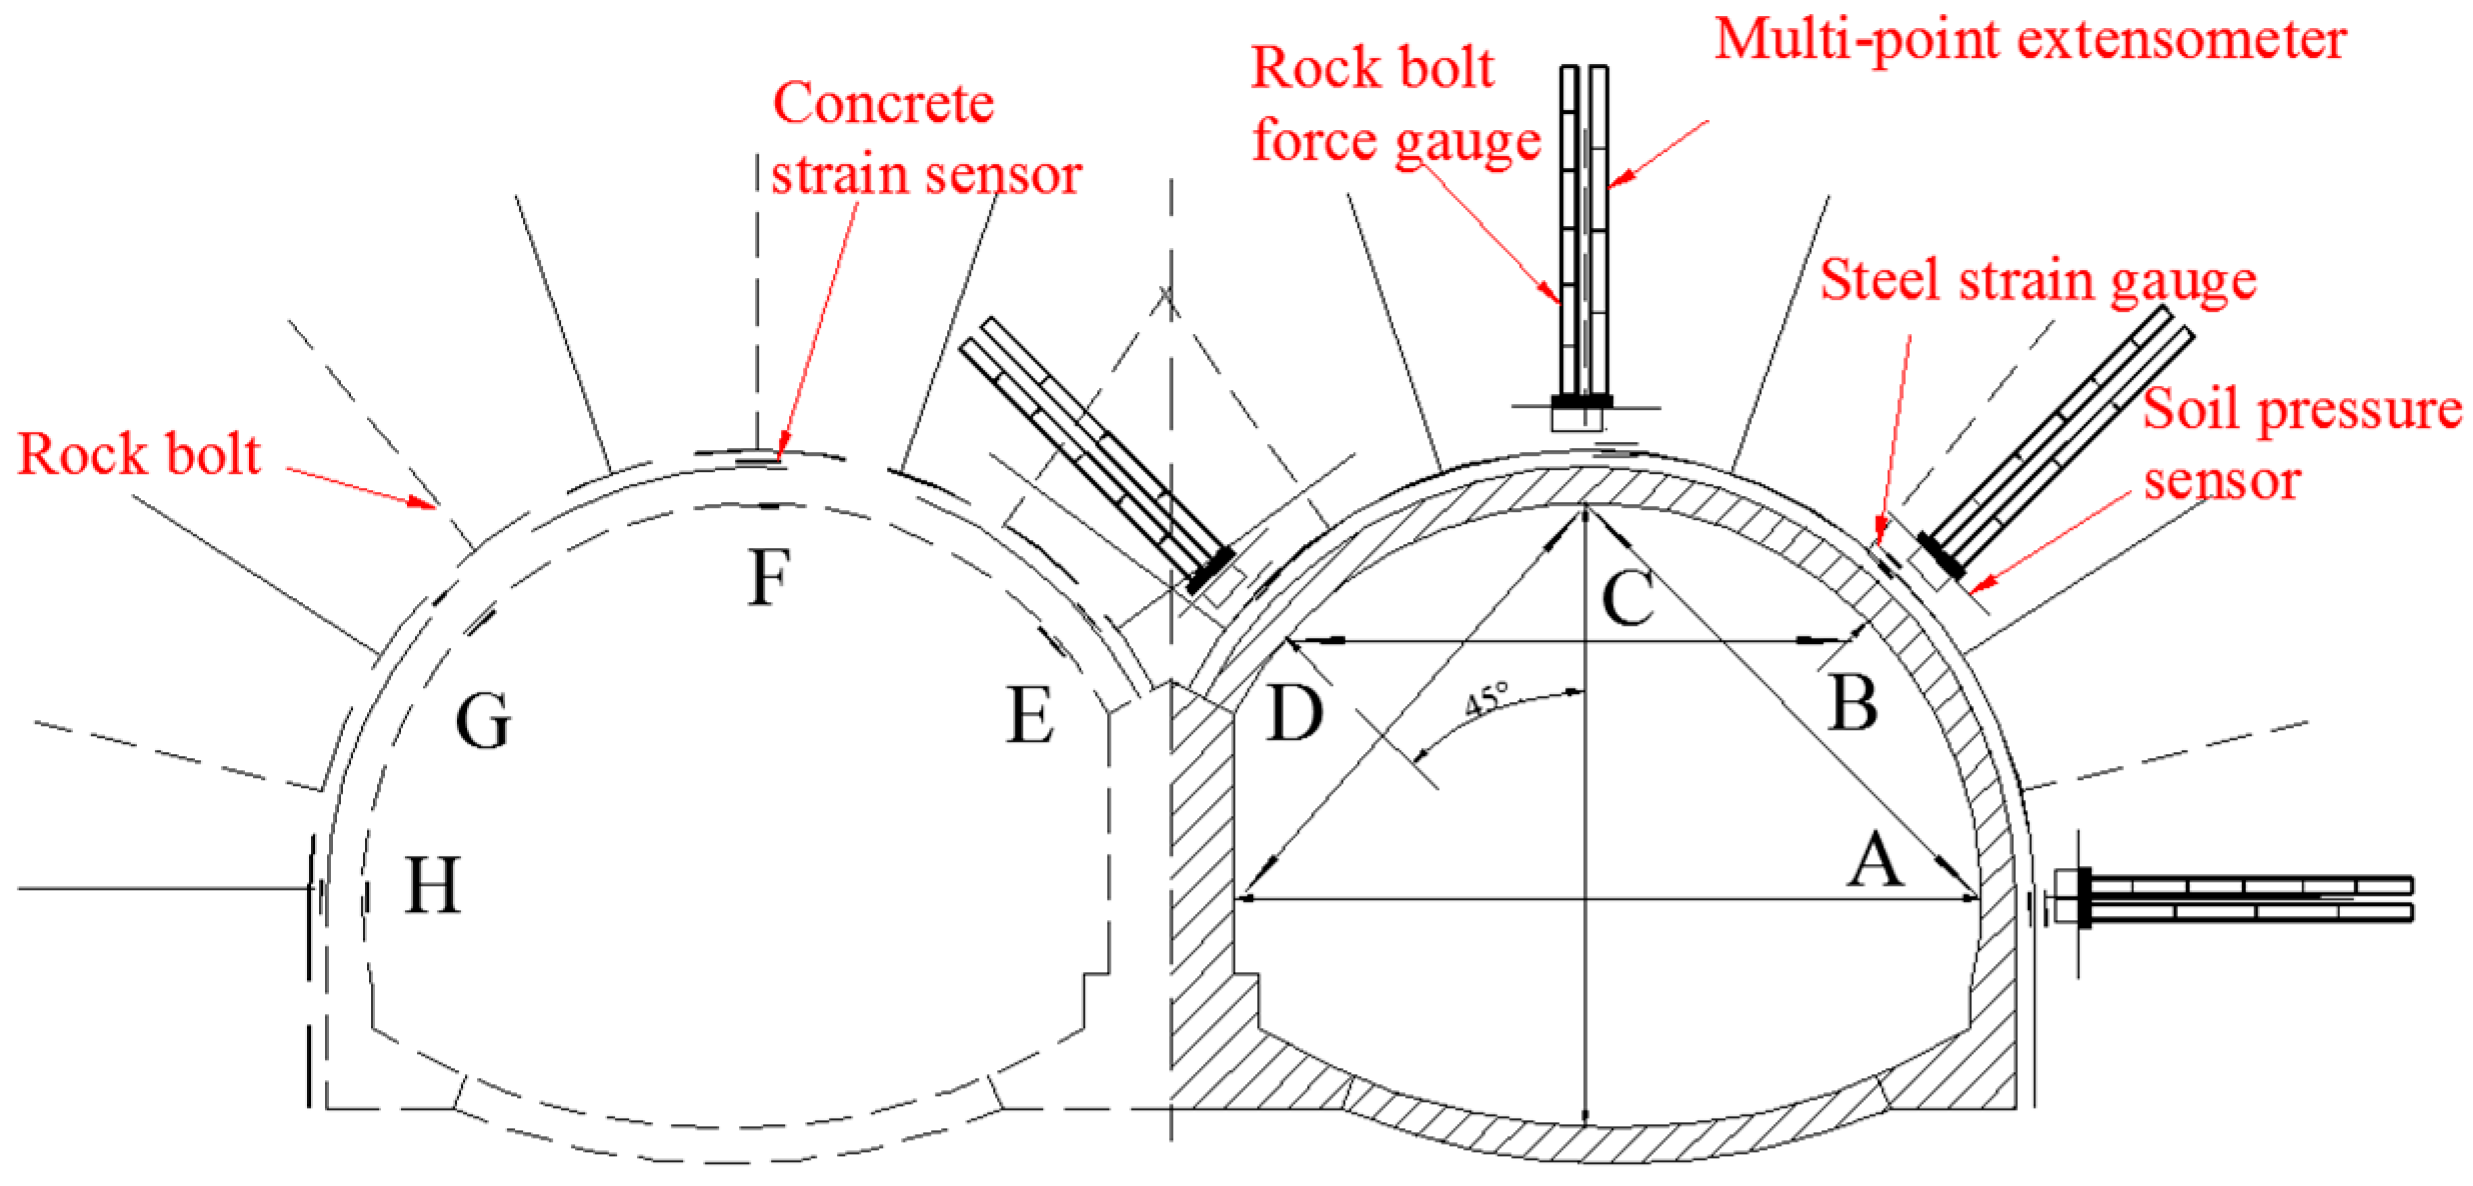
2.5. Monitoring Sections and Measuring Points Layouts

Since the Gangkou double-arched tunnel is structurally symmetrical and the geological conditions in the tunnel area are basically similar, instead of monitoring the deformations and stresses of the surrounding rocks and lining structures in the entire cross section of the double-arched tunnel, only one bore needs to be monitored. Typical monitoring sections were chosen in each rock mass classification in the tunnel area. These three monitoring sections are the K89+949 section (class III rock masses), K90+105 section (class IV rock masses) and K89+729 section (class V rock masses), as shown in Figure 1. The burial depths of the cross sections are, respectively, 56.0 m, 39.2 m and 40.5 m. According to the Code for Design of Road Tunnel in China [26], these three cross sections are deep-buried. Therefore, the same monitoring parameters in different cross sections can be compared. The layouts of the measuring points in different classes of surrounding rocks are shown in Figure 8 and Figure 9.

3. Monitoring Results and Analysis

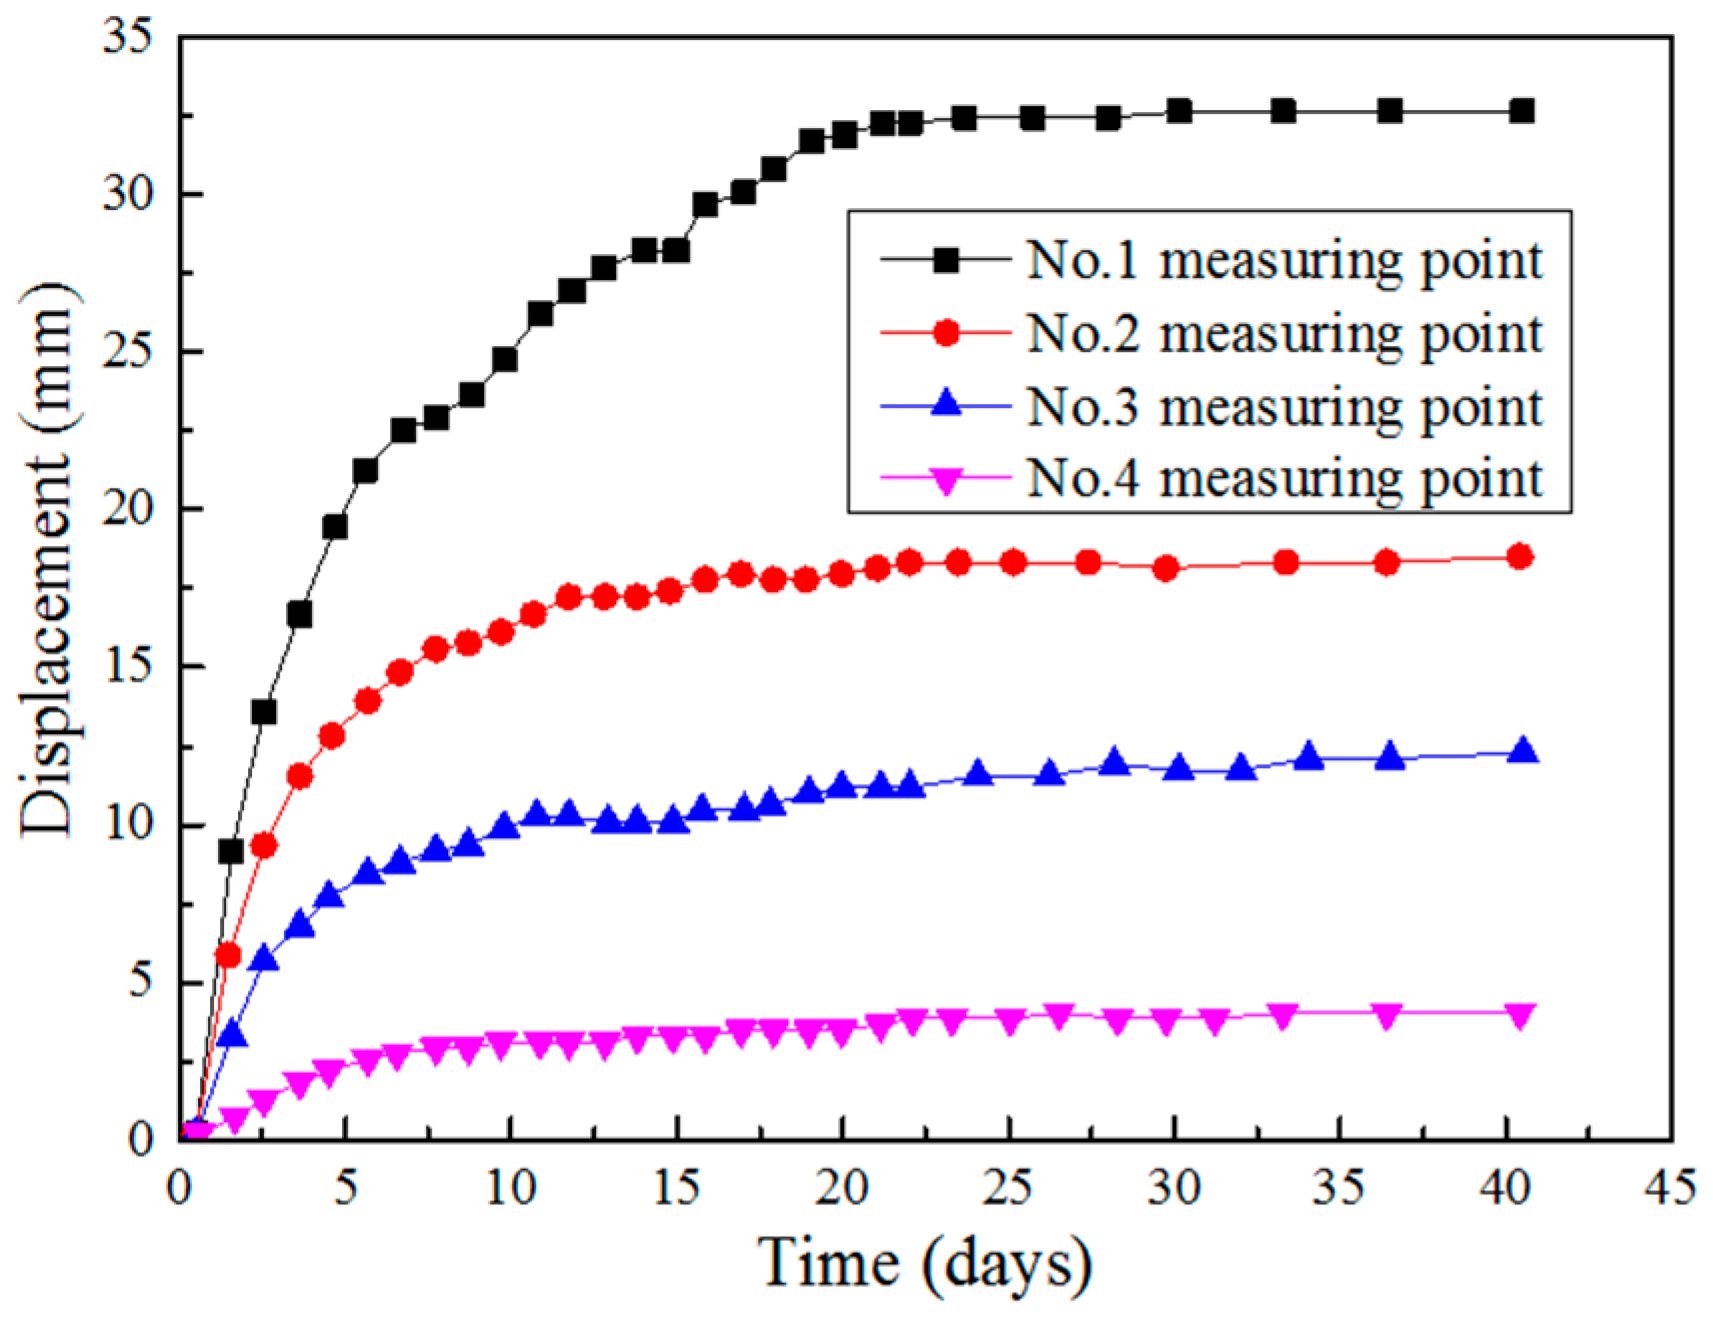
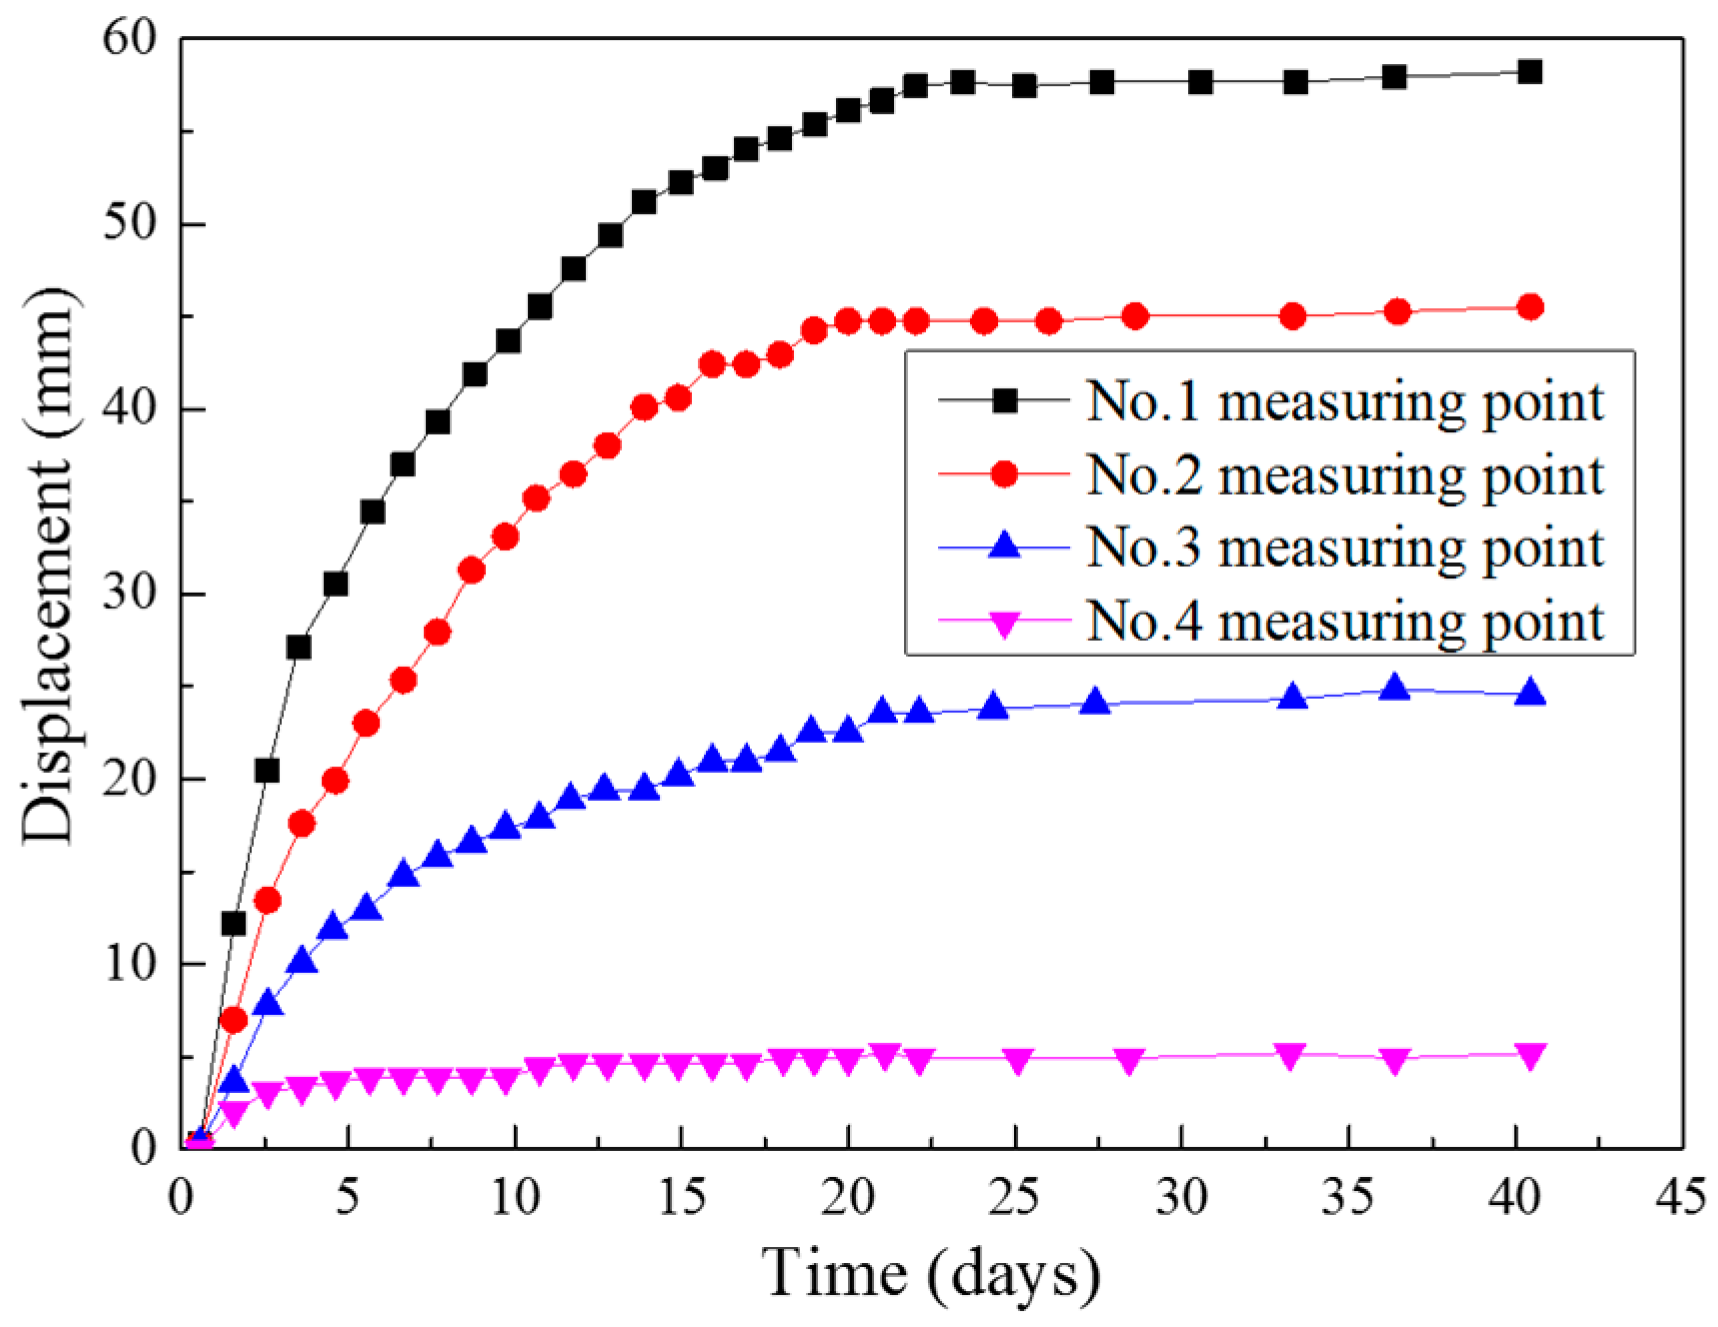
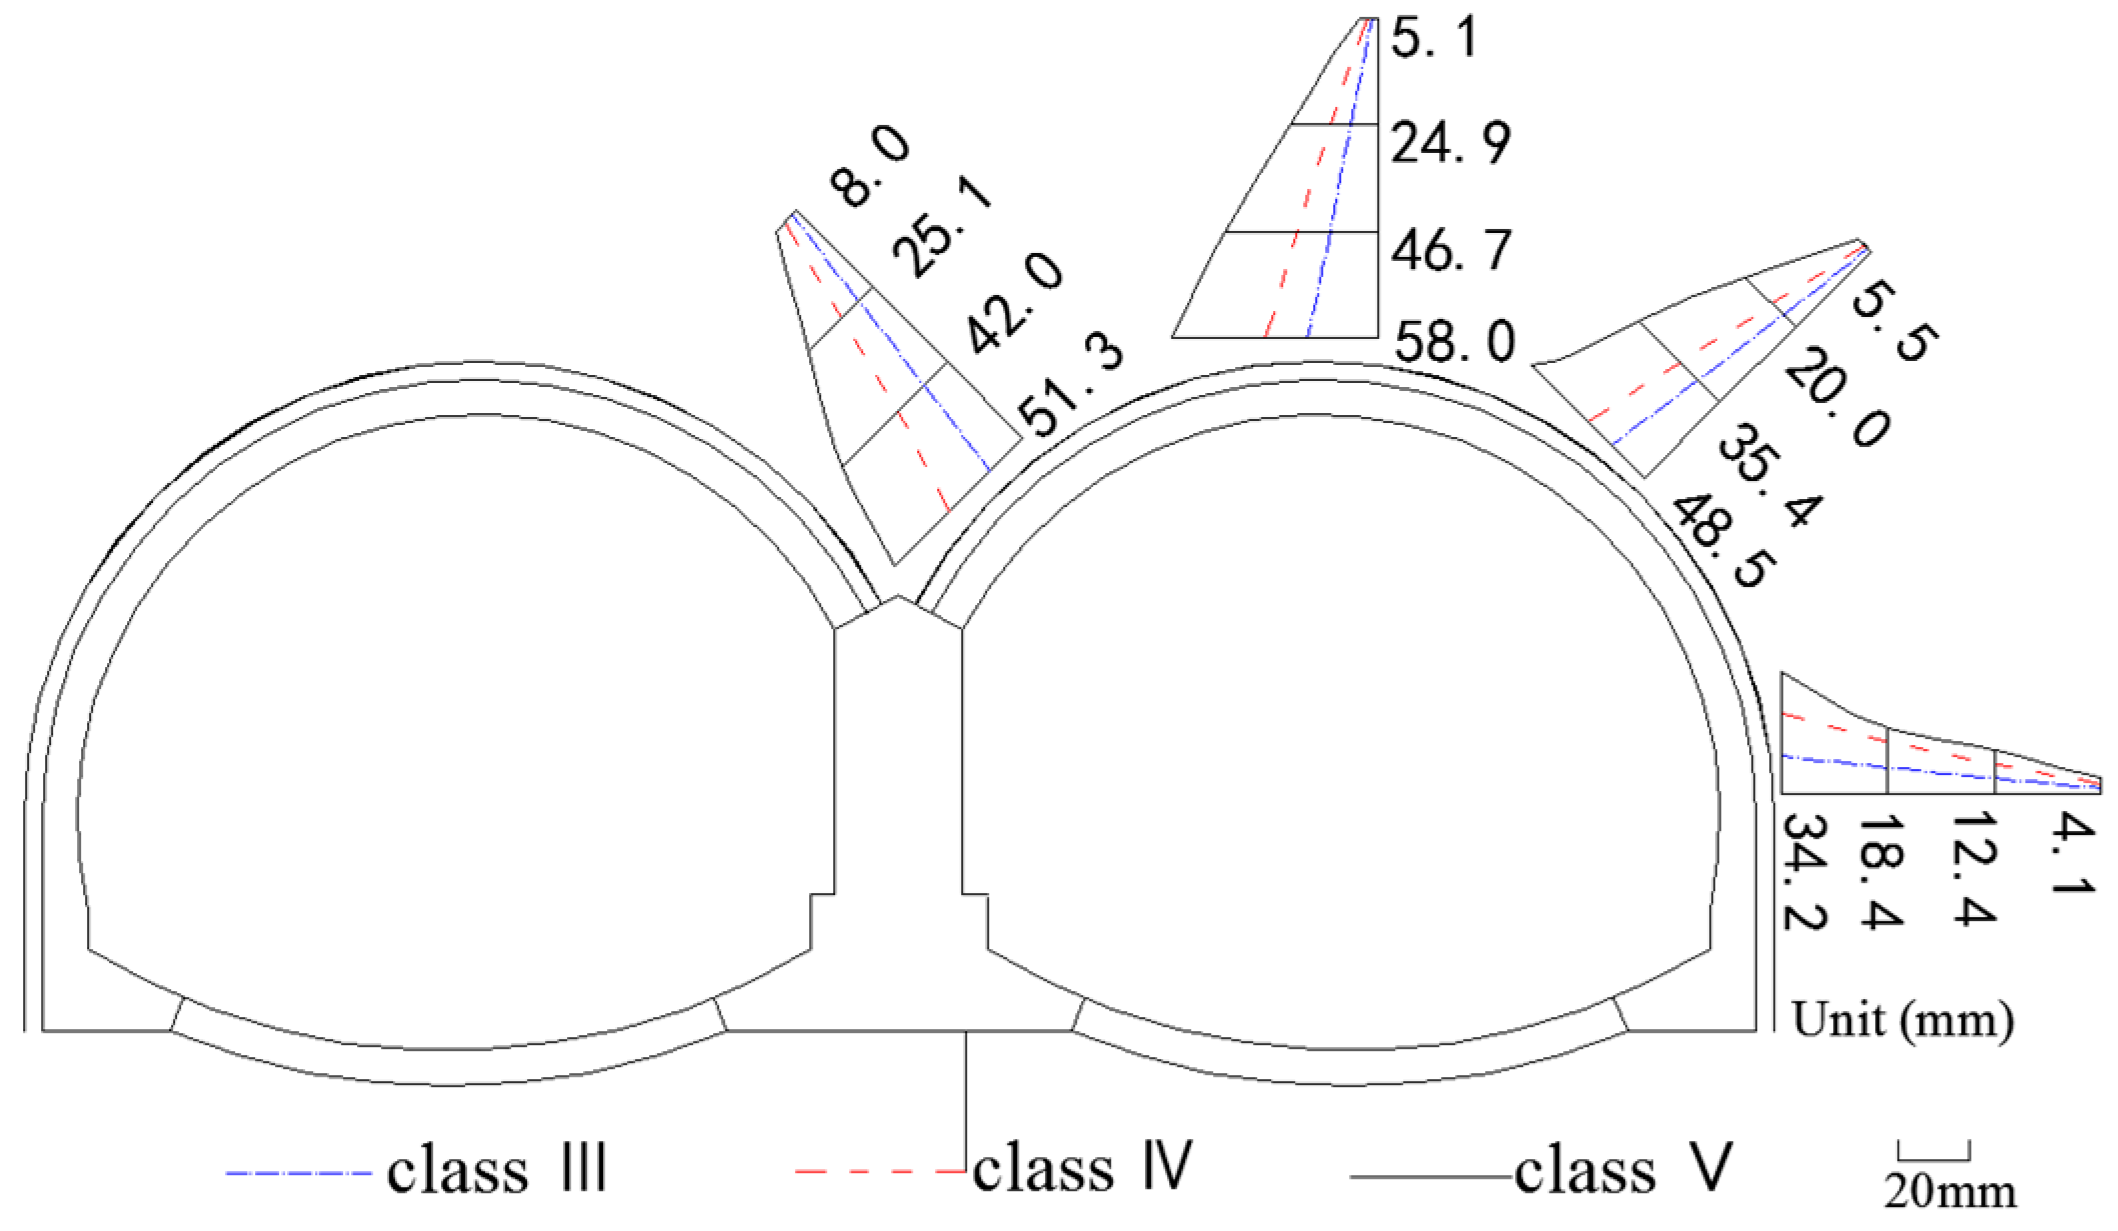
3.1. Internal Displacements of Surrounding Rocks

Figure 10 and Figure 11 depict time history plots of the internal displacements in class V surrounding rocks at positions B and C (see Figure 8) in the K89+729 section. As shown in the figures, the changing trend is closely related to the construction procedures, which mainly includes three stages of change: (1) after the multi-point extensometers had been installed at the right places, the measured values of the internal displacements at each location of surrounding rocks kept increasing rapidly and the growth rate was on the rise as well. After the construction of the initial supports, the displacements at each point reached to about 50% of the ultimate stable values; (2) the internal displacements at each location of surrounding rocks continued to increase whereas the increasing rate gradually slowed down after the initial supports were completed. Till the completion of secondary linings, the increments of the displacements accounted for about 40% of the final values; (3) after keeping small growth rate for a short period, the internal displacements of surrounding rocks did not reach the stable state until the construction of secondary linings.
Figure 12 shows the final distribution of the internal displacements in the cross sections corresponding to three different classes of rock masses (class III, class IV and class V) (layouts of the measuring points are shown in Figure 4). As we can see from Figure 12: at the same location in the monitoring section, the internal displacements of surrounding rocks are larger in the area that is closer to the tunnel excavation contour line. The displacements are relatively larger in the area within 3 m from the tunnel excavation contour line, which should be seen as the key monitoring area. At different locations in the same monitoring section, the internal displacements of surrounding rocks at the tunnel vault are greater than that at the tunnel spandrel while the displacements at the tunnel spandrel are greater than that at the side wall of the tunnel. In addition, the internal deformations of surrounding rocks are relatively larger in the cross section with lower-level surrounding rock masses. For example, the final stable-state value of the internal displacement at the vault in the cross section K89+949 (class III) is about 20 mm while the value becomes about 40 mm in the section K90+105 (class IV) and it reaches up to 60 mm in the section K89+729 (class V).

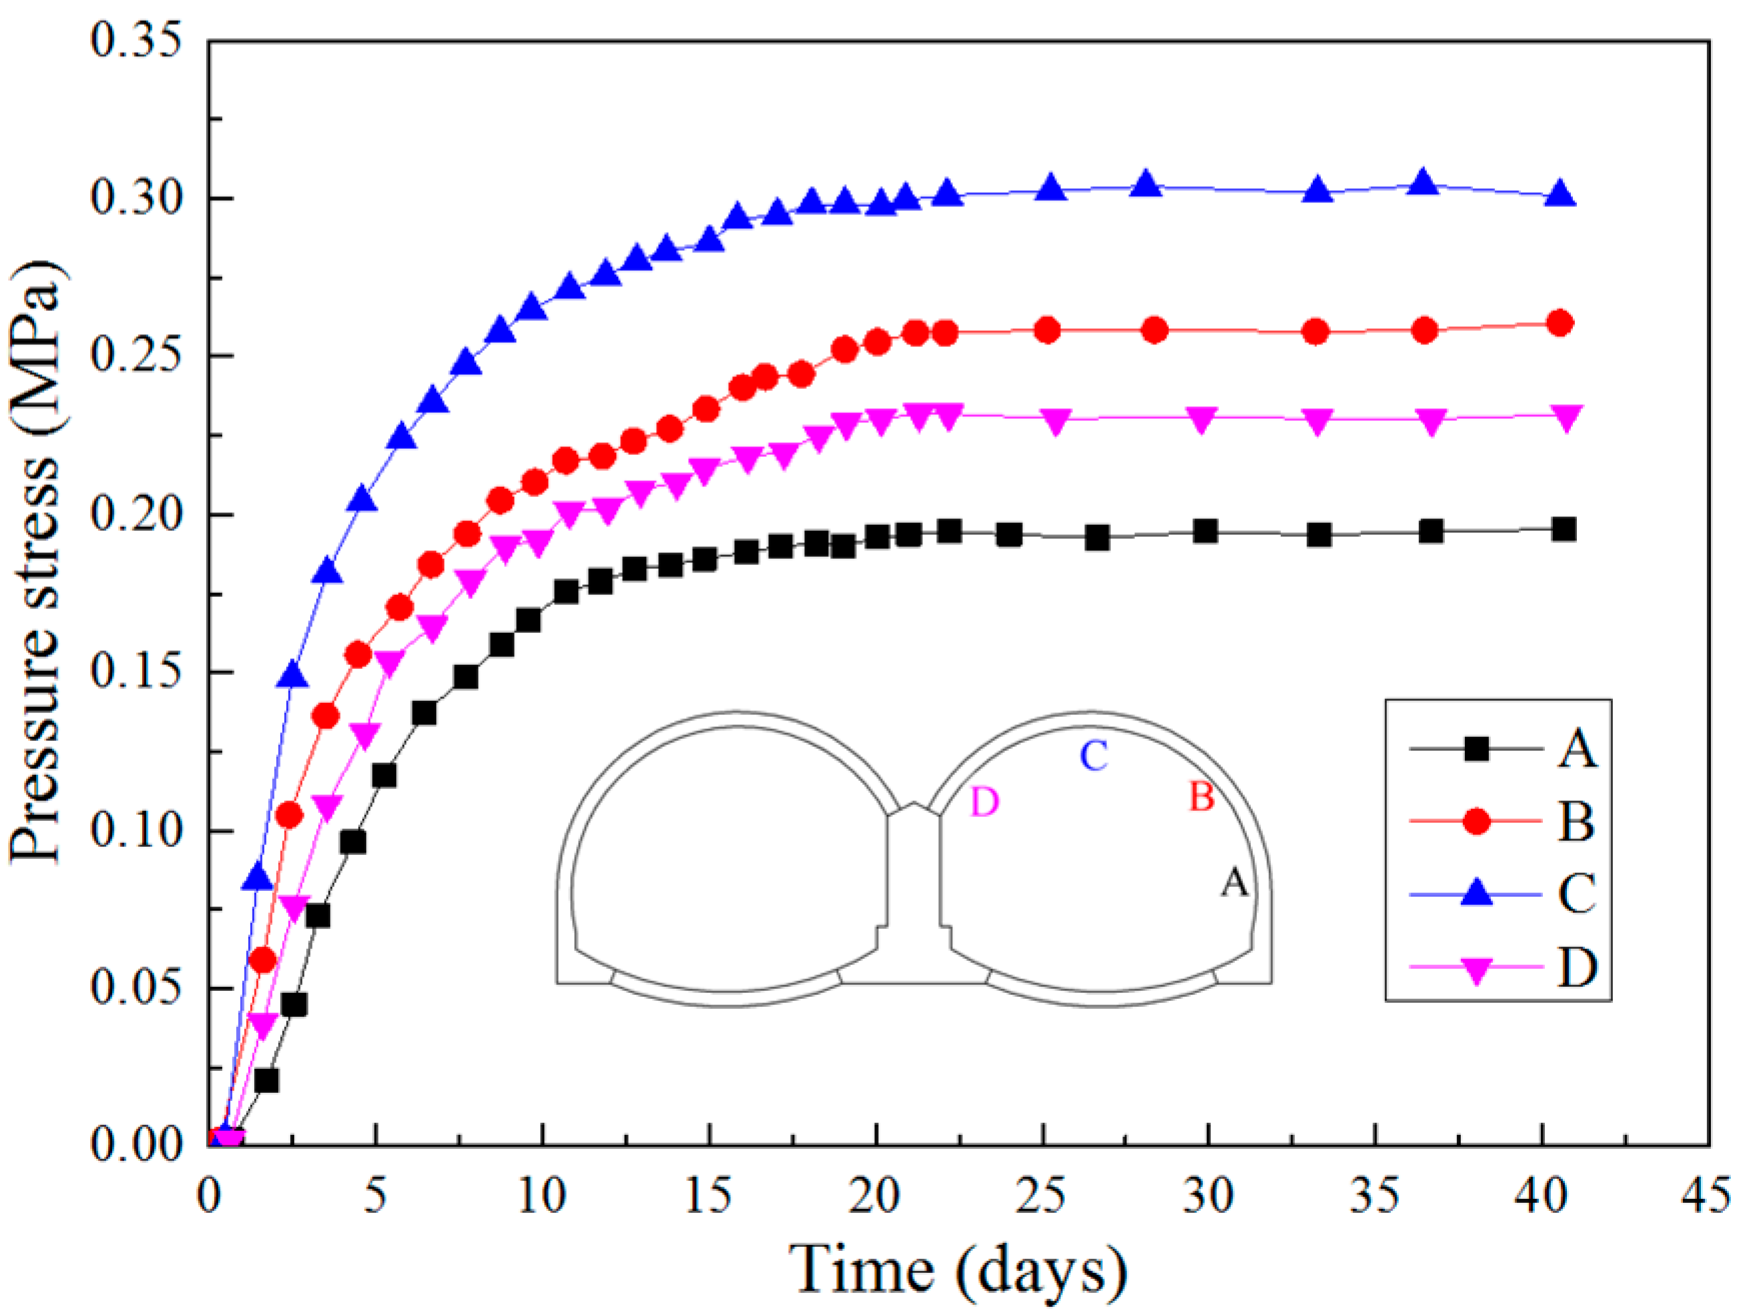
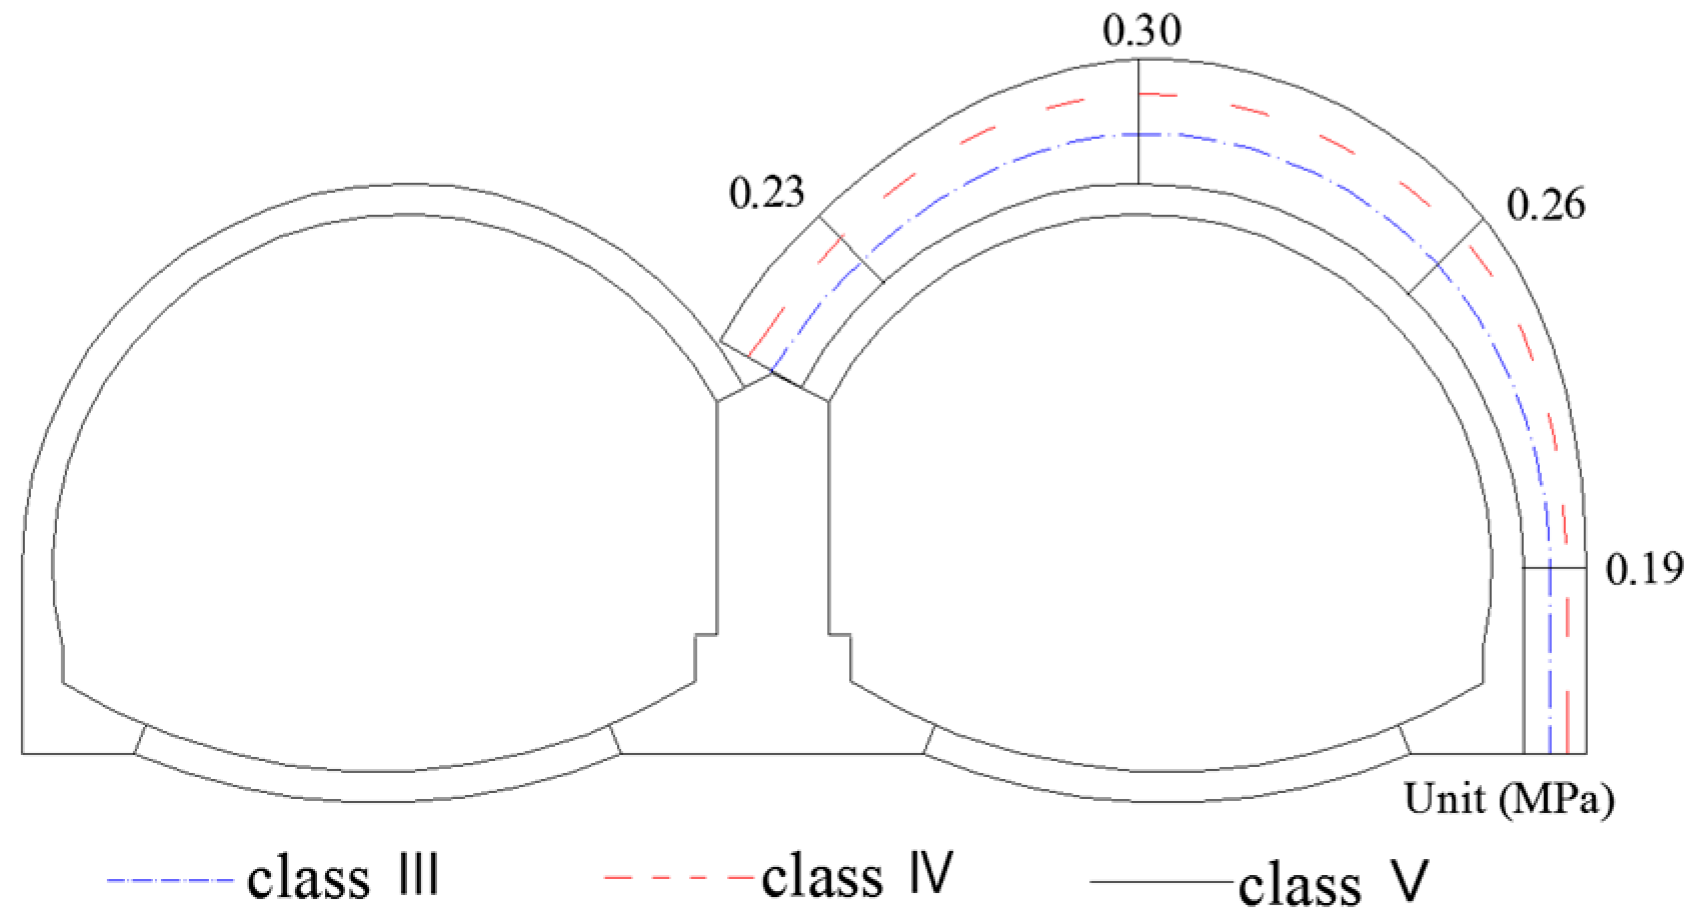
3.2. Contact Pressures between Surrounding Rocks and Primary Linings

The time history plots of the contact pressures between surrounding rocks and primary linings in the K89+729 section are presented in Figure 13. As shown in the figure, after the earth pressure cells had been installed in the right places, the contact pressures between surrounding rocks and primary linings increased rapidly and the increasing tendency did not slow down until the completion of the primary lining construction. The pressures reached up to 90% of the final stable-state values about 5 days after the construction of primary linings. When the construction of secondary linings was finished, the contact pressures almost stopped increasing. At this time, the state of surrounding rocks could be considered stable.
Figure 14 presents the final distribution of the contact pressures between surrounding rocks and primary linings in the cross sections corresponding to different classes of surrounding rocks (class III, IV and V). It can be seen from Figure 14 that at different locations in the same cross section, the pressures at the tunnel vault are higher than that at the spandrel, while the pressures at the spandrel are higher than that at the side wall. As an important bearing structure of the double-arched tunnel, the existence of the middle wall is able to effectively ease the surrounding rock pressures on the primary linings near the middle wall, resulting in the decreasing of the contact pressures on that side. In addition, the contact pressures between surrounding rocks and primary linings are greater in the cross section with lower-level surrounding rocks. For instance, the contact pressure at the tunnel vault in the cross section K89+949 (class III) is about 0.15 MPa while the pressure in the section K90+105 (class IV) is about 0.25 MPa and the pressure reaches up to 0.30 MPa in the section K89+729 (class V).
Since there is no definite calculating formula concerning the surrounding rock pressures of the double-arched tunnel, the surrounding rock pressures can be estimated through Protodyakonov’s theory. According to the theory, the span length and the height of the tunnel balance arch as well as the surrounding rock pressures can be calculated by those formulas as shown below:
a 0 = a + 2 b tan ( 45 o - φ 0 2 )
b 0 = a 0 2 f
q = γ b 0
where, a0 and b0 respectively represent the span length and the height of the tunnel balance arch, a and b respectively represent the designed span length and height of the tunnel, ϕ0 stands for the calculating internal friction angle of surrounding rocks, f stands for Protodyakonov’s firmness coefficient of surrounding rocks, γ is the rock density and q is the surrounding rock pressure at the tunnel vault.
q 1 = γ [ a + 2 b tan ( 45 o - φ 0 2 ) 2 f ] = 31.5 × [ 12.39 + 2 × 6.5 × tan ( 29 o - 29 o 2 ) 2 × 1.8 ] 0.14 MPa
The cross section K89+729 in class V surrounding rocks (ϕ0 = 29°, γ = 31.5 kN/m3, f = 1.8) is taken as a case. According to the formulas above, the calculated surrounding rock pressure at the left or right tunnel vault is 0.14 MPa (see Equation (6)), which is far lower than the field measured value 0.30 MPa. In this case (see Figure 15, case 1), the left and the right tunnel arches are regarded independent of each other, which is clearly not in accord with that actual situation. As is known, during the construction of the double-arched tunnel, the left and the right tunnel arches interact with each other and both have significant influence on the mechanical behaviors of each other. Therefore, when calculating the surrounding rock pressures of the double-arched tunnel, both the left and the right arches should be taken into consideration. At present, since there is no clear calculation method, based on the balance arch theory, a simplified calculation model is established to estimate the surrounding rock pressures of the double-arched tunnel. That is to consider these two arches as an entire single-arched structure, as shown in the Figure 15, case 2. In this case, the calculated value is 0.25 MPa (see Equation (7)). As is shown, although both the calculated values in these two cases are lower than the field measured value 0.30 MP, the calculated value in case 2 is much closer to the measured value than that in case 1, which indicates that both the left and the right arches should be considered when calculating the surrounding rock pressures through the balance arch theory. In addition, the difference between the theoretical calculated value and the field measured value reflects the complexity of surrounding rocks during the construction of the double-arched tunnel, which in turn illustrates the necessity to carry out on-site monitoring projects during the excavation of the double-arched tunnel.
q 2 = γ [ 2 a + 2 b tan ( 45 o - φ 0 2 ) 2 f ] = 31.5 × [ 12.39 × 2 + 2 × 6.5 × tan ( 29 o - 29 o 2 ) 2 × 1.8 ] = 0.25 M P a

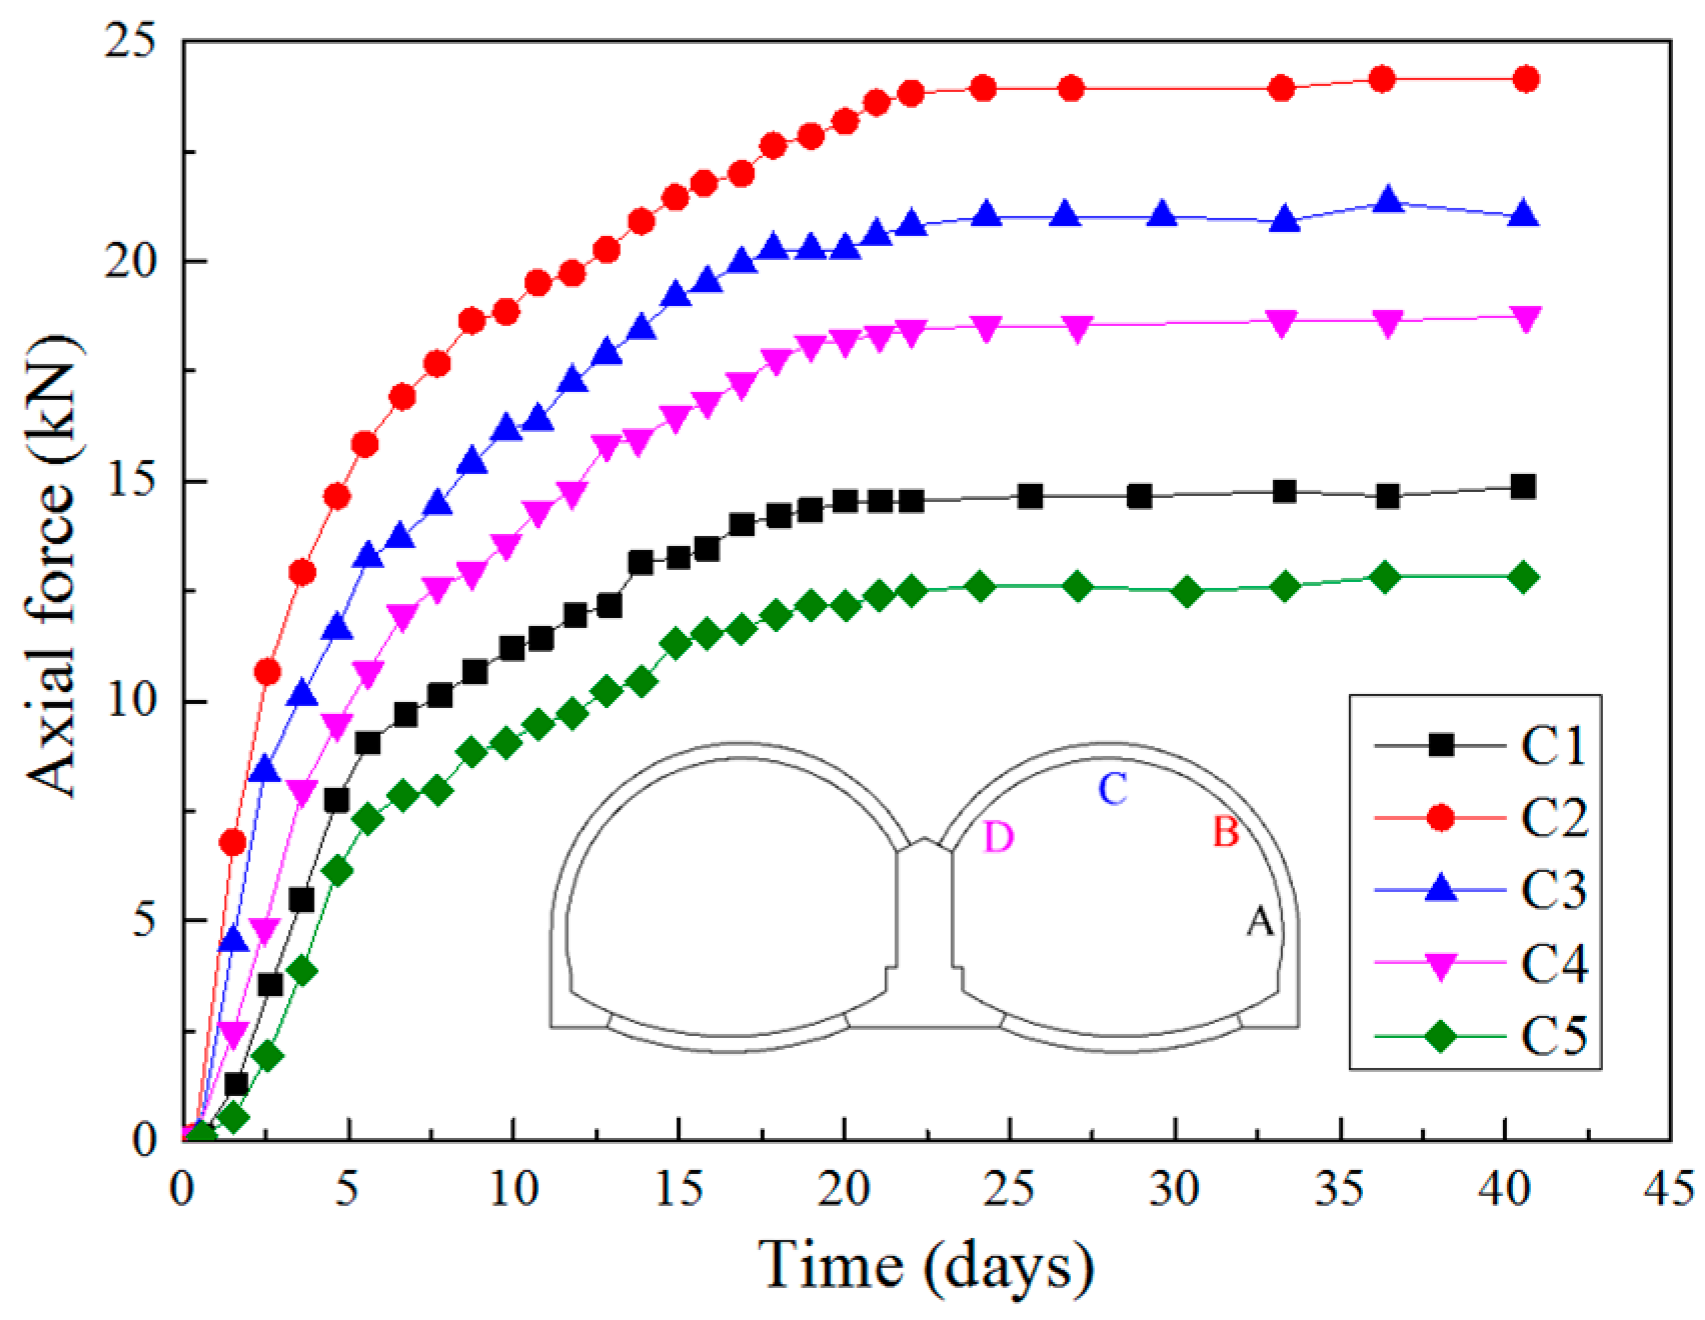
3.3. Axial Forces in Rock Bolts

Figure 16 and Figure 17 show the dynamic evolution of the axial forces in rock bolts at B and C locations in the K89+729 section during the tunnel construction. According to the field monitoring data, the axial forces in rock bolts present regular changes in stages: (1) When the installation of the rock bolts was completed, the axial forces in the rock bolts at different locations increased rapidly at a gradually increasing growth rate. After the construction of the primary linings, the values of the axial forces at each point in the rock bolts took up 60% of the final stable-state values and the growth rate of the axial forces began to slow down. This indicates that most of the axial forces in rock bolts were generated during the construction of the primary supports, owing to the fact that the sprayed concrete had not played its full role of supporting during this period, which then made the rock bolts bear the majority of the surrounding rock loadings; (2) After the construction of the primary supports, the axial forces in rock bolts remained on increasing slowly. From the completion of the primary supports to the completion of the second linings, the increments of the axial forces in rock bolts in this period accounted for about 30% of the ultimate stable values; (3) After the completion of the secondary linings, the axial forces in rock bolts increased slightly and then reached a steady state eventually.
Figure 18 demonstrates the final distribution of the axial forces in rock bolts in different sections corresponding to class III, IV and V surrounding rocks (layouts of measuring points are shown in Figure 5). It can be seen from the figure that each single rock bolt bears pure tensile stresses which are relatively larger in the middle of the rock bolt and lower at the two ends. At different locations in the same section, the axial forces in rock bolts at the tunnel vault are larger than that at the right spandrel, while the axial forces in rock bolts at the right spandrel are larger than that at the side wall, which are even greater than that at the left spandrel of the tunnel. This indicates the initial load bearing effects of the middle wall significantly lower the axial forces in the rock bolts close to the side of the middle wall, therefore it is necessary to take measures to strengthen the anchoring forces. The stable values of the axial forces in rock bolts are larger in the cross section with lower class of surrounding rock masses, the stable value of the axial forces in rock bolts in the section K89+949 (class III) is about 12 kN, the stable value in the section K90+105 (class IV) is about 18 kN, whereas the value in the section K89+729 (class V) becomes about 25 kN. Among them, the maximum value of the axial forces in rock bolts is 25 kN and the tensile stress is 50.9 MPa by calculation (see Equation (8)). The body of the rock bolt (diameter: Φ25 mm) used in the tunnel is made of hot-rolled ribbed bar (HRB) 335 round steel, of which the ultimate tensile stress is 168.4 MPa. It is quite clear that the actual bearing capacity of the rock bolt has not been utilized to its full potential, which is far less than the designed bearing capacity. Therefore, under the premise of ensuring the stability and safety of surrounding rocks, it can be acceptable to reduce the number of the rock bolts, to increase the bolt spacing and to strengthen the anchoring forces appropriately.
σ = 25 × 10000 0.25 π × 25 2 50.9 MPa

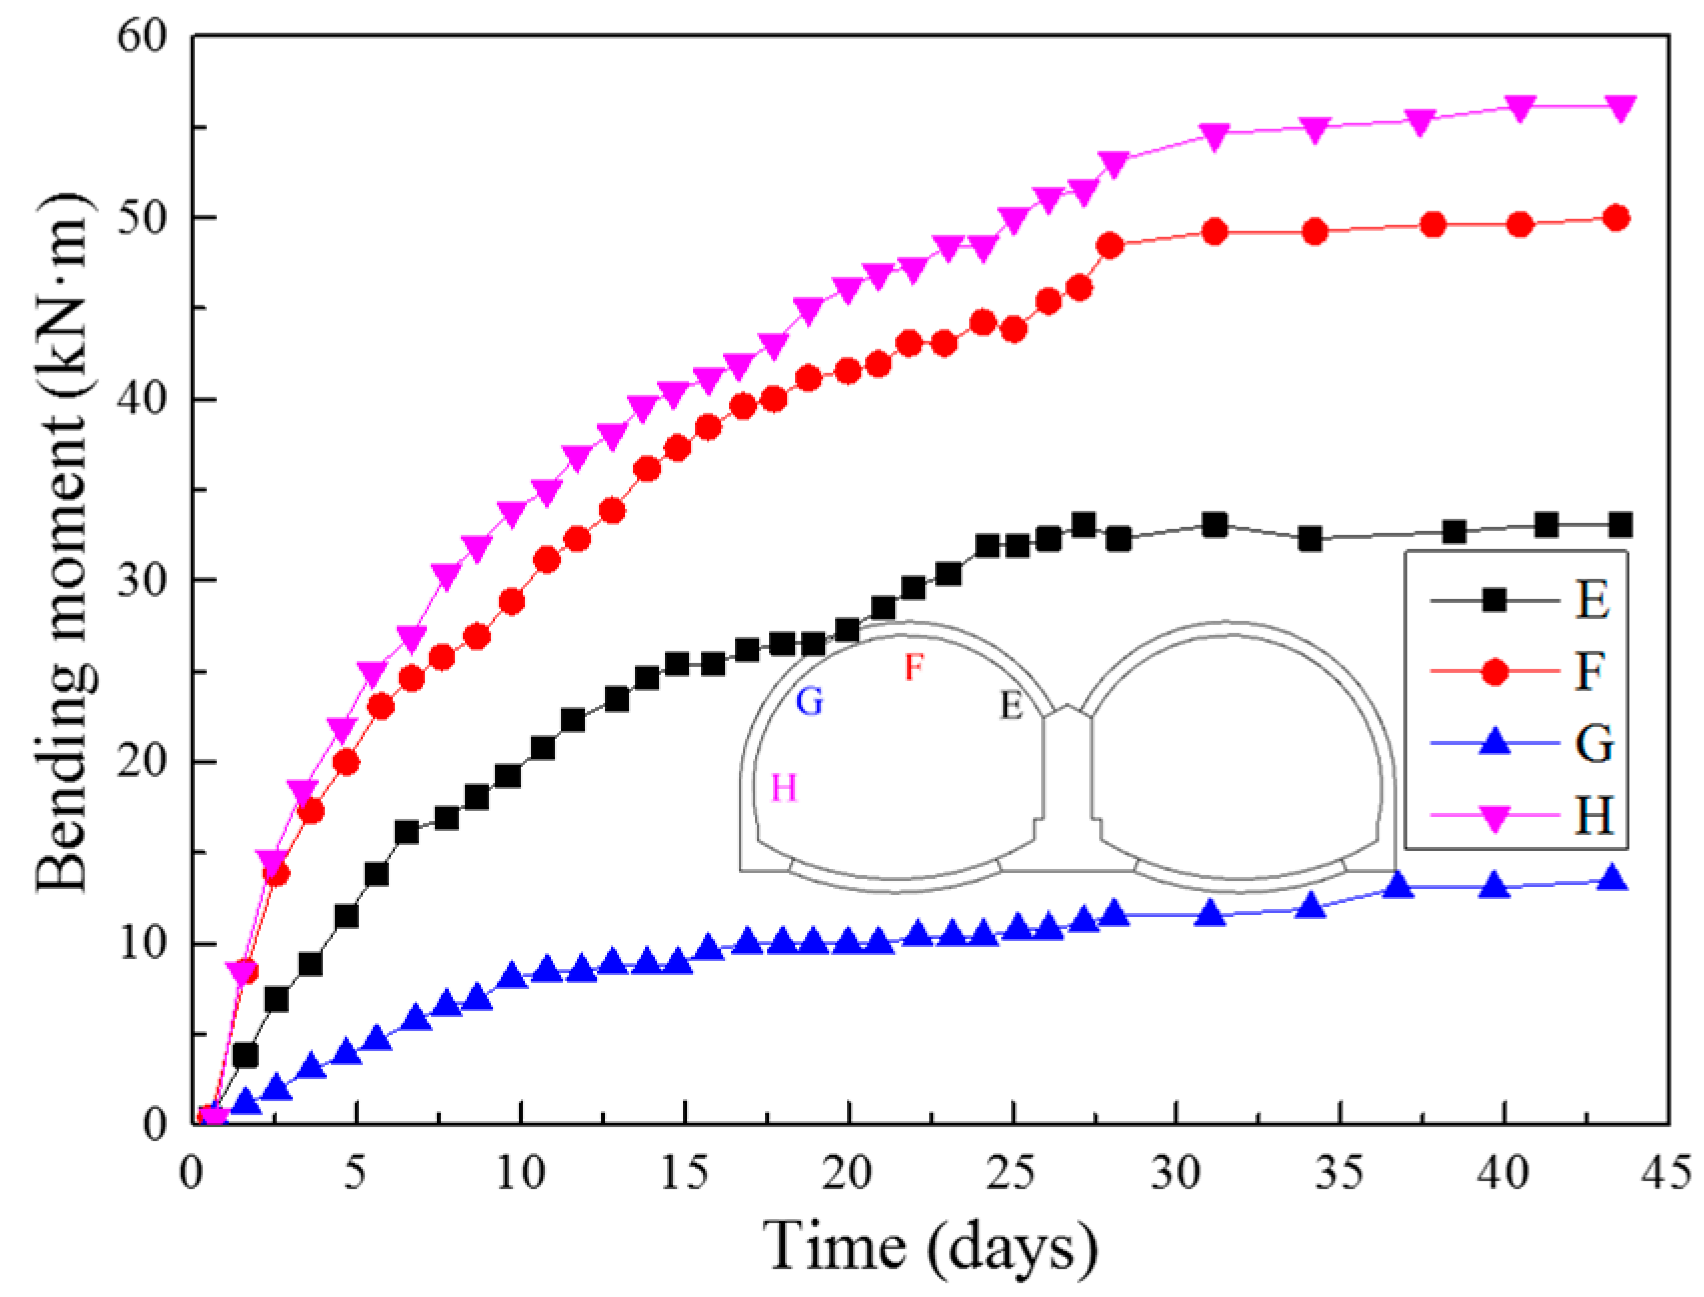
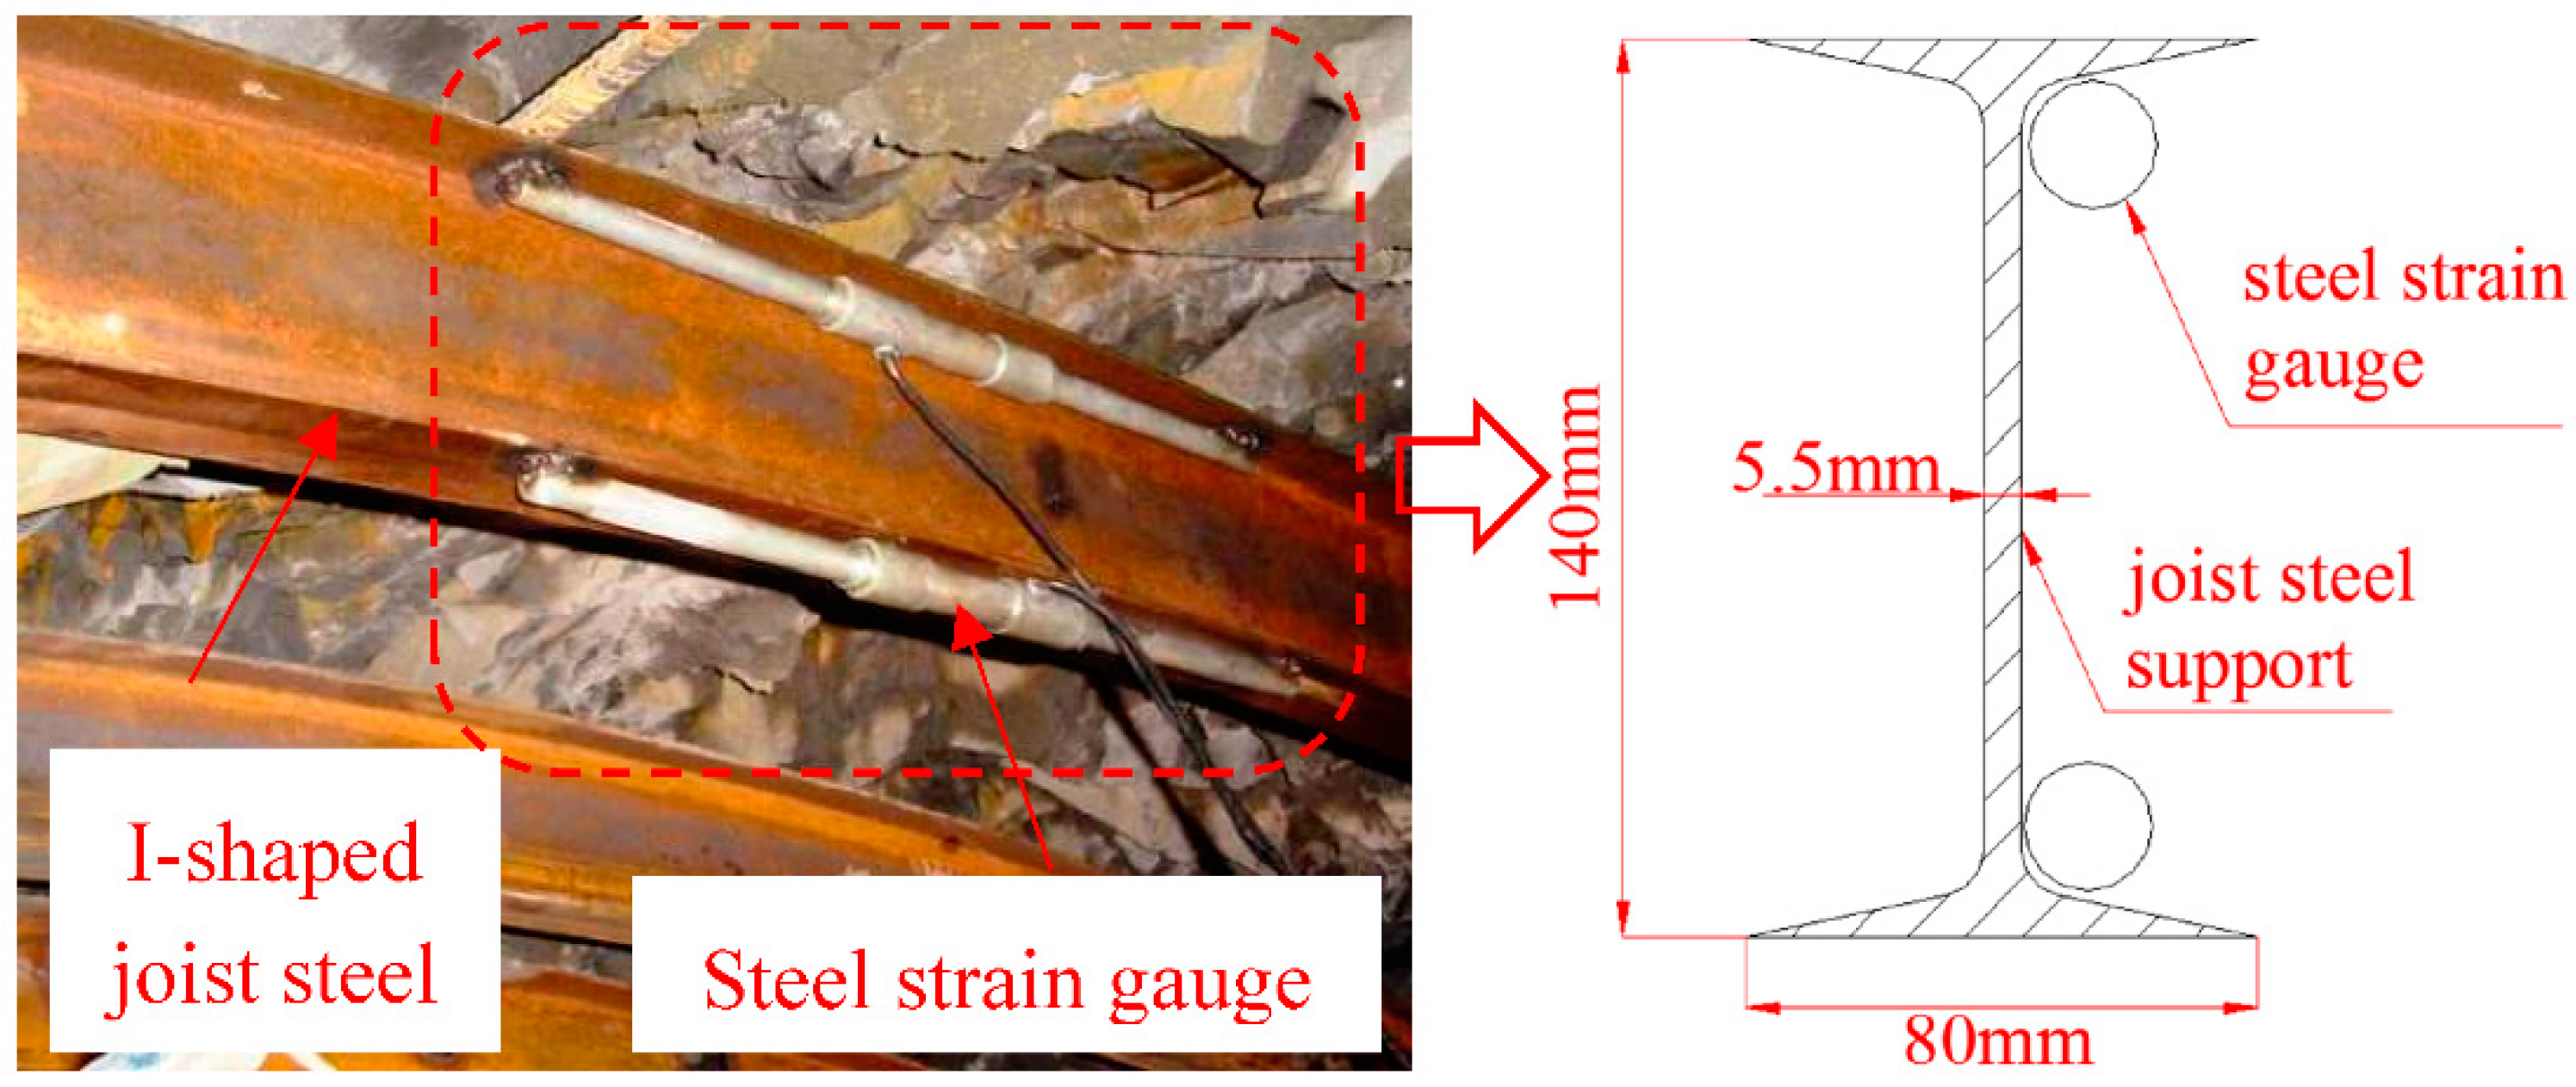
3.4. Internal Forces in Steel Arches

Figure 19 and Figure 20 present the dynamic evolution of the internal forces in steel arches (including the axial forces and the absolute values of the bending moments) at different locations in the K89+729 section during construction. As shown in the figures, after the completion of steel arches, the steel arches immediately began to bear loadings and the internal forces at each location in steel arches kept increasing rapidly. Till the completion of primary linings, the axial forces and the bending moments in steel arches took up almost 50% of the final values. After the construction of the primary linings, the axial forces and bending moments in steel arches continuously increased, however the growth rate significantly slowed down. Till the completion of the second linings, the increments of the internal forces in steel arches accounted for about 40% of the final stable values in this period. After that, the internal forces in steel arches increased slightly and then reached the steady state eventually.
Figure 21 demonstrates the final distribution of the internal forces in steel arches at two typical sections respectively corresponding to class IV and V surrounding rocks (layouts of the steel strain gauges are shown in Figure 6). The figure shows that the axial forces are compressive along the full length of the steel arches. The axial forces in steel arches at the tunnel vault are obviously smaller than that at the side wall, while the absolute values of the bending moments reach the maximum both at the vault and the side wall of the tunnel, which indicates that the steel arch vault is the most unfavorable position to bear loadings. In addition, the axial forces and bending moments in steel arches are relatively larger in the monitoring section with lower class of surrounding rocks.

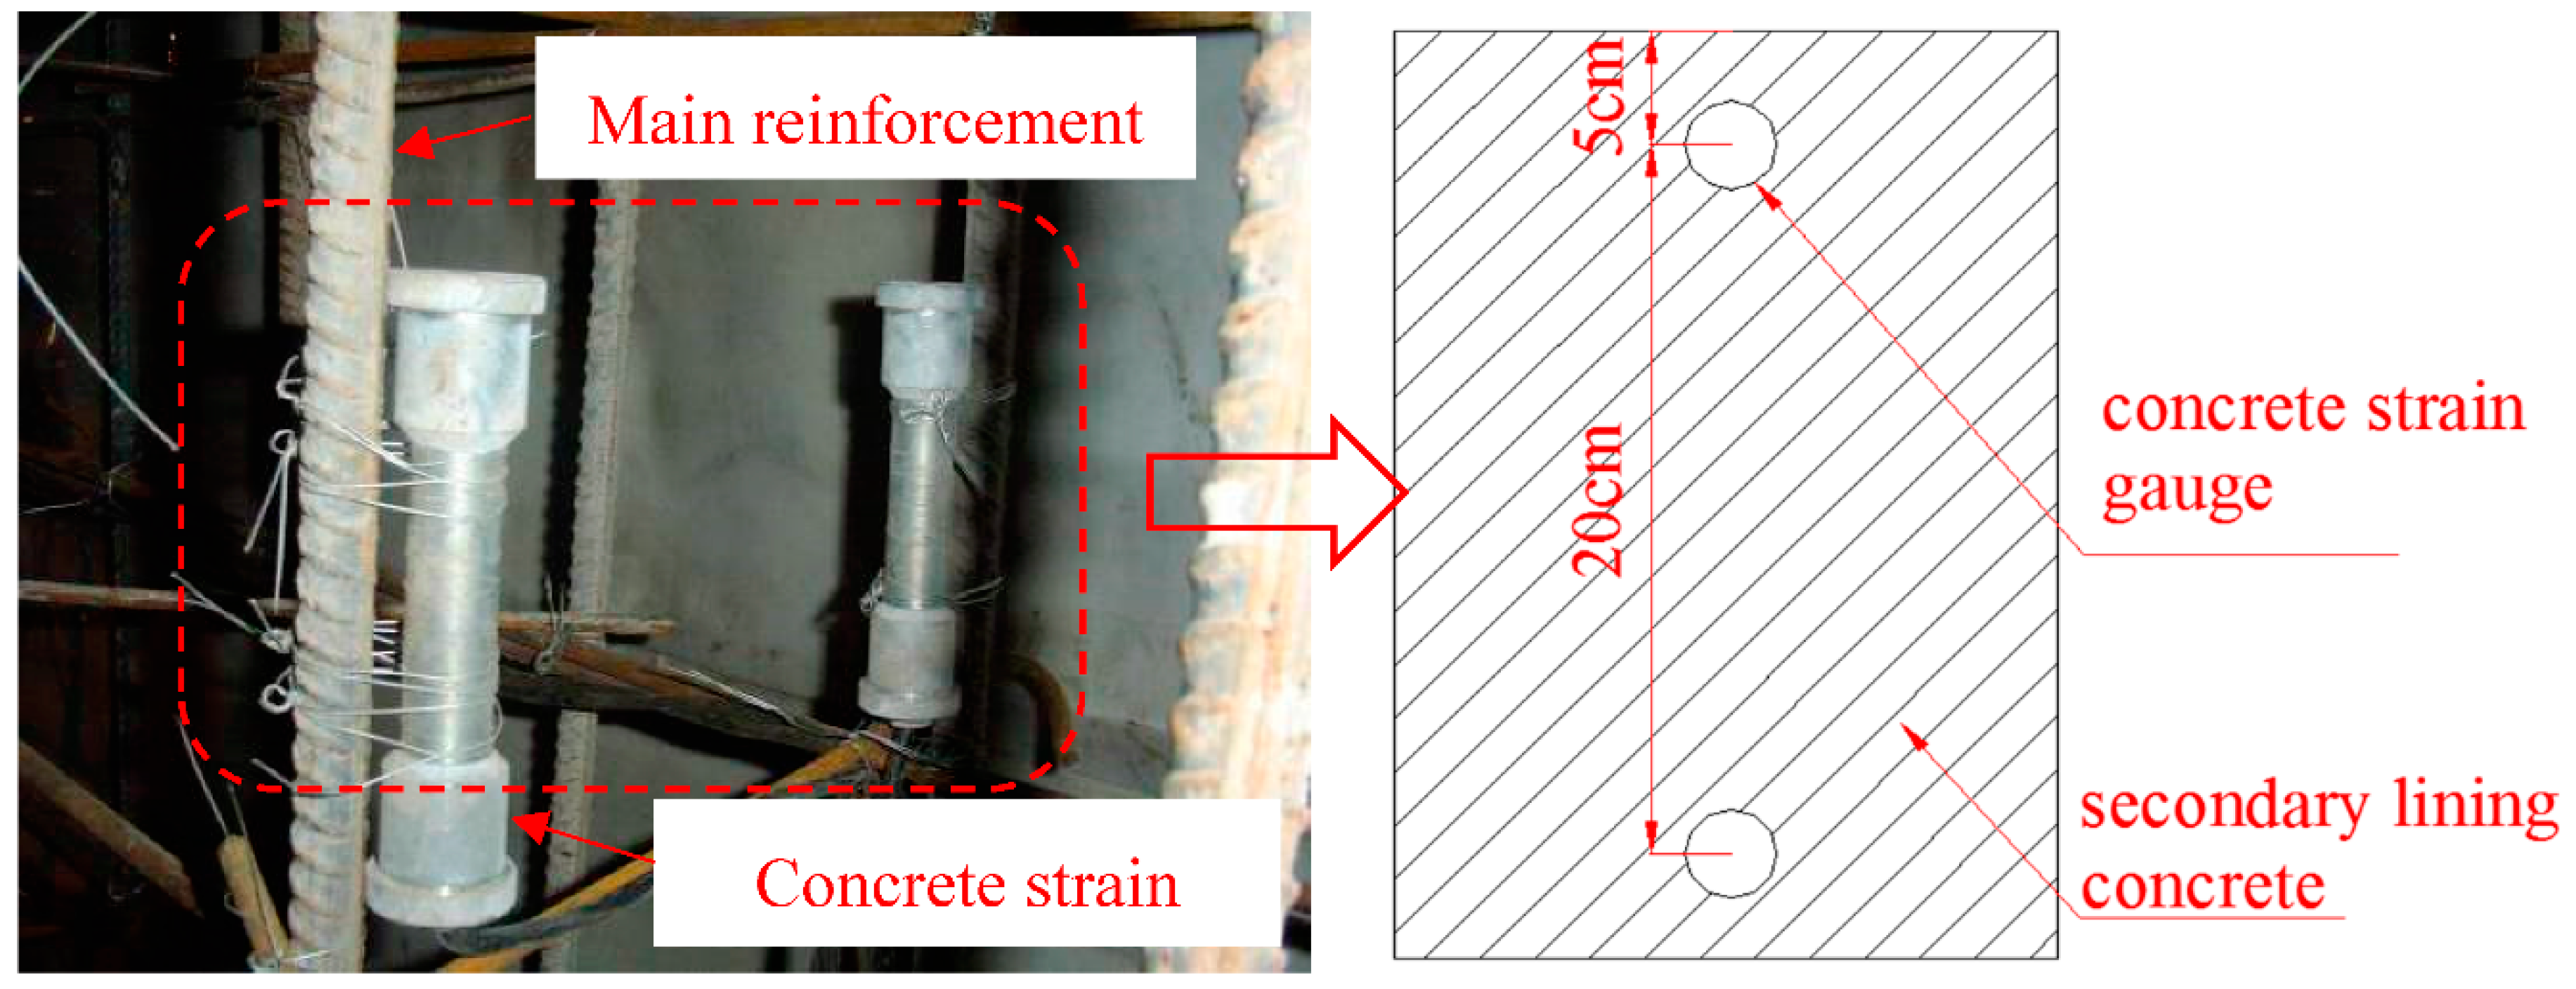
3.5. Internal Forces in Secondary Linings

Figure 22 and Figure 23 present the time history plots of the internal forces (including axial forces and absolute values of bending moments) in the secondary linings in the K89+729 section during 45 days after the construction of secondary linings. As shown in the figures, after the secondary linings were finished, they immediately began to bear internal forces. The internal forces increased greatly at the very beginning and then the growth rate gradually slowed down, the internal forces tended to stabilize 30 days after the construction of secondary linings. On condition of the surrounding rock pressures, the secondary linings began to contact with the primary linings little by little and then the contact pressures between the two gradually increased, resulting in rapid growth of the internal forces in secondary linings at the early stage, at this time both the primary and secondary linings bear surrounding rock pressures together. When the redistribution of the internal forces in both the primary and secondary linings became balanced, the internal forces in secondary linings tended to stabilize. This changing trend fully illustrates that the secondary linings not only serve as a structure for sufficient safety margin but also bears certain loads in the construction and long-term operation periods of the Gangkou tunnel.
Figure 24 shows the final distribution of the internal forces in secondary linings in the cross sections corresponding to different classes of rock masses (class III, IV and V respectively). It can be seen from Figure 24 that the absolute values of the bending moments in secondary linings at the vault and the side wall are relatively larger than that at the spandrel while the axial forces along the secondary linings are basically the same, which indicates that the vault of the secondary lining is the most disadvantaged loading position. As is shown, the internal forces in secondary linings are larger in the section with lower class of rock masses.

4. Conclusions

This paper comprehensively presented a case study of field monitoring of the deformations and forces of both surrounding rocks and linings during the construction of a representative double-arched tunnel-the Gangkou tunnel. In the typical cross sections corresponding to three different classes of surrounding rocks (class III, IV and V), the internal displacements of surrounding rocks, contact pressures between surrounding rocks and primary linings, axial forces in rock bolts and internal forces both in steel arches and secondary linings were measured scientifically. The dynamic evolution and the spatial distribution characteristics of these monitoring data were analyzed and discussed carefully. The monitoring and analysis results show that the deformations and forces of both surrounding rocks and lining structures are directly related to the construction procedures, geological conditions and measuring locations in the double-arched tunnel. And according to the results, some reasonable suggestions were provided for the improvement of the tunnel construction. From this study, the conclusions are drawn as follows:
(1)
The dynamic evolution of the internal displacements of surrounding rocks is closely related to the tunnel construction procedures. The internal displacements of surrounding rocks did not reach the stable state until the completion of the secondary linings. At different locations in the monitoring section, the internal displacements of surrounding rocks at the tunnel vault are greater than that at the tunnel spandrel, which are even greater than that at the side wall of the tunnel. The internal deformations of surrounding rocks are larger in the cross section with lower-level surrounding rock masses.
(2)
The contact pressure between surrounding rocks and primary linings converged rapidly and it generally reached its stable state within 5 days after the construction of primary linings. The monitoring results show that the existence of the middle wall is able to effectively transfer the surrounding rock pressures on the primary linings near the middle wall, resulting in the decreasing of the contact pressures at that side. The contact pressures between surrounding rocks and primary linings are greater in the cross section with lower-level surrounding rocks. In addition, based on Protodyakonov’s theory, a simplified method was proposed to estimate the surrounding rock pressures of the double-arched tunnel and the calculated values are in better agreement with the measured values.
(3)
Single rock bolt bears pure tensile stresses which are relatively larger in the middle of the rock bolt and lower at the two ends. At different positions in the same cross section, the axial forces in rock bolts at the tunnel vault are higher than that at the spandrel, which are even higher than that at the side wall of the tunnel. Through calculation, the tensile stress of a single bolt is far less than its ultimate tensile stress, which shows that the rock bolt does not play its role to the full potential and it is necessary to take appropriate measures to strengthen the anchoring forces.
(4)
The internal forces in steel arches increased greatly at the very beginning. As the excavation proceeded, the growth rate gradually slowed down and eventually the forces tended to stabilize after the construction of secondary linings. By analysis of the internal forces at different positions in steel arches, it is found that the steel arch vault is the most disadvantaged loading position.
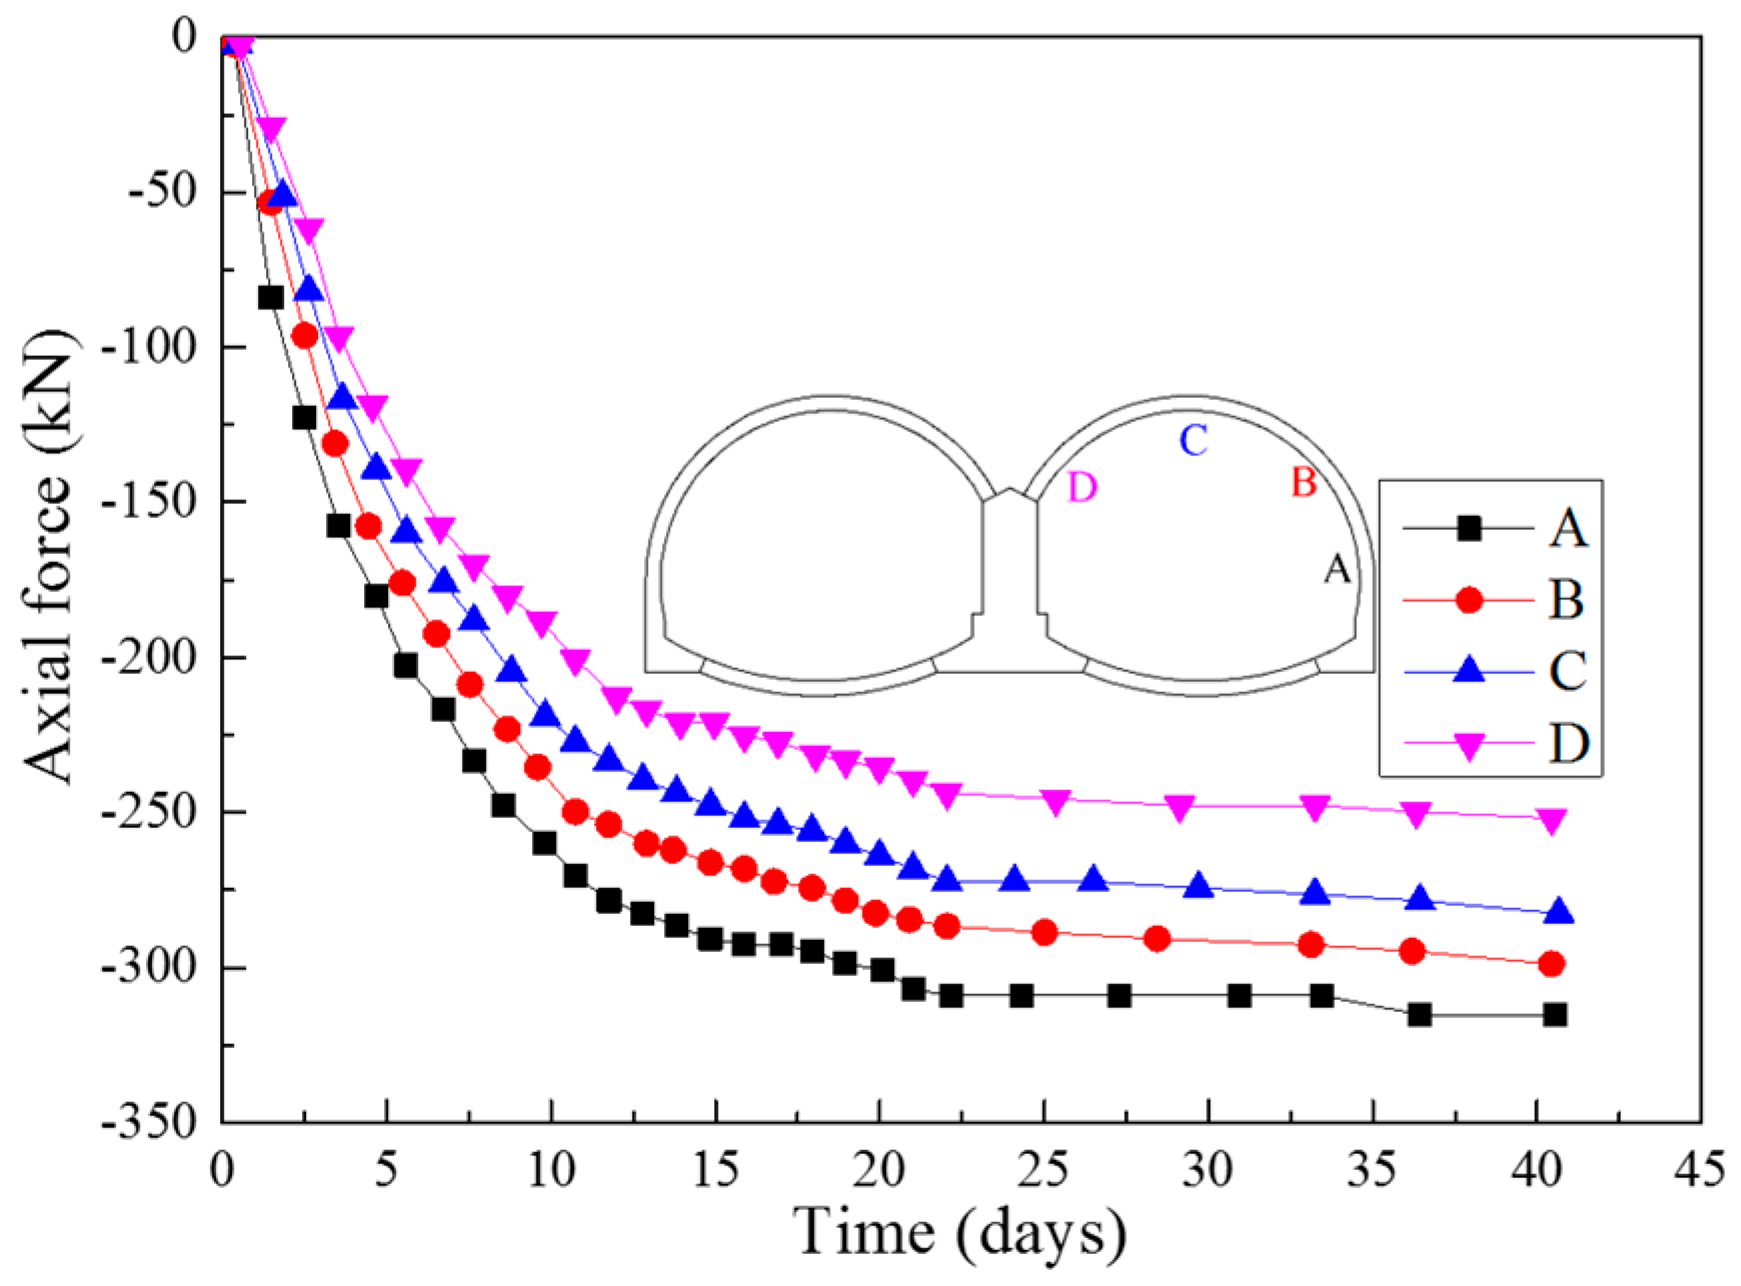
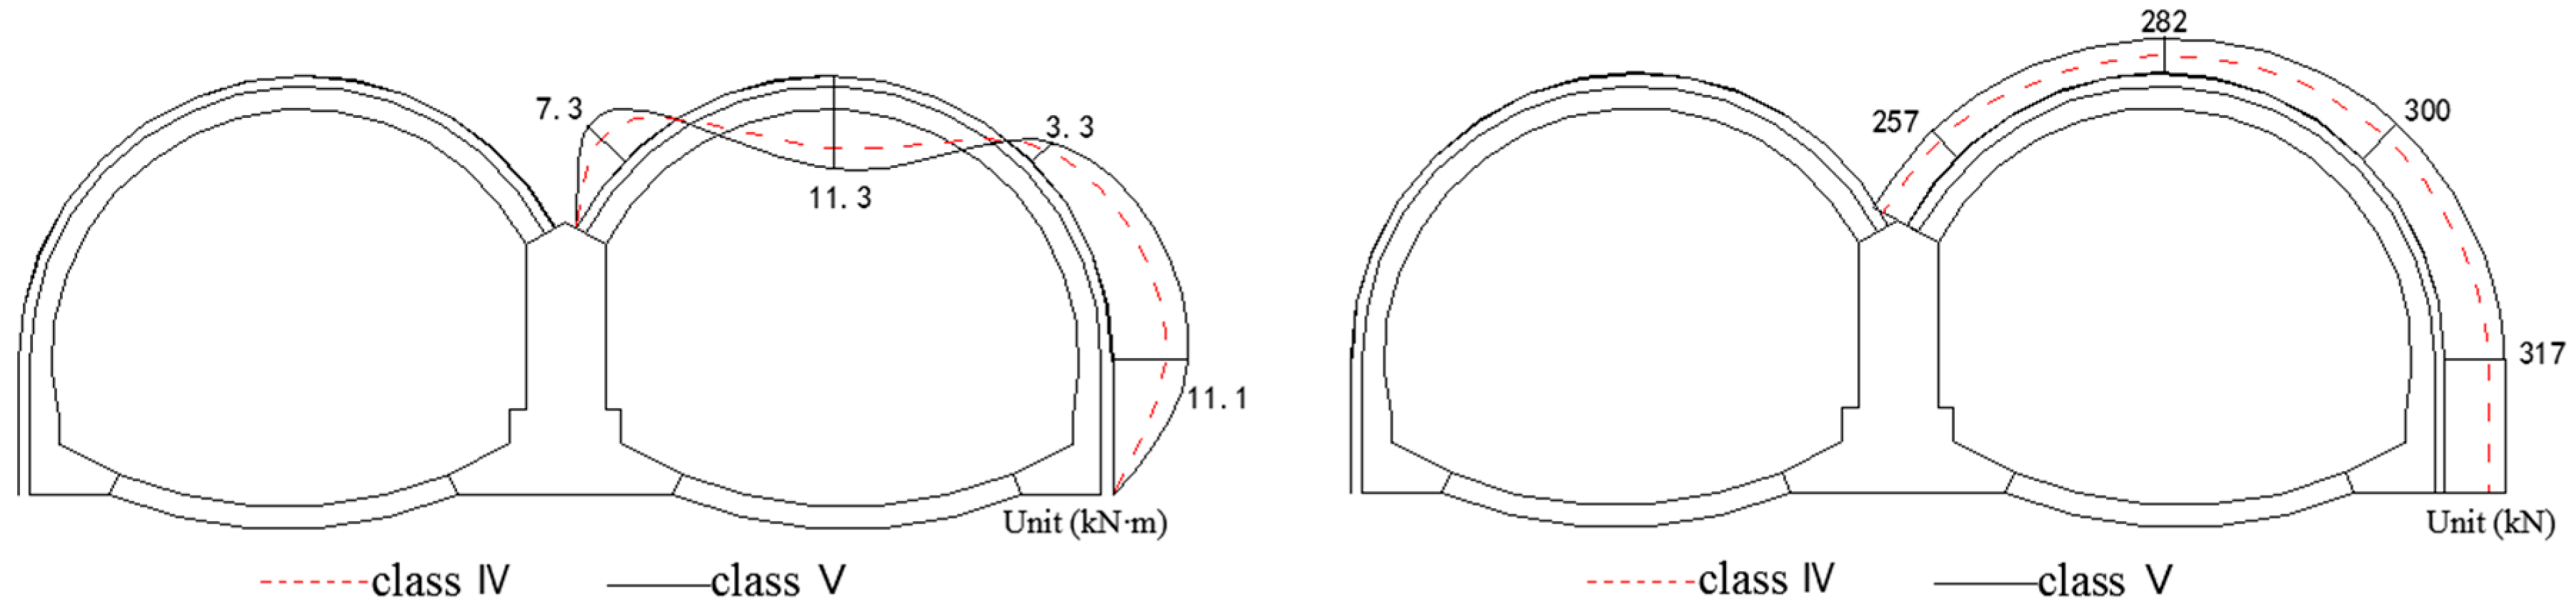
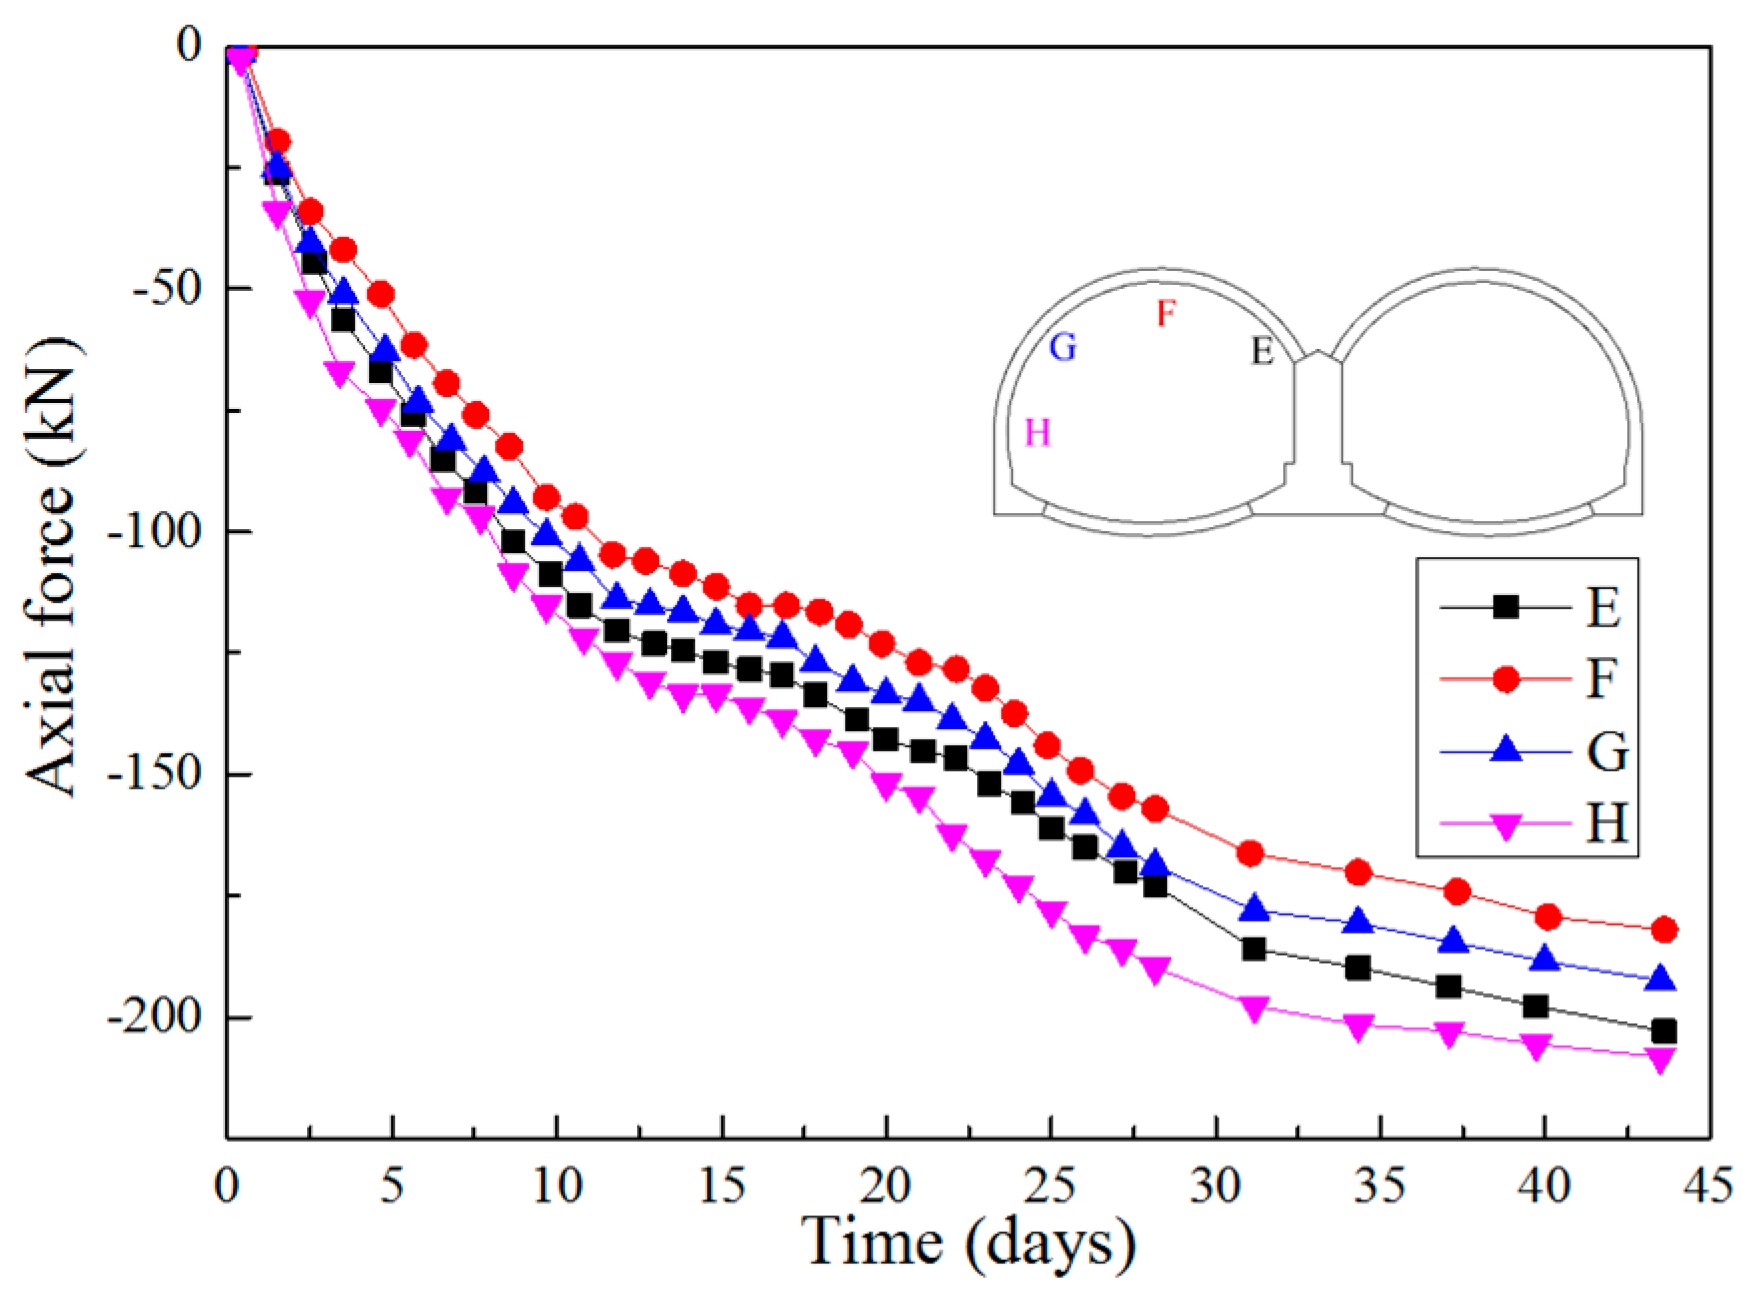
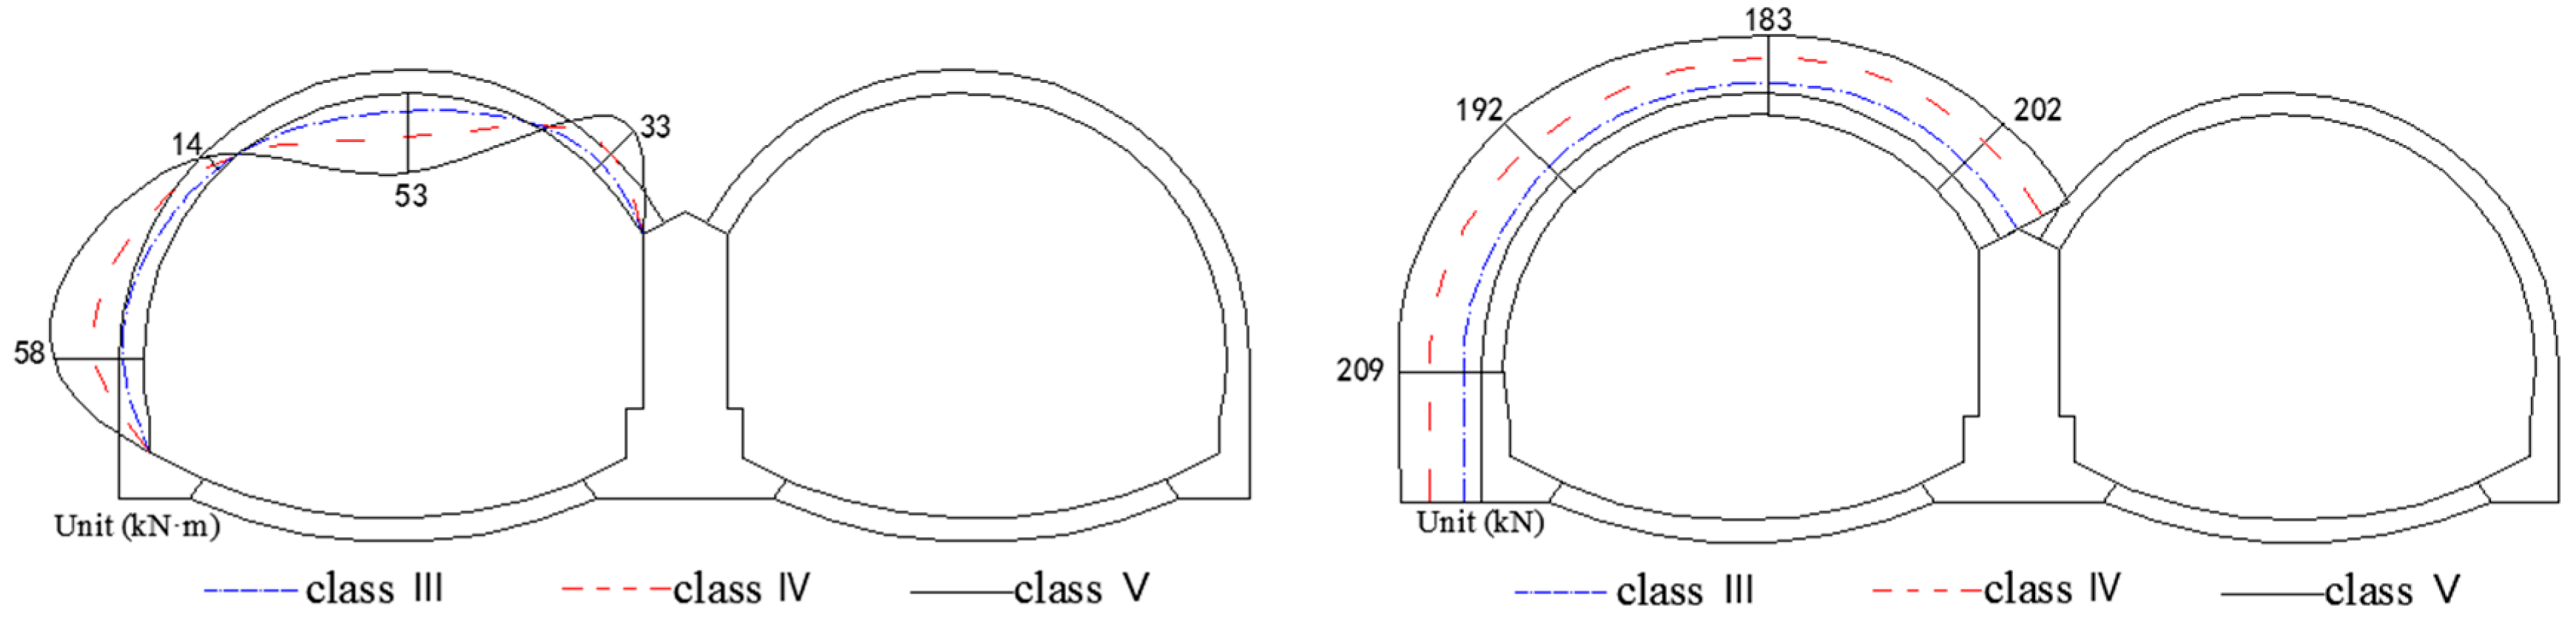
(5)
The secondary linings not only serve as a structure for sufficient safety margin but also bear certain loadings in the construction and long-term operation periods of the Gangkou tunnel. The lower the rock mass classification, the larger the internal forces in secondary linings. The internal forces in secondary linings are larger in the cross section with lower class of rock masses.

Acknowledgments

The authors gratefully acknowledge the financial supports provided by China Railways Corporation under grant No. 2014G004-H for this research. The support and assistance in field monitoring projects provided by the Construction Headquarters in the Jinhua-Wenzhou Highway are greatly acknowledged. The authors would like to thank Gangbing Song of University of Houston for introducing the special issue to us.

Author Contributions

Qixiang Yan and Bo Wang conceived and designed the field monitoring tests; Gang Lin performed the tests; Qixiang Yan and Chuan Zhang analyzed the monitoring data; Qixiang Yan and Chuan Zhang wrote the paper.

Conflicts of Interest

The authors declare no conflict of interest.

References

  1. Hwang, J.H.; Kikumoto, M.; Kishida, K.; Kimura, M. Dynamic stability of multi-arch culvert tunnel using 3-D FEM. Tunn. Undergr. Space Technol. 2005, 21, 384. [Google Scholar] [CrossRef]
  2. Wang, J.; Xia, C.; Zhu, H.; Li, Y.; Lin, Z.; Chen, X. Site monitoring and analysis of non-symmetrical muti-arch highway tunnel. Chin. J. Rock Mech. Eng. 2004, 23, 267–271. (In Chinese) [Google Scholar]
  3. Tao, L.; Shen, M.; Tao, L.; He, Z.; Yuan, Y. Model test and 3D numerical simulation study on excavation of double-arch tunnel. Chin. J. Rock Mech. Eng. 2006, 25, 1802–1808. (In Chinese) [Google Scholar]
  4. Lei, M.; Omer, J. Study on train vibration response and cumulative deformation of double arch tunnel in Kast foundation. Geotech. Geol. Eng. 2015, 33, 549–558. [Google Scholar] [CrossRef]
  5. Wang, S.; Li, C.; Wang, Y.; Zou, Z. Evolution characteristics analysis of pressure-arch in a double-arch tunnel. Tehnicki Vjesnik 2016, 23, 181–189. [Google Scholar]
  6. Huang, R.; Xiao, H. Deformation mechanism of a shallow double-arch tunnel in a sloping rock mass. Bull. Eng. Geol. Environ. 2010, 69, 89–97. [Google Scholar]
  7. Li, D.; Li, X.; Li, C.C.; Huang, B.; Gong, F.; Zhang, W. Case studies of groundwater flow into tunnels and an innovative water-gathering system for water drainage. Tunn. Undergr. Space Technol. 2009, 24, 260–268. [Google Scholar] [CrossRef]
  8. Rabcewicz, L. The New Austrian Tunneling Method. Water Power 1964, 16, 453–457. [Google Scholar]
  9. Hellmich, C.; Ulm, F.J.; Mang, H.A. Multisurface Chemoplasticity. II: Numerical Studies on NATM Tunneling. J. Eng. Mech. 1999, 125, 702–713. [Google Scholar] [CrossRef]
  10. Sauer, G.; Gold, H. NATM ground support concepts and their effects on contracting practices. In Proceedings of the 9th Rapid Excavation and Tunneling Conference (RETC), Los Angeles, CA, USA, 11–14 June 1989.
  11. Jenkins, J.D.; Sander, H.J. Principles of the NATM and Other Uses of the Geologic Monitoring Techniques. In High Level Radioactive Waste Management; American Society of Civil Engineers (ASCE): Las Vegas, NE, USA, 1991. [Google Scholar]
  12. Muller, L. Removing misconceptions on the New Austrian Tunneling Method. Tunn. Tunn. Int. 1978, 10, 29–32. [Google Scholar]
  13. Bieniawski, Z.T. 22-Classification of Rock Masses for Engineering: The RMR System and Future Trends. Rock Test. Site Charact. 1993, 3, 553–573. [Google Scholar]
  14. Barton, N.; Lien, R.; Lunde, J. Engineering classification of rock masses for the design of tunnel support. Rock Mech. Rock Eng. 1974, 6, 189–236. [Google Scholar] [CrossRef]
  15. Aydin, A.; Ozbek, A.; Acar, A. Geomechanical characterization, 3-D optical monitoring and numerical modeling in Kirkgecit-1 tunnel, Turkey. Eng. Geol. 2014, 181, 38–47. [Google Scholar] [CrossRef]
  16. Yoshimura, H.; Yuki, T.; Yamada, Y.; Kobubun, N. Analysis and monitoring of the Miyana railway tunnel constructed using the New Austrian tunneling method. Int. J. Rock Mech. Min. Sci. Geomech. Abstr. 1986, 23, 67–75. [Google Scholar] [CrossRef]
  17. Lefas, I.D.; Georgiannou, V.N.; Boronkay, K.A. Monitoring of tunnel behaviour through cataclastic rocks. Geotech. Eng. 2006, 159, 113–123. [Google Scholar]
  18. Ariznavarreta-Fernández, F.; González-Palacio, C.; Menéndez-Díaz, A.; Ordoñez, C. Measurement system with angular encoders for continuous monitoring of tunnel convergence. Tunn. Undergr. Space Technol. 2016, 56, 176–185. [Google Scholar] [CrossRef]
  19. Hellmich, C.; Ulm, F.J.; Mang, H. Modeling of Early-Age Creep of Shotcrete. I: Model and Model Parameters. J. Eng. Mech. 2000, 126, 284–291. [Google Scholar] [CrossRef]
  20. Hellmich, C.; Mang, H.A.; Ulm, F.J. Hybrid method for quantification of stress states in shotcrete tunnel shells: Combination of 3D in situ displacement measurements and thermochemoplastic material law. Comput. Struct. 2001, 79, 2103–2115. [Google Scholar] [CrossRef]
  21. Ullah, S.; Pichler, B.; Scheiner, S.; Hellmich, C. Shell-specific interpolation of measured 3D displacements, for micromechanics-based rapid safety assessment of shotcrete tunnels. Comput. Model. Eng. Sci. 2010, 57, 279–314. [Google Scholar]
  22. Ullah, S.; Pichler, B.; Hellmich, C. Modeling Ground-Shell Contact Forces in NATM Tunneling, Based on 3D Displacement Measurements. J. Geotech. Geoenviron. Eng. 2013, 139, 444–457. [Google Scholar] [CrossRef]
  23. Fuentes, R. Internal forces of underground structures from observed displacements. Tunn. Undergr. Space Technol. 2015, 49, 50–66. [Google Scholar] [CrossRef]
  24. Yuan, Y.; Wang, S.H.; Guo-Ping, D.U.; Dan, L.I. In-situ testing study on lining system of double-arched tunnel. Chin. J. Rock Mech. Eng. 2005, 24, 480–484. (In Chinese) [Google Scholar]
  25. Erbing, L.I.; Wang, D.; Wang, Y.; Tan, Y.; Zhang, L. Monitoring and control of construction deformation of urban shallow-buried large-span double-arch tunnel under complex condition. Chin. J. Rock Mech. Eng. 2007, 26, 833–839. (In Chinese) [Google Scholar]
  26. JTG D70-2004, Code for Design of Road Tunnel; China Communication Press: Beijing, China, 2004. (In Chinese)
Figure 1. Longitudinal and cross sections of the Gangkou double-arched tunnel.
Applsci 07 00169 g001
Figure 2. Schematic diagram of the three heading method in class IV and V rock masses.
Applsci 07 00169 g002
Figure 3. Schematic diagram of the central heading method in class III rock masses.
Applsci 07 00169 g003
Figure 4. Multi-point extensometer.
Applsci 07 00169 g004
Figure 5. Rock bolt force gauge.
Applsci 07 00169 g005
Figure 6. Layouts of the steel strain gauges.
Applsci 07 00169 g006
Figure 7. Layouts of the concrete strain gauges.
Applsci 07 00169 g007
Figure 8. Layout diagram of the measuring points in class IV and V surrounding rocks (K90+105, K89+729 respectively).
Applsci 07 00169 g008
Figure 9. Layout diagram of the measuring points in class III surrounding rocks (K89+949).
Applsci 07 00169 g009
Figure 10. Time history plots of the internal displacements in class V rock masses at position B in the K89+729 section.
Applsci 07 00169 g010
Figure 11. Time history plots of the internal displacements in class V rock masses at position C in the K89+729 section.
Applsci 07 00169 g011
Figure 12. Final distribution of the internal displacements in three different classes of rock masses (class III, IV and V) and the values in the figure represent the internal displacements in class V surrounding rocks.
Applsci 07 00169 g012
Figure 13. Time history plots of the contact pressures between surrounding rocks and primary linings in the K89+729 section.
Applsci 07 00169 g013
Figure 14. Final distribution of the contact pressures between surrounding rocks and primary linings in the cross sections in different classes of rock masses (class III, IV and V).
Applsci 07 00169 g014
Figure 15. Schematic diagram of the tunnel balance arch curves of the double-arched tunnel in two cases.
Applsci 07 00169 g015
Figure 16. Time history plots of the axial forces in rock bolts at location B in the K89+729 section.
Applsci 07 00169 g016
Figure 17. Time history plots of the axial forces in rock bolts at location C in the K89+729 section.
Applsci 07 00169 g017
Figure 18. Final distribution of the axial forces in rock bolts in different sections respectively corresponding to class III, IV and V surrounding rocks. The values in the figure are the axial forces in rock bolts in class V surrounding rocks.
Applsci 07 00169 g018
Figure 19. Time history plots of the bending moments in steel arches in the K89+729 section.
Applsci 07 00169 g019
Figure 20. Time history plots of the axial forces in steel arches in the K89+729 section.
Applsci 07 00169 g020
Figure 21. Final distribution of the bending moments and axial forces in steel arches in different classes of surrounding rocks.
Applsci 07 00169 g021
Figure 22. Time history plots of the absolute values of the bending moments in secondary linings in the K89+729 section.
Applsci 07 00169 g022
Figure 23. Time history plots of the axial forces in secondary linings in the K89+729 section.
Applsci 07 00169 g023
Figure 24. Final distribution of the internal forces in secondary linings in the cross sections corresponding to three different classes of rock masses (class III, IV and V respectively).
Applsci 07 00169 g024
Table 1. Physical and mechanical parameters of three different classes of rock masses (class III, class IV and class V respectively).
Rock Mass ClassificationCohesion (MPa)Internal Friction Angle (°)Elastic Modulus (GPa)Unit Weight (kN/m3)
III1.3–1.436°–38°7–1033.0–35.0
IV0.5–0.732°–34°4–631.5–33.0
V0.07–0.1027°–29°0.8–1.927.5–31.5
Table 2. Detailed parameters of primary and secondary supports in class IV surrounding rocks.
class IV surrounding rocksRock boltSteel archSprayed concreteSecondary lining
Diameter: 2.5 cm;
Length: 300 cm;
Longitudinal and circumferential spacing: 120, 50 cm
Material: HRB 335 round steel.
No. 14 hot rolled joist steel with a cross-sectional area of 21.5 cm2;
Longitudinal spacing: 200 cm.
Thickness of sprayed concrete: 20 cm.Thickness of formworking concrete: 40 cm;
Diameter of main reinforcement: 2.2 cm;
Spacing of main reinforcement: 20 cm.
Table 3. Detailed parameters of primary and secondary supports in class V surrounding rocks.
class V surrounding rocksRock boltSteel archSprayed concreteSecondary lining
Diameter: 2.5 cm;
Length: 350 cm;
Longitudinal and circumferential spacing: 120, 50 cm
Material: HRB 335 round steel.
No.14 hot rolled joist steel with a cross-sectional area of 21.5 cm2;
Longitudinal spacing: 150 cm.
Thickness of sprayed concrete: 25 cm.Thickness of formworking concrete: 50 cm;
Diameter of main reinforcement: 2.2 cm;
Spacing of main reinforcement: 20 cm.
Table 4. Monitoring parameters and methods.
No.ParametersSensors and Sensing DevicesRangeAccuracyFrequency
1internal displacements of surrounding rocksmulti-point extensometer, dial indicator100 mm0.1 mm2–4 times/day (displacement velocity > 10 mm/day);
once/day (5–10 mm/day);
once/2 days (1–5 mm/day);
once/week (<1 mm/day).
2contact pressures between surrounding rocks and primary liningsvibrating-wire pressure cell, cymometer0.6 MPa±1.5% F.S2–4 times/day (construction time 1–15 days);
once/day (16–30 days);
once/week (30–90 days);
once/month (>90 days).
3axial forces in rock boltsvibrating-wire bolt force gauge, cymometer2000 kN±1.0% F.S
4internal forces in steel archesvibrating-wire steel strain gauge, cymometer3000 με±1.0% F.S
5internal forces in secondary liningsembedded concrete strain gauge, cymometer3000 με±1.0% F.S

