Article

Wind Turbine Gearbox Fault Diagnosis Based on Improved EEMD and Hilbert Square Demodulation

Faculty of Mechanical Engineering & Automation, Zhejiang Sci-Tech University, Hangzhou 310018, China
*
Author to whom correspondence should be addressed.
Appl. Sci. 2017, 7(2), 128; https://doi.org/10.3390/app7020128
Submission received: 2 November 2016 / Revised: 31 December 2016 / Accepted: 6 January 2017 / Published: 26 January 2017

Abstract

:
The rapid expansion of wind farms has accelerated research into improving the reliability of wind turbines to reduce operational and maintenance costs. A critical component in wind turbine drive-trains is the gearbox, which is prone to different types of failures due to long-term operation under tough environments, variable speeds and alternating loads. To detect gearbox fault early, a method is proposed for an effective fault diagnosis by using improved ensemble empirical mode decomposition (EEMD) and Hilbert square demodulation (HSD). The method was verified numerically by implementing the scheme on the vibration signals measured from bearing and gear test rigs. In the implementation process, the following steps were identified as being important: (1) in order to increase the accuracy of EEMD, a criterion of selecting the proper resampling frequency for raw vibration signals was developed; (2) to select the fault related intrinsic mode function (IMF) that had the biggest kurtosis index value, the resampled signal was decomposed into a series of IMFs; (3) the selected IMF was demodulated by means of HSD, and fault feature information could finally be obtained. The experimental results demonstrate the merit of the proposed method in gearbox fault diagnosis.

1. Introduction

In order to harvest wind energy more efficiently, wind turbines are becoming larger and more complex. As a result, the fault rates of wind turbines are increasing, which impacts enormously on the cost of wind energy [1]. The gearbox is the major component of a wind turbine drive train and is costly and vulnerable to failure, inevitably causing the unit to stop working [2]. Accordingly, investigation into fault diagnosis for the wind turbine gearbox is becoming a popular field of research. Typically, gear tooth damages and bearing faults are the most frequent faults. Since vibration signals carry much information related to the system’s dynamical characteristics, vibration analysis is a common approach for wind turbine gearbox fault diagnosis, especially with respect to the rotation parts [3,4]. However, the wind turbine working environment is strict and poor, which makes the vibration signals non-linear and non-stationary. Although traditional time domain and frequency analysis techniques, such as energy analysis, kurtosis, crest factor and spectrum analysis, have been widely used in fault diagnosis, these methods have only been effective in a stationary signal process. When it comes to non-stationary signal analyzing, the diagnostic performance has usually been unsatisfactory.
For this reason, many time-frequency analysis techniques, such as wavelet packet transform (WPT) [5,6], empirical model decomposition (EMD) [7,8,9] and independent component analysis (ICA) [10], have been applied to deal with the non-linear and non-stationary characteristics exhibited in the vibration signals. Wang et al. integrated EEMD and ICA for gearbox bearing fault diagnosis [11]. Law et al. (2000) proposed a method based on wavelet packet decomposition and Hilbert–Huang transform (WPD-HHT) and successfully applied it to spindle bearings condition monitoring [12]. He et al. (2007) used ICA to detect signal transients caused by localized gear damage [13]. Amirat et al. (2013) developed an EEMD-based wind turbine bearing failure detecting method using the generator stator current homopolar component [14]. Although those techniques made some progress into fault diagnosis, they had their own disadvantages. WPT could not process signals self-adaptively and needed a massive amount of data to ensure accurate results. EMD, a self-adaptive signal processing method, could decompose the non-stationary signal into several intrinsic mode functions (IMFs), which were almost orthogonal. However, mode mixing was a huge shortcoming, which restricted the application of EMD in many engineering situations. ICA extracted the transient feature without the need for prior information; however, this algorithm required redundant information measured from multiple sensors. Advanced signal processing techniques needs to be developed for this challenging task.
EEMD, an improvement of EMD, was presented by Wu and Huang (2009) to overcome mode mixing [15]. Not only did EEMD have the virtue of self-adaptability, but it also eliminated mode mixing by adding noise to the original signal. It had an absolute advantage in dealing with non-stationary and nonlinear signals. However, the performance of EEMD was also affected by parameters, such as the amplitude of added noise and the number of ensemble trials. Several efforts have been made to explore choosing proper values of these parameters to evaluate the performance of EEMD. Zhang et al. (2010) investigated the effect of the above-mentioned parameters pertinent to EEMD and improved it by replacing white noise with a finite bandwidth noise [16]. Both Stevenson et al. (2005) and Ring investigated the effect of sampling frequency on EMD and proposed a sampling limit [17,18]. However, the factor of added noise made the effect of sampling frequency on EEMD different from EMD. In this paper, the effect of sampling frequency on EEMD is quantitatively analyzed, and a criterion is proposed on how to select a resampling frequency according to the analysis result. By selecting a proper resampling frequency, the accuracy of EEMD has been further increased. The vibration data were decomposed into several IMFs by means of improved EEMD. Then, the fault-related signal was extracted by selecting the IMF with the largest kurtosis [11,19]. After fault-related signal extraction, fault information should normally be identified to provide guidance for maintenance. However, in the diagnosis of a gearbox, the amplitude modulation occurs in a measured signal, which means the fault information cannot be obtained by spectrum analysis directly. The phenomenon of amplitude modulation occurs because a high-frequency carrier signal is varied by a low-frequency modulating signal. The modulating signal results from the impacts caused by defects of a bearing or gear impulses appearing every time the tooth or rolling element crosses the defected area, which leads to amplitude modulation [20,21]. To deal with this phenomenon, Hilbert square demodulation (HSD) techniques are introduced. HSD can derive the low-frequency modulating signal from the modulated signal. Lastly, spectrum analysis is applied on the demodulated signal, and fault-related information is obtained.
In this paper, a novel hybrid method based on EEMD and HSD is presented for wind turbine gearbox fault diagnosis. The paper is organized as follows. The review of EEMD and Hilbert square demodulation is presented in Section 2. The proposed method for gearbox fault diagnosis is discussed in Section 3. The experimental and practical validations are presented in Section 4. A discussion and a conclusion are given in Section 5.

2. Review of Ensemble Empirical Mode Decomposition and Hilbert Square Demodulation

2.1. Ensemble Empirical Mode Decomposition

EEMD is an adaptive data-driven signal processing method, which substantially improves on EMD in overcoming the problem of mode mixing. The procedures of EEMD are as follows:
  • Given that x ( t ) is an original signal, add random white noise signal r a n d n j ( t ) to x ( t ) :
    x j ( t ) = x ( t ) + r a n d n j ( t ) j = 1 , 2 , , M
    where x j ( t ) is the noise-added signal and M is the number of trials.
  • Decompose x j ( t ) into a series of IMFs c i j ( t ) utilizing EMD as follows:
    x j ( t ) = i = 1 N c i j ( t ) + r N j ( t )
    where c i j ( t ) stands for the IMF obtained each trial, r N j ( t ) denotes the residue of the j-th trial and Nj is the IMFs number of the j-th trial.
  • If j < M, repeat Steps 1 and 2, and add different random white noise signals each time.
  • Since the noise series in each decomposition step is statistically different and low correlation exists among the various series, the noise will be canceled out in the ensemble means, provided that the sufficient number of steps has been taken. The ensemble means of the corresponding IMFs can be obtained as the final IMFs:
    c i ( t ) = ( j = 1 M c i j ( t ) ) / M
    where i = 1, 2, 3, ..., I and I = min ( N 1 , N 2 , , N M ) .
  • c i ( t ) is the ensemble mean of corresponding IMF of the decomposition.

2.2. Hilbert Square Demodulation

Once a localized defect emerges in a bearing or gear, impulses occur every time the tooth or rolling element crosses the defective area; thus, the amplitude modulation occurs in measured signals. HSD, a type of non-stationary signal processing technique based on Hilbert transform (HT), has been investigated for feature extraction of the amplitude modulation signal [22]. The following is the basic principle of HSD.
The reason for the phenomenon of amplitude modulation is that a high-frequency carrier signal is varied by a low-frequency modulating signal. Thus, the modulated signal could be the product of the modulating signal with the carrier signal. The modulating signal results from the impacts caused by defects of a bearing or gear, whereas the carrier signal is a combination of the resonance frequencies of the bearing. Therefore, the mathematical model of modulated signal can be described as:
x ( t ) = s ( t ) f ( t )
where f ( t ) is the high-frequency carrier signal and s ( t ) is the low-frequency modulating signal.
Given:
Z ( t ) = x 2 ( t ) + H 2 [ x ( t ) ]
where H [ x ( t ) ] is the Hilbert transform of x ( t ) .
According to the Bedrosian product theorem [23], H [ x ( t ) ] can be written:
H [ x ( t ) ] = H [ s ( t ) f ( t ) ] = s ( t ) H [ f ( t ) ]
Thus, Z ( t ) can be expressed as:
Z ( t ) = s 2 ( t ) { f 2 ( t ) + H 2 [ f ( t ) ] }
Generally, the high-frequency carrier signal f ( t ) is a harmonic signal:
f ( t ) = a 1 cos ( ω 1 t )
so the Hilbert transform of f ( t ) can be written as follows:
H [ f ( t ) ] = a 1 sin ( ω 1 t )
The second term of Equation (7) on the right-hand side can be transformed as follows:
f 2 ( t ) + H 2 [ f ( t ) ] = a 1 2 cos 2 ( ω 1 t ) + a 1 2 sin 2 ( ω 1 t ) = a 1 2
so Z ( t ) finally becomes:
Z ( t ) = a 1 2 s 2 ( t )
It is clear that only the low-frequency modulating signal is left in Equation (11), so we can get the fault characteristic frequency by means of spectrum analysis.

3. The Proposed Method

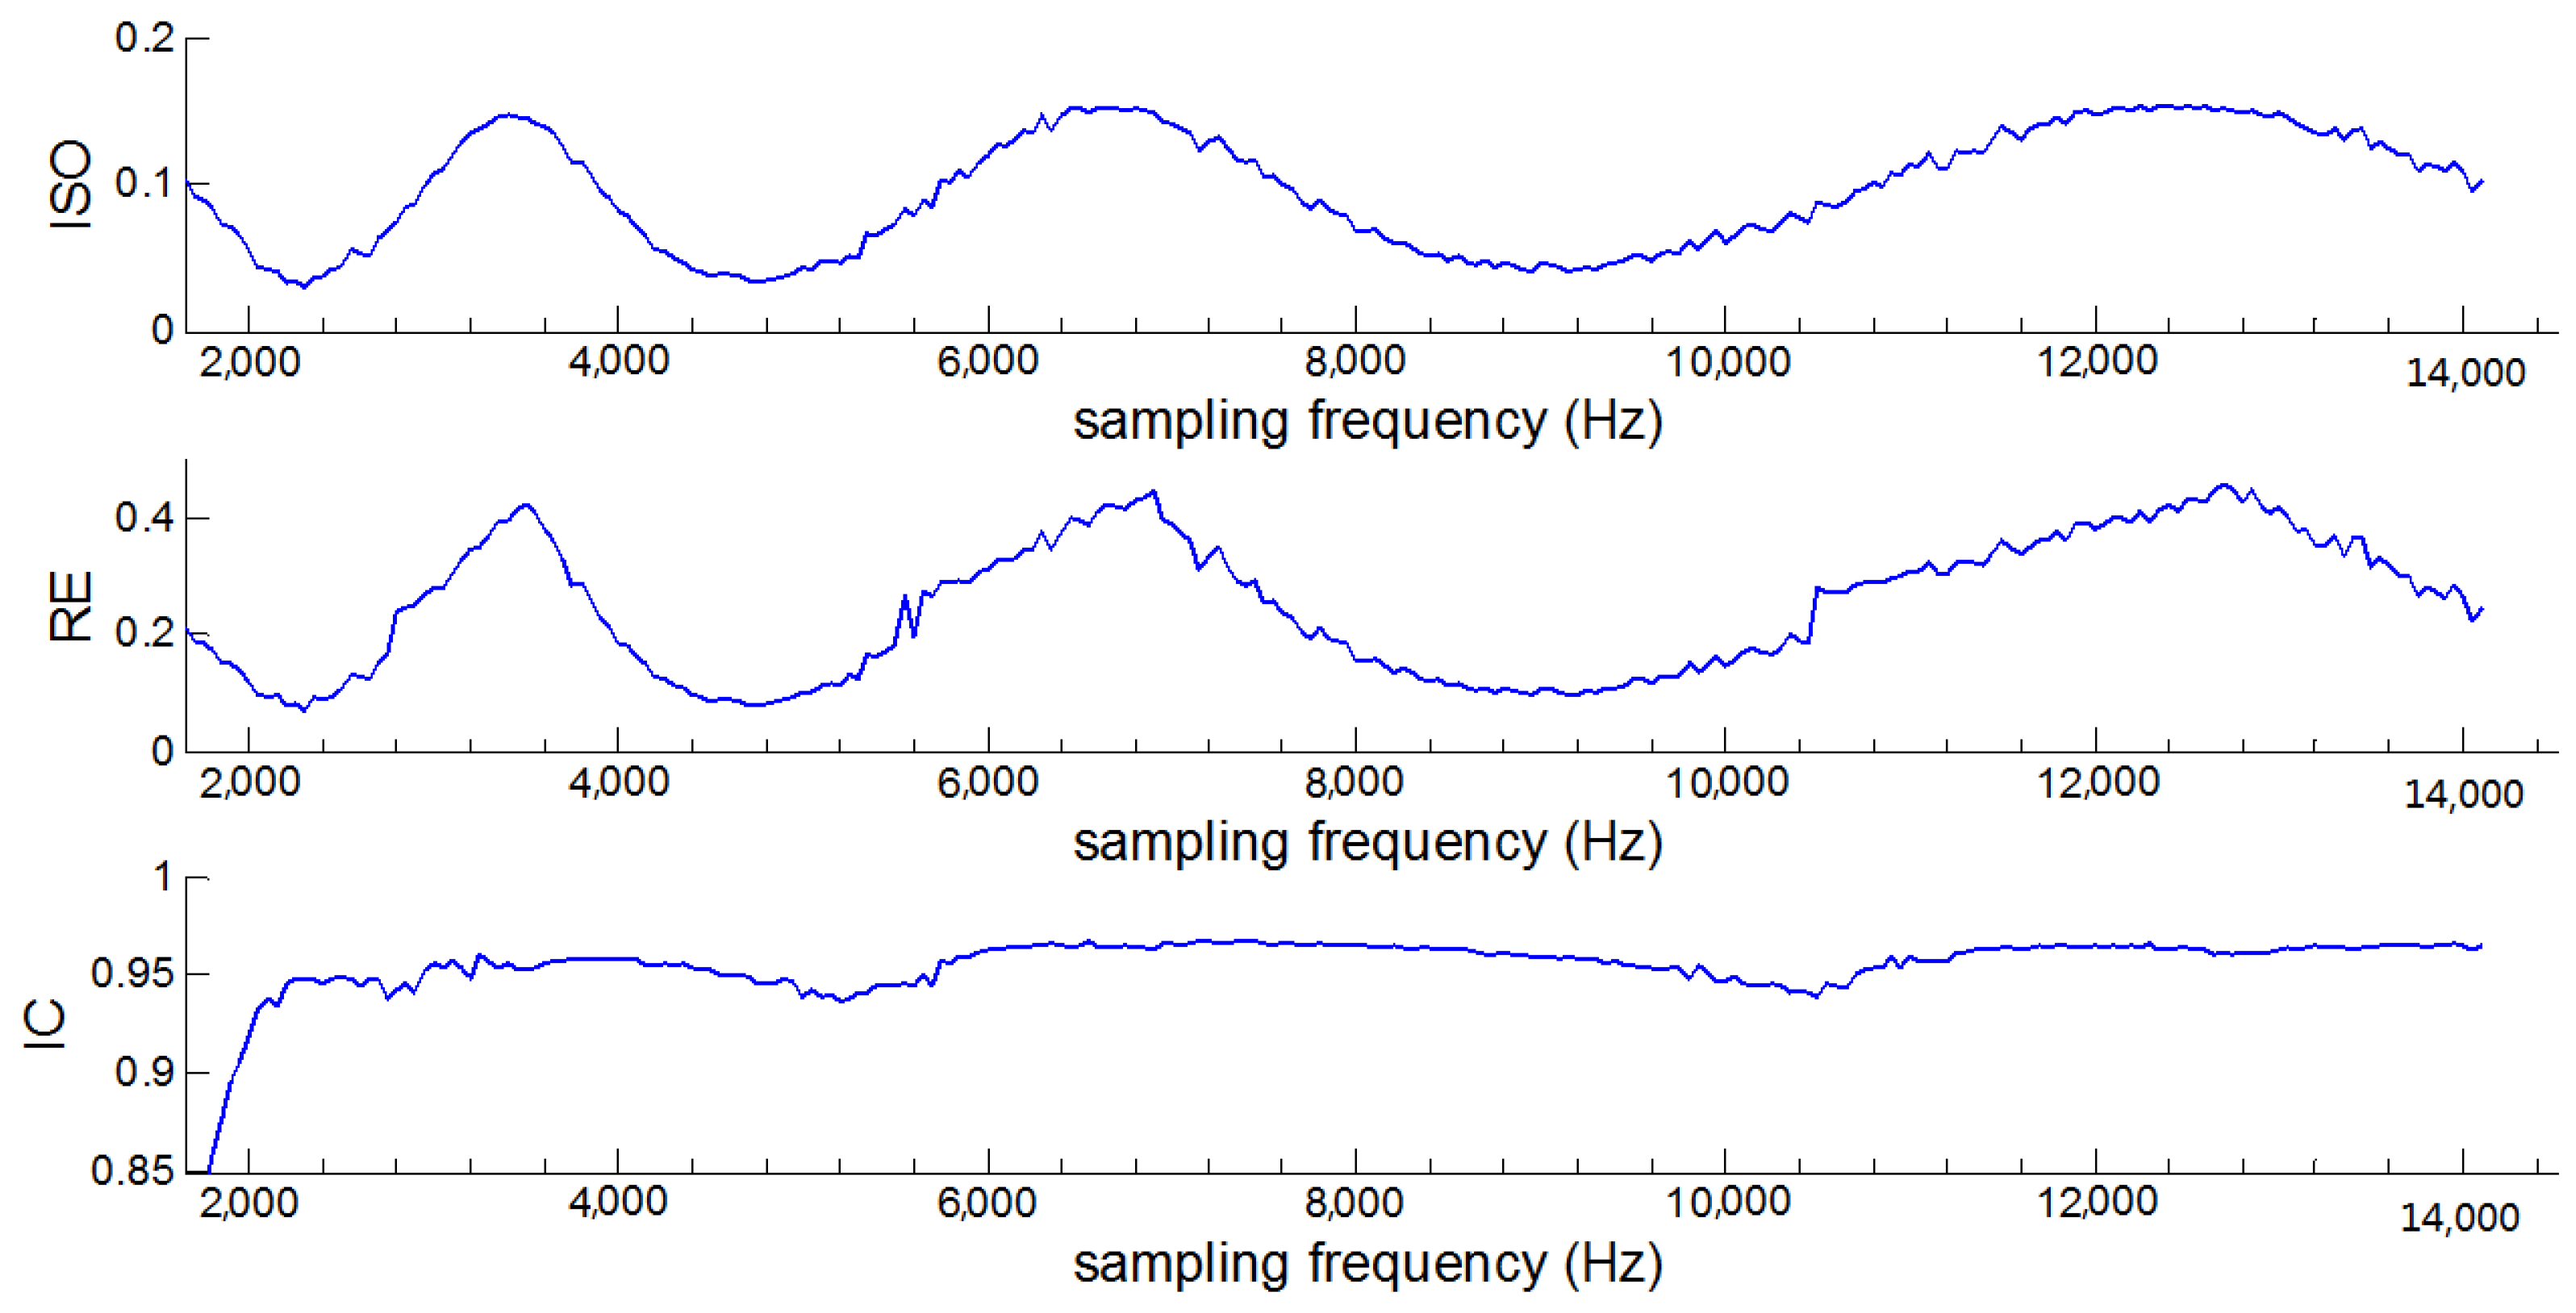
3.1. Criterion of Resampling Frequency Selection

To examine the effect of sampling frequency, a simulated signal with transient impulse was constructed as shown in Equation (12). The reason for using this kind of simulated signal was that impulses would appear in the acceleration signals when gear tooth damage or a bearing fault occurred in the gearbox of a wind turbine. The simulated signal, its spectrum and components, are shown in Figure 1.
x 1 ( t ) = e 400 t 1 sin ( 2 π 800 t ) ,   t 1 = mod ( t , 1 / 33 ) x 2 ( t ) = sin ( 2 π 180 t ) x 3 ( t ) = sin ( 2 π 50 t ) x 4 ( t ) = 0.16 r a n d o m ( n , 1 ) , n = l e n g t h ( t ) x ( t ) = x 1 ( t ) + x 2 ( t ) + x 3 ( t ) + x 4 ( t )
To facilitate quantitative evaluation, three quantities were utilized to analyze the performance of the EEMD. These were the successive IMF orthogonality (SIO), the IMF coherence (IC) and the residual energy (RE). The last two measures were only utilized when the number of components in the decomposition was known. The SIO was a measure equivalent to that stated in [17], but was only implemented on consecutive IMFs. This measure was defined as:
SIO = i = 1 I 1 1 N IMF i ( n ) IMF i + 1 ( n )
where I was the number of IMFs, N the length of signal and n the discrete time.
The IC was the measure of correlation between the valid or expected number of components (ENC) of the decomposition. This measured the ability of the EMD to decompose the signal into physically meaningful components and was defined as:
IC = 1 ENC i ENC c o r ( IMF i ( n ) , s i ( n ) )
where s i ( n ) was the source component of the raw signal corresponding to IMF i ( n ) .
The RE was the energy in the IMFs that were outside the expected number of components. This was another measure of the interpretability of EEMD and was defined as:
RE = 1 N ( s ( n ) 2 i ENC n = 1 N IMF i ( n ) 2 )
where s ( n ) was the signal under analysis.
According to the Nyquist criteria, the sampling frequency must be more than twice the maximum frequency component of the signal; therefore, the sampling frequency of the simulated signal varied from 1650 Hz to 14,100 Hz by steps of 50 Hz. As shown in Figure 2, these performance measure results present a periodic variation trend with the increase of sampling frequency. As the value of sampling frequency was about 2400 Hz, 4800 Hz and 9200 Hz, which corresponded to 3-times, 6-times and 12-times the maximum frequency of the simulated signal respectively, SIO and RE became the local minimum value, while IC became the local maximum value. When SIO and RE take the minimum value, decomposition results had a good orthogonality and maintained the integrity of the information of the raw signal. When IC take the maximum value, the decomposition result was physically meaningful, which meant the EEMD decomposition results were relatively satisfactory. From the view of the information integrity, accuracy and efficiency of the decomposition results, the resampling frequency should be selected as about 12-times in the maximum frequency of a vibration signal.
The decomposition results of the simulated signal with different sampling frequencies of 9450 Hz and 12,100 Hz are illustrated in Figure 3.
As shown in Figure 3a, IMF2, IMF4 and IMF5 corresponded to x 1 ( t ) , x 2 ( t ) and x 3 ( t ) , respectively. However, there were great deviations between IMF4 and x 2 ( t ) in Figure 3b. By comparing the two decomposition results, we saw that a higher sampling frequency did not necessarily provide a better decomposition result, affirming the value of the criterion of resampling frequency selection.

3.2. Improved EEMD

As mentioned above, the decomposition result of EEMD was directly affected by the sampling frequency. Too high of a sampling frequency did little to help increase the accuracy. On the contrary, it decreased the computational efficiency. Therefore, a proper resampling frequency should be selected according to the frequency characteristic of the vibration signal. In this paper, we show how EEMD was improved by replacing the raw vibration signal with a resample signal. The procedures of the improved EEMD are as follows:
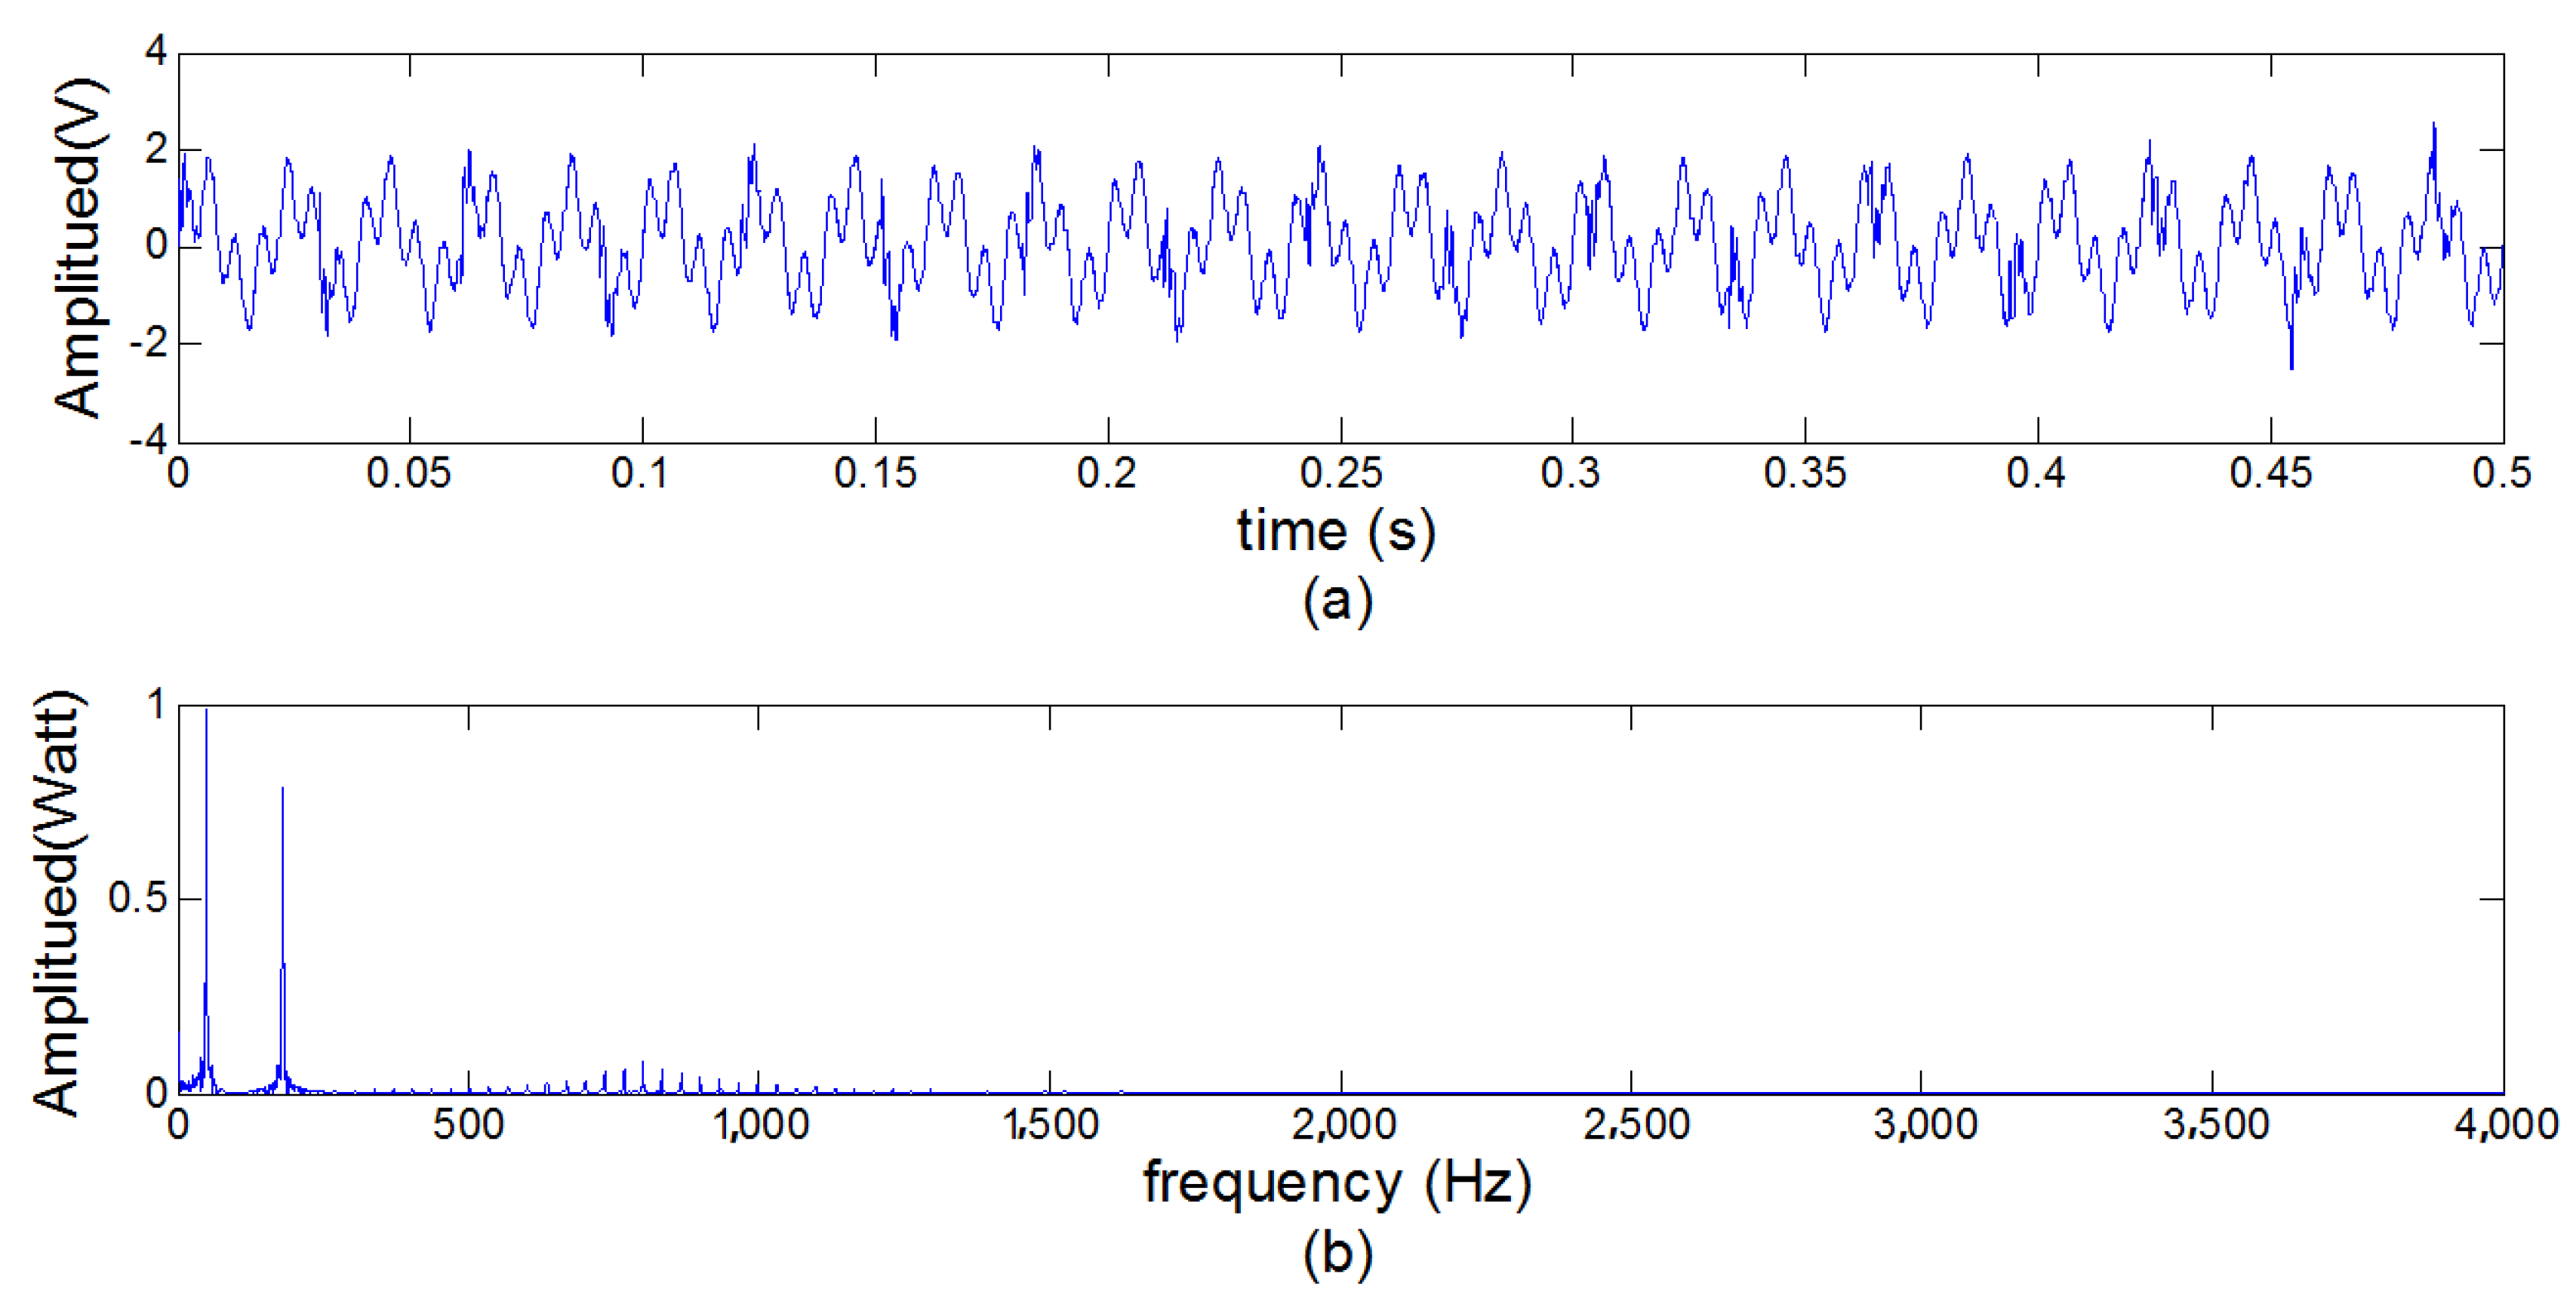
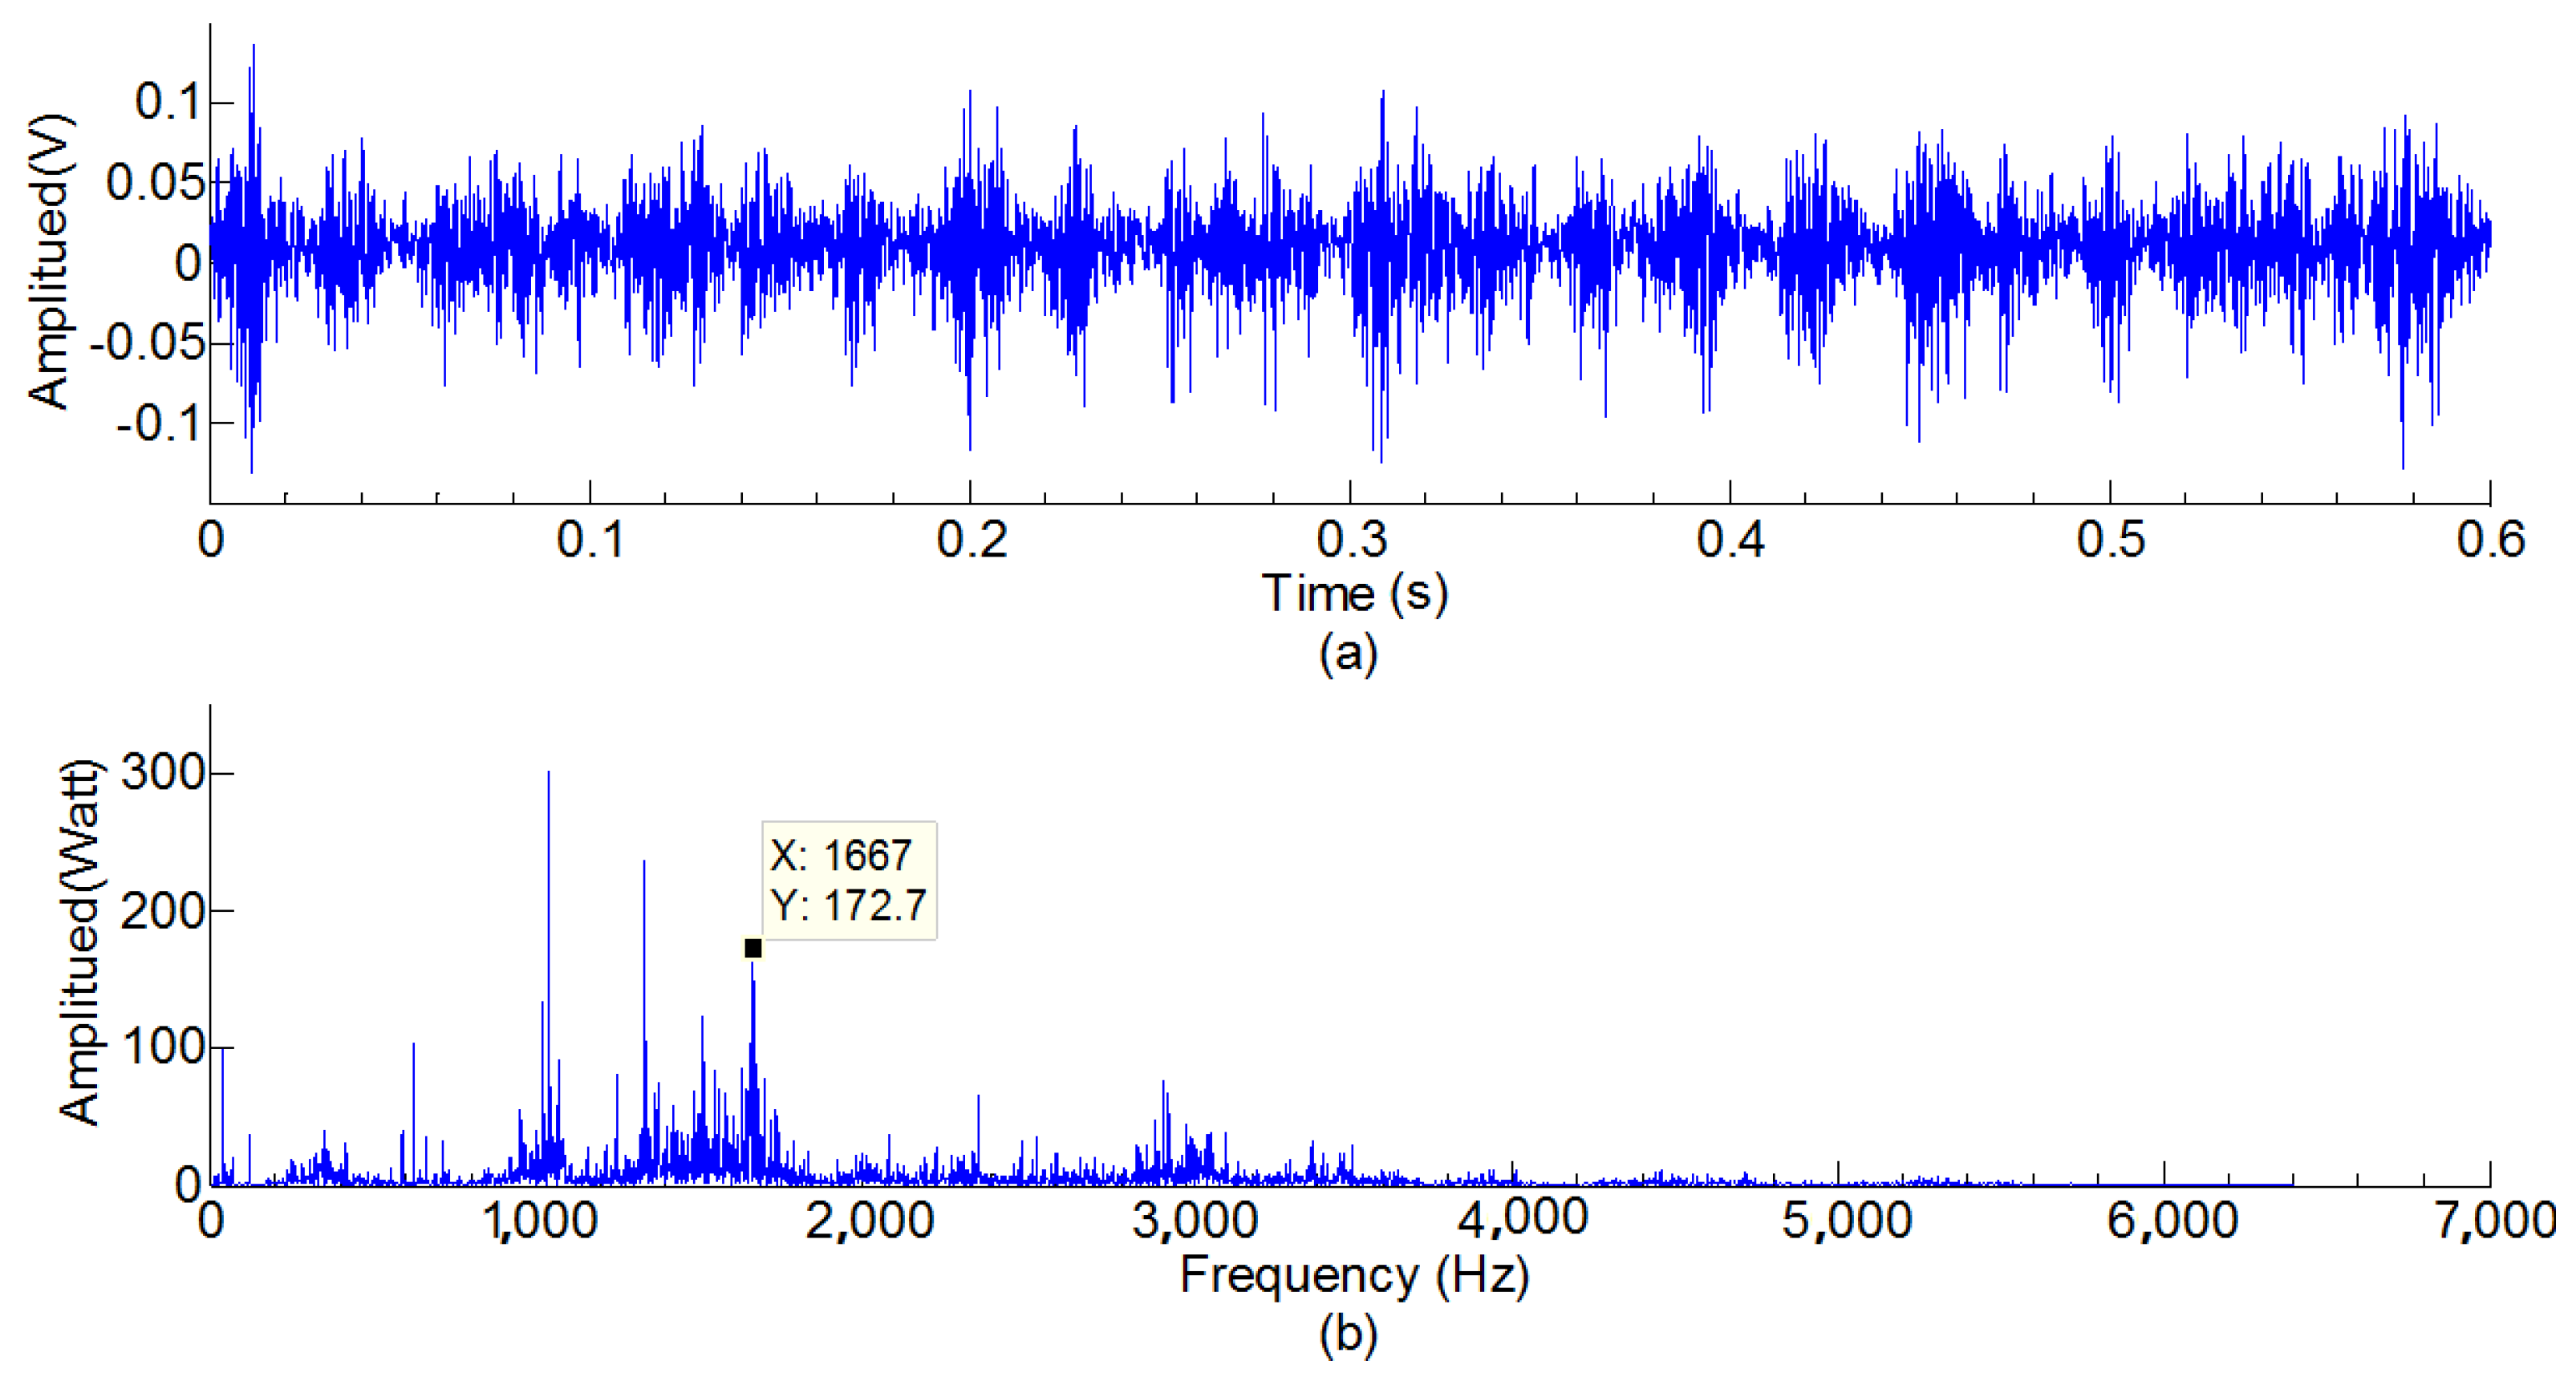
  • In order to ascertain the frequency components of the vibration signal, Fourier transform was first performed to obtain its frequency spectrum.
  • Twelve-times the maximum frequency was subtracted from the sampling frequency:
    f e = f s f r = f s 12   ×   f max
    where f s was the sampling frequency of vibration, f r was the resampling frequency calculated by the resampling frequency criterion, f max was the maximum frequency of the vibration signal and f e was the frequency to determine whether or not to execute the resample algorithm.
    If f e f max , we resampled the raw signal with the resampling frequency f r and output the resample signal; otherwise, we output the raw signal directly.
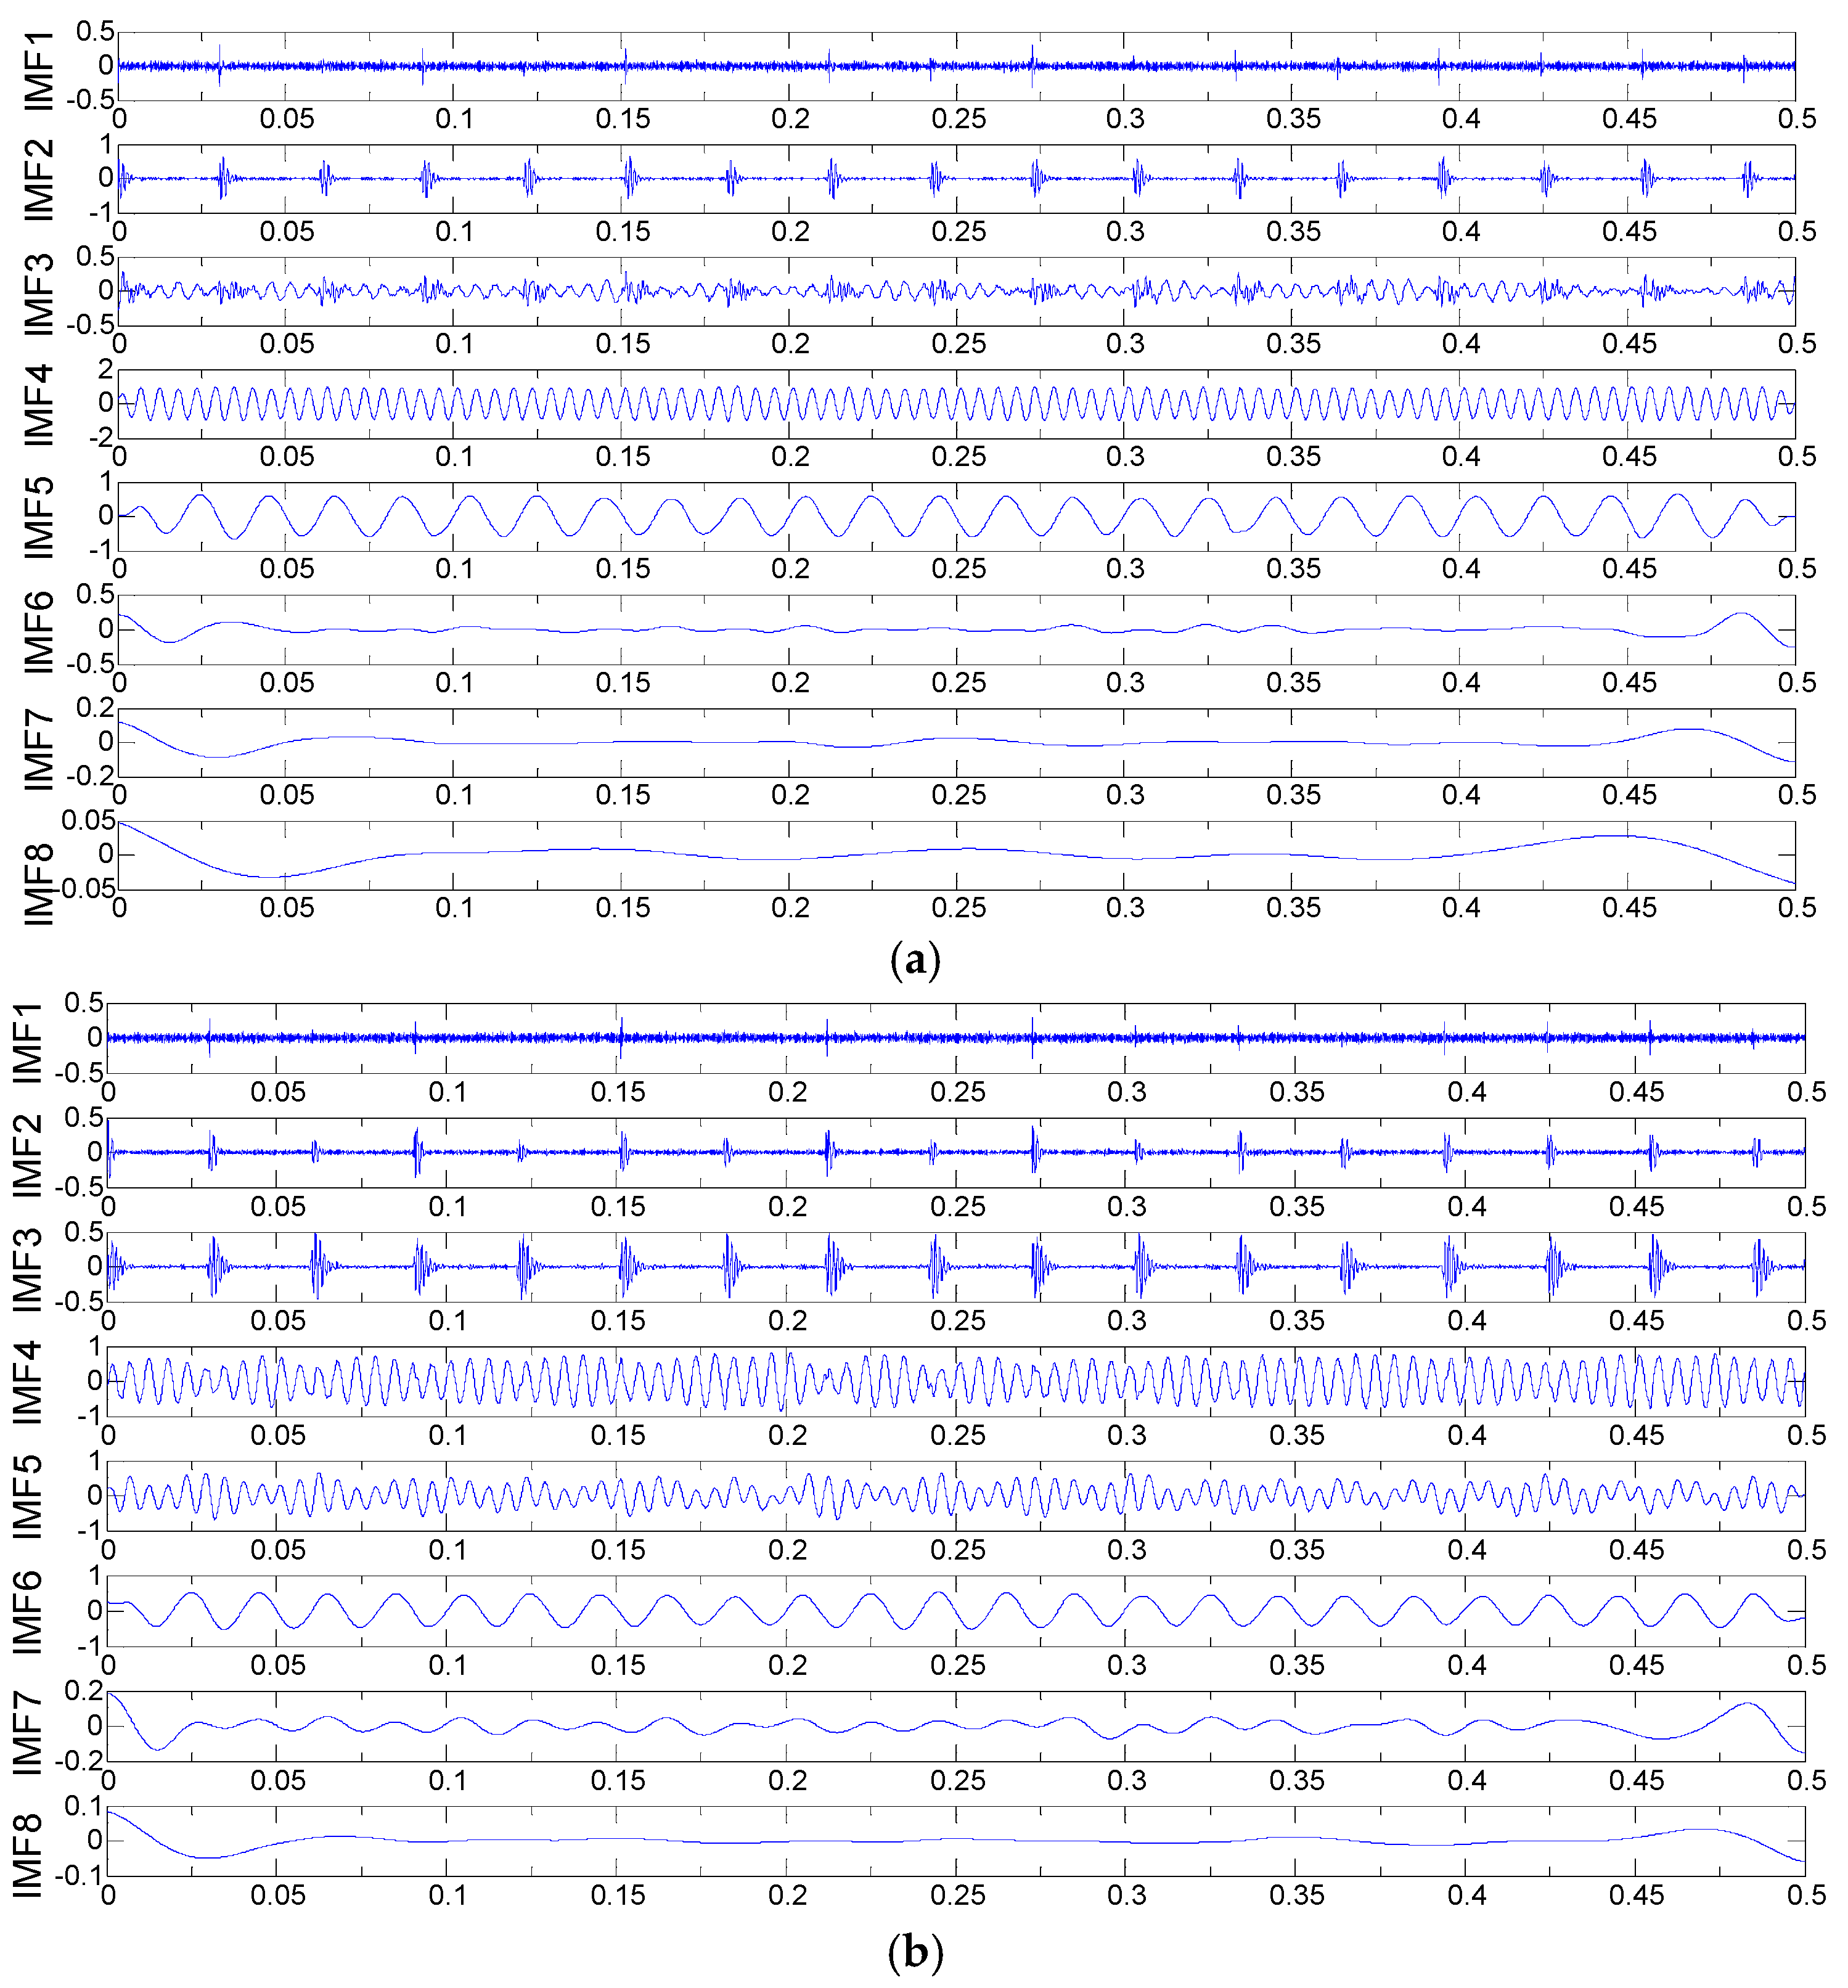
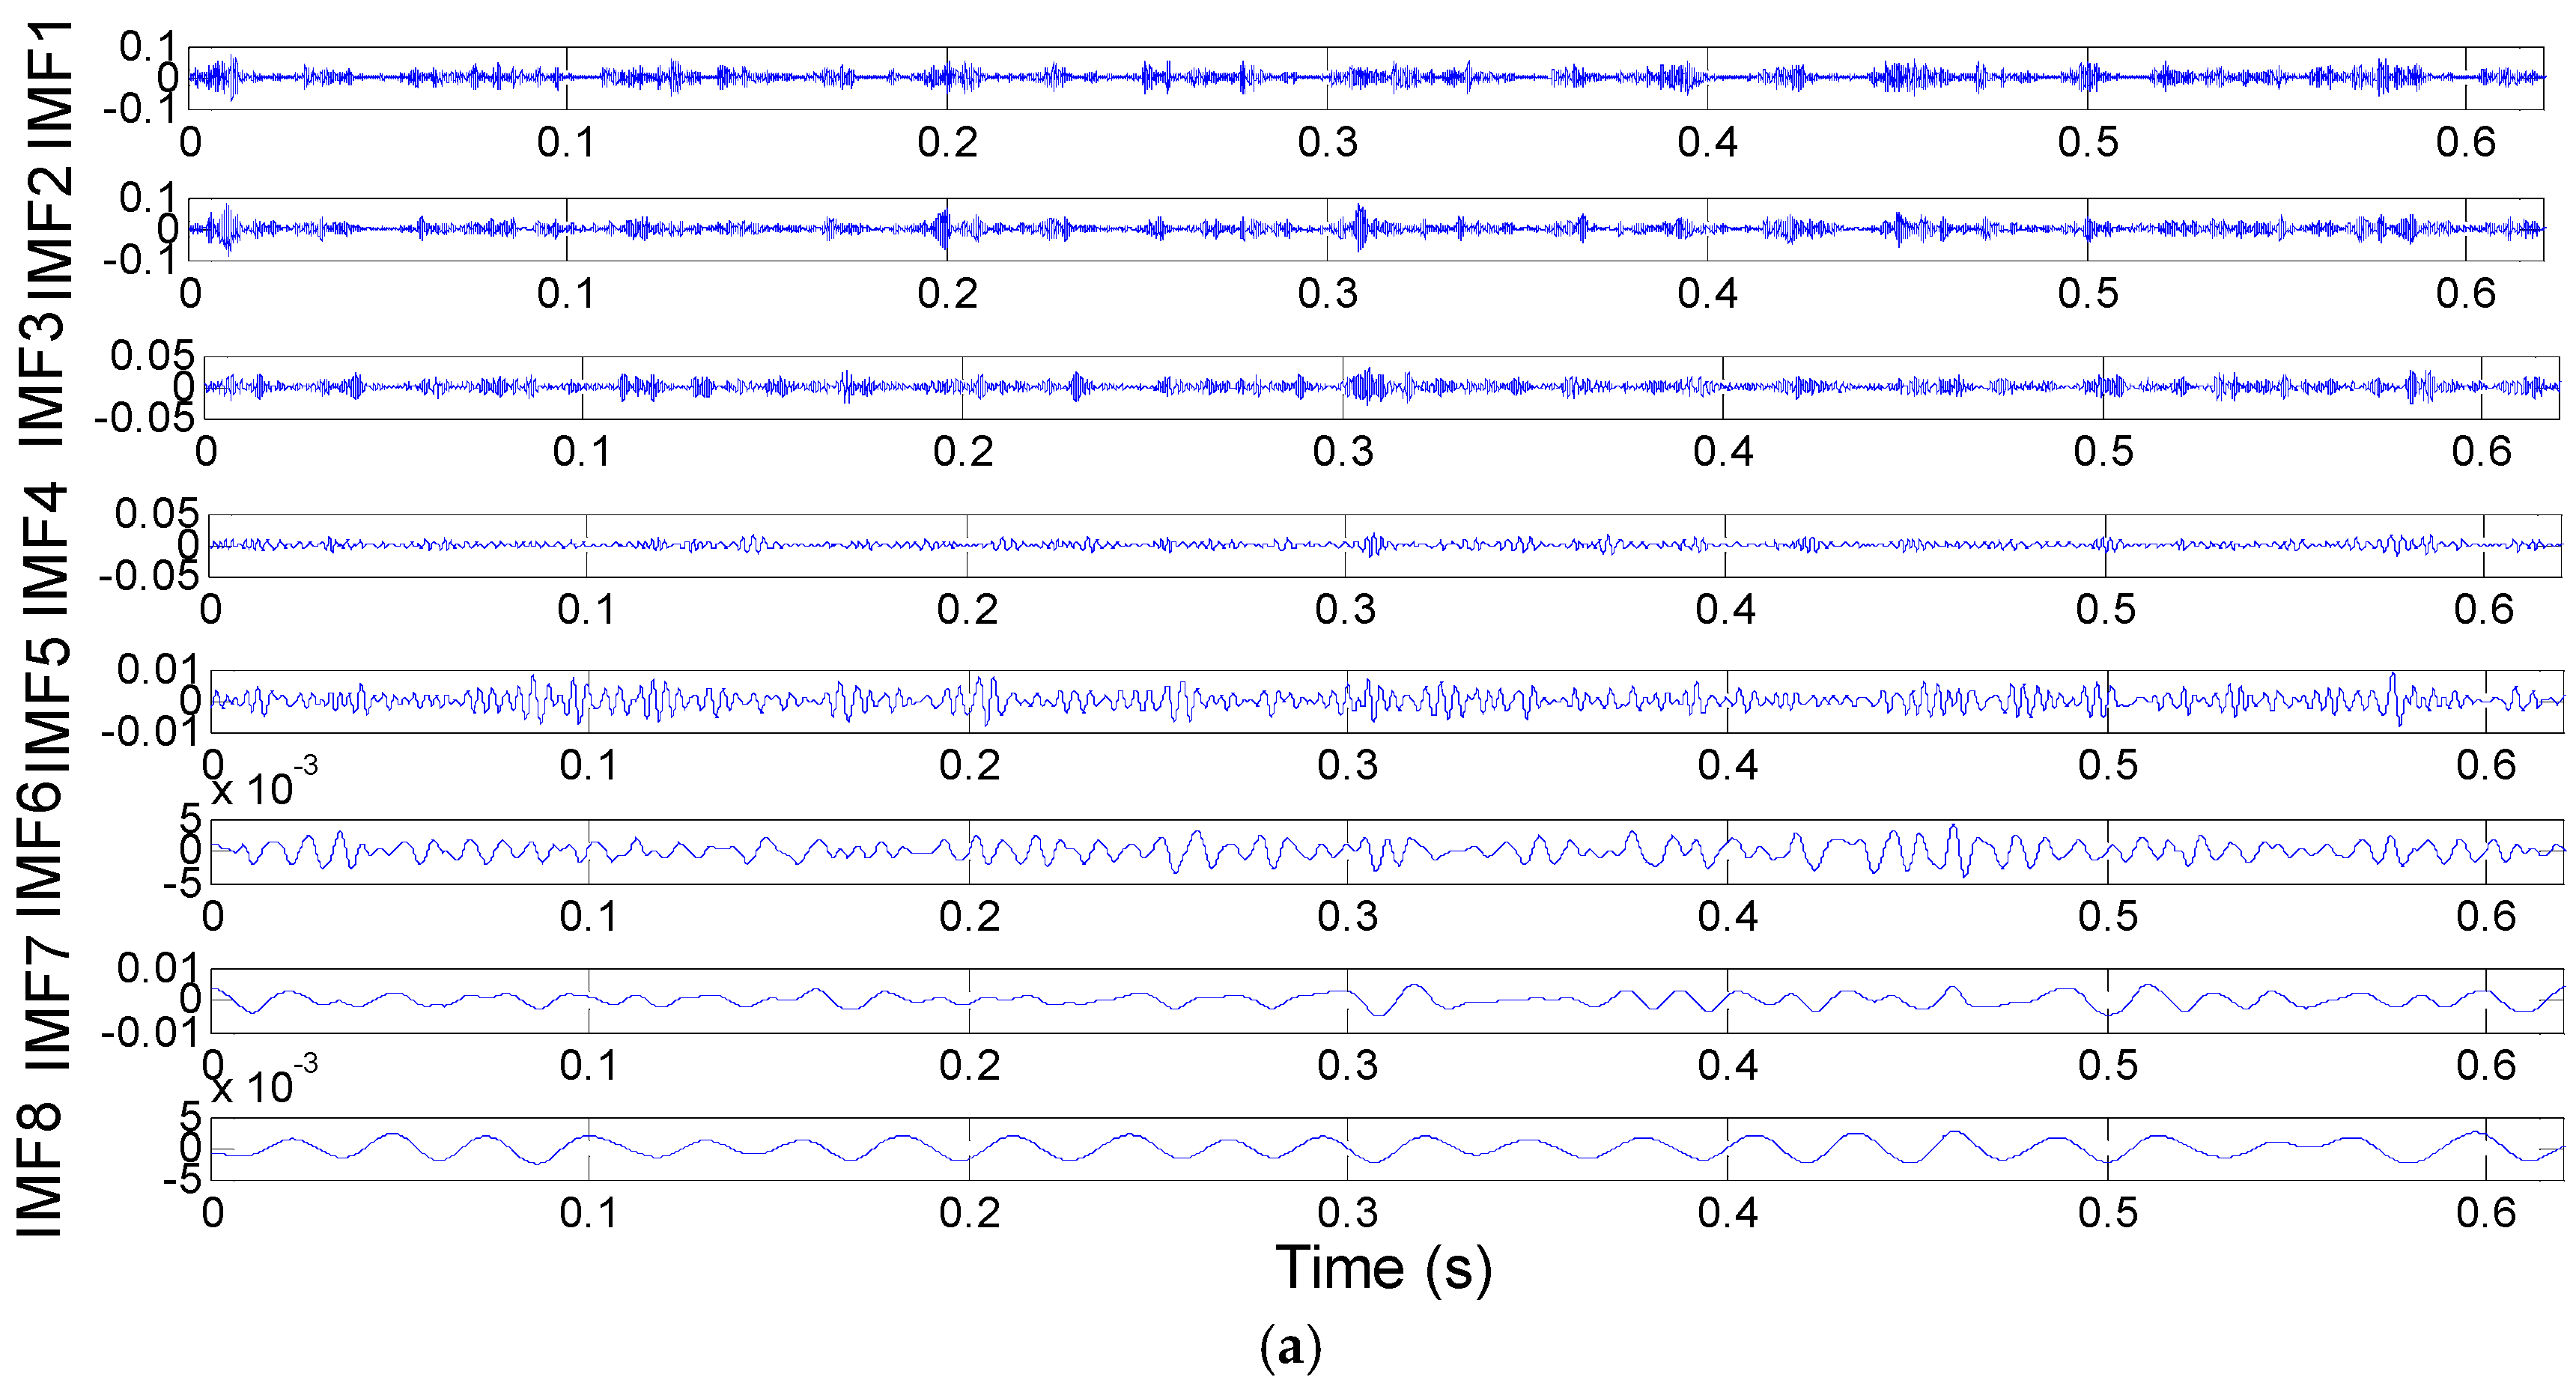
  • Perform EEMD on the signal obtained in Step 2.

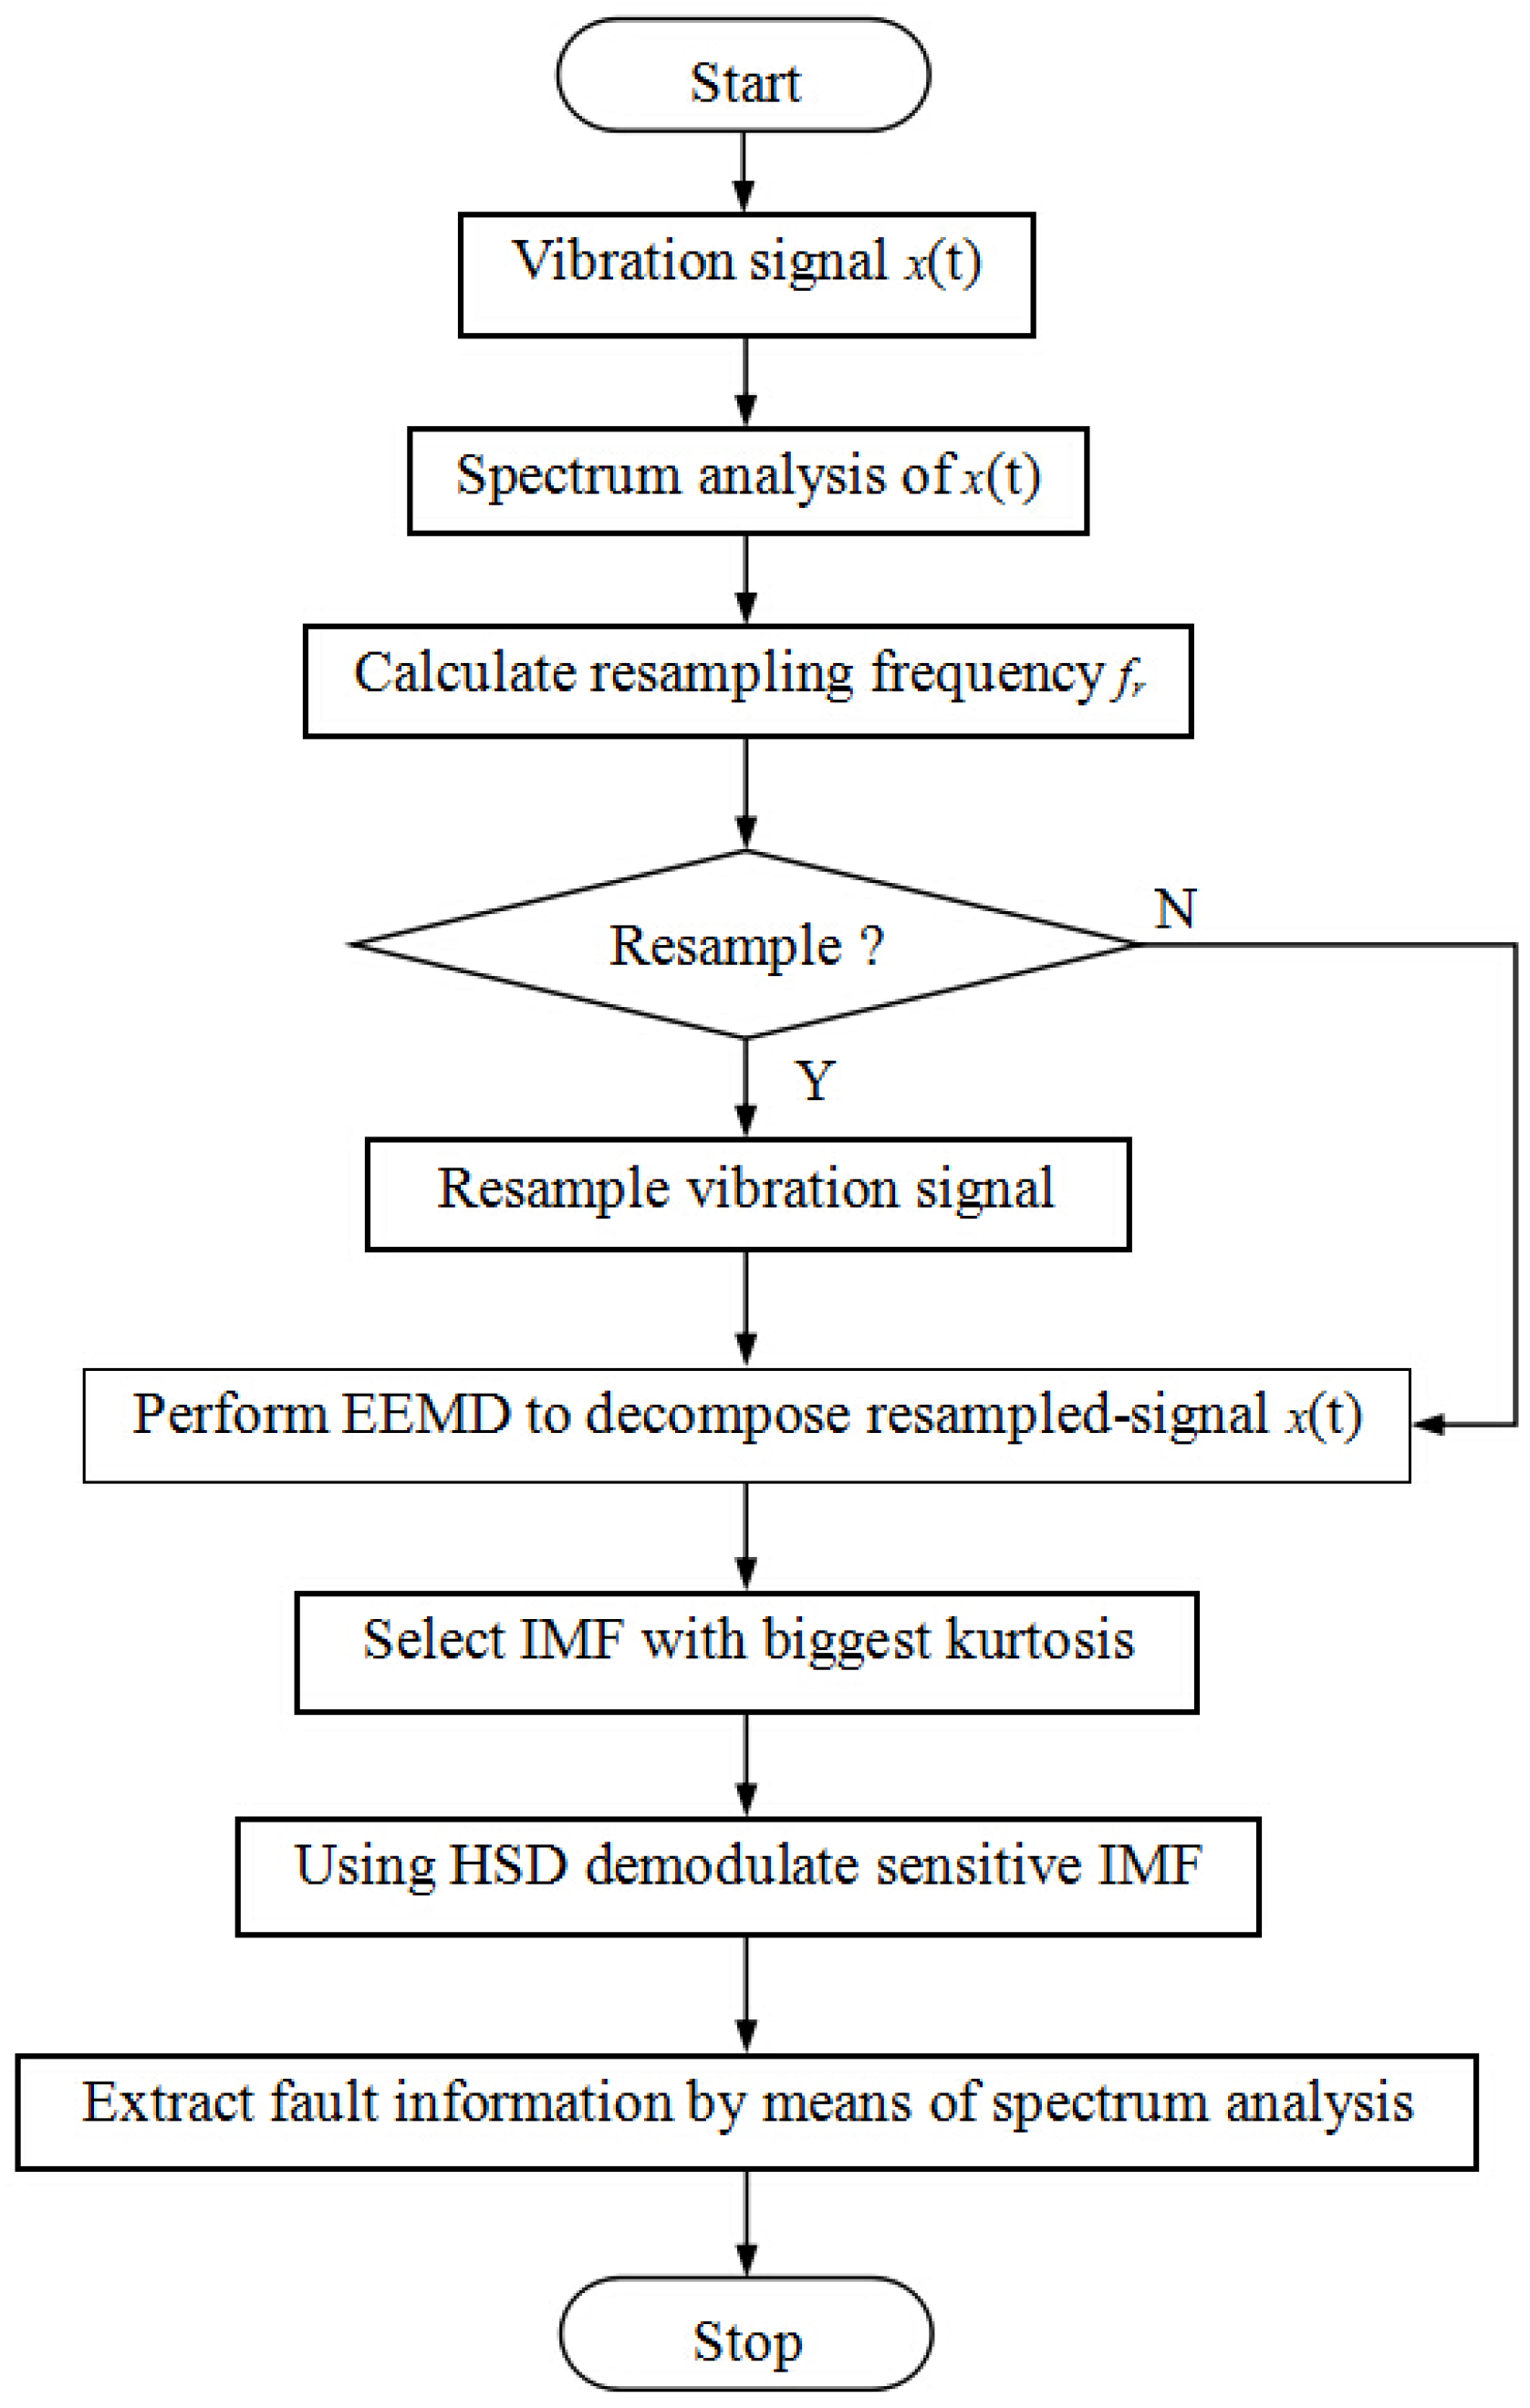
3.3. The Proposed Method

Typical wind turbine systems have a complex structure and combine many different components. Therefore, the vibration signal measured from wind turbine gearboxes is characteristically nonlinear and non-stationary. The useful fault feature in the vibration is very weak and dominated by strong gear meshing frequencies. The low signal to noise ratio (SNR) and transient nature pose significant difficulties and challenges to fault diagnosis of wind turbine gearboxes. Moreover, gear tooth damage leads to a reduction in gear tooth stiffness intermittently throughout the rotation of the gear. Changes due to the gear damage appear in the vibration spectrum as amplitude modulation. To overcome the above limitation, a fault diagnosis method based on improved EEMD and HSD has been proposed. Firstly, the frequency components of the raw vibration signal were calculated to determine whether a resample was needed. Secondly, the raw vibration signal or resampled signal were decomposed into a series of IMFs using EEMD. Then, the fault-related signal, which had the highest kurtosis value, was selected and processed by HSD. Finally, spectrum analysis was applied on the demodulation signal and a satisfactory extraction result was obtained. The complete process of the proposed approach is shown in Figure 4, which includes the following steps:
1
Spectrum analysis to extract the distributions of the frequencies of the vibration signal, using the resampling frequency criterion to calculate the resampling frequency value f r .
2
Raw vibration signal resample. Subtract the resampling frequency from the sampling frequency:
f e = f s f r
If f e f max , resample the raw vibration signal with resampling frequency f r , and output the resampled signal; otherwise, output the raw vibration signal directly.
3
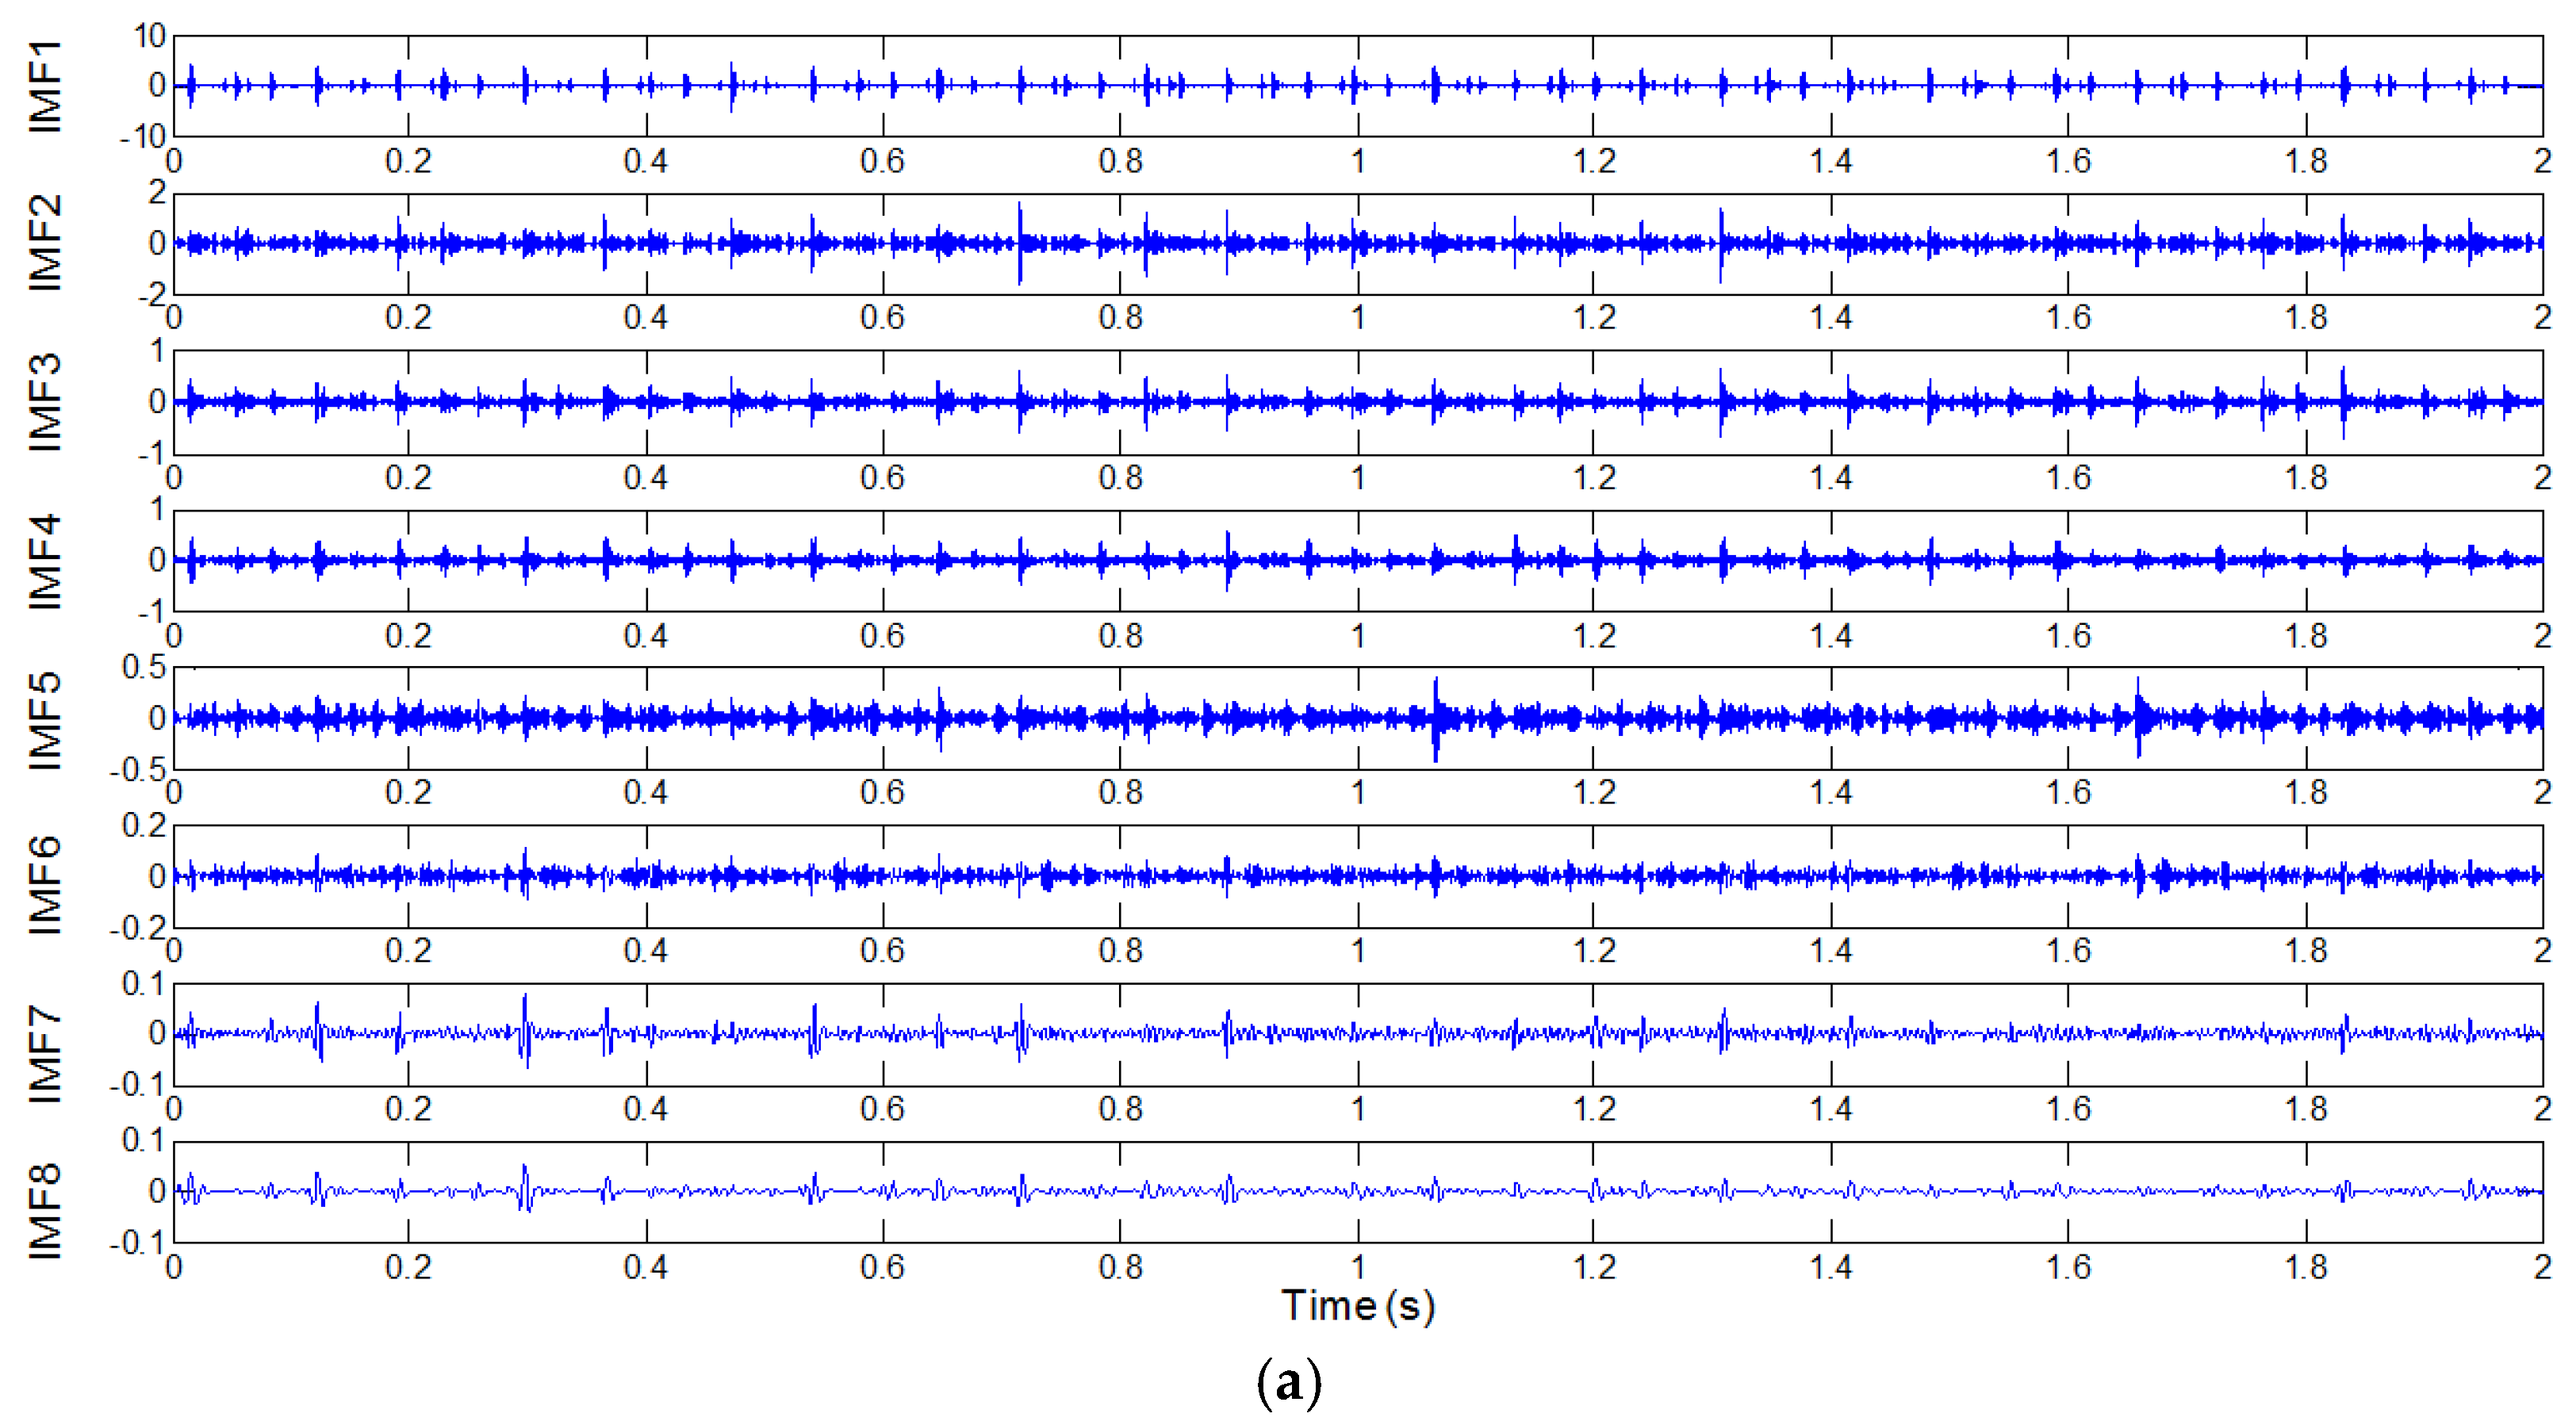
The resampled signal decomposes by means of EEMD. Use EEMD to decompose the vibration signal obtained in Step 2 into a set of IMFs.
4
Sensitive IMF selection with the biggest kurtosis index value.
5
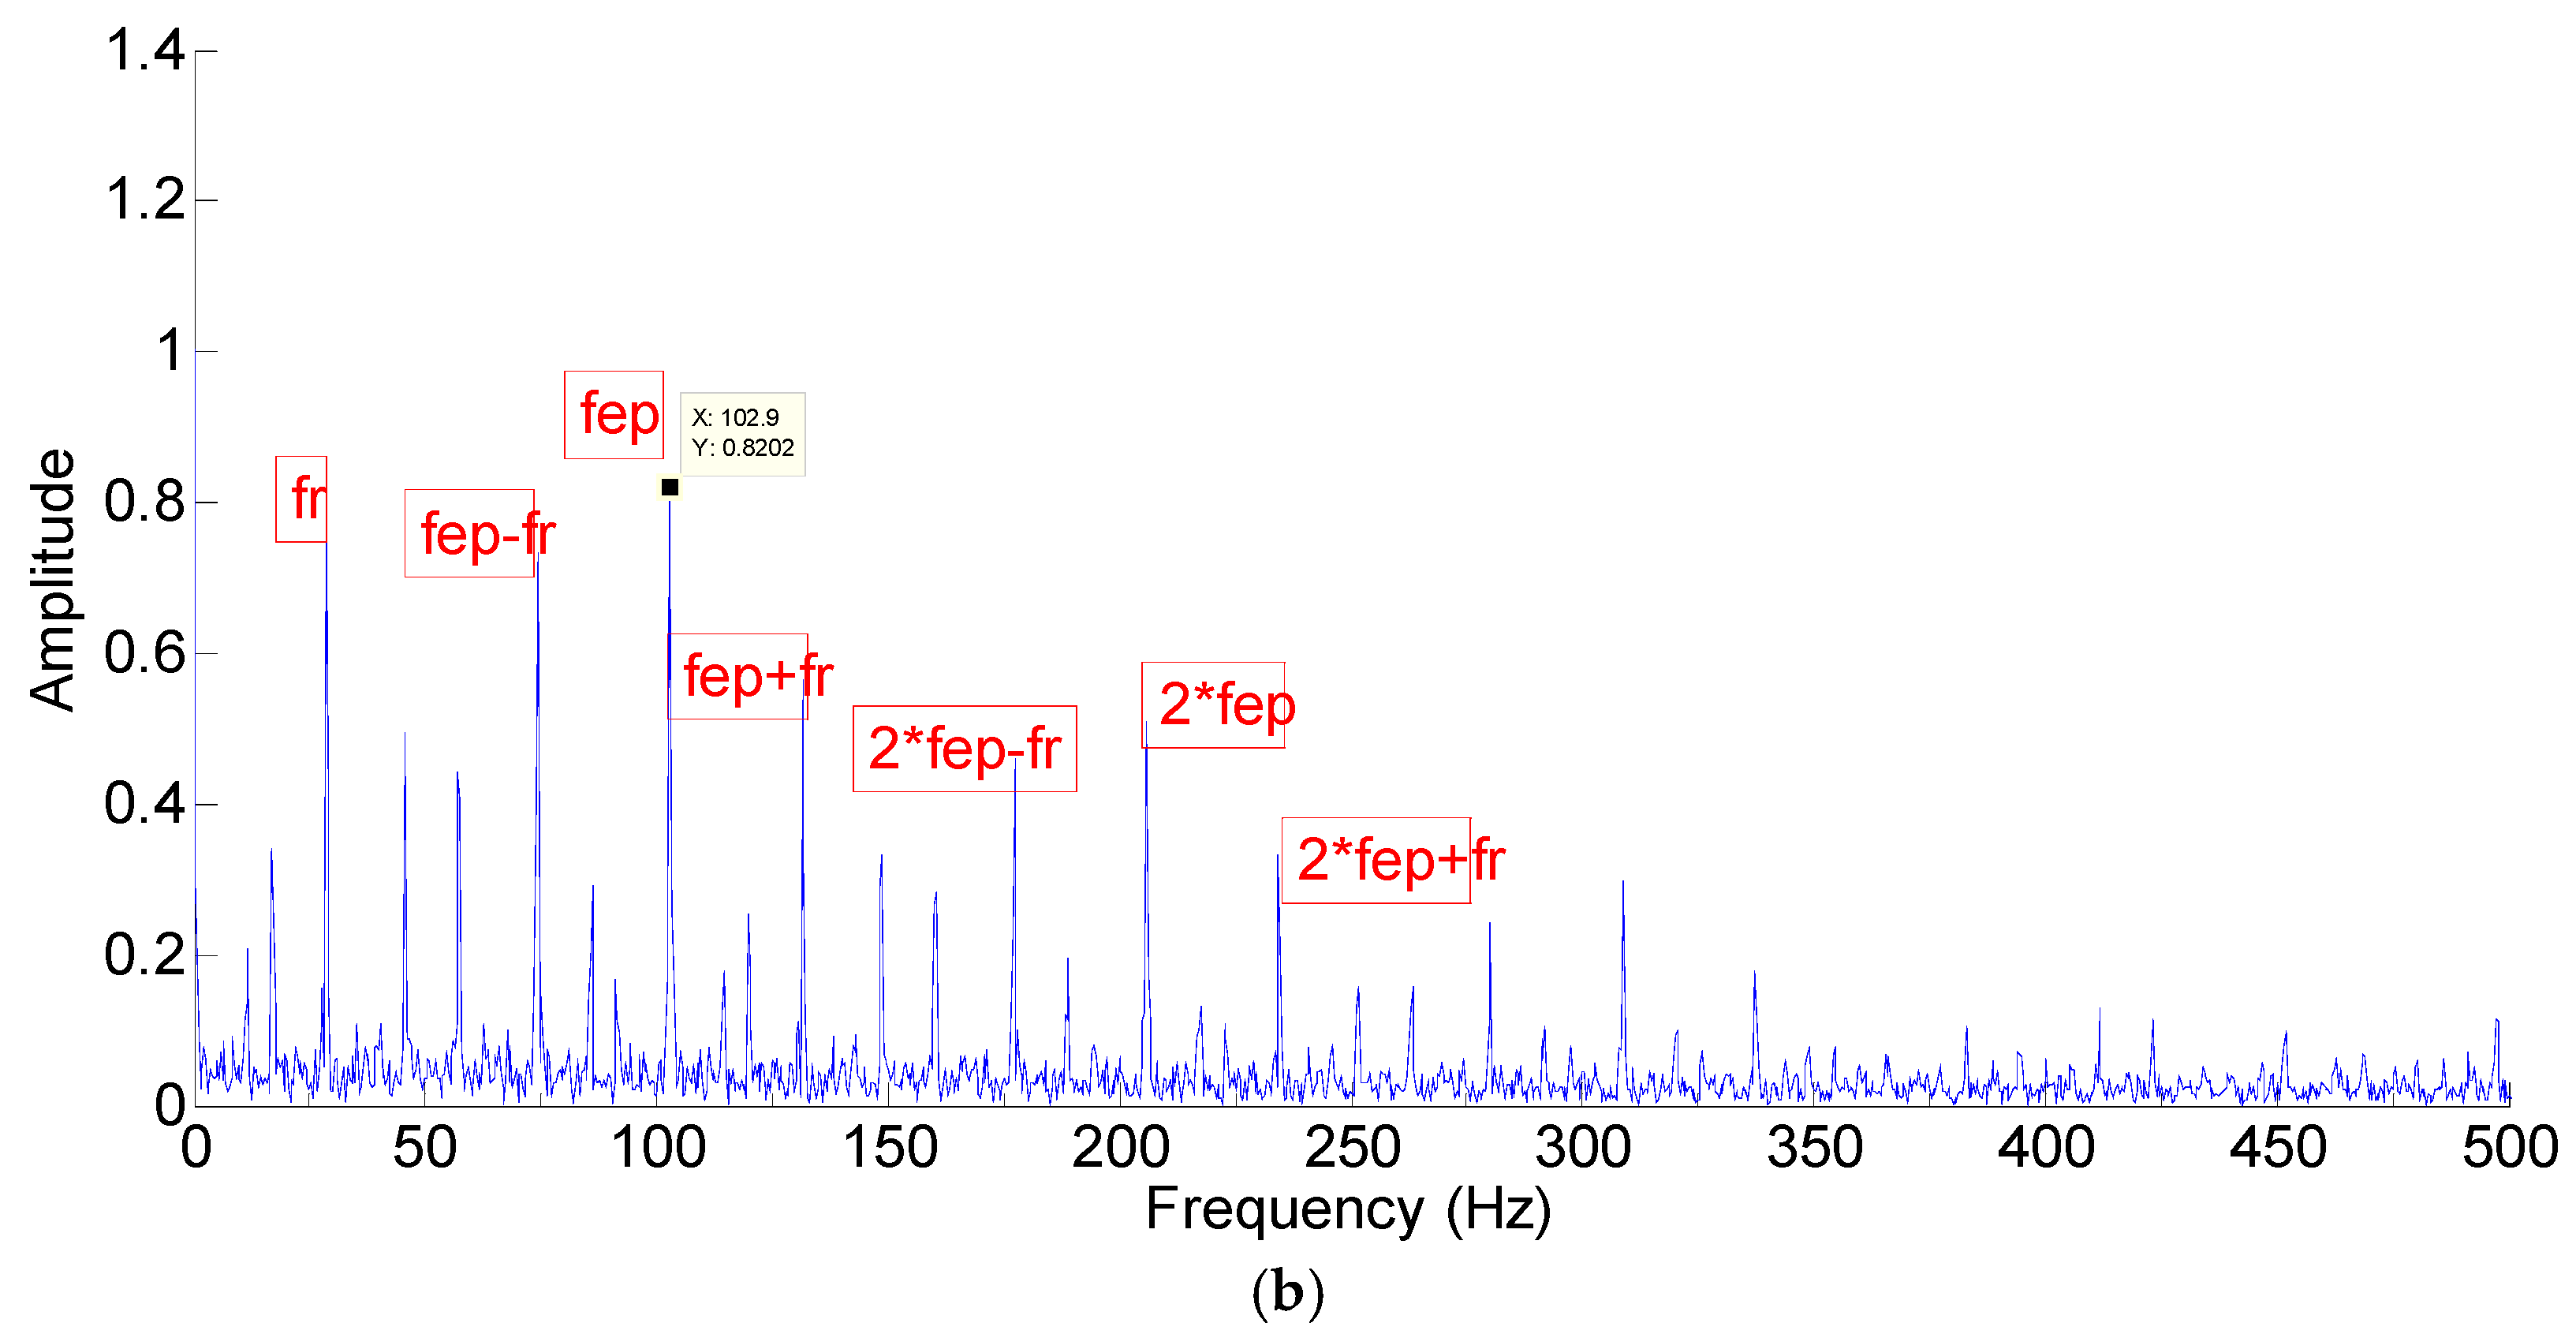
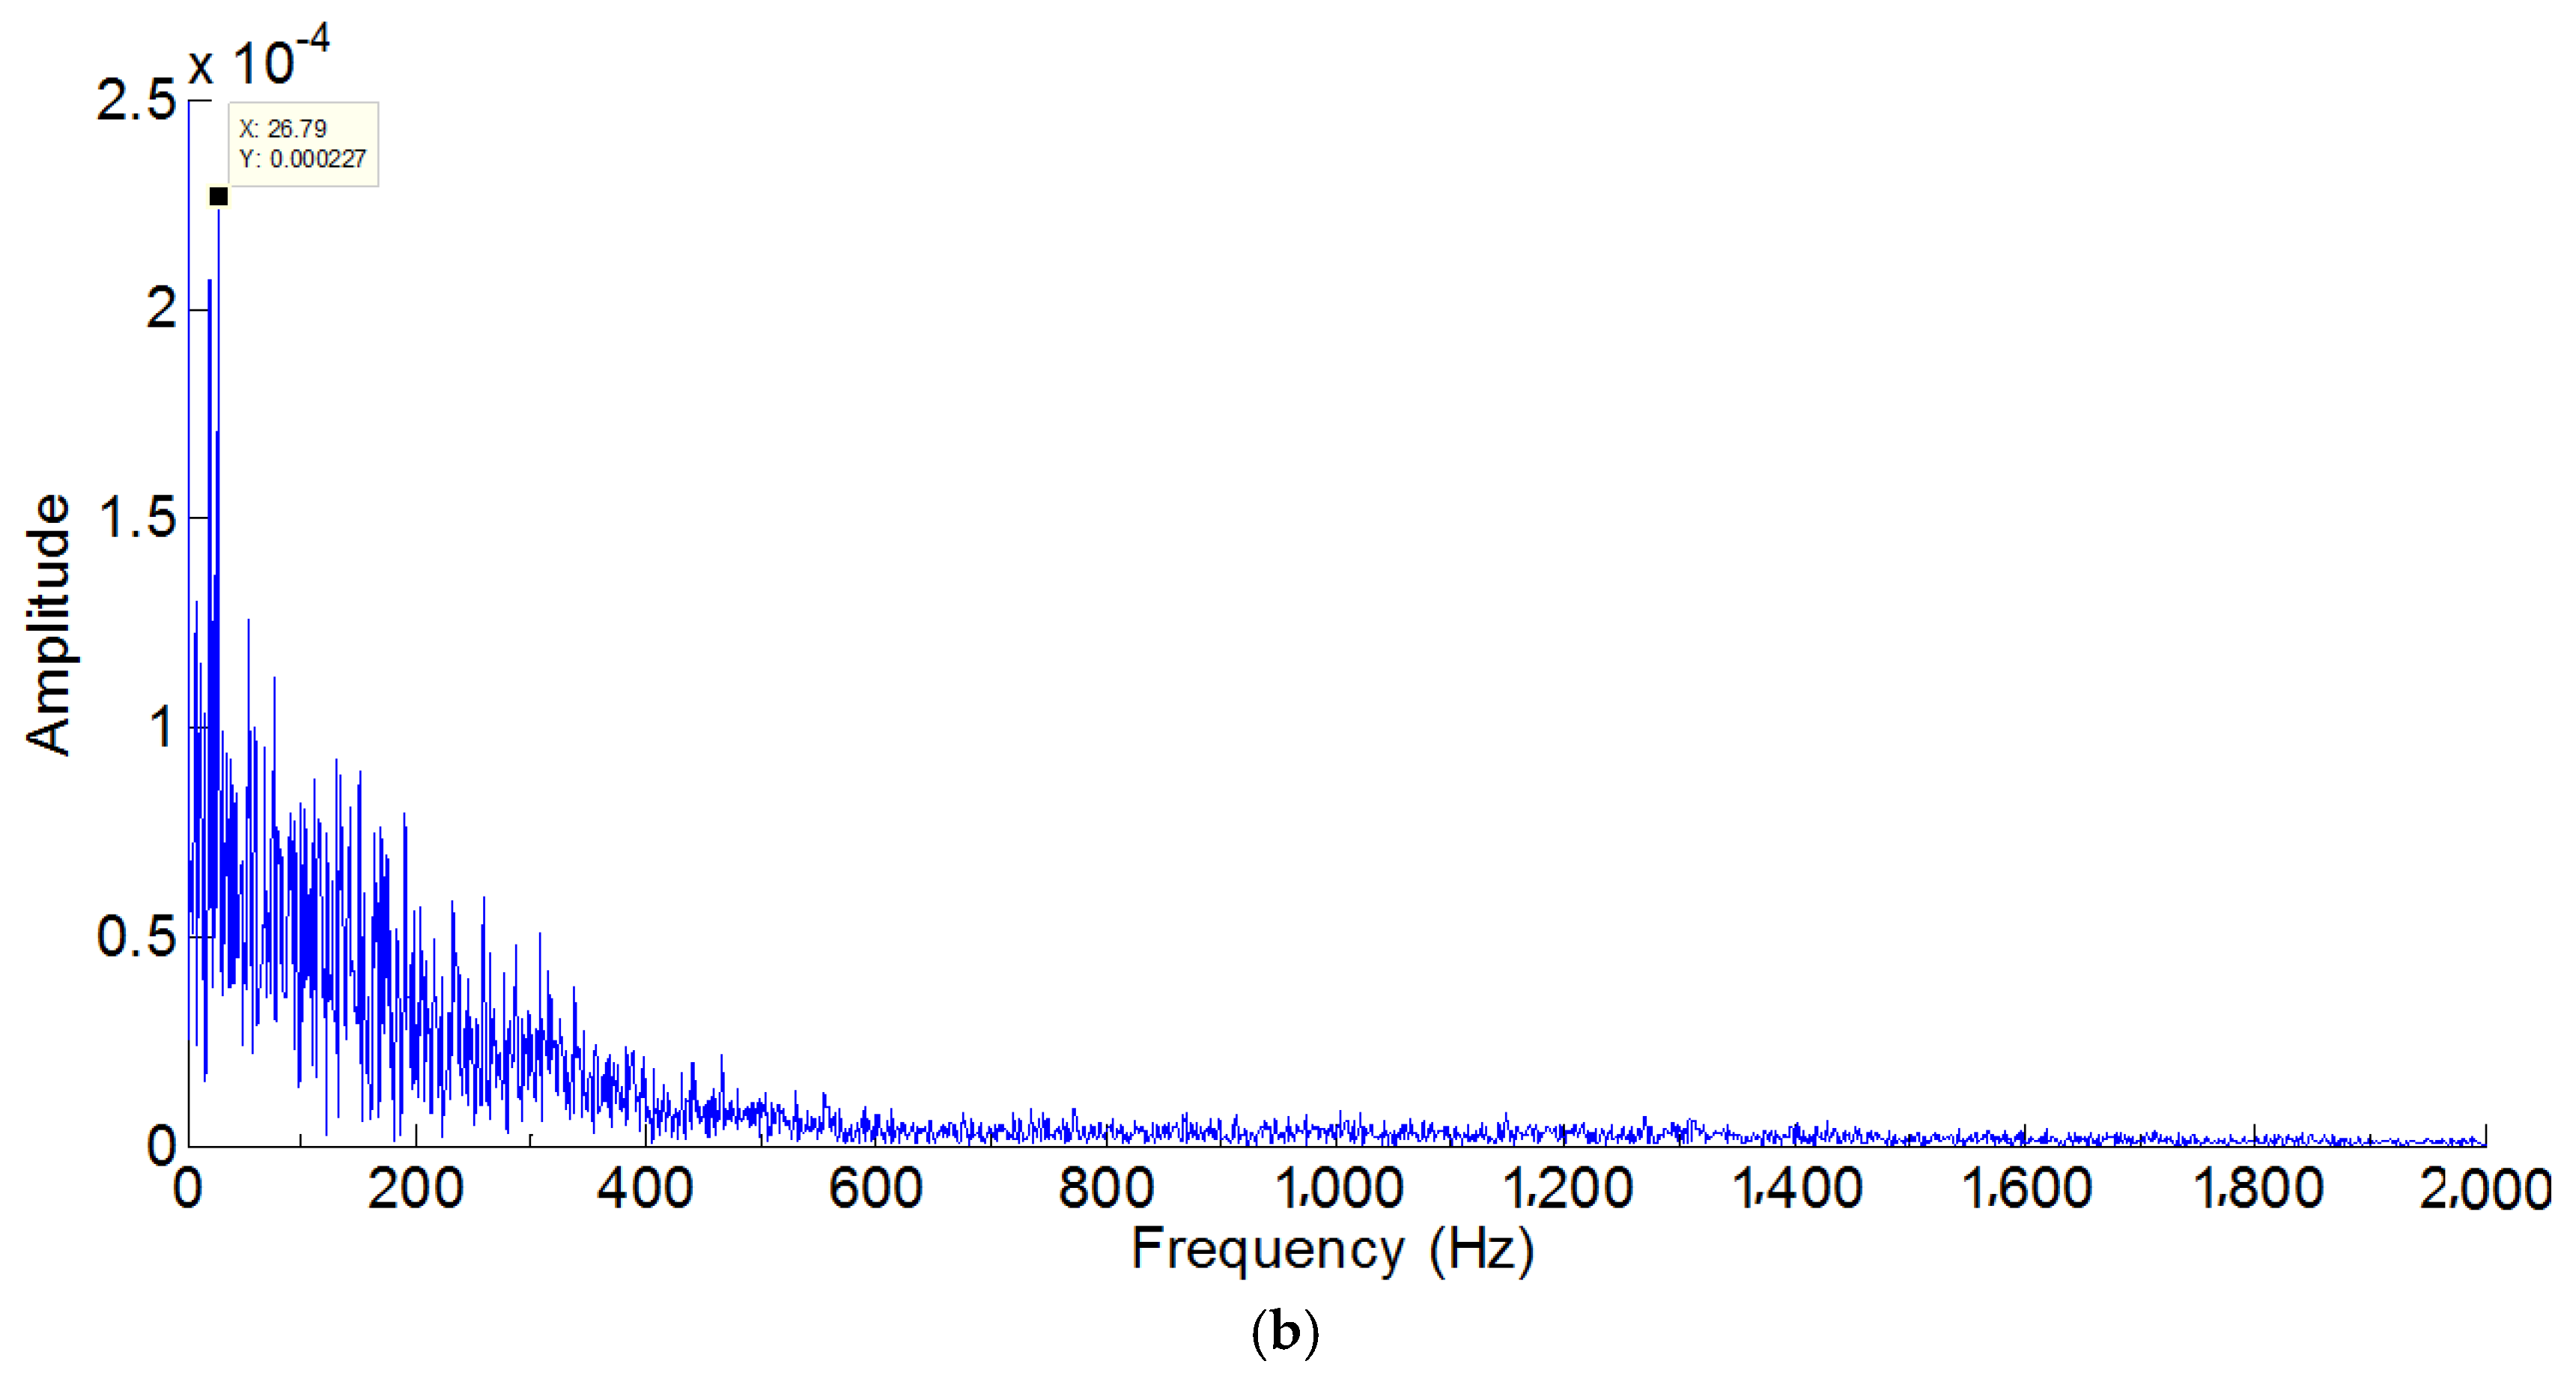
Feature information extraction from sensitive IMF by HSD. Use HSD to demodulate sensitive IMF to extract feature information from the demodulated signal.
6
Fault type identified by means of spectrum analysis.

4. The Proposed Method for Gearbox Fault Diagnosis of a Wind Turbine

Two different experimental signals were used to verify the performance of the proposed method. The results demonstrate its effectiveness and robustness for wind turbine gear box fault diagnosis.

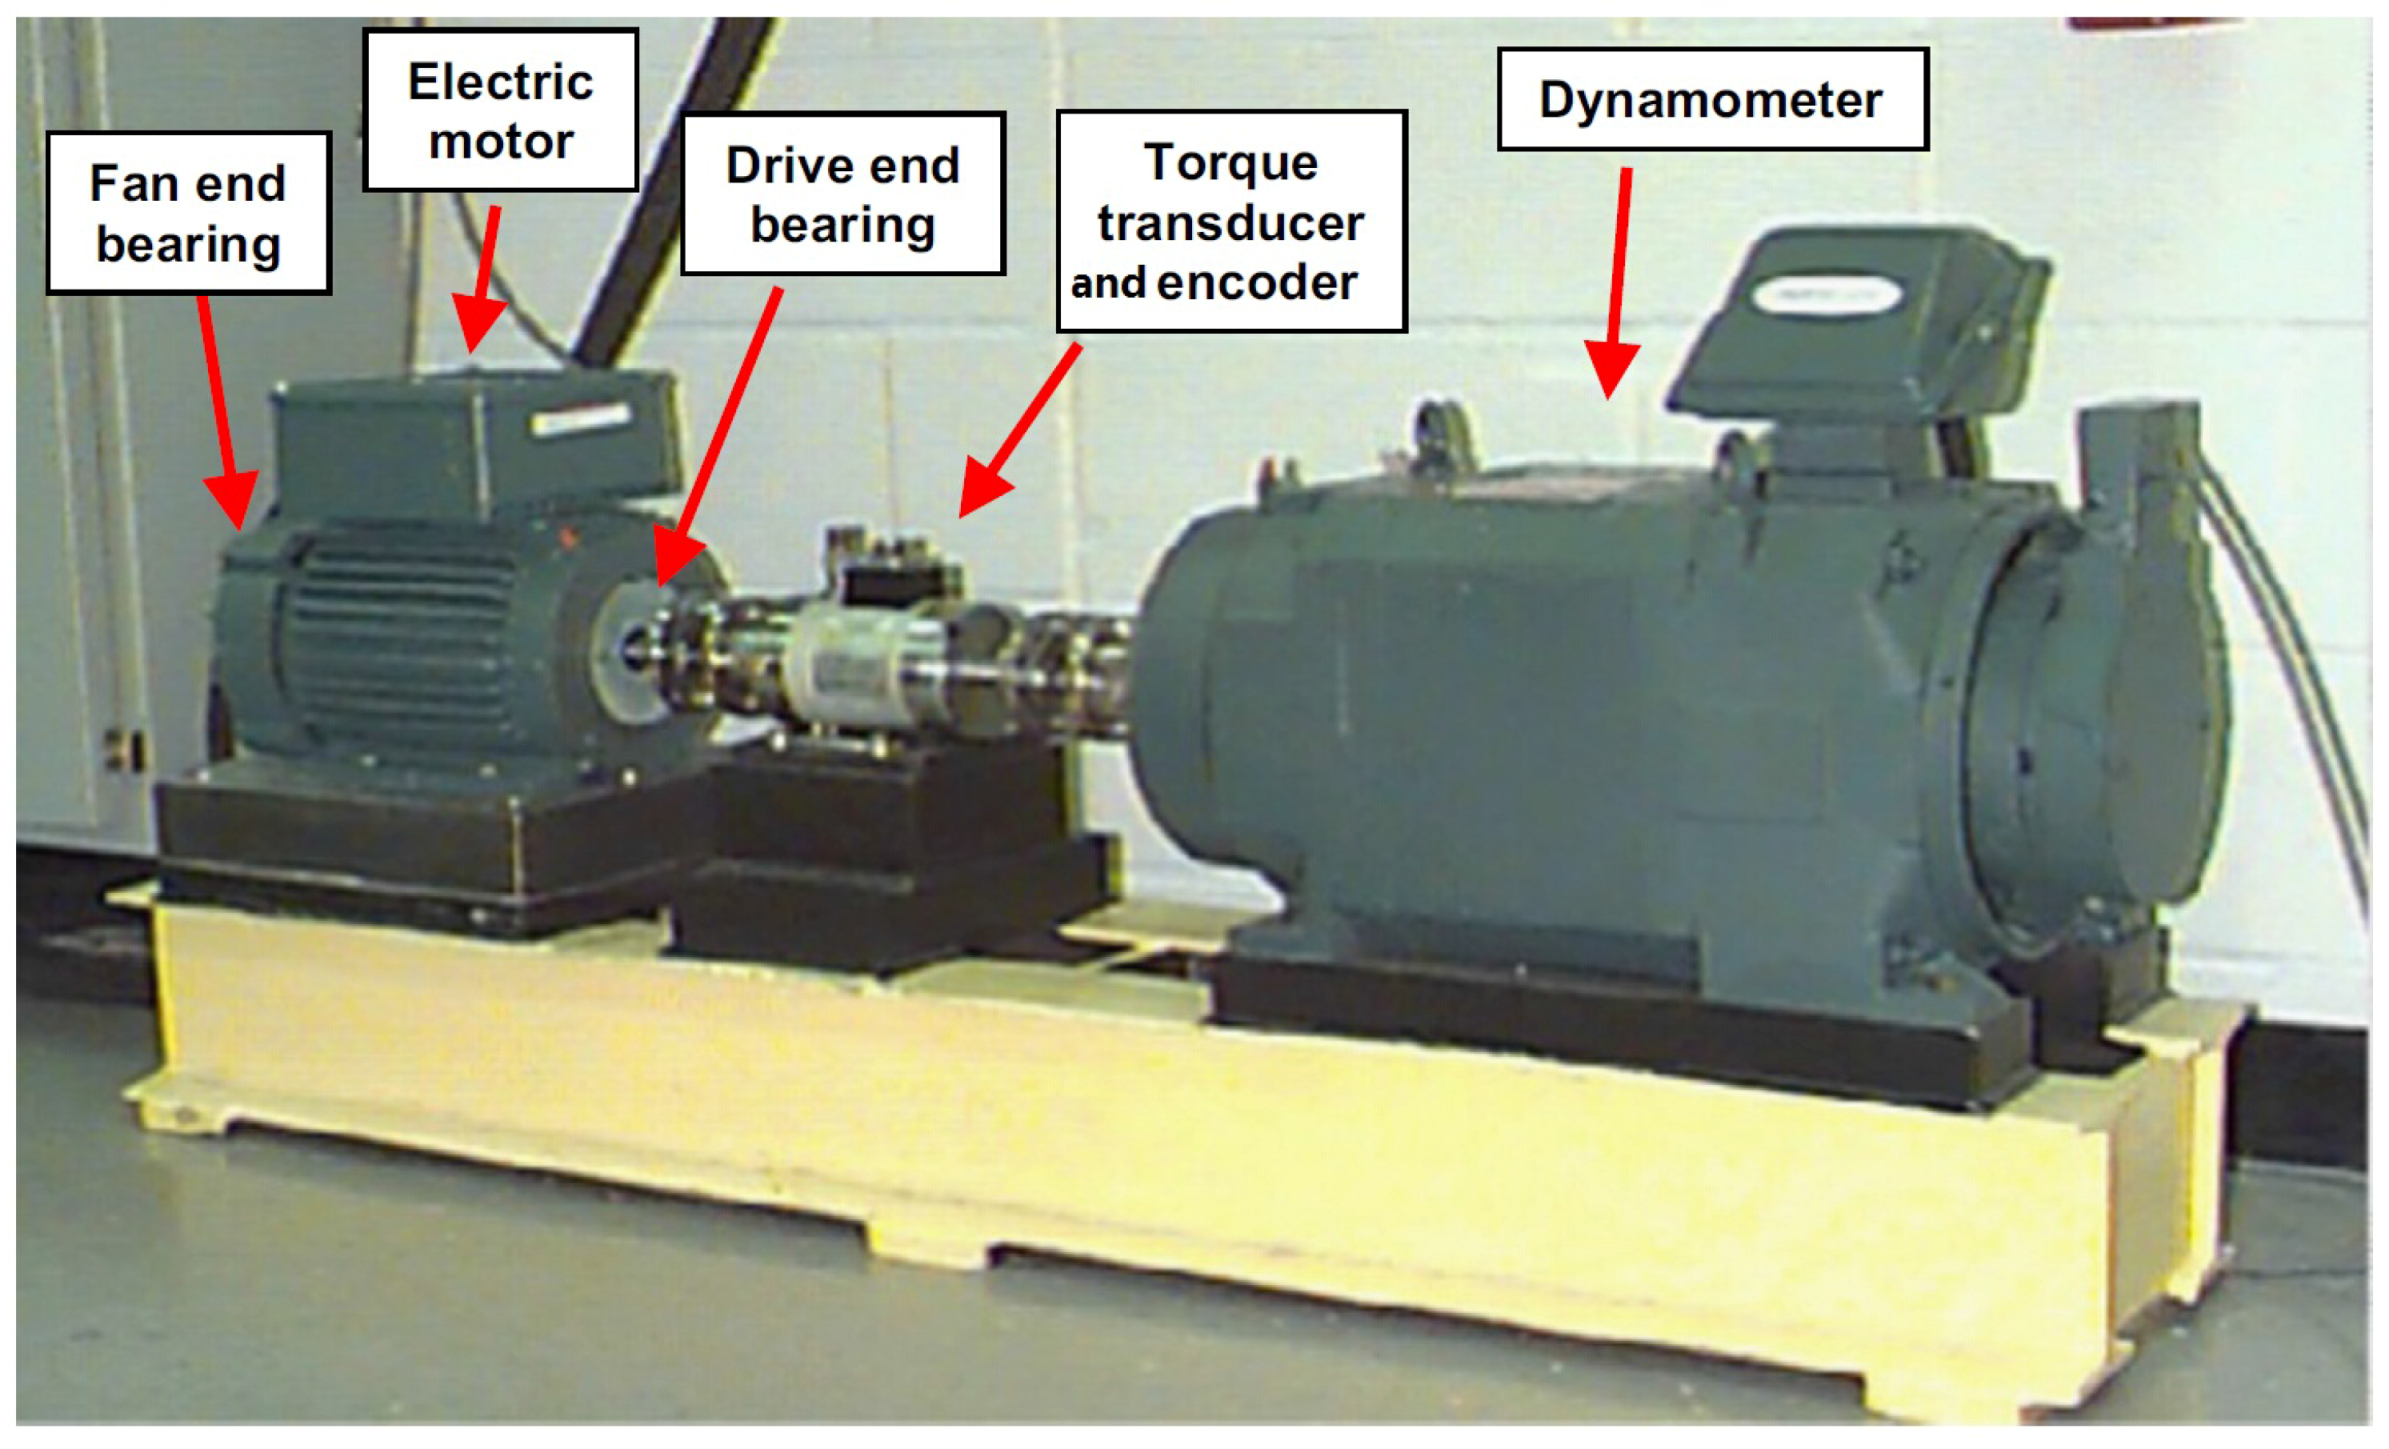
4.1. Bearing Experimental Evaluation

An experimental study on the fault diagnosis of a rolling bearing was firstly employed to show how the proposed method worked and to validate its effectiveness and suitability. The experimental dataset by the Case Western Reserve University (CWRU) Bearing Data Center [24] has become a standard reference in the bearing diagnostics field. The proposed method was applied to the CWRU dataset. The basic layout of the test rig is shown in Figure 5. It consisted of a 2-hp motor (left), a torque transducer (center), a dynamometer (right) and control electronics (not shown). Two bearings were installed in the motor-driven mechanical system, one at the drive end of the motor and the other at the fan end. In both bearings, three types of faults (outer race, inner race and ball faults) and various levels of fault severity (7–28 mils) were introduced using electro-discharge machining. Each bearing was tested under four different loads, 0–3 hp. The motor rotational speed was varied between 1730 and 1797 RPM depending on the load. Data was collected at 12,000 samples per second and at 48,000 samples per second for drive end bearing experiments. All fan end bearing data were collected at 12,000 samples per second. A more detailed description of the experimental setup and the apparatus involved can be found at the Case Western Reserve University’s website [24].
In this study, we employed the drive end bearing data collected at 1719 RPM ( f r = 28.5   Hz ) using an accelerometer. The sampling frequency f s was 48 kHz. The fault was seeded at the outer race with a 21 mils fault diameter. Fault characteristic frequency was the multiple of the rotating frequency, the coefficient of the driven end bearing outer ring and the coefficient of the drive end bearing and is listed in Table 1 [24]. Therefore, the fault characteristic frequency could be obtained by Equation (18):
f e p = 1719 60 × 3.5848 = 102.7   Hz
The time domain waveform of the experimental vibration signal and its FFT spectrum are shown in Figure 6, from which the fault characteristic frequency cannot be identified. The proposed method was applied to this vibration signal.
As show in Figure 6a, the vibration signal presented a periodic change with the increasing of experiment times. Spectrum analysis has been made, and the result is shown in Figure 6b. However, it is difficult to find out any obvious fault information, for the feature with gear fault information is drawn in the background vibration signals.
The proposed method in this article is then introduced to analyze the vibration signal. According to the resample criterion presented in Section 3.2, if we subtract 12-times the maximum frequency from sampling frequency, the value of the result was bigger than the maximum frequency. Therefore, the resample should be taken to improve the accuracy and computational efficiency of EEMD.
f e = f s f r = 48000 12 × 3293 = 8484   Hz 3293   Hz
The resample was first applied on the vibration signal with a frequency of 39,516 Hz. The first eight IMFs of the resample signal are shown in Figure 7a. The IMF1 was selected for further analysis because it had the highest kurtosis value compared with the other IMFs. The demodulation spectrum obtained from applying the HSD on IMF1 is illustrated in Figure 7b, which shows that the identified frequency matched the calculated fault frequency f e p = 102.7   Hz . The side-bands’ frequencies were also clearly identified.

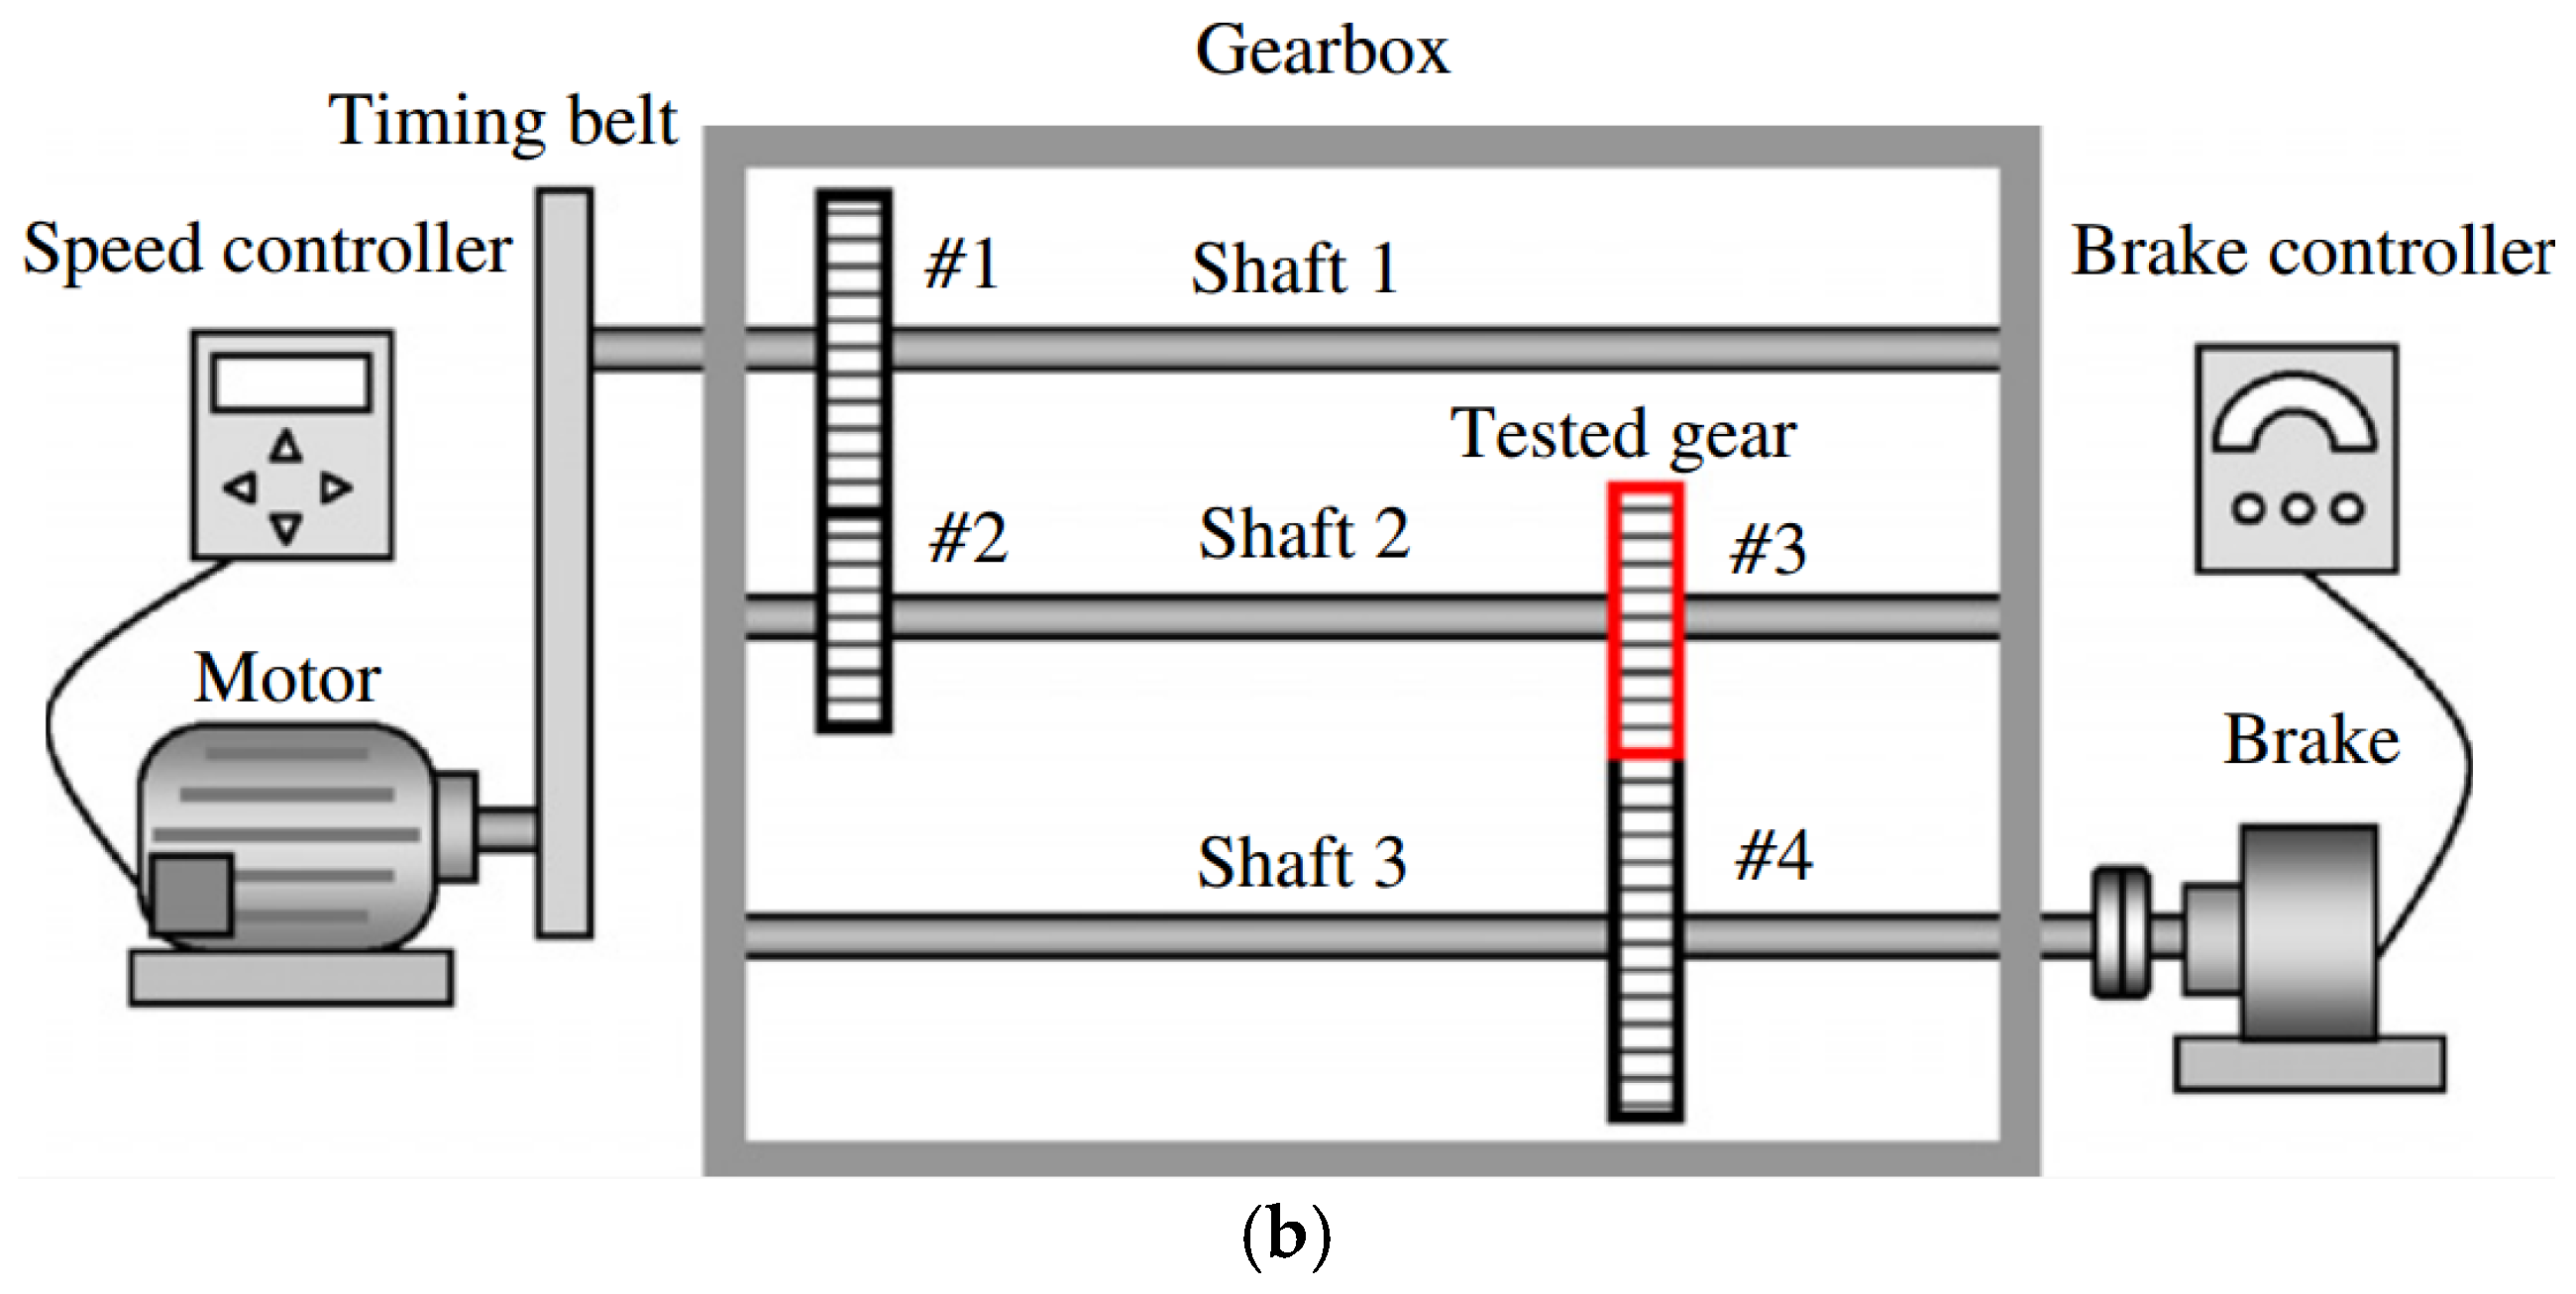
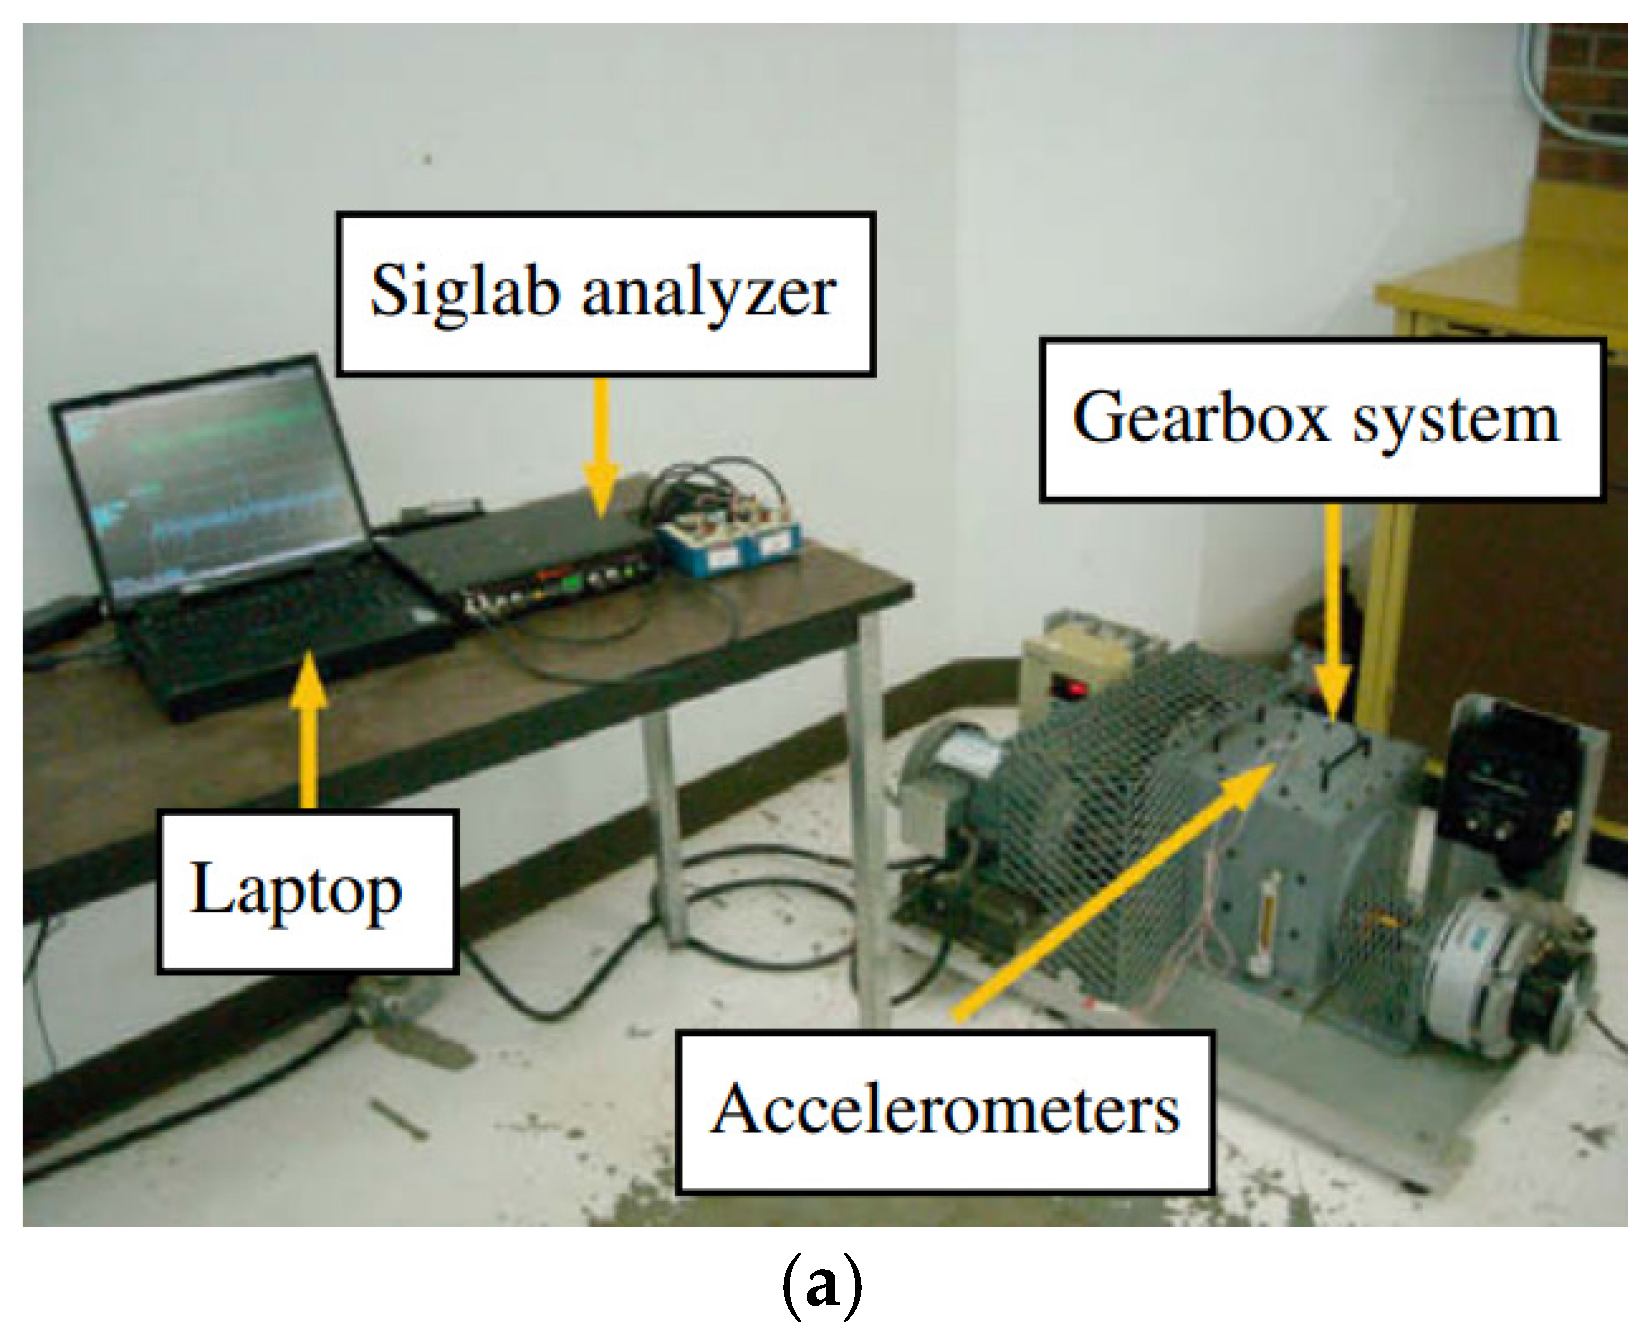
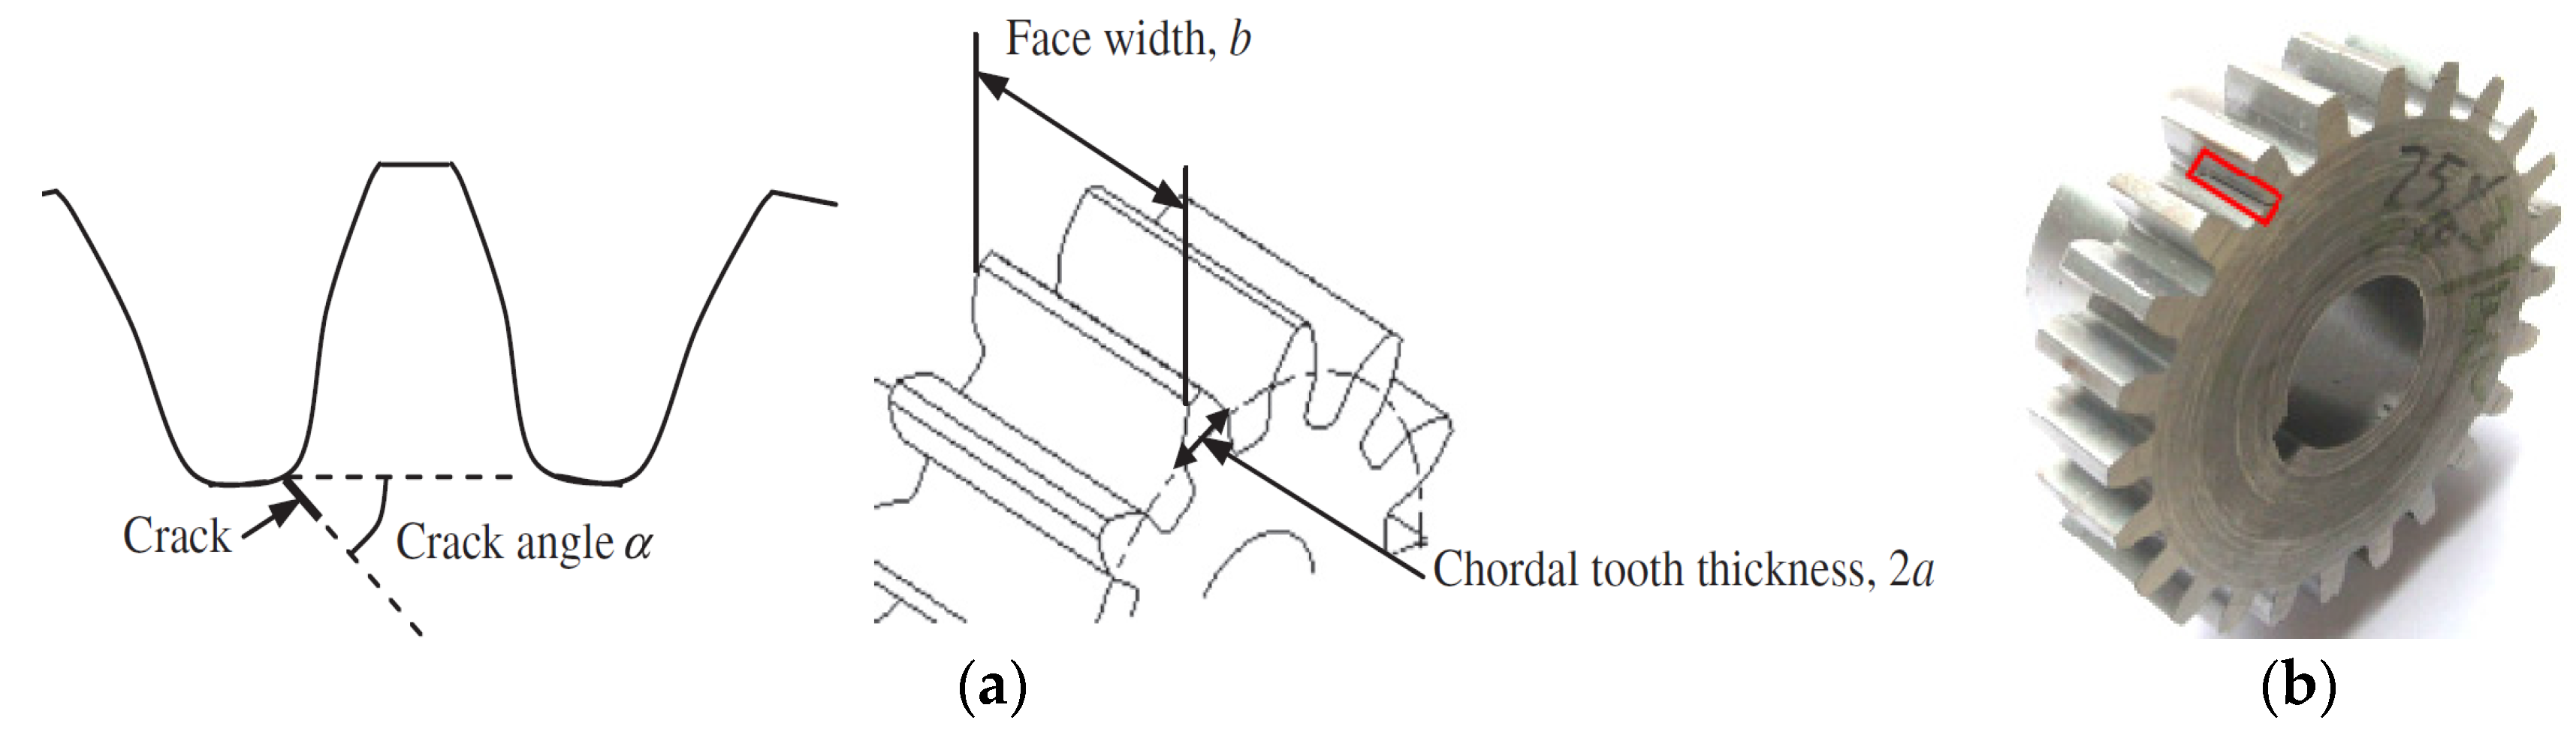
4.2. Gear Experimental Evaluation

A set of gear fault vibration signals was kindly provided by the Reliability Research Lab in the Department of Mechanical Engineering at the University of Alberta [25]. The diagram of the experimental system is displayed in Figure 8 [26,27]. The system included a gearbox, a 3-hp AC motor for driving the gearbox and a magnetic brake for loading. The motor rotating speed was controlled by a speed controller, which allowed the tested gear to operate under various speeds. The load was provided by the magnetic brake connected to the output shaft, and the torque could be adjusted by a brake controller. As shown in Figure 8b, the gearbox was driven by the motor through a timing belt, and there were three shafts inside the gearbox, which were mounted to the gearbox housing by rolling element bearings. Gear 1 on Shaft 1 has 48 teeth and meshes with Gear 2 with 16 teeth. Gear 3 on Shaft 2 has 24 teeth and meshes with Gear 4, which was on the output shaft (Shaft 3) and has 40 teeth. Gear 3 was the tested gear. Gears with different levels of crack faults were simulated in the experimental system. As shown in Figure 9a, α was the crack angle, a one half of the chordal tooth thickness and b the face width. The crack thickness was 0.4 mm in the experiment based on the measurement of the thinnest knife of the machine tools in the lab.
In this study, we employed the gear with 75% crack level as shown in Figure 9b. The vibration was measured at 2200 RPM with the sampling frequency f s = 12 , 800 Hz . We used two acceleration sensors produced by PCB Electronics with Model Number 352C67. The meshing frequencies are summarized in Table 2 [26]. From the configuration of the gearbox system, the fault characteristic frequency was equal to the rotating frequency of Shaft 2.
f e q = f 2 = 26.1   Hz
The time domain waveform of the experimental vibration signal and its spectrum are illustrated in Figure 10, from which the fault characteristic frequency cannot be identified. The vibration signal was analyzed with the proposed method.
According to the resample criterion presented in Section 3.2, subtract 12-times the maximum frequency with the sampling frequency, and the value of the result is less than the maximum frequency. Therefore, the resample algorithm is unable to be carried out.
f e = f s f r = 12800 12 × 1667 = 7204   Hz 1667   Hz
The results of the decomposition of the vibration signal directly with EEMD are shown in Figure 11a. The IMF2 was selected for further analysis because it had the biggest kurtosis value compared with the other IMFs. HSD was applied on IMF2, and the obtained demodulation spectrum is shown in Figure 11b. It was found that the identified frequency component matched the gear fault characteristic frequency f e q = 26.1   Hz accurately.

5. Discussion and Conclusions

In order to detect gearbox faults of wind turbines as early as possible, we proposed a novel fault diagnosis method based on improved EEMD and HSD. Firstly, the frequency components of the raw vibration signal were calculated to determine whether a resample was needed. In order to increase the accuracy of EEMD, a resampling criterion for the raw signal was developed. Secondly, a raw signal or resample signal was decomposed into several IMFs using improved EEMD. Then, using the IMF with the highest kurtosis value, the fault feature was selected for demodulation by the Hilbert square demodulation technique. Finally spectrum analysis was applied and fault information obtained. Experimental studies have demonstrated the effectiveness of the proposed method in fault diagnosis for the gear and bearing of the wind turbine gearbox.

Acknowledgments

This work is supported by the National Natural Science Foundation of China (Grant No. 51475432), the Zhejiang Provincial National Natural Science Foundation of China (Grant No. 2013C24005) and the Key Program for International S&T Cooperation Projects of China (Grant No. 2015DFA71400).

Author Contributions

H.C. and W.C. designed experiment verification and validation schemes. P.C. and J.W. gathered experimental data and analyzed experimental results. P.C., H.C., C.W. and J.L. Studied the signal processing method. H.C. and P.C. wrote the manuscript.

Conflicts of Interest

The authors declare no conflict of interest.

References

  1. Song, G.; Li, H.; Gajic, B.; Zhou, W.; Chen, P.; Gu, H. Wind turbine blade health monitoring with piezoceramic-based wireless sensor network. Int. J. Smart Nano Mater. 2013, 4, 150–166. [Google Scholar] [CrossRef]
  2. Antoniadou, I.; Manson, G.; Staszewski, W.J.; Barszcz, T.; Worden, K. A time-frequency analysis approach for condition monitoring of a wind turbine gearbox under varying load conditions. Mech. Syst. Signal Process. 2015, 64, 188–216. [Google Scholar] [CrossRef]
  3. Zheng, J.; Cheng, J.; Yang, Y. Generalized empirical mode decomposition and its applications to rolling element bearing fault diagnosis. Mech. Syst. Signal Process. 2013, 40, 136–153. [Google Scholar] [CrossRef]
  4. Lei, Y.G.; He, Z.J.; Yanyang, Z.; Chen, X. New clustering algorithm-based fault diagnosis using compensation distance evaluation technique. Mech. Syst. Signal Process. 2008, 22, 419–435. [Google Scholar] [CrossRef]
  5. Nikolaou, N.; Antoniadis, I. Rolling element bearing fault diagnosis using wavelet packets. NDT & E Int. 2002, 35, 197–205. [Google Scholar]
  6. Zhang, L.; Wang, C.; Song, G. Health Status Monitoring of Cuplock Scaffold Joint Connection Based on Wavelet Packet Analysis. Shock Vib. 2015, 2015, 1–7. [Google Scholar] [CrossRef]
  7. Wang, Z.; Lu, C.; Wang, Z.; Ma, J. Health assessment of rotary machinery based on integrated feature selection and Gaussian mixed model. J. Vibroeng. 2014, 16, 1753–1762. [Google Scholar]
  8. Lu, C.; Hu, J.; Liu, H. Application of EMD-AR and MTS for hydraulic pump fault diagnosis. J. Vibroeng. 2013, 15, 761–772. [Google Scholar]
  9. Lu, C.; Yuan, H.; Tang, Y. Bearing performance degradation assessment and prediction based on EMD and PCA-SOM. J. Vibroeng. 2014, 16, 1387–1396. [Google Scholar]
  10. He, Q.; Feng, Z.; Kong, F. Detection of signal transients using independent component analysis and its application in gearbox condition monitoring. Mech. Syst. Signal Process. 2007, 21, 2056–2071. [Google Scholar] [CrossRef]
  11. Wang, J.; Gao, R.X.; Yan, R.Q.; Wang, L. An integrative computational method for gearbox diagnosis. Procedia CIRP 2013, 12, 133–138. [Google Scholar] [CrossRef]
  12. Koizumi, T.; Tsujiuchi, N.; Matsumura, Y. Diagnosis with the correlation integral in time domain. Mech. Syst. Signal Process. 2000, 14, 1003–1010. [Google Scholar] [CrossRef]
  13. Liang, X.H.; Zuo, M.J.; Hoseini, M.R. Vibration signal modeling of a planetary gear set for tooth crack detection. Eng. Fail. Anal. 2015, 48, 185–200. [Google Scholar] [CrossRef]
  14. Amirat, Y.; Choqueuse, V.; Benbouzid, M. EEMD-based wind turbine bearing failure detection using the generator stator current homopolar component. Mech. Syst. Signal Process. 2013, 41, 667–678. [Google Scholar] [CrossRef] [Green Version]
  15. Wu, Z.; Huang, N.E. Ensemble empirical mode decomposition: A noise assisted data analysis method. Adv. Adapt. Data Anal. 2009, 1, 1–14. [Google Scholar] [CrossRef]
  16. Zhang, J.; Yan, R.; Gao, R.; Feng, Z. Performance enhancement of Ensemble Empirical Mode Decomposition. Mech. Syst. Signal Process. 2010, 24, 2104–2123. [Google Scholar] [CrossRef]
  17. Huang, N.E.; Shen, Z.; Long, S.R.; Wu, M.C.; Shih, H.H.; Zheng, Q.; Yen, N.-C.; Tung, C.C.; Liu, H.H. The Empirical Mode Decomposition and the Hilbert Spectrum for Nonlinear and Non-stationary Time Series Analysis. R. Soc. Lond. Proc. 1998, 454, 903–995. [Google Scholar] [CrossRef]
  18. Stevenson, N.; Mesbah, M.; Boashash, B. A sampling limit for the empirical mode decomposition. In Proceedings of the 8th International Symposium on Signal Processing and its Applications, Sydney, Australia, 28–31 August 2005; pp. 647–650.
  19. Wang, H.; Chen, J.; Dong, G. Feature extraction of rolling bearing’s early weak fault based on EEMD and tunable Q-factor wavelet transform. Mech. Syst. Signal Process. 2014, 48, 103–119. [Google Scholar] [CrossRef]
  20. Stack, J.R.; Harley, R.G.; Habetler, T.G. An amplitude modulation detector for fault diagnosis in rolling element bearings. IEEE Trans. Ind. Electron. 2004, 51, 1097–1102. [Google Scholar] [CrossRef]
  21. Zhang, X.; Liang, Y.; Zhou, J. A novel bearing fault diagnosis model integrated permutation entropy, ensemble empirical mode decomposition and optimized SVM. Measurement 2015, 69, 164–179. [Google Scholar] [CrossRef]
  22. Yu, X.; Ding, E.; Chen, C.; Liu, X.; Li, L. A Novel Characteristic Frequency Bands Extraction Method for Automatic Bearing Fault Diagnosis Based on Hilbert Huang Transform. Sensors 2015, 15, 27869–27893. [Google Scholar] [CrossRef] [PubMed]
  23. Bedrosian, E. A product theorem for Hilbert transform. Proc. IEEE 1963, 51, 868–869. [Google Scholar] [CrossRef]
  24. Case Western Reserve University Bearing Data Center Website. Available online: http://csegroups.case.edu/bearingdatacenter/home (accessed on 25 December 2015).
  25. Reliability Research Lab. Available online: http://www.mece.ualberta.ca/groups/reliability/index.html (accessed on 28 December 2015).
  26. Lei, Y.; Zuo, M.J. Gear crack level identification based on weighted K nearest neighbor classification algorithm. Mech. Syst. Signal Process. 2009, 23, 1535–1547. [Google Scholar] [CrossRef]
  27. Lei, Y.; Zuo, M.J.; He, Z.; Zi, Y. A multidimensional hybrid intelligent method for gear fault diagnosis. Expert Syst. Appl. 2010, 37, 1419–1430. [Google Scholar] [CrossRef]
Figure 1. Simulated signal and its components. (a) Waveform of the simulated signal; (b) its spectrum; (c) source components of the simulated signal.
Applsci 07 00128 g001aApplsci 07 00128 g001b
Figure 2. The effect of sampling on ensemble empirical mode decomposition (EEMD) performance. ISO, successive IMF orthogonality; RE, residual energy; IC, IMF coherence.
Applsci 07 00128 g002
Figure 3. EEMD decomposition result with different sampling frequencies. (a) Decomposition result of EEMD with a sampling frequency of 9450 Hz; (b) decomposition result of EEMD with a sampling frequency of 14,100 Hz.
Applsci 07 00128 g003
Figure 4. The flow chart of the proposed method. HSD, Hilbert square demodulation.
Applsci 07 00128 g004
Figure 5. Bearing test rig.
Applsci 07 00128 g005
Figure 6. Experimental bearing vibration signal and its spectrum. (a) Experimental bearing vibration signal; (b) spectrum of the bearing vibration signal.
Applsci 07 00128 g006
Figure 7. The decomposition results of vibration with improved EEMD and the spectrum of the demodulated signal. (a) The decomposition results of vibration with improved EEMD; (b) the spectrum of the demodulated signal.
Applsci 07 00128 g007aApplsci 07 00128 g007b
Figure 8. Gear test rig. (a) Experimental system; (b) diagram of the system.
Applsci 07 00128 g008aApplsci 07 00128 g008b
Figure 9. Gear crack angle, face width and chordal tooth thickness and experiment fault gear. (a) Crack angle, face width and chordal tooth thickness of a gear; (b) 75% level crack in the gear.
Applsci 07 00128 g009
Figure 10. Gear experimental vibration signal and its spectrum. (a) Gear experimental vibration signal; (b) spectrum of gear vibration signal.
Applsci 07 00128 g010
Figure 11. The decomposition results of vibration with improved EEMD and spectrum of the demodulated signal. (a) The decomposition results of vibration with improved EEMD; (b) the spectrum of the demodulated signal.
Applsci 07 00128 g011aApplsci 07 00128 g011b
Table 1. Coefficient of drive end bearing: 6205-2RS JEM SKF, deep groove ball bearing.
Inner RingOuter RingCage TrainRolling Element
5.41523.58480.398284.7135
Table 2. Motor speed and characteristic frequencies of the gearbox.
Motor Speed (RPM)f1 (Hz)f12 (Hz)f2 (Hz)f34 (Hz)f3 (Hz)
22008.73418.8926.19628.5615.72
Note: f1, f2 and f3 are the rotating frequencies of Shaft 1, Shaft 2 and Shaft 3, respectively. f12 and f34 are the meshing frequencies of Gears 1 and 2 and Gears 3 and 4, respectively.

