1. Introduction
Titanium has good mechanical properties in high temperatures, good corrosion resistance and low weight rate. Generally, titanium is alloyed with elements such as Al, V, Mn, Sn, Zr, Mo, etc. [
1]. In this way, many titanium alloys—Ti-6Al-4V, Ti-5Al-2.5Sn, Ti-6Al-2Sn-4Zr-2Mo, etc. are manufactured for different engineering applications. Ti-6Al-4V is used for rings, fasteners, airframes, vessels, biomedical implants, forging, and hubs; Ti-5Al-2.5Sn is used in gas turbine engines, aerospace structures, and chemical processing equipment; and Ti-6Al-2Sn-4Zr-2Mo is used jet engines, automotive valves, blades, and discs.
Mechanical and thermal properties of Ti-6242S alloy are lower than other titanium alloys. Therefore, this alloy is preferred many industrial areas. However, there are difficulties encountered in the machining of Ti-6242S [
2]. Excessive heat and tool wear due to especially low thermal properties of this alloy have occurred. Cutting forces are increased due to high mechanical properties and excessive tool wear. This also leads to an increase in vibration. In this case, the quality of the machined surface is deteriorates. Many studies of the turning, milling, and drilling of titanium alloys have been conducted in order to address this problem. However, many of the studies are related to machinability of Ti-6Al-4V alloy. Ti-6242S alloy is the second most-used as second titanium alloys after Ti-6Al-4V alloy. Ginting and Nouari [
3] made an experimental study with milling of Ti-6242S to determine optimal cutting parameters. In the experiments, they investigated the effect of different cutting speeds and feed rates on tool wear, metal removal rate, and temperature using cemented carbide tools. They emphasized that the increase of tool wear and the decrease of tool life with increasing of cutting speed and feed rate. Lebaal et al. [
4] studied a new optimization approach based on Kriging interpolation and sequential quadratic programming algorithm for end milling of Ti-6242S using coated and uncoated Chemical Vapour Deposition (CVD) tools. They reported that the surface roughness increased with increasing depth of cut and feed rate. The lowest surface roughness was obtained from minimum cutting speed. Ginting et al. [
5] investigated the performance of cutting tools in green machining of Ti-6242S. They researched the tool life, tool wear types, and plastic deformation of tools using uncoated and multilayer coated cemented carbide cutting tools.
When considering the literature, it is known that there are many problems in the machinability of titanium and its alloys [
6,
7,
8]. Because of these difficulties, machinability of these alloys was investigated using various modelling and optimization techniques. Pradhan and Bhattacharyya [
9] studied optimization of electro discharge manufacturing (EDM) parameters in micro-EDM of Ti-6Al-4V. They showed that these methods are appropriate with experimental results. Thepsonthi and Ozel [
10] investigated the tool wear in micro-milling of Ti-6Al-4V using Cubic Boron Nitride (CBN) coated tools. Then, they analyzed the experiment results using the DEFORM program. Andriya et al. [
11] modelled the cutting forces in machining of Ti-6Al-4V with TiAlN Physical Vapour Deposition (PVD) coated tools using response surface methodology. Khanna and Davim [
12] studied the machinability of various titanium alloys under different cutting parameters. They optimized the cutting temperatures and cutting forces by means of Taguchi Techniques.
Scientists have used different optimization techniques such as Taguchi Methods (TM), Response Surface Methodology (RSM), Artificial Neural Network (ANN), etc. in machining [
13,
14,
15]. Scientific studies on optimization techniques are on-going in machining. The aim of this study is to find the relationship between cutting parameters—such as cutting speeds, feed rate, and depth of cut—and optimization techniques as RSM and ANN for cutting forces, surface roughness, and tool wear in the milling of Ti-6242S alloy.
2. Experimental Methods
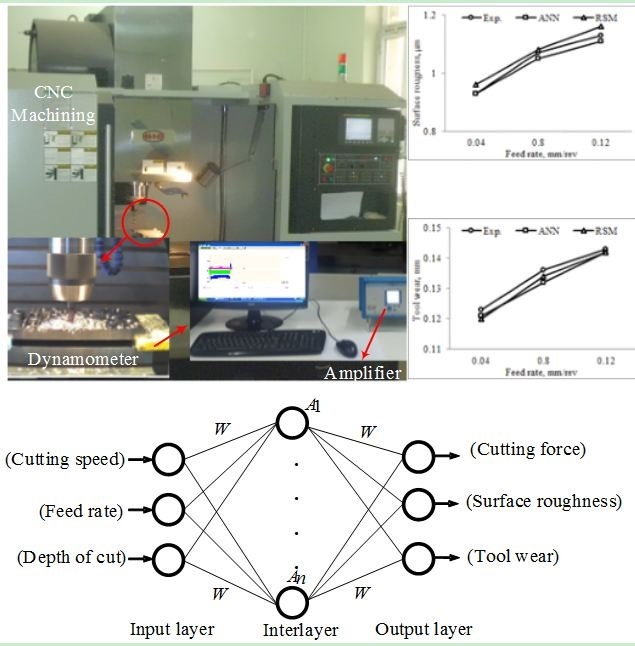
The milling operation was performed in VMC-1000 CNC vertical machining center (Hummer, Taichung, Taiwan) with a spindle power of 15 kW and a maximum speed of 8000 rpm. After the Kistler 9257B dynamometer (Kistler, Winterthur, Switzerland) detected cutting signals, the charge amplifier (Kistler type 5070A) (Kistler, Winterthur, Switzerland) amplified the signals and then, through a data accusation card (sampling rate = 5000 Hz), transmitted to a personal computer to compute the cutting forces. The obtained data were processed in software Kistler DynoWare (Kistler, Winterthur, Switzerland). After experimental work was completed, the surface roughness of the machined surface was measured using Surtonic 3+ surface roughness measuring instrument (Taylor Hobson, Leicester, UK). The diameter of the device probe was 6 mm and the whole system was set at a sampling length of 0.8 mm. The tool wear was determined by using optical microscope. The surface roughness values (
Ra) were taken at four positions. Mechanical and chemical properties of the Ti-6242S alloy are given in
Table 1 and
Table 2, respectively.
The milling experiments of Ti-6242S were carried out at different cutting parameters using WC end mills which have 10 mm diameter. The used cutting parameters are given in
Table 3.
3. Mathematical Modelling and Optimization
The development of computer technology has enabled to optimize of studies of made experimentally using computer programs. Many optimization programs such as ANN, RSM, Taguchi, Fuzzy Logic, Genetic Algorithms, etc. are used in machining manufacturing. ANN and the other is RSM are the most commonly used programs.
3.1. Artificial Neural Network (ANN)
ANN, inspired by biological neurons, was developed to solve engineering problems in 1940 in the USA. Recently, use of ANN has been widespread [
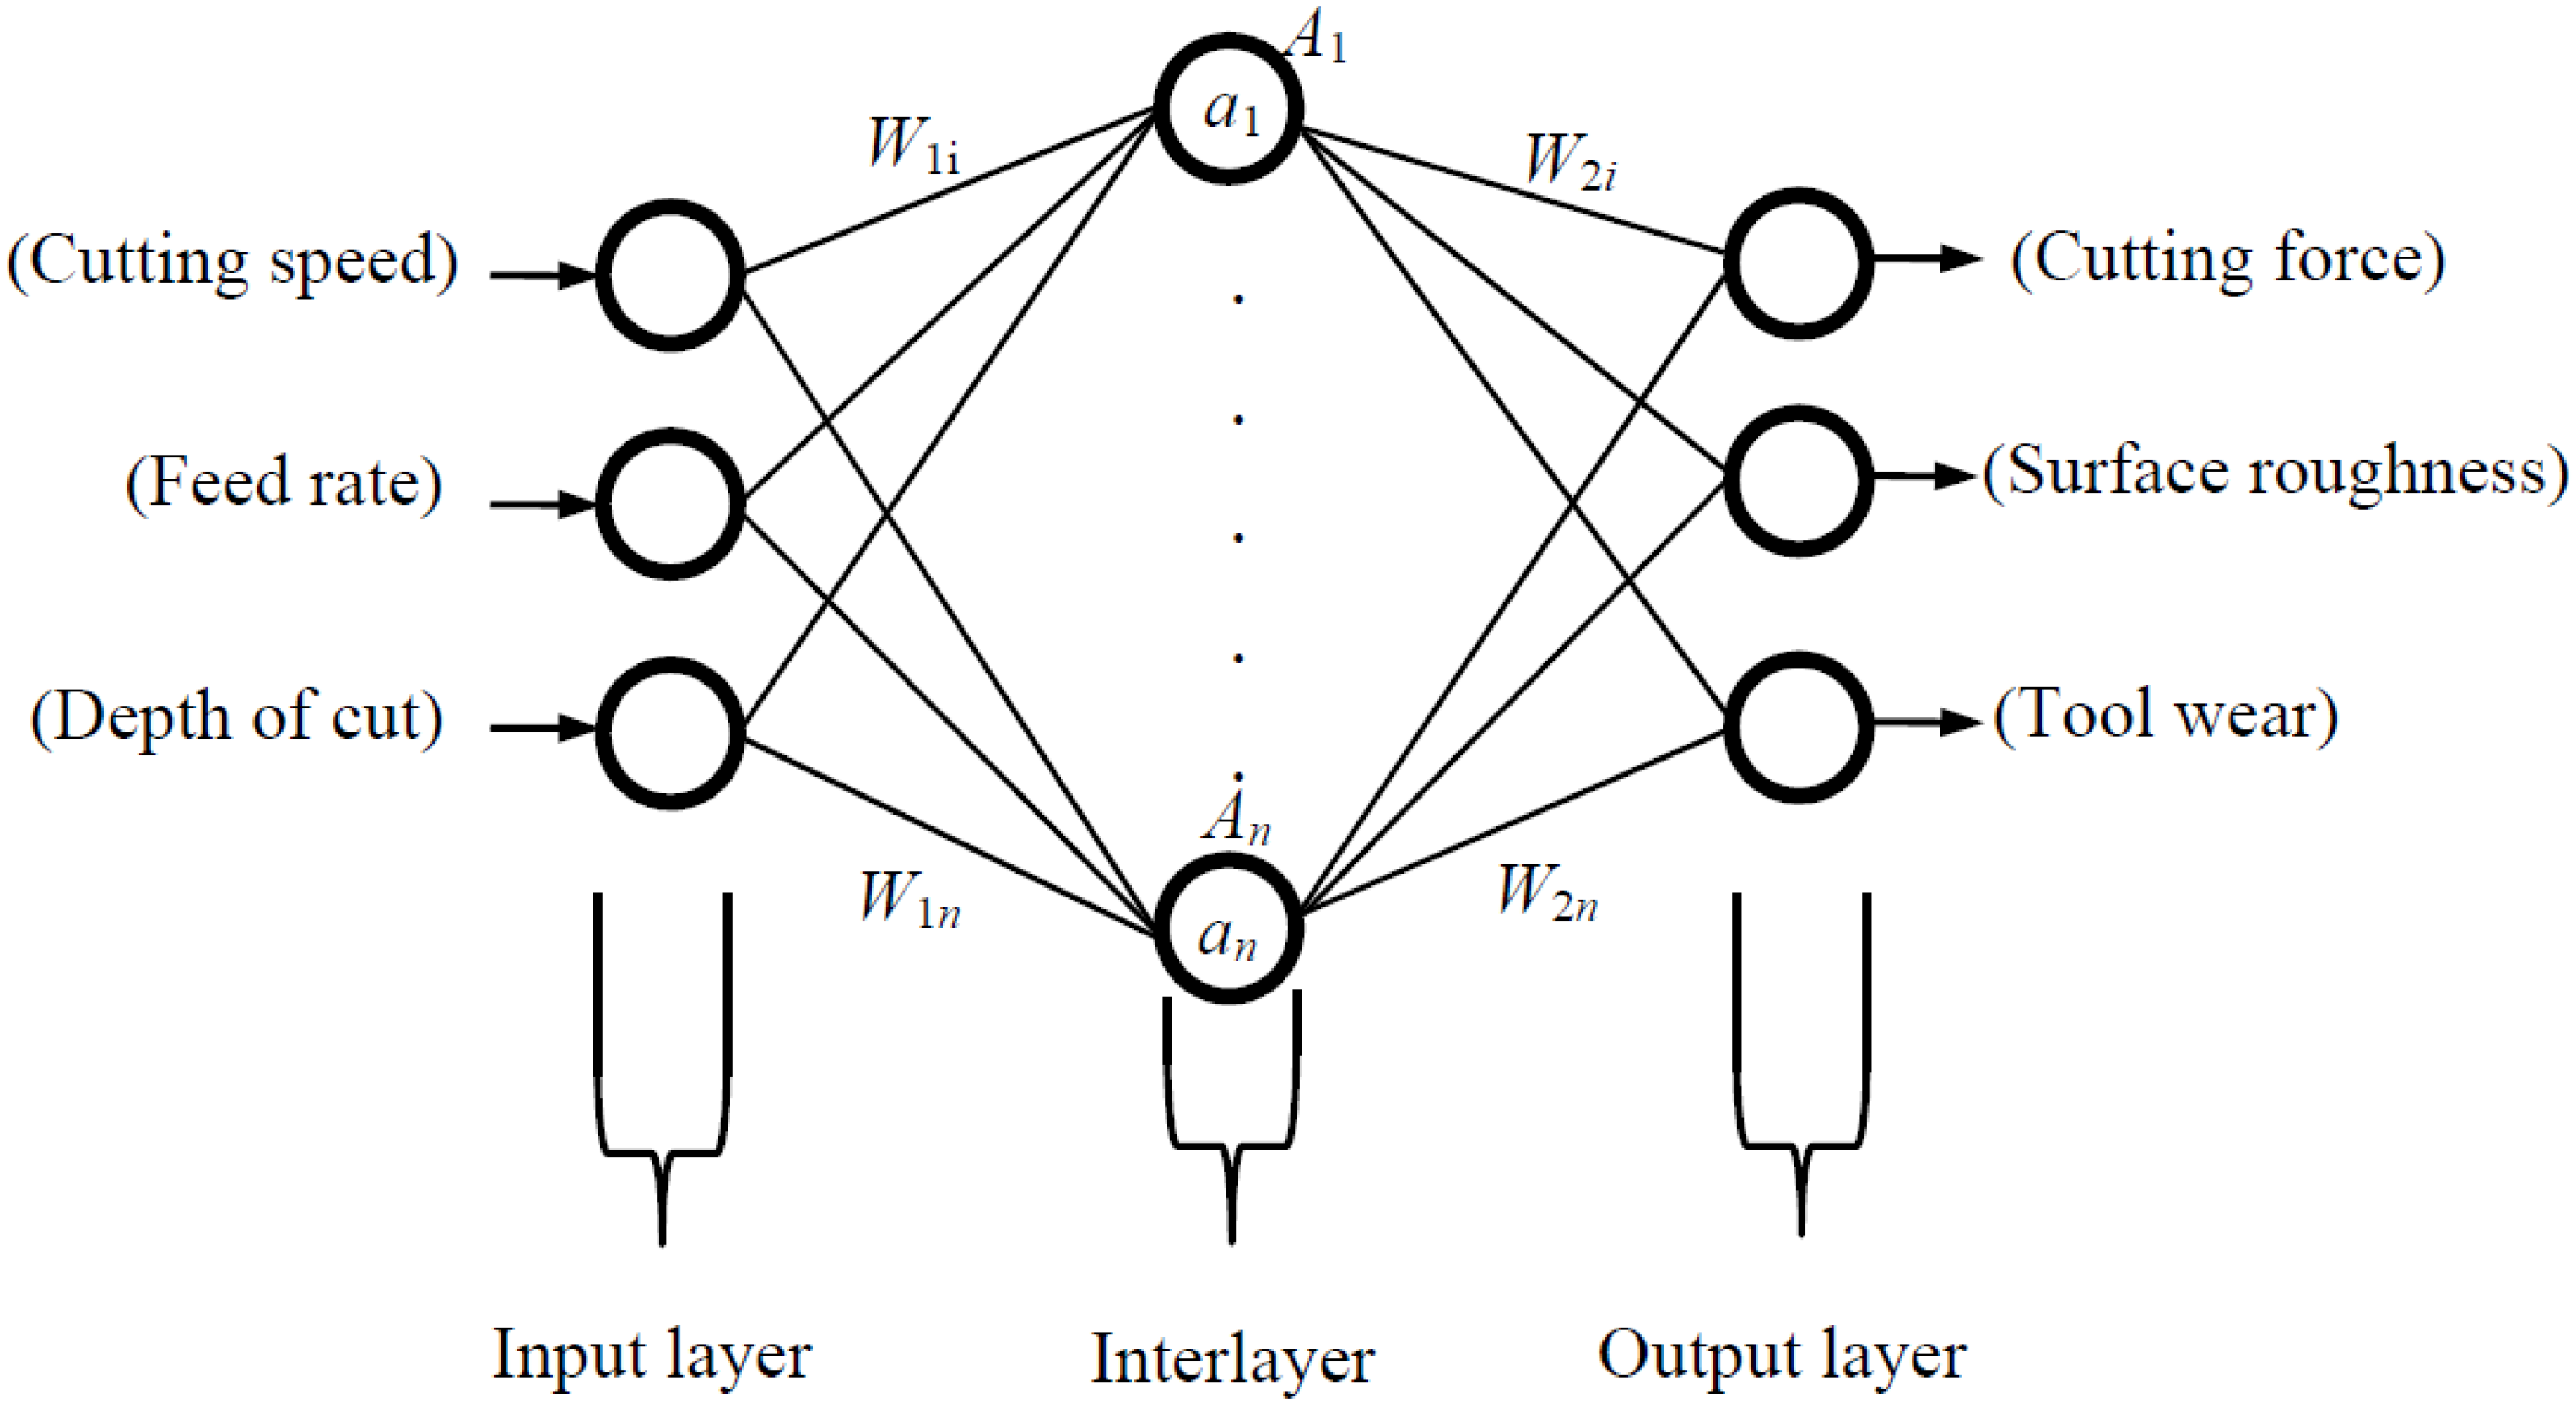
16]. There is input layer, interlayer, and output layer in ANN. These layers are connected with one another. Data obtained from experiments are trained in ANN, so initially randomly selected weights are reached optimum levels. The more parameters the ANN are trained in, the better the results obtained are. The created structure for ANN is given in
Figure 1. The number of cells in interlayer is 10.
The necessary equations for ANN are given below. The sum of input parameters (
Xi) are multiplied with the sum of weights in the interlayer (
W1i). A net value (
ai) was obtained.
This net value was transferred from activation functions (
Ai).
Then, output value (
yi) was found by multiplying activation function and weights (
W2i) between the interlayer and output layer.
when the obtained value was substracted from real value (
di), the error (
ei) was found.
and the total error (
SSE) was calculated.
Train Levenberg Markuad backpropagation was used to adjust weight to the learning algorithms. These systems used the Hessian (
H), Jacobian (
J), and gradient (
g) matrices.
The Hessian matrix,
where
μ and
I were the Marquardt parameter and the unit matrix, respectively.
J’ was the transpose of the Jacobien matrix. The Jacobian matrix,
In the main equation, If all the matrix were replaced, the weight was found.
It was used to 70% training, 15% testing, and 15% validation of the defined parameters from experimental study to ANN. All weights were trained.
3.2. Response Surface Methodology (RSM)
The used RSM in modeling and analyzing of problems consists of statistical techniques and mathematical terminology and it is developed in 1951. Especially, RSM is widely used for the formulation of problems and process optimization. Due to unknown format of actual response function, a suitable approach for true functional relationship between the response and the independent variables must be found [
17]. If the response of the system is a good fit as a linear function of independent variables, it is a model of the first order.
A second-order model may be more appropriate if there is a curvature in the response surface.
where
y is response variable;
β0,
β1,
β2…
βk are unknown regression parameters;
Xi and
Xj are process variables;
e is error term.
The data obtained from experiments was transferred to Box Behnken design in RSM. The highest and lowest value of process variables was defined into system and 17 test results were entered. The other 10 tests were used to determine the validity of the produced equations. Then RSM produced optimum results of experiments depending on machining parameters.
4. Results and Discussion
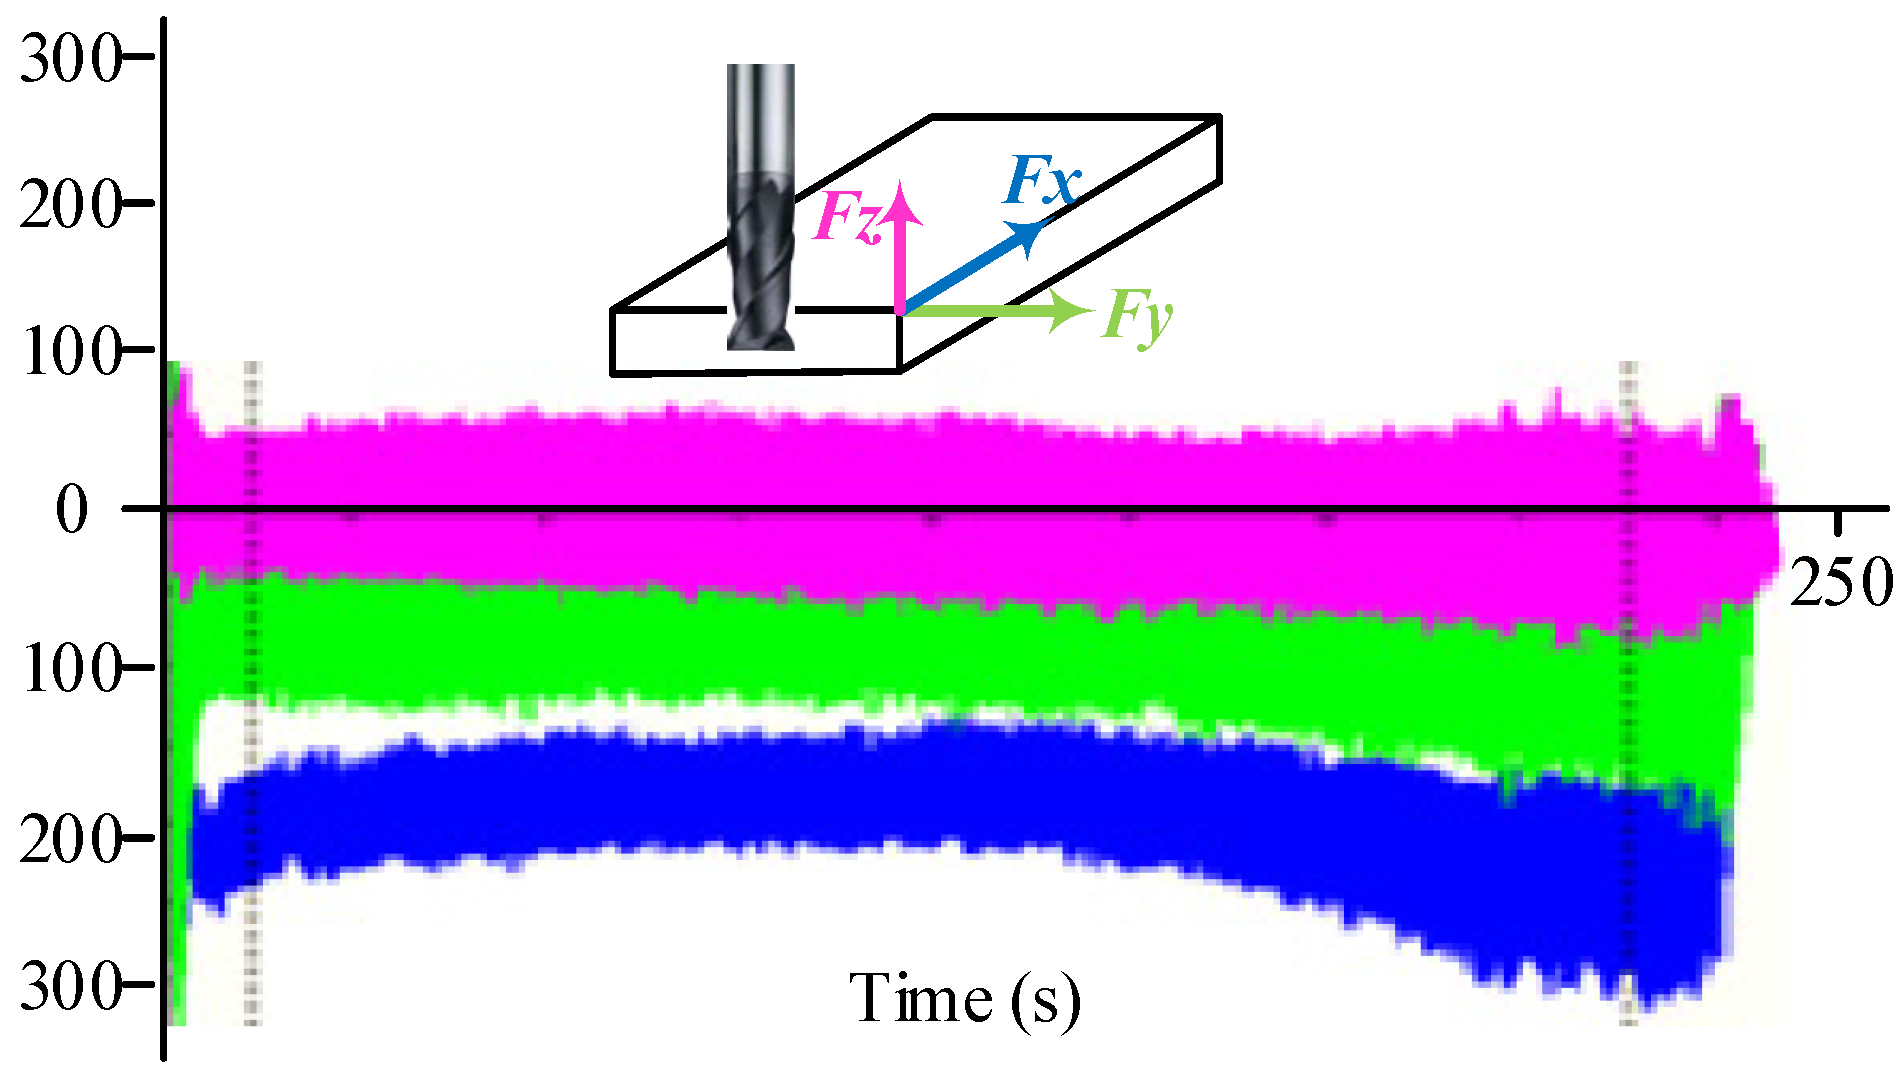
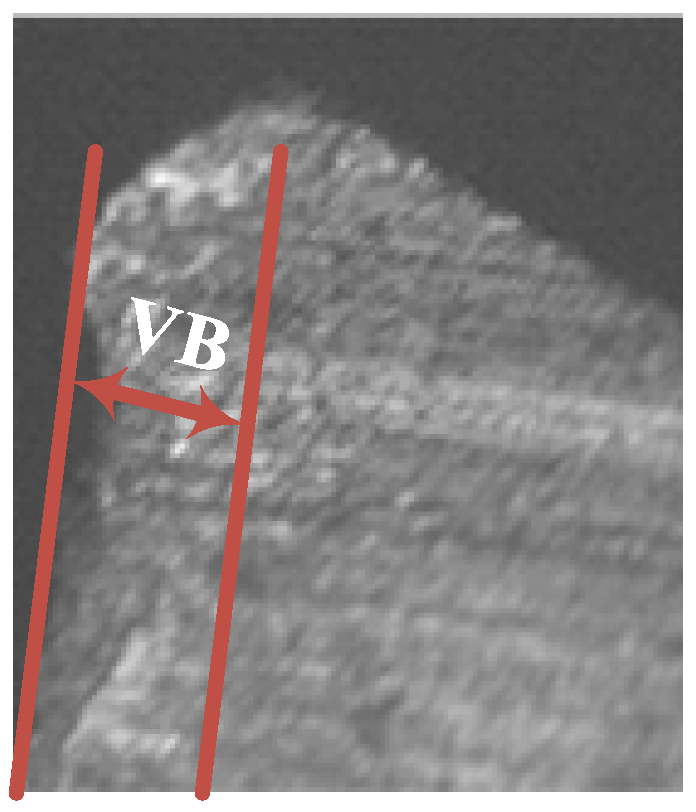
Cutting force, surface roughness, and tool wear in the milling of Ti-6242S were investigated by using different cutting parameters. The cutting force diagram obtained from Kistler DynoWare was given in
Figure 2 and the tool wear (VB) was given in
Figure 3 for the 15 m/min cutting speed, 0.08 mm/rev feed rate, and 1.5 mm depth of cut.
The cutting force was calculated by using Equation (13).
Cutting forces, tool wear, and surface roughness values were experimentally determined for all cutting parameters. The predicted values were obtained from ANN and RSM using the experimental results. Optimum weights depending on training of ANN were found by Equations (1)–(10). Then these optimum weights were written in Equations (1)–(3). Thus, the estimated cutting parameters were calculated. Mathematical models related to cutting force, surface roughness, and tool wear were produced by Equation (11) or Equation (12) in RSM. These are given in Equations (14)–(16).
where
F is cutting force,
Ra is surface roughness,
VB is tool wear,
V is cutting speed,
f is feed rate, and
a is depth of cut.
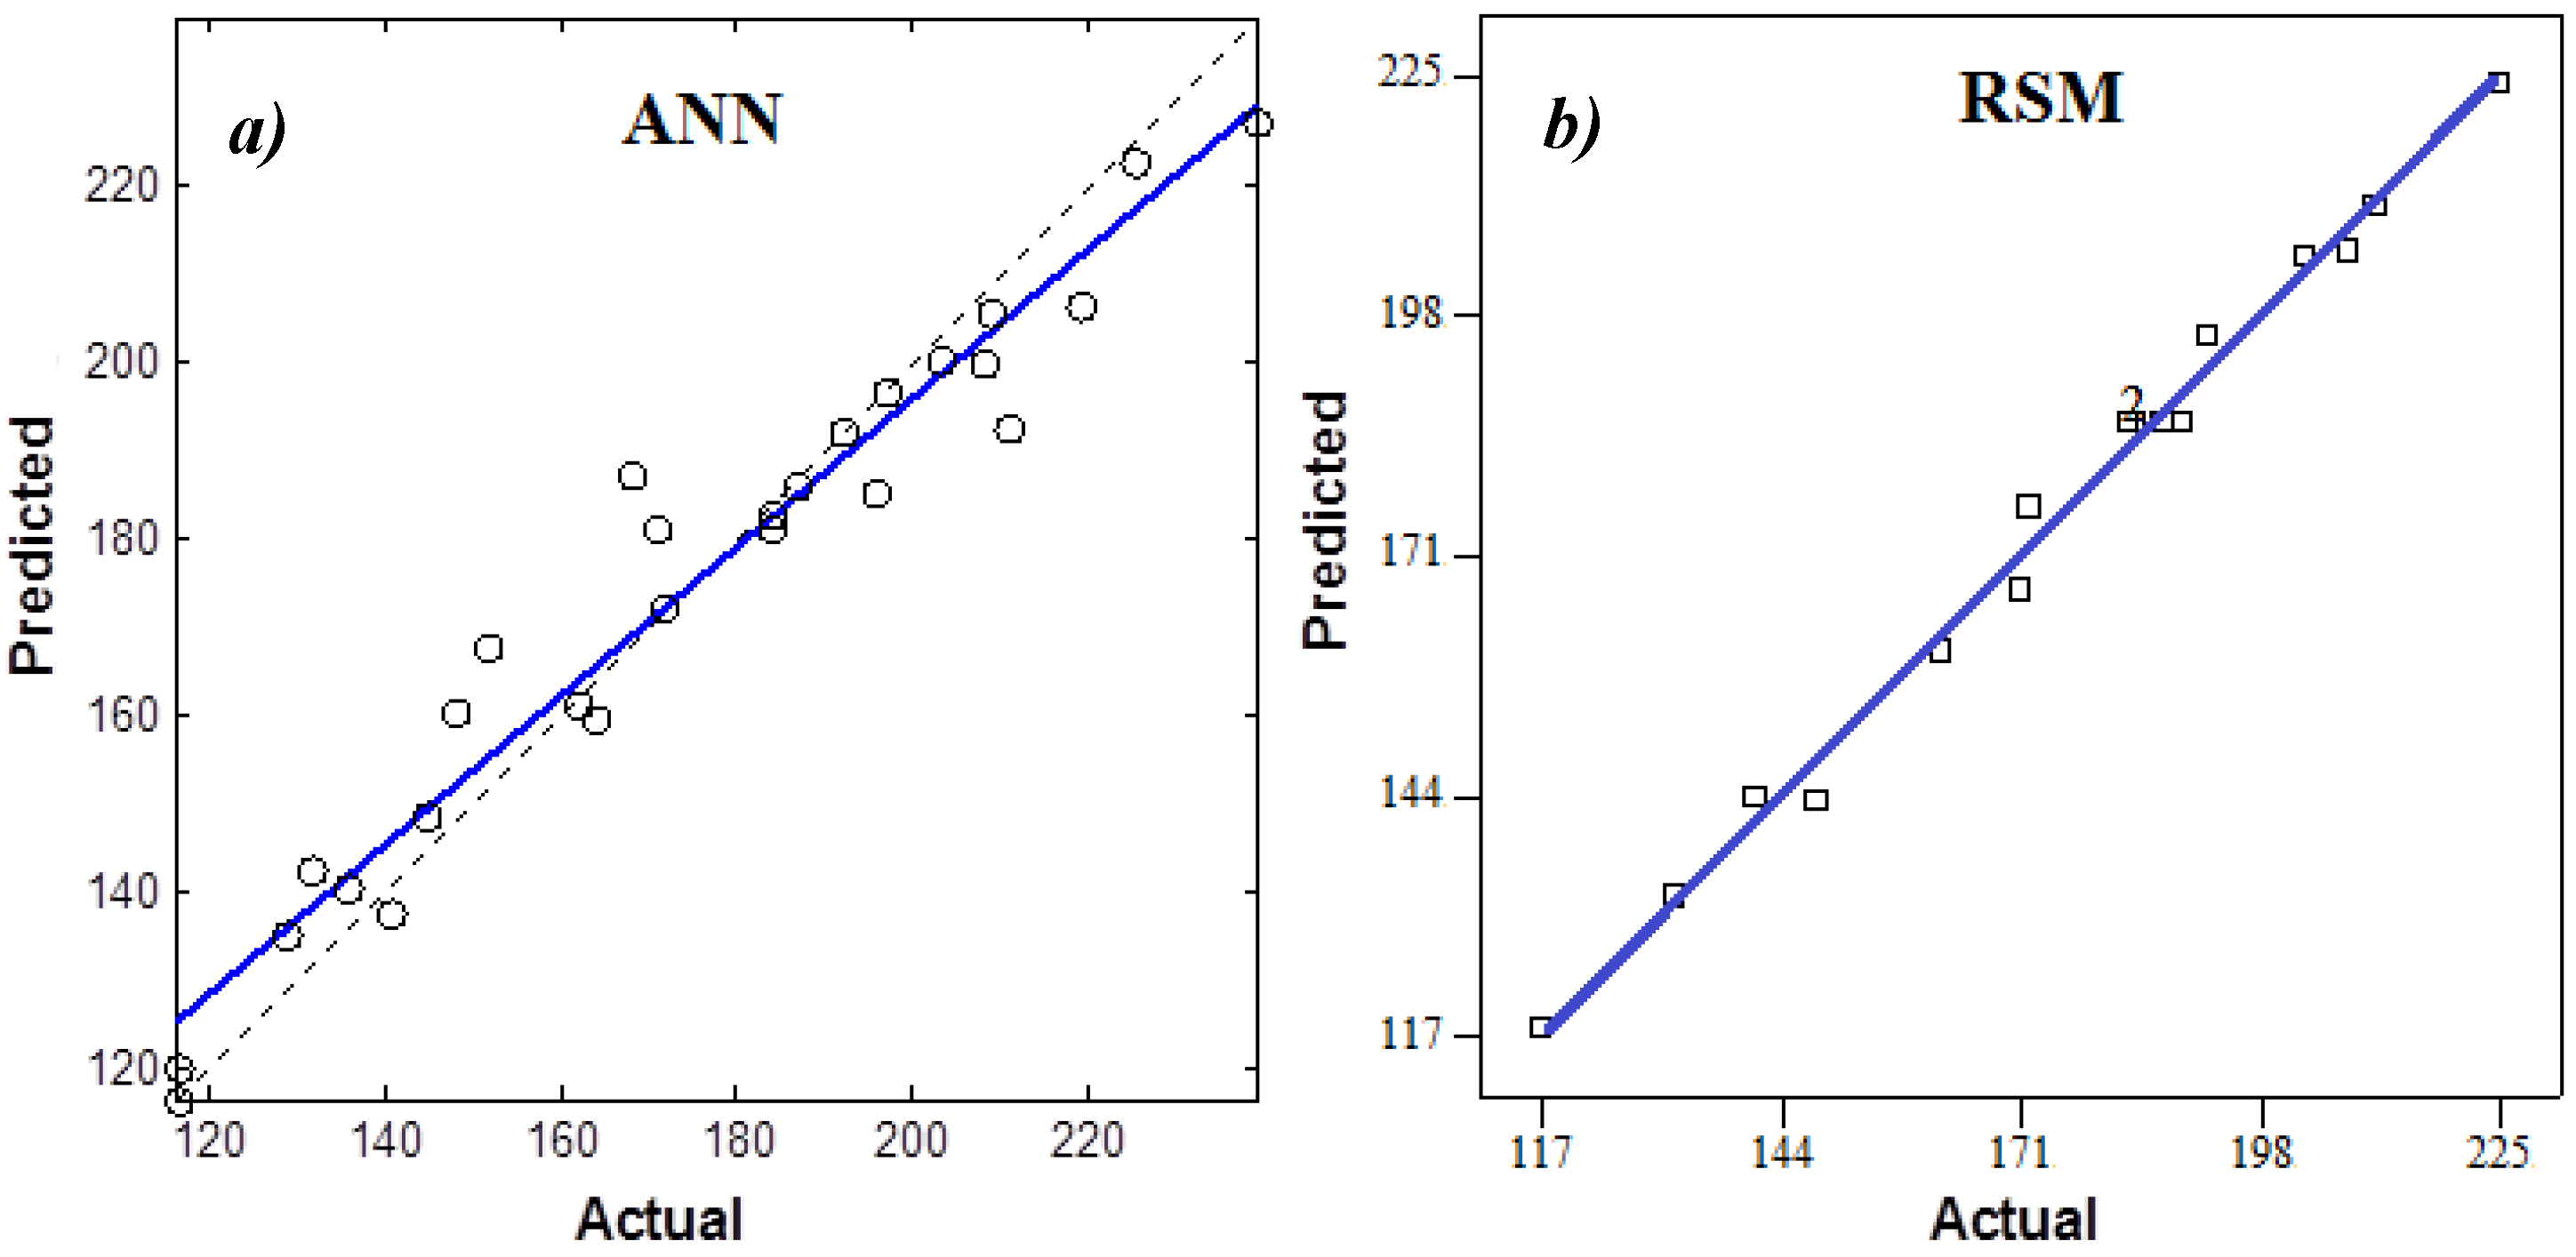
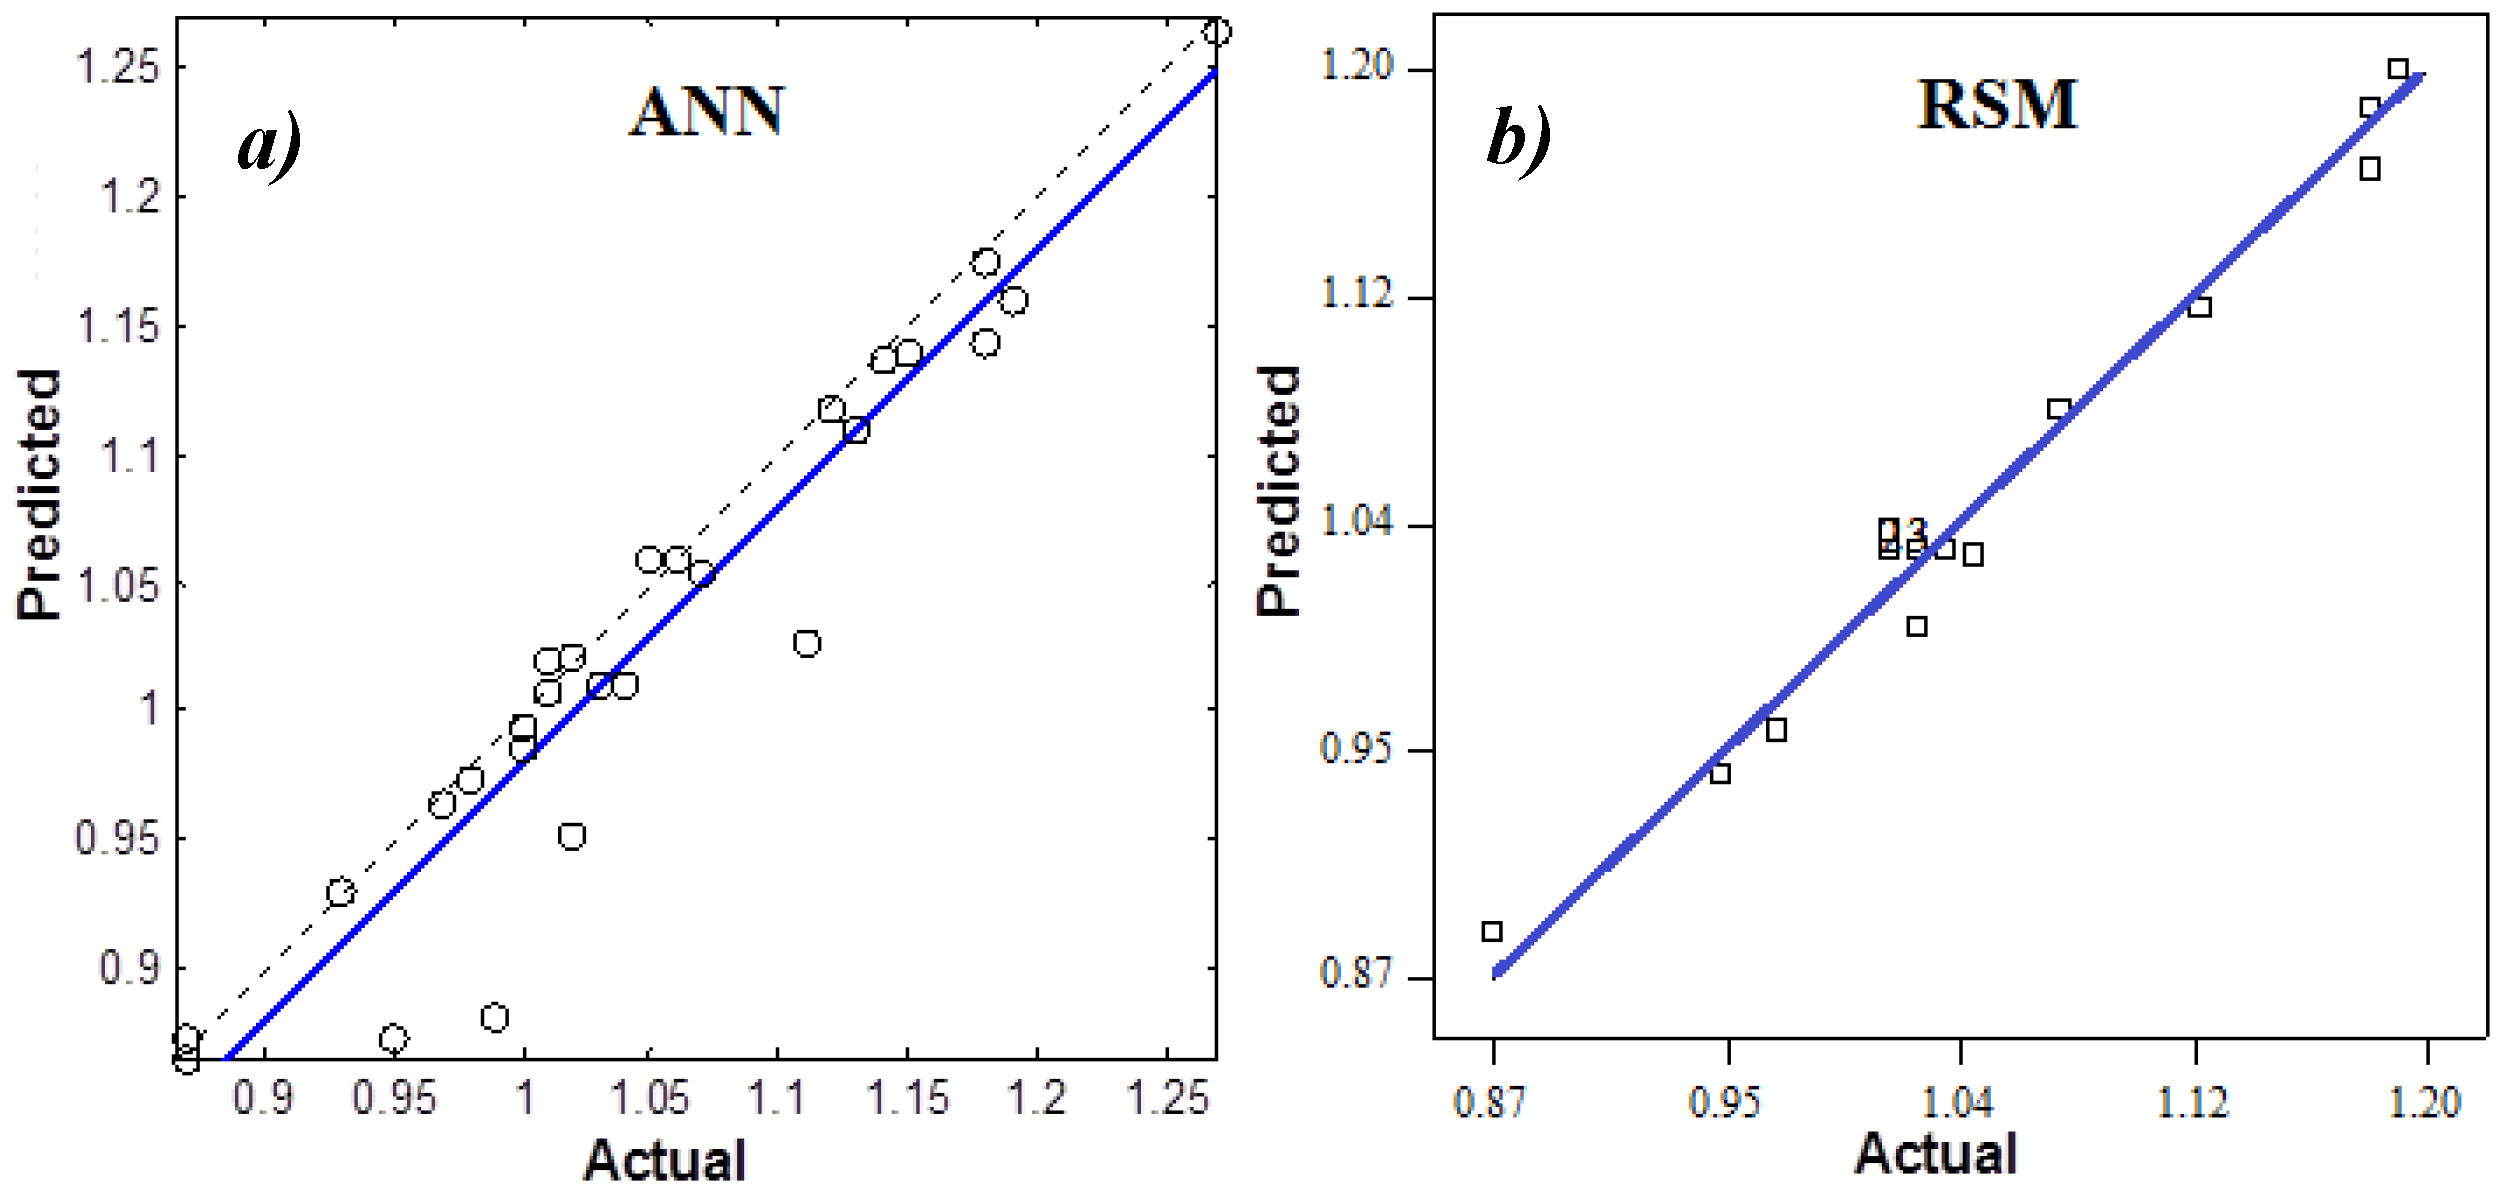
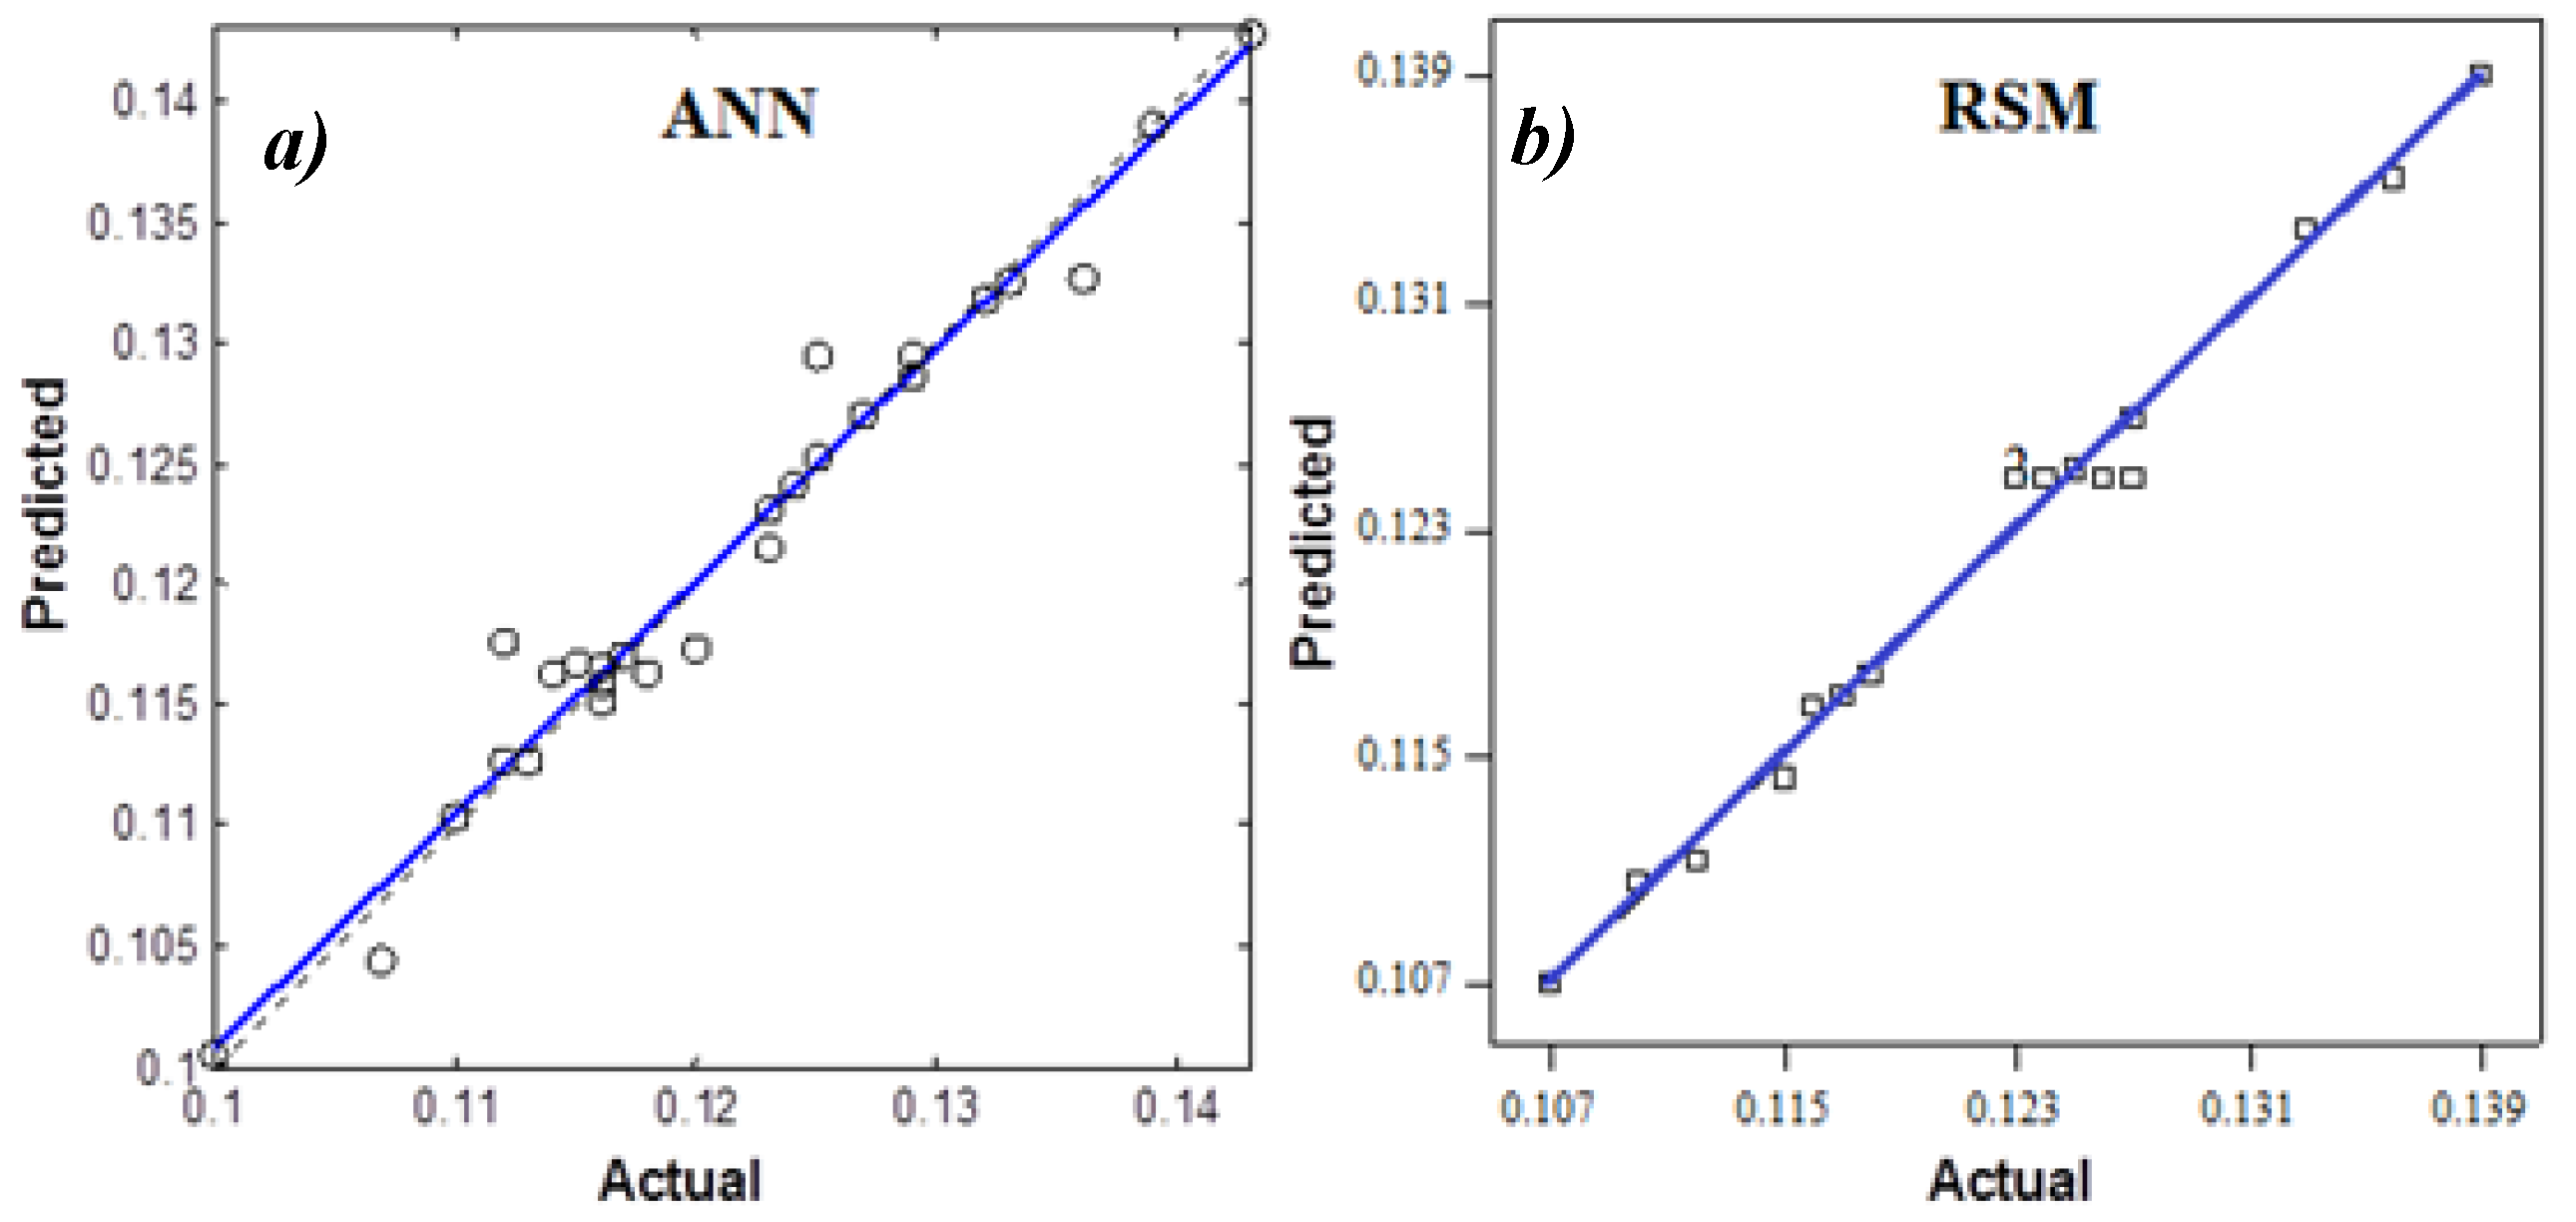
The predicted values obtained from ANN and RSM together with experimental results are given in
Table 4. Predicted and actual values of cutting force, surface roughness, and tool wear are given in
Figure 4,
Figure 5 and
Figure 6, respectively.
When the cutting force, surface roughness, and tool wear were examined in
Figure 4,
Figure 5 and
Figure 6, it was seen that predicted and actual values was close to the absolute line for ANN and RSM. The results of experimental were compared to the results of ANN and RSM for cutting force, surface roughness, and tool wear in
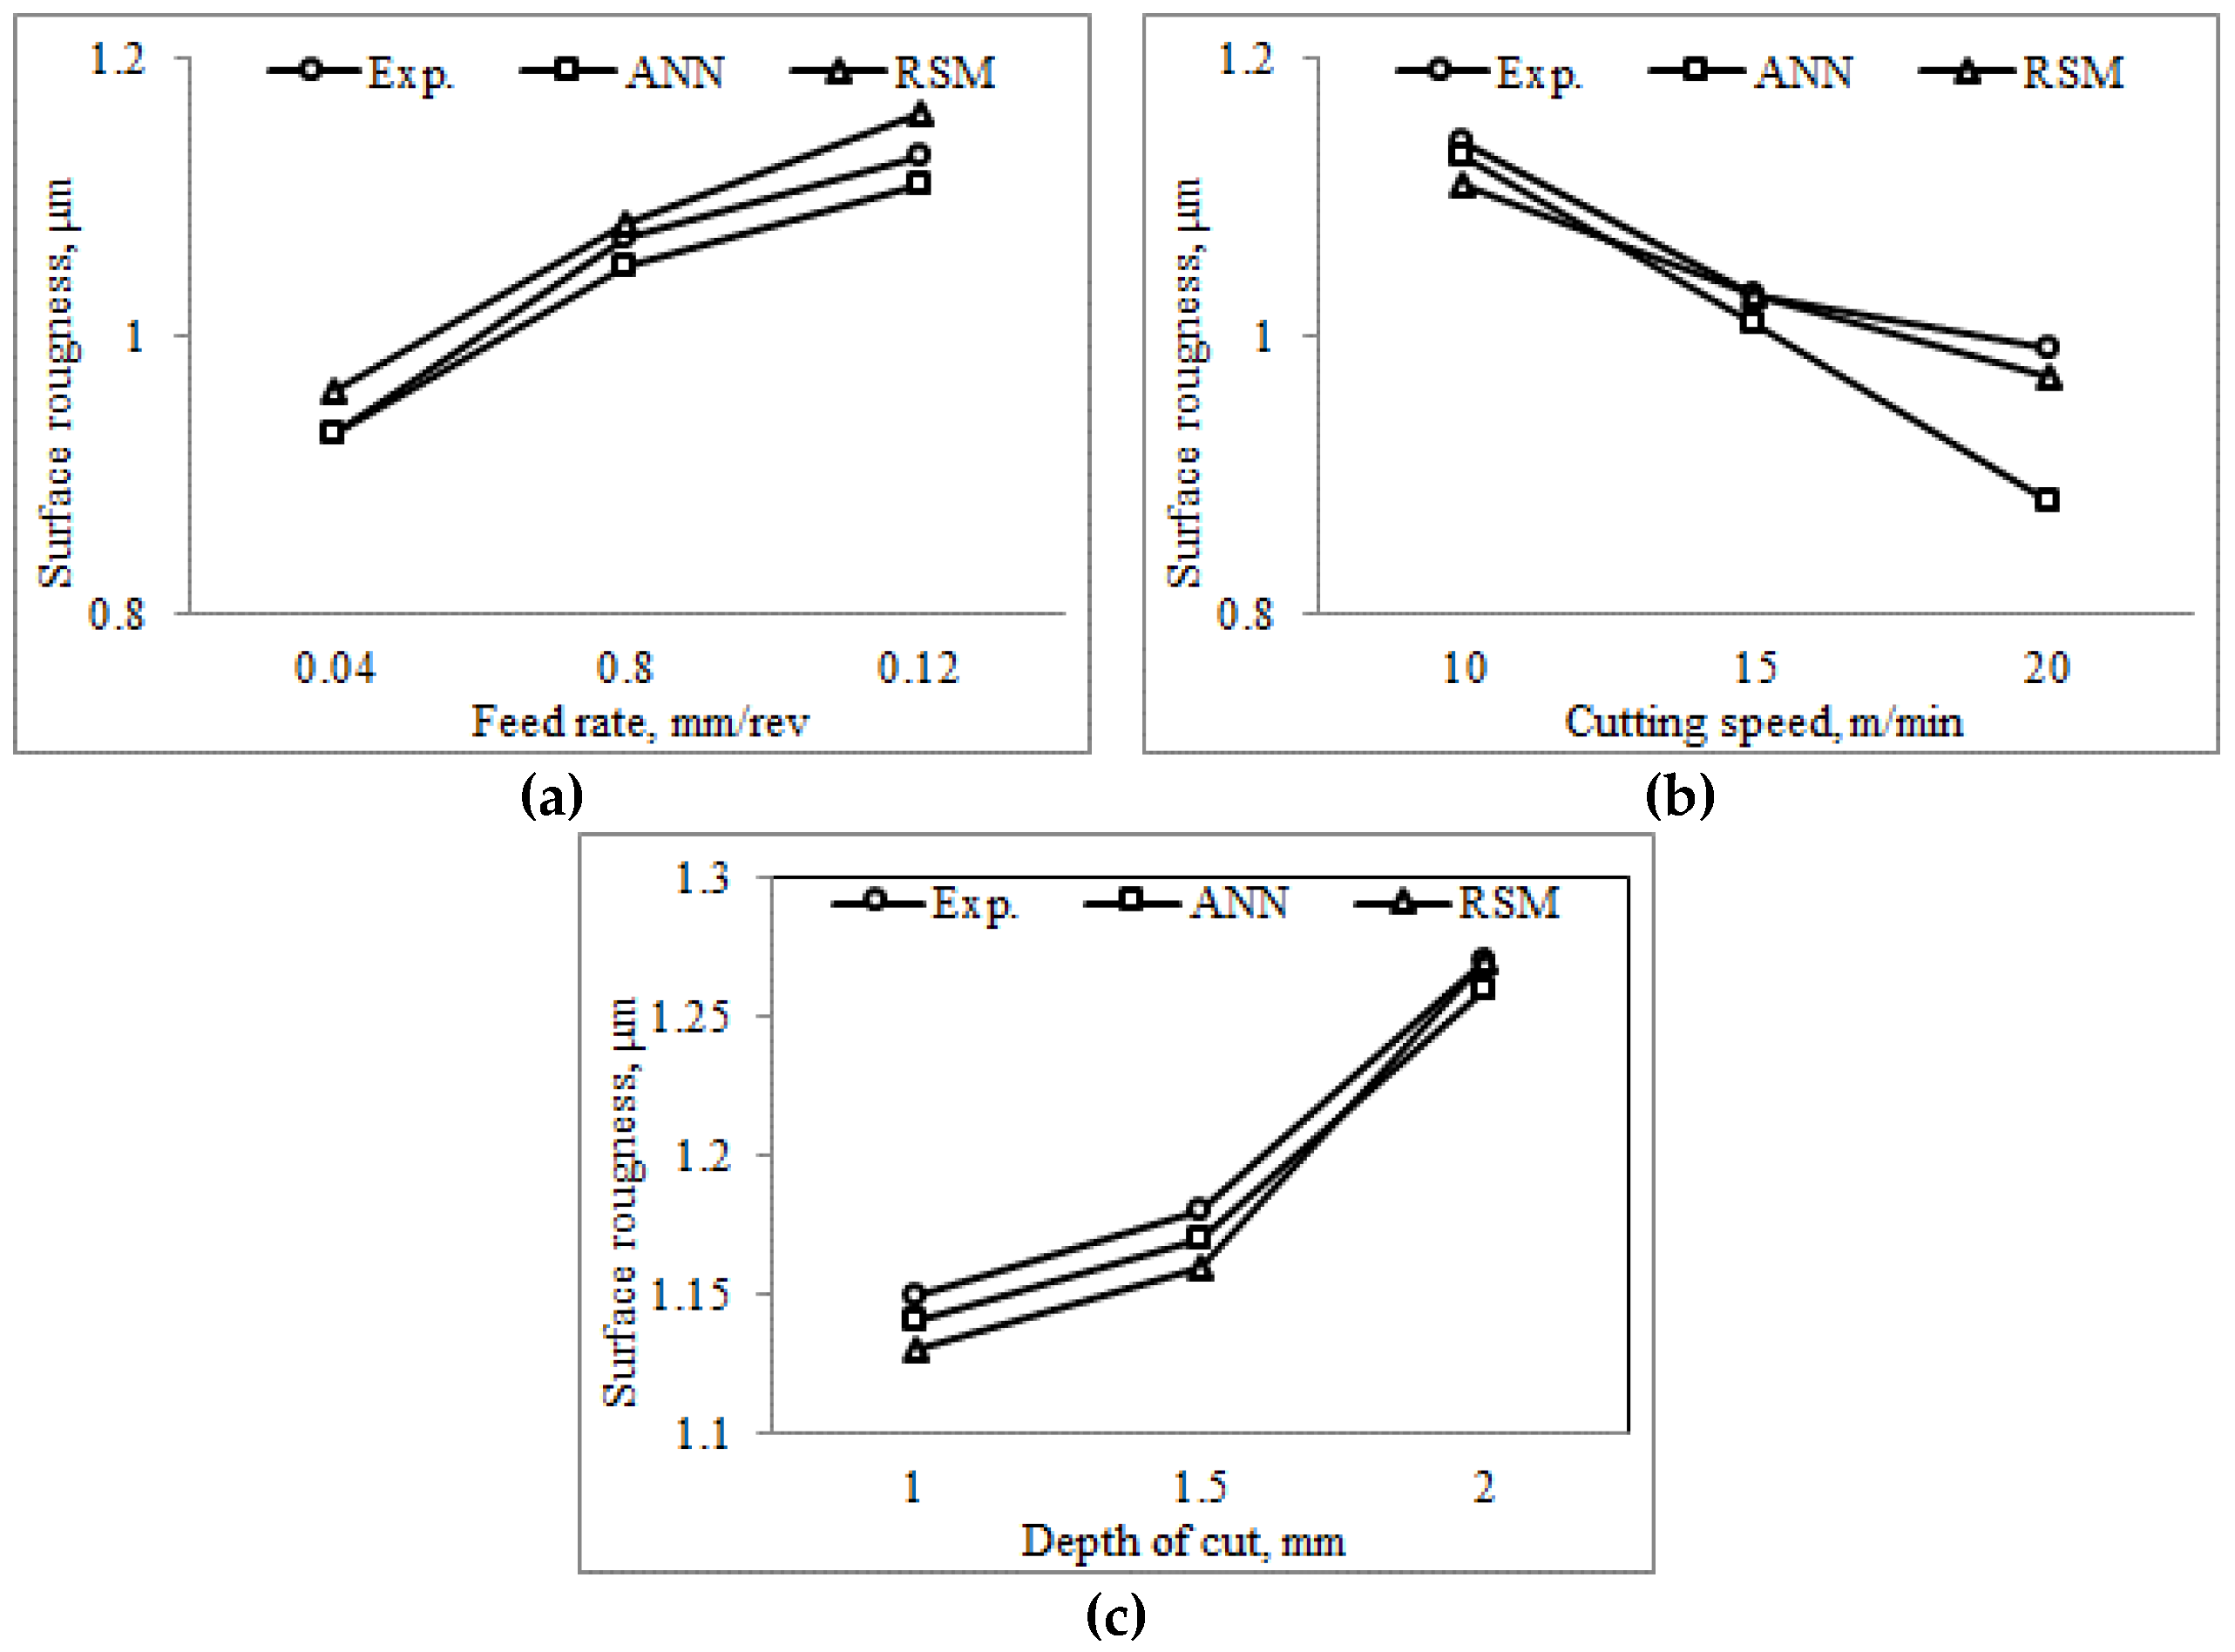
Figure 7,
Figure 8 and
Figure 9, respectively.
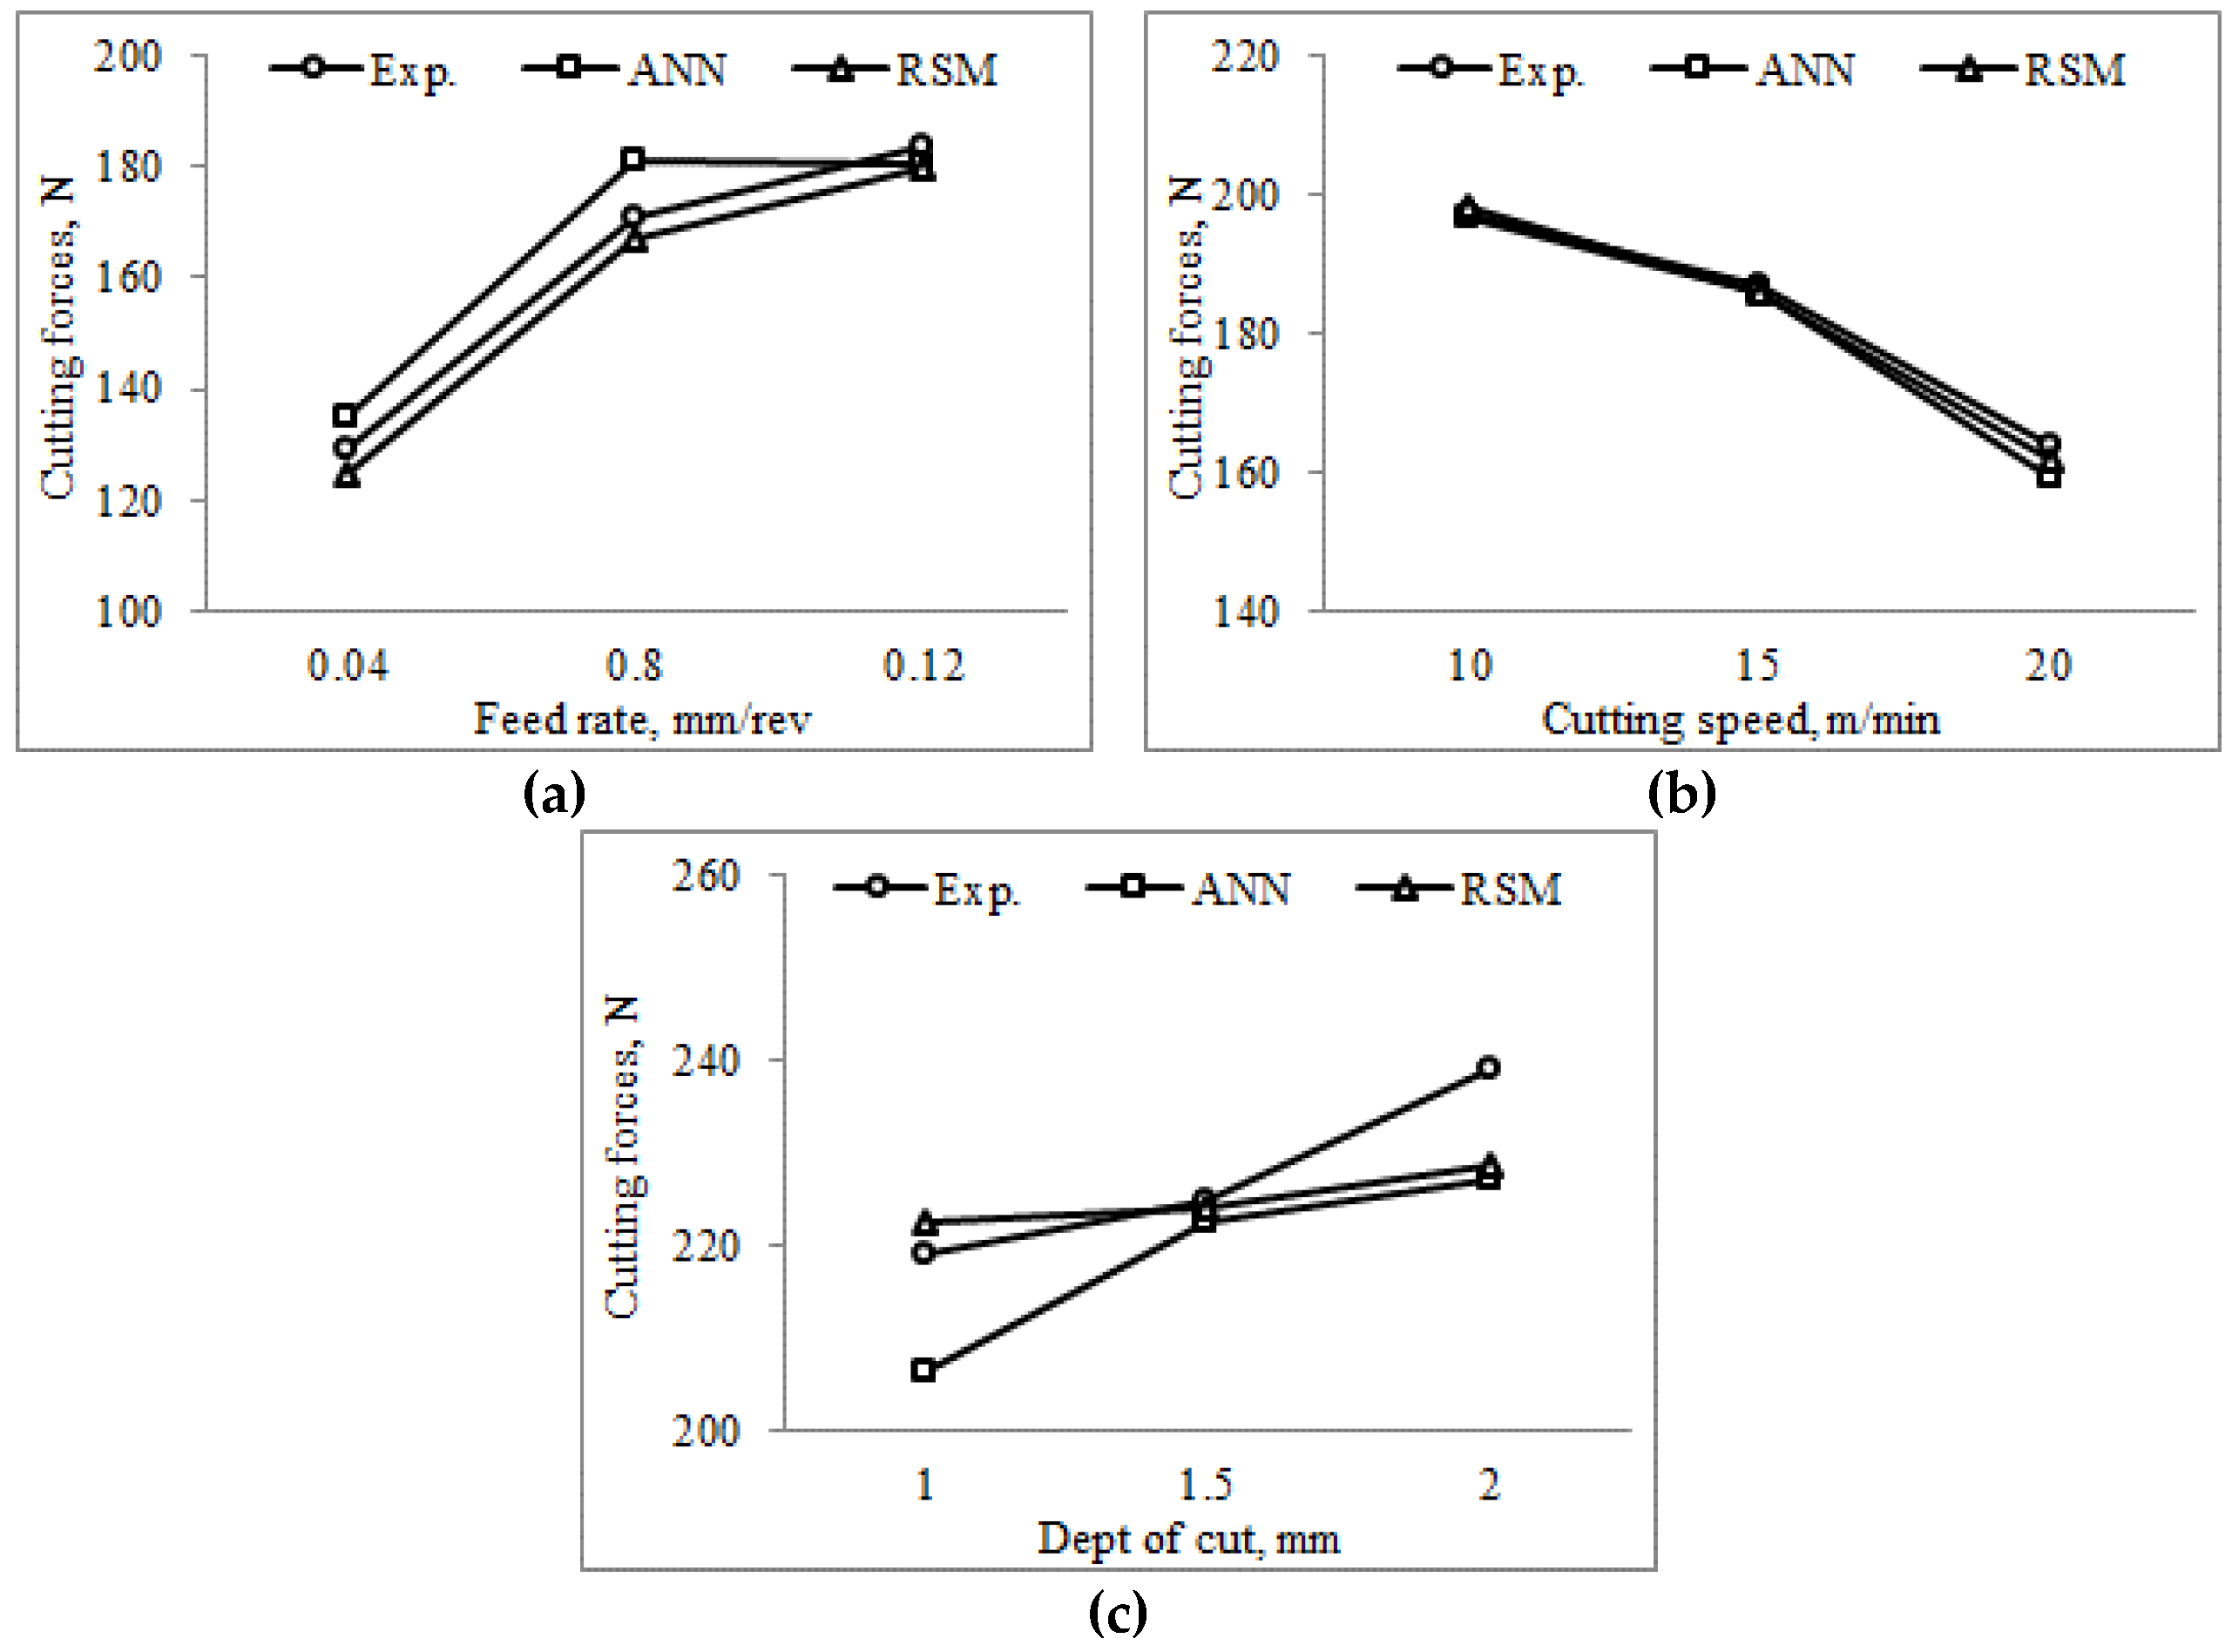
As seen in
Figure 7, obtained values from ANN and RSM for cutting force were very close to the experiment results. When the feed rate and the depth of cut increased, the cutting force increased. In this case, the metal removal rate increased. Thus, it was considered that the cutting force increased. On the other hand, higher cutting speed reduced the cutting force. It was considered that the cutting force reduced because increased of the cutting speed was led to increase of removed chip cross section. Maximum deviation between experimental results and ANN was found as 11.48% at 25th experiment. On the other hand, Maximum deviation between experimental results and RSM was found as 4.95% at ninth experiment for cutting forces. However, total average deviations obtained from all experimental studies were found 0.074% and 0.53% for ANN and RSM, respectively.
From
Figure 8, it was seen that experiment results were be closed to obtained values from ANN and RSM for surface roughness. It was seen that obtained values from ANN and RSM were close to experimental results for surface roughness. Surface roughness reduced with increasing of the cutting speed and it increased with increasing of the feed rate and the depth of cut. The cause of the increase of surface roughness was cutting force. For surface roughness, while maximum deviation between experimental results and ANN was obtained as 12.5% in the 23rd experiment, it was obtained as 5.7% at the first experiment between experimental results and RSM. However, total average deviations obtained from all experimental studies were found 1.98% and 2.13% for ANN and RSM, respectively.
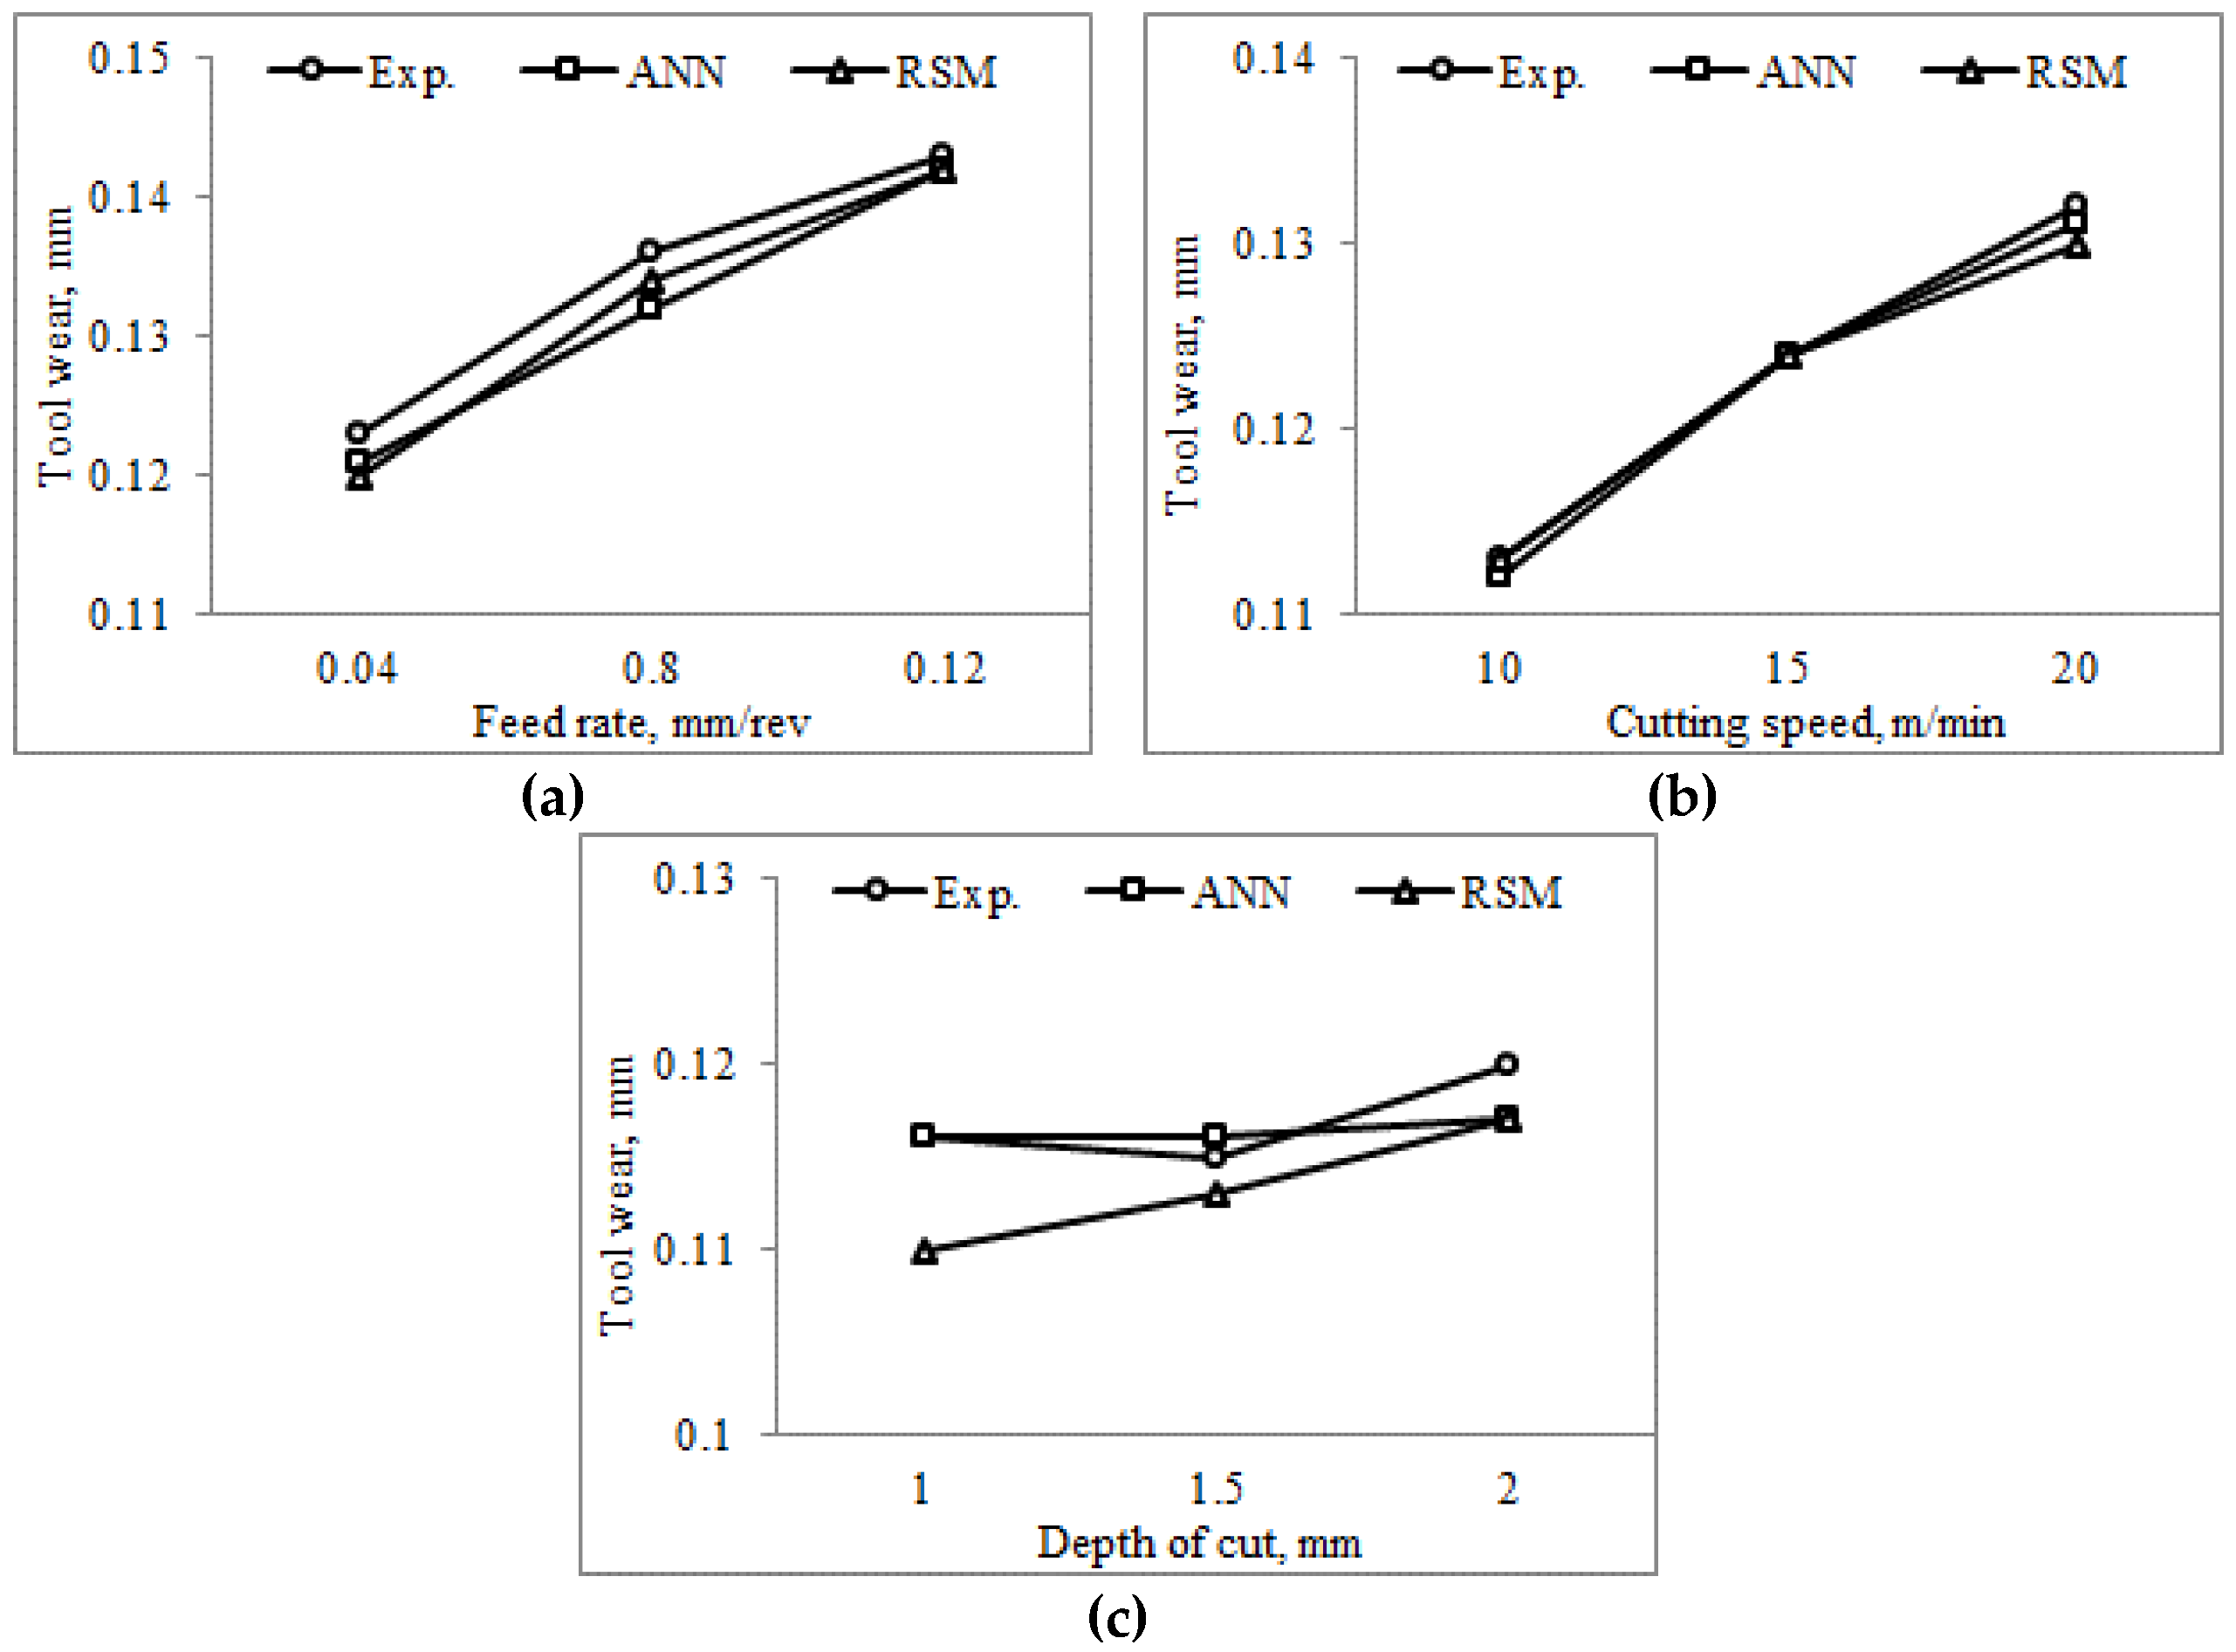
As could be understood from
Figure 9, tool wear increased with increasing of cutting speed, feed rate, and depth of cut. The reason of tool wear was the increase in the cutting forces formed with increasing of the feed rate and the depth of cut. The heat was a result of friction between the tool and the workpiece with increasing cutting speed. The excessive heat led to tool wear. The maximum deviation obtained from both ANN and RSM according to experimental results was found as 5% from third and seventh experiments respectively for tool wear. However, total average deviations obtained from all experimental studies were found to be 0.15% and 0.76% for ANN and RSM, respectively.
Analysis of variance (ANOVA) is used to analyze how the arguments interact with each other and the effects of these interactions on the dependent variable.
Table 5,
Table 6 and
Table 7 give the ANOVA results of the effects of machining parameters on cutting forces, surface roughness, and tool wear in the milling of the Ti-6242S.
From
Table 5,
Table 6 and
Table 7, it can be observed that
F-values producing by the models imply the significance of the model. There is only a 0.01% chance that a model
F-value this large could occur due to noise. The values of “Prob >
F” for models are less than 0.0500, they indicate that the model terms are significant. R
2 is very important for models as the accuracy increases as this value increases.
5. Conclusions
In this experimental study, the effects of different cutting parameters on cutting forces, surface roughness, and tool wear were investigated in the milling of Ti-6242S alloys. The results of the study are given below:
ANN and RSM models were developed to predict cutting force, surface roughness, and tool wear.
To train a network in ANN, a Levenberg-Marquardt algorithm was used. Models in RSM used Box Behnken design. Values obtained from the ANN and the RSM were found to be very close to the data obtained from experimental studies.
The increase of the feed rate and the depth of cut increased the cutting force, surface roughness, and tool wear.
The increase of the cutting speed reduced the cutting force and the surface roughness and increased the tool wear.
To obtain low cutting force and a good surface quality, high cutting speed, low feed rate, and low depth of cut should be selected as machining parameters.
Cutting speed, feed rate, and cutting depth must be set at low levels to minimize tool wear.
From the results obtained from the experiment and RSM models, the predicted and measured values are quite close. The developed models can be effectively used to predict the cutting force and surface roughness.
Experimental results using optimization and modelling methods such as ANN and RSM can be obtained in less time and result in economical machining. Results for different input parameters can be modelled without experimental studies.


