A Photometric Stereo Using Re-Projected Images for Active Stereo Vision System

Department of Mechanical Engineering, Korea University, Seoul 02841, Korea
*
Author to whom correspondence should be addressed.
Appl. Sci. 2017, 7(10), 1058; https://doi.org/10.3390/app7101058
Submission received: 7 September 2017
/
Accepted: 11 October 2017
/
Published: 13 October 2017
Abstract
:In optical 3D shape measurement, stereo vision with structured light can measure 3D scan data with high accuracy and is used in many applications, but fine surface detail is difficult to obtain. On the other hand, photometric stereo can capture surface details but has disadvantages, in that its 3D data accuracy drops and it requires multiple light sources. When the two measurement methods are combined, more accurate 3D scan data and detailed surface features can be obtained at the same time. In this paper, we present a 3D optical measurement technique that uses re-projection of images to implement photometric stereo without an external light source. 3D scan data is enhanced by combining normal vector from this photometric stereo method, and the result is evaluated with the ground truth.
1. Introduction
Optical 3D measurement technology is used in many applications, such as reverse engineering, quality inspection, restoration of cultural properties, face recognition, and dental computer aided design/computer aided manufacturing (CAD/CAM), because of its high measurement speed and precision [1,2,3,4,5]. Many passive stereo vision technologies have been proposed [6,7], but active stereo vision using structured light is one of the most popular optical 3D measurement techniques. It has high 3D scan data accuracy and fast data processing speed, but it has difficulties in expressing fine surface features. On the other hand, photometric stereo—another optical 3D measurement technique—can achieve fine surface feature but provides less accurate 3D scan data and requires multiple light sources. The output of active stereo vision is point data, and normal vector is calculated based on this point data, while the output of photometric stereo is normal vector, and point data is calculated by integrating this normal vector. Therefore, point data obtained by active stereo vision is more precise than that of photometric stereo, and normal vector obtained by photometric stereo is more detailed than that of active stereo vision. In this paper, we aimed to acquire more precise and detailed 3D scan data by combining active stereo vision and photometric stereo without external light sources in an active stereo vision hardware setup. The final result was verified by comparing distance deviation of point data and angular deviation of normal vector acquired with ground truth.
2. Related Works
2.1. Active Stereo Vision Using Structured Light
Active stereo vision using structured light is a common method to ensure that the accuracy of measured 3D scan data is high enough for its use in commercial devices [8,9,10]. The equipment for active stereo vision consists of two cameras and one projector, as shown in Figure 1a. The 3D scan data (Figure 1d) can be obtained by capturing left and right camera images of the object upon which the structured light is projected (Figure 1b,c), and by using epipolar geometry between the calibrated two cameras, 3D scan data is generally smoothed because of the high-frequency noise that it contains. In this process, the surface detail is also smoothed, making it difficult to obtain fine surface features.
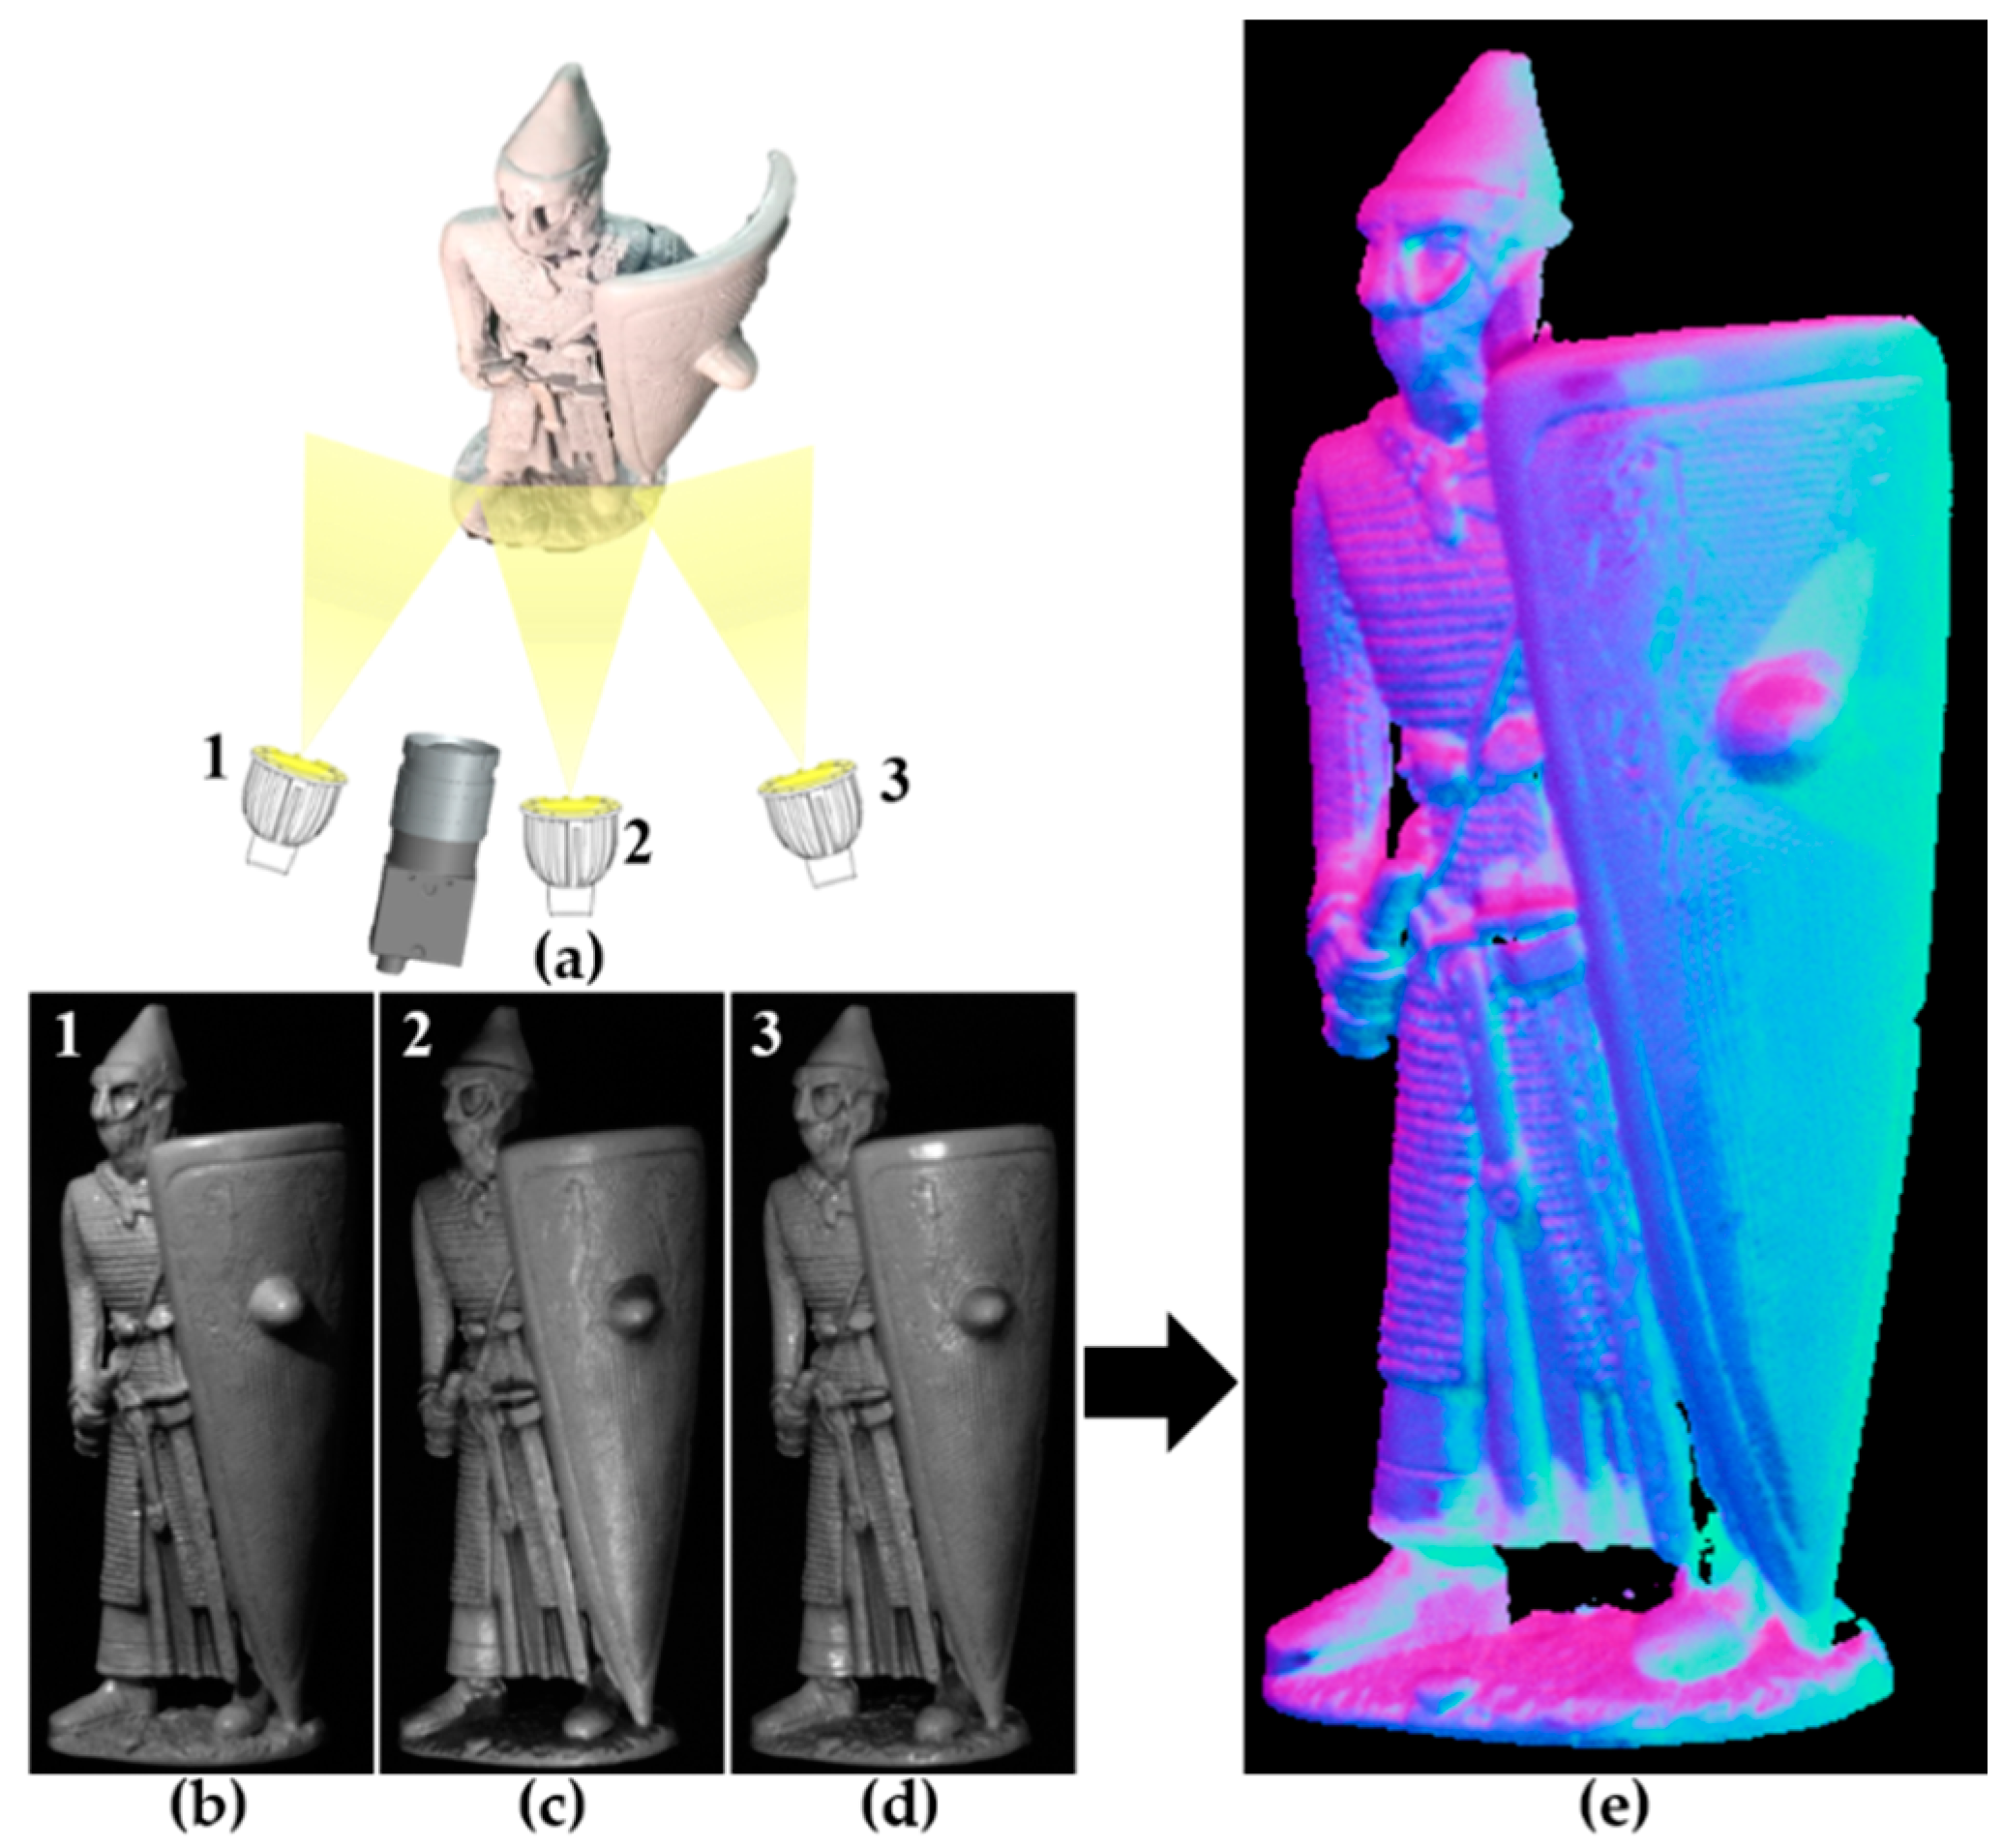
2.2. Photometric Stereo
Photometric stereo is widely used for applications which require the surface detail of a target object to be obtained [11,12,13]. Photometric stereo requires one camera and three or more light sources, which must not be located in one straight line, as shown in Figure 2a. This method is a technique for acquiring normal vector through the object’s reflection characteristics by using images taken from a single camera with different light positions (Figure 2b–d). The normal vector (Figure 2e) acquired are relatively accurate, but a depth map obtained with the same technique is not accurate. This is because the depth map is obtained by continuously integrating the normal vector, causing accumulated error.
2.3. Data Combining Method
Active stereo vision and photometric stereo are techniques suitable for acquiring accurate 3D scan data and detailed surface features. By combining the data from each method, more accurate 3D scan data and detailed surface features can be acquired. Nehab’s algorithm combines 3D scan data from the active stereo vision with normal vector from the photometric stereo to obtain improved 3D scan data [14]. Figure 3 shows the experimental setup for Nehab’s algorithm, which consists of two cameras, a single projector, and external light sources.
2.4. Previous Works
Through the Nehab algorithm, precise and detailed 3D scan data can be obtained by combining active stereo vision and photometric stereo. However, combining an active stereo vision system and a photometric stereo system increases the size and complexity of the equipment configuration, incurring additional equipment costs [15,16,17]. To solve this problem, we propose a photometric stereo system that uses re-projected images instead of images taken under different light conditions to obtain detailed surface data.
3. Our Approach
3.1. Active Stereo Vision Measurement System Analysis
In general, the stereo vision measurement method is used to measure an object at various viewpoints by solving the field of view problem [18]. To obtain a complete 3D model of an object, 3D scan data from various viewpoints are registered to a single coordinate system and merged as shown in Figure 4. In this registration process, transformation matrices between these 3D scan data from various viewpoints are obtained.
3.2. Re-Projection Method
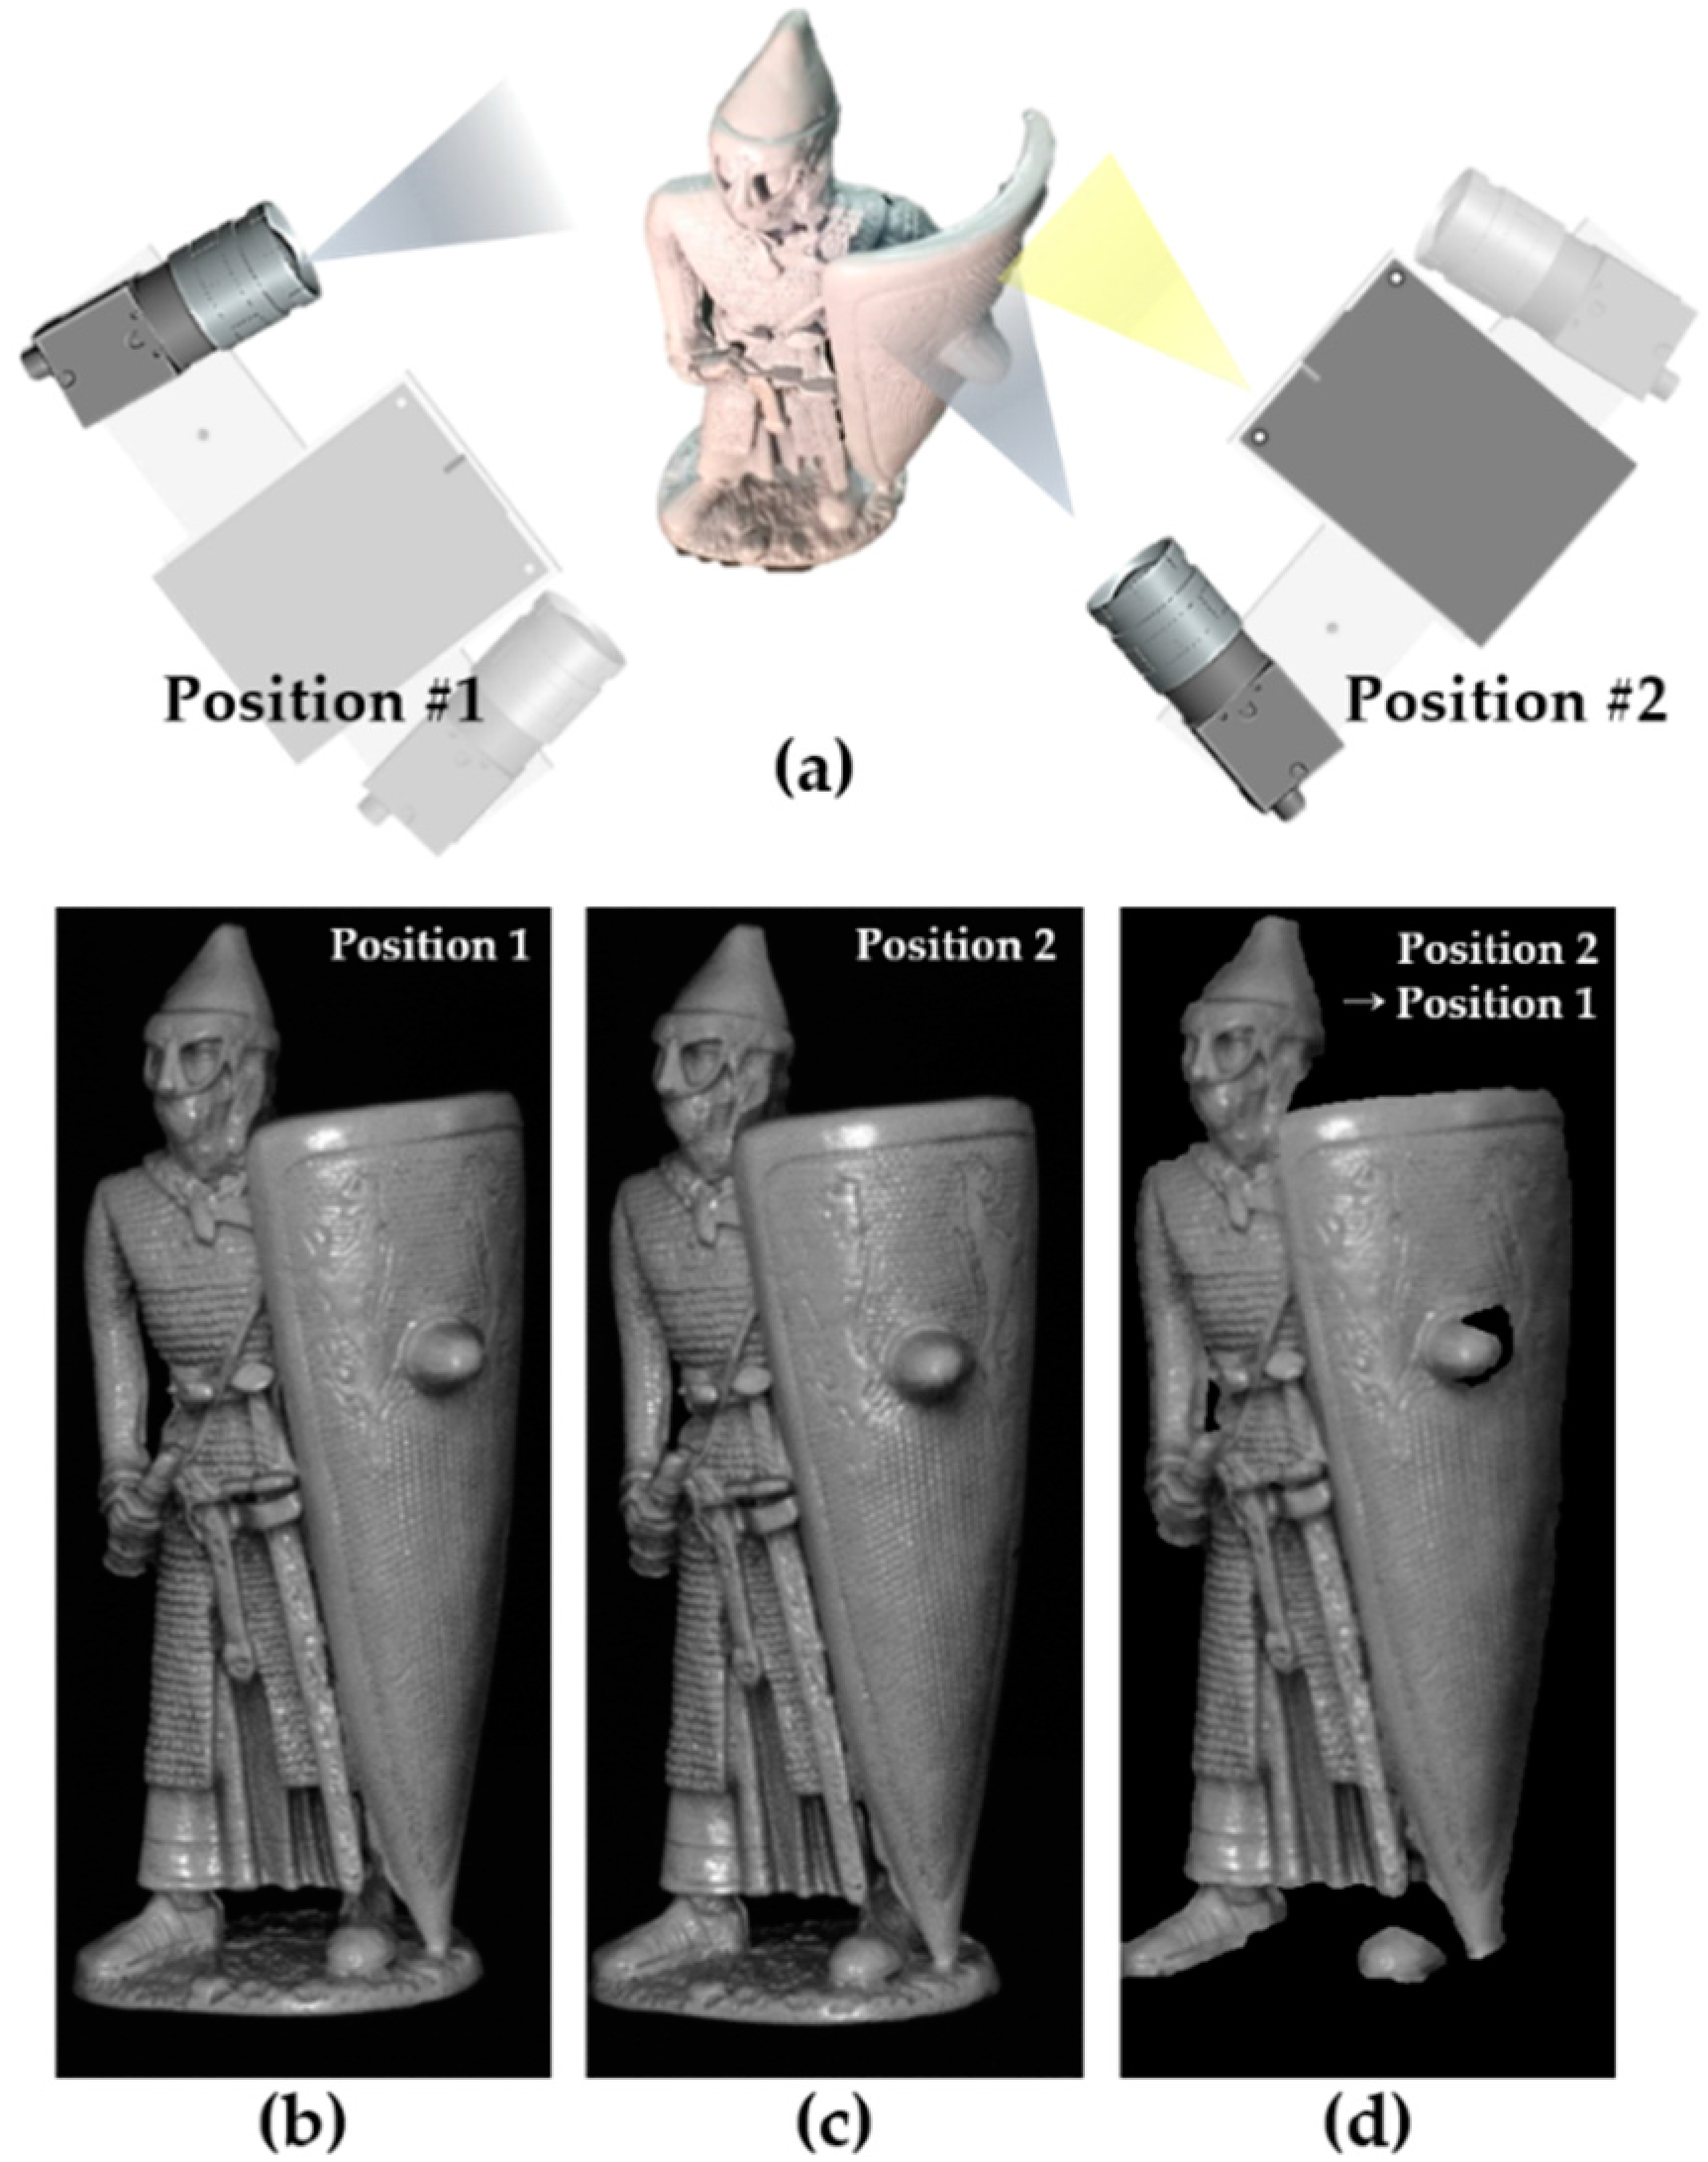
To use the photometric stereo measurement method, three or more images from a single camera with different light sources are needed. For the re-projection method, such images can be obtained by re-projecting the images obtained at various viewpoints in the stereo vision measurement process. If a reference view image (Figure 5b) and an image from a different view (Figure 5c) are obtained at two different viewpoints (as shown in Figure 5), a new image (Figure 5d) can be generated by re-projecting an image from view 2 to reference view 1. The projector in view 2 works as an external light source. As a result, the re-projected image (Figure 5d) can be assumed to be an image taken at view 1, but with a light source from view 2.
In the image generation process, the 3D scan data () obtained at another viewpoint in the local coordinate system is converted into 3D scan data () in the world coordinate system using the transformation matrix ().
The converted 3D scan data are applied to the function (), including the radial and tangent distortion of the lens in accordance with the camera model, and are re-projected onto the image plane at the reference point.
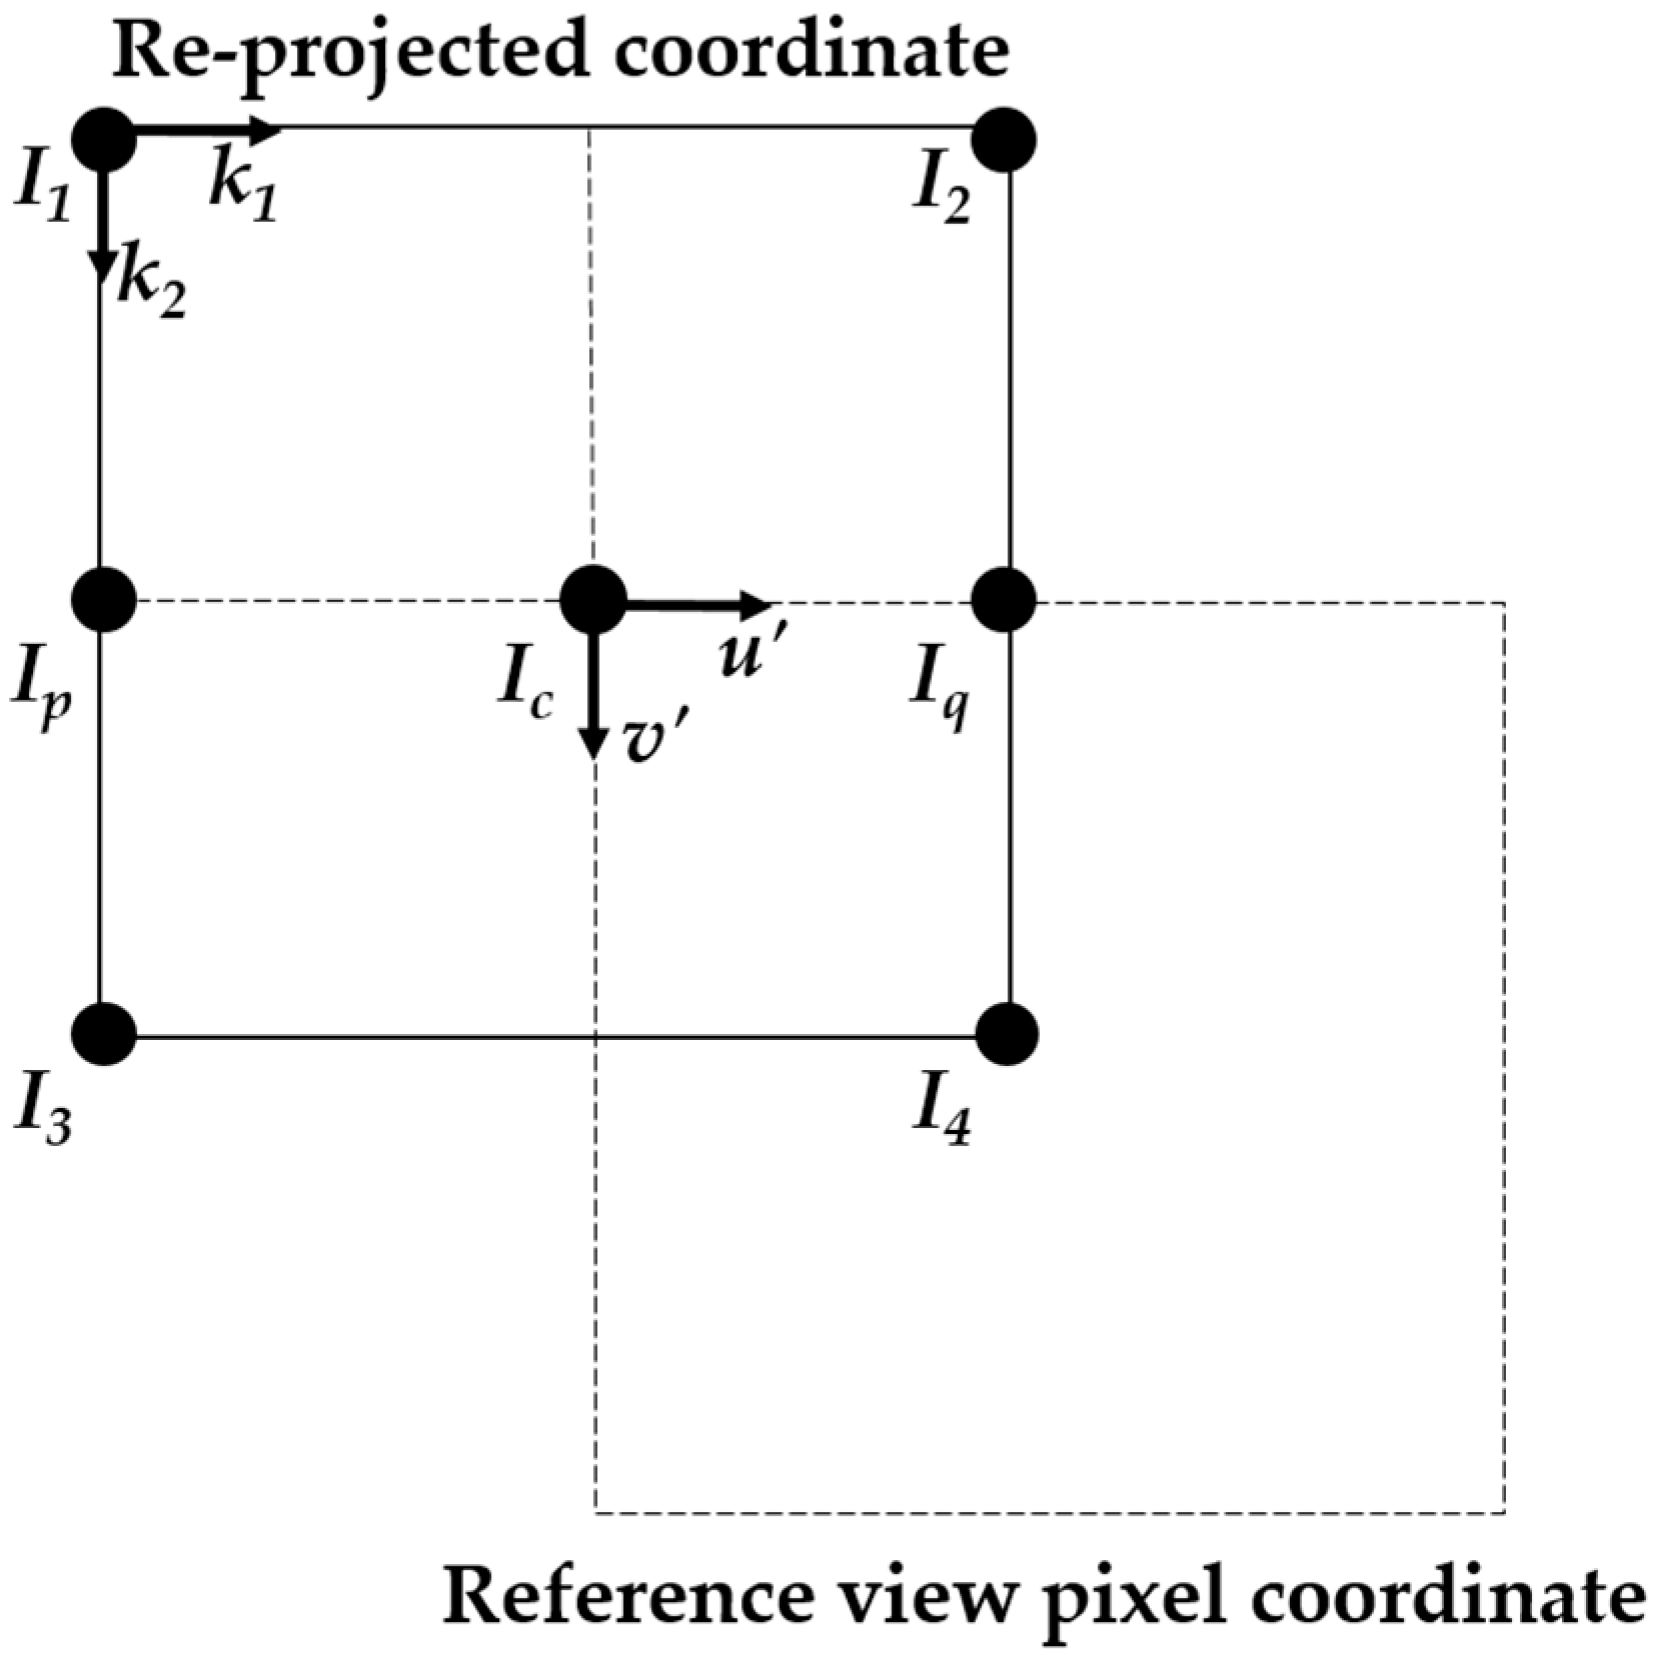
Since the re-projected coordinates () do not fit the camera pixel coordinates, they are converted to integer coordinates through bilinear interpolation. Because the corresponding points of the 3D scan data () obtained at the other viewpoints and the other viewpoint image pixels (u) can be known in the 3D scan data measurement process of the stereo vision, the corresponding points can be found between the other viewpoint image (u) and the reference viewpoint image pixel (). Thereafter, the intensity values () of the image corresponding to the corresponding point are bilinearly interpolated to obtain a re-projected image as shown in Figure 6. Through this process, images obtained from various positions can be re-projected to the reference coordinate system to obtain images for use in photometric stereo.
4. Experimental Results and Evaluation
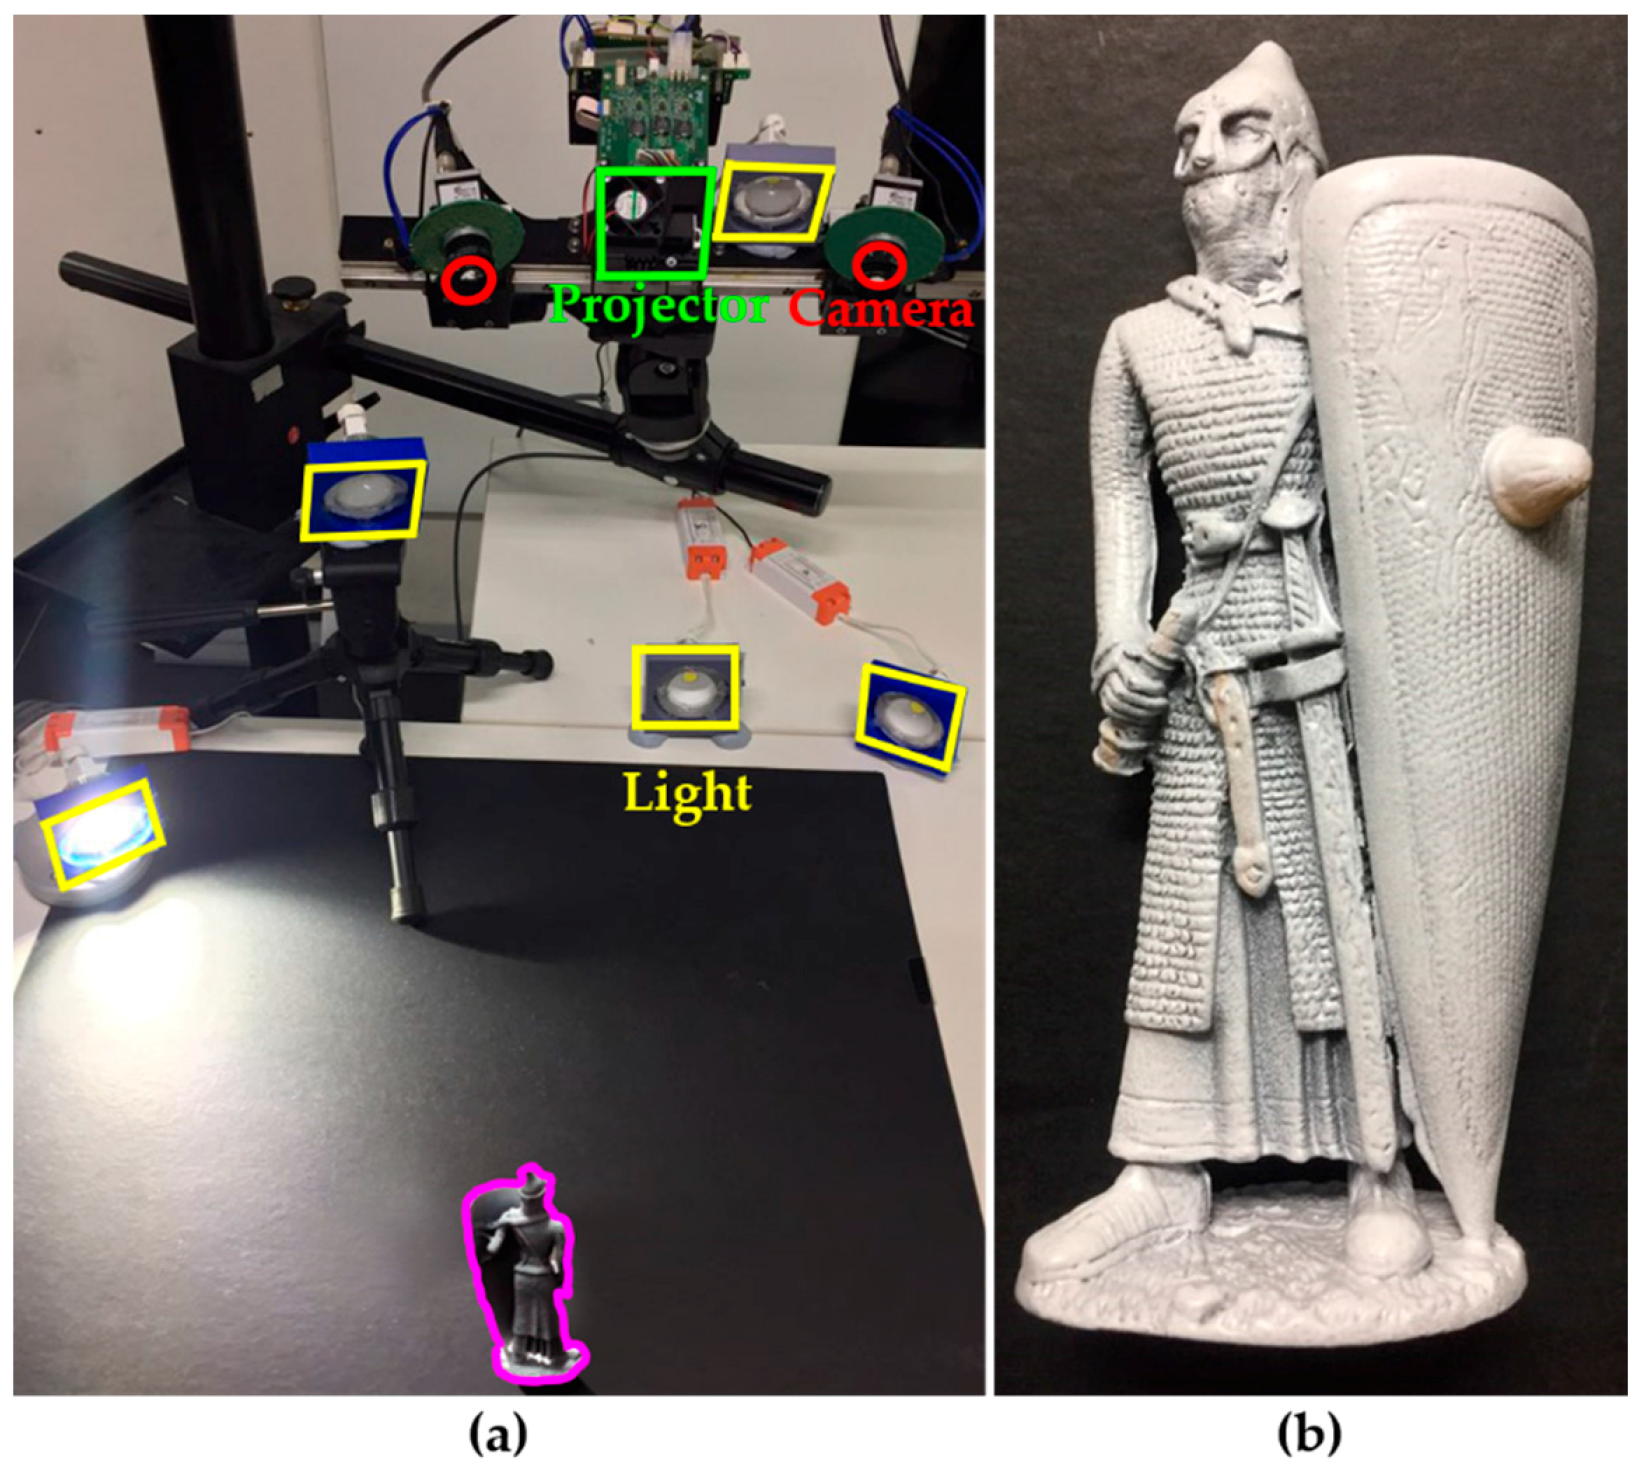
To obtain the 3D data, an active stereo vision system was built, which consists of the same hardware configuration of the state of the art and two cameras (acA1300-200um-Basler ace, Basler, Ahrensburg, Germany), two lenses (HF16HA-1B, Fujifilm, Tokyo, Japan), and a single projector (LC3000-PRO 100, Texas Instruments, Dallas, TX, USA), as shown in Figure 7. In addition, a photometric stereo system was built with five external LED light sources and a single camera (acA1300-200um-Basler ace). The target object was a knight statue (50 mm in width, 150 mm in height, and 30 mm in depth). The proposed algorithm was implemented in C++ language and implemented on a personal computer with an i7-4770K processor (Intel, Santa Clara, CA, USA) with 8 GB memory and a Windows 7 operating system. The computational cost of Nehab’s method and ours has no difference in terms of acquiring the 3D point cloud, since we use the same algorithm to enhance the 3D scan data. The main difference is hardware setup and time cost of taking images for the algorithm. Nehab’s method takes five images per point of view to implement photometric stereo, while our method takes only a single image per point of view. This difference increases as the number of views to obtain scan data increase. Creating a re-projected image of 800 × 600 resolution only takes 20 ms per view on our hardware setup, which is minor compared to the extra time spent taking images for photometric stereo in Nehab’s configuration with a 30 fps camera.
The normal data (Nps) from the traditional photometric stereo method which uses images under different light conditions were obtained through the procedure described in Section 2.2. 3D point data (Psv) and normal vectors (Nsv) were obtained from five different views via the stereo vision system, and registration was done through the procedure described in Section 3.1. The registration errors of five scan patches was 0.022 mm, which proves high precision of an active stereo vision system. With this registration result, images from four different views were re-projected to a reference view, creating four re-projected images as described in Section 3.2. These four re-projected images and the reference view image work as images under different light conditions. Normal vector (Nrp) can be obtained via the photometric stereo method from these five images.
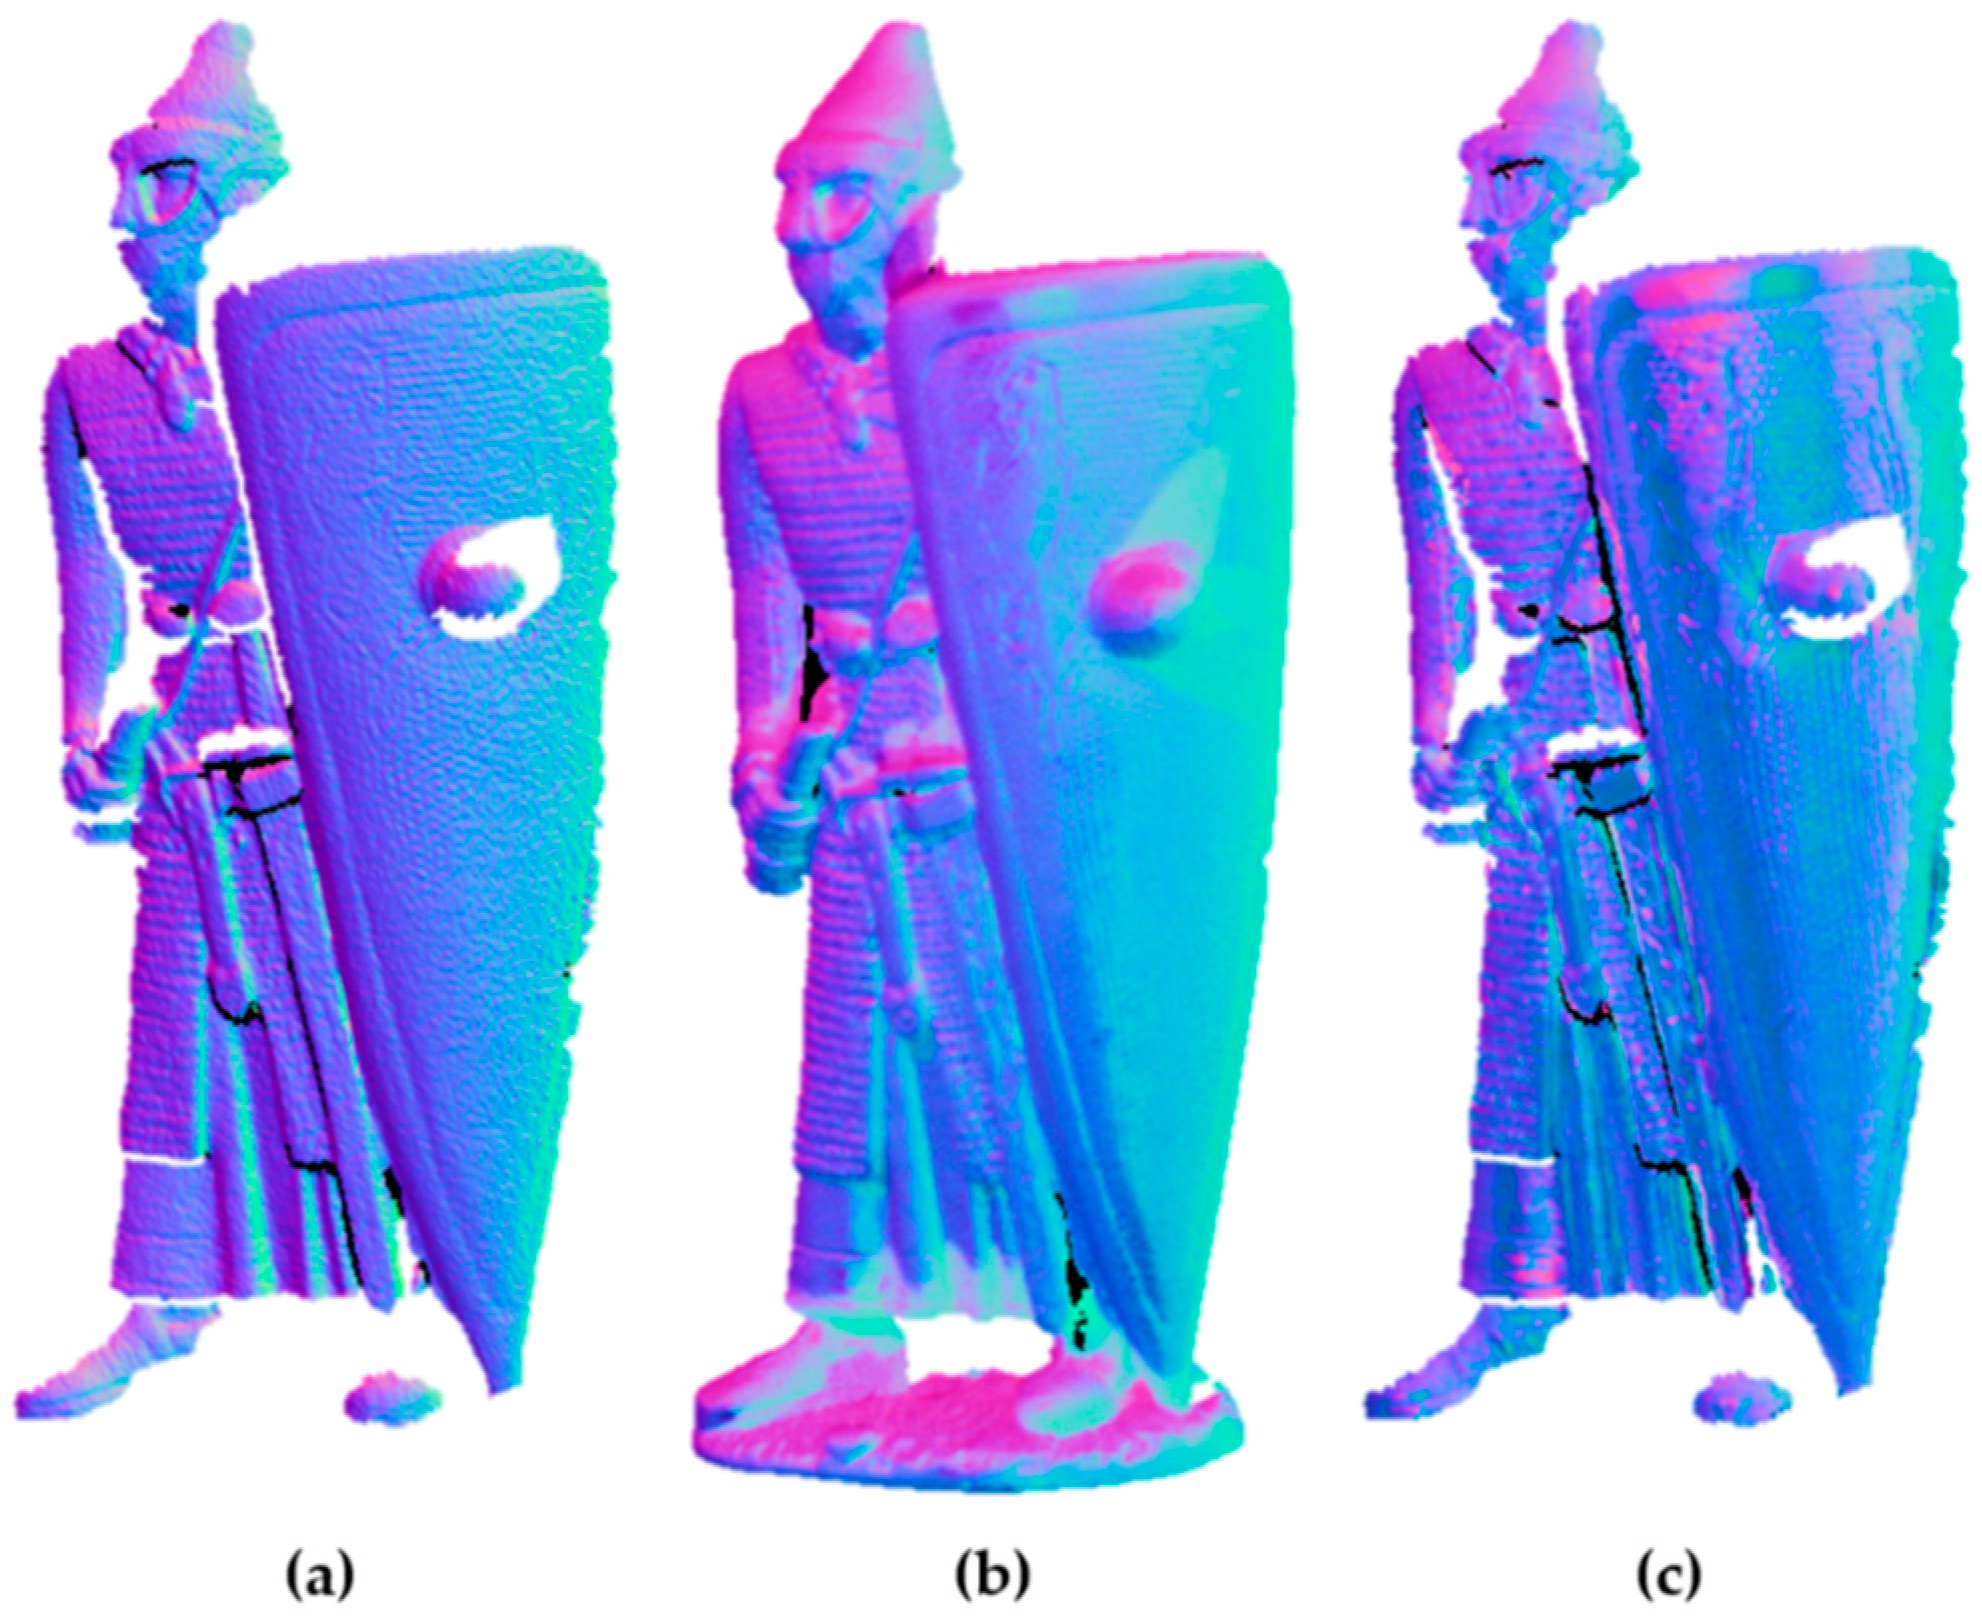
When there is a unit normal vector with a value of −1 to 1, this value is converted from 0 to 255, and is mapped to the RGB field of the image to create the normal map, as shown in Figure 8. The normal vector of the photometric stereo (Nps) in Figure 8b represents more detailed surface features than the normal vector (Nsv) of the stereo vision in Figure 8a. The normal vector (Nrp) in Figure 8c obtained from re-projected images also represents more detailed surface features than that of the of stereo vision system. The difference is shown more clearly in the shield portion of the knight model.
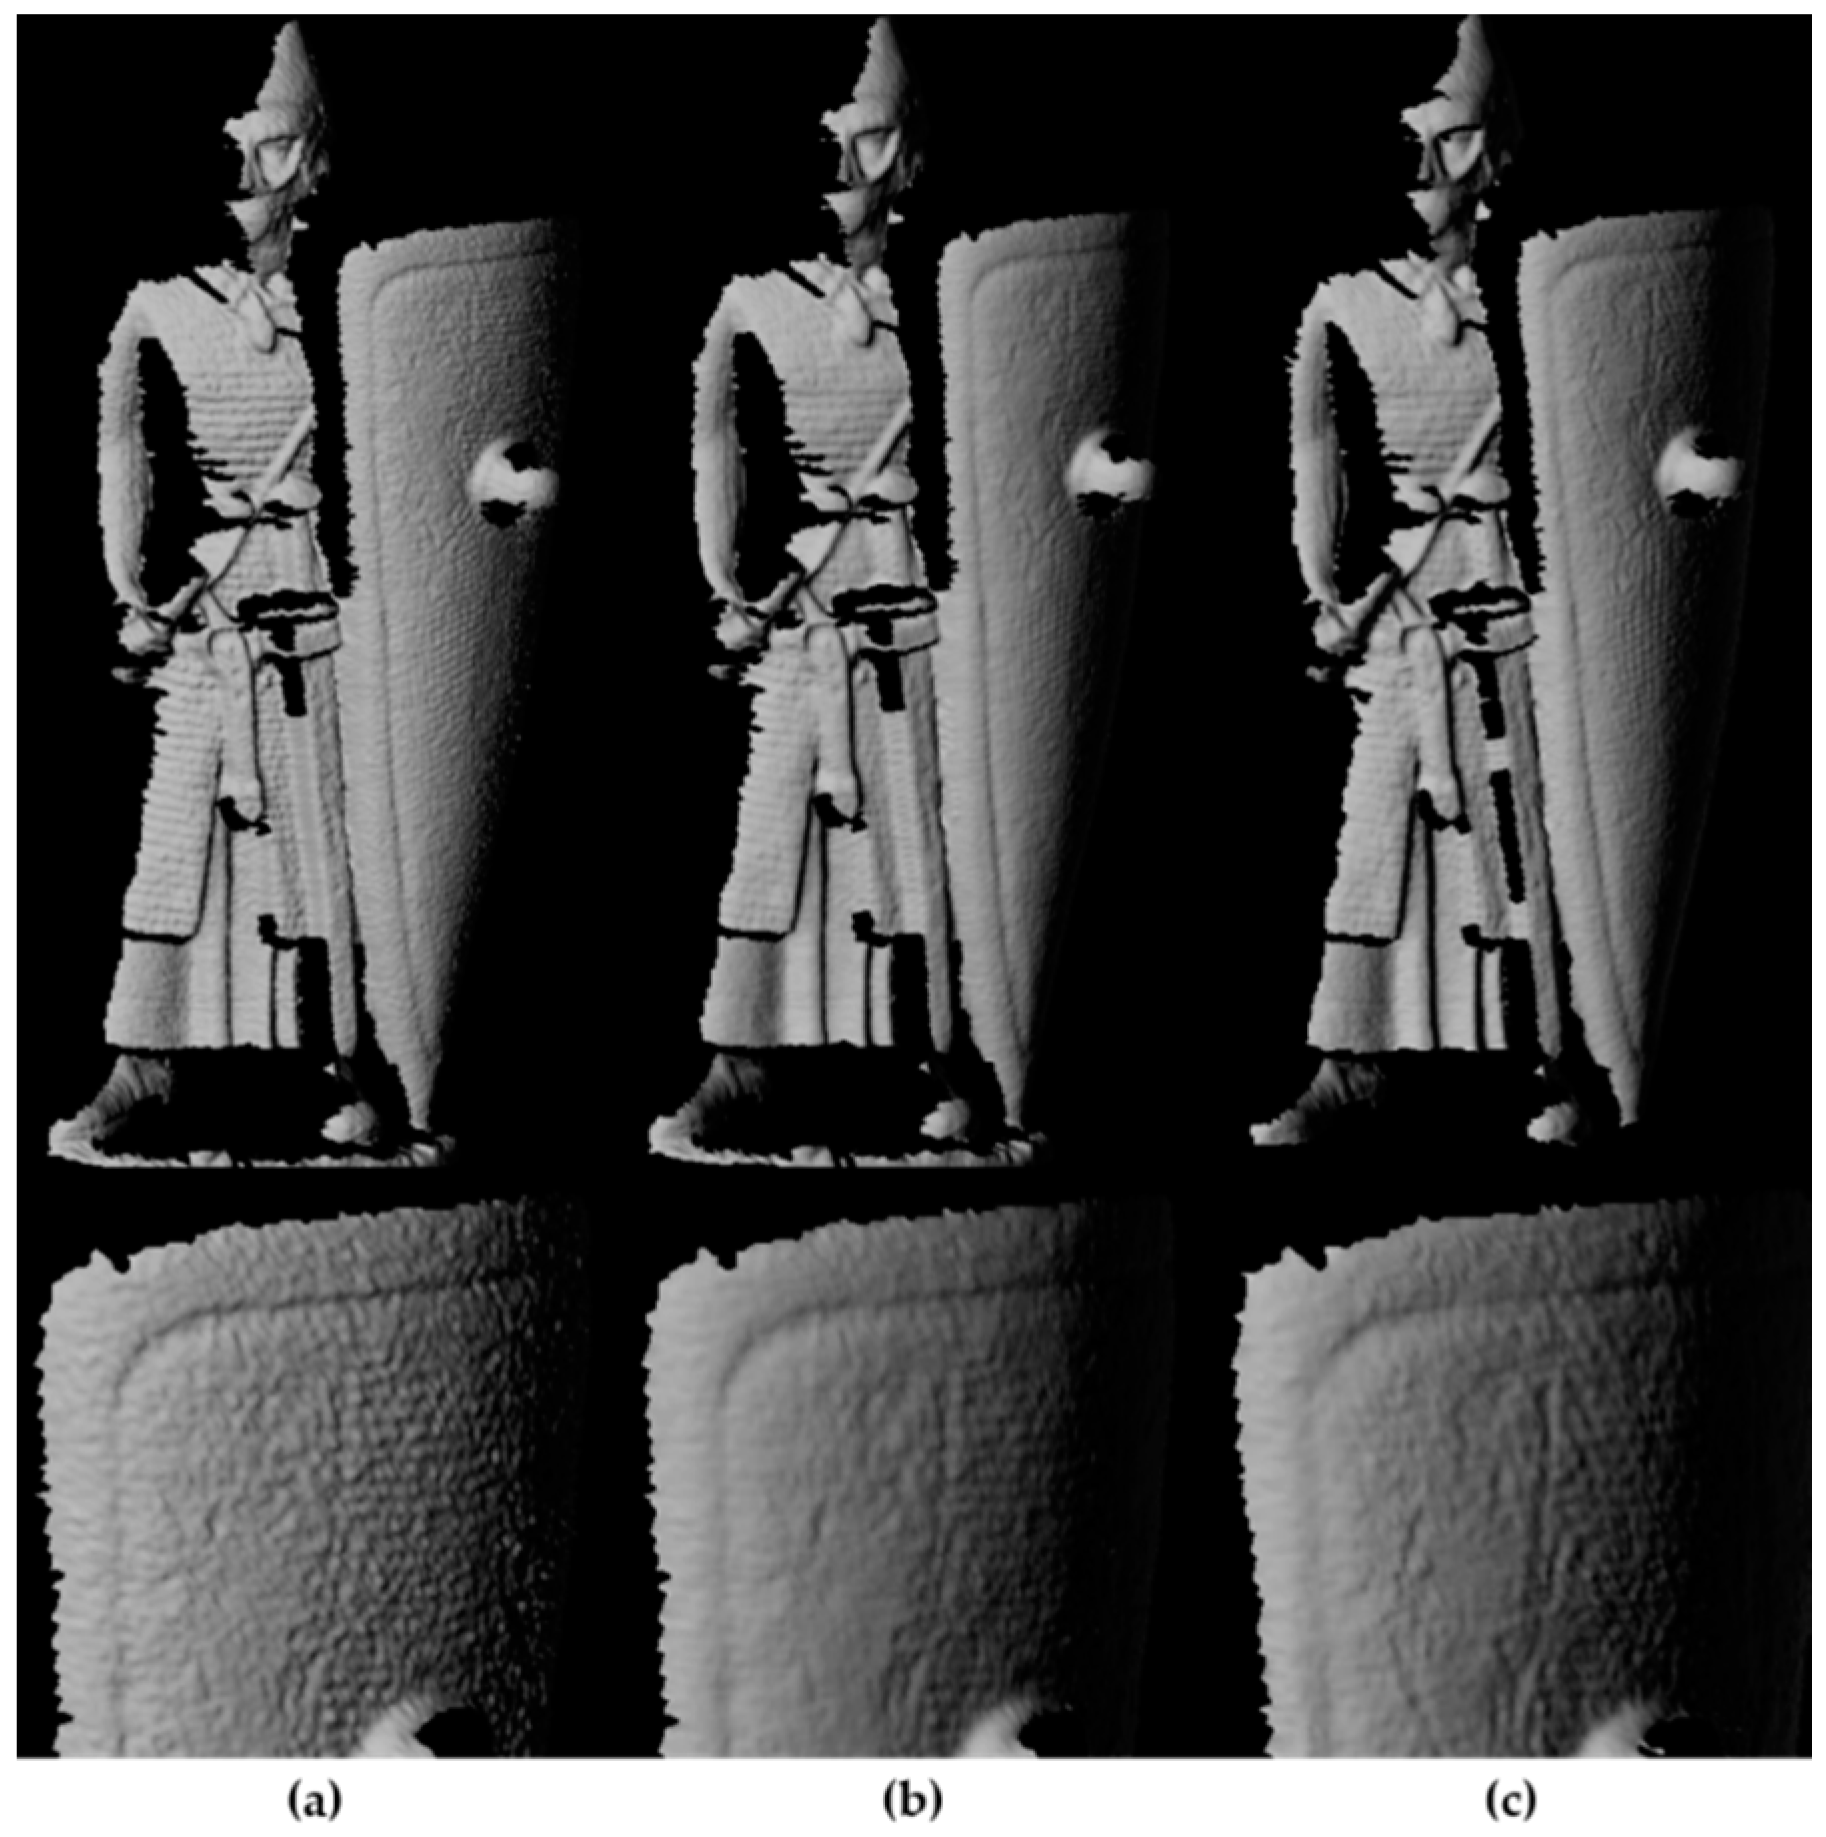
We used these detailed normal vectors (Nps) and (Nrp) to improve the stereo vision 3D point data (Psv) by means of Nehab’s algorithm, obtaining more precise 3D data, as described in Section 2.3. In order to see errors of our re-projection algorithm’s result only, we applied Nehab’s algorithm on a single scan patch, which does not contain registration error and point difference from the merging process. Figure 9 shows 3D rendering comparisons between each method described above. Figure 9a is 3D scan data obtained from the stereo vision ((Psv), (Nsv)) without Nehab’s algorithm, which contains high-frequency noise. Figure 9b shows 3D scan data obtained from Nehab’s algorithm with the normal vector from traditional photometric stereo method ((Psv), (Nps))Nehab; this shows more surface details, and the high-frequency noise is removed. Figure 9c shows 3D scan data obtained from/via Nehab’s algorithm with the normal vector from the re-projection method proposed in this paper ((Psv), (Nrp))Nehab. The result also shows more surface details, and the high-frequency noise is removed, while it is not significantly different from the 3D scan data obtained from the method which uses an external light source.
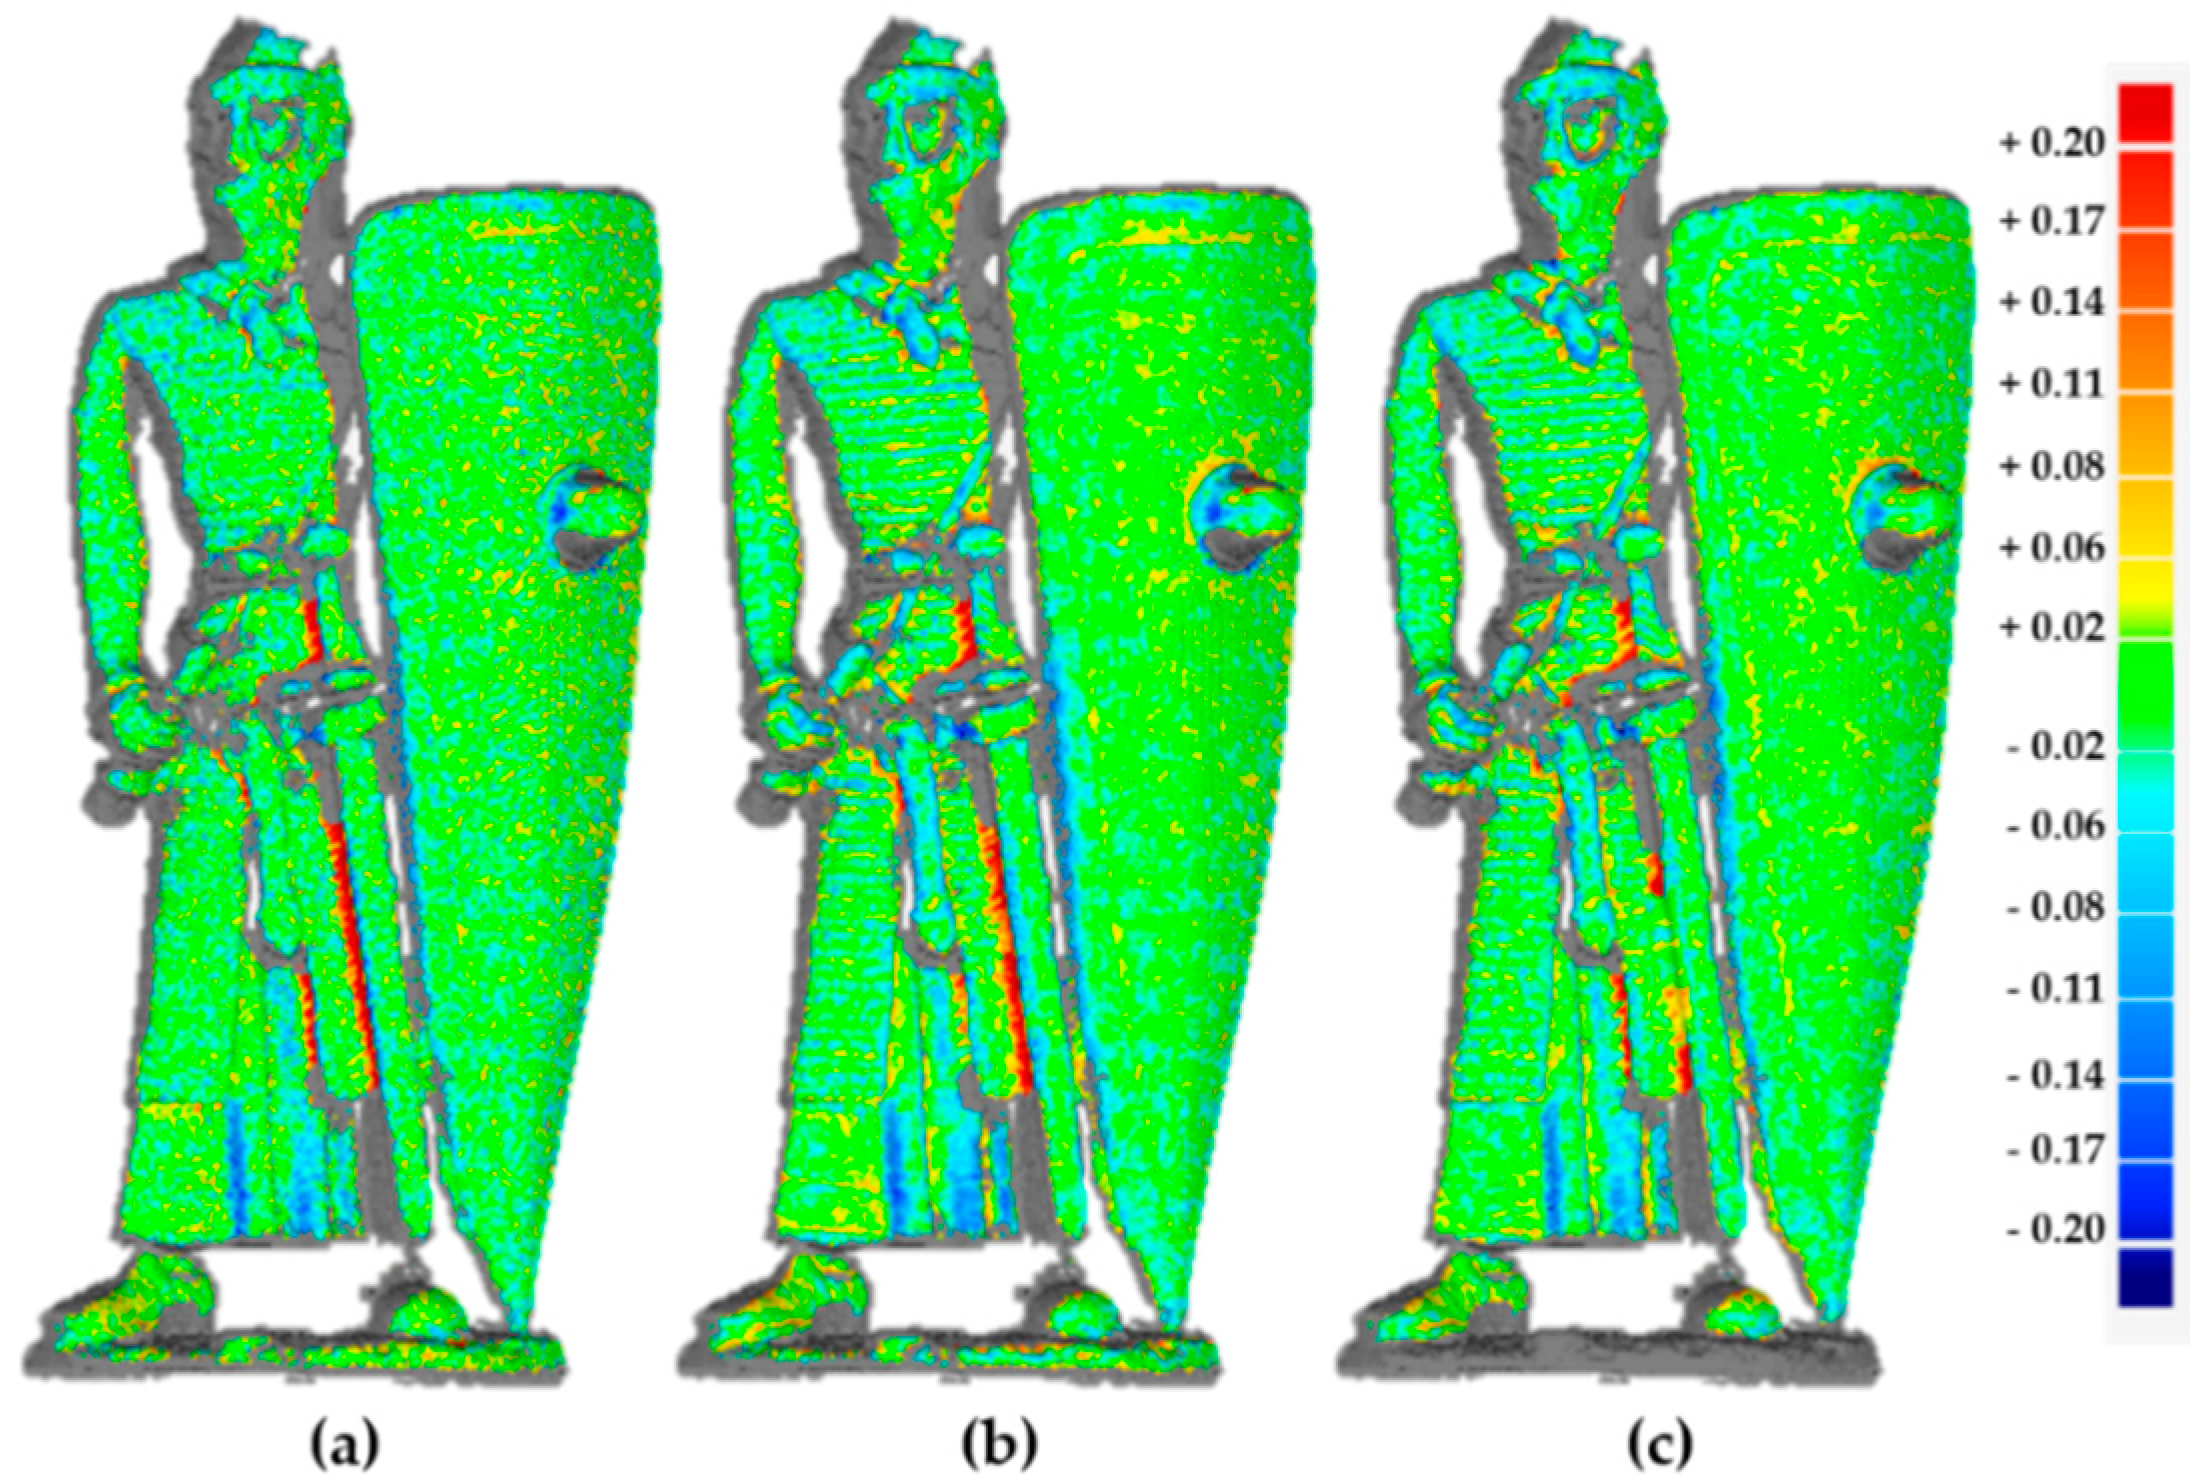
For quantitative comparison analysis, high-quality 3D scan data obtained by measuring a target object with a high-precision 3D scanner (Identica Hybrid, Medit Company, Seoul, Republic of Korea) which has 7 μm accuracy was defined as ground truth. This ground truth was compared with the 3D scan data measured previously using the Geomagic Control X (3D Systems, Rock Hill, SC, USA) [19]. Figure 10 shows the point distance deviation comparison to the ground truth. Table 1 shows the root mean square (RMS) error and standard deviation. Applying Nehab’s algorithm to the 3D scan data from active stereo vision resulted in a decrease in RMS error.
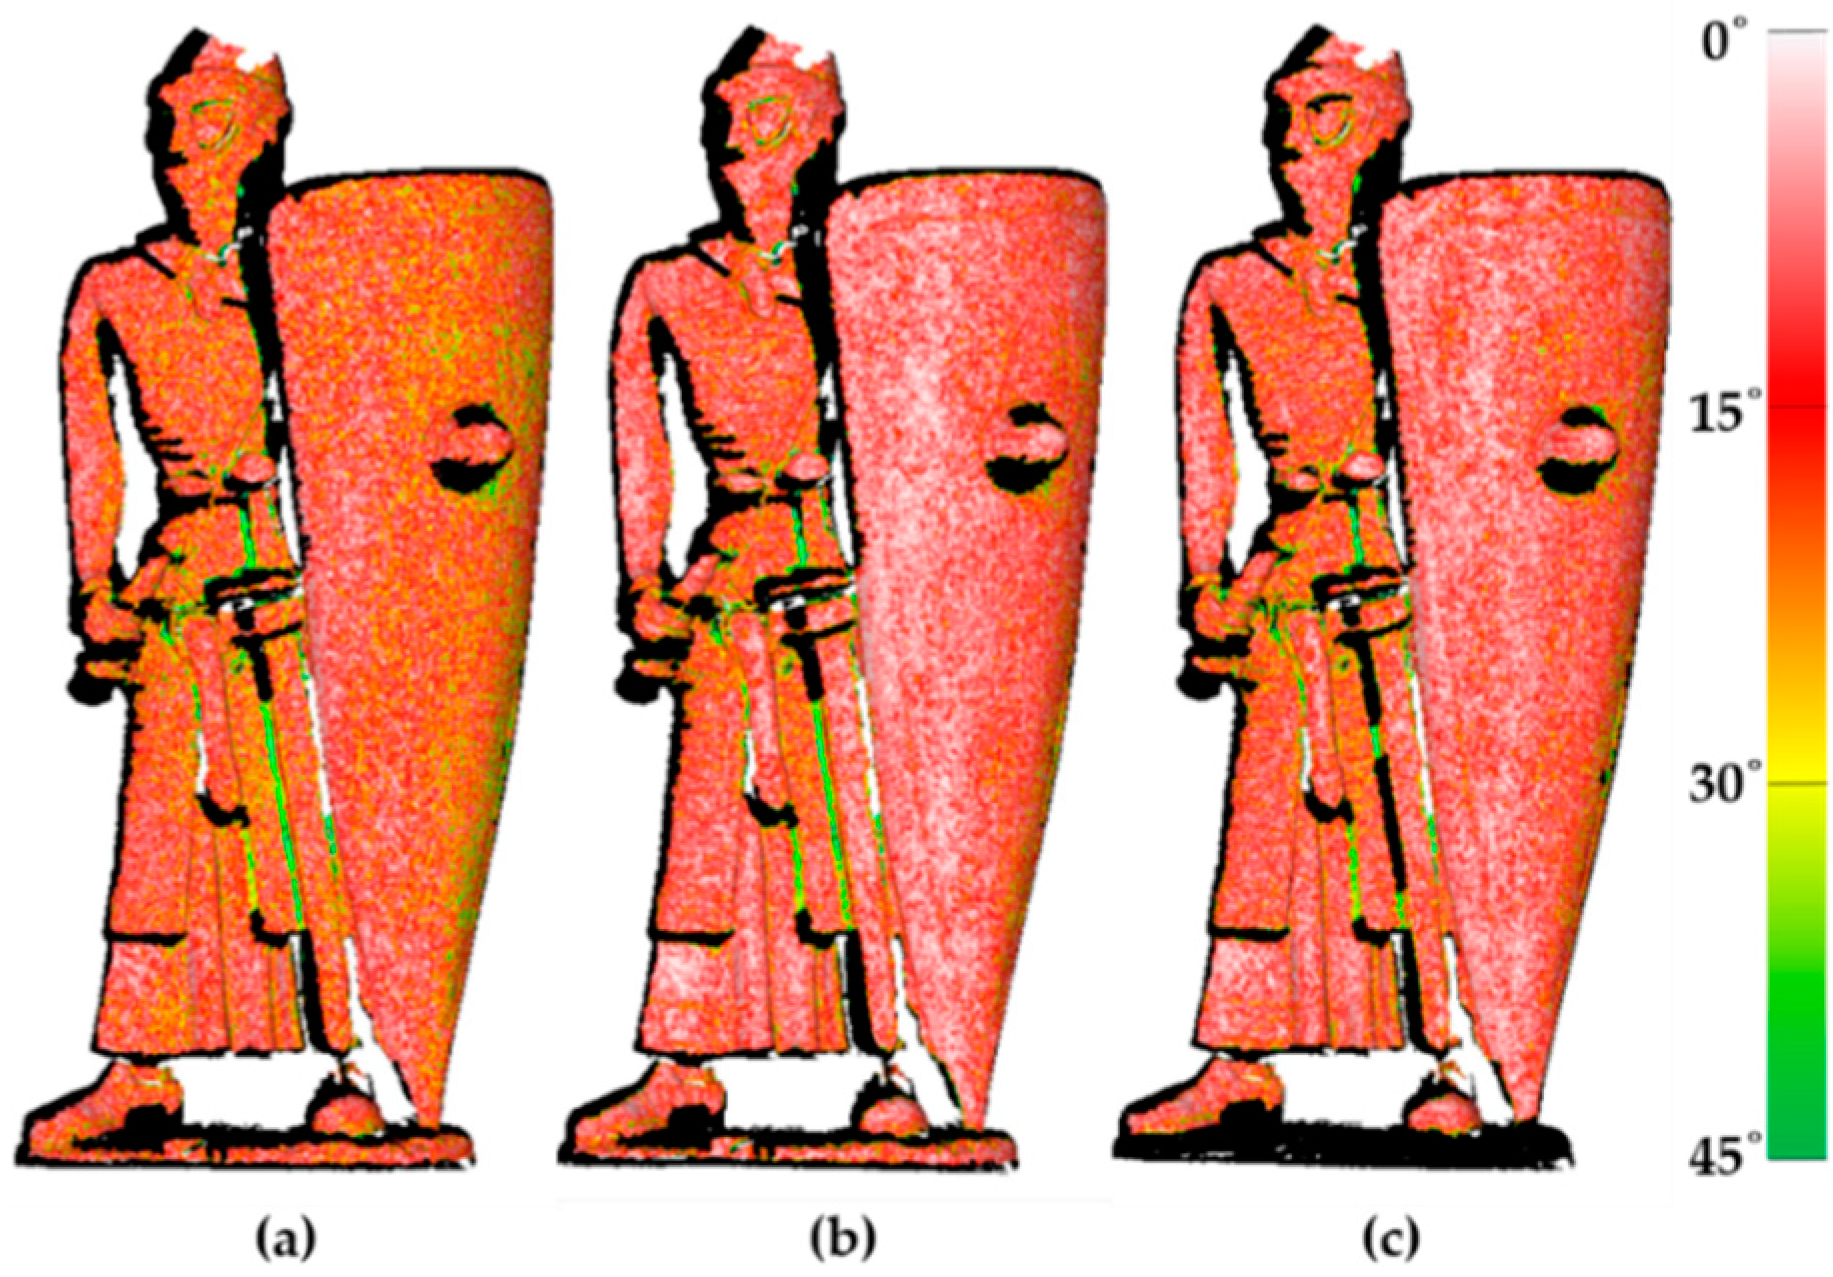
A comparison between normal vectors is also needed to see how much the surface detail is improved. Figure 11 shows the angular deviation between the normal vector of the ground truth and the other normal vector.
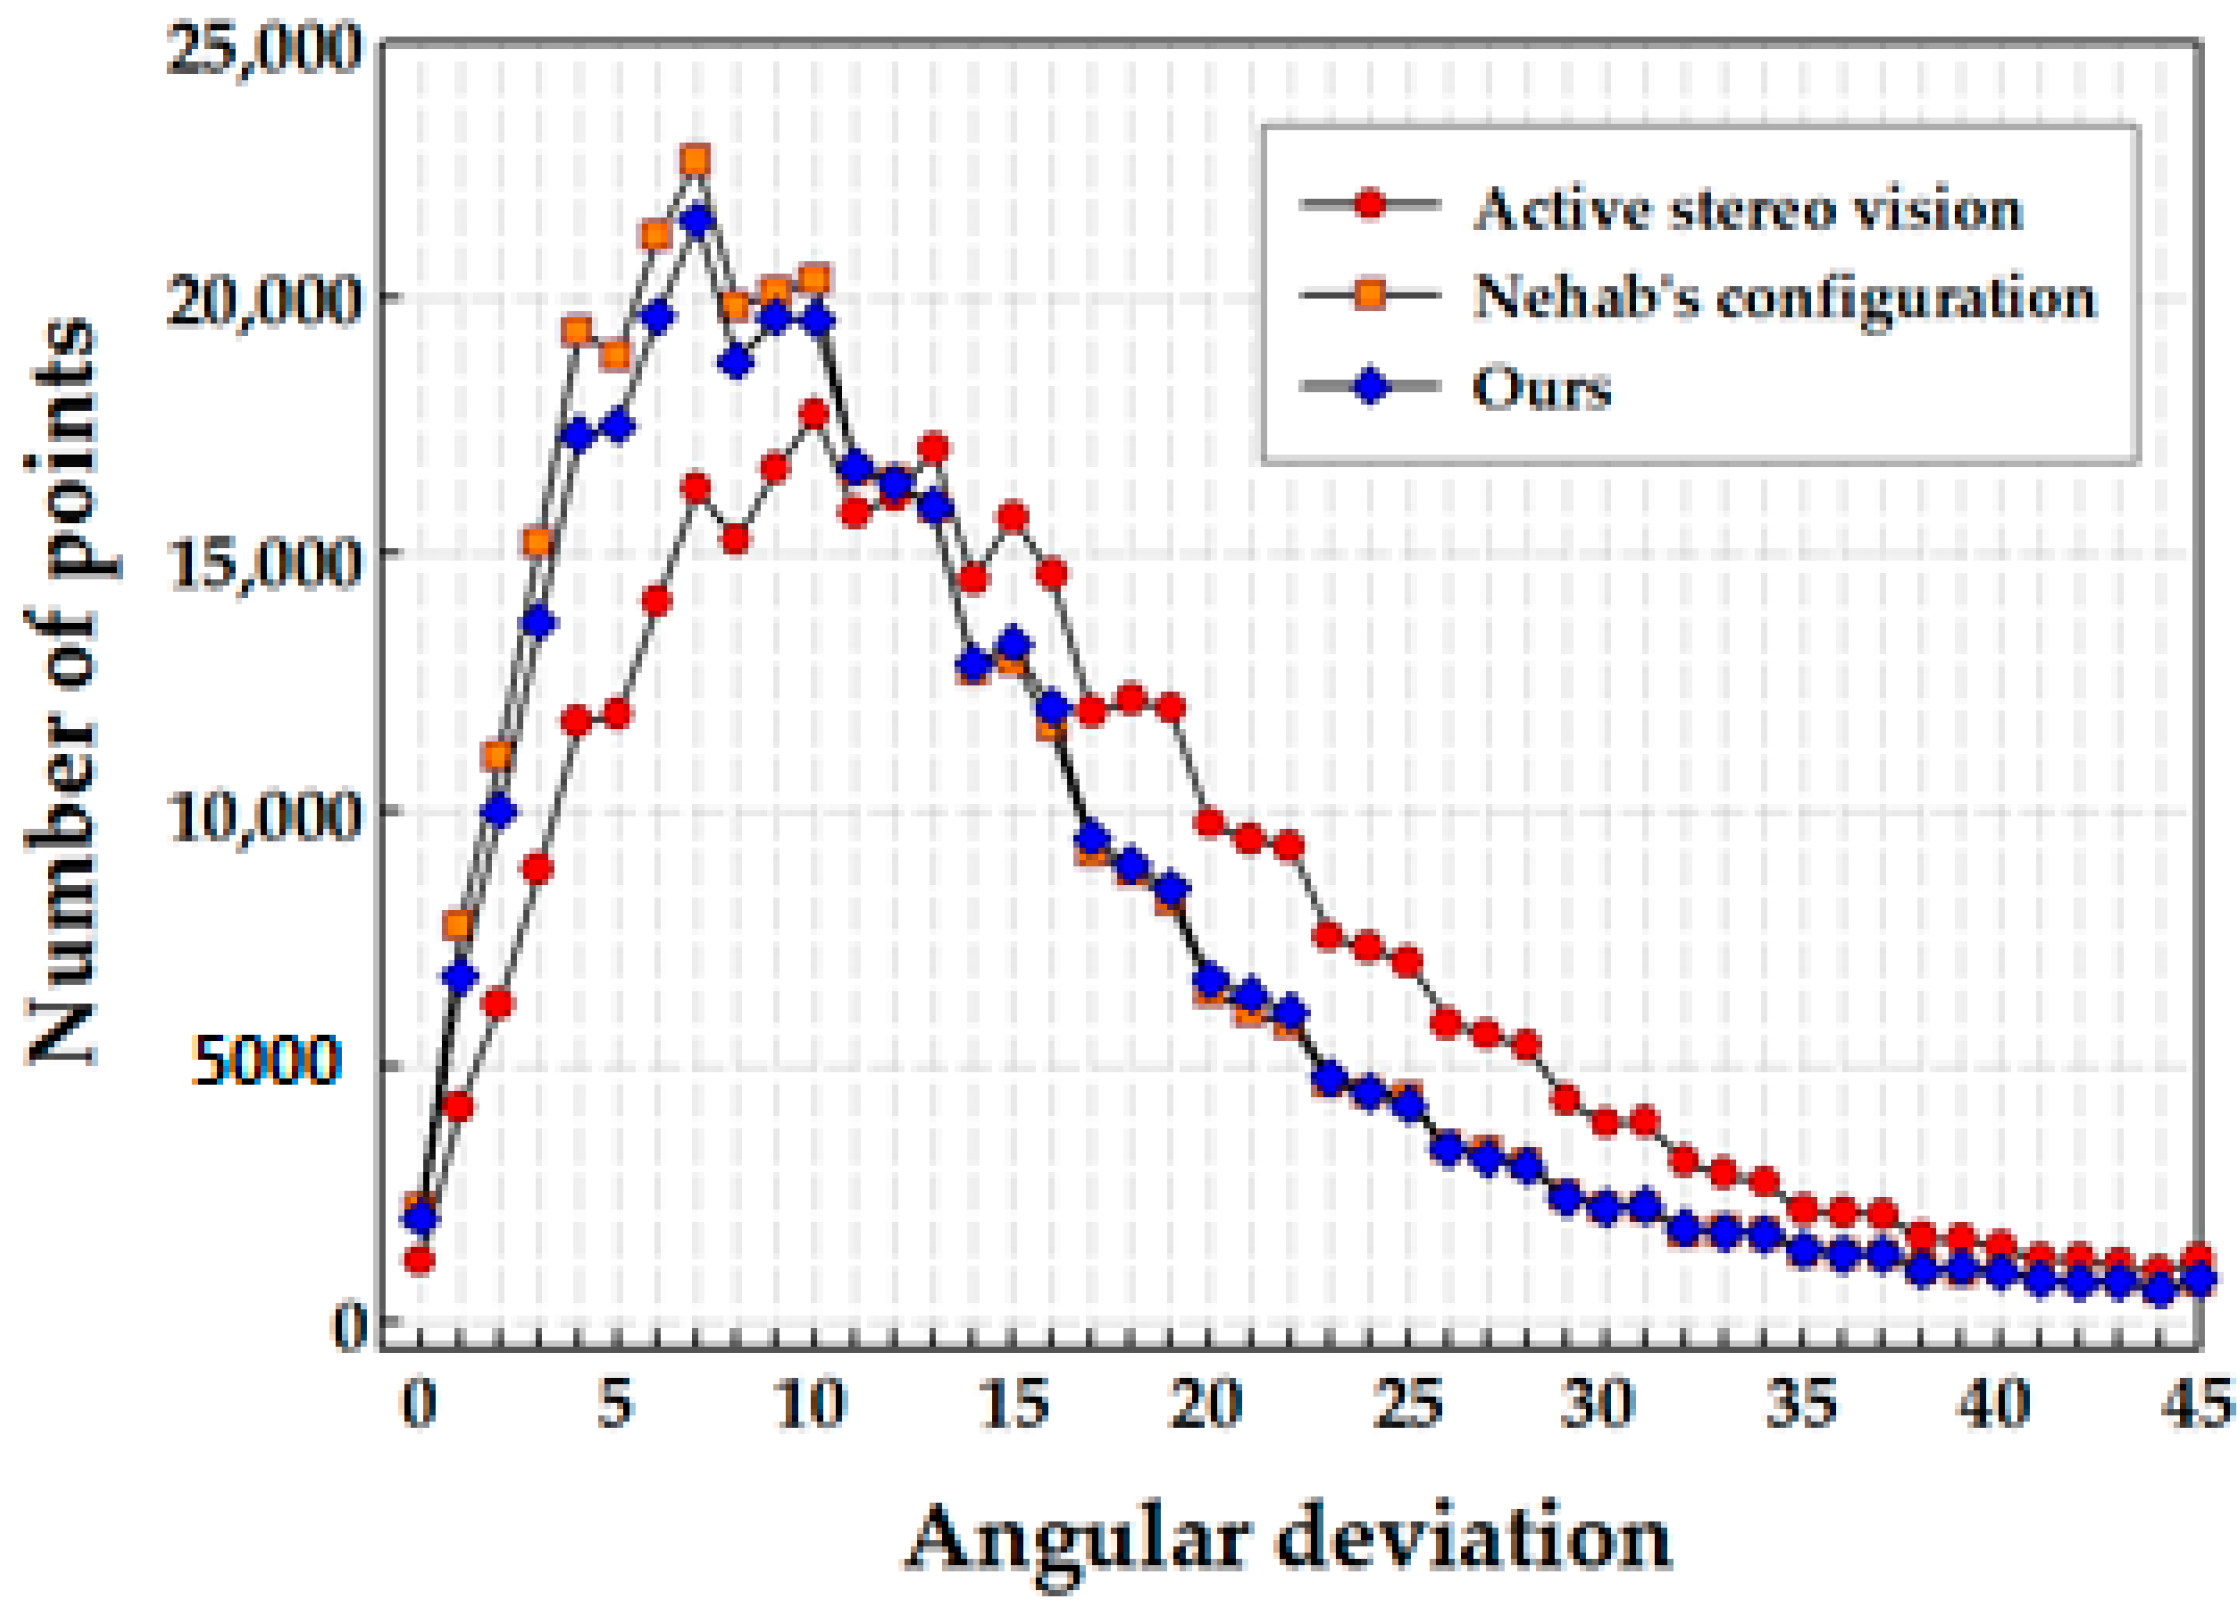
Figure 12 shows the angular deviation with the normal vector in terms of the number of points per deviation. Both Nehab’s configuration with external light sources and our configuration without external light sources show an increase in the number of points, with the angular deviation under 12°, thereby showing that the surface detail has improved, compared to the original stereo vision scan data. To use Nehab’s algorithm, an external light source is required, increasing the size and complexity of the equipment. However, our configuration does not require any external light source in order to use Nehab’s algorithm, which improves the quality of the 3D scan data.
5. Conclusions
In this study, we implemented a photometric stereo method using re-projected images under a stereo vision system, which does not use any external light sources. Comparing the normal vectors obtained from the traditional photometric stereo method (which uses external light sources), we confirmed that our re-projection method also works well in obtaining the normal vectors, even without external light sources. We applied each of these normal vectors to Nehab’s method to improve the quality of 3D scan data, and found that the precision of the 3D scan data and surface details are better than those of the stereo vision system. Our proposed method requires no external light sources; thus, it can be implemented in the existing stereo vision system without any additional equipment. This brings an advantage in size and complexity compared to the traditional photometric stereo system or Nehab’s configuration. Another advantage of our method is that time for taking images required for the algorithm is shorter, while having no significant difference in terms of computational cost. We expect that this study can help improve the quality of 3D scan data with minimal additional cost.
Acknowledgments
This research was supported by the Technology Innovation Program (10065150, Development for Low-Cost and Small LIDAR System Technology Based on 3D Laser scanning for 360 Real-time Monitoring), funded by the Ministry of Trade, Industry & Energy (MOTIE, Korea) and the Korea Evaluation Institute of Industrial Technology (KEIT, Korea).
Author Contributions
Keonhwa Jung and Taehwan Choi proposed the method of the research, designed the experiments and wrote the manuscript. Seokjung Kim and Sungbin Im performed the experiments. Minho Chang provided the expertise in 3D measurement. All authors approved the final version of the manuscript.
Conflicts of Interest
The authors declare no conflict of interest.
References
- Chen, F.; Brown, G.M.; Song, M. Overview of three-dimensional shape measurement using optical methods. Opt. Eng. 2000, 39, 10–22. [Google Scholar]
- Bernardini, F.; Rushmeier, H.; Ioana, M. Building a digital model of Michelangelo’s Florentine Pietà. IEEE Comput. Graph. Appl. 2002, 22, 59–67. [Google Scholar] [CrossRef]
- Seno, T.; Ohtake, Y.; Kikuchi, Y.; Saito, N.; Suzuki, H.; Nagai, Y. 3D scanning based mold correction for planar and cylindrical parts in aluminum die casting. J. Comput. Des. Eng. 2015, 2, 96–104. [Google Scholar] [CrossRef]
- Betta, G.; Capriglione, D.; Corvino, M.; Lavatelli, A.; Liguori, C.; Sommella, P.; Zappa, E. Metrological characterization of 3D biometric face recognition systems in actual operating conditions. ACTA IMEKO 2017, 6, 33–42. [Google Scholar] [CrossRef]
- Fu, X.; Peng, C.; Li, Z.; Liu, S.; Tan, M.; Song, J. The application of multi-baseline digital close-range photogrammetry in three-dimensional imaging and measurement of dental casts. PLoS ONE 2017, 12. [Google Scholar] [CrossRef] [PubMed]
- He, L.; Yang, J.; Kong, B.; Wang, C. An automatic measurement method for absolute depth of objects in two monocular images based on sift feature. Appl. Sci. 2017, 7, 517. [Google Scholar] [CrossRef]
- Li, Y.; Li, Z. A multi-view stereo algorithm based on homogeneous direct spatial expansion with improved reconstruction accuracy and completeness. Appl. Sci. 2017, 7, 446. [Google Scholar] [CrossRef]
- Besl, P.J. Active optical range imaging sensors. Mach. Vis. Appl. 1989, 1, 127–152. [Google Scholar] [CrossRef]
- Valkenburg, R.J.; McIvor, A.M. Accurate 3D measurement using a structured light system. Image Vis. Comput. 1998, 16, 99–110. [Google Scholar] [CrossRef]
- Geng, J. Structured-light 3D surface imaging: A tutorial. Adv. Opt. Photonics 2011, 3, 128–160. [Google Scholar] [CrossRef]
- Woodham, R.J. Photometric method for determining surface orientation from multiple images. Opt. Eng. 1980, 19, 139–144. [Google Scholar] [CrossRef]
- Hernandez, C.; Vogiatzis, G.; Cipolla, R. Multiview photometric stereo. IEEE Trans. Pattern Anal. Mach. Intell. 2008, 30, 548–554. [Google Scholar] [CrossRef] [PubMed]
- Basri, R.; Jacobs, D.; Kemelmacher, I. Photometric stereo with general, unknown lighting. Int. J. Comput. Vis. 2007, 72, 239–257. [Google Scholar] [CrossRef]
- Nehab, D.; Rusinkiewicz, S.; Davis, J.; Ramamoorthi, R. Efficiently combining positions and normals for precise 3D geometry. ACM Trans. Graph (TOG) 2005, 24, 536–543. [Google Scholar] [CrossRef]
- Malzbender, T.; Wilburn, B.; Gelb, D.; Ambrisco, B. Surface enhancement using real-time photometric stereo and reflectance transformation. In Proceedings of the 17th Eurographics Conference on Rendering Techniques, Nicosia, Cyprus, 26–28 June 2006; pp. 245–250. [Google Scholar]
- Herbort, S.; Gerken, B.; Schugk, D.; Wöhler, C. 3D range scan enhancement using image-based methods. ISPRS J. Photogramm. Remote Sens. 2013, 84, 69–84. [Google Scholar] [CrossRef]
- Park, J.; Sinha, S.N.; Matsushita, Y.; Tai, Y.W.; Kweon, I.S. Multiview photometric stereo using planar mesh parameterization. Proc. IEEE Int. Conf. Comput. Vis. 2013, 39, 1161–1168. [Google Scholar]
- Im, S.; Lee, Y.; Kim, J.; Chang, M. A solution for camera occlusion using a repaired pattern from a projector. Int. J. Precis. Eng. Manuf. 2016, 17, 1443–1450. [Google Scholar] [CrossRef]
- Geomagic Control X. Available online: http://www.geomagic.com/en/products/control/overview (accessed on 25 August 2017).
Figure 1.
(a) Our active stereo vision system configuration; (b) Image taken from left camera: structured light is projected onto the target object; (c) Image taken from right camera: structured light is projected onto the target object; (d) Acquired 3D scan data.
Figure 1.
(a) Our active stereo vision system configuration; (b) Image taken from left camera: structured light is projected onto the target object; (c) Image taken from right camera: structured light is projected onto the target object; (d) Acquired 3D scan data.
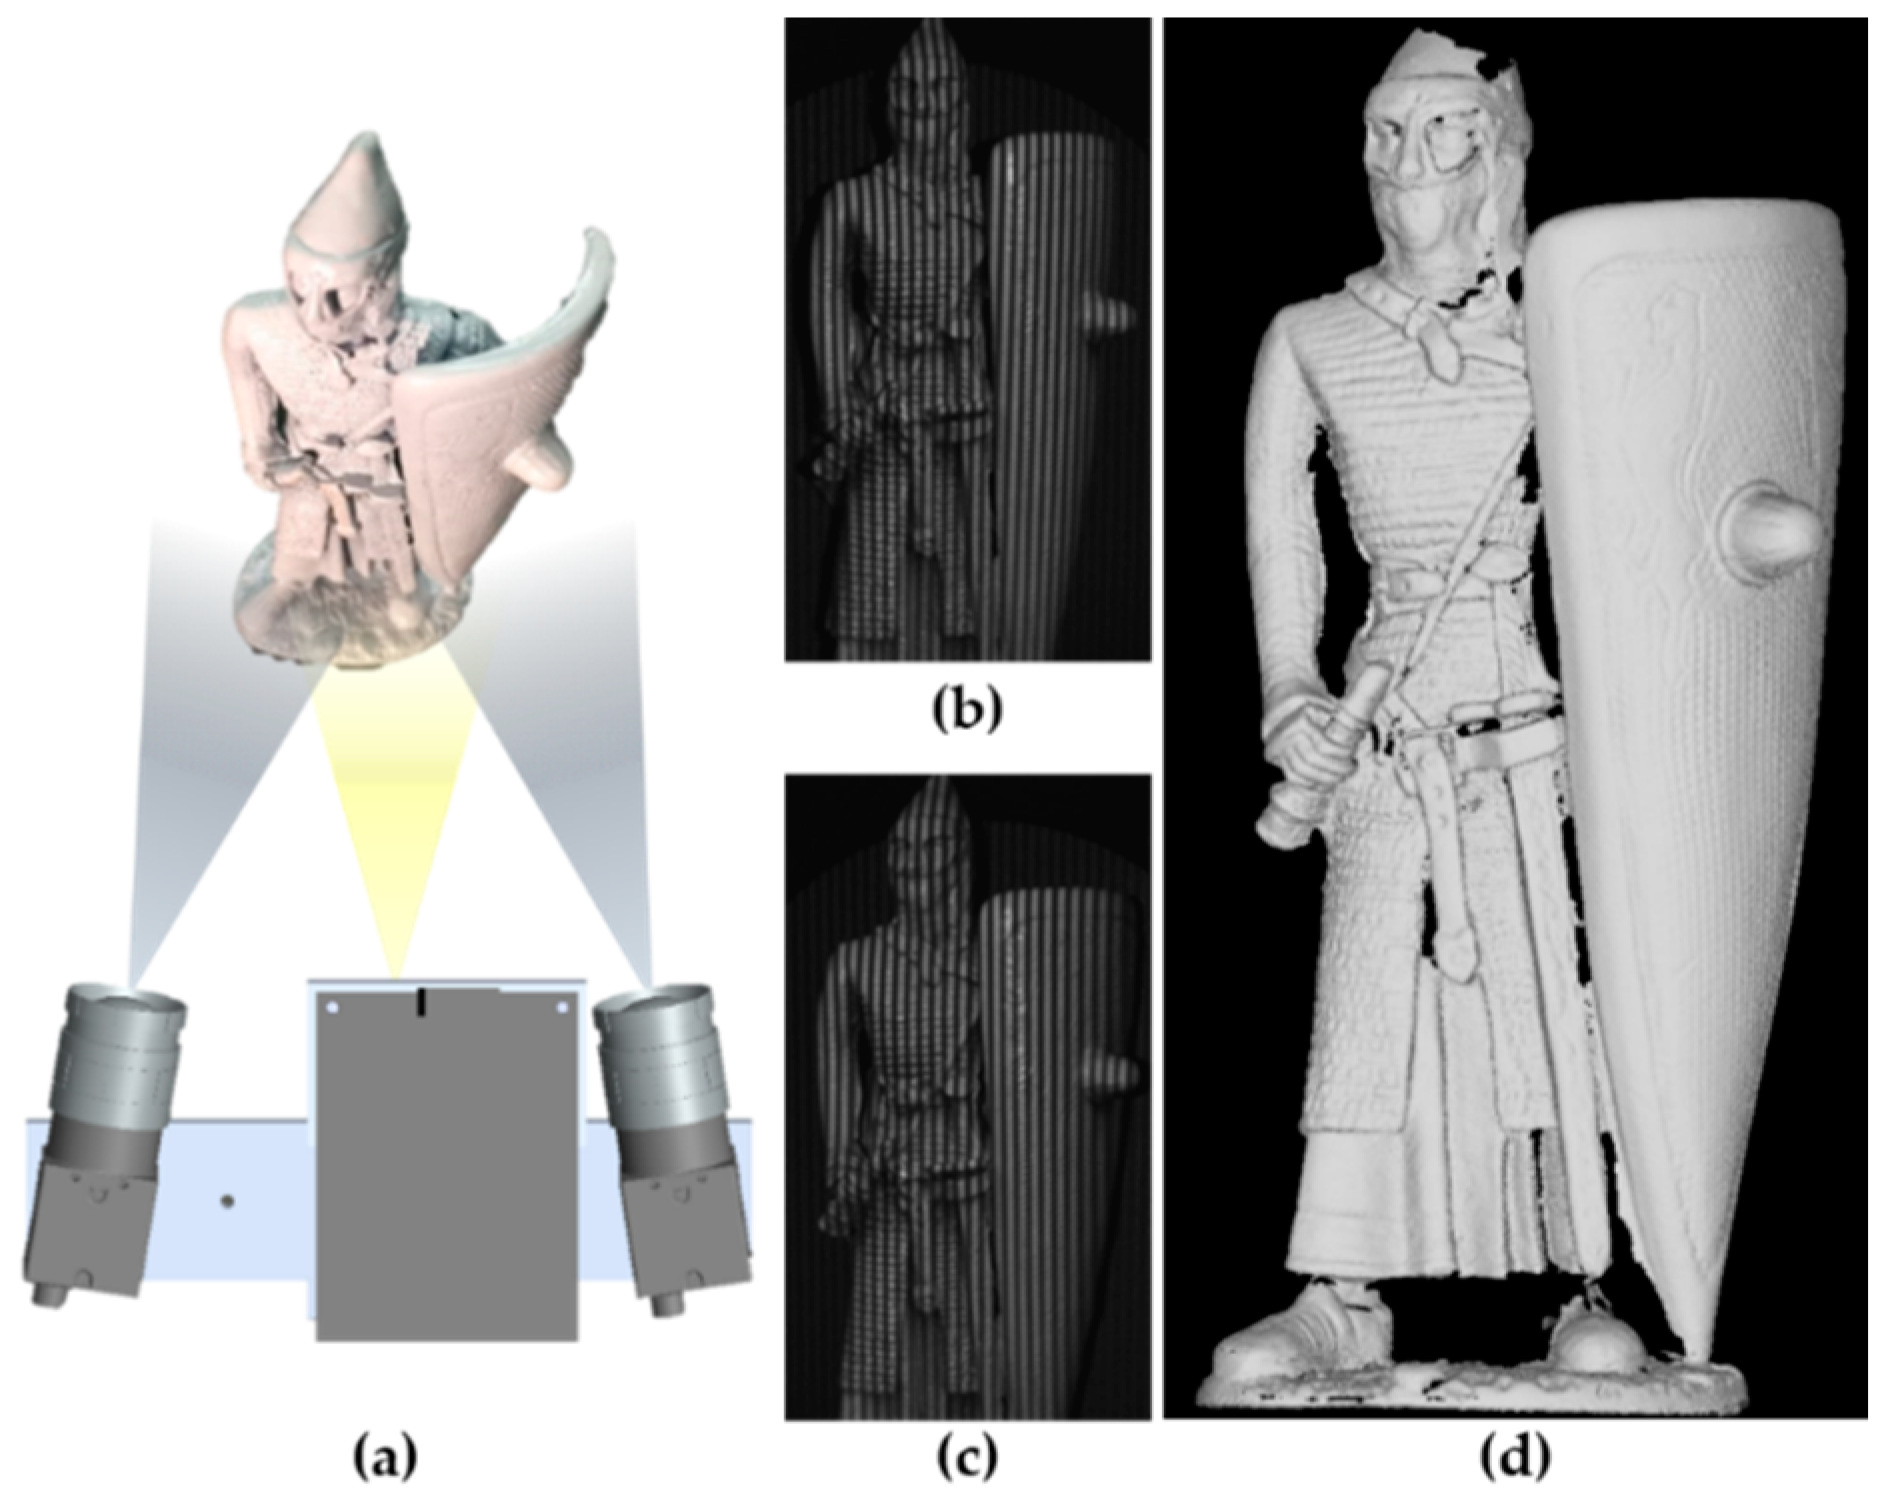
Figure 2.
(a) Our photometric stereo system configuration; (b–d) Images taken under different positions of external light source; (e) Acquired Normal map.
Figure 2.
(a) Our photometric stereo system configuration; (b–d) Images taken under different positions of external light source; (e) Acquired Normal map.

Figure 3.
Nehab’s configuration, which uses external light sources in order to use the photometric stereo method.
Figure 3.
Nehab’s configuration, which uses external light sources in order to use the photometric stereo method.
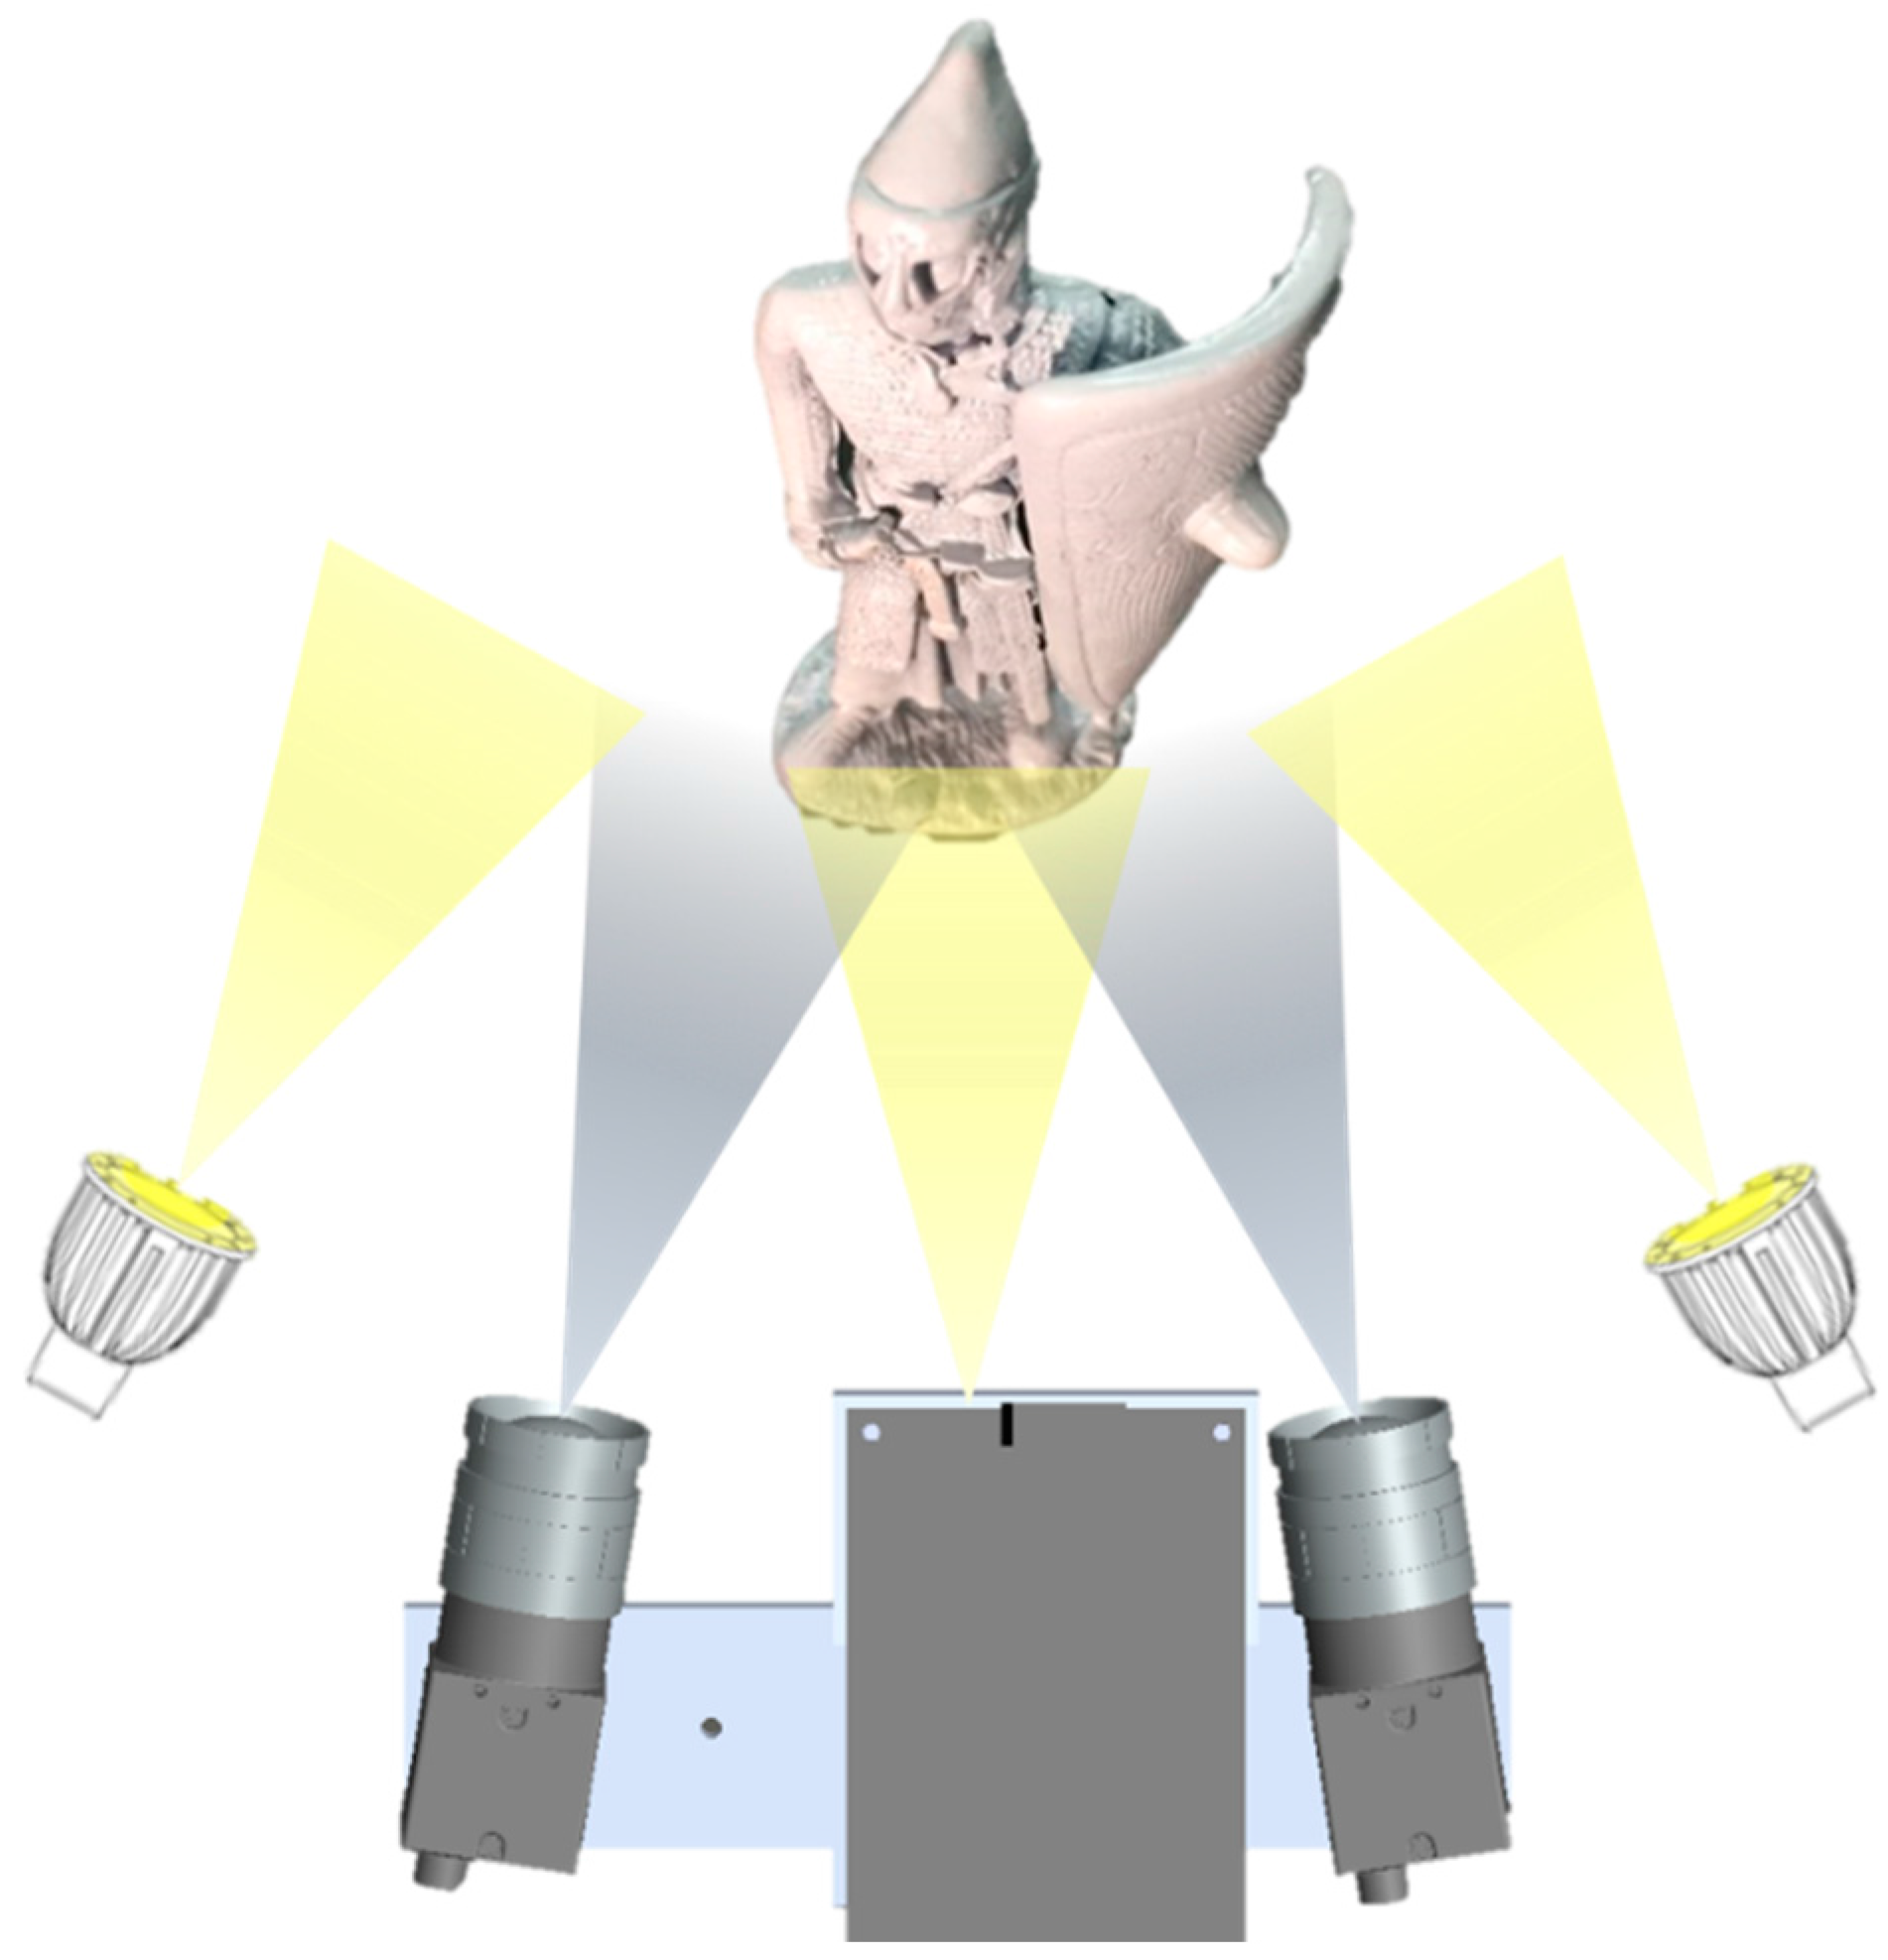
Figure 4.
(a) 3D scanning configuration at various viewpoints; (b) 3D scan data from position #1; (c) 3D scan data from position #2; (d) 3D scan data from position #3; (e) Registration result of the 3D scan data (b–d).
Figure 4.
(a) 3D scanning configuration at various viewpoints; (b) 3D scan data from position #1; (c) 3D scan data from position #2; (d) 3D scan data from position #3; (e) Registration result of the 3D scan data (b–d).
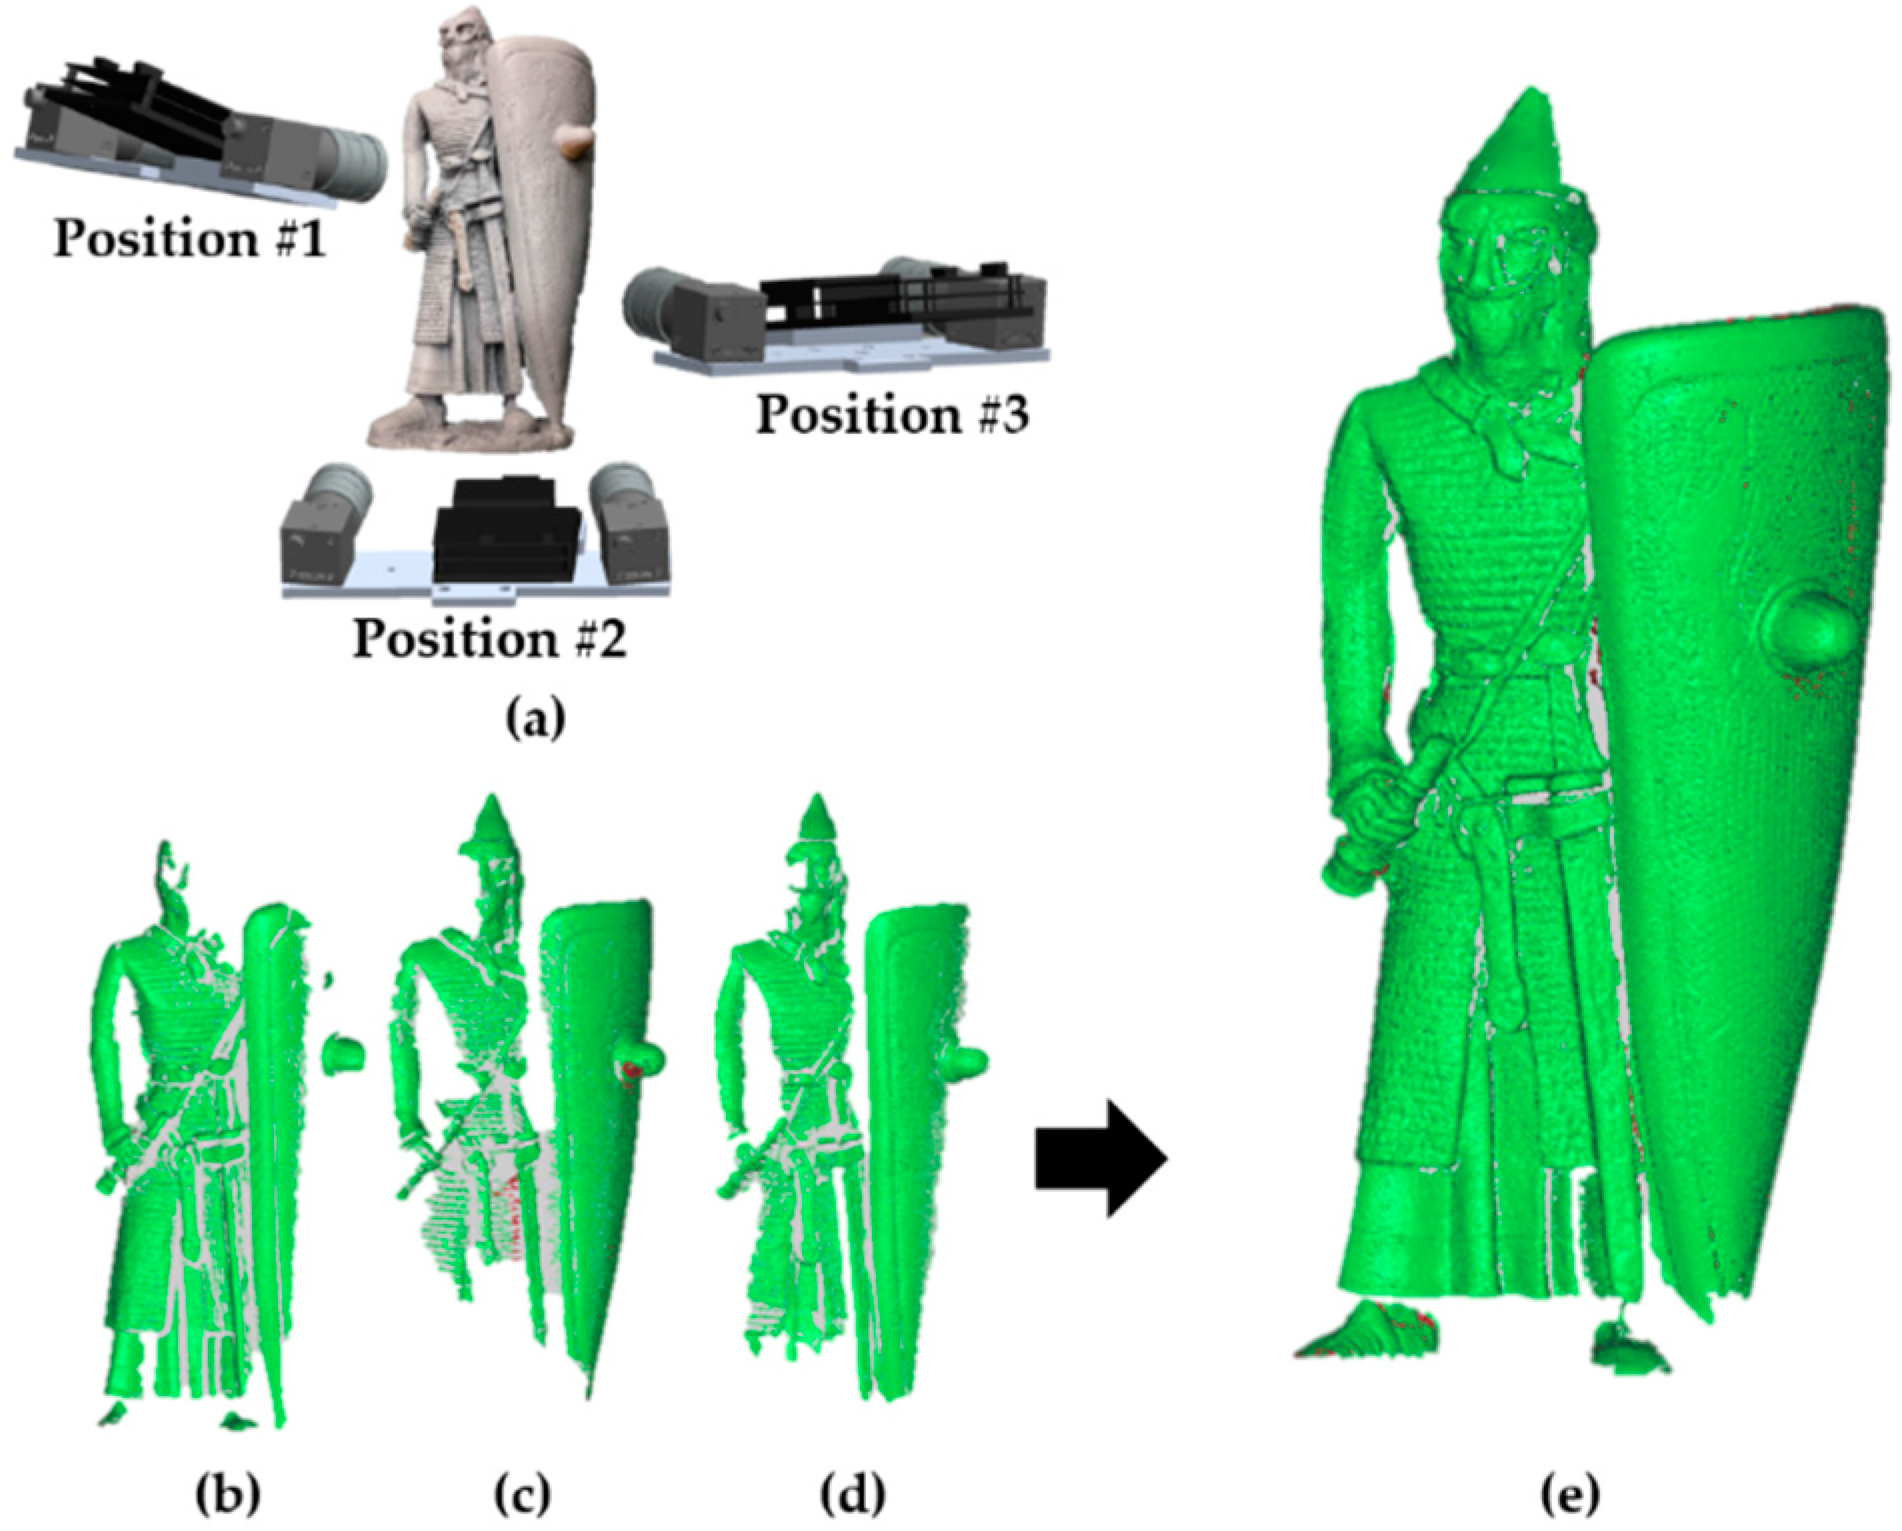
Figure 5.
(a) Image re-projection in two different positions; (b) Reference view image taken from left camera at position #1; (c) Other view image taken from left camera at position #2; (d) Re-projected image from the other view to the reference view which shows data acquired from position #2 in the perspective of camera #1.

Figure 6.
Bilinear interpolation for re-projected image. New intensity value of re-projected image Ic in reference view image is defined by Ip and Iq.
Figure 6.
Bilinear interpolation for re-projected image. New intensity value of re-projected image Ic in reference view image is defined by Ip and Iq.

Figure 7.
(a) Experiment environment; (b) Target object.

Figure 8.
Normal maps. (a) Normal vector obtained by stereo vision; (b) Normal vector obtained by traditional photometric stereo; (c) Normal vector obtained by photometric stereo using re-projection images.
Figure 8.
Normal maps. (a) Normal vector obtained by stereo vision; (b) Normal vector obtained by traditional photometric stereo; (c) Normal vector obtained by photometric stereo using re-projection images.

Figure 9.
3D rendering comparisons. (a) 3D scan data obtained by active stereo vision; (b) 3D scan data applying Nehab’s algorithm using traditional photometric stereo method; (c) 3D scan data applying Nehab’s algorithm using re-projection method.
Figure 9.
3D rendering comparisons. (a) 3D scan data obtained by active stereo vision; (b) 3D scan data applying Nehab’s algorithm using traditional photometric stereo method; (c) 3D scan data applying Nehab’s algorithm using re-projection method.

Figure 10.
Distance deviation of the points from ground truth. (a) Points obtained by active stereo vision; (b) Points after applying Nehab’s algorithm, which uses normal vector from the traditional photometric stereo method; (c) Points after applying Nehab’s algorithm, which uses normal vector from the re-projection method.

Figure 11.
Angular deviation of the normal vector to the ground truth. (a) Normal vector obtained by stereo vision; (b) Normal vector after applying Nehab’s algorithm, which uses normal vector from the traditional photometric stereo method; (c) Normal vector after applying Nehab’s algorithm, which uses normal vector from the re-projection method.

Figure 12.
Angular deviation of the normal vector.

Table 1.
Distance deviation of point data.
| Error (mm) | Active Stereo Vision | Nehab’s Configuration | Ours |
|---|---|---|---|
| RMS (root mean square) Estimate | 0.0490 | 0.0450 | 0.0454 |
| Standard deviation | 0.0489 | 0.0450 | 0.0454 |
© 2017 by the authors. Licensee MDPI, Basel, Switzerland. This article is an open access article distributed under the terms and conditions of the Creative Commons Attribution (CC BY) license (http://creativecommons.org/licenses/by/4.0/).
Share and Cite
MDPI and ACS Style
Jung, K.; Kim, S.; Im, S.; Choi, T.; Chang, M. A Photometric Stereo Using Re-Projected Images for Active Stereo Vision System. Appl. Sci. 2017, 7, 1058. https://doi.org/10.3390/app7101058
AMA Style
Jung K, Kim S, Im S, Choi T, Chang M. A Photometric Stereo Using Re-Projected Images for Active Stereo Vision System. Applied Sciences. 2017; 7(10):1058. https://doi.org/10.3390/app7101058
Chicago/Turabian StyleJung, Keonhwa, Seokjung Kim, Sungbin Im, Taehwan Choi, and Minho Chang. 2017. "A Photometric Stereo Using Re-Projected Images for Active Stereo Vision System" Applied Sciences 7, no. 10: 1058. https://doi.org/10.3390/app7101058
Note that from the first issue of 2016, this journal uses article numbers instead of page numbers. See further details here.