A Congestion Control Strategy for Power Scale-Free Communication Network

Key Laboratory of Industrial Internet of Things & Networked Control, Chongqing University of Posts and Telecommunications, Chongqing 400065, China
*
Author to whom correspondence should be addressed.
Appl. Sci. 2017, 7(10), 1054; https://doi.org/10.3390/app7101054
Submission received: 17 September 2017
/
Accepted: 11 October 2017
/
Published: 13 October 2017
(This article belongs to the Special Issue Distribution Power Systems)
Abstract
:The scale-free topology of power communication network leads to more data flow in less hub nodes, which can cause local congestion. Considering the differences of the nodes’ delivery capacity and cache capacity, an integrated routing based on the communication service classification is proposed to reduce network congestion. In the power communication network, packets can be classified as key operational services (I-level) and affairs management services (II-level). The shortest routing, which selects the path of the least hops, is adopted to transmit I-level packets. The load-balanced global dynamic routing, which uses the node’s queue length and delivery capacity to establish the cost function and chooses the path with minimal cost, is adopted to transmit II-level packets. The simulation results show that the integrated routing has a larger critical packet generation rate and can effectively reduce congestion.
1. Introduction
The power communication network is a private communication network that meets the effective operation and management of the power system [1]. The reliability of the power communication network, which is the supporting network for the smart grid, has been the prerequisite for economical and safe operation of the smart gird [2,3]. The power communication network is different from the public communication network because of multiple service types, which have different influences on the reliable operation of the power system. With the amount of data in the power communication network increasing explosively, the bottleneck nodes of the network are prone to congestion, resulting in that it is difficult to process the critical data in a timely manner, which endangers the safe operation of the power system [4,5,6]. Therefore, how to reduce the congestion in the power communication network becomes the key problem of the smart grid.
Since power grid status monitoring is moving towards Internet protocols and services, the existing Internet technologies should be modified with new protocols to fit into the real-time service requirements. There are many studies about the problem of communication network congestion. The work in [7] proposed a congestion avoidance algorithm based on traffic priority for an electric power dispatching digital network, which guaranteed the QoS of high priority services. The work in [8] proposed a low risk routing method based on the fact that different types of traffic have different service importance levels to reduce the risk of the power communication network. In [9], when the number of nodes in the power communication network increases to a certain extent, the scale-free characteristic is shown in the network. In [10], a routing algorithm based on a complex network was proposed, and the relationship between node congestion level and betweenness centrality was studied. The work in [11] proposed a protocol to work with a free-scale peer-to-peer network, by using the information about the network’s architecture and by representing message dependencies at the bit level. In [12], the node betweenness is used to compute edge weights and then routed by the shortest path. In [13], the next-hop node was selected by studying the gravitational effect of the node in the packet transmission process, which takes the path length and the waiting time into account. In [14,15], a global dynamic routing strategy was proposed, which took the queue length of each node in the path as the route cost. In [16], the optimal path was found by predicting the queues of neighbor nodes and combining the shortest path routing. In [17], a heuristic algorithm for the optimization of transport was proposed to enhance traffic efficiency in complex networks. However, the above existing studies for the communication network do not take the scale-free characteristic of the power communication network topology and power communication service level into consideration when doing research on local congestion. The scale-free topology is characterized by a power-law distribution of the node degrees, which shows that there is a small number of highly connected nodes in the network called hub nodes. Therefore, the characteristic of scale-free networks easily causes local network congestion at hub nodes.
In order to solve the local congestion problem of the power communication network, the topology model of the power communication network is established, and the delivery capacity and cache capacity of nodes are allocated according to node betweenness. Communication services are divided into two levels based on the importance of the power communication services, including key operational services of the I-level and affairs management services of the II-level. An integrated routing strategy composed of shortest path routing and global dynamic routing is proposed. Among them, the shortest path routing is adopted to transmit I-level packets, which can guarantee that the important communication packets are transmitted to the destination as soon as possible. Additionally, the global dynamic routing is adopted to transmit II-level packets to avoid the hub nodes being overloaded. Therefore, the delivery path depends on the communication services level. The minimum number of nodes between the source and destination is obtained under the shortest path routing. The cost function is set by considering the queue length and delivery capacity information of nodes in the path, and the path with the minimal cost is selected to transmit the packets under the global dynamic routing.
2. Power Communication Network Model
The high reliability power communication network architecture is composed of the core network, backbone network and access network, as shown in Figure 1.
The provincial control center and the provincial backup control center are set as core nodes; the dispatching stations and core substations are set as backbone nodes; the 110-kV, 220-kV and 500-kV substations are set as access nodes. The links of provincial control center and core substations are ring connection, and the links of dispatching stations and substations are dual homing connection, as shown in Figure 2.
Power communication network is a typical complex network with the scale-free characteristic. Based on the idea of graph theory, the topology model of the power communication network is built, and the modeling rules are as follows.
- The provincial power communication network is set as a unit, and only the communication networks of 110 kV and above are considered, including power plants, substations and dispatching institutions.
- The communication nodes and dispatch centers of the stations (power plants, substations and converter station) are abstracted as nodes without differences.
- The communication lines between communication nodes are abstracted as edges. The communication lines are bidirectional communication, and the differences between the communication lines are ignored, that is none of the edges have weights or direction.
- Multiple communication links in the same direction are merged, and self-loops are eliminated.
Based on the modeling rules, the power communication network can be built as an undirected graph with N nodes and M edges, that is:
where V = {v1, v2, ..., vN} is the set of nodes in the network and E = {} is the set of links. When = 1, there is a link between nodes vi and vj; otherwise, = 0. = {()} denotes the set of link weights.
The typical scale-free characteristic is shown in the power communication network, and the degree distribution p(k) follows the power-law distribution, as shown in Equation (2).
where k is the node degree, Nk is the number of nodes with the degree k, p(k) is the proportion of nodes with degree k and γ is the exponent. The power-law distribution shows that the scale-free network has strong heterogeneity, and there are a few hub nodes with very large degrees.
There is a huge amount of data, and the characteristics of the complex relationship between nodes are shown in the power communication network. In the process of packet delivery, the load distribution is uneven, and the local congestion usually occurs at the hub nodes. If the heavy load on hub nodes can be redistributed to the idle nodes when congested, then the hub nodes can avoid being more congested. Therefore, how to improve network throughput, reduce network congestion and ensure the efficient transmission of important packets under the limited condition of nodes’ resources have become urgent issues.
3. Congestion Control Strategy for the Power Scale-Free Network
In the power communication network, the traditional shortest path routing is usually adopted to deliver packets. Some hub nodes are needed to bear very heavy load, which may result in communication network congestion. During the period of congestion, the real time data flows may not meet the delay requirements, which lead the critical networks of the power grid into an unstable state. In order to effectively balance the data flow and obtain a larger network capacity, as well as reduce network congestion in the power communication network, an integrated routing strategy based on service classification with the reasonable allocation of nodes’ delivery capacity and cache capacity is proposed.
3.1. Allocation of Resources to Communication Nodes
Because the delivery capacity and cache capacity of the power communication nodes are limited and the scale-free characteristic is shown in the power communication network topology, if the nodes’ resources are evenly distributed, this will cause the hub nodes to be overloaded. Therefore, it is important that the limited resources are allocated reasonably to improve the traffic efficiency of the whole network. In order to ensure that the nodes’ resources can be effectively utilized, the nodes’ delivery capacity and cache capacity are allocated based on the node betweenness, and the following parameters are defined.
- Bi is the betweenness of power communication node i, and it is denoted by the number of the shortest paths through node i.
- Ci is the delivery capacity of power communication node i, and it is denoted by the maximum number of packets Ci that node i can deliver at each time step.
- Li is the maximum number of packets that power communication node i can cache, and when the cache capacity is full, the incoming packets will be discarded.
- ni is the queue length of node i, and it is denoted the load of power communication node i.
The node betweenness is the fixed value after the network topology is determined, so the allocation of nodes’ resources is no longer changed. The delivery capacity Ci and cache capacity Li of the power communication nodes can be denoted as Equation (3).
where is the sum of the node betweenness, and the total delivery capacity and cache capacity resources are denoted as C and L, respectively. For the specific power communication network, C and L are deterministic values. In the allocation strategy, to ensure that the communication nodes’ deliver capacity and cache capacity are integers greater than zero, the calculation results are rounded up to the nearest integer.
3.2. Classification of Power Communication Services
Compared with the public communication network services, the power communication services are more important, and huge losses would be brought to the power grid when congestion occurs. In the power communication network, the following three services are included, as shown in Table 1.
In Table 1, different communication quality, delays, and so on, are required for different communication services. To ensure the stable operation of the power grid, the real-time requirements of core services should be very high, such as the safety monitoring data and automated dispatch instructions. A slight delay in the delivery process may cause a huge loss, so the core services must reach the destination in a short time interval. On the contrary, the real-time requirements of the administrative telephone are lower. The administrative telephone is mainly responsible for the power grid company administration and daily office management, which has less effect on the normal operation of the power grid. Therefore, according to the importance of services and the requirement of delay, the power communication services are divided into two levels, including key operational services of the I-level and affairs management services of the II-level, as shown in Table 2.
The amount of key operational services is small, but the requirements of real-time and reliability are very high; and the data flow of affairs management services is large and changes fast, but the requirement of delay is lower than key operational services [18]. Compared with II-level services, the amount of data of I-level services in the power communication network is smaller, but I-level services are more important. In order to make the routing algorithm better suitable for the power communication network and guarantee the key operational services’ timely deliver to the destination, integrated routing is proposed. The data packets contain the class information including I-level services and II-level services, and the data packets are put into the appropriate class queue of the root based on the information classifiers. Assuming that the proportion of the I-level packet generation is λ at each time step and the proportion of the II-level packet generation is 1 − λ and [0, 1], different proportions of different service levels have an impact on the efficiency of data transmission in the power communication network.
3.3. Integrated Routing Strategy
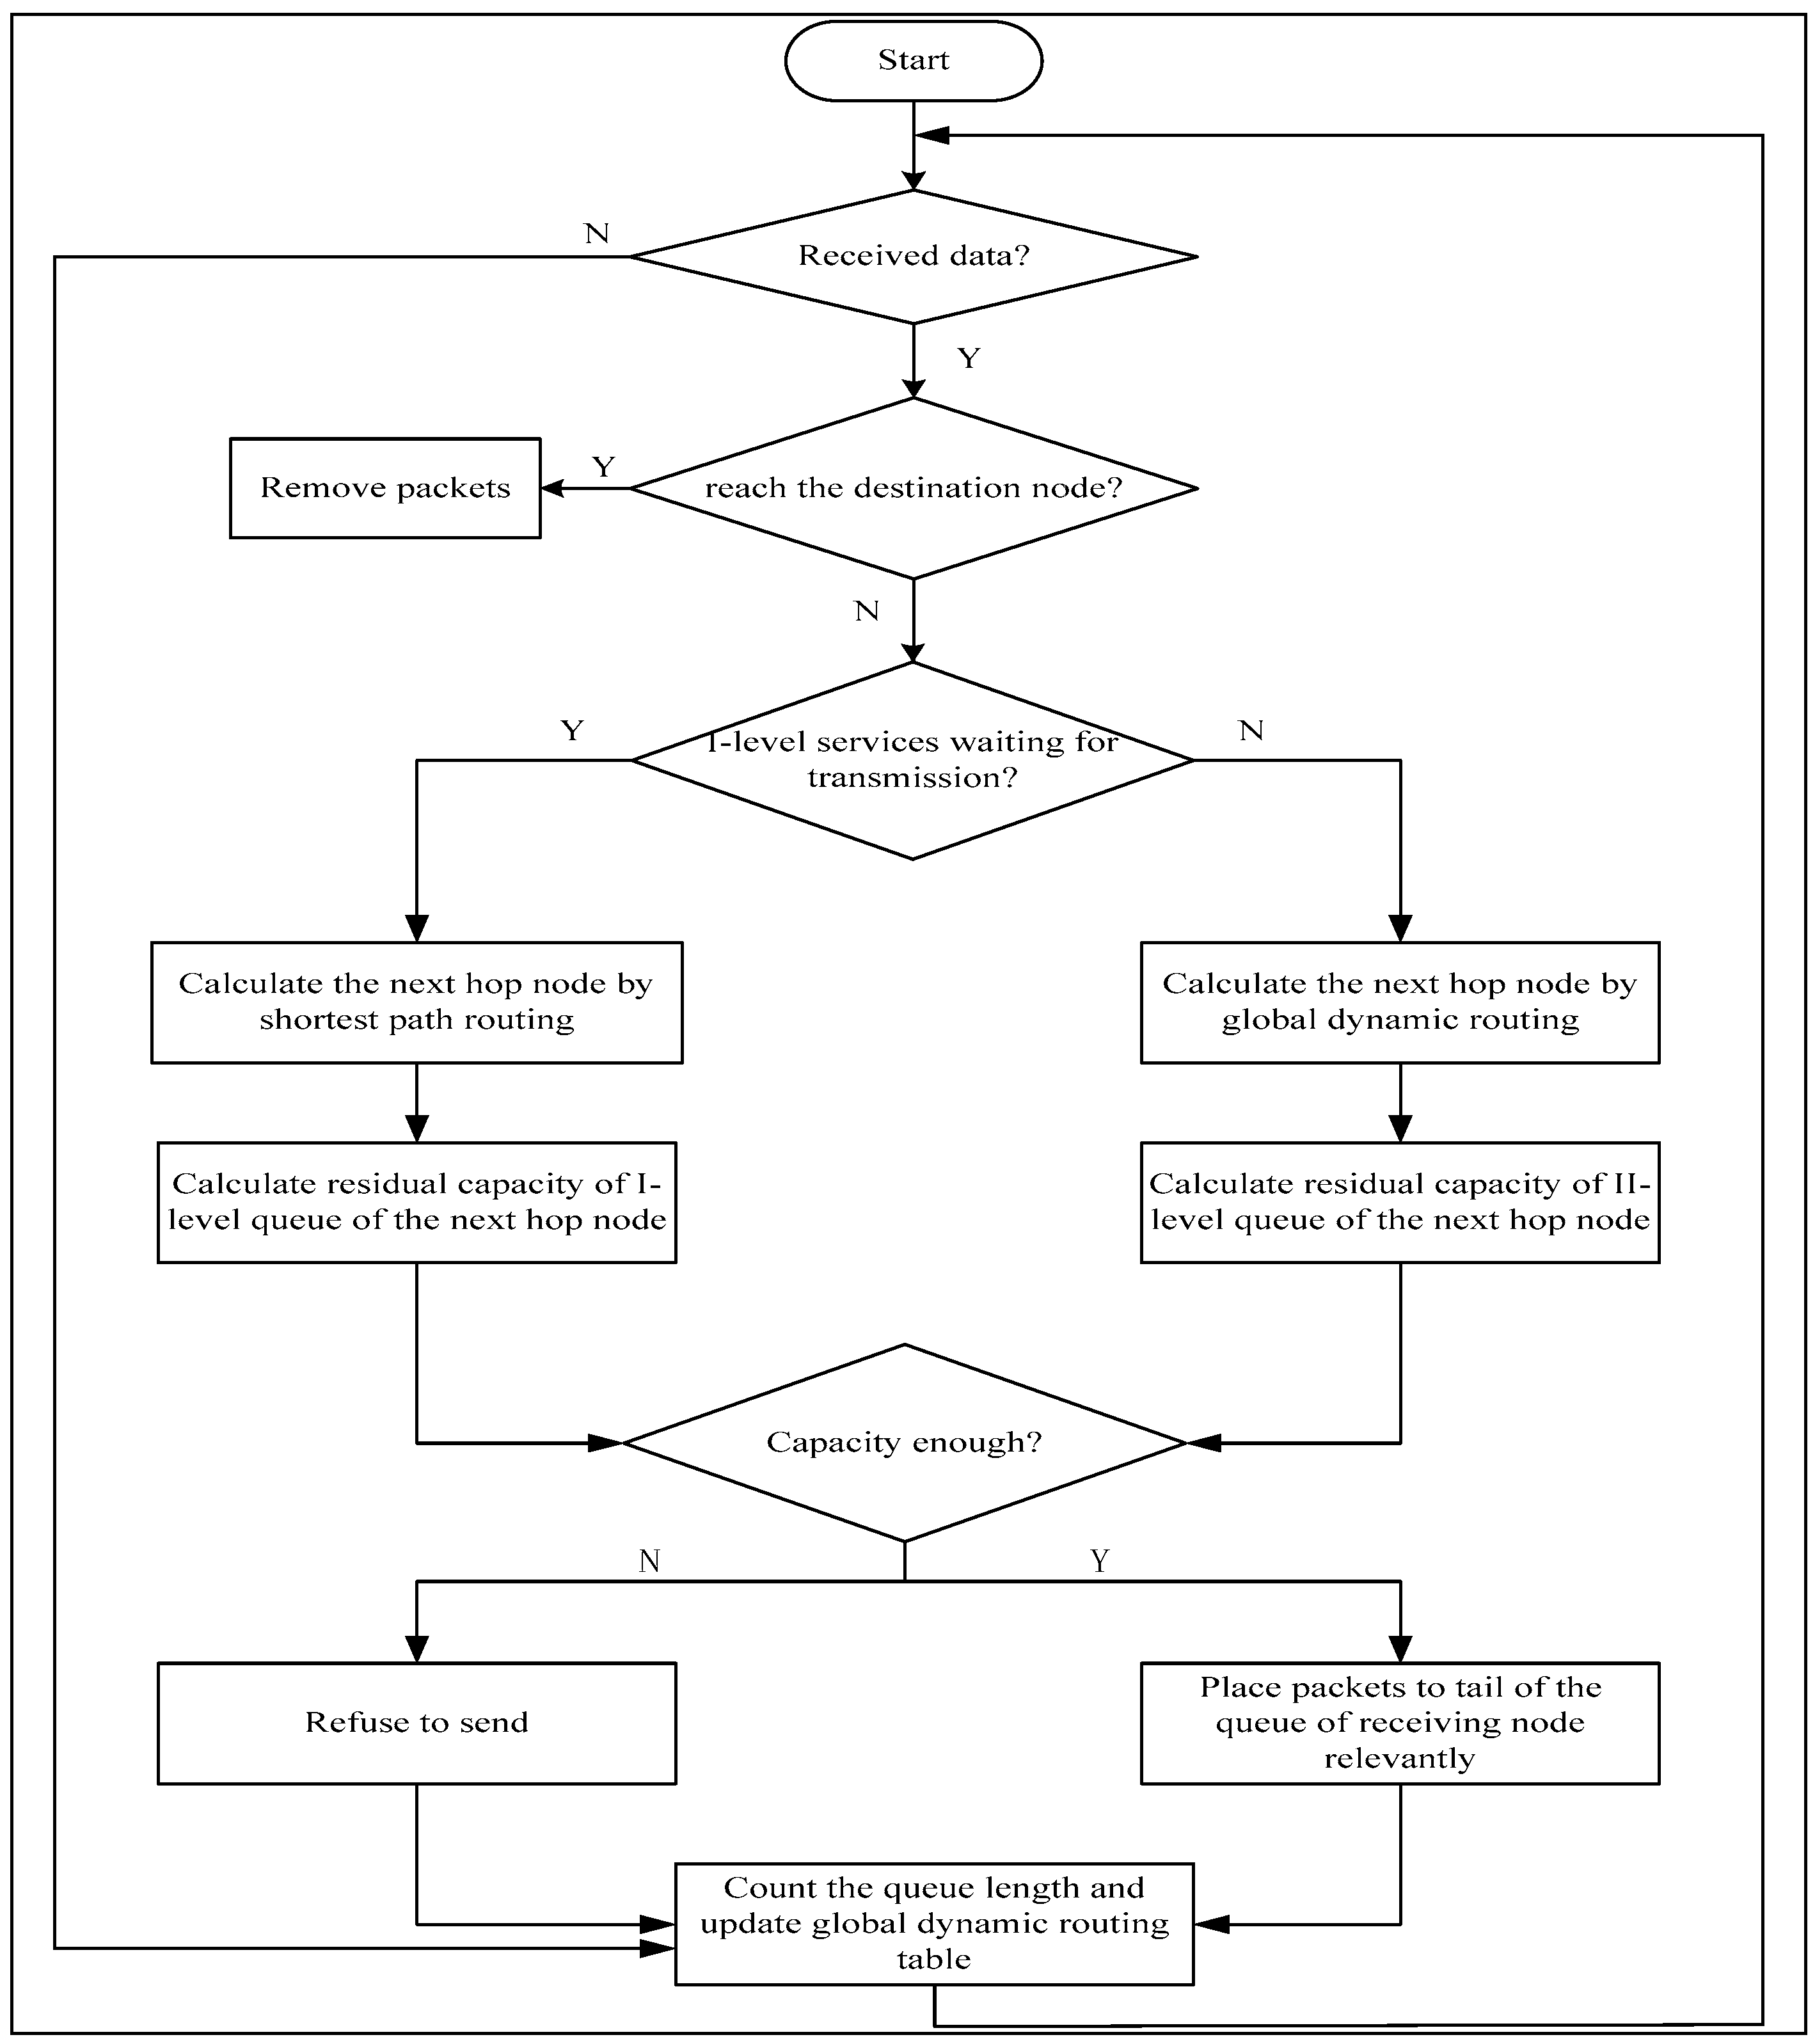
In the power communication network, the shortest path routing strategy is widely used, which reflects an incomparable superiority when network packets are less. However, as network packets increase, the packets prefer to go through these hub nodes under the shortest path routing strategy, which further exacerbates network congestion and even endangers the normal operation of the power grid. The real-time queue lengths of nodes are considered as routing costs to dramatically redistribute the overall data flow on all nodes under the global dynamic routing strategy. However, the routing table needs to be updated under the global dynamic routing at each time step, and much of the computational resource will be consumed. Integrated routing combines the advantages of these two routing strategies and makes up for the weakness. If the shortest routing is adopted to transmit I-level packets and the global dynamic routing is adopted to transmit II-level packets, which can guarantee the real-time requirement of the important communication services and reduce the network congestion, the incoming packets to different paths from the source to the destination are evenly distributed under the integrated routing, and the fundamental structure of the node queue is shown in Figure 3.
When the packet enters the router, it must pass through the following four processes: (1) the packet is stored in the buffer of the receive port; (2) the packet is processed by the distribution scheduler and copied to the buffer queue of the forwarding port; (3) each queue packet is copied to the output buffer queue by the packet polling scheduler according to the fair queuing algorithm; (4) the packet is forwarded, and the processes are shown in Figure 4.
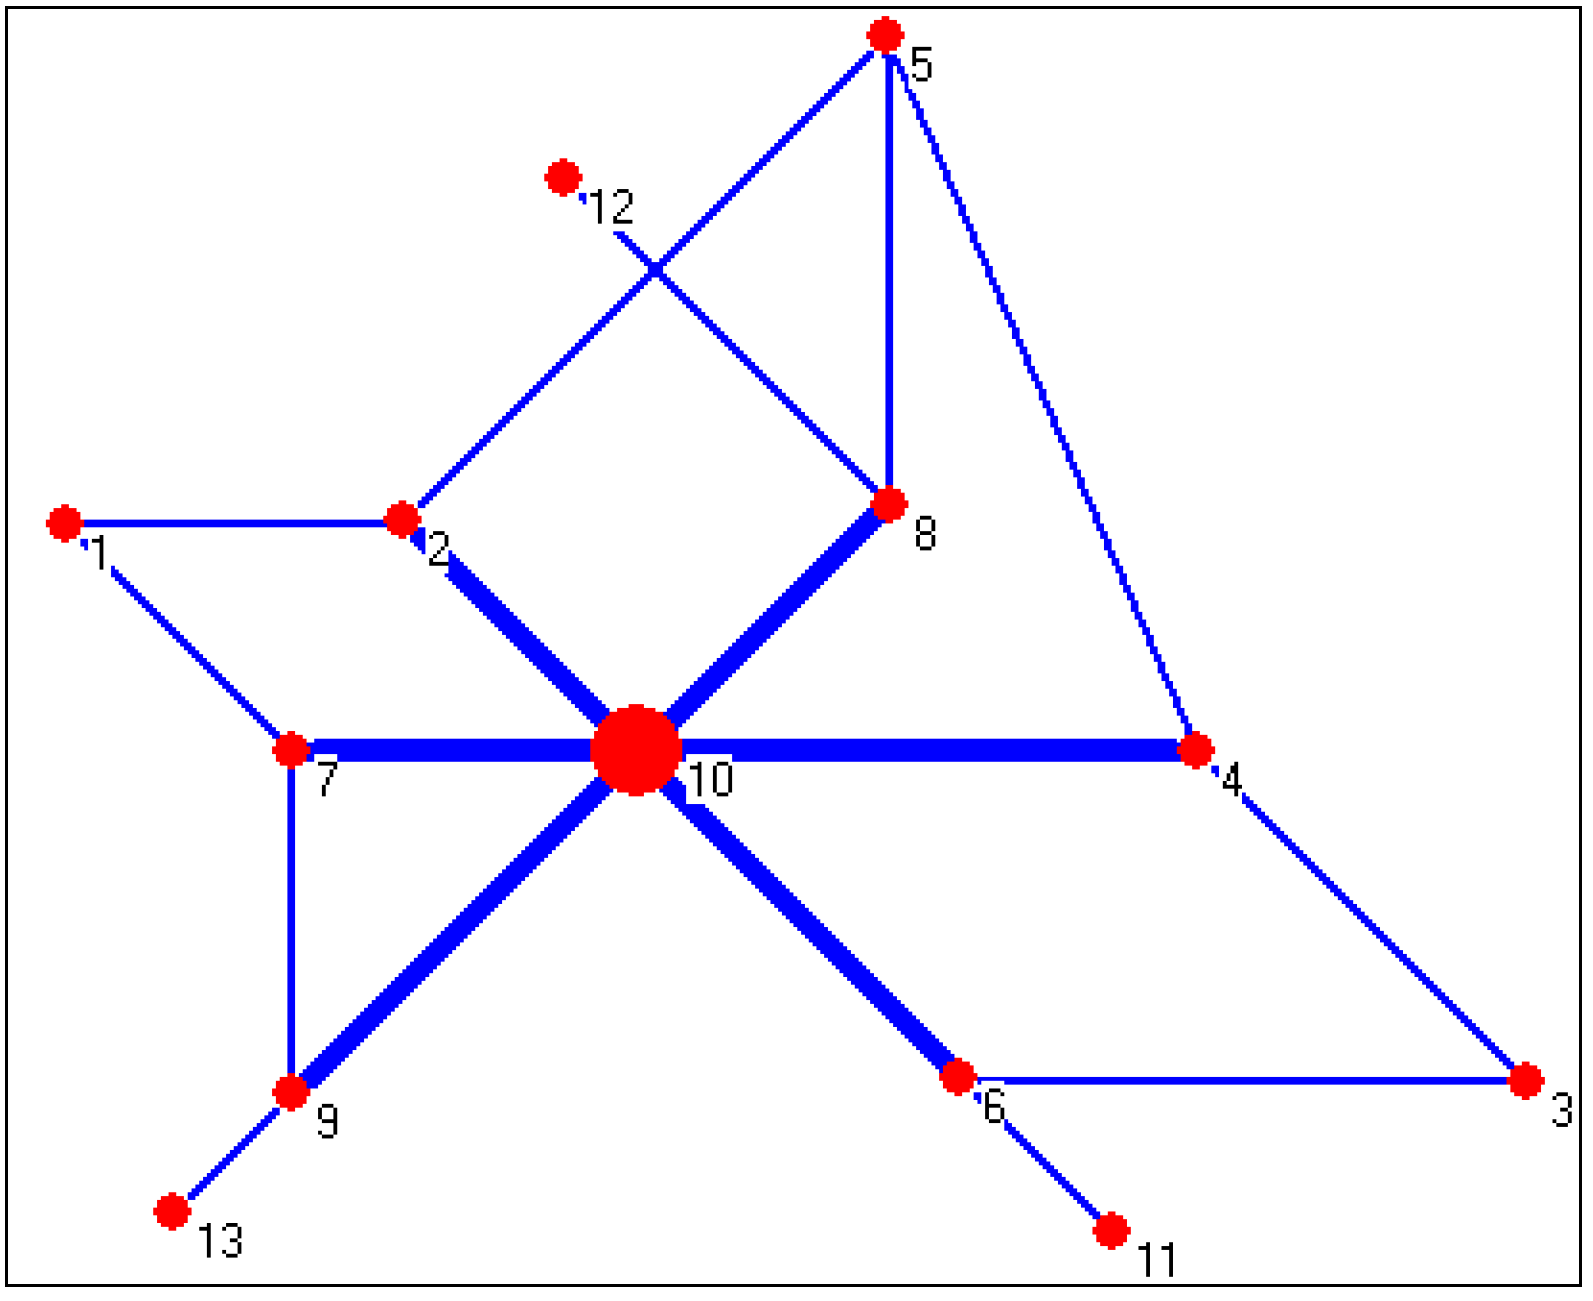
The scale-free characteristic of the power communication network causes the network congestion, which occurs at the hub nodes first. As shown in Figure 4, Node 10 is the hub node in the network.
It can be seen from Figure 5 that Hub Node 10 usually can be passed through to obtain the shortest path in data transmission, which results in the load of Hub Node 10 and the link it is connected to being heavy. For example, if I-level packets select the delivery path 4 and II-level packets select the delivery path , this can reduce the load of Hub Node 10 and guarantee the reliable delivery of I-level packets. In the integrated routing, each node stores and maintains two kinds of routing tables, which include the routing table of I-level services and the routing table of II-level services. The power communication network adopts the TCP/IP (Transmission Control Protocol/Internet Protocol), which has a large range of traffic data and a high real-time requirement, and the end to end TCP protocol allows senders to reduce traffic. Each node is considered as both host and router to generate packets or forward packets. The rules of the integrated routing strategy based on the classification of power communication services are as follows.
- Step 1:
- The topological graph is constructed based on the modeling rules;
- Step 2:
- Wait for the business request. The fixed routing table is obtained based on the open shortest path priority protocol (OSPF). Additionally, the routing update module can quickly inform all nodes of the current state in the network. Each node counts periodically the queue length in turn and updates its global dynamic routing table.
- Step 3:
- Each node has two queues that store two levels of services. When the packet polling scheduler polls the queue, if the queue length of the node ni > Ci, the Ci packets are put in the polling scheduler or else, ni packets are put in the polling scheduler. For an incoming packet, it can be routed to the destination through two outgoing ports depending on different packet levels.
- Step 4:
- Recalculate the queue length of nodes in the network and update the dynamic routing table.
The flowchart of integrated routing is shown in Figure 6.
3.3.1. Shortest Path Routing
Open shortest path priority protocol (OSPF) based on the Dijkstra algorithm has been widely used in the power communication network. Given that the power communication network topology is , the adjacency matrix Ω is used to represent the weighted network, and the weight of each edge in the network is . When the edges are connected between the two power communication nodes, = 1, or = , a routing table can be constructed on the shortest path tree (SPT) and points out a route with less cost to each destination in the routing area. Additionally, the fixed routing table is obtained, which is calculated by topology and link weights. As long as the topology of the power communication network is not changed, the routing table will not change. The forwarding of I-level packets is based on the fixed routing table.
The shorter average transmission distance is obtained, and the I-level packets can reach the destination quickly when the network is in the free flow state. Therefore, the effective delivery of I-level packets is guaranteed.
The load of nodes is an important parameter to evaluate the network congestion. The total number of packets within the network is denoted as Np(t), and the total load of hub nodes is denoted as n*(t) at each time step, that is the sum of the queue lengths of each hub node. The maximum transmission time <Tmax> and the average transmission time <Tavg> are also important indexes to measure the efficiency of network transmission. The maximum time and average time for a packet to deliver from its source to its destination are denoted as <Tmax> and <Tavg> [19,20].
3.3.2. Global Dynamic Routing
The packets are delivered not only according to the topological structure, but also the queue lengths and capacity of the nodes under the global dynamic routing strategy. Nodes with a large degree and less load can be transmitted more effectively and are less prone to congestion. Conversely, the nodes with a small degree and heavy load have lower delivery efficiency. It is necessary that the heavy load nodes be avoided as much as possible to obtain a large network capacity and reduce the local congestion in the selected path. Because the node queue length changes from time to time, so the computation is consumed to find the global dynamic paths at each time step.
The path from the source vi to destination vj is set as Link(i): ; the cost can be denoted as Equation (4).
where n(j) is the queue length of node vj and C(j) is the delivery capacity of node vj. The route path with minimal cost is selected under the global dynamic routing strategy. The routing table is obtained by Equation (4), and the calculation process can be described as follows.
- Initially, the routing table is empty, and the real-time queue length of each power communication node can be denoted as n(1), n(2), n(N);
- According to the queue length and delivery capacity of the nodes in the path, the cost of the multiple paths from the source to the destination are calculated by Equation (4);
- The least cost path is selected to deliver packets, and the routing table is updated according to the real-time load of nodes at each time.
Three functional modules of the global dynamic routing are as follows.
- The initialization module involves the description of the common constant, type and global variable.
- The routing update module is the procedure for realizing the dynamic and adaptive routing protocol. This module can quickly inform all nodes of the current state in the network. Each node counts periodically the queue length in turn and updates its global dynamic routing table.
- The routing decision module is the procedure of the global dynamic routing protocol. It is based on Equation (4) and allows the optimal routing to be found by computing the multi-segment map.
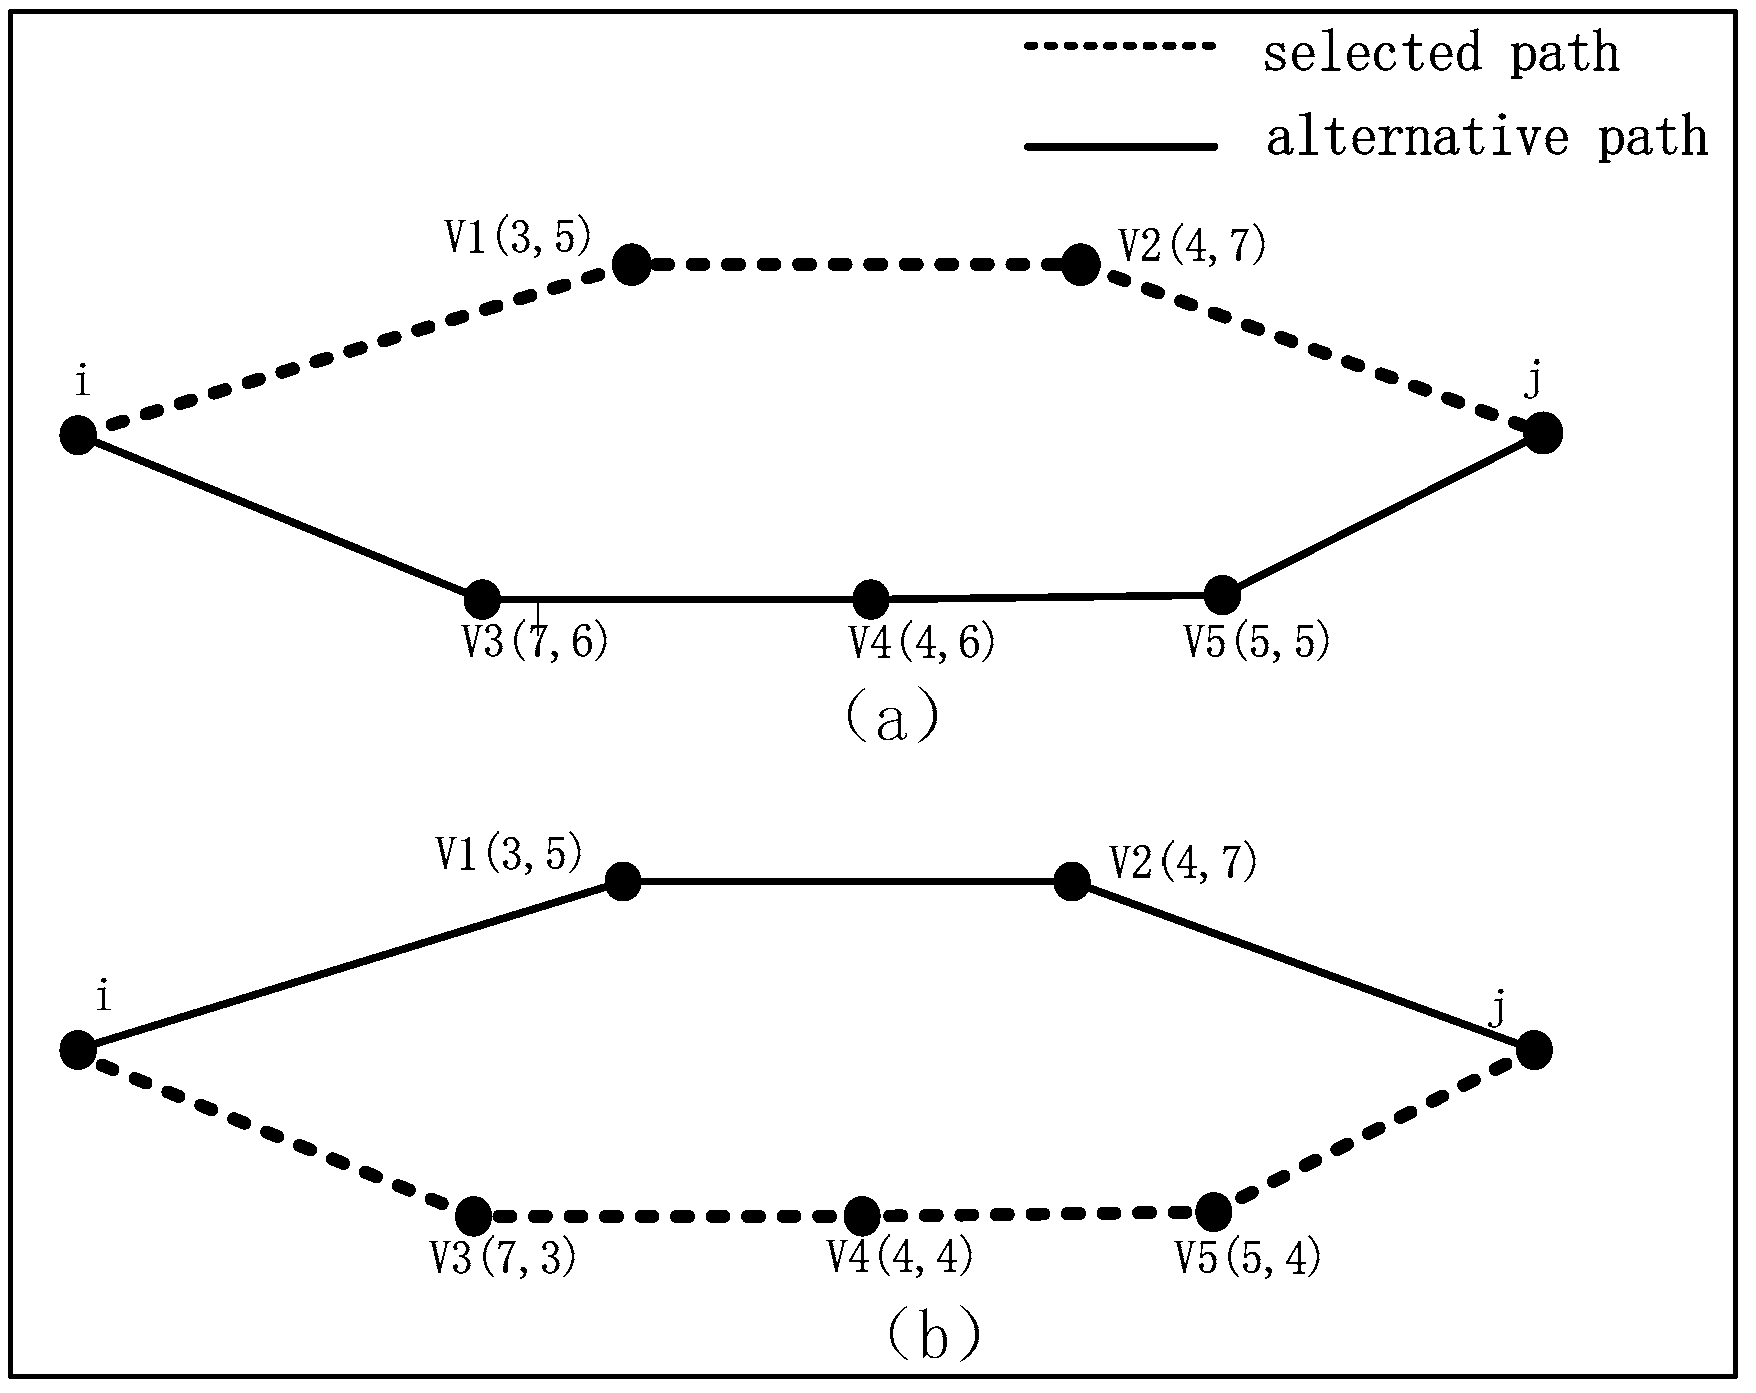
For example, when node i has two neighbor nodes (v1 and v3), the costs are = = 5.42 and = = 6.36. Therefore, node v1 is selected as the next hop node, as shown in Figure 7a. When the load condition of nodes changes, the recalculated costs of the two paths are 5.42 and 5.23, respectively, and v3 is selected as the next hop node, as shown in Figure 7b.
In Figure 7, the delivery capacity and queue length of the power communication nodes are denoted as the parameters in parentheses. The selected path would change when the load condition of nodes changes, which indicates that the shortest path is not necessarily selected under the global dynamic routing. The forwarding of II-level packets is based on the dynamic routing table.
3.4. Critical Packet Generation Rate
In order to characterize the network capacity, which describes the phase transition of data flow, a related model has been proposed to describe the network congestion, as shown in Equation (5).
where W = W(t + t) − W(t), W(t) represents the total number of packets within the network at time t, <W> indicates the average over time windows of width t and is the average delivery capacity of all nodes. Critical packet generation rate Rc is an important parameter to measure network capacity. In the free flow state, due to the balance of created and removed packets, order parameter η is around zero. With increasing packet generation rate R, there will be a critical value of Rc that characterizes the phase transition from free flow to congestion. When R exceeds Rc, the packets are accumulated continuously in the network, η will become constantly larger than zero, the inflow will exceed the outflow and some nodes in the network begin to become congestion. The network capacity can be measured by the maximal generation rate Rc at the phase-transition point [21]. When a greater critical packet generation rate is reached, it shows that the integrated routing can optimize the traffic distribution and alleviate the number of congested packets effectively, as well as reach a much higher network capacity.
4. Simulation Results
4.1. Model-Beijing Power Communication Network
Based on the complex network theory, the model of the Beijing power communication network in 2012 is built, and its topology characteristics are analyzed [22], as shown in Table 3.
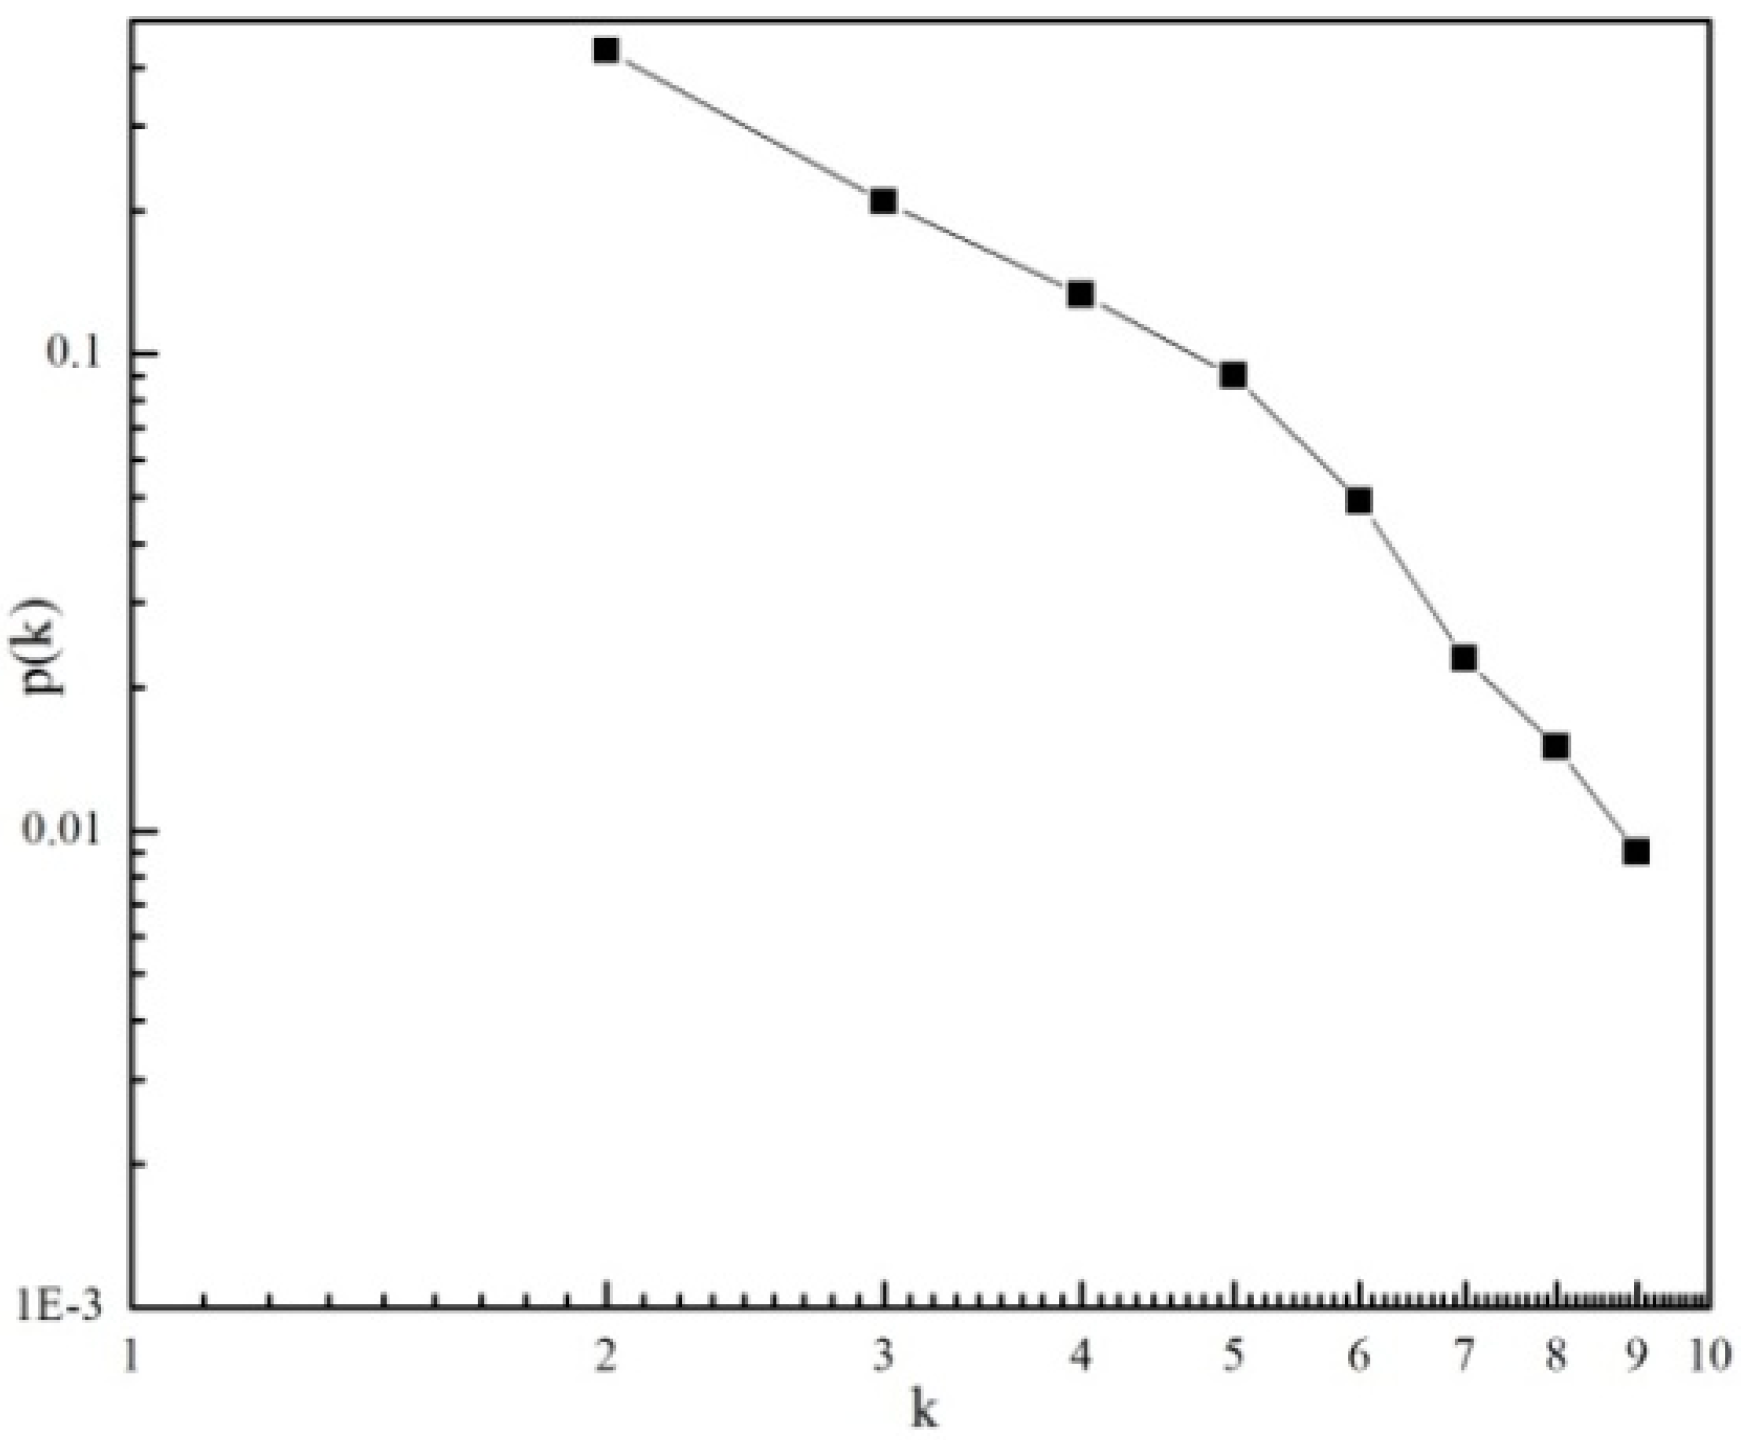
It can be seen from Table 3 that all node degrees of the Beijing power communication network are distributed between two and nine, and the average degree is 3.2. There are only less than 5% of nodes for which the degree is greater than six, which indicates that the number of nodes of a low degree is far more than those of a high degree. The degree distribution in the double logarithmic coordinates is shown in Figure 8.
The least square method is used to fit the curve, and the degree distribution function p(k) = 1.928 k−2.02 is obtained, which satisfies Equation (2) and conforms to the power-law distribution. The scale-free network characteristics have been shown for the Beijing power communication network, and the fitting parameter γ = 2.02.
The topology model of the Beijing power communication network is built, which includes 533 nodes and 876 links in the network. The local topology diagram of 50 nodes is shown in Figure 9.
All the simulation experiments in this paper were based on MATLAB (R2013b) and OPNET Modeler14.5, and the experimental operation was supported by a cluster server. The Beijing power communication network is set as the network topology based on the topology model in Section 2, including 533 routers and 876 links. The packet arrivals to a node follow the Poisson process. If the amount of packets in the network continues to grow with the time step, i.e., the number of packets entering the network at each time is more than the number of packets leaving the network, network congestion occurs. Simulation parameters are set as follows: power-law index γ = 2.02; node delivery capacity C = 2 × N; cache capacity L = 10 × N; and the delivery capacity and cache capacity of the nodes are allocated according to Equation (3). Each step generates R packets, and the proportion of I-level packets is λ. The packet length is 2000 bits, and pairs of nodes are connected by a bidirectional full duplex link of same capacity. In order to improve the rationality of the simulation experiment, each R value is calculated by 6000 time steps in the simulation process; then it can be considered that the data flow is basically steady, and the average Rc is determined by the last 1000 steps.
4.2. Simulation Results for Node Resource Allocation
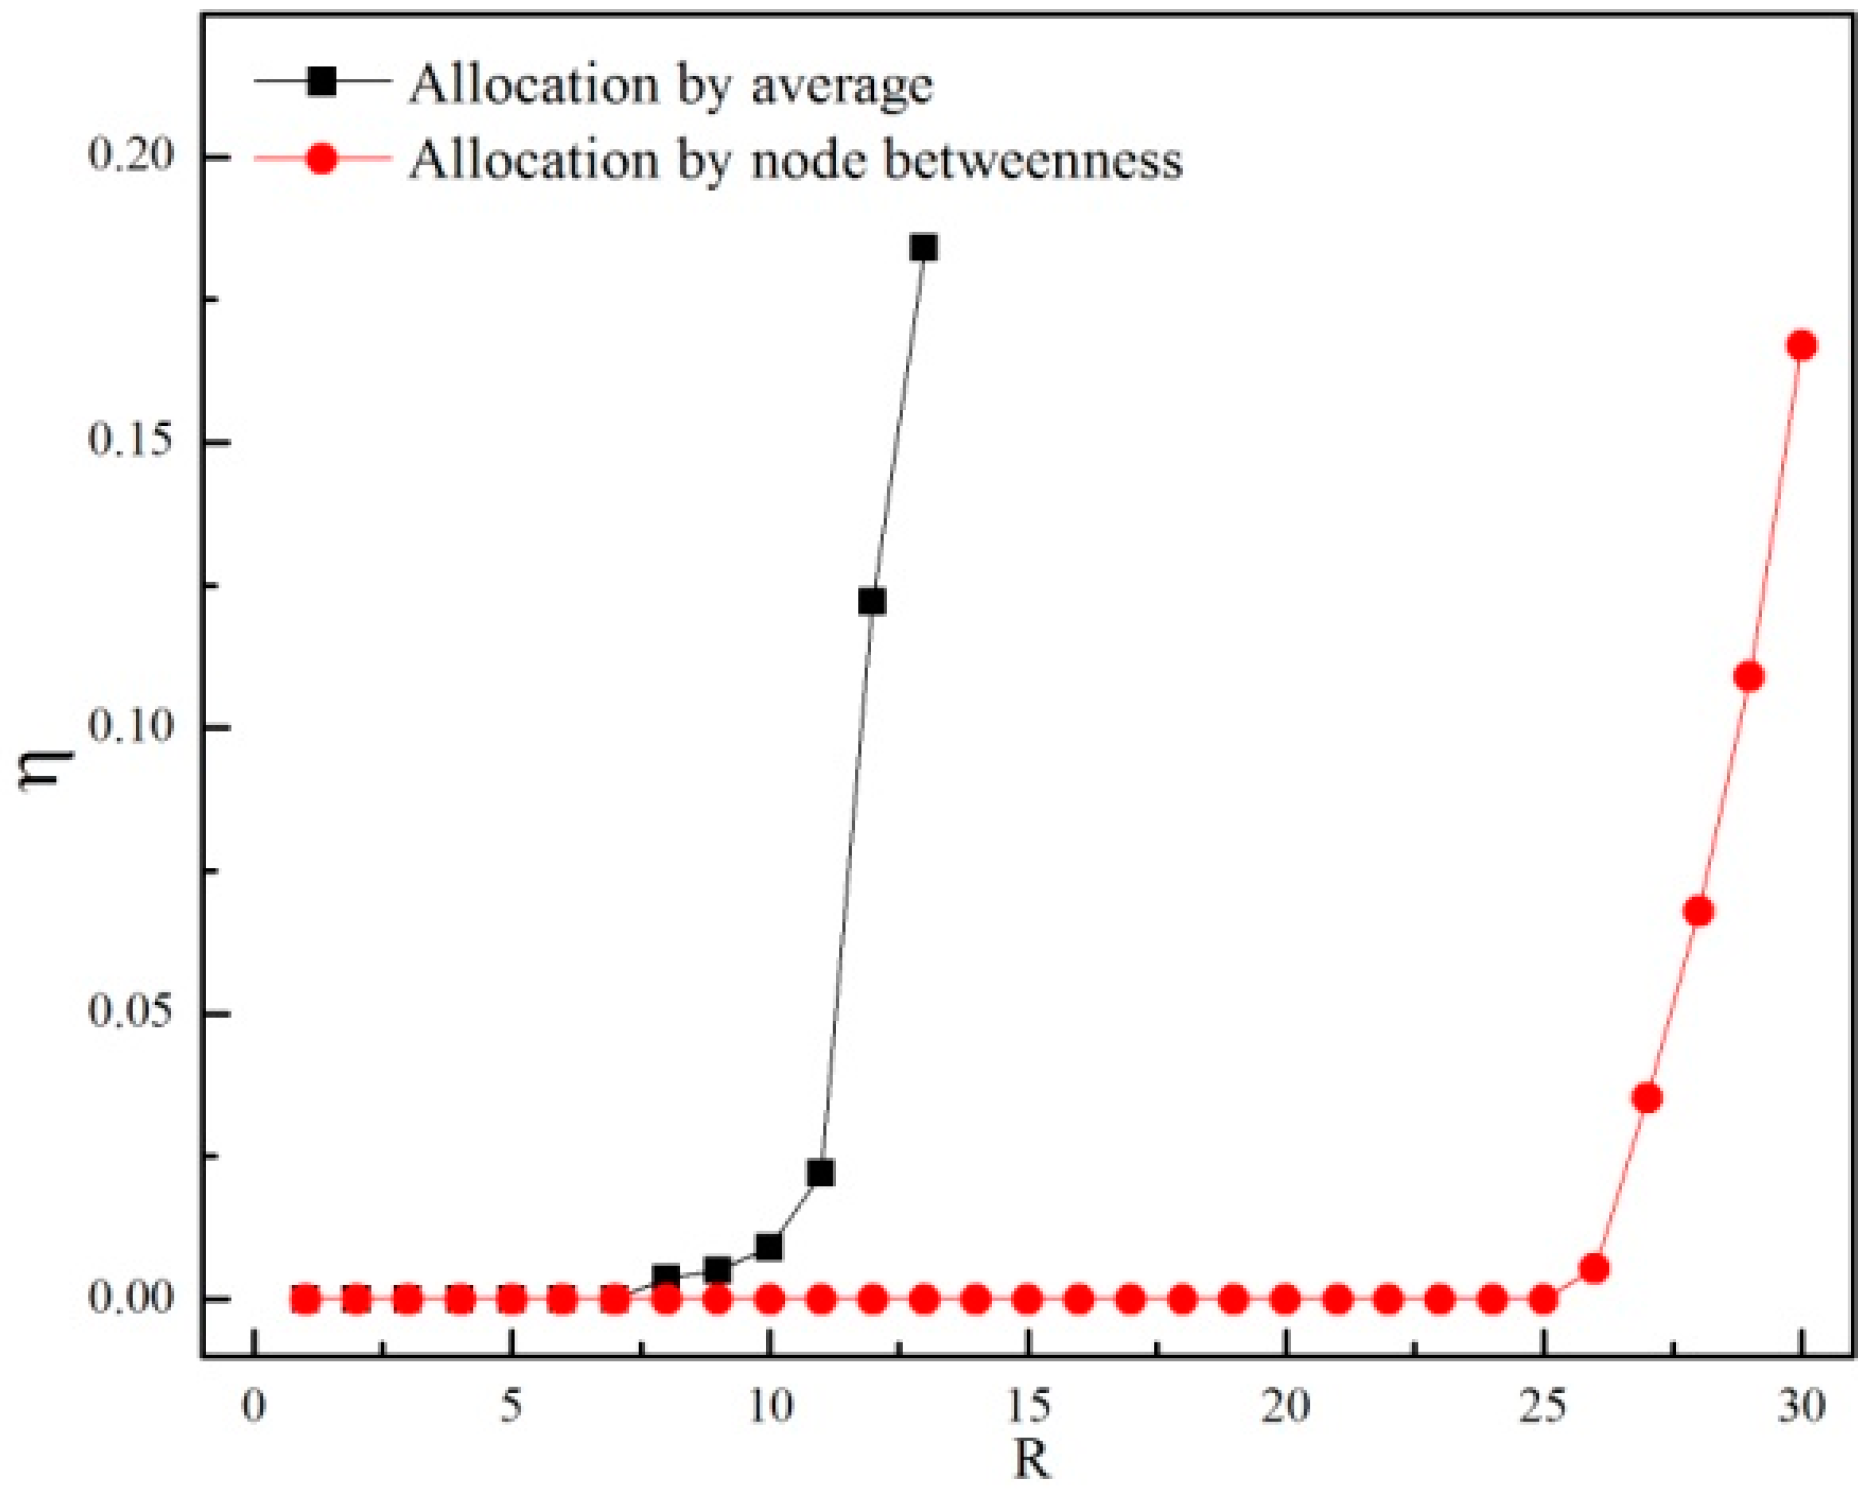
The resource allocation of the power communication node has an important influence on network throughput. In the shortest path routing, λ = 0.2. The node’s delivery capacity and cache capacity resource in accordance with average allocation or node betweenness and the variation of order parameter η are shown in Figure 10.
When the total of the network node resources is limited, the network transmission capacity is different under different allocation strategies. It can be seen from Figure 9, when the packet generation rate R is small, η = 0, and the network is in a free state, that is the number of packets flowing into and out of the network is flat at each time step. When the node resources are evenly distributed, the critical packet generation rate is eight, but when the node resources are allocated according to Equation (3), the critical packet generation rate increases to 25, which is three-times higher than the average allocation. We can concluded that the power communication network has a greater critical packet generation rate when the node resource allocation is according to node betweenness.
4.3. Simulation Results for Global Dynamic Routing
Under the shortest path routing, static local routing [23], improved efficient routing [24] and global dynamic routing strategy, the order parameter η vs. packet generation rate R is shown in Figure 10. The proportion of I-level packets is λ = 0.2. α = −1 in the static local routing and β = 0.3 in the improved efficient routing, which are the optimal values for the two routing strategies.
In Figure 11, the critical packet generation rate under the shortest path routing is Rc = 25, under the static local routing is Rc = 31 and under the improved efficient routing is Rc = 38. Under the global dynamic routing, Rc reaches a very high value of 44, which is larger than the three routing strategies. As far as we know, the global dynamic routing has a larger network capacity and can reduce the occurrence of congestion.
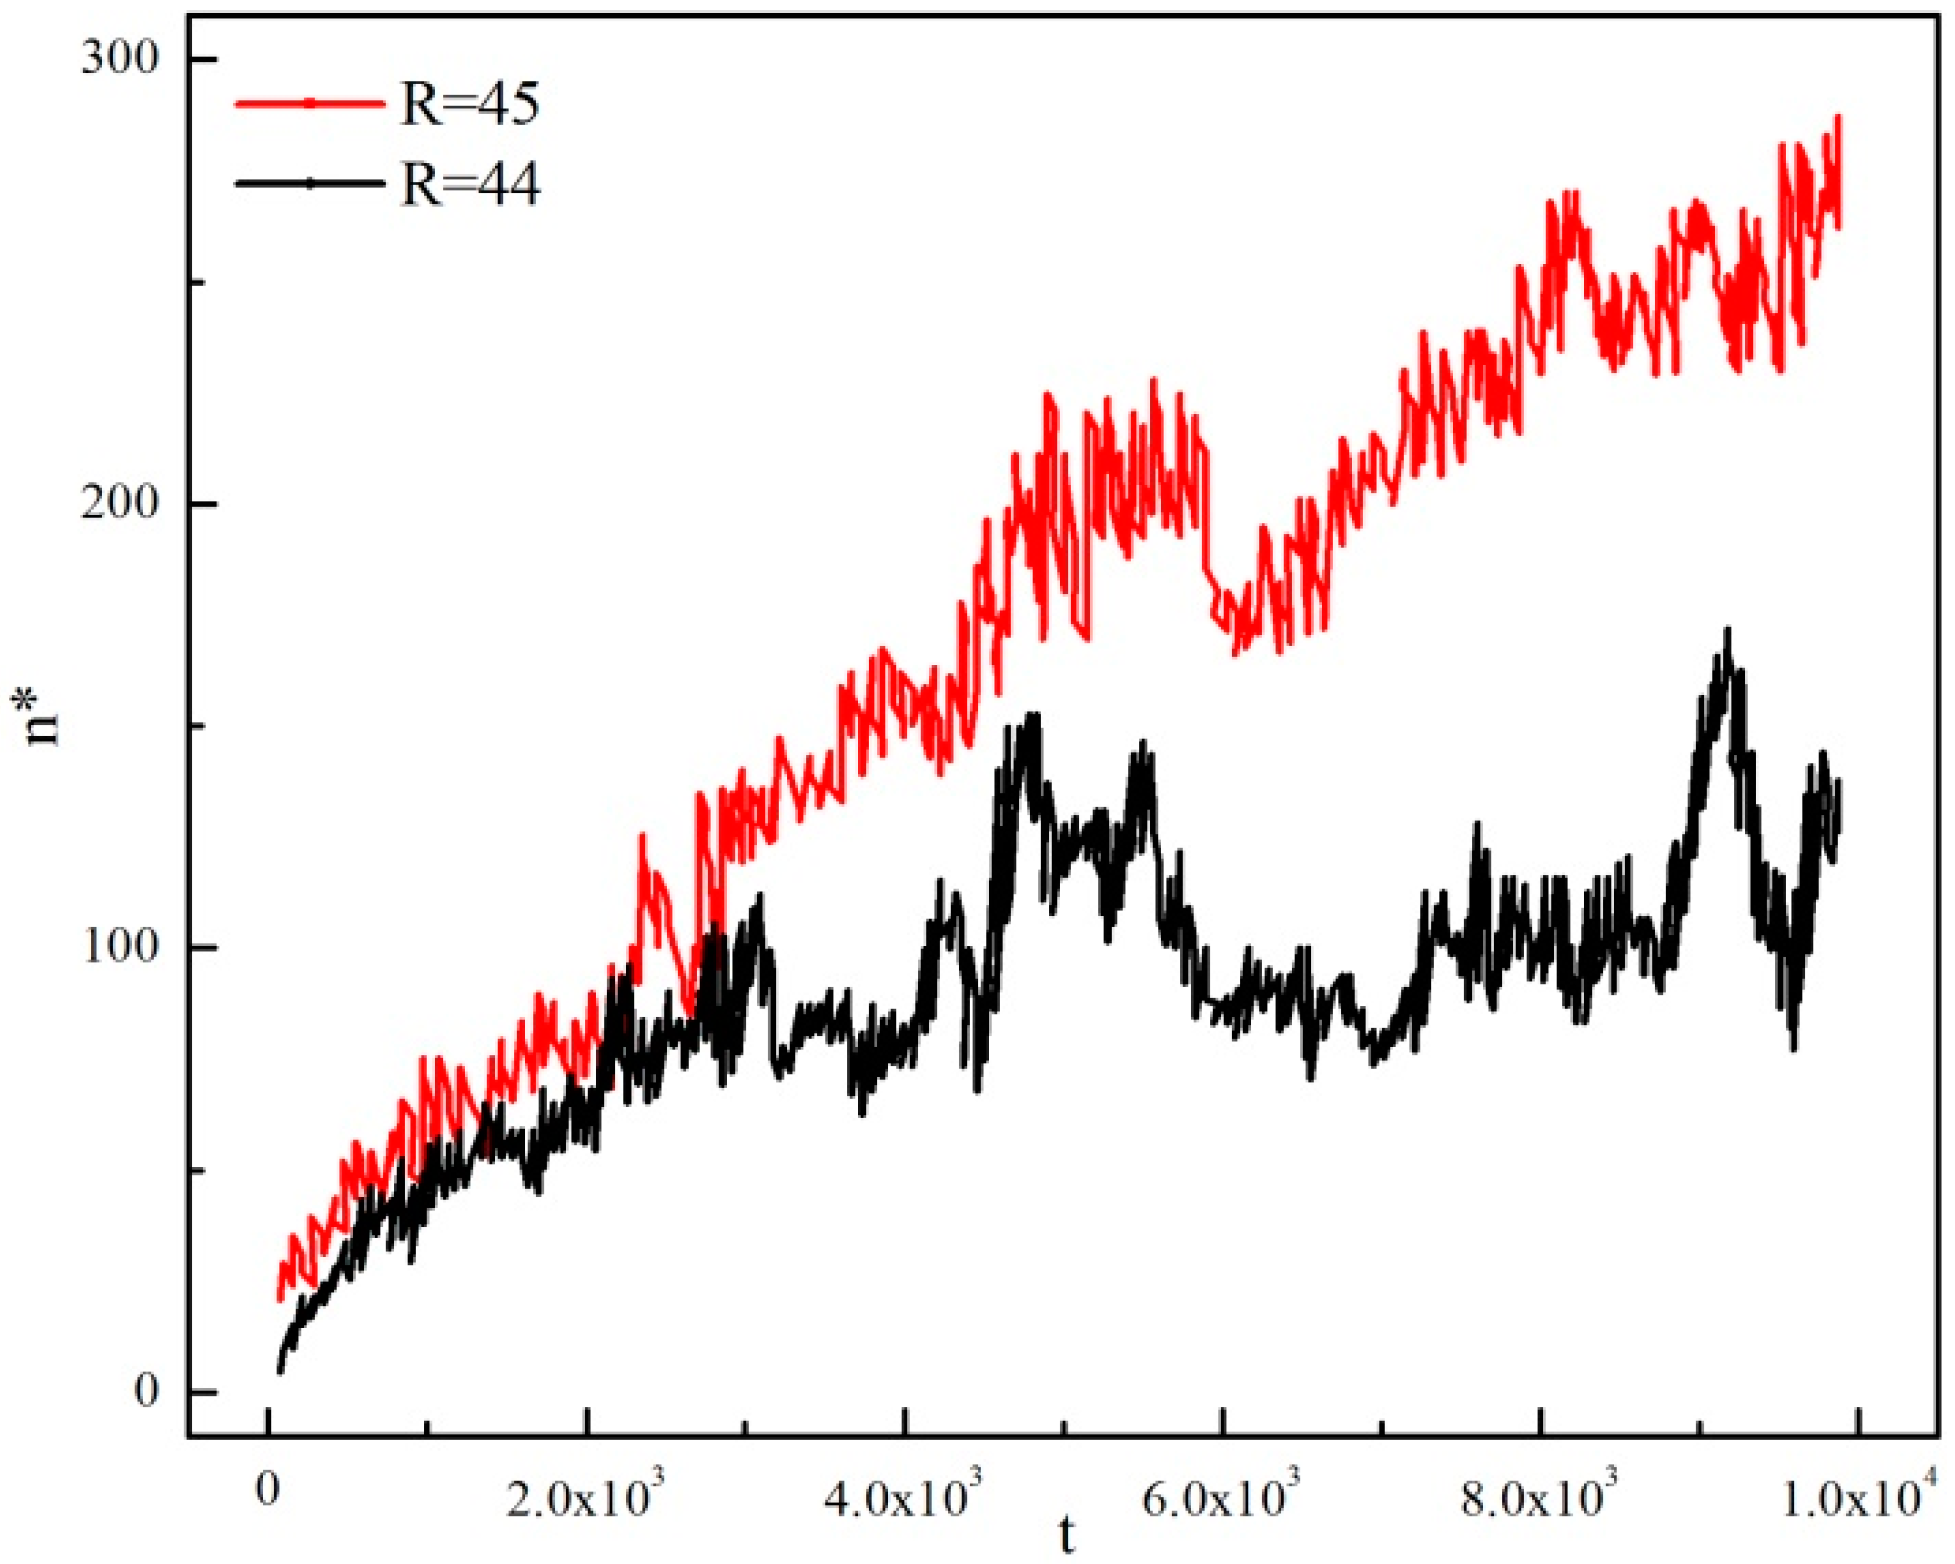
We can verify that the congestion occurs first at the hub nodes in the power communication network. When the packet generation rates are different, the total load of hub nodes changes with time, as shown in Figure 12. The abscissa is the time step t, and the ordinate is the total load of hub nodes n*(t) at time t; where λ = 0.2 and the hub node takes the node with k > 6.
We know that the critical packet generation rate of global dynamic routing is 44 in Figure 11. The variation of the total load of the hub nodes with time step t is studied when R = 44 and R = 45. In Figure 12, when R = 44, the total load of the hub nodes fluctuates over time, but always near a certain value, the network is in a free-flowing state. When R = 45, the total load of hub nodes increases with time, and the network will enter the congestion state. When the packet generation rate exceeds the threshold, the packets are accumulated at the hub nodes over time, which indicates that congestion occurs first at the hub nodes. This is caused by the topology of the scale-free characteristic of the power communication network.
4.4. Simulation Results for Integrated Routing
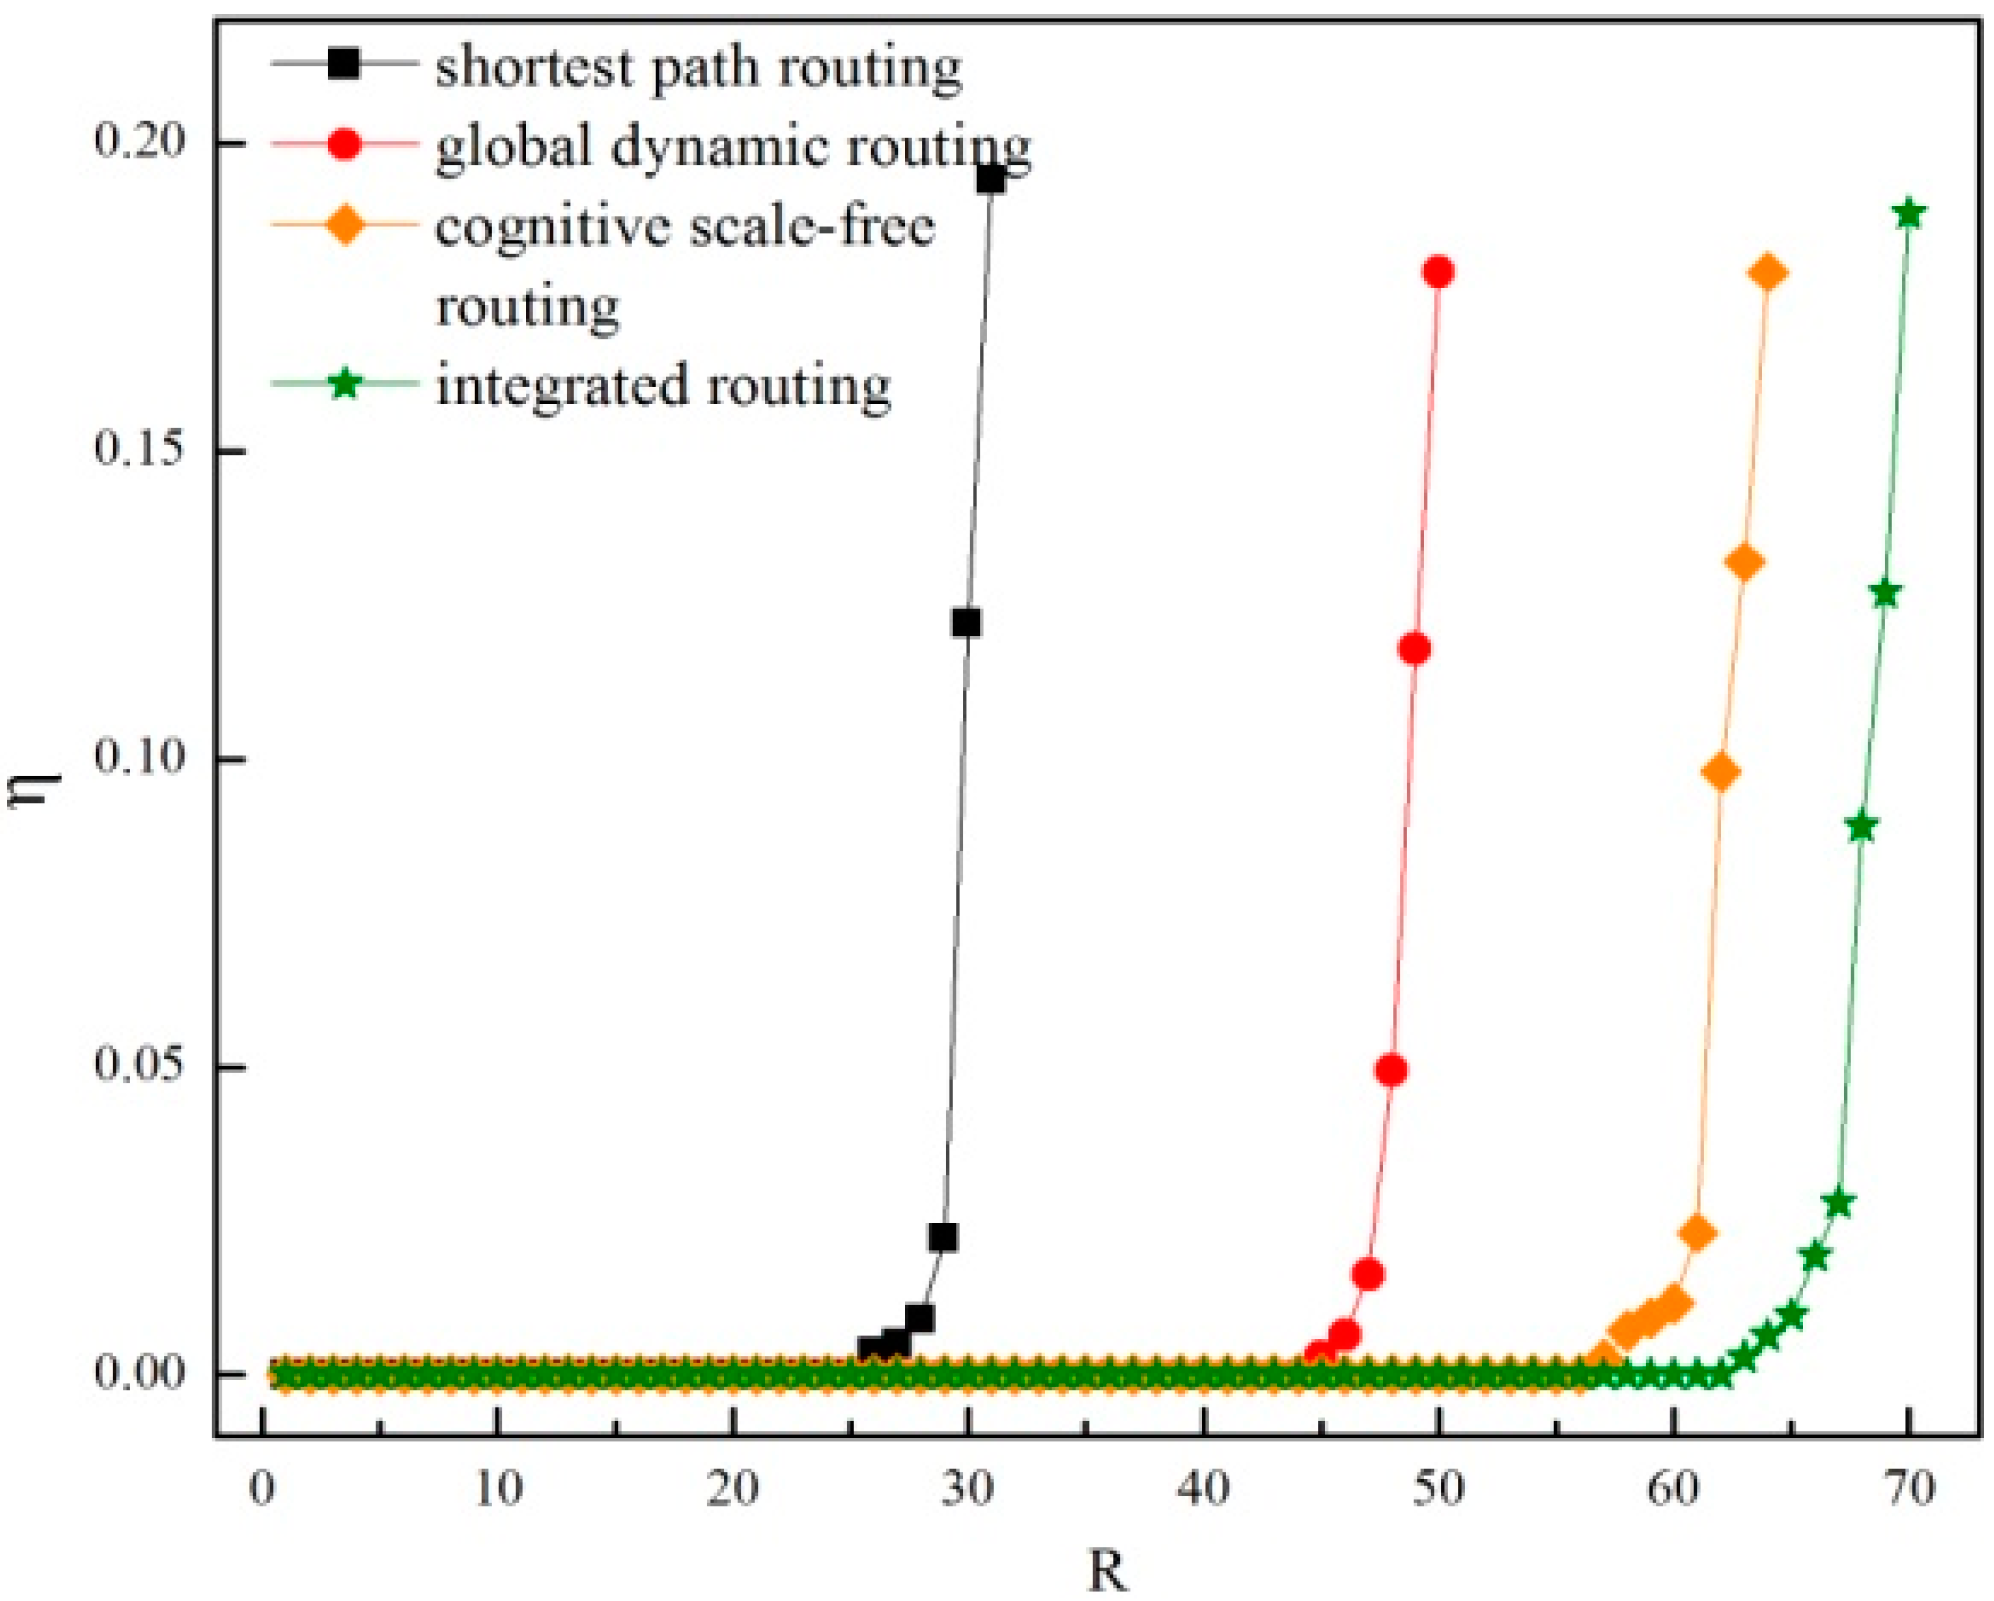
If the node resources are allocated according to the node betweenness, λ = 0.2, comparing with the cognitive scale-free routing protocol [7], and the order parameter η vs. R under the four routing strategies are shown in Figure 13.
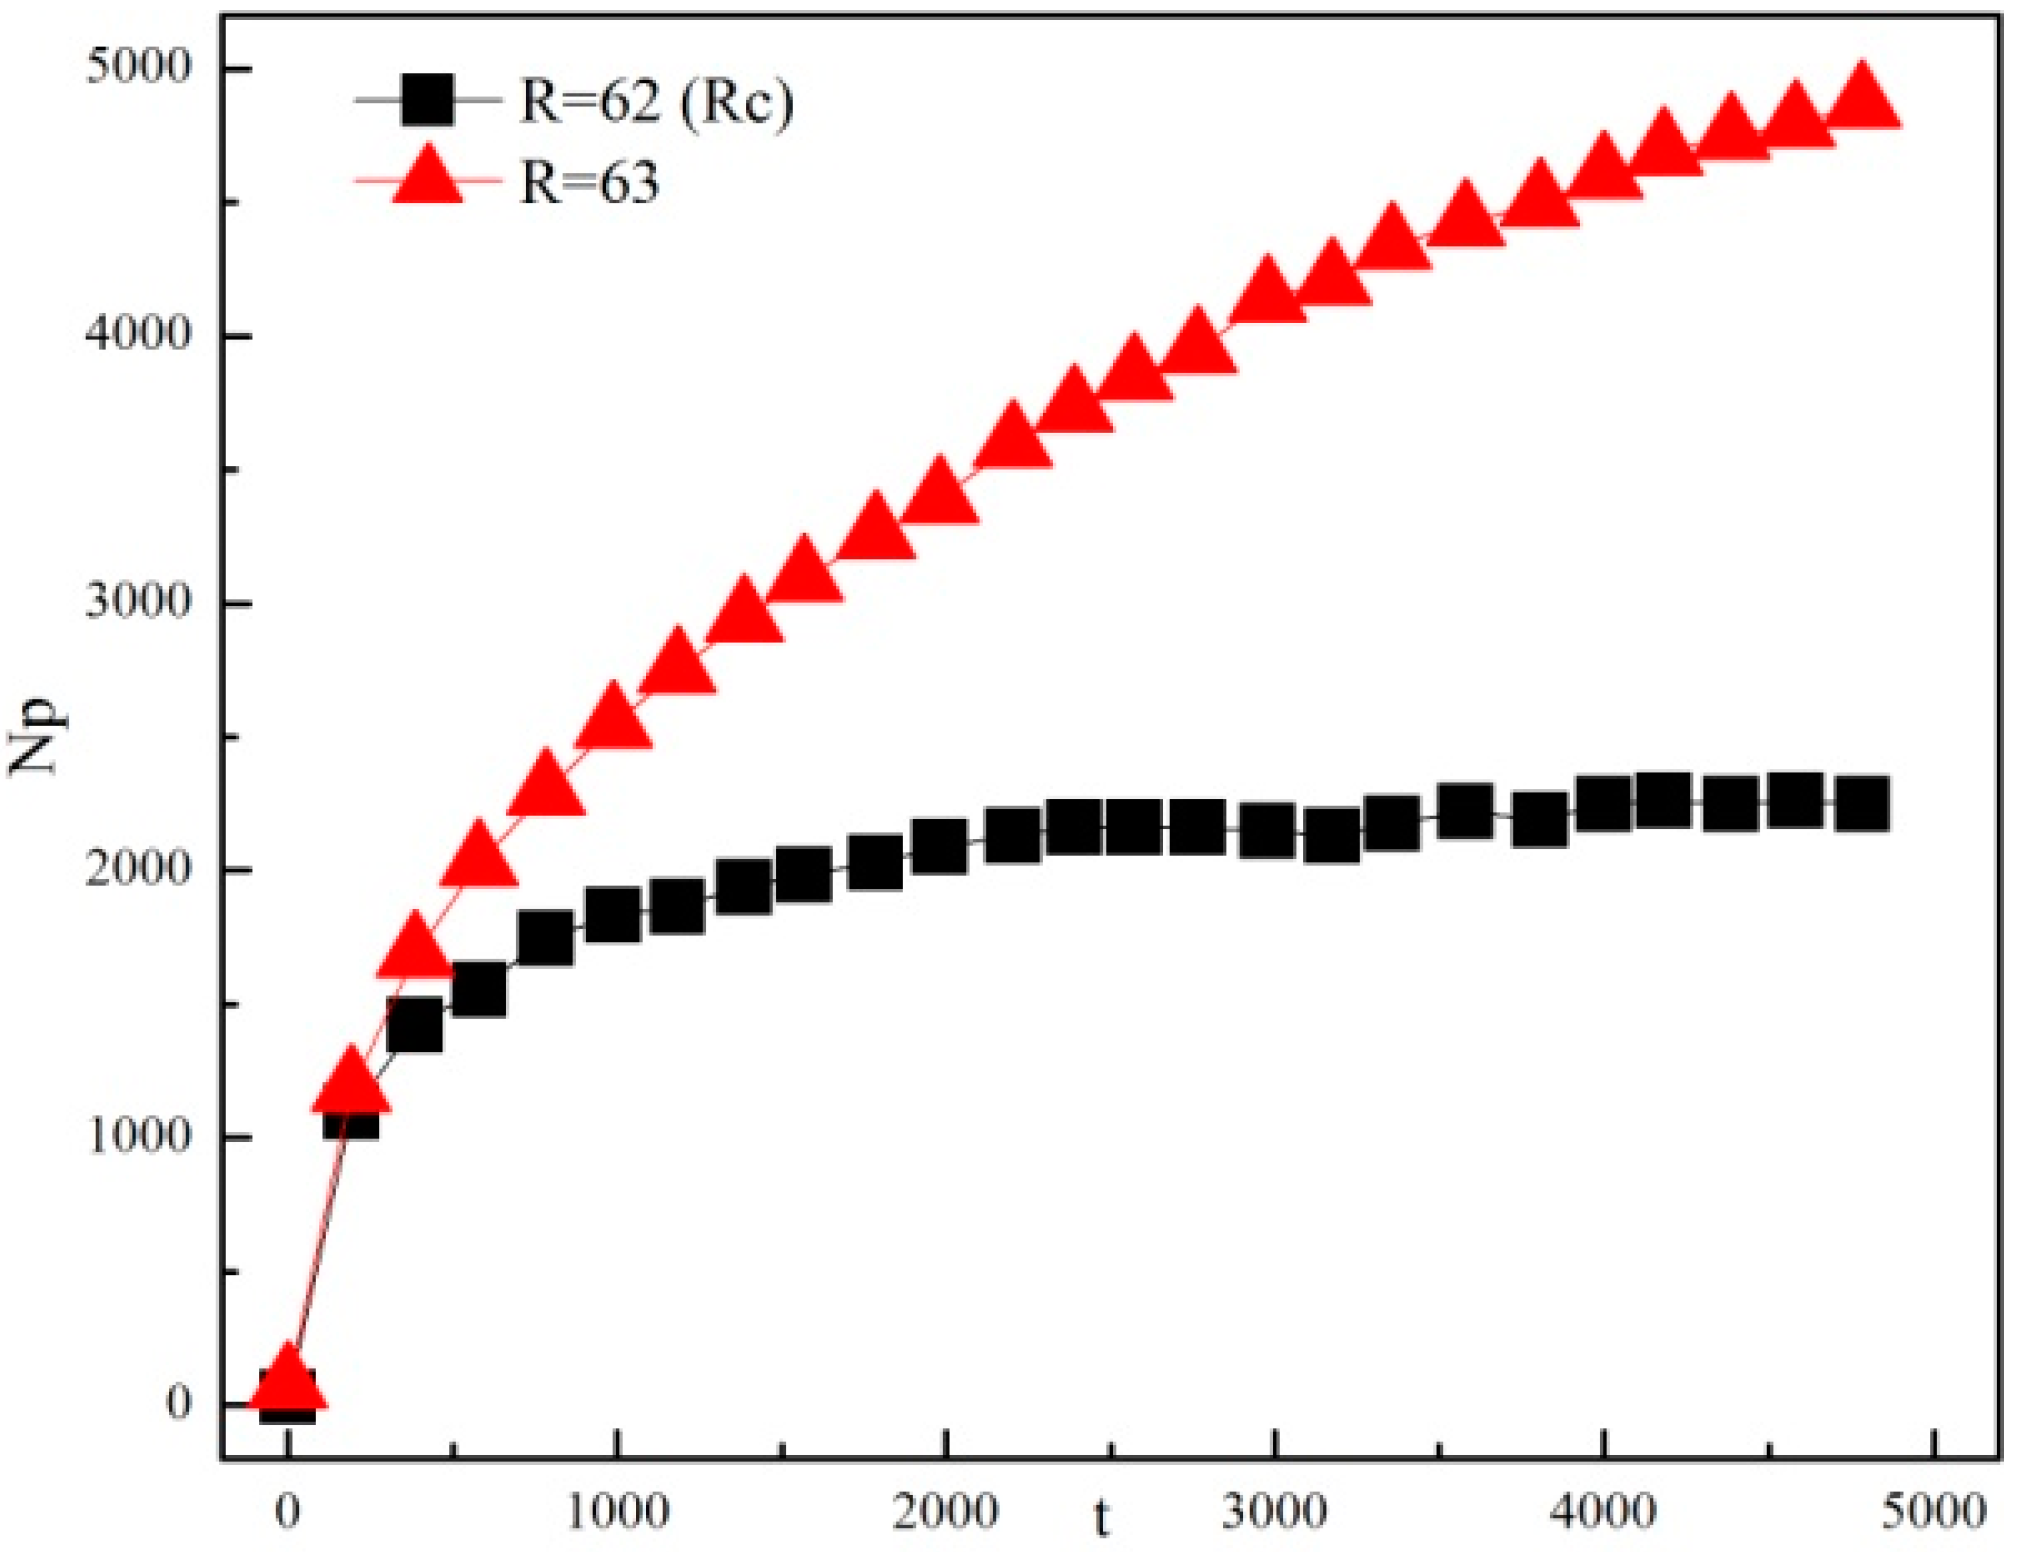
In Figure 13, the critical packet generation rate of integrated routing is the largest, Rc = 62, which shows that a larger network capacity can be obtained in the integrated routing. The results show that integrated routing can effectively enhance the traffic capacity comparing with the other routing strategies. The evolution of the total packet number Np for different R under the integrated routing is shown in Figure 14.
As shown in Figure 14, when the packet generation rate R = 62, the number of added packets can be offset by the number of packets arriving at the destination. Therefore, the number of packets in the network will be stable near a certain value. When the packet generation rate R = 63, the number of packets arriving at the destination is smaller than the added packets, so the packets are accumulated in the network, resulting in congestion or even network paralysis. It can be concluded that the critical packet generation rate of the network is 62 in the integrated routing, and the network capacity is larger, which can reduce the network congestion.
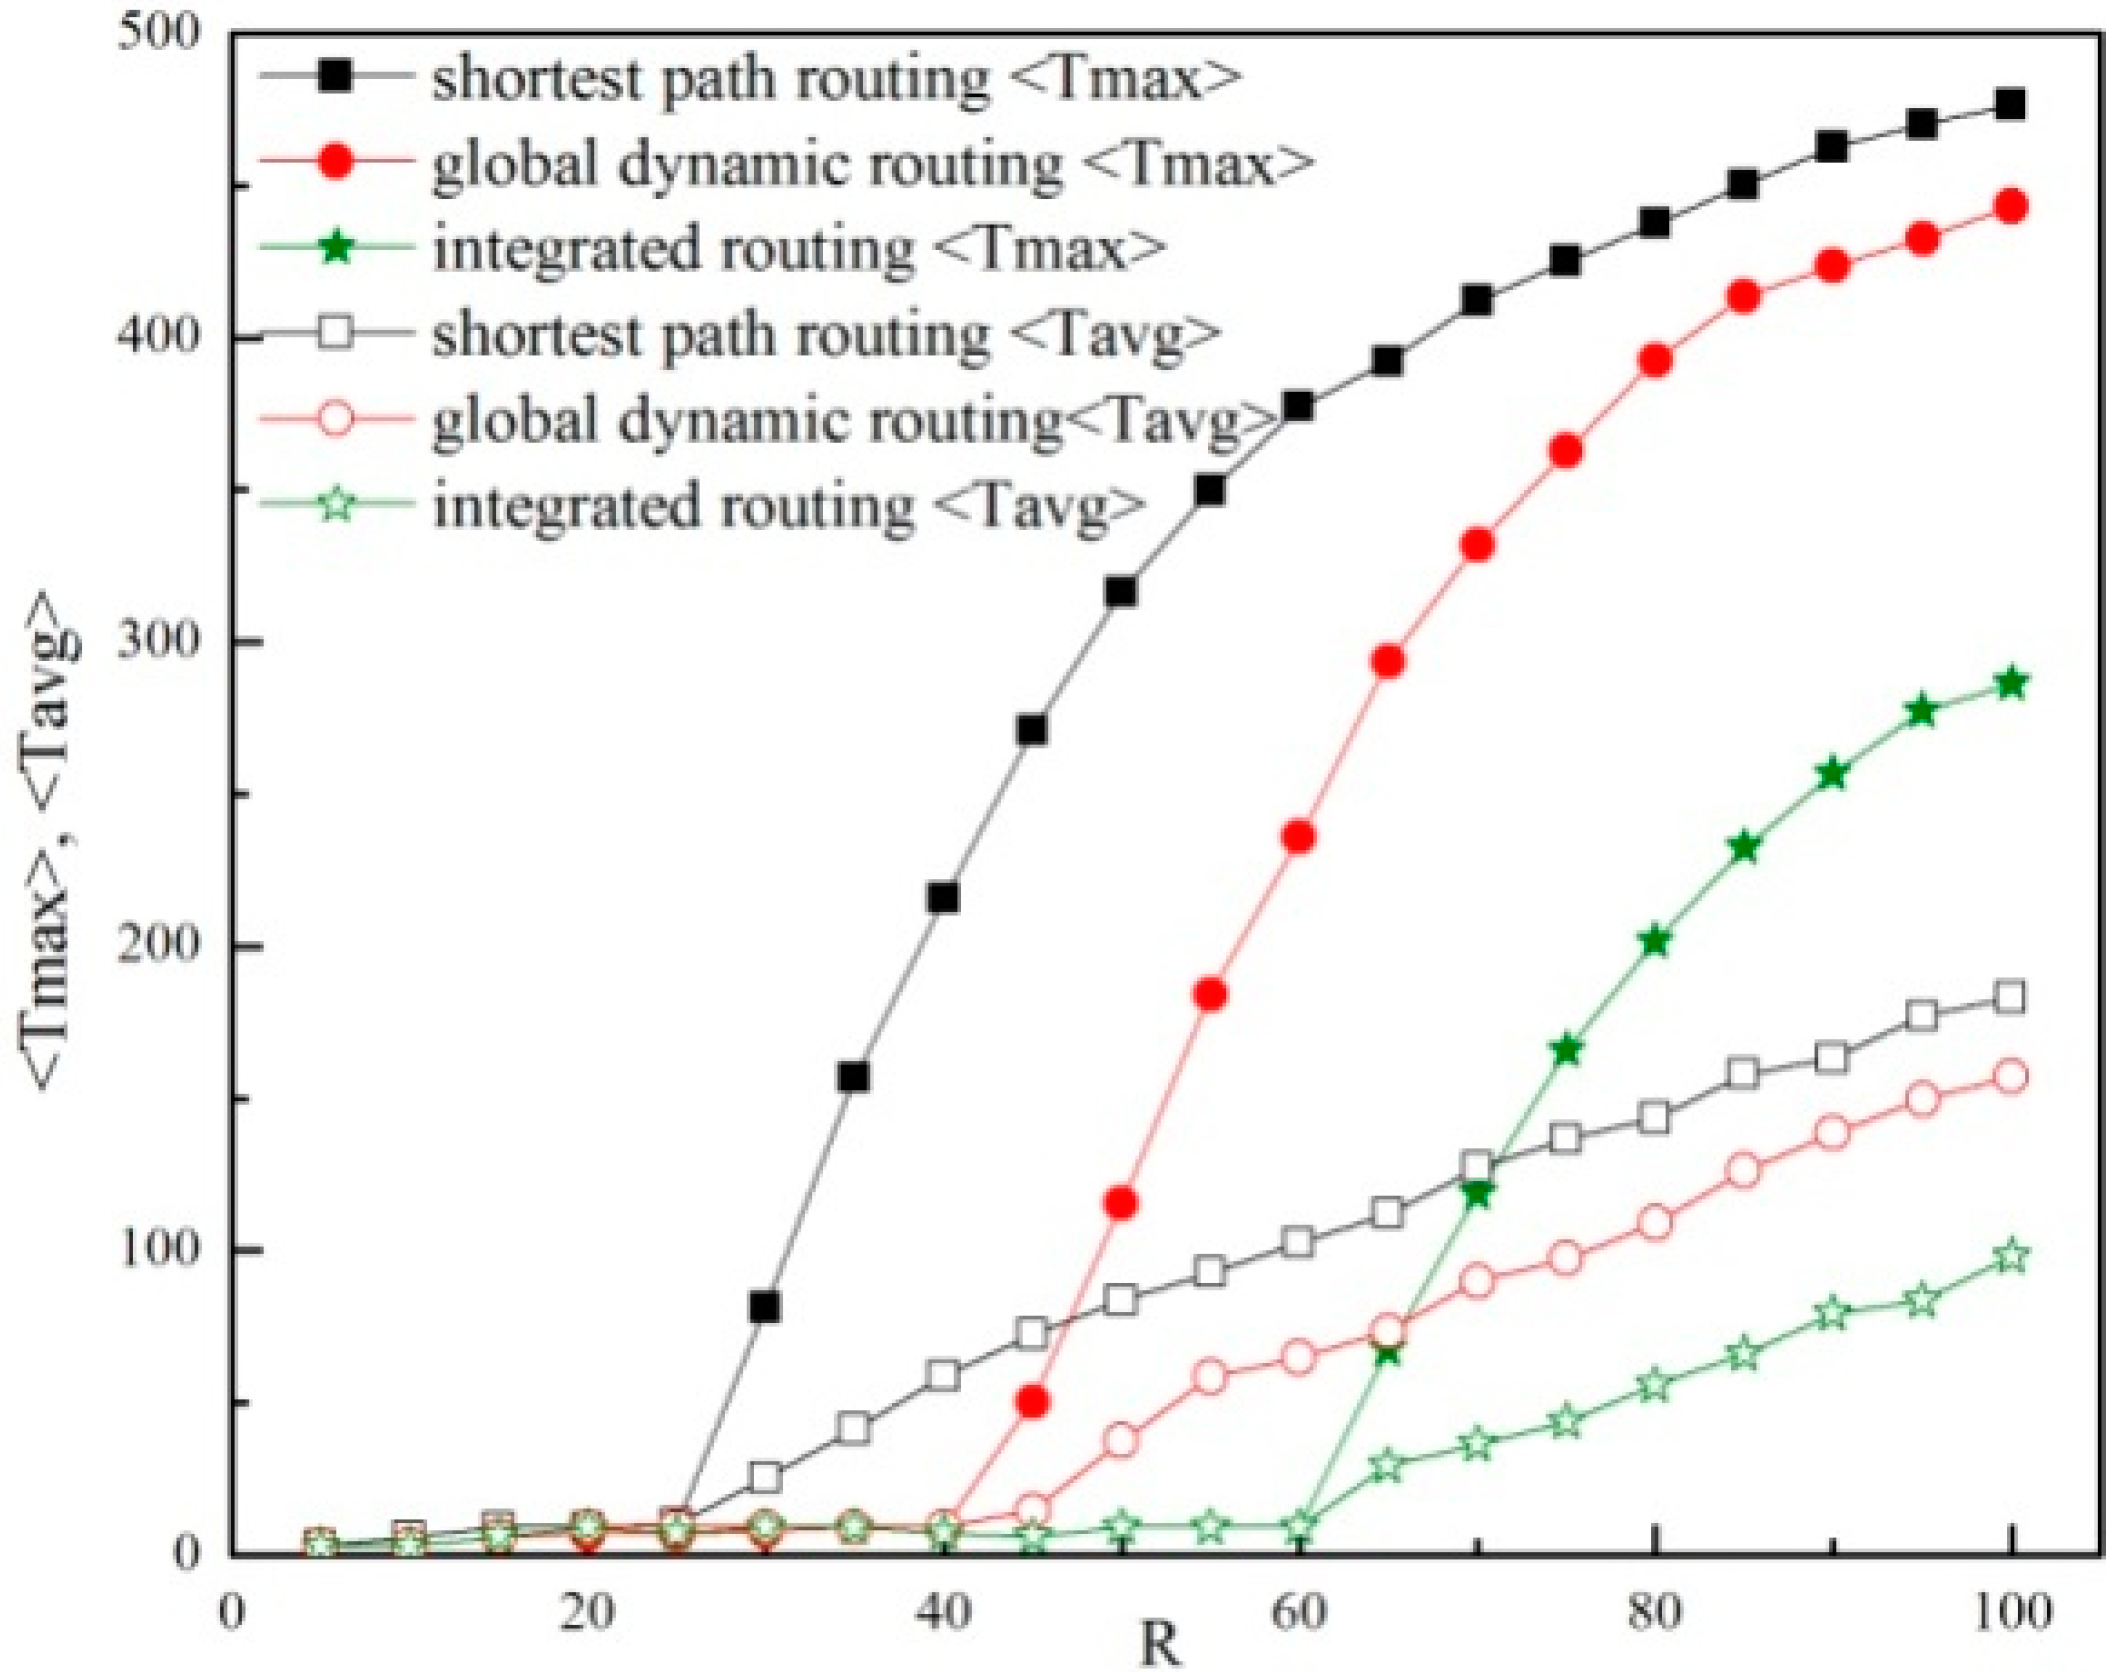
The changes of maximum packet transmission time <Tmax> and the average transmission time <Tavg> vs. the packet generation rate R are shown in Figure 15.
It can be seen from Figure 15 that when R < Rc, the maximum transmission time and the average transmission time are stable. When R > Rc, the maximum transmission time and average transmission time increase greatly, and the maximum transmission time and average transmission time in the integrated routing are less than the first two routing strategies. The path one packet traverses through with the shortest length is not necessarily the quickest way, when considering the possible traffic congestion and waiting time along the shortest paths. Hub nodes are easily selected to pass through for a packet to arrive at its destination, which causes the queues of hub nodes and the waiting time to be longer than other common nodes. Packets are delayed, and thus, the whole network gets congested. Under the global dynamic routing, the path is selected based on the current traffic load at each node, and the packets can take the bypass to avoid the congested nodes in the delivery process and reduce the degree of congestion of hub nodes. This will increase the transmission distance, but shorten the waiting time of the packets at the same time. In the shortest path routing, the transmission distance is the shortest, but the packets will easily pass through the congested hub nodes so as to continuously deteriorate the situation of node congestion, which increases the waiting time of packets and even causes data loss when the node’s cache queue is full. As a result, the power system’s safety and stability are severely threatened.
Compared with the public communication network, the power communication network is smaller. Taking the Beijing-Tianjin-Tangshan power network as an example, the number of nodes in Beijing power communication network is the largest, 533, and the number of nodes in Zhangjiakou power communication network is the smallest, 82. With the development of the smart grid, the size of the power communication network will continue to expand, and Figure 16 shows the critical packet generation rate Rc vs. the network sizes N under three routing strategies with λ = 0.2.
In Figure 16, the critical packet generation rate of the shortest path does not change significantly as the number of nodes increases. Despite the number of nodes increasing, the network is always prone to congestion at the hub nodes, and network throughput is small. The critical packet generation rate of global dynamic routing and integrated routing increases with the increasing of the network size. With the same average degree and network size, the network’s capacity under the integrated routing strategy is the largest.
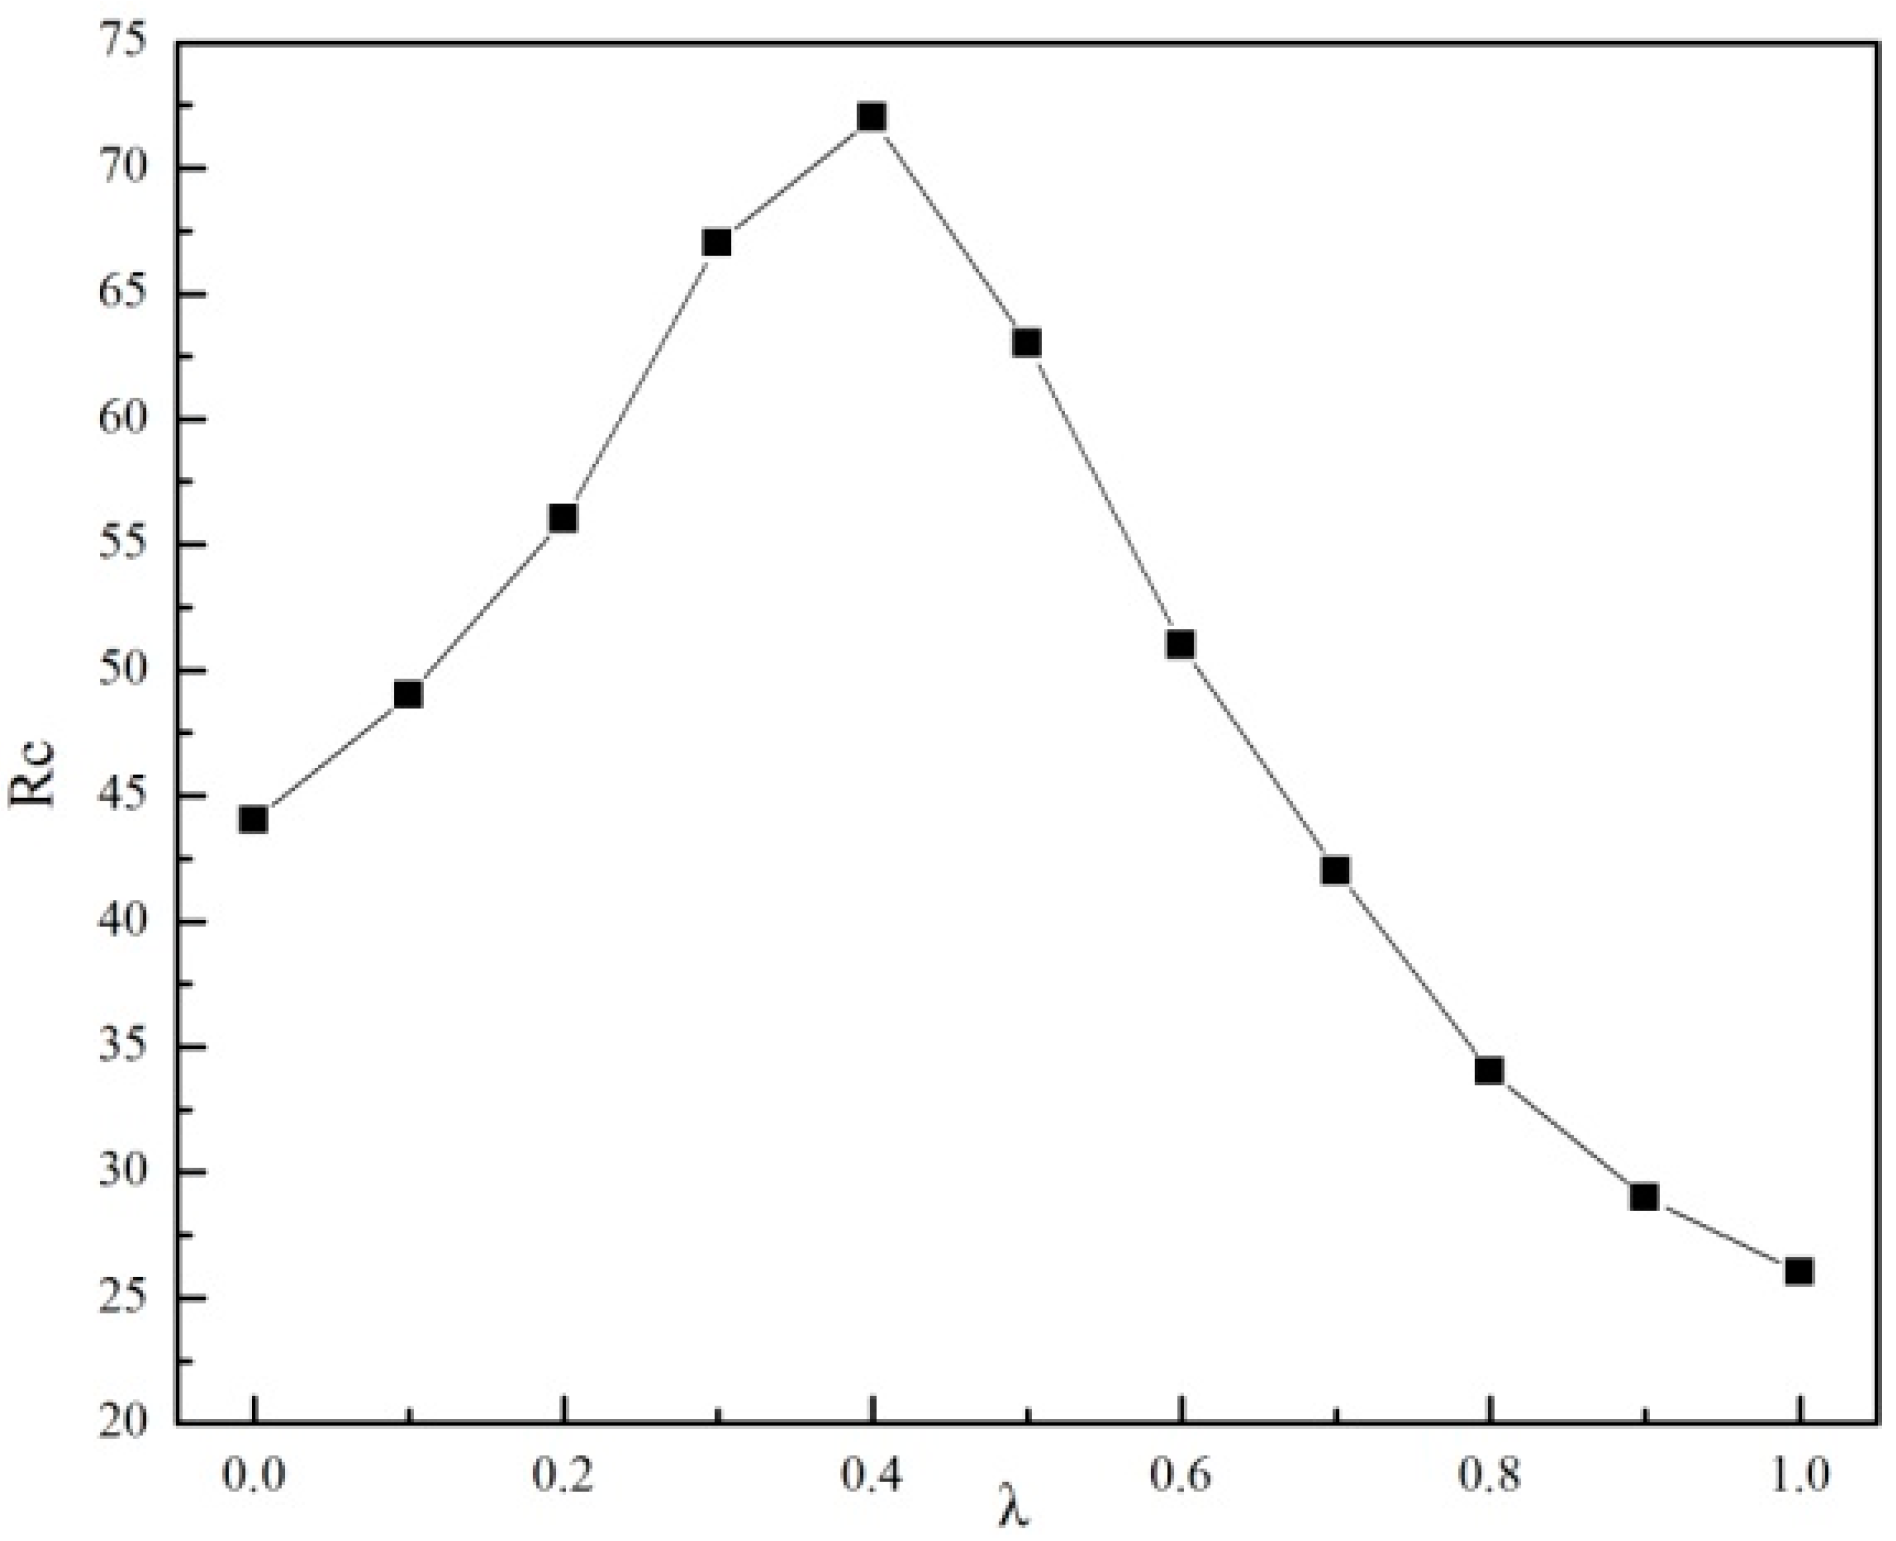
Under the integrated routing, the critical packet generation rate of the Beijing power communication network vs. the I-level packet generation proportion λ is as shown in Figure 17.
It can be seen from Figure 17 that the critical packet generation rate of the integrated routing increases first and then decreases with the increase of λ. λ is the proportion of the I-level packets at each time step. When λ = 0, only II-level packets are in the network, and the global dynamic routing is selected for transmission; when λ = 1, only I-level packets are in the network, and the shortest path routing is selected for transmission. When λ = 0.4, the critical packet generation rate is the largest, but when λ > 0.6, the critical packet generation rate of the integrated routing will be smaller than the global dynamic routing. Because the number of I-level packets is increasing, this results in congestion occurring easily at the hub nodes. In the realistic power communication network, the number of the key operational services of the I-level is small, and the number of affairs management services of the II-level is large, which accounts for the majority of the whole power communication services. Therefore, λ < 0.5 is more realistic and reasonable, that is the integrated routing has a larger critical packet generation rate and can effectively reduce congestion.
5. Conclusions
In this paper, an integrated routing strategy based on service classification is proposed for local congestion of the power communication network with the scale-free characteristic. The topology model of the power communication network is built, and the deliver capacity and cache capacity of the nodes are allocated according to the node betweenness. The services are divided into two levels based on the importance of power communication services. The shortest routing is adopted to transmit I-level packets, and the global dynamic routing is adopted to transmit II-level packets. The simulation results show that, in the power communication network, the integrated routing strategy can effectively guarantee the reliable transmission of critical services and has a large critical packet generation rate, which can reduce the local congestion.
Acknowledgments
The research was supported by the Project of Science and Technology of State Corporation of China (Grant No. SGJSSZOOFZJS1501091) and the Basic and Frontier Research Project of Chongqing (Grant No. cstc2015jcyjA40007).
Author Contributions
Min Xiang conceived of and designed the experiments. Qinqin Qu contributed to analyzing the results obtained via simulation and writing the paper.
Conflicts of Interest
The authors declare no conflict of interest.
References
- Wang, D.; Chen, C.P.; Yan, J.; Guo, L.; Lai, F.G. Pondering a New-generation Security Architecture Model for Power Information Network. Autom. Electr. Power Syst. 2016, 40, 6–11. [Google Scholar]
- Fan, B.; Tang, L. Vulnerability Analysis of Power Communication Network. Proc. CSEE 2014, 34, 1191–1197. [Google Scholar]
- Peng, H.; Tao, H.Z.; Yan, Y.Q.; Wang, J.; Ji, X.C.; Xie, X.D.; Liu, T. Database Management Technology for Smart Grid Dispatching and Control Systems. Autom. Electr. Power Syst. 2015, 39, 19–25. [Google Scholar]
- Zhang, X.P.; Zeng, R.J.; Chen, H. Service Characteristics and Key Technologies of the Smart Grid Communication. Telecommun. Electr. Power Syst. 2012, 33, 80–84. [Google Scholar]
- Amjad, A.M.; Josep, M.G. Special Issue on Advances in Integrated Energy Systems Design, Control and Optimization. Appl. Sci. 2017, 7, 1–3. [Google Scholar]
- Chen, L.J.; Mei, S.W.; Chen, Y. Smart Grid Information Security and Its Influence on Power System Survivability. Control Theory Appl. 2012, 29, 240–244. [Google Scholar]
- Zeng, Y.; Li, W.J.; Chen, Y.Y.; Tang, L.R. A congestion avoidance algorithm based on the service priority for electric power dispatching data network. Power Syst. Prot. Control 2014, 42, 49–55. [Google Scholar]
- Fan, B. An Improved Routing Method for Electric Power Communication Networks. Am. J. Netw. Commun. 2016, 5, 115. [Google Scholar]
- Zhao, T.; Wang, B.; Gao, Q. Congestion warning method based on the Internet of vehicles and community discovery of complex networks. J. China Univ. Posts Telecommun. 2016, 23, 37–45. [Google Scholar]
- Benyoussef, M.; Ezzahraouy, H.; Benyoussef, A. Optimal topology to minimizing congestion in connected communication complex network. Int. J. Mod. Phys. C 2017, 28, 1750073. [Google Scholar] [CrossRef]
- Evropeytsev, G.; Dominguez, E.L.; Hernández, S.E.P.; Cruz, J.R.P. An Efficient Causal Group Communication Protocol for Free Scale Peer-to-Peer Networks. Appl. Sci. 2016, 6, 234. [Google Scholar] [CrossRef]
- Liu, W.Y.; Liu, B. Study on congestion control for complex network based onweighted routing strategy. Syst. Eng. Theory Pract. 2015, 35, 1063–1068. [Google Scholar]
- Liu, G.; Li, Y. Study on the congestion phenomena in complex network based on gravity constraint. Acta Phys. Sin. 2012, 61, 108901. [Google Scholar]
- Ling, X.; Hu, M.B.; Jiang, R.; Qing, S.W. Global dynamic routing for scale-free networks. Phys. Rev. E Stat. Nonlinear Soft Matter Phys. 2010, 81, 016113. [Google Scholar] [CrossRef] [PubMed]
- Xu, P.; Hong, C. A global dynamic routing strategy based on capacity utilization ratio on scale-free networks. J. Natl. Univ. Def. Technol. 2013, 35, 109–113. [Google Scholar]
- Sheng, M.; Shi, Y.; Peng, C.W. A congestion avoidance routing protocol for cognitive scale-free networks. In Proceedings of the 2012 75th IEEE International Conference on Vehicular Technology, Yokohama, Japan, 16 July 2012; pp. 156–161. [Google Scholar]
- Zou, Y.; Li, Z. Optimal Routing Strategy on Scale-free Networks with Heterogeneous Delivering Capacity. Int. J. Future Gener. Commun. Netw. 2015, 8, 1–8. [Google Scholar]
- Fu, Y.; Gao, Q.; Yu, P. Discussion on power communication network platform construction based on multi service VPN. In Proceedings of the 2003 28th International Conference on China Electric Power Control and Operation Thesis Florilegium, Beijing, China, 21–23 October 2003; pp. 852–856. [Google Scholar]
- Danila, B.; Sun, Y.; Bassler, K.E. Collectively optimal routing for congested traffic limited by link capacity. Phys. Rev. E Stat. Nonlinear Soft Matter Phys. 2009, 80, 066116. [Google Scholar] [CrossRef] [PubMed]
- Echenique, P.; Gómez-Gardeñes, J.; Moreno, Y. Improved routing strategies for Internet traffic delivery. Phys. Rev. E Stat. Nonlinear Soft Matter Phys. 2004, 70, 056105. [Google Scholar] [CrossRef] [PubMed]
- Arenas, A.; Díazguilera, A.; Guimerà, R. Communication in networks with hierarchical branching. Phys. Rev. Lett. 2001, 86, 3196–3199. [Google Scholar] [CrossRef] [PubMed]
- Xing, N.Z. Empirical analysis on complex network characteristic of power optical fiber communication network. Opt. Commun. Technol. 2014, 38, 1–4. [Google Scholar]
- Wang, W.X.; Wang, B.H.; Yin, C.Y.; Xie, Y.B.; Zhou, T. Traffic dynamics based on local routing protocol on a scale-free network. Phys. Rev. E 2006, 89, 026111. [Google Scholar] [CrossRef] [PubMed]
- Jiang, Z.Y.; Liang, M.G. Improved efficient routing strategy on scale-free networks. Int. J. Mod. Phys. C 2012, 23, 50016–50022. [Google Scholar] [CrossRef]
Figure 1.
Power communication network architecture.
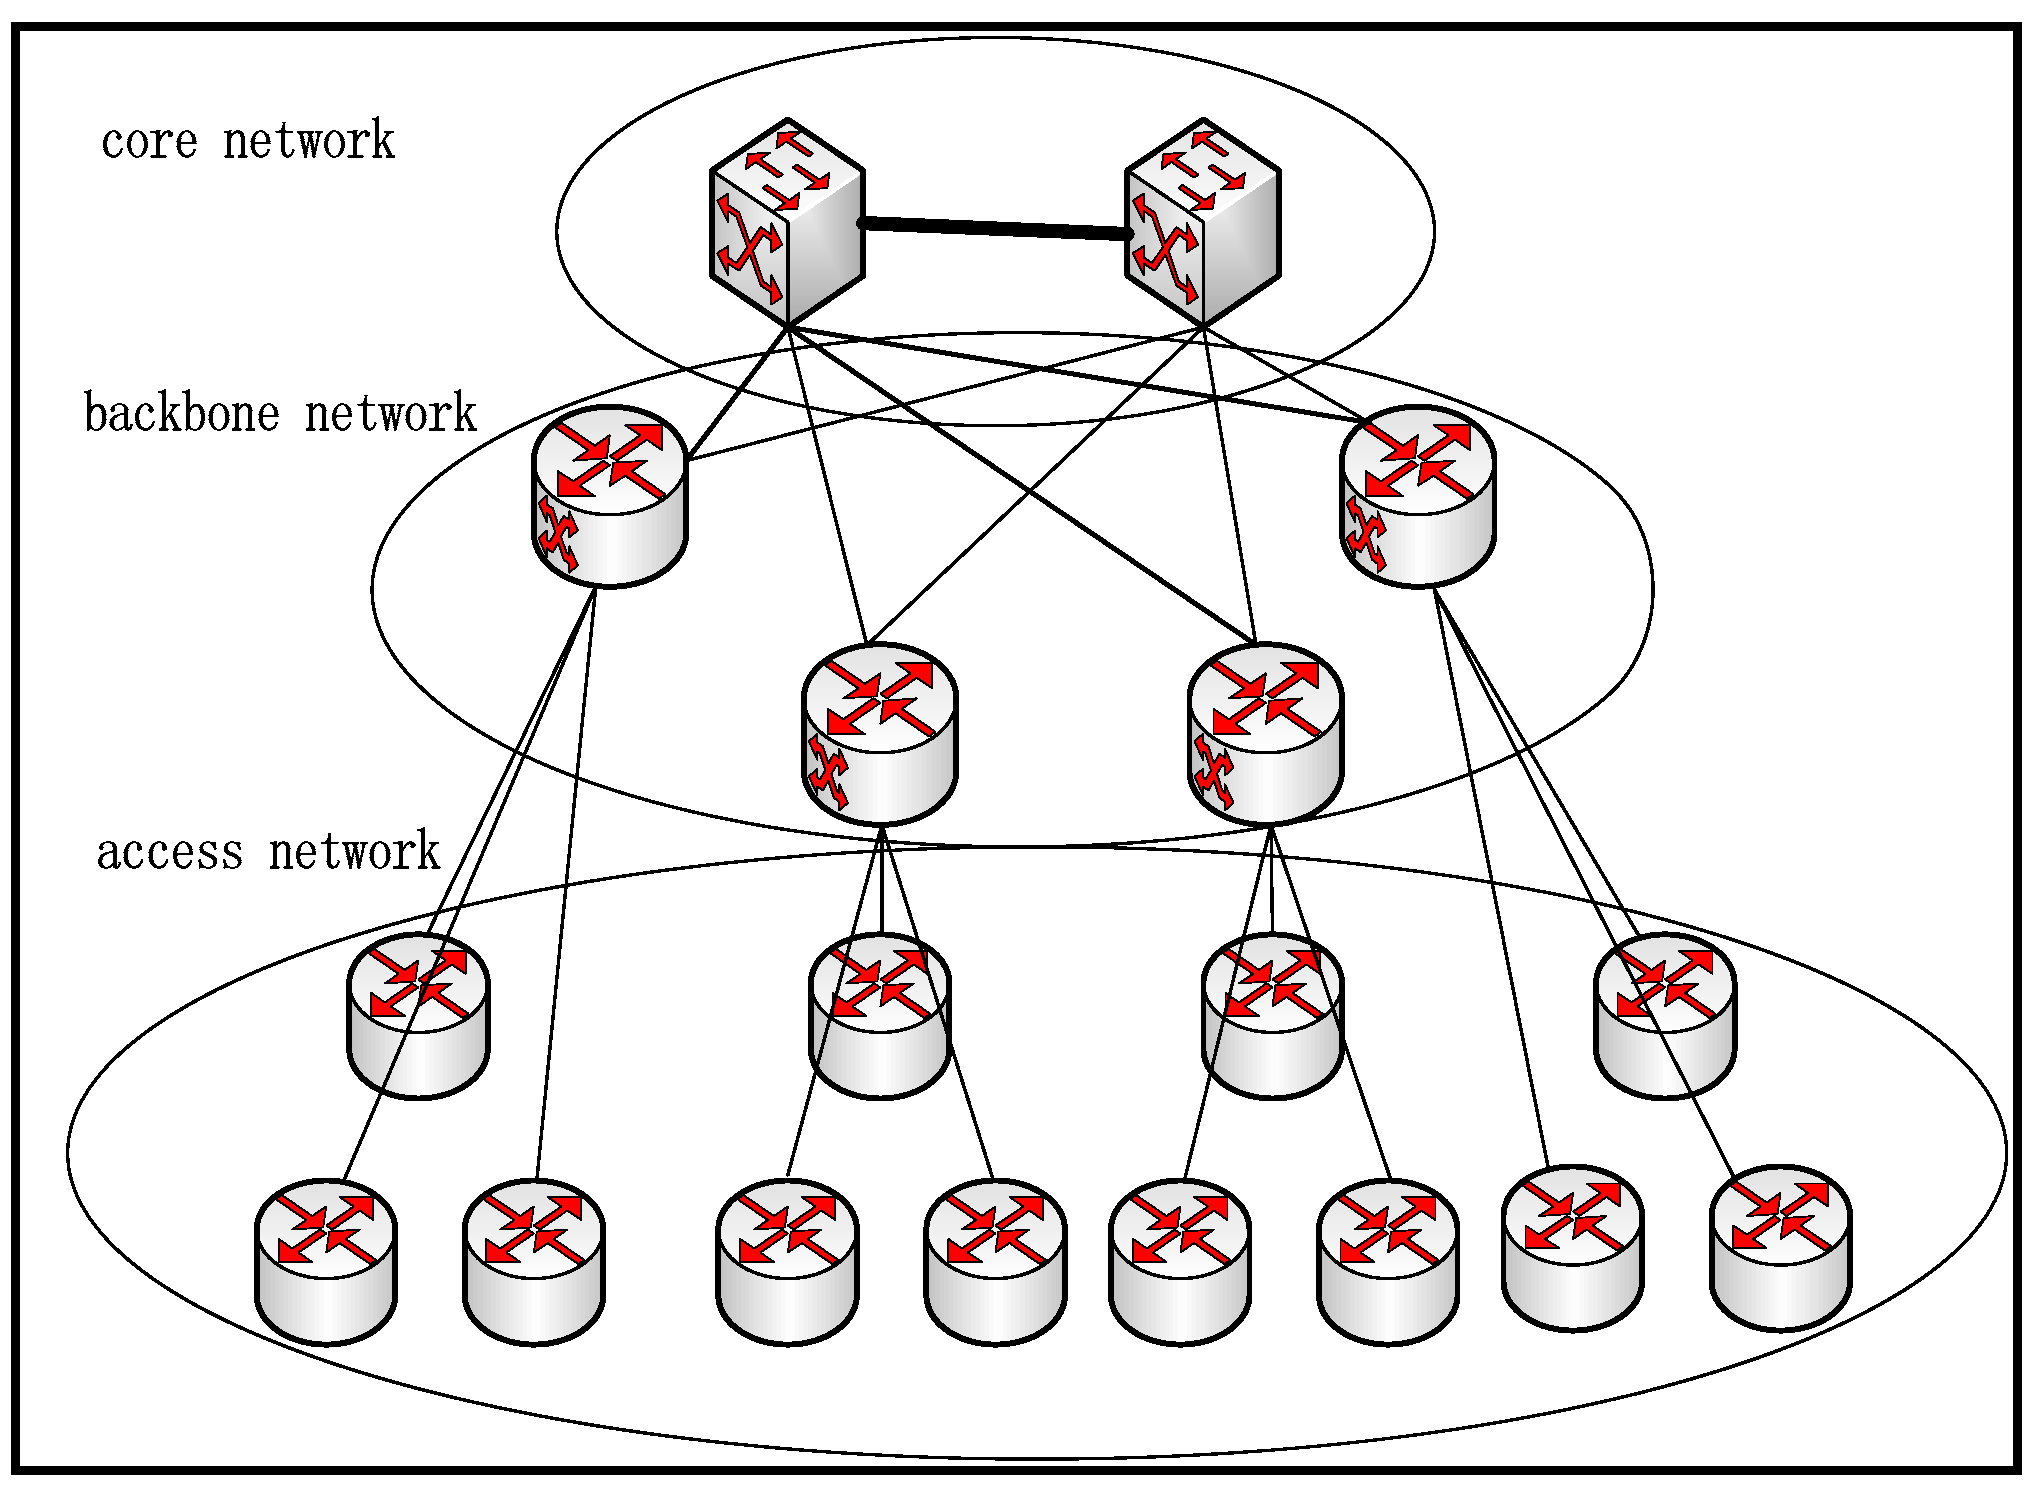
Figure 2.
Different network architectures of the power communication network.
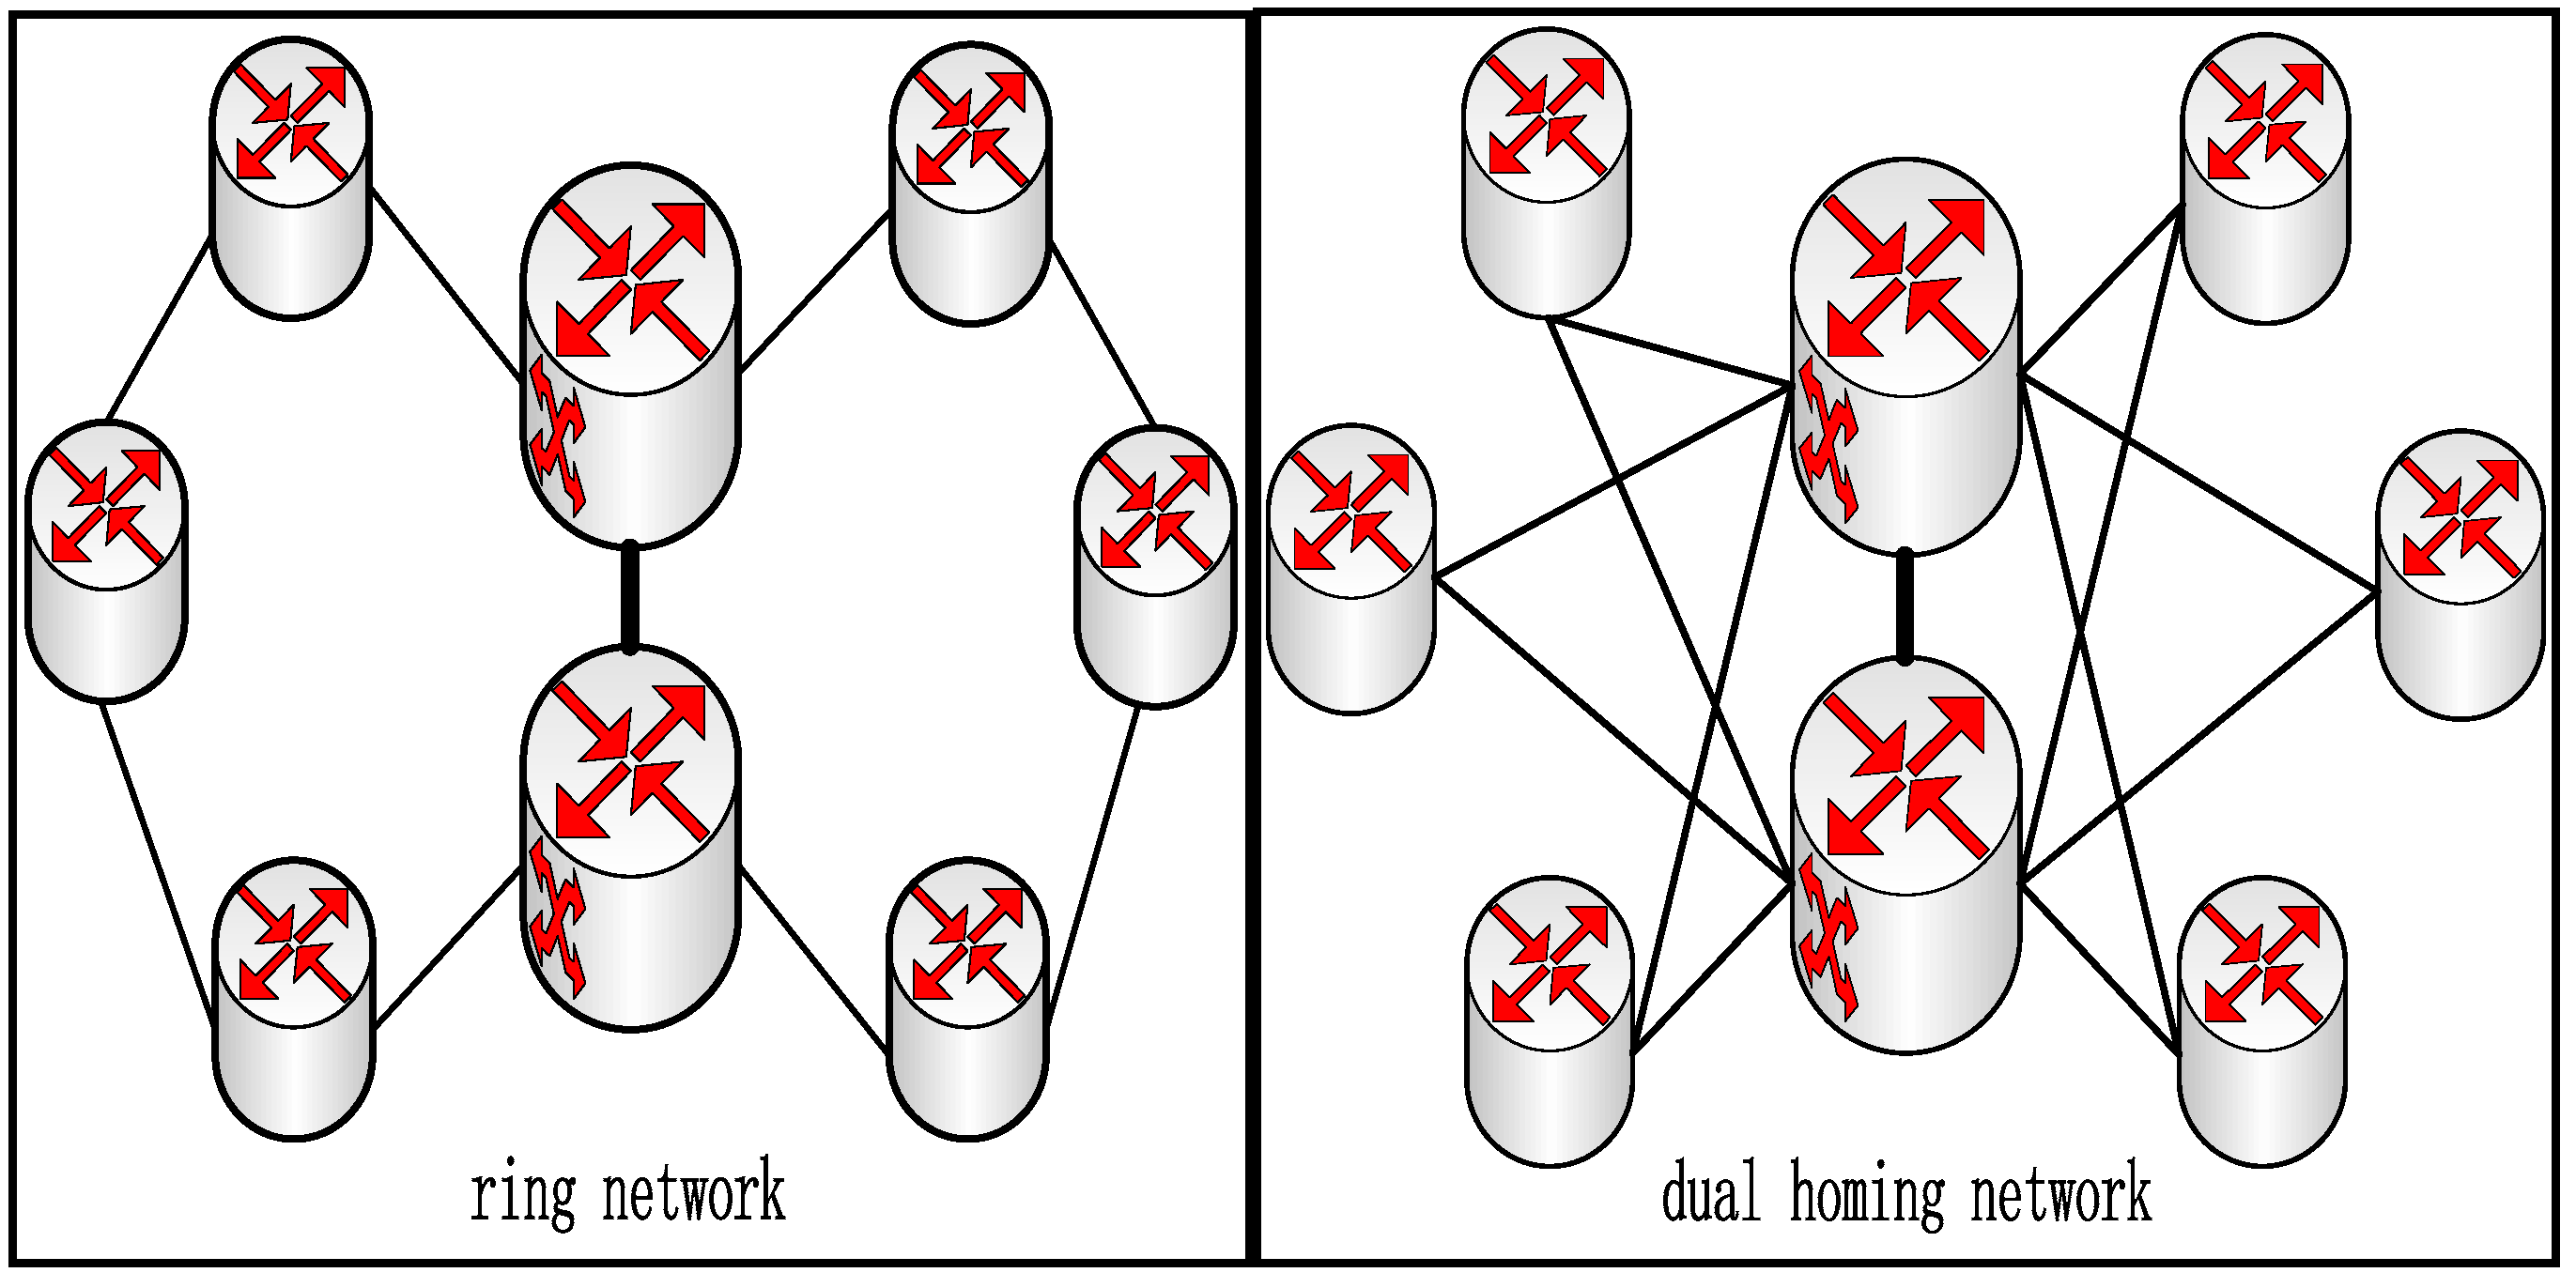
Figure 3.
Fundamental structure of the node queue. QM: Queue Management; QS: Queue Scheduling.
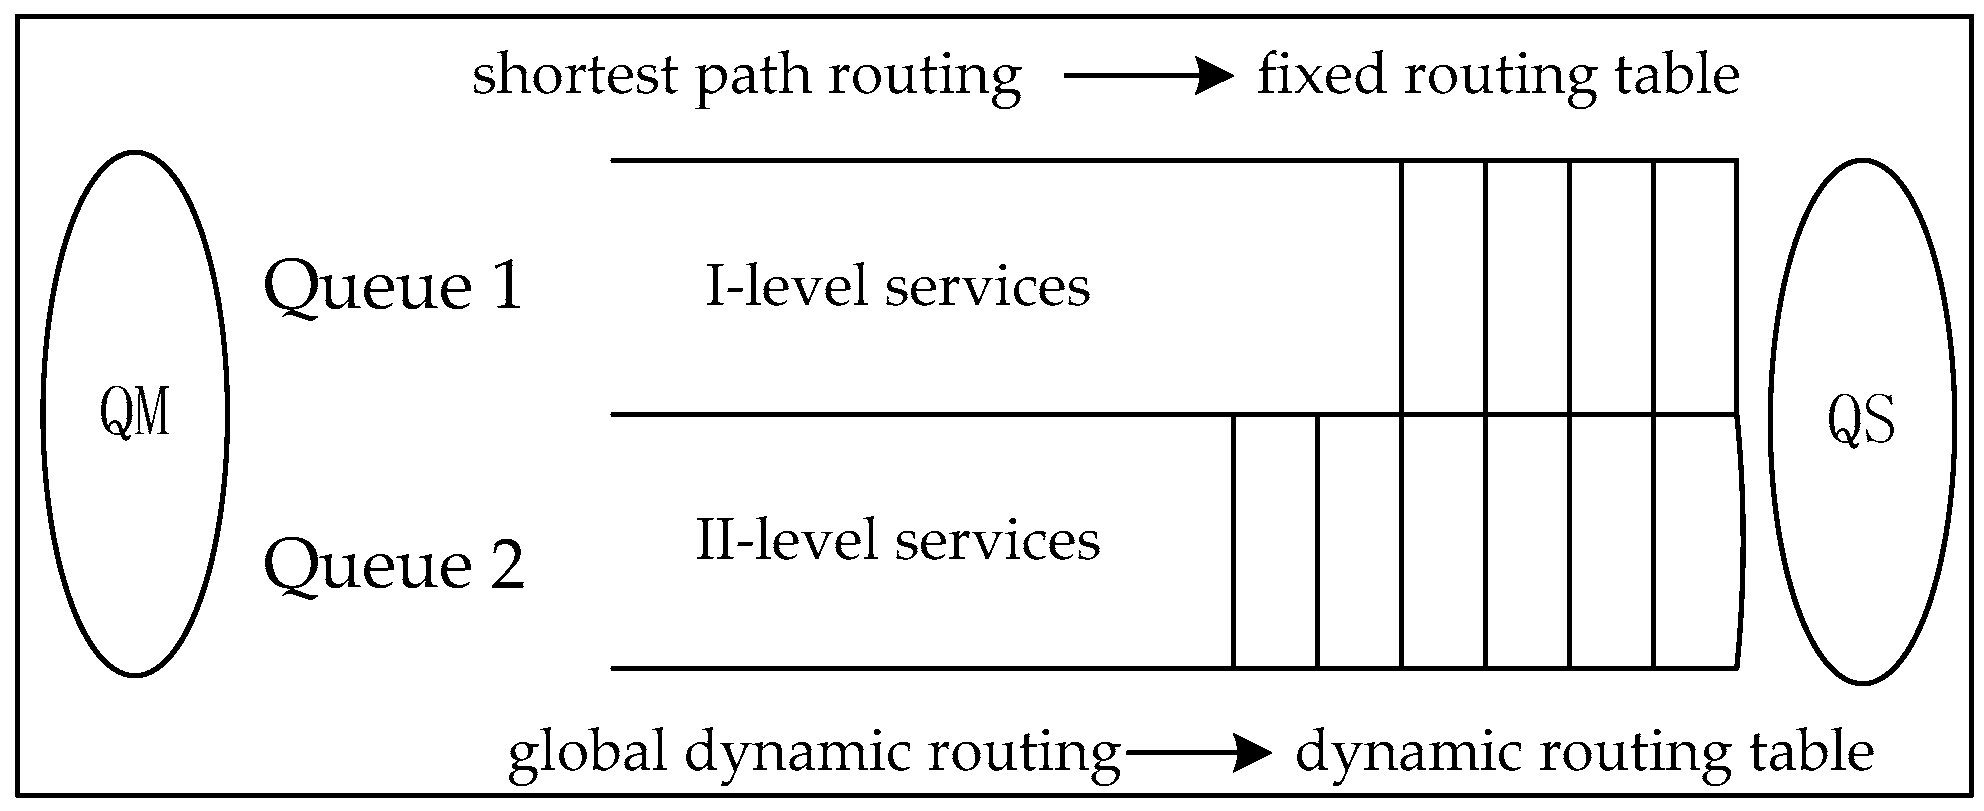
Figure 4.
The process of packet processing.
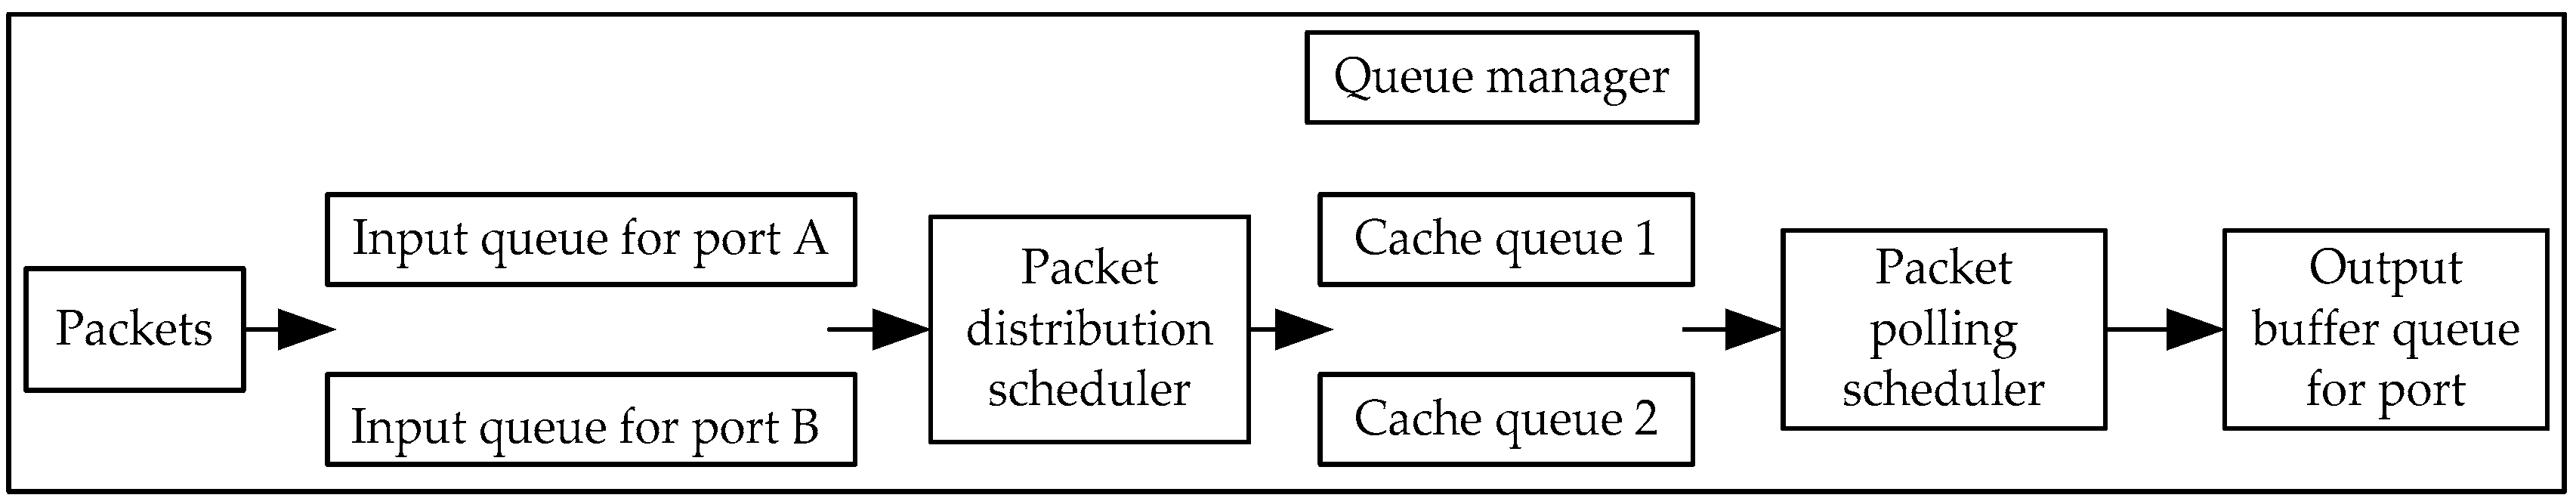
Figure 5.
Data flow at the hub node.

Figure 6.
The flowchart of integrated routing.

Figure 7.
Delivery path selection of global dynamic routing in different load conditions. (a) Initial load of nodes; (b) changed load of nodes.
Figure 7.
Delivery path selection of global dynamic routing in different load conditions. (a) Initial load of nodes; (b) changed load of nodes.

Figure 8.
Degree distribution of the Beijing power communication network.

Figure 9.
Local topology of the Beijing power communication network.
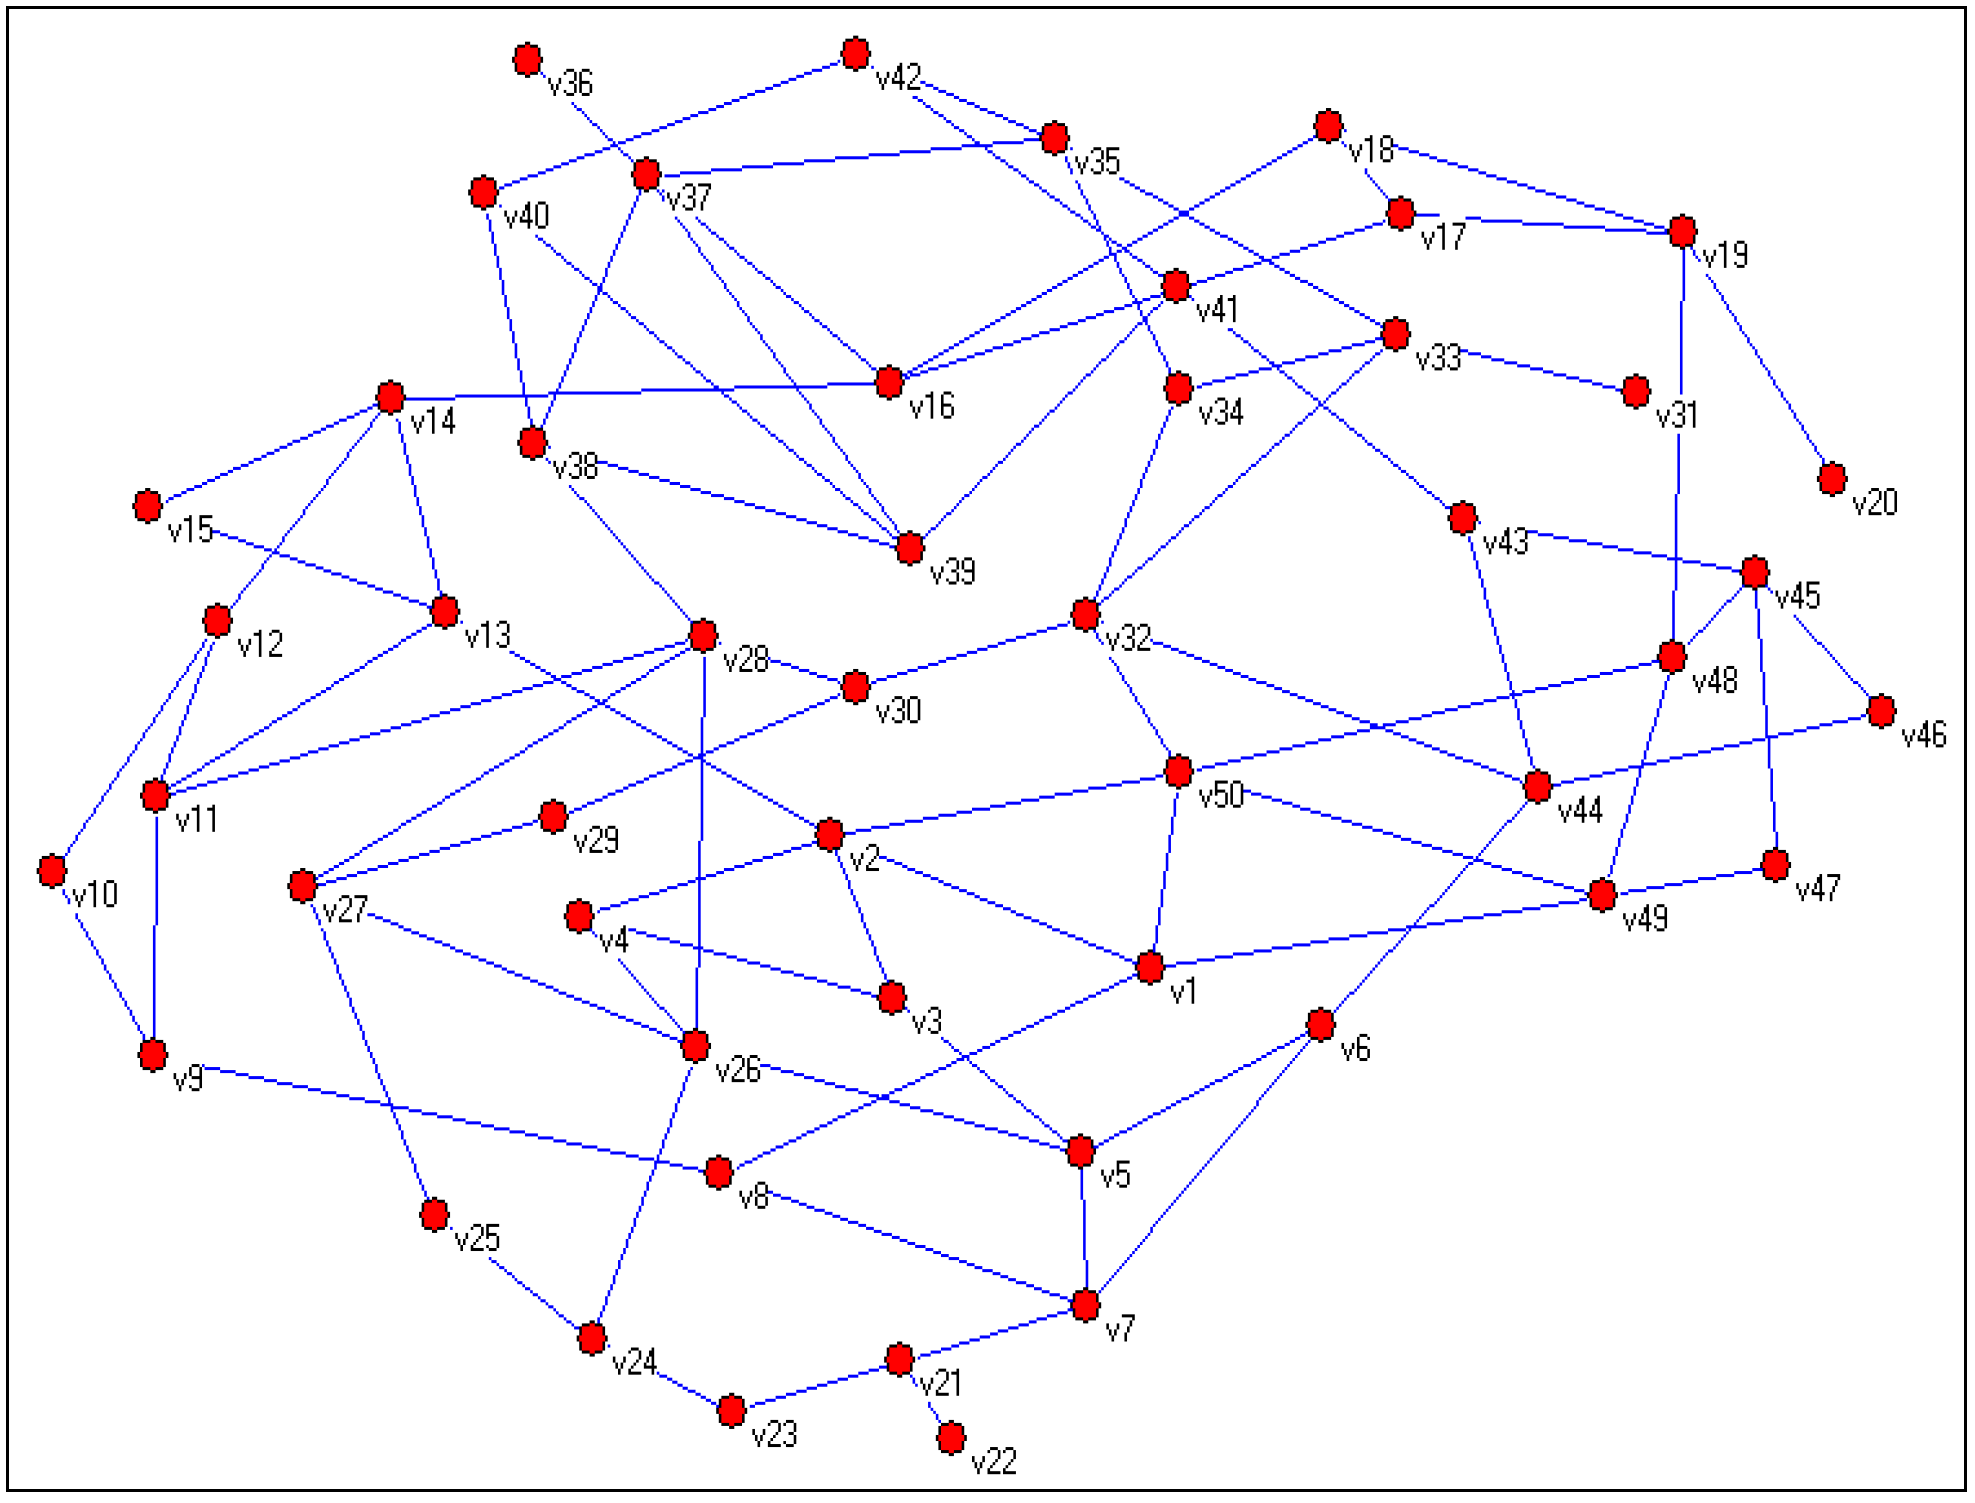
Figure 10.
The order parameter η vs. R with different allocations of node resources under the shortest path routing.
Figure 10.
The order parameter η vs. R with different allocations of node resources under the shortest path routing.

Figure 11.
The order parameter η vs. R under the four routing strategies.
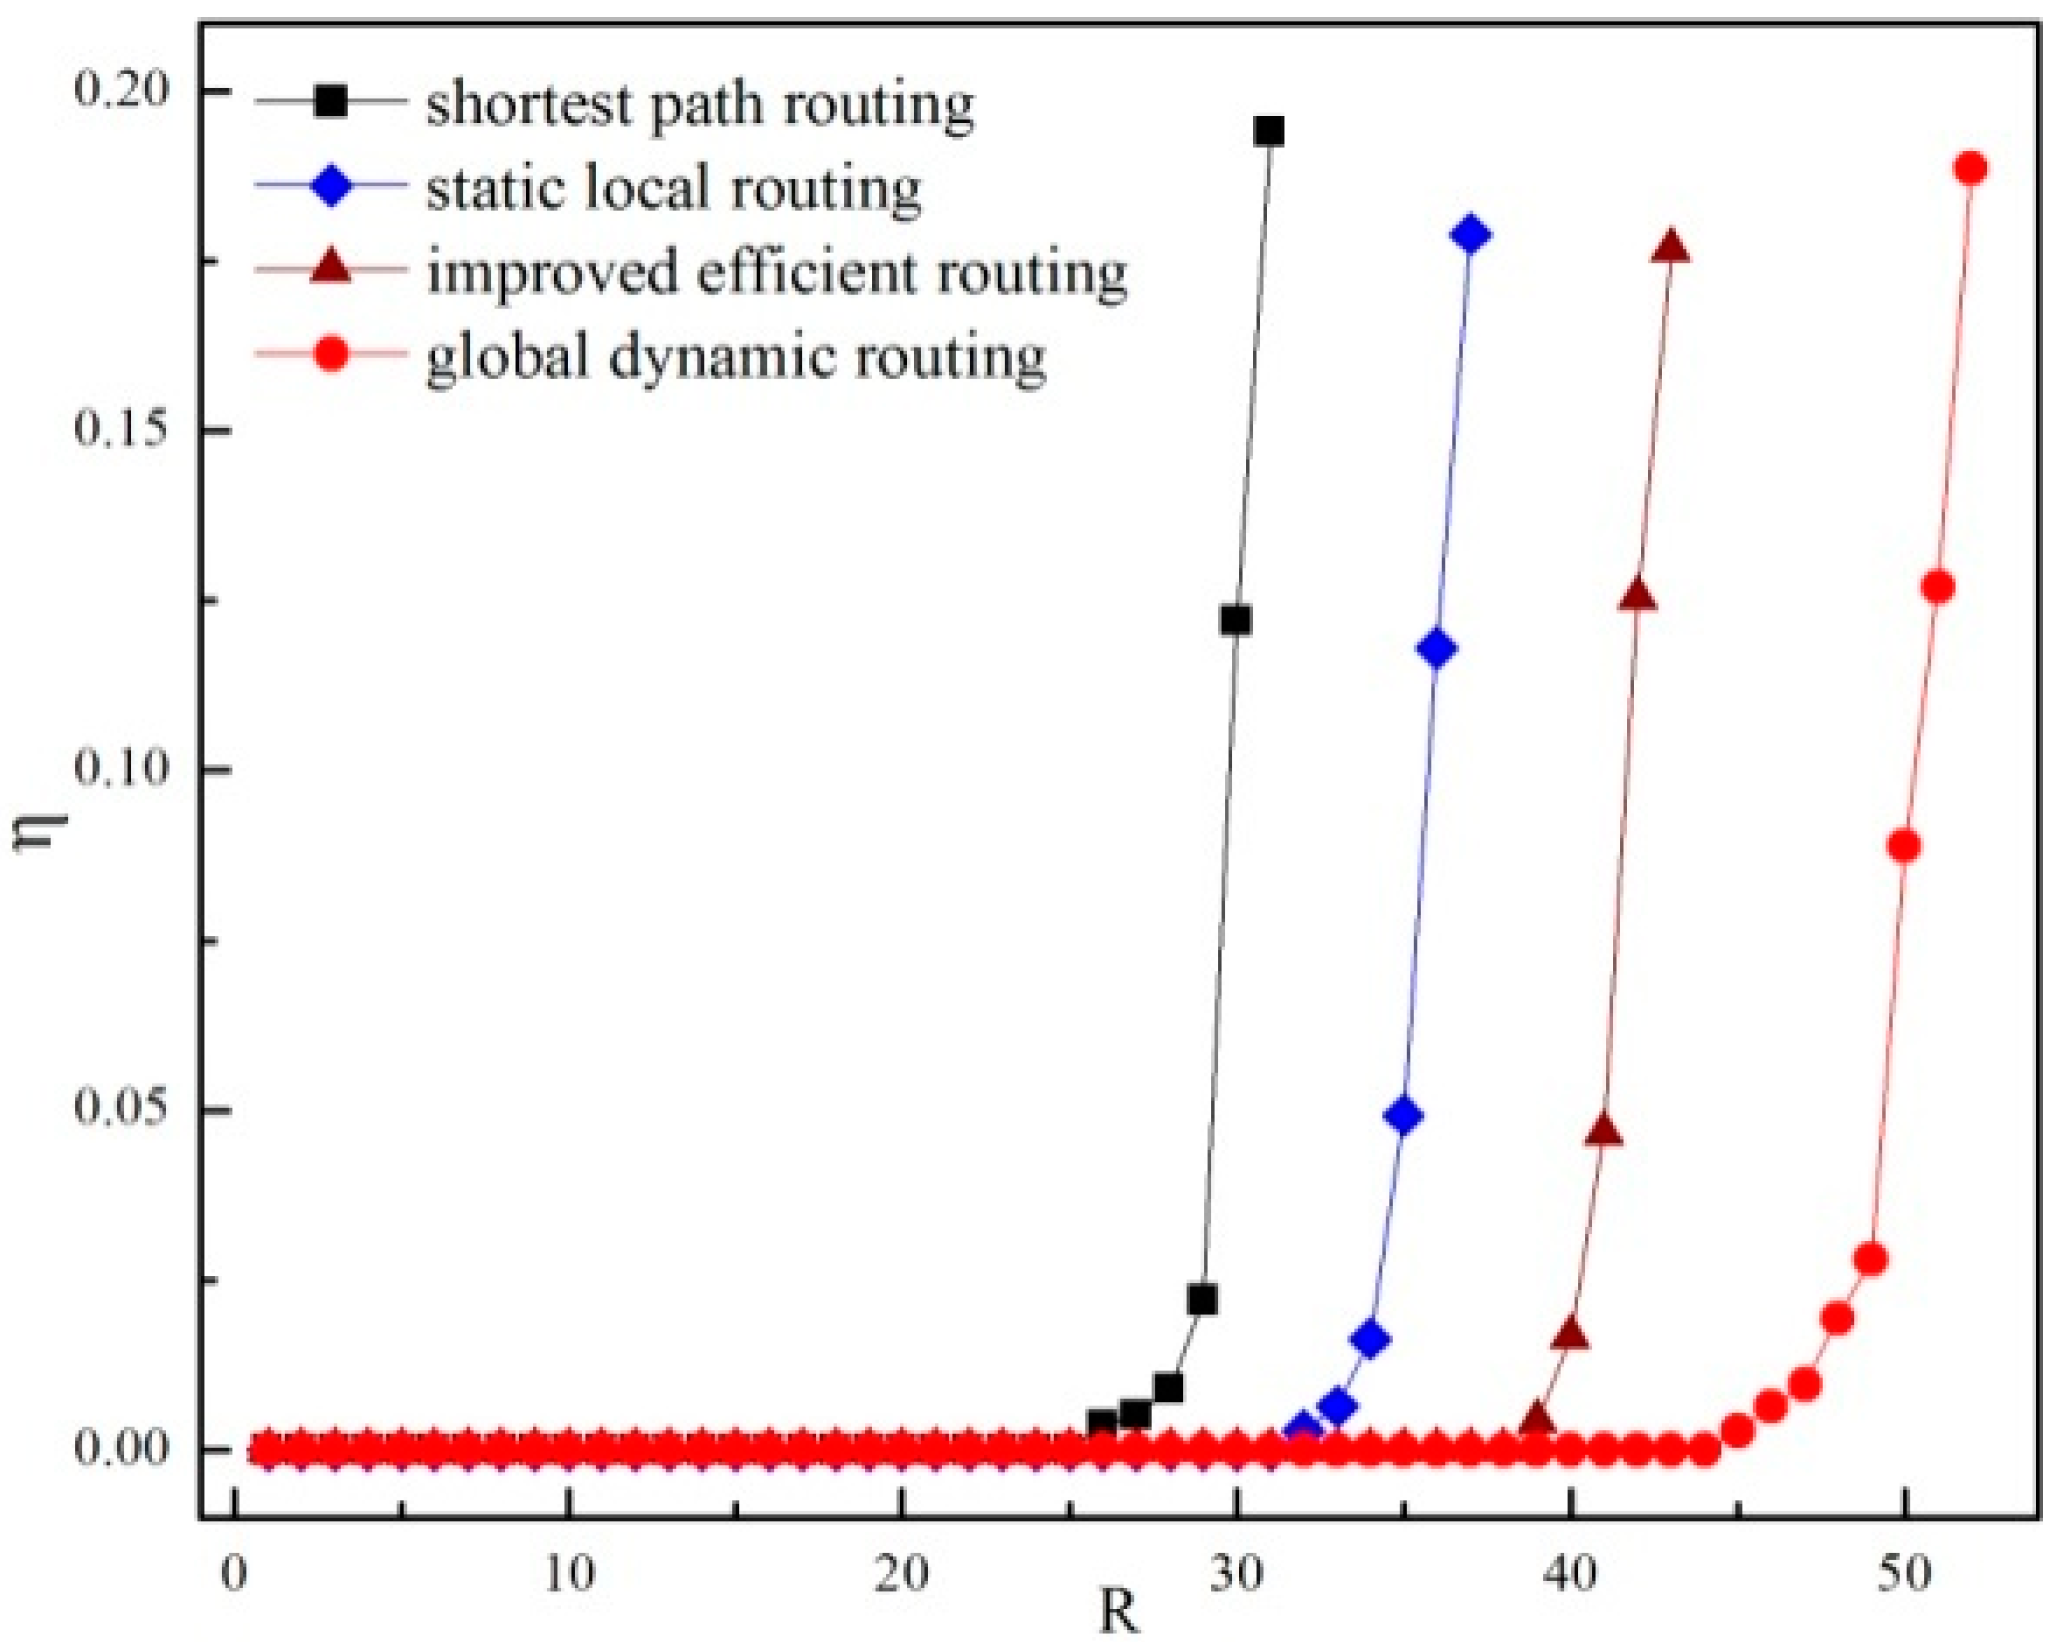
Figure 12.
Variations of the total load at hub nodes.

Figure 13.
The order parameter η vs. R under the four routing strategies.

Figure 14.
Evolution of packet number Np vs. t for different R under the integrated routing.

Figure 15.
The maximum transmission time <Tmax> and average transmission time <Tavg> vs. packet generation rate R under different routing strategies.
Figure 15.
The maximum transmission time <Tmax> and average transmission time <Tavg> vs. packet generation rate R under different routing strategies.

Figure 16.
The critical packet generation rate Rc vs. network size N with the same average degree <k> = 3.2 (Beijing power communication network average degree) under the three routing strategies.
Figure 16.
The critical packet generation rate Rc vs. network size N with the same average degree <k> = 3.2 (Beijing power communication network average degree) under the three routing strategies.
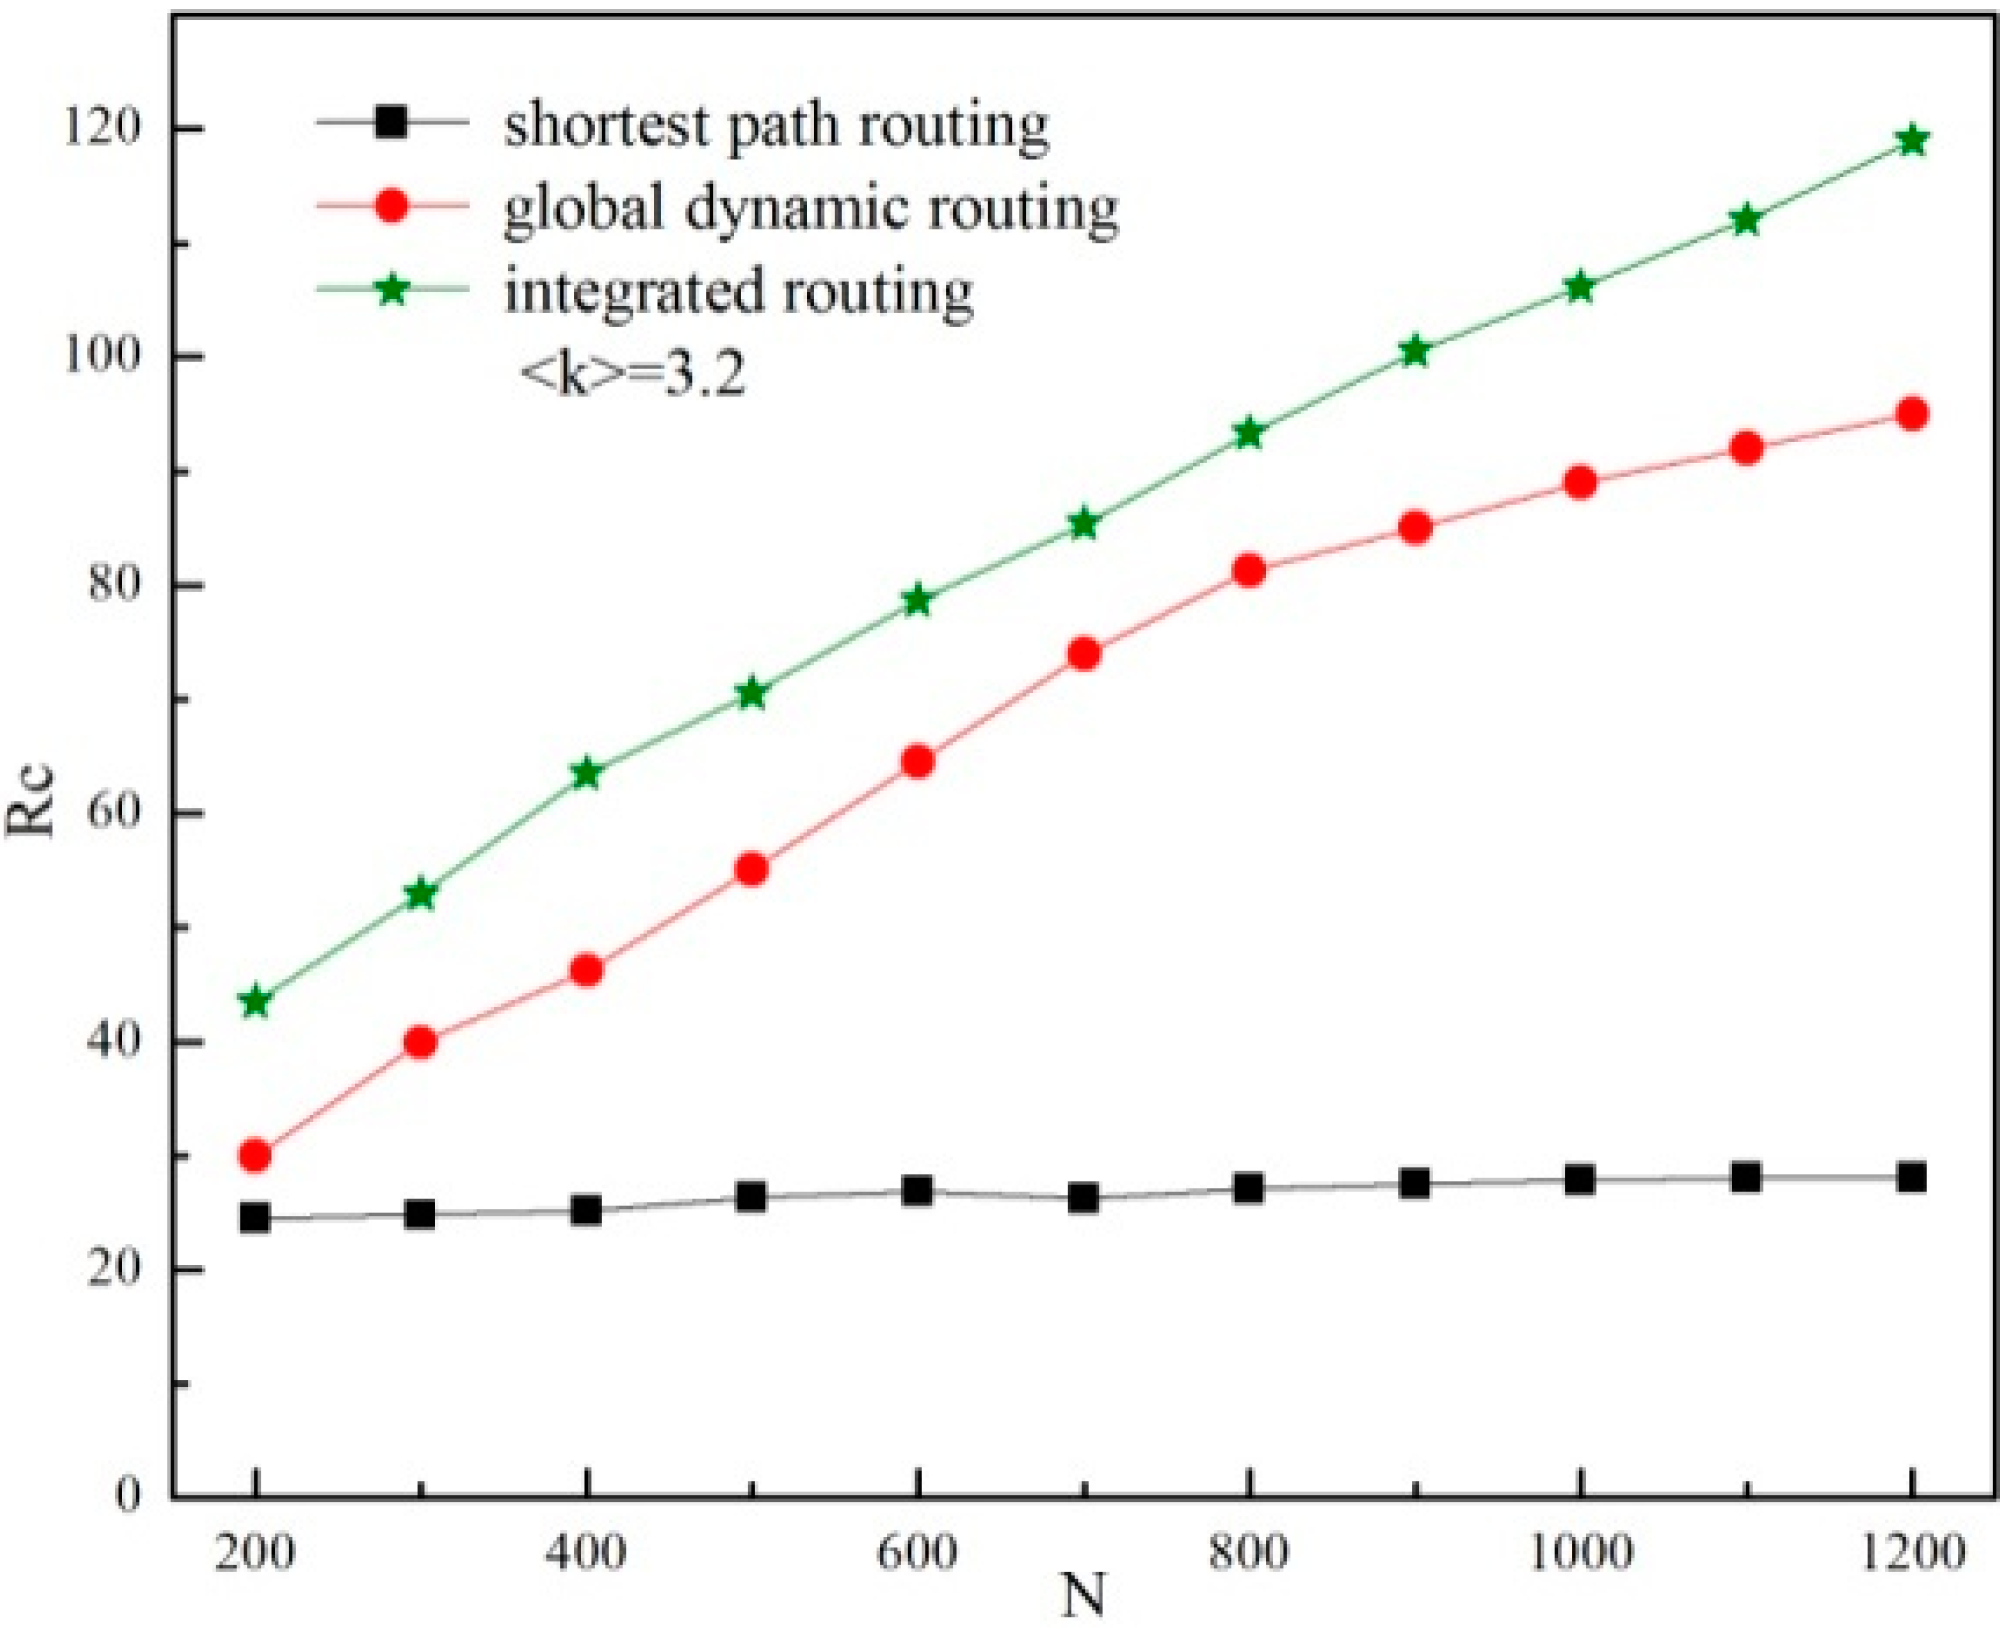
Figure 17.
Critical packet generation rate varies vs. I-level packet generation proportion λ.


Table 1.
Service type of power communication services.
| Service Type | Examples |
|---|---|
| voice service | dispatching telephone, conference telephone, etc. |
| data service | line relay protection data, dispatching automation data, etc. |
| video service | remote video conference, surveillance video, etc. |
Table 2.
Classification of power communication services.
| I-Level | II-Level |
|---|---|
| relay protection data | video conference |
| safety and stability control data | lightning location monitoring |
| dispatching telephone | office automation |
| protection information management | electric metering telemetry |
| dispatching automation | video monitoring of substations |
| wide area measurement | administrative telephone |
Table 3.
Node degree distribution of the Beijing power communication network (2012).
| k | 1 | 2 | 3 | 4 | 5 |
| Nk | 0 | 252 | 111 | 71 | 48 |
| p(k) | 0 | 0.432 | 0.208 | 0.133 | 0.090 |
| k | 6 | 7 | 8 | 9 | ∑ |
| Nk | 26 | 12 | 8 | 5 | 533 |
| p(k) | 0.049 | 0.023 | 0.015 | 0.009 | 1 |
© 2017 by the authors. Licensee MDPI, Basel, Switzerland. This article is an open access article distributed under the terms and conditions of the Creative Commons Attribution (CC BY) license (http://creativecommons.org/licenses/by/4.0/).
Share and Cite
MDPI and ACS Style
Xiang, M.; Qu, Q. A Congestion Control Strategy for Power Scale-Free Communication Network. Appl. Sci. 2017, 7, 1054. https://doi.org/10.3390/app7101054
AMA Style
Xiang M, Qu Q. A Congestion Control Strategy for Power Scale-Free Communication Network. Applied Sciences. 2017; 7(10):1054. https://doi.org/10.3390/app7101054
Chicago/Turabian StyleXiang, Min, and Qinqin Qu. 2017. "A Congestion Control Strategy for Power Scale-Free Communication Network" Applied Sciences 7, no. 10: 1054. https://doi.org/10.3390/app7101054
Note that from the first issue of 2016, this journal uses article numbers instead of page numbers. See further details here.