Article

Strong Aftershock Study Based on Coulomb Stress Triggering—A Case Study on the 2016 Ecuador Mw 7.8 Earthquake

1
Key Laboratory of Earthquake Geodesy, Institute of Seismology, CEA, Wuhan 430071, China
2
Department of Mechanical Engineering, University of Houston, Houston, TX 77204, USA
*
Author to whom correspondence should be addressed.
Appl. Sci. 2017, 7(1), 88; https://doi.org/10.3390/app7010088
Submission received: 8 December 2016 / Revised: 10 January 2017 / Accepted: 12 January 2017 / Published: 20 January 2017
(This article belongs to the Special Issue Structural Health Monitoring (SHM) of Civil Structures)

Abstract

:
The 2016 Ecuador M 7.8 earthquake ruptured the subduction zone boundary between the Nazca plate and the South America plate. This M 7.8 earthquake may have promoted failure in the surrounding crust, where six M ≥ 6 aftershocks occurred following this mainshock. These crustal ruptures were triggered by the high coulomb stress changes produced by the M 7.8 mainshock. Here, we investigate whether the six M ≥ 6 aftershocks are consistent with the positive coulomb stress region due to the mainshock. To explore the correlation between the mainshock and the aftershocks, we adopt a recently published high-quality finite fault model and focal mechanisms to study the coulomb stress triggers during the M 7.8 earthquake sequence. We compute the coulomb failure stress changes (ΔCFS) on both of the focal mechanism nodal planes. We compare the ΔCFS imparted by the M 7.8 mainshock on the subsequent aftershocks with the epicenter location of each aftershock. In addition, the shear stress, normal stress, and coulomb stress changes in the focal sources of each aftershock are also computed. Coulomb stress changes in the focal source for the six M ≥ 6 aftershocks are in the range of −2.17–7.564 bar. Only one computational result for the M 6.9 aftershock is negative; other results are positive. We found that the vast majority of the six M ≥ 6 aftershocks occurred in positive coulomb stress areas triggered by the M 7.8 mainshock. Our results suggest that the coulomb stress changes contributed to the development of the Ecuador M 7.8 earthquake sequence.

1. Introduction

The 2016 M 7.8 earthquake occurred offshore of the west coast of Northern Ecuador, where the plate boundary between the Nazca and the South America plates lies (Figure 1). During this earthquake, at least 668 people were killed, and 27,732 people were injured. More than 7000 buildings were destroyed, including most of the town of Pedernales and its surrounding urban areas [1]. The urban earthquake disaster is growing throughout the world and has become a serious problem in developing countries. Unless earthquake monitoring is improved, subsequent aftershocks will have more disastrous social and economic consequences [2]. Due to its unique geodynamic environment, seven M > 7 earthquakes have occurred within 250 km of this event since 1900.
The M 7.8 mainshock was followed by six M ≥ 6 aftershocks, the largest being an M 6.9 aftershock on 18 May about one month after the mainshock. The epicenter locations and focal mechanisms of these aftershocks are consistent with the plate boundary subduction zone between the Nazca and the South America plates.
In recent years, many seismology scientists worldwide have focused on coulomb stress triggering and the correlation between the mainshock and subsequent aftershocks in an earthquake sequence. Much research on large earthquake sequences has concluded that stress changes from the mainshock affect the locations of subsequent aftershocks [4,5,6]. The coulomb stress triggering theory has been proposed for evaluating aftershock hazards after great earthquakes. This theory implies that coulomb stress changes due to a mainshock can promote nearby faults closer to failure stress and trigger the occurrence of some aftershocks. It was thought that small coulomb stress changes can alter the likelihood of earthquakes on nearby faults [7,8]. The occurrence of earthquake activity can be promoted when the coulomb stress increases as little as 0.1 bar on a seismogenic fault [9,10]. Small positive changes in coulomb stress due to an earlier mainshock can trigger subsequent earthquakes.
The coulomb stress change triggered by a mainshock has been widely studied to explore its interaction with aftershock activities. Coulomb stress triggering of moderate-to-large earthquakes has been observed in the US [4,11,12,13], in Europe [14,15,16], on the Sunda Trench [17,18,19], and in Japan [20,21,22,23,24,25]. However, in South America and Ecuador, the stress triggering theory has yet to be extensively studied [26,27,28]. The 2016 Ecuador earthquake sequence provides a unique opportunity to test the interaction between a large subduction earthquake that imparted coulomb stress changes and the subsequent seismicity. In this study, based on the Coulomb 3.3 software [29] (3.3, USGS, Menlo Park, CA, USA), which implements the elastic half space of Okada [30], we investigate the coulomb stress triggering theory with the 2016 Ecuador M 7.8 earthquake sequence. Firstly, we collect the focal mechanism solutions of six M ≥ 6 aftershocks from the USGS (US Geological Survey). Secondly, we compute the coulomb stress changes on both nodal planes of these events. We determine the regional stress direction from the principal axes. Thirdly, we compute the coulomb stress, normal stress, and shear stress changes in the focal source of each M ≥ 6 aftershock. Our primary goal is to find the correlation between the coulomb stress changes and the spatial distribution of the following aftershocks. In addition, we want to determine whether the coulomb stress triggering theory can explain the Ecuador M 7.8 earthquake sequence.

2. The Coulomb Stress Triggering Hypothesis

2.1. Coulomb Failure Criterion

The coulomb failure criterion is commonly adopted to quantify the effect of static stress change on a fault plane. The trend of rocks to rupture in a brittle manner is considered to be a function of both shear and confining stresses, commonly formulated as the coulomb failure criterion [8]. A seismogenic fault rupture permanently deforms the crustal medium and modifies the tectonic stress field, increasing or decreasing the stress on nearby faults as a function of the location, geometry, and slip direction. The coulomb failure stress (CFS) is defined as follows [31]:
CFS = τ s μ ( σ n p )
where τ is the shear stress along the fault plane (positive in the interred direction of slip). s is cohesion, and μ is apparent friction coefficient, which ranges from 0.6 to 0.8 for most intact rocks [31]. σn is the normal stress on the fault plane, and p is the fluid pressure, respectively. The coulomb failure stress change can be defined as follows:
Δ CFS = Δ τ + μ Δ σ n
where Δτ is the shear stress change on a given failure plane (positive in the fault slip direction). Δσn is the normal stress change (positive for fault unclamping or compression). μ′ = μ(1 − β) is the effective coefficient of friction, which includes the effects of pore pressure changes and generally ranges from 0 to 0.8. β is Skempton’s coefficient, and the range is from 0 to 1. The previous study showed that the μ′ is typically found to be around 0.4 (μ = 0.75, β = 0.47) for subduction zones [28]. Previous studies have employed values of 0.2 ≤ μ′ ≤ 0.75 to compute coulomb stress changes and have discussed the robustness of the obtained conclusion for different settings of apparent coefficients of frictions [32,33,34]. In this paper, we investigated μ′ = 0.2, 0.4, 0.6, and 0.8, respectively. The computed results show that there is no significant differences, which is consistent with previous conclusions. A priori, the models with μ′ = 0.4 can minimize the uncertainty, as discussed by King et al [8]. Here, we take the computation results with μ′ = 0.4 for the following analysis and discussion. Positive values of the coulomb stress change promote rupture and negative values inhibit rupture. It seems that the coulomb stress increases as low as 0.1 bar can trigger the occurrence of subsequent aftershocks [7,8].
The coulomb stress change relies on the source model of an earthquake, the geometry, the slip direction of the receiver fault (fault receiving stress from a mainshock), and the effective coefficient of friction. Here, we utilize this model to estimate how the Ecuador M 7.8 mainshock transferred stress in the epicentral region. By assuming a Young's modulus of 8.0 × 10⁵ bar and a Poisson’s ratio of 0.25, we compute the coulomb stress change in an elastic half-space. The effective friction coefficient is 0.4. We make two complementary computations. First, we resolve coulomb stress changes on both nodal planes of each M ≥ 6 aftershock. Second, we compute the normal, shear, and coulomb stress changes in the focal source of each M ≥ 6 aftershock. The coulomb failure stress changes, produced by the Ecuador M 7.8 mainshock, is important for us to investigate the cause and mechanism of the larger aftershocks.

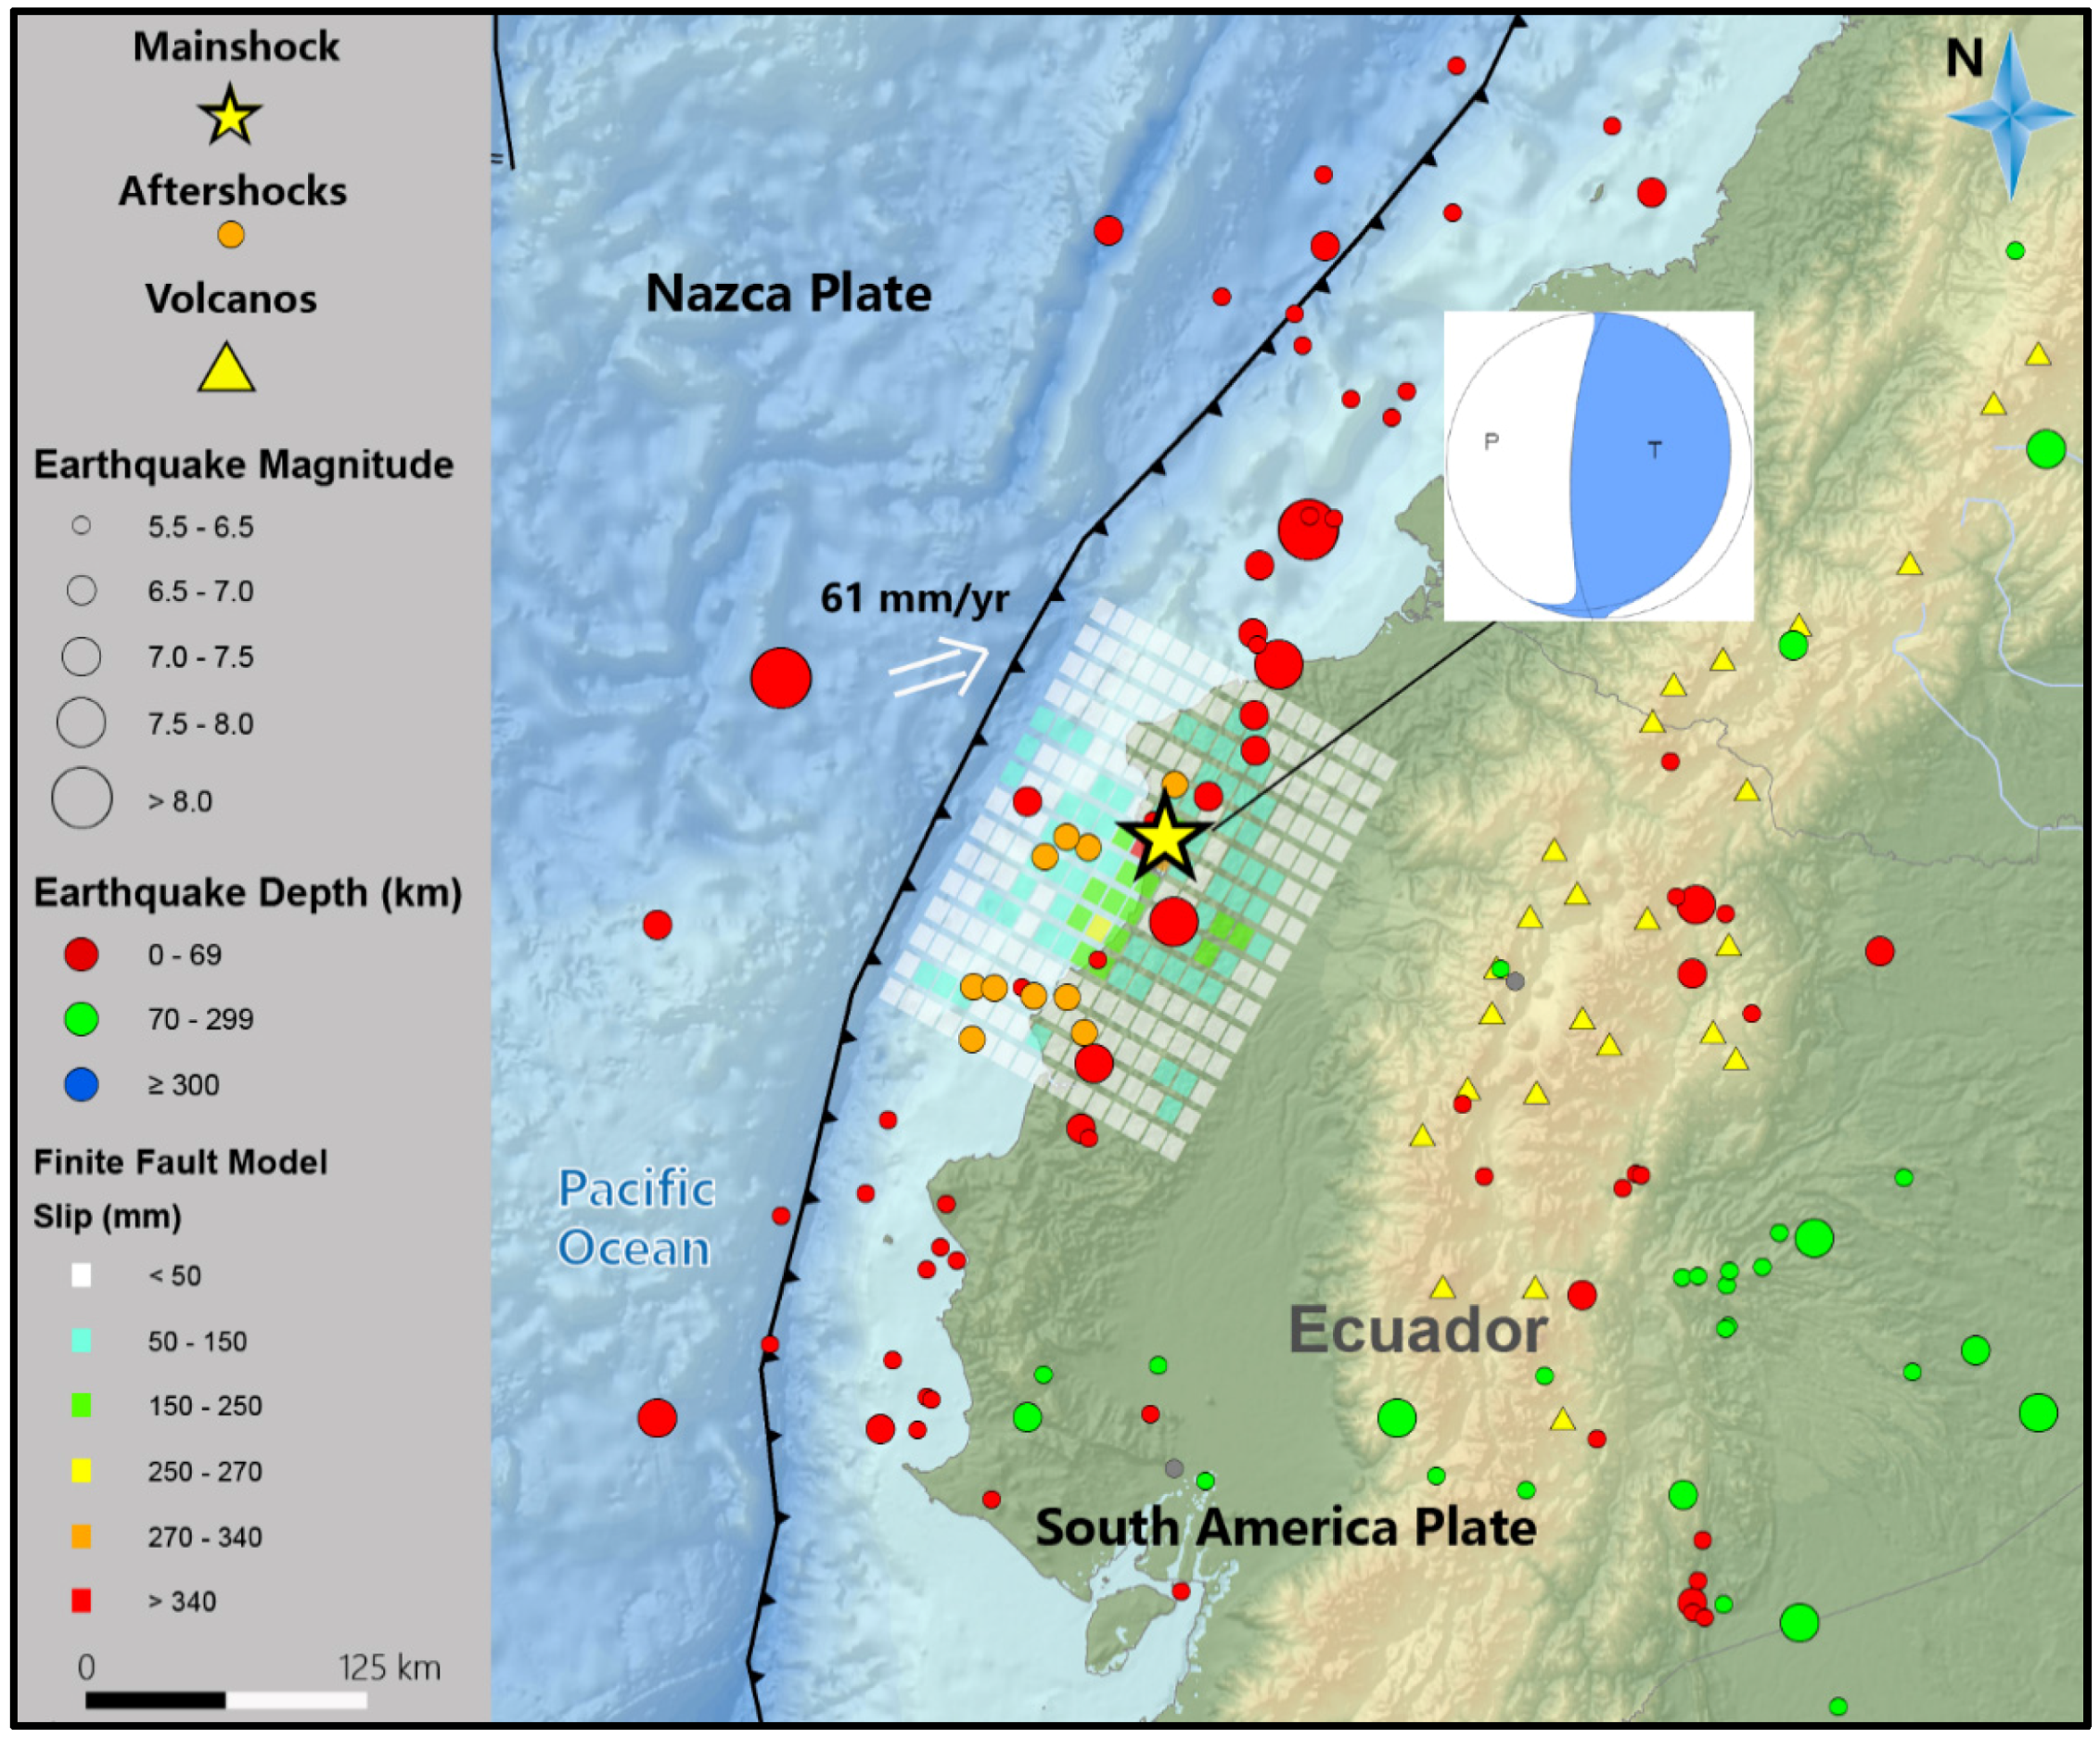
2.2. Finite Fault Model

A more realistic finite fault failure model is critical for the following calculation of coulomb stress changes. Here, we choose a variable finite fault model that was inverted from Global Seismic Network (GSN) broadband waveforms by Gavin Hayes (Figure 2) [35]. This model can be downloaded from https://earthquake.usgs.gov/archive/product/finite-fault/us20005j32/us/1460878 551639/web/20005j32_coulomb.inp. Distribution of the amplitude and slip direction for subfault elements of the fault rupture model are determined by the inversion of teleseismic body waveforms and long period surface waves [36,37]. Gavin Hayes used GSN broadband waveforms downloaded from the National Earthquake Information Center (NEIC) waveform server and analyzed 38 teleseismic broadband P waveforms, 9 broadband SH waveforms, and 53 long period surface waves, selected based on data quality and azimuthal distribution. Waveforms were first converted to displacement by removing the instrument response and then used to constrain the slip history using a finite fault inverse algorithm [38].
As shown in Figure 2, the different colors indicate the slip amount. The deeper the color, the greater the amplitude of the slip. Arrows indicate the slip direction (of the hanging wall with respect to the foot wall). For the M 7.8 mainshock, the strike of the fault rupture plane is 29° and the dip is 15°. The rupture surface is approximately 70 km along the strike and 20 km in the dip direction. The seismic moment release based upon this plane is 7.1e + 27 dyne.cm.

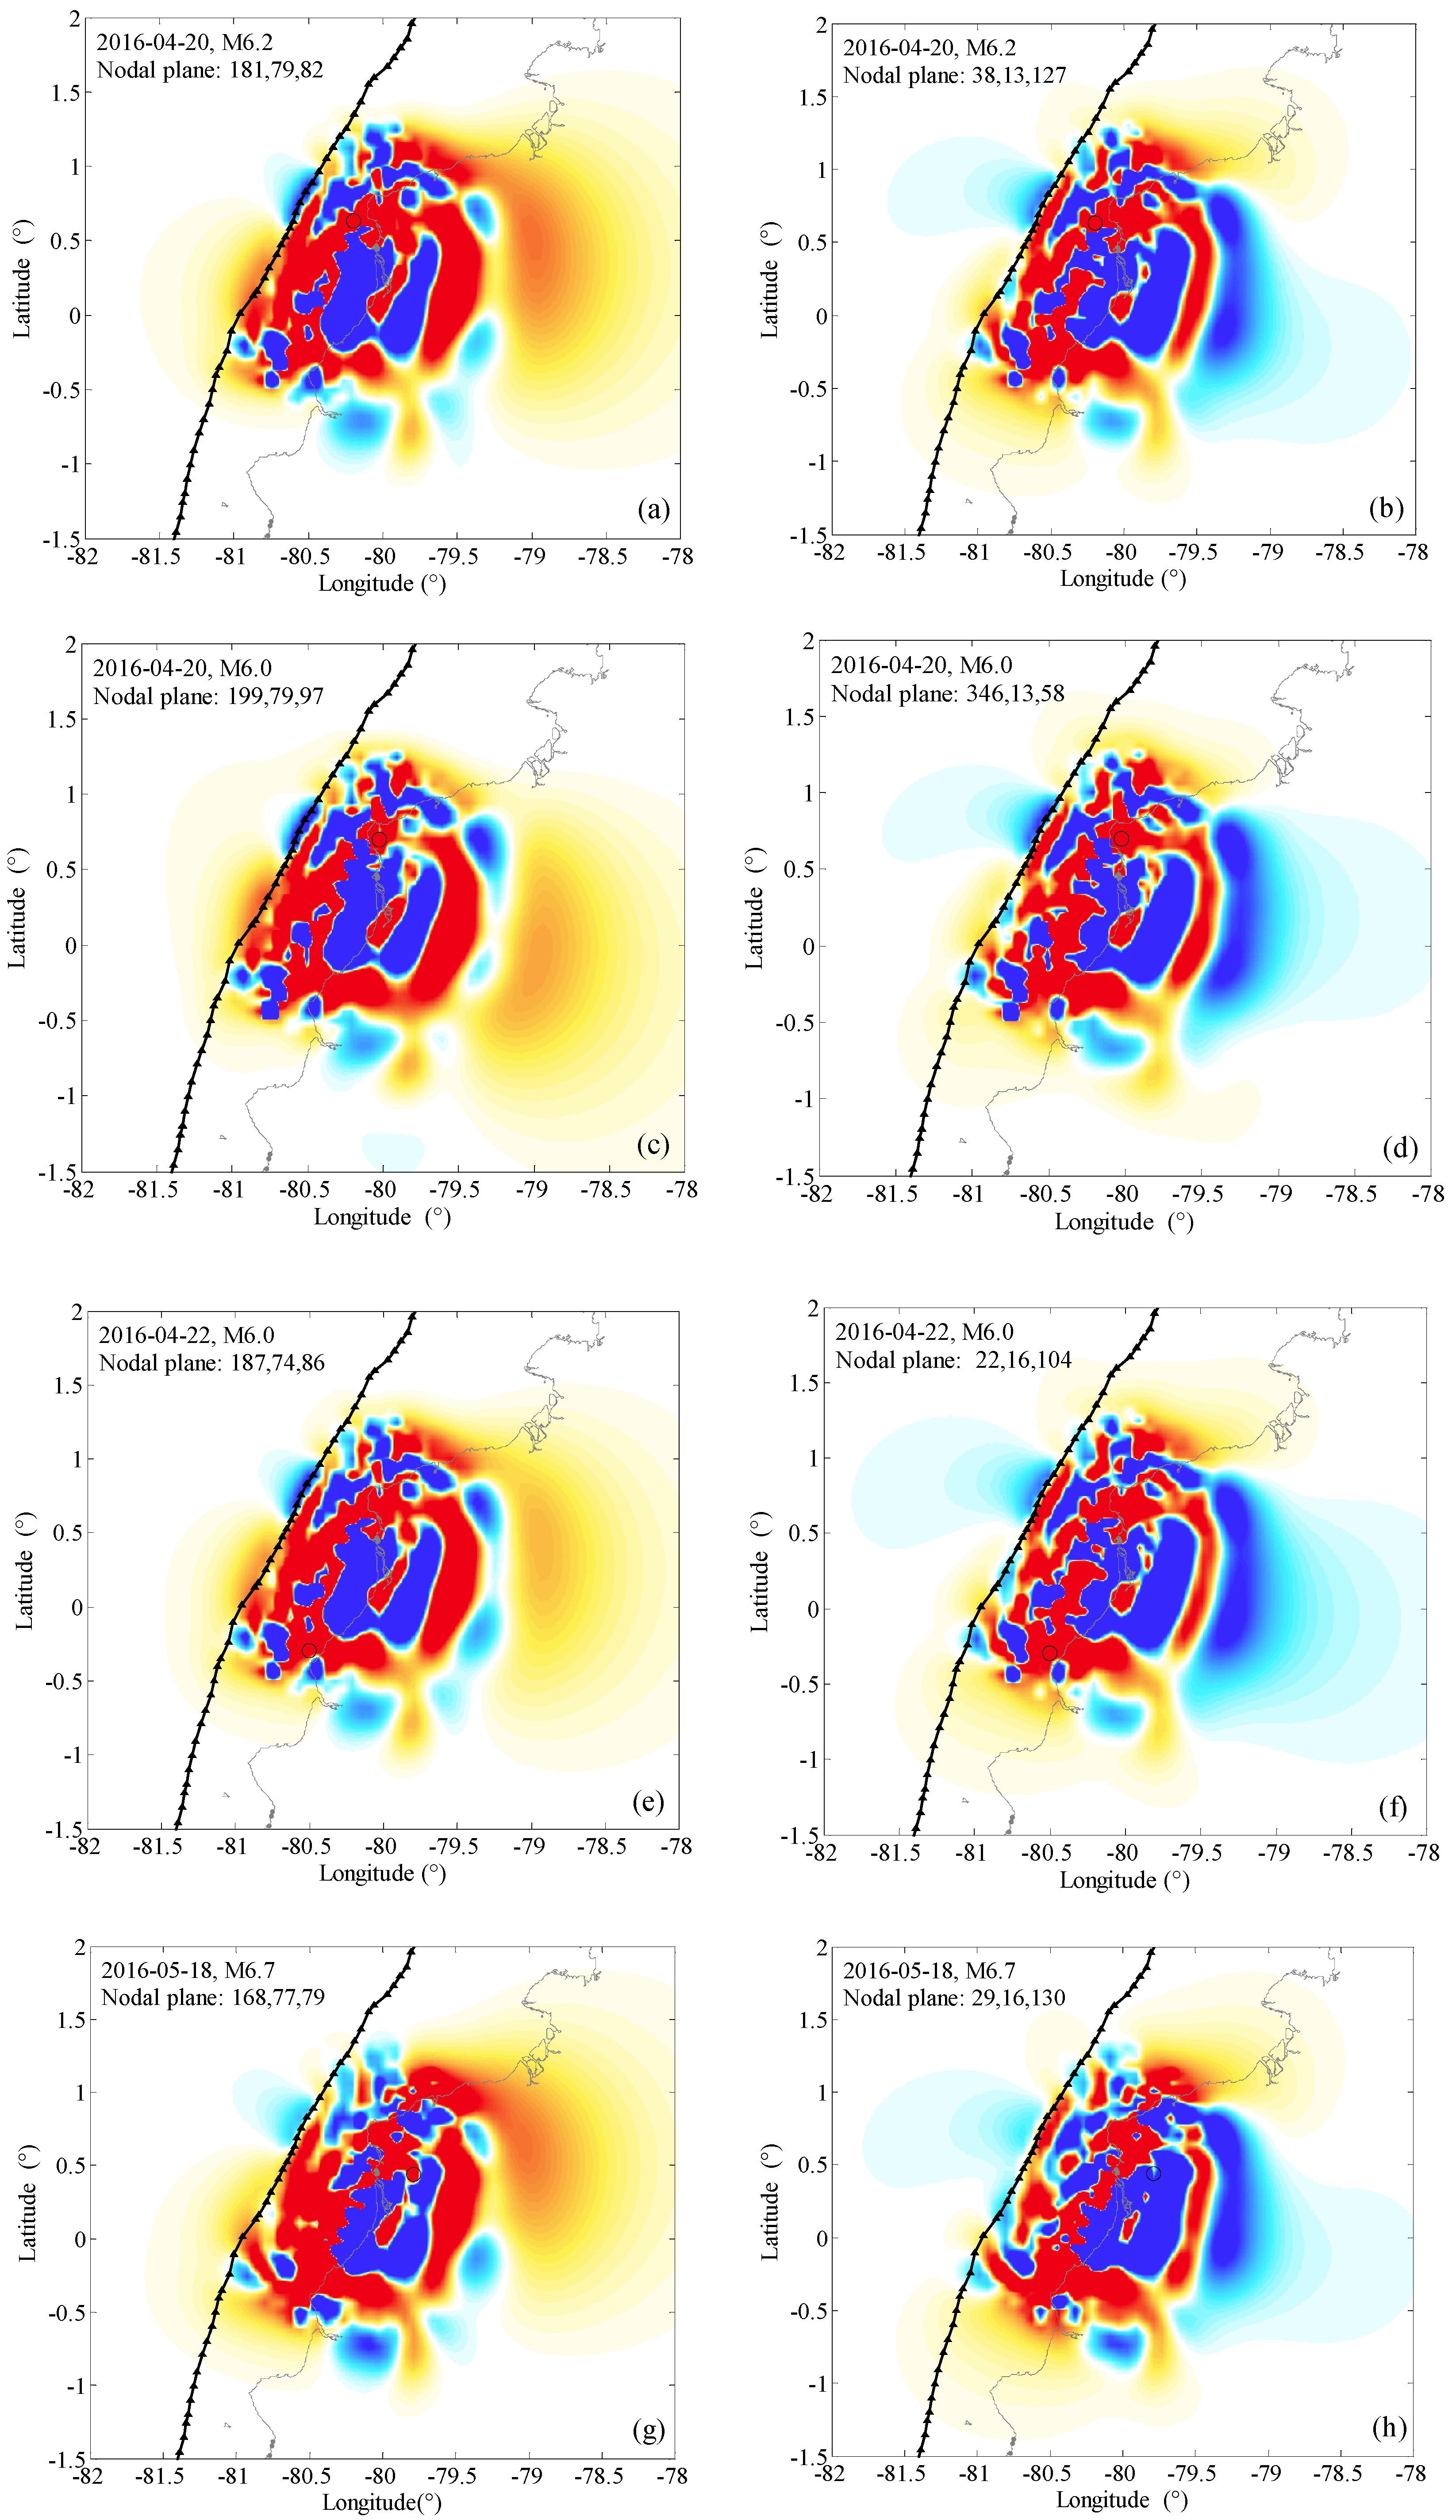
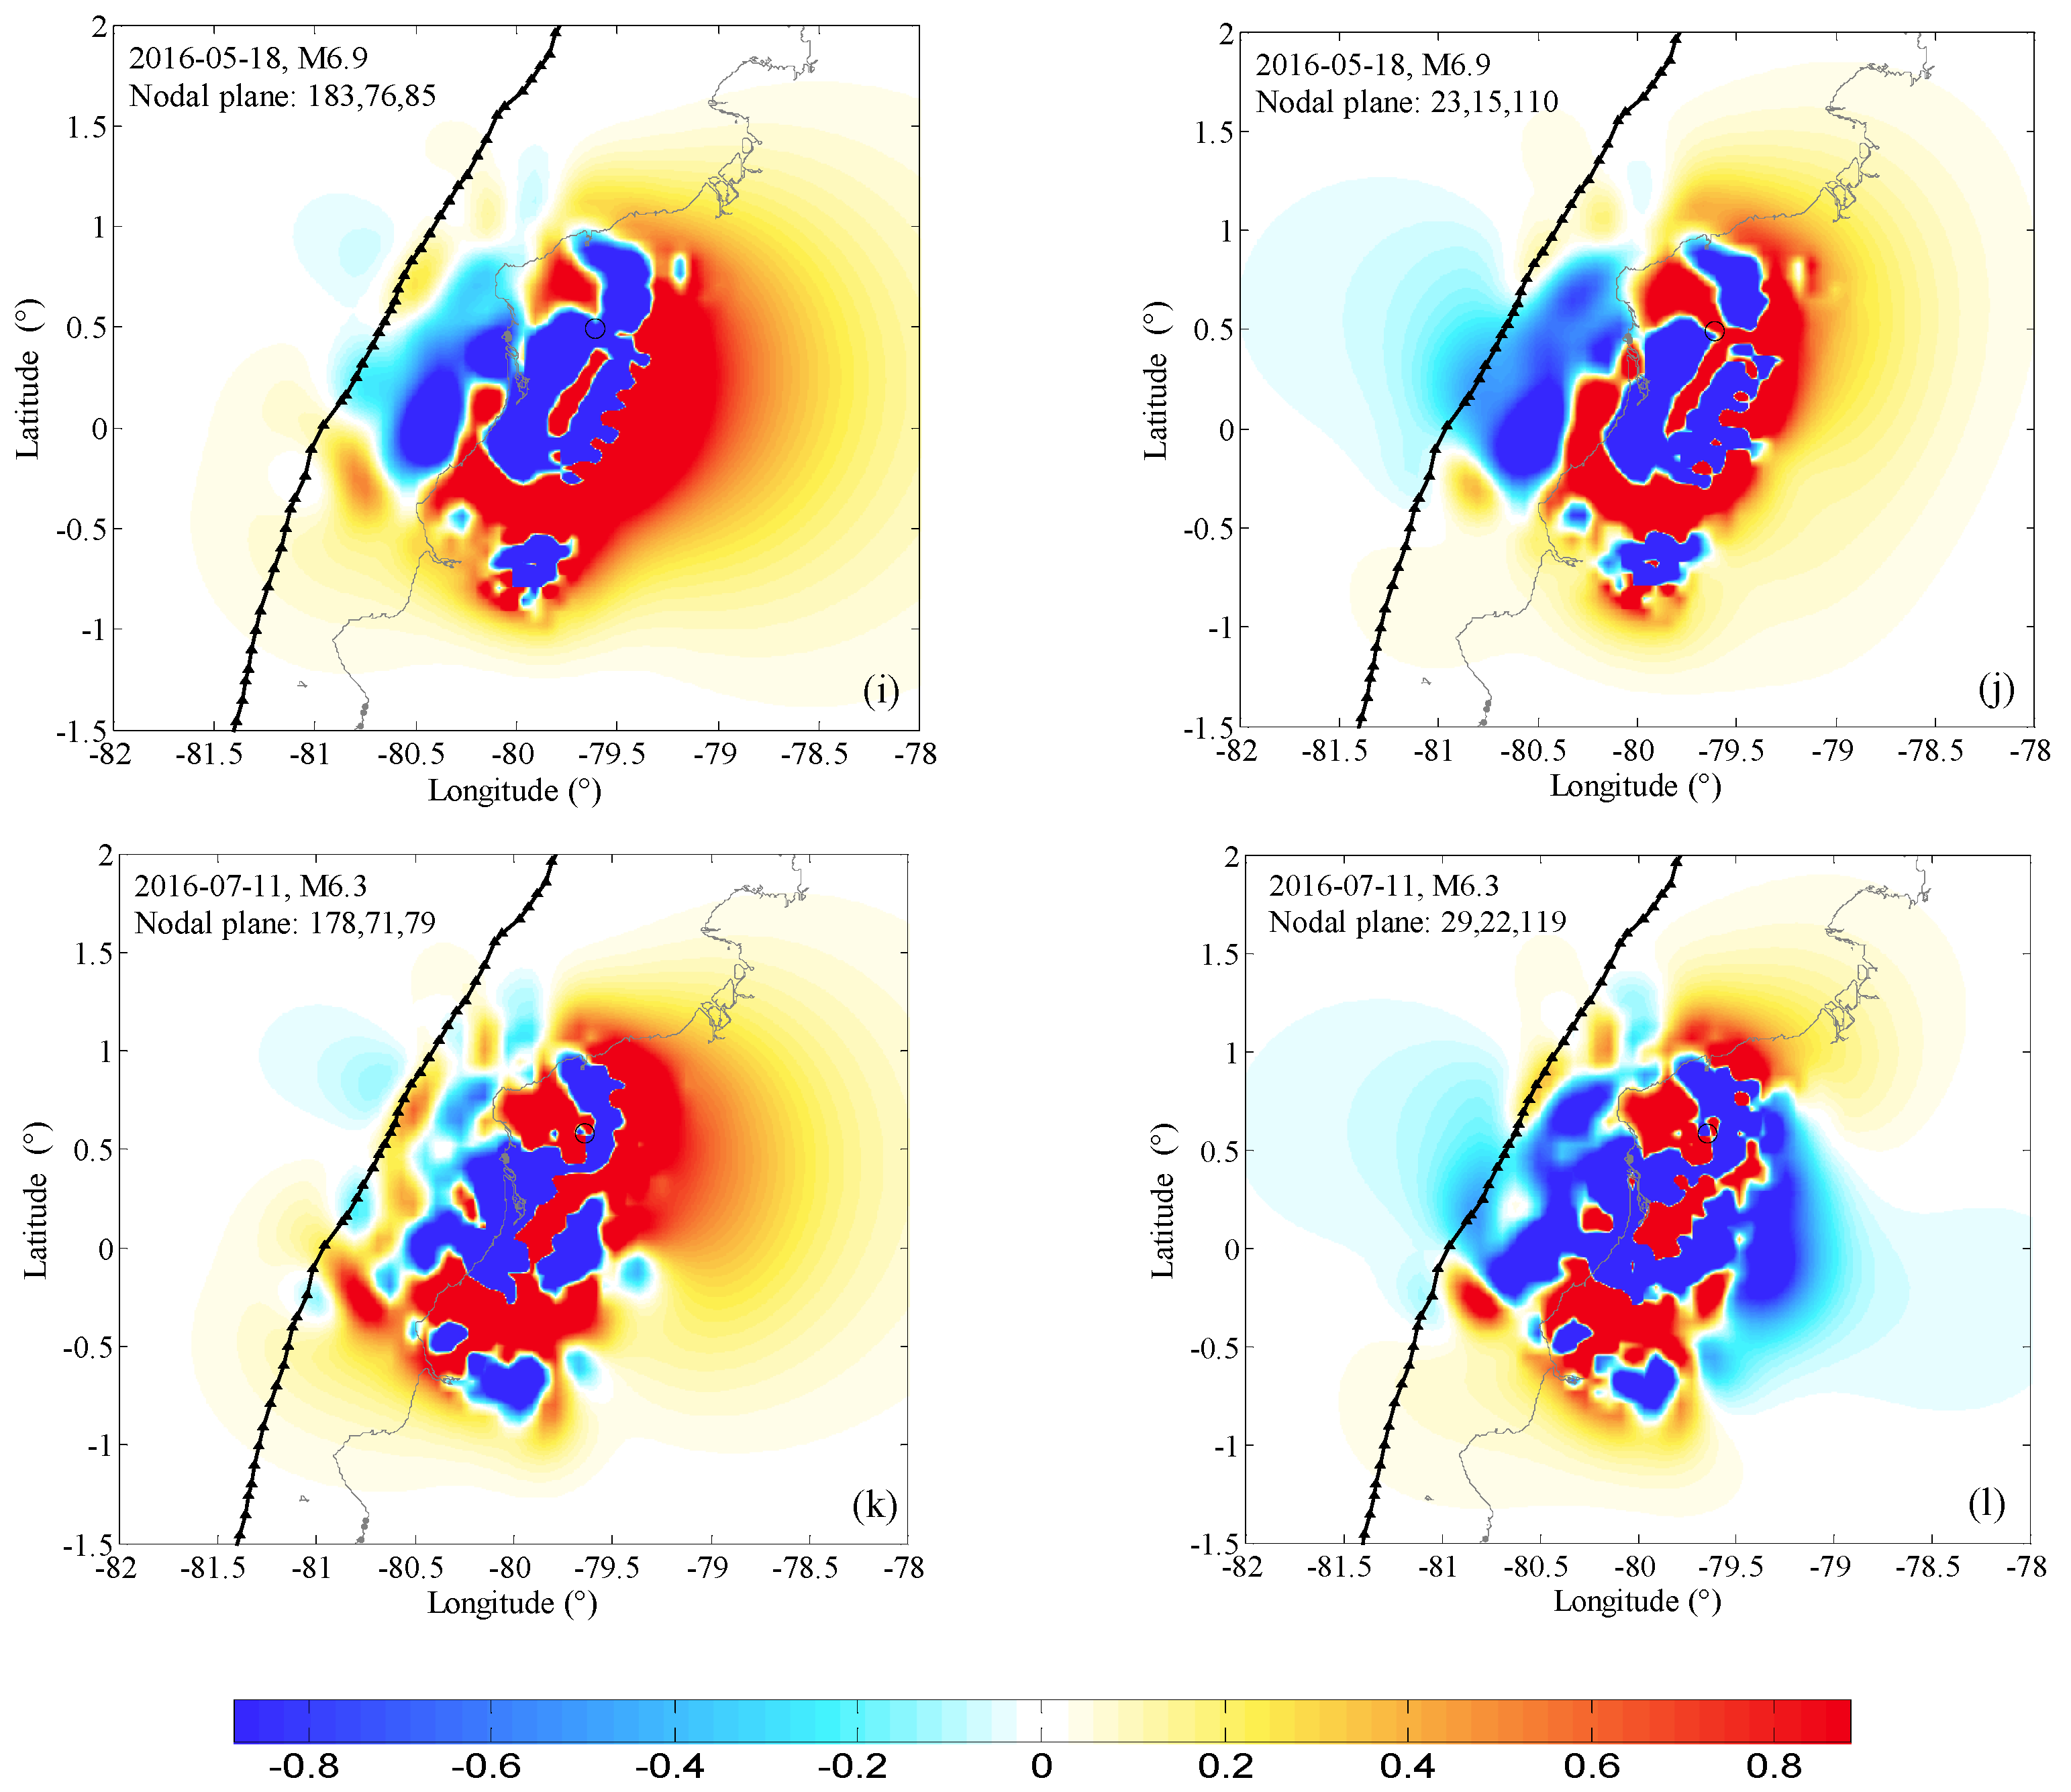
3. Coulomb Stress Changes Computed on Nodal Planes

We present here the high-quality focal mechanism solutions of six M ≥ 6 aftershocks from USGS (Table 1). All of the aftershocks are within the depth range of 0–50 km, bounded by 0.3°–0.9° N latitude and 79°–81° W longitude. Based on the finite fault model of the M 7.8 mainshock inverted by Gavin Hayes [35], we compute the coulomb stress changes on both nodal planes of each subsequent aftershock in their rake directions (Figure 3). We simulate the M 7.8 mainshock as dislocations in an elastic half-space and compute the resulting static stress changes. Our computational results are precise in the near field where the details of the slip distribution are critical. Correspondingly, the details of the slip distribution in the far field become less important than the total moment of the earthquake and the average orientation of the rupture plane [39]. Coulomb stress changes exhibit a lobed pattern of alternating positive and negative stress changes on the receiver fault planes or nodal planes. The computation of coulomb stress changes on both of the nodal planes are a direct test of the coulomb hypothesis.
Figure 3 illustrates the coulomb stress changes triggered by the M 7.8 mainshock on both nodal planes of the six M ≥ 6 aftershocks. As illustrated in Figure 3, the stress field figures for each aftershock are completely different because two different nodal planes are represented. Each figure shows the characteristic areas of coulomb stress increases and areas of coulomb stress decreases caused by the M 7.8 mainshock. The distributions of the six M ≥ 6 aftershocks are consistent with these stress change patterns. Rises in coulomb stress appear to be sufficient to trigger aftershock events, while coulomb stress reductions effectively inhibit them. Among the six M ≥ 6 aftershocks, five of the hypocenters plotted fall in regions of positive stress changes. Conversely, only one hypocenter falls within the stress shadow of the mainshock, as shown in Figure 3i. Overall, we observe that the vast majority of the aftershocks undergo positive coulomb stress change, which would promote or trigger rupture. These findings suggest that the M 7.8 mainshock may have triggered the six M ≥ 6 aftershocks.
It should be noted that the focal mechanism solutions display geometry similar to the six M ≥ 6 aftershocks. Small uncertainties could remarkably affect the computation results. Therefore, we explore the coulomb stress change on the focal mechanism solutions given by USGS. We assume that each M ≥ 6 aftershock has a focal mechanism solution consistent with the regional tectonic stress field.

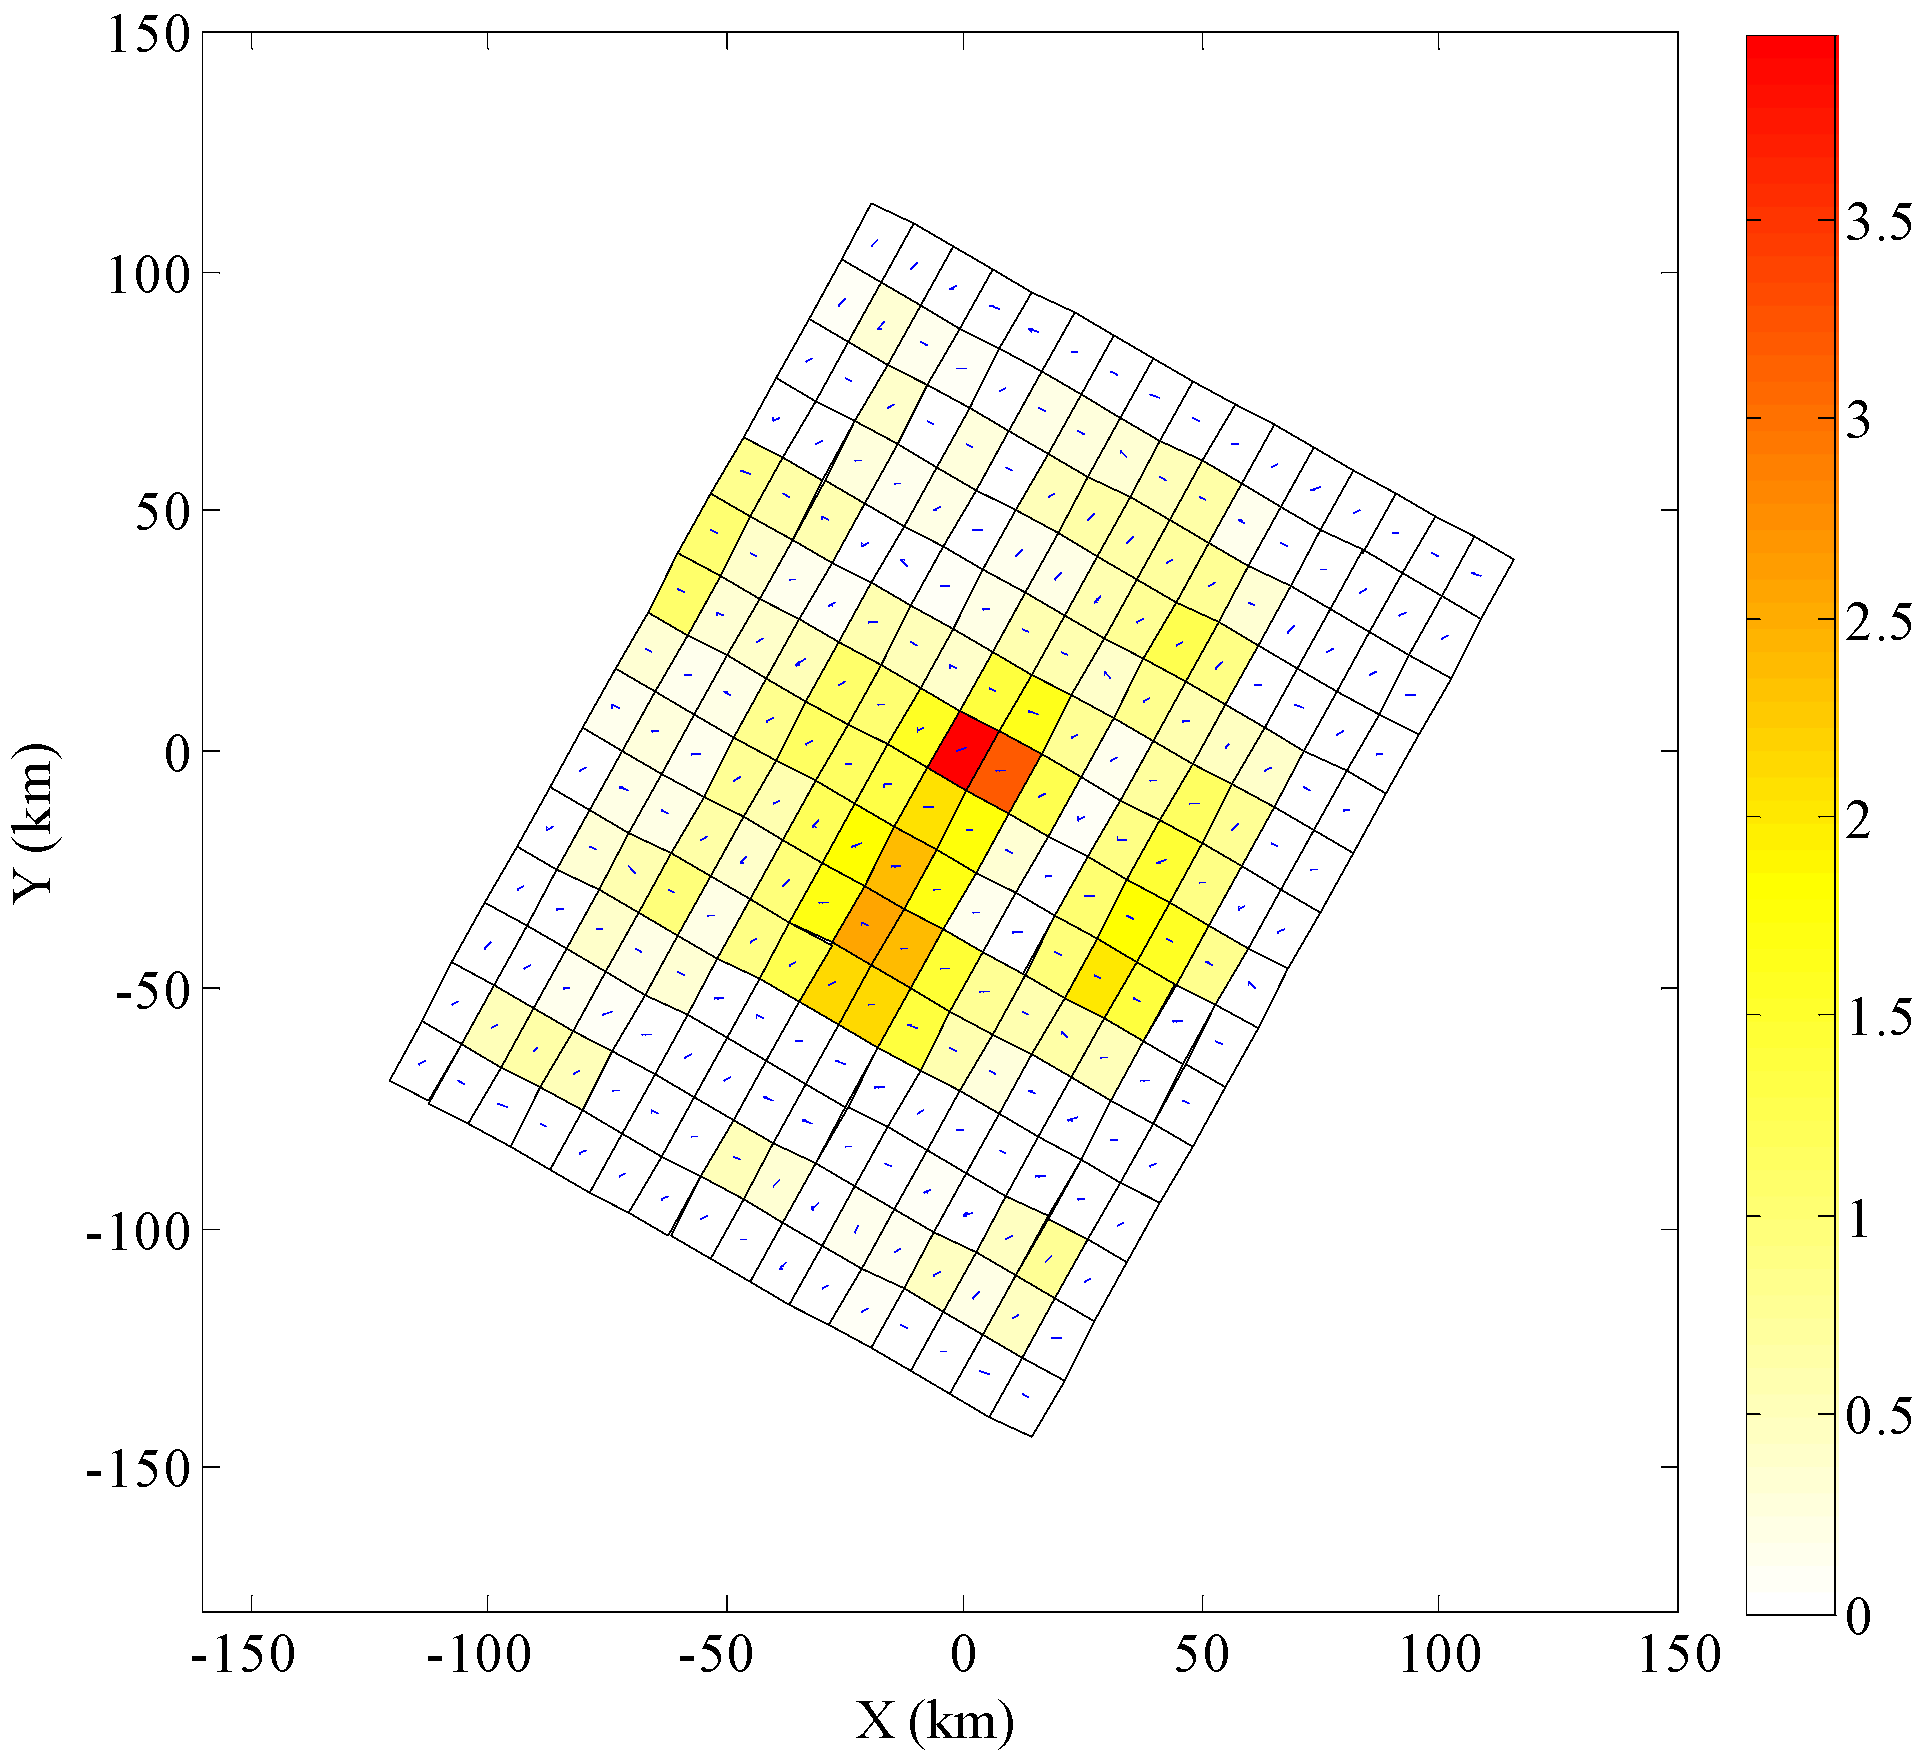
4. Coulomb Stress Changes Computed in the Focal Source

In this section, to further test whether the M 7.8 mainshock triggered subsequent aftershocks, we also examine the shear, normal, and coulomb stress changes in the focal source for each M ≥ 6 aftershock. The coulomb stress changes in the focal source more accurately test the stress triggering effect. Here, we present the USGS data to compute the coulomb stress change caused by the M 7.8 mainshock. As shown in Table 1, there is no obvious feature for the shear stress and normal stress calculation results. However, for the coulomb stress, the majority of the calculation results was positive, except for the result of the M 6.9 aftershock on the nodal plane: 183,76,85, which agrees well with the result in Section 3. For the other five M ≥ 6 aftershocks, the coulomb stress changes on both fault planes increased at varying degrees. We computed that the M 7.8 mainshock increased the coulomb stress in the focal source of five M ≥ 6 aftershocks by at least 0.1 bar. Although some of the coulomb stress changes are probably too small to cause subsequent aftershocks, these coulomb stress changes can promote failure if the fault is already near failure or an advance future earthquake occurrence if it is not. The results indicate that the majority of the M ≥ 6 aftershocks were triggered by the coulomb stress caused by the M 7.8 mainshock slip. Few M ≥ 6 aftershock occurred where the stress is computed to have dropped.

5. Discussion and Conclusions

Based on the seismic stress triggering theory and elastic dislocation theory, we compute the coulomb stress changes on two inferred rupture planes according to the focal mechanism solutions of each M ≥ 6 aftershock. The computation results show that the vast majority of the M ≥ 6 aftershocks occurred within areas of coulomb stress increases (>0.1 bar). Based on the focal mechanism solutions from USGS, we also computed the coulomb stress changes in the focal source of each aftershock. These possible coulomb stress changes are greater than the threshold of coulomb stress triggering (0.1 bar). As shown in Table 1, the majority of the coulomb stress calculation results is positive, except for the result for the M 6.9 aftershock on the nodal plane: 183,76,85. For the other five M ≥ 6 aftershocks, the coulomb stress changes on both fault planes increased at varying degrees. Among them, the maximum increase reached 7.564 bar and the minimum increase was 0.159 bar. Thus, the M ≥ 6 aftershock distribution is well explained by the seismic coulomb stress changes caused by the Ecuador M 7.8 mainshock.
In this study, the coulomb stress triggering among the Ecuador M 7.8 mainshock and subsequent M ≥ 6 aftershocks was investigated. It should be noted that there is much randomness and uncertainty as regards the time and location of an earthquake. Data and model uncertainties are still the biggest obstacle in determining quantitatively whether coulomb stress triggered the subsequent aftershocks. These uncertainties include the finite fault model, earthquake distribution, focal depth, and focal mechanism solutions. The nodal plane uncertainties add random noise to the stress change estimates and systematically reduce a potentially large coulomb index [11]. It is difficult to perfectly explain the complex geological phenomenon by only the coulomb stress triggering hypothesis. The original aim of this study is to provide a more reliable seismic hazard assessment in the Ecuador earthquake zone by considering the interaction of the earthquake sequences.
In this paper, it should be noted that we only adopted one finite fault model inverted from GSN broadband waveforms to compute the coulomb stress changes. However, the source model has much inherent uncertainty due to input data errors, model assumptions, and model estimation procedures [40]. Slip models using rectangle sub-faults artificially cause anomalous stress concentration along the edge of each sub-fault, which will affect the coulomb stress computation results. These uncertainties from the source model have yet to be fully studied. We attempted to approach source model uncertainties by considering multiple source models for the 2015 Nepal M 7.8 earthquake [41]. With the set of finite fault source models of the June 2000 M 5.9 Kleifarvatn earthquake, Woessner propagated correlated fault model uncertainties to determine uncertainties of coulomb failure stress change calculations [40]. In terms of the Ecuador M 7.8 earthquake, some limitations apply to our uncertainty and robustness analysis. The most important factor is the lack of reliable source models for this earthquake. Second, the fault model uncertainties should be regarded as a lower-bound estimate of the true uncertainties, as uncertainties in the modeling procedure are included via the global optimization procedure by Sudhaus [42].

Acknowledgments

The authors are grateful for the partial financial support received from the Science for Earthquake Resilience (XH15027). The authors would like to appreciate the support from China Scholarship Council and China Earthquake Administration. The authors wish to thank Gavin Hayes and Edwin Mayorga for the technical support.

Author Contributions

Jianchao Wu computed the coulomb stress changes and wrote the paper. Yongjian Cai drew some figures and revised the paper. Weijie Li collected the earthquake data and finite fault model. Qian Feng provided guidance for methods of data computation.

Conflicts of Interest

The authors declare no conflict of interest.

References

  1. M 7.8–27 km SSE of Muisne, Ecuador. Available online: https://earthquake.usgs.gov/earthquakes/eventpage/us20005j32#impact (accessed on 16 Apirl 2016).
  2. Tucker, B.; Erdik, M.; Hwang, C. Issues in Urban Earthquake Risk, NATO ASI Series, Series E. Appl. Sci. 1994, 271, 21–33. [Google Scholar]
  3. M 7.8–27 km SSE of Muisne, Ecuador Tectonic Summary. Available online: https://earthquake.usgs.gov/earthquakes/eventpage/us20005j32#executive (accessed on 16 Apirl 2016).
  4. Sumy, D.F.; Sumy, D.S.; Cochran, E.S.; Keranen, K.M.; Wei, M.; Abers, G.A. Observations of static Coulomb stress triggering of the November 2011 M 5.7 Oklahoma earthquake sequence. J. Geophys. Res. Solid Earth 2014, 119, 1904–1923. [Google Scholar] [CrossRef]
  5. Steacy, S.; Jiménez, A.; Holden, C. Stress triggering and the Canterbury earthquake sequence. Geophys. J. Int. 2013, 196, 473–480. [Google Scholar] [CrossRef]
  6. Yeo, K.B.; Choong, W.H.; Hau, W.Y. Prediction of Propeller Blade Stress Distribution Through FEA. Appl. Sci. 2014, 14, 3054. [Google Scholar]
  7. Reasenberg, P.A.; Simpson, R.W. Response of Regional Seismicity to the Static Stress Change Produced by the Loma Prieta Earthquake. Science 1992, 255, 1687. [Google Scholar] [CrossRef] [PubMed]
  8. King, G.C.; Stein, R.S.; Lin, J. Static stress changes and the triggering of earthquakes. Bull. Seismol. Soc. Am. 1994, 84, 935–953. [Google Scholar]
  9. Stein, R.S. The role of stress transfer in earthquake occurrence. Nature 1999, 402, 605–609. [Google Scholar] [CrossRef]
  10. Juan, J.S.-T.; Chen, Y.-C.; Guo, S. Fault-Tolerant Visual Secret Sharing Schemes without Pixel Expansion. Appl. Sci. 2016, 6, 18. [Google Scholar] [CrossRef]
  11. Meier, M.A.; Werner, M.J.; Woessner, J.; Wiemer, S. A search for evidence of secondary static stress triggering during the 1992 Mw 7.3 Landers, California, earthquake sequence. J. Geophys. Res. Solid Earth 2014, 119, 3354–3370. [Google Scholar] [CrossRef]
  12. Stein, R.S.; King, G.C.; Lin, J. Stress triggering of the 1994 M = 6.7 Northridge, California, earthquake by its predecessors. Science 1994, 265, 1432–1435. [Google Scholar] [CrossRef] [PubMed]
  13. Deng, J.; Sykes, L.R. Evolution of the stress field in southern California and triggering of moderate-size earthquakes: A 200-year perspective. J. Geophys. Res. Solid Earth 1997, 102, 9859–9886. [Google Scholar] [CrossRef]
  14. Papadimitriou, E.E. Mode of strong earthquake recurrence in the central Ionian Islands (Greece): Possible triggering due to Coulomb stress changes generated by the occurrence of previous strong shocks. Bull. Seismol. Soc. Am. 2002, 92, 3293–3308. [Google Scholar] [CrossRef]
  15. Nostro, C.; Chiaraluce, L.; Cocco, M.; Baumont, D.; Scotti, O. Coulomb stress changes caused by repeated normal faulting earthquakes during the 1997 Umbria-Marche (central Italy) seismic sequence. J. Geophys. Res. Solid Earth 2005, 110. [Google Scholar] [CrossRef]
  16. Stein, R.S.; Barka, A.A.; Dieterich, J.H. Progressive failure on the North Anatolian fault since 1939 by earthquake stress triggering. Geophys. J. Int. 1997, 128, 594–604. [Google Scholar] [CrossRef]
  17. Wu, J.; Lei, D.; Cai, Y.; Li, H. Stress Triggering of the 2012 Sumatra Mw 8.2 Earthquake by the 2012 Sumatra Mw 8.6 Earthquake. Electron. J. Geotech. Eng. 2015, 20, 7. [Google Scholar]
  18. Pollitz, F.F.; Banerjee, P.; Burgmann, R.; Hashimoto, M.; Choosakul, N. Stress changes along the Sunda trench following the 26 December 2004 Sumatra—Andaman and 28 March 2005 Nias earthquakes. Geophys. Res. Lett. 2006, 33. [Google Scholar] [CrossRef]
  19. Wiseman, K.; Bürgmann, R. Stress and seismicity changes on the Sunda megathrust preceding the 2007 Mw 8.4 earthquake. Bull. Seismol. Soc. Am. 2011, 101, 313–326. [Google Scholar] [CrossRef]
  20. Toda, S.; Stein, R.S.; Reasenberg, P.A.; Dieterich, J.H.; Yoshida, A. Stress transferred by the 1995 Mw = 6.9 Kobe, Japan, shock: Effect on aftershocks and future earthquake probabilities. J. Geophys. Res. Solid Earth 1998, 103, 24543–24565. [Google Scholar] [CrossRef]
  21. Jianchao, W.; Yueqiang, Q.; Dongning, L. Coulomb Stress Triggering of the Japan Kyushu M 7.0 Earthquake on 15 April 2016. Electron. J. Geotech. Eng. 2016, 21, 5429–5439. [Google Scholar]
  22. Toda, S.; Stein, R.S.; Lin, J. Widespread seismicity excitation throughout central Japan following the 2011 M = 9.0 Tohoku earthquake and its interpretation by Coulomb stress transfer. Geophys. Res. Lett. 2011, 38. [Google Scholar] [CrossRef]
  23. Enescu, B.; Aoi, S.; Toda, S.; Suzuki, W.; Obara, K.; Shiomi, K.; Takeda, T. Stress perturbations and seismic response associated with the 2011 M 9.0 Tohoku-oki earthquake in and around the Tokai seismic gap, central Japan. Geophys. Res. Lett. 2012, 39. [Google Scholar] [CrossRef]
  24. Ishibe, T.; Shimazaki, K.; Satake, K.; Tsuruoka, H. Change in seismicity beneath the Tokyo metropolitan area due to the 2011 off the Pacific coast of Tohoku Earthquake. Earth Planets Space 2011, 63, 731–735. [Google Scholar] [CrossRef]
  25. Takeo, I.; Kenji, S.; Shin’ichi, S.; Kunihiko, S.; Hiroshi, T.; Yusuke, Y.; Shigeki, N.; Naoshi, H. Correlation between Coulomb stress imparted by the 2011 Tohoku-Oki earthquake and seismicity rate change in Kanto, Japan. Geophys. J. Int. 2015, 201, 112–134. [Google Scholar]
  26. Mayorga, E.F.; Sánchez, J.J. Modelling of Coulomb stress changes during the great (Mw = 8.8) 1906 Colombia-Ecuador earthquake. J. S. Am. Earth Sci. 2016, 70, 268–278. [Google Scholar] [CrossRef]
  27. Ryder, I.; Rietbrock, A.; Kelson, K.; Bürgmann, R.; Floyd, M.; Socquet, A.; Vigny, C.; Carrizo, D. Large extensional aftershocks in the continental forearc triggered by the 2010 Maule earthquake, Chile. Geophys. J. Int. 2012, 188, 879–890. [Google Scholar] [CrossRef]
  28. Lin, J.; Stein, R.S. Stress triggering in thrust and subduction earthquakes and stress interaction between the southern San Andreas and nearby thrust and strike-slip faults. J. Geophys. Res. Solid Earth 2004, 109. [Google Scholar] [CrossRef]
  29. Toda, S.; Stein, R.S.; Richards-Dinger, K.; Bozkurt, S.B. Forecasting the evolution of seismicity in southern California: Animations built on earthquake stress transfer. J. Geophys. Res. Solid Earth 2005, 110. [Google Scholar] [CrossRef]
  30. Okada, Y. Internal deformation due to shear and tensile faults in a half-space. Bull. Seismol. Soc. Am. 1992, 82, 1018–1040. [Google Scholar]
  31. Harris, R.A. Introduction to special section: Stress triggers, stress shadows, and implications for seismic hazard. J. Geophys. Res. Solid Earth 1998, 103, 24347–24358. [Google Scholar] [CrossRef]
  32. Stein, R.S.; Lisowski, M. The 1979 Homestead Valley earthquake sequence, California: Control of aftershocks and postseismic deformation. J. Geophys. Res. Solid Earth 1983, 88, 6477–6490. [Google Scholar] [CrossRef]
  33. Oppenheimer, D.H.; Reasenberg, P.A.; Simpson, R.W. Fault plane solutions for the 1984 Morgan Hill, California, earthquake sequence: Evidence for the state of stress on the Calaveras fault. J. Geophys. Res. Solid Earth 1988, 93, 9007–9026. [Google Scholar] [CrossRef]
  34. Shawn, L.; Robert, R.; Helen, N.; William, S. Global Positioning System measurements of deformations associated with the 1987 Superstition Hills earthquake: Evidence for conjugate faulting. J. Geophys. Res. Solid Earth 1992, 97, 4885–4902. [Google Scholar]
  35. Preliminary Finite Fault Results for the 16 April 2016 Mw 7.8 28 km SSE of Muisne, Ecuador Earthquake (Version 1). Available online: https://earthquake.usgs.gov/earthquakes/eventpage/us20005j32#finite-fault (accessed on 16 Apirl 2016).
  36. Shao, G.; Li, X.; Ji, C.; Maeda, T. Focal mechanism and slip history of the 2011 Mw 9.1 off the Pacific coast of Tohoku Earthquake, constrained with teleseismic body and surface waves. Earth Planets Space 2011, 63, 559–564. [Google Scholar] [CrossRef]
  37. Ji, C.; Helmberger, D.V.; Wald, D.J.; Ma, K.-F. Slip history and dynamic implications of the 1999 Chi-Chi, Taiwan, earthquake. J. Geophy. Res. Solid Earth 2003, 108. [Google Scholar] [CrossRef]
  38. Ji, C.; Wald, D.J.; Helmberger, D.V. Source description of the 1999 Hector Mine, California, earthquake, part I: Wavelet domain inversion theory and resolution analysis. Bull. Seismol. Soc. Am. 2002, 92, 1192–1207. [Google Scholar] [CrossRef]
  39. Ma, K.-F.; Chan, C.-H.; Stein, R.S. Response of seismicity to Coulomb stress triggers and shadows of the 1999 Mw = 7.6 Chi-Chi, Taiwan, earthquake. Bull. Seismol. Soc. Am. 2005, 110. [Google Scholar] [CrossRef]
  40. Woessner, J.; Jónsson, S.; Sudhaus, H.; Baumann, C. Reliability of Coulomb stress changes inferred from correlated uncertainties of finite-fault source models. Bull. Seismol. Soc. Am. 2012, 117. [Google Scholar] [CrossRef]
  41. Wu, J.; Hu, Q.; Li, W.; Lei, D. Study on Coulomb Stress Triggering of the April 2015 M 7.8 Nepal Earthquake Sequence. Int. J. Geophys. 2016, 2016. [Google Scholar] [CrossRef]
  42. Sudhaus, H.; Sigurjón, J. Improved source modelling through combined use of InSAR and GPS under consideration of correlated data errors: Application to the June 2000 Kleifarvatn earthquake, Iceland. Geophys. J. Int. 2009, 176, 389–404. [Google Scholar] [CrossRef]
Figure 1. The epicentral region of the 2016 Ecuador M 7.8 earthquake. The earthquake occurred as a result of shallow thrust faulting on the plate boundary subduction zone between the Nazca and South America plates, where the Nazca plate subducts eastward beneath the South America plate with a rate of 61 mm/year (modified from US Geological Survey (USGS) [3]).
Applsci 07 00088 g001
Figure 2. The finite fault model of the M 7.8 coastal Ecuador earthquake (unit: m). It is subdivided in 15 patches along the strike and 16 patches along the slip. Each patch is 13 × 9 km2. The blue line within each patch represents the slip direction. The bar on the right indicates the slip amount of each patch.
Applsci 07 00088 g002
Figure 3. Illustration of coulomb stress changes on both nodal planes of six M ≥ 6 aftershocks triggered by the 2016 Ecuador M 7.8 earthquake based on Gavin Hayes’s finite fault model (unit: bar). (a) 2016-04-20, M 6.2, Nodal plane: 181,79,82, Depth: 11.5 km; (b) 2016-04-20, M 6.2, Nodal plane: 38,13,127, Depth: 11.5 km; (c) 2016-04-20, M 6.0, Nodal plane: 199,79,97, Depth: 11.0 km; (d) 2016-04-20, M 6.0, Nodal plane: 346,13,58, Depth: 11.0 km; (e) 2016-04-22, M 6.0, Nodal plane: 187,74,86, Depth: 11.5 km; (f) 2016-04-22, M 6.0, Nodal plane: 22,16,104, Depth: 11.5 km; (g) 2016-05-18, M 6.7, Nodal plane: 168,77,79, Depth: 16.0 km; (h) 2016-05-18, M 6.7, Nodal plane: 29,16,130, Depth: 16.0 km; (i) 2016-05-18, M 6.9, Nodal plane: 183,76,85, Depth: 35.5 km; (j) 2016-05-18, M 6.9, Nodal plane: 23,15,110, Depth: 35.5 km; (k) 2016-07-11, M 6.3, Nodal plane: 178,71,79, Depth: 25.5 km; (l) 2016-07-11, M 6.3, Nodal plane: 29,22,119, Depth: 25.5 km.
Applsci 07 00088 g003aApplsci 07 00088 g003b
Table 1. The basic parameters of the M ≥ 6 aftershocks and stress change calculation results.
DateAftershockLatitude LongitudeDepth (km)Strike Dip Rake (°)Stress Change (Bar)
ShearNormalCoulomb
20 AprilM 6.20.639
80.210
11.5181,79,826.4582.7667.564
38,13,1276.477−0.2606.373
20 AprilM 6.00.708
80.035
11.0199,79,973.006−2.1042.164
346,13,583.0150.1193.062
22 AprilM 6.00.292
80.504
11.5187,74,862.0223.6883.497
22,16,1042.041−0.4851.847
18 MayM 6.70.426
79.790
16.0168,77,79−2.24913.8713.299
29,16,130−2.1755.8370.159
18 MayM 6.90.495
79.616
35.5183,76,85−1.711−1.149−2.170
23,15,110−1.7396.2510.762
11 JulyM 6.30.581
79.638
25.5178,71,79−1.4651.0301.053
29,22,119−1.449−1.1231.898

