Article

Application of Near-Infrared Hyperspectral Imaging to Detect Sulfur Dioxide Residual in the Fritillaria thunbergii Bulbus Treated by Sulfur Fumigation

1
Zhejiang Academy of Traditional Chinese Medicine, Key Laboratory of Research and Development of Chinese Medicine of Zhejiang Province, Hangzhou 310007, China
2
College of Biosystems Engineering and Food Science, Zhejiang University, Hangzhou 310058, China
*
Authors to whom correspondence should be addressed.
Appl. Sci. 2017, 7(1), 77; https://doi.org/10.3390/app7010077
Submission received: 8 November 2016 / Revised: 22 December 2016 / Accepted: 6 January 2017 / Published: 12 January 2017
(This article belongs to the Special Issue Applications of Hyperspectral Imaging for Food and Agriculture)

Abstract

:
Sulfur-fumigated Chinese medicine is a common issue in the process of Chinese medicines. Detection of sulfur dioxide (SO2) residual content in Fritillaria thunbergii Bulbus is important to evaluate the degree of sulfur fumigation and its harms. It helps to control the use of sulfur fumigation in Fritillaria thunbergii Bulbus. Near-infrared hyperspectral imaging (NIR-HSI) was explored as a rapid, non-destructive, and accurate technique to detect SO2 residual contents in Fritillaria thunbergii Bulbus. An HSI system covering the spectral range of 874–1734 nm was used. Partial least squares regression (PLSR) was applied to build calibration models for SO2 residual content detection. Successive projections algorithm (SPA), weighted regression coefficients (Bw), random frog (RF), and competitive adaptive reweighted sampling (CARS) were used to select optimal wavelengths. PLSR models using the full spectrum and the selected optimal wavelengths obtained good performance. The Bw-PLSR model was applied on a hyperspectral image to form a prediction map, and the results were satisfactory. The overall results in this study indicated that HSI could be used as a promising technique for on-line visualization and monitoring of SO2 residual content in Fritillaria thunbergii Bulbus. Detection and visualization of Chinese medicine quality by HSI provided a new rapid and visual method for Chinese medicine monitoring, showing great potential for real-world application.

1. Introduction

Fritillaria thunbergii Miq. is a kind of liliaceous plant available in China. Fritillaria thunbergii Miq. is well known as an ornamental plant, and more importantly, a medicinal plant. Fritillaria thunbergii Bulbus has been used as an important Chinese medicinal plant for over 2000 years. Fritillaria thunbergii Bulbus shows special curative effect on clearing heat, resolving phlegm, relieving cough, detoxification, and disperse abscesses and nodules by a sulfur-fumigated process using chromatographic fingerprinting analysis [1]. Processing and trading of Fritillaria thunbergii Bulbus as a medicine is popular, which has great economic value.
Fritillaria thunbergii Bulbus are dried to be stored, transported, and traded. Traditional methods to dry Fritillaria thunbergii Bulbus are natural drying methods, drying instruments, and sulfur fumigation. Sulfur fumigation (SF) is a traditional preservation method in Chinese traditional medicine [2]. Sulfur fumigation could be efficiently used to prolong the shelf life of Chinese traditional medicine. However, increasing concerns of SF in Chinese medicine have been discussed due to its uncertain safety. Studies have been reported that SF could damage the bioactive compounds, change chemical profiles, and generate detrimental exogenous materials of Chinese medicine [3,4,5]. The Chinese government has set strict rules to end the use of SF in Chinese traditional medicine [6]. Unfortunately, the benefits of SF, such as easy operation and high cost-effectiveness, drives the producers to use SF in Chinese traditional medicine for seeking higher profits. Sulfur dioxide (SO2) residuals could be detected in the SF-treated Chinese medicines, which is generally the index to detect SF-treated Chinese medicine.
The traditional methods to detect the SF-treated Chinese medicine are human eyes or experience-based detection and laborious methods [6]. The accuracy of human eyes or experience-based detection could not be guaranteed, due to the subjectiveness of the detection results. The laborious methods are accurate and used as standard methods. However, these methods are time-consuming, reagent consuming, expensive, and require complex sample preparation and operation. Thus, rapid and accurate detection techniques are needed.
Near-infrared spectroscopy has been used as a non-destructive, rapid, and accurate technique to detect SF-treated Chinese traditional medicines [7]. However, near-infrared spectra are acquired from quite a small area of the sample. Hyperspectral imaging (HSI), integrating both spectroscopy technique and imaging technique, provides spectral and spatial information simultaneously. In the acquired hyperspectral images, there is a spectrum of each pixel, and there is a grey-scale image at each wavelength. Hyperspectral images provides comprehensively external and internal information related to quality parameters, and the advantage of hyperspectral images makes it feasible to predict the quality parameters of each pixel to form a prediction map. The prediction map provides the direct visual information distribution of the quality parameters. The use of HSI has been studied to identify sulfur-fumigated Chinese medicines [8], but the studies of SO2 residual content detection by HSI are rarely reported.
The main objective of this study was to detect and visualize SO2 residuals in SF-treated Fritillaria thunbergii Bulbus using NIR-HSI combined with chemometric methods.

2. Materials and Methods

2.1. Sample Preparation

The fresh Fritillaria thunbergii Bulbus were collected from Pan’an, Zhejiang Province, China. The Fritillaria thunbergii Bulbus were appraised by the director of the pharmacist of Zhejiang Academy of Traditional Chinese Medicine before further analysis. The bulbs of Fritillaria thunbergii Miq. were cleaned and placed in fumigation boxes, and 40 samples were used for each treatment. The samples of each treatment were fumigated by 0 g, 10 g, 30 g, and 50 g of sulfur per 500 g sample. The fumigation procedure lasted for 24 h, then the samples were dried to 15% water content in an oven at 60 °C. The fumigated samples were then placed into sealed plastic bags and taken to the laboratories for image acquisition. In total, 160 samples were collected.

2.2. Hyperspectral Image Acquisition

The samples fumigated by different amounts of sulfur were used for hyperspectral image acquisition. The hyperspectral image acquisition was conducted on an assembled HSI system. The system acquires hyperspectral images in the spectral range of 874–1734 nm with spectral resolution of 5 nm for 256 wavebands. An imaging spectrograph (ImSpector N17E; Spectral Imaging Ltd., Oulu, Finland) coupled with a 320 × 256 camera (Xeva 992; Xenics Infrared Solutions, Leuven, Belgium) was used for hyperspectral images. The light illumination was provided by two symmetrically-placed 150 W tungsten halogen lamps (Fiber-Lite DC950 Illuminator; Dolan Jenner Industries Inc., Boxborough, MA, USA). The HSI system conducted linear scanning with the movement of the samples driven by a linear lead-screw drive stepper motor (Isuzu Optics Corp., Zhubei, Taiwan). For image acquisition, the height between the sample and the lens, the moving speed of the sample, and the exposure time of the camera were adjusted before the image acquisition to 320 nm, 22.8 mm/s and 4 ms to acquire clear and non-deformable images.
The acquired hyperspectral images by the system were raw images, and should be corrected to reflectance images by the following equation:
I R = I r a w I d a r k I w h i t e I d a r k ,
where IR was the corrected reflectance image, Iwhite was the white reference image with nearly 100% reflectance. Idark was the dark reference image with nearly 0% reflectance.
To extract spectral data, the entire sample region of each sample was defined as the region of interest (ROI), and the average spectrum of each ROI was extracted as the sample spectrum. It was impossible to measure SO2 residuals of each pixel, and the average value of SO2 residuals and the corresponding spectrum of each sample were used for calibration.

2.3. Measurement of SO2 Residuals

The SO2 residuals in Fritillaria thunbergii Bulbus were measured by the acid-base titration method introduced by China Pharmacopoeia [6]. Firstly, the samples were ground into powders, and 10 g of powder of each sample was collected. The powders were added into a two-neck round bottom flask, then 300–400 mL water was added into the flask. The switch of the reflux condensing tube was open to supply water, and the reflux condensing tube was connected to a 100 mL Erlenmeyer flask by a rubber catheter. Fifty milliliters of 3% hydrogen dioxide solution as absorbent was added to the Erlenmeyer flask, and the rubber catheter port in the Erlenmeyer flask was buried into the solution. Before measurement, three drops of 2.5 mg/mL methyl red-ethanol solution indicator were added into the absorbent and the titration, by adding 0.01 mol/L NaOH into the absorbent, finished when the color of the absorbent changed from red to yellow. Secondly, the flow of nitrogen is provided at the speed of 0.2 L/min, and the piston of a separatory funnel was opened to let the HCl solution (6 mol/L) pass into the two-neck round bottom flask. The solution in the two neck round bottom flask was then heated to boiling, and the solution maintained at micro-boiling. After 1.5 h later, the heating procedure was stopped, and then absorbent was cooled. The cool absorbent was then stirred by a magnetic stirrer and the titration, by adding 0.01 mol/L NaOH into the absorbent, was conducted until the yellow color of the solution could remain for more than 20 s. Eventually, the SO2 residuals could be calculated.

2.4. Multivariate Analysis

2.4.1. Spectral Preprocessing and Outlier Detection

The hyperspectral images contained random noises caused by the environment, the system, and the sample status. The spectra were extracted from the pixels within each sample. Thus, the pixel-wise spectra were preprocessed by wavelet transform (WT) with Daubechies 8 wavelet function, decomposition level 3, and seven-point moving average smoothing (MAS).

2.4.2. Calibration Model

Partial least square regression (PLSR) is a widely-used chemometric method in spectral data analysis [9,10]. PLSR is proved to be stable, accurate and highly predictive models. The advantage of PLSR is that it could handle the large spectral data efficiently, and provide a detailed explanation of the relationship between the spectral data and the quality features. PLSR linearly projects both X and Y into new spaces, and explore the linear regression model between X and Y. The original X is transformed into new variables, called latent variables (LV). The linear equation of the PLSR model can be simply expressed as:
Y= BX+ b0
where B is the regression coefficients matrix, X is the spectral data matrix, and b0 is the intercept. The simple equation makes PLSR quite easy and fast to interpret and calculate. PLSR is also used to conduct rapid calculations of each pixel within the hyperspectral images.
Before modelling using the spectral data and SO2 residual content, outliers were detected based on the prediction residuals of SO2 residual content by the PLSR model using all samples.

2.4.3. Optimal Wavelength Selection Methods

HSI generated a large amount of data. How to deal with this data is an important issue. The spectral data extracted from the hyperspectral images suffer from the risk of colinearity, redundant and uninformative wavelengths, resulting in complex and unstable models. Optimal wavelength selection aims at selecting a few wavelengths containing the most useful information from the full spectrum for analysis instead of the full spectrum. The selection of optimal wavelengths could improve the model performance and simplify the model. Selection of optimal wavelengths could significantly reduce both the spectral and image data. In HSI, optimal wavelength selection could also make the image visualization easy. Four different variable selection methods were used in this study, including the successive projections algorithm (SPA) [11], weighted regression coefficient (Bw) [12], random frog (RF) [13], and competitive adaptive reweighted sampling (CARS) [14].
SPA is a forward variable selection method. SPA projects one variable on the remaining variables, and the variables with maximum projection are selected as candidate subset, when the selected candidate variables reach the predefined number of variables. Then multiple linear regression (MLR) models were built on different numbers of variables, and the variables corresponding to the minimum root mean square error of cross-validation (RMSECV) of the MLR model are selected as the final optimal wavelengths.
Weighted regression coefficient (Bw) is a variable selection method derived from PLSR. To acquire Bw, the spectral data could be standardized to the same scale, and a new PLSR model is built on the standardized spectrum. Then, Bw is acquired from the new PLSR model. The Bw values indicate the relative importance of wavelengths. The peaks and valleys of the wavelength–Bw plot could then be manually selected as the optimal wavelengths.
Random frog is an efficient variable selection method [13]. Random frog simply uses the random frog algorithm to generate subsets, and then the PLSR models are used to evaluate the proposed subsets. The basic procedure of RF is: (1) generate a variable subset as the initialized subset by randomly selecting a predefined number of variables from the original variables; (2) generate a new variable subset based on the initialized subset, and evaluate the initialized subset and the new subset to determine if the initialized subset could be updated by the new subset with a certain probability; and (3) after the predefined iterations of step 2, the probability of each variable selected in all iterations are calculated to determine the optimal wavelengths.
CARS is also an efficient variable selection method based upon PLSR models. CARS uses regression coefficients of PLSR models as variable importance indicators. In CARS, PLSR models are built according to a predefined number of Monte Carlo sampling, and the weights of the absolute regression coefficients of each variable are calculated and compared. The variables with smaller weights of the absolute regression coefficients are eliminated based a predefined rule. For each iteration, PLSR models are built using the selected variables, and until the iteration ends, the variables corresponding to the minimum RMSECV of three-fold cross-validation are selected as the optimal wavelengths.

2.4.4. Image Visualization

The advantage of HSI is to provide spectral and spatial information simultaneously, making it feasible to apply the calibration models on the pixels within the hyperspectral image to form a prediction map to visualize the distribution of the sample quality parameters. Generally, the predicted maps are presented in color, and different colors represent predicted values. The basic procedure for image visualization is to build calibration models, then to apply the calibration models on the hyperspectral images. It was noticed that the performance of the prediction maps depend significantly on the model performance. It is a fact that hyperspectral images containing hundreds of wavebands could reach to several hundreds of MBytes or more than one gigabyte. Applying the calibration models using optimal wavelengths on the images at the optimal wavelengths could be easily and rapidly achieved with simple computational tasks. On the other hand, the calibration models using optimal wavelengths may achieve robust, accurate, and simple models compared with full spectra model. Thus, the optimal PLSR model using optimal wavelengths are used for image visualization.

2.4.5. Software and Model

The resizing of hyperspectral images was conducted on ENVI 4.6 (ITT, Visual Information Solutions, Boulder, CO, USA). The resizing was to cut the image with only samples and a single background from the original hyperspectral images. The spectral data extraction was conducted on Matlab R 2010b (The Math Works, Natick, MA, USA). PLSR was performed on Unscrambler® 10.1 (CAMO AS, Oslo, Norway). The optimal wavelength selection methods and the image visualization were conducted on Matlab R 2010b (The Math Works, Natick, MA, USA).
The performances of the PLSR models using full spectra and the optimal wavelengths were evaluated by correlation coefficients of the calibration set and the prediction set (rc and rp), and the root mean square error of the calibration set and the prediction set (RMSEC and RMSEP). A better model should have higher rc and rp, and lower RMSEC and RMSEP.

3. Results and Discussion

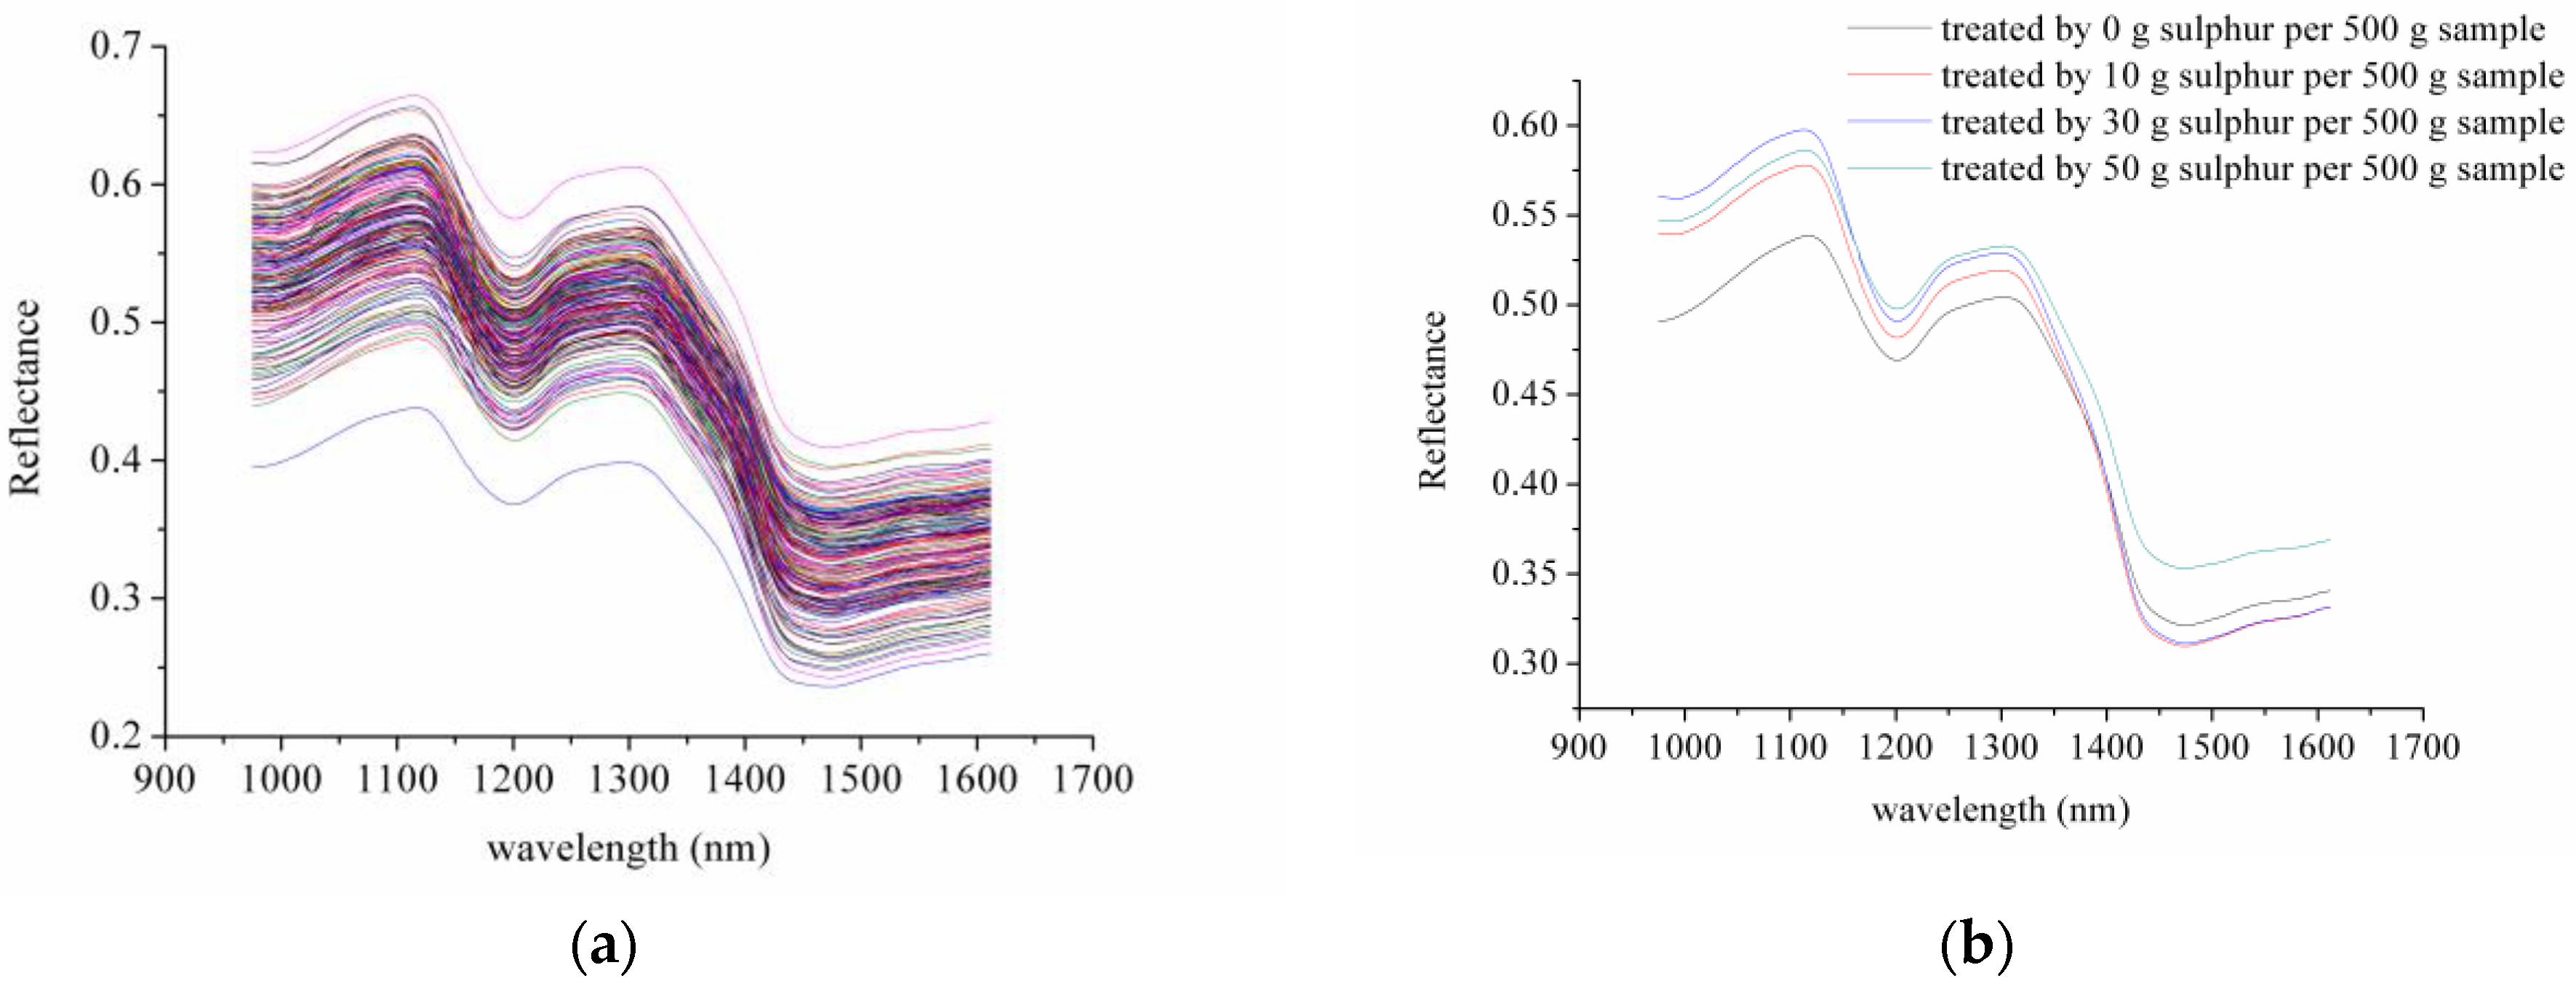
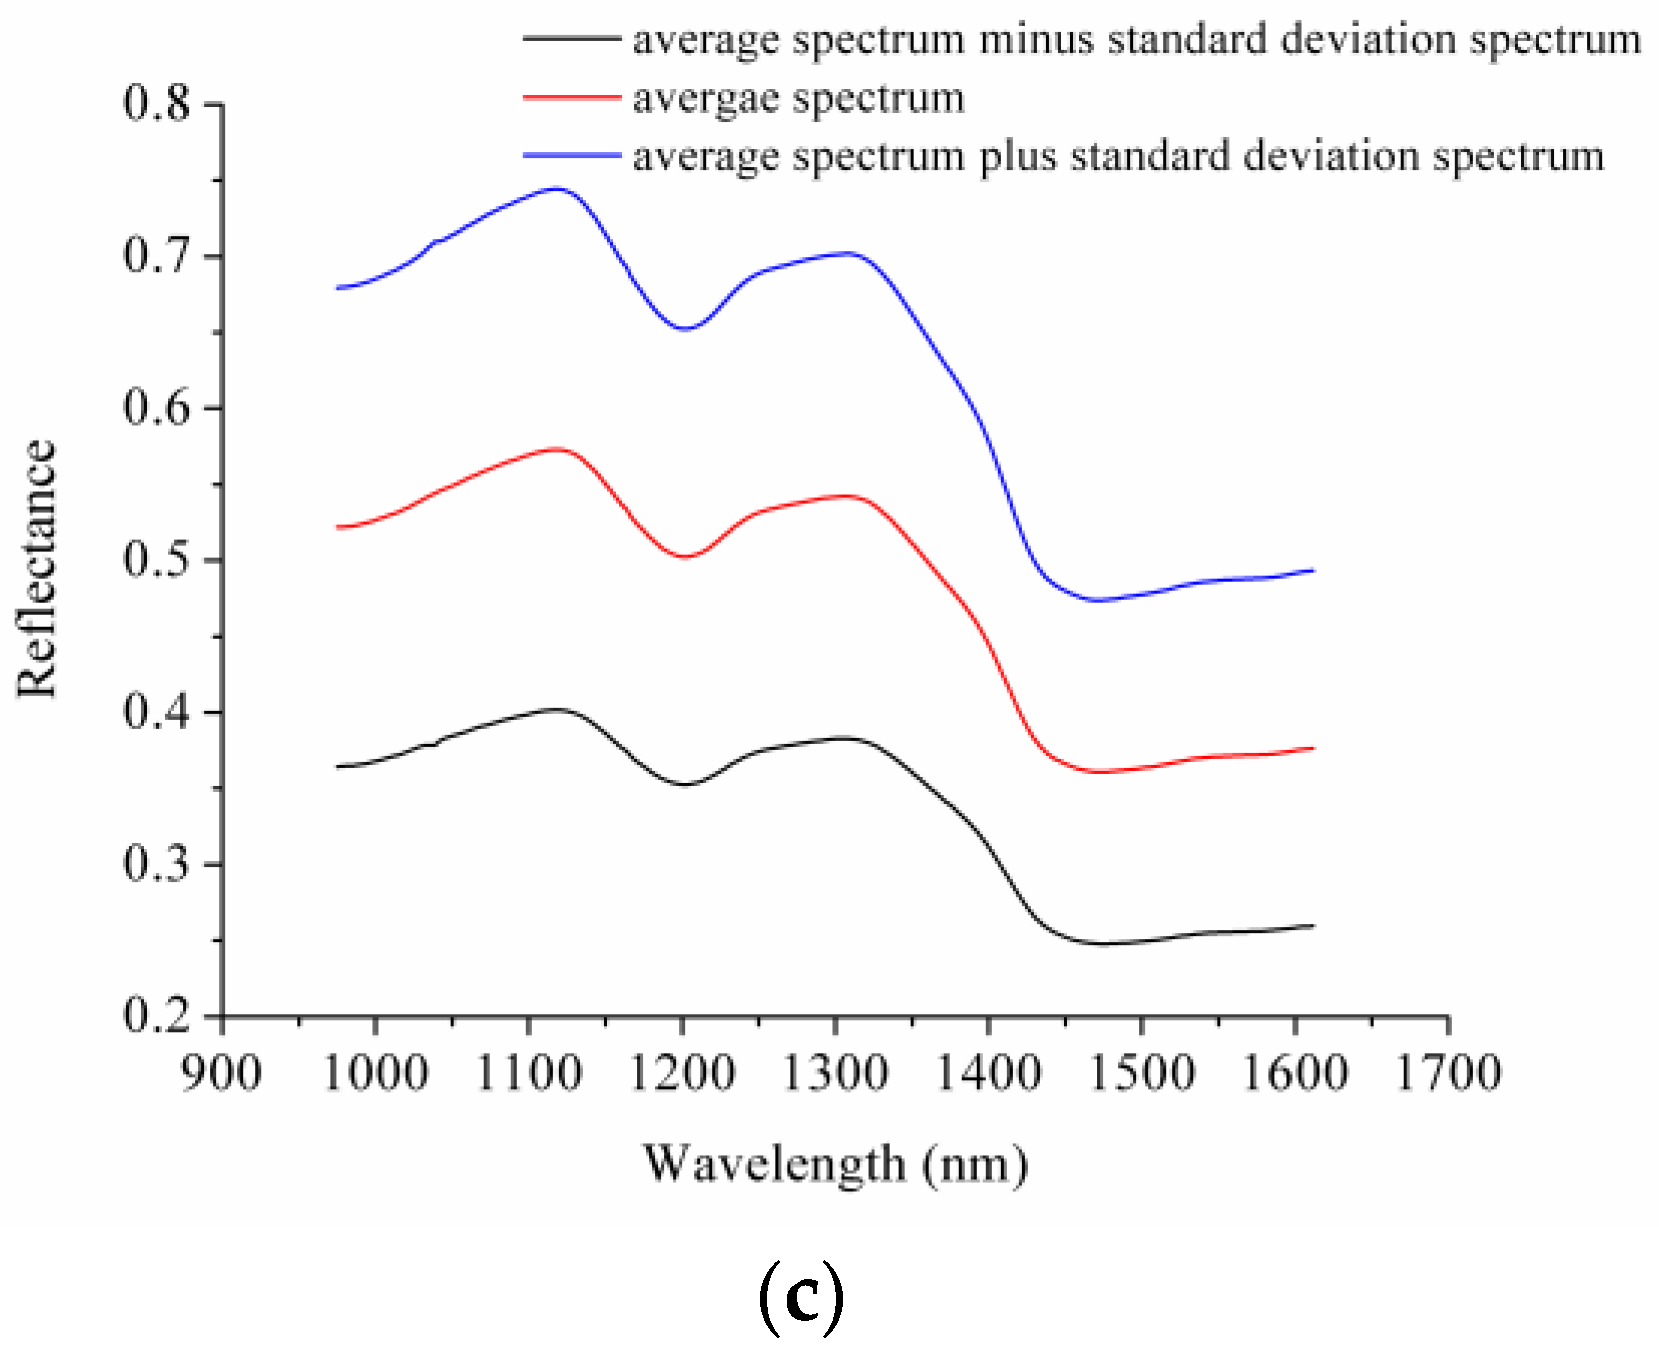
3.1. Spectral Profiles

Due to the noise caused by the detector, the head and the tail of the spectra contained obvious noises, and only the spectrum in the range of 975.01–1611.96 nm was used for analysis. Figure 1a shows the extracted spectra of the samples, and Figure 1b shows the average spectra of the four different treatments. It was found that slight differences could be found from the average spectra of samples under different treatments, and the sulfur fumigation showed influence on the samples. The average spectrum, average spectrum minus standard deviation spectrum, and average spectrum plus standard deviation spectra of a randomly-selected sample are shown in Figure 1c, and variances of the spectra could be observed within a sample.

3.2. Statistical Analysis of SO2 Residual Content

The samples which were treated by 0 g sulfur were measured as 0 g SO2 residuals. Before modelling using the spectral data and SO2 residual content, 12 samples were removed as outliers. The remaining 148 samples were divided into the calibration set and the prediction set at the ratio of 3:1, 111 samples were selected into the calibration set and 37 samples were selected into the prediction set. The statistical analysis of SO2 residual content of samples in the calibration set and the prediction set is shown in Table 1. It was noticed that the calibration set and the prediction set had similar weights.

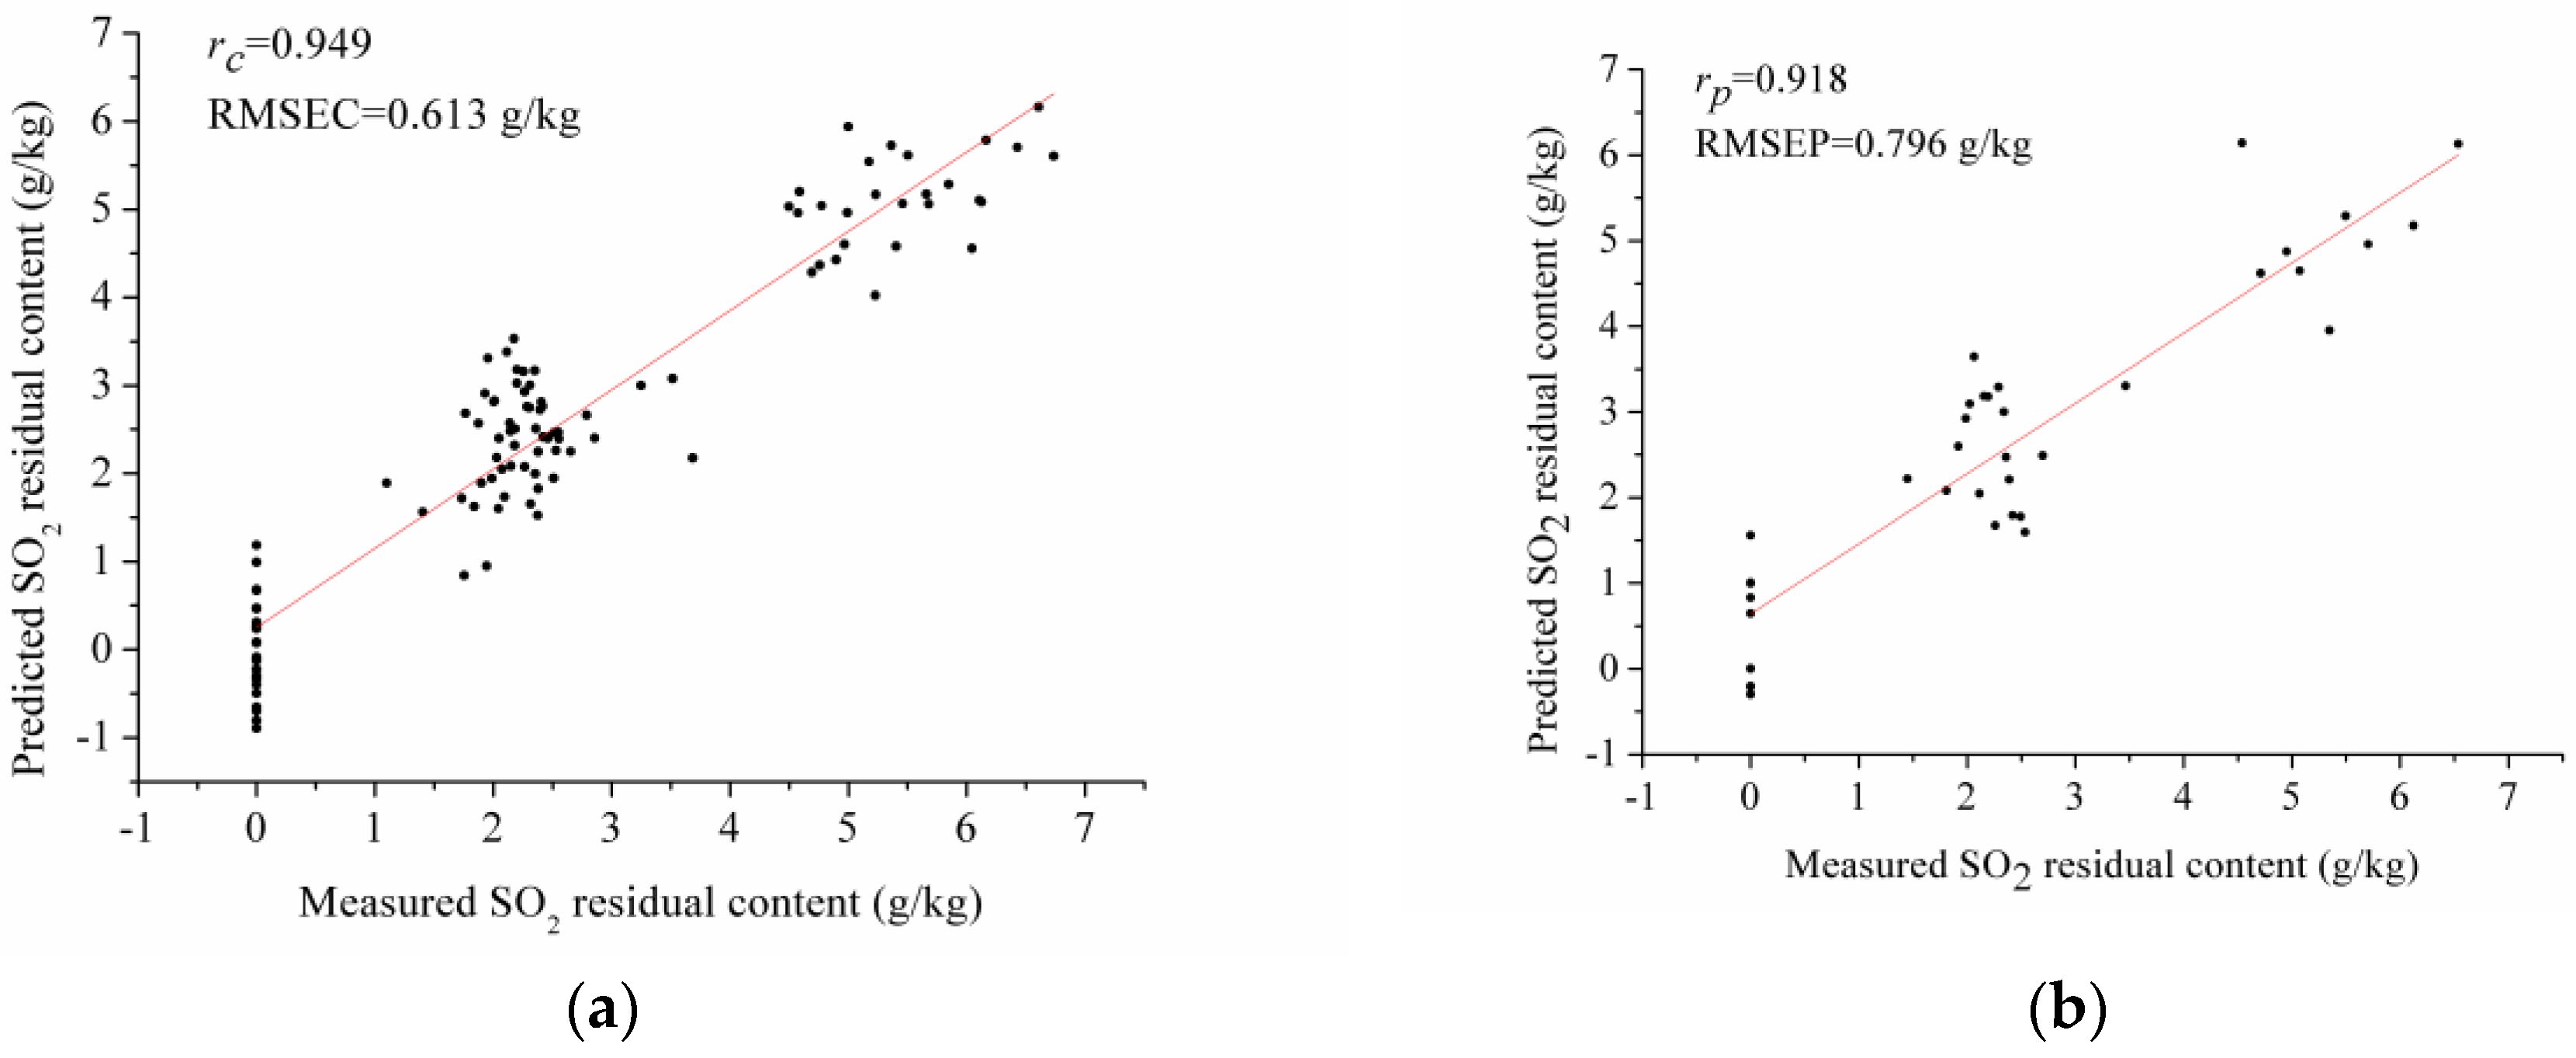
3.3. PLSR Model Using Full Spectra

PLSR is an efficient modelling method for spectral analysis due to its capability to deal with the dataset with more variables for X than Y. The PLSR model was built using leave-one-out cross-validation. The optimal PLSR model was obtained with 15 LVs. The results of the PLSR model using the full spectrum are shown in Figure 2. The PLSR model using the full spectrum obtained good performance with rc and rp over 0.9. The results indicated that it was feasible to use HSI to detect SO2 residual content in sulfur-fumigated Fritillaria thunbergii Bulbus.

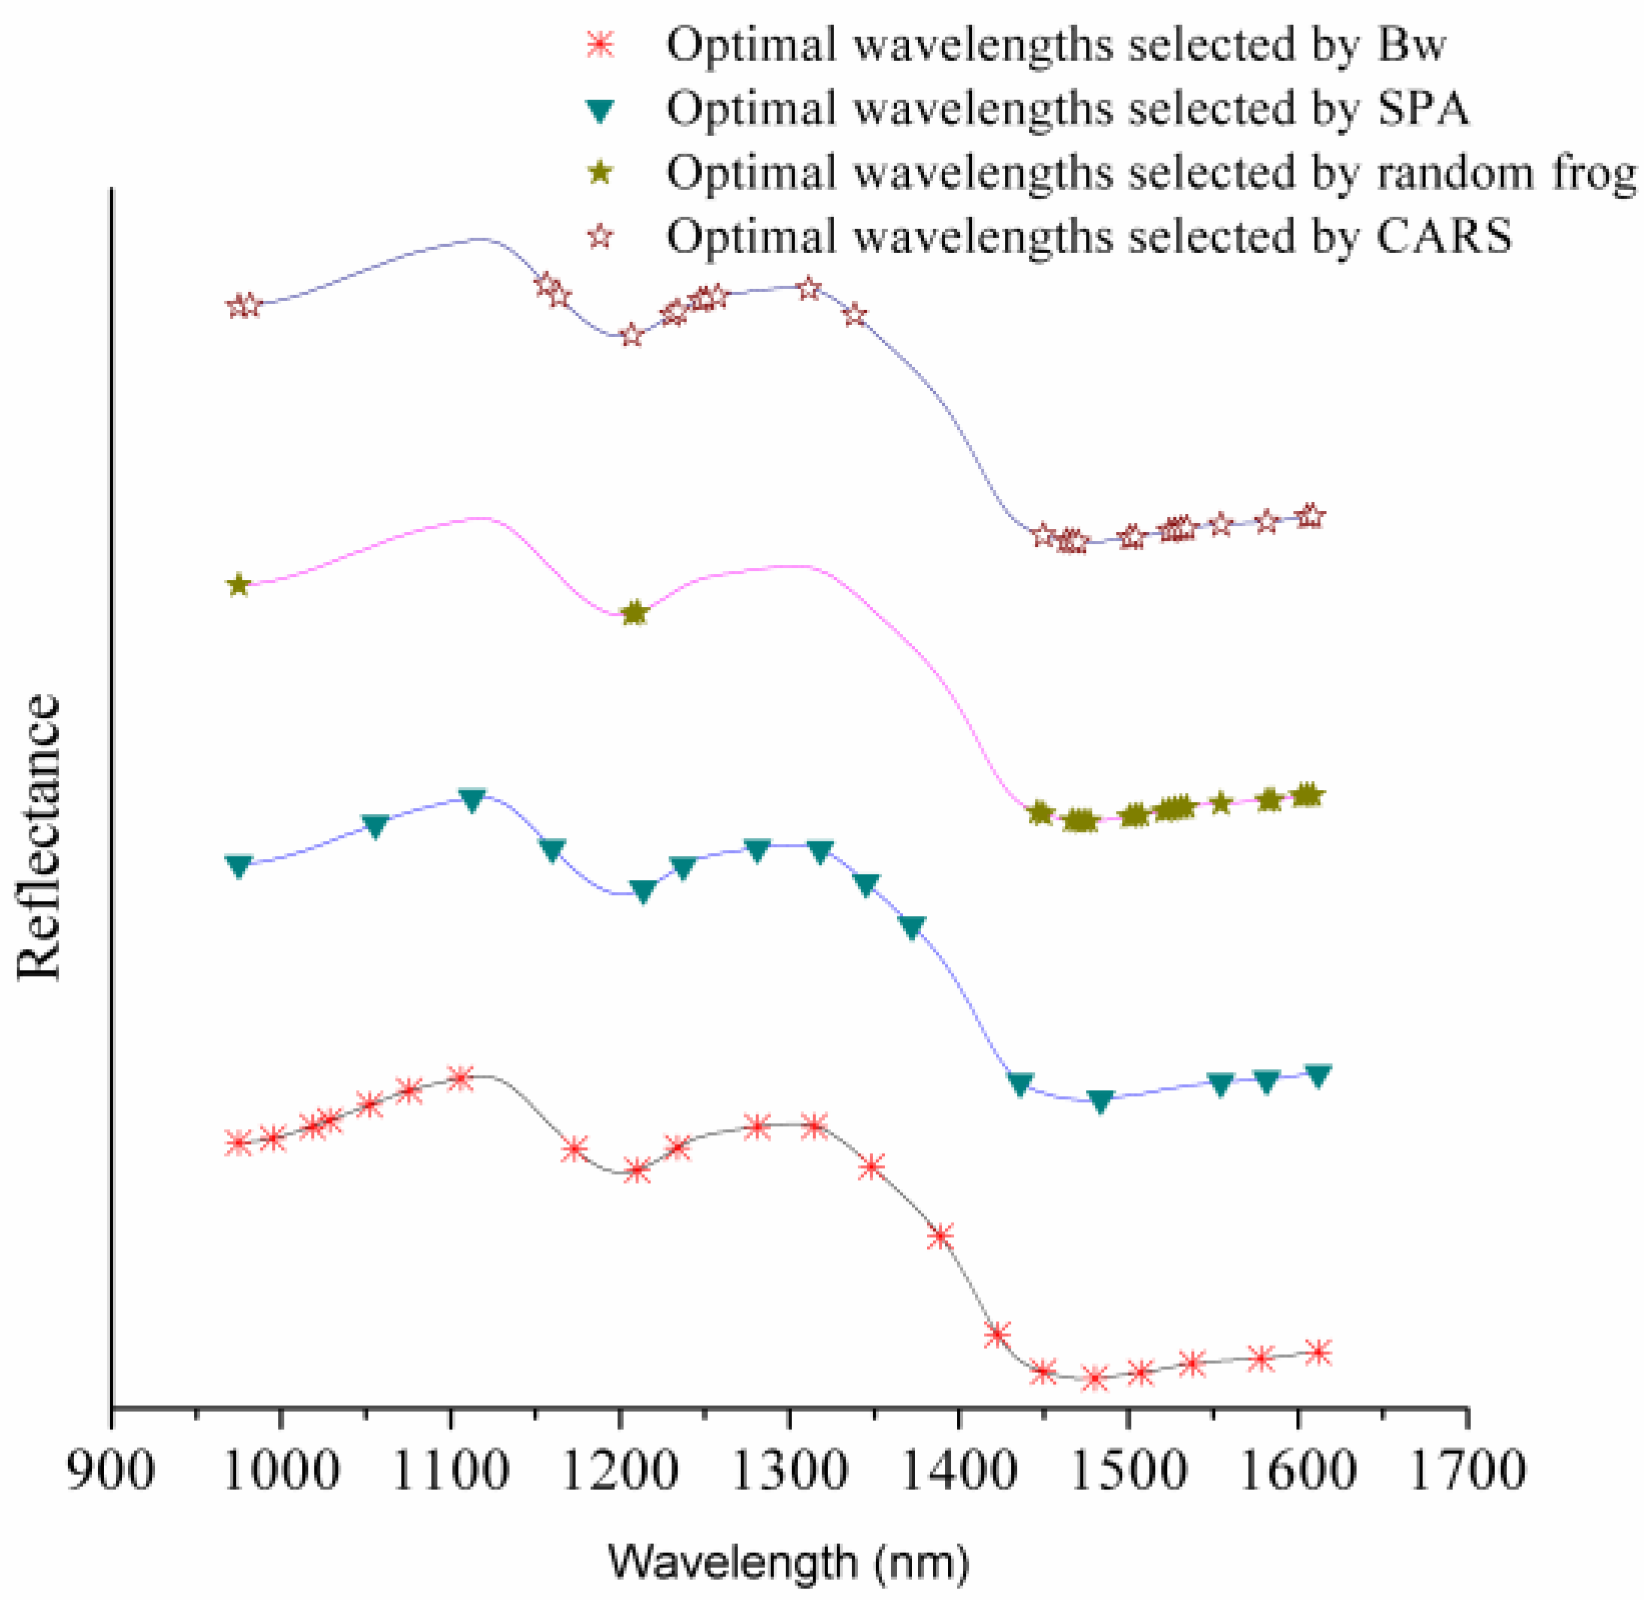
3.4. Optimal Wavelength Selection

SPA, Bw, random frog, and CARS were used in this study to select the optimal wavelengths. To conduct SPA, the number of wavelengths to be selected was set as 5–30, and 15 optimal wavelengths were selected. The peaks and valleys of the wavelength–Bw plot of the PLSR model were selected as the optimal wavelengths, and 21 optimal wavelengths were selected. To conduct random frog, according to [13], 10,000 iterations were sufficient. In all, 24 optimal wavelengths were selected by random frog. To conduct CARS, the number of iterations was set as 10,000, the maximum components were set to 20, and the ratio of samples used in each Monte Carlo sampling procedure was set as 0.9. In all, 26 optimal wavelengths were selected by CARS. The selected optimal wavelengths are shown in Figure 3 and Table 2.
The selected wavelength 975.01 nm, 981.72 nm, and 995.15 nm were attributed to the water absorption [15,16,17], the wavelength near 1020 nm (1018.65 nm) was assigned to protein [18]. The wavelength 1028.72 nm was assigned to a combination of C–H stretching first overtone and C–H deformation second overtone of CH3 [19], the wavelengths between 1150 nm and 1214 nm were assigned to the second overtones of C–H stretching [20,21]; the wavelengths between 1408 nm and 1462 nm were attributed to the water absorption [21]; the wavelengths between 1230 nm and 1400 nm were corresponded to C–H second overtone [22]; the wavelengths between 1460 nm and 1600 nm were attributed to the first overtone of O–H stretching variations [23]; the wavelengths between 1600 nm and 1800 nm were attributed to the first overtones of C–H stretching [24].

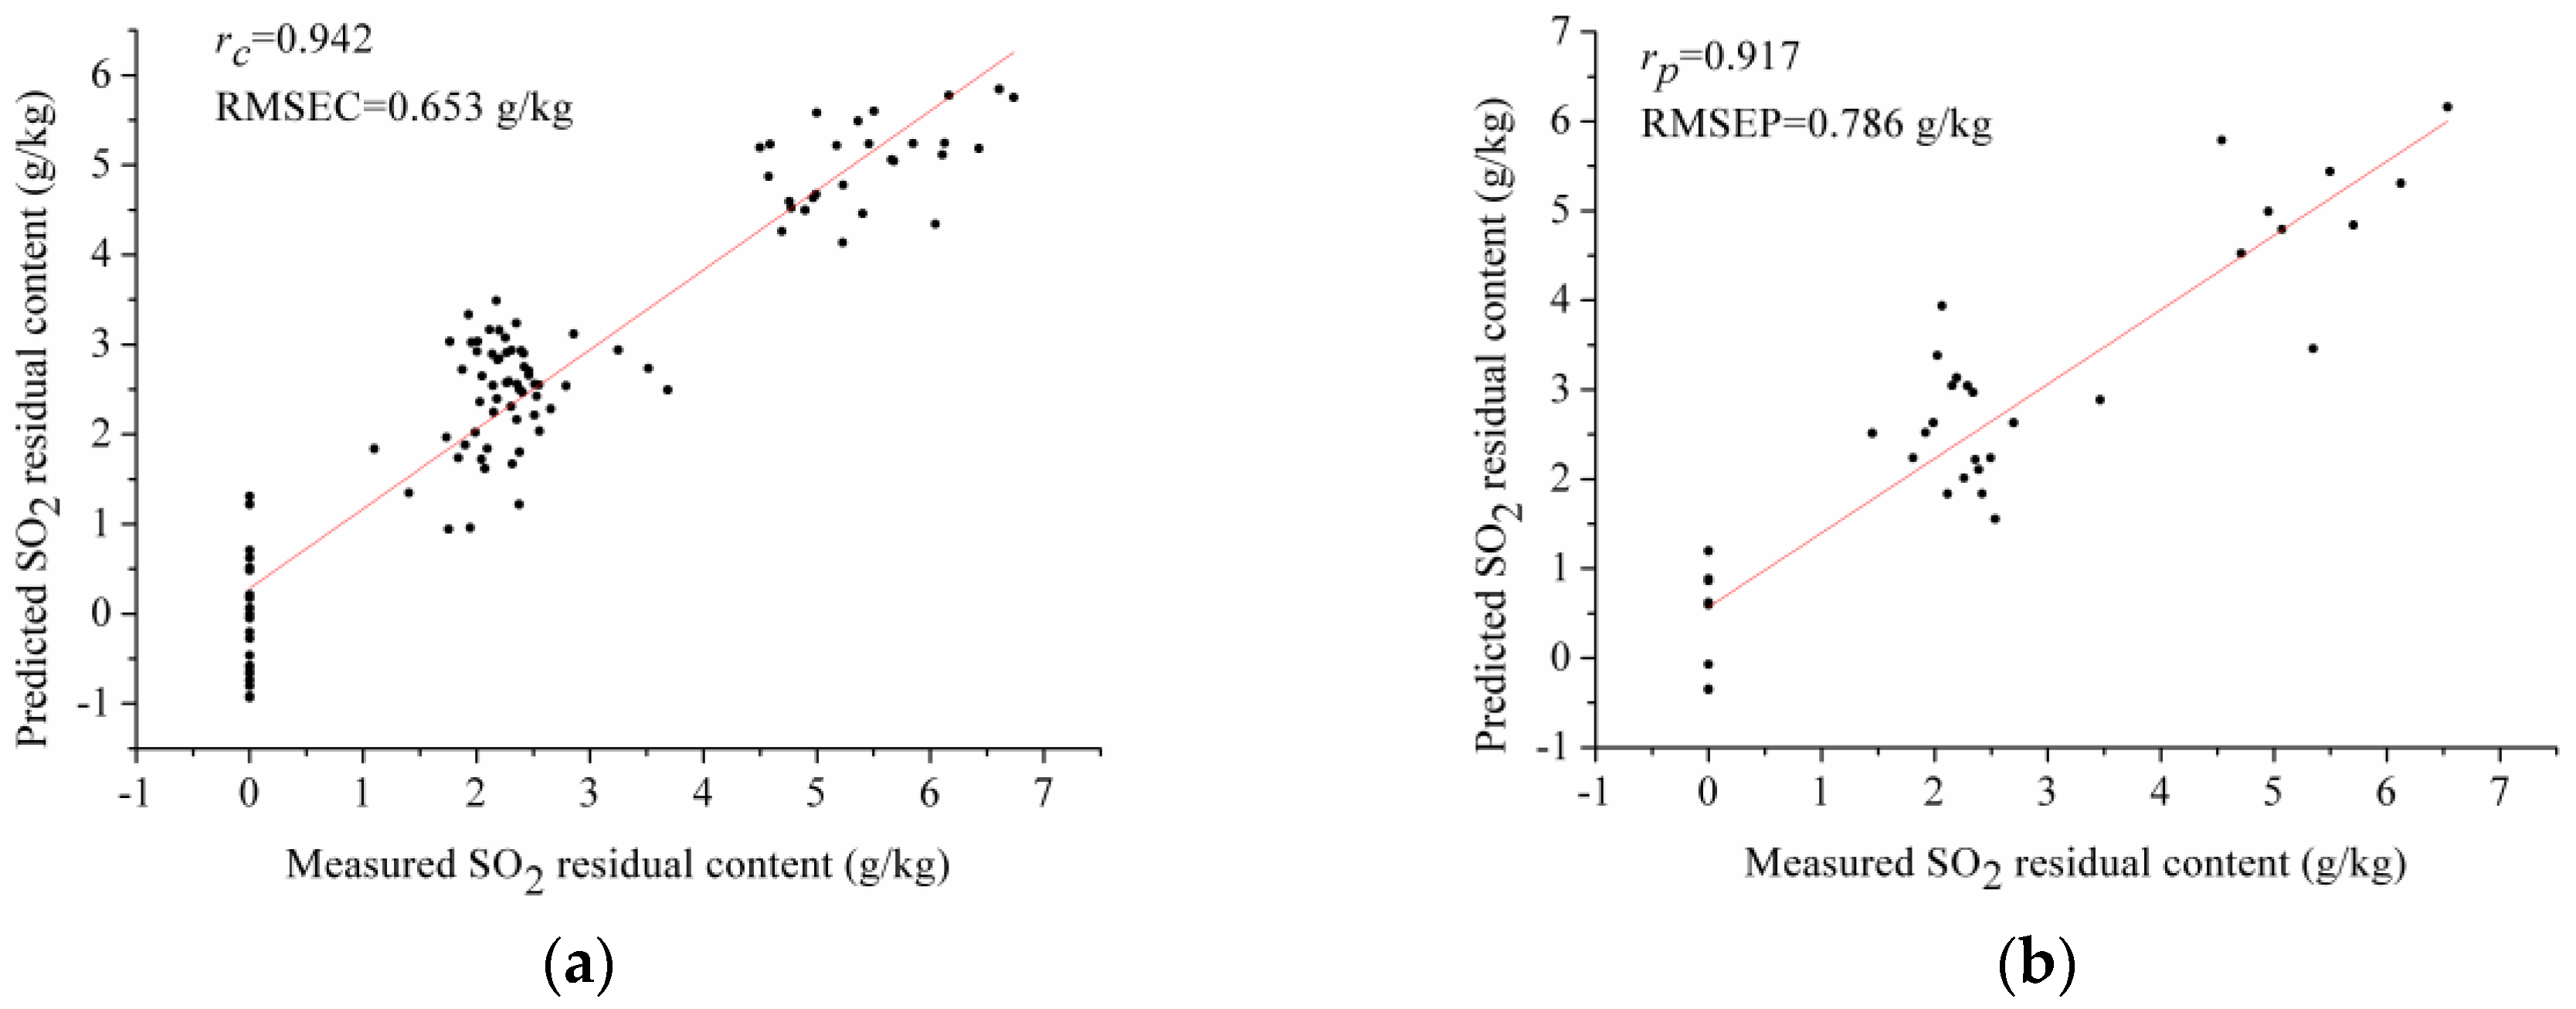
3.5. PLSR Model Using Optimal Wavelengths

PLSR models were built using the optimal wavelengths selected by four different methods. The results of PLSR models are shown in Table 3. SPA-PLSR, Bw-PLSR, and CARS-PLSR models obtained better performances, with rc and rp over 0.9. RF-PLSR obtained slightly worse results, with rc and rp over 0.8. The Bw-PLSR model obtained the highest rp and lowest RMSEP (shown in Figure 4). A fact that the number of wavelengths reduced from 190 wavelengths of the full spectrum to 15, 21, 24, and 26 wavelengths of the optimal wavelengths. The number of wavelengths was significantly reduced at least 86.3% by optimal wavelength selection. It was noticed that the PLSR models using selected optimal wavelengths obtained similar or slightly worse performance to the full spectrum PLSR model. The results showed that the selected optimal wavelengths carried useful information relating to the quality parameters. Although the number of optimal wavelengths was small compared with the full spectrum, informative wavelengths could be used for calibration instead of the full spectrum with similar results. As for spectral analysis, use of informative wavelengths relating to chemical meaning and quality parameters had great potential for practical application instead of the full spectrum. The overall results indicated that optimal wavelength selection could be used to detect SO2 residual content in sulfur-fumigated Fritillaria thunbergii Bulbus by HSI.

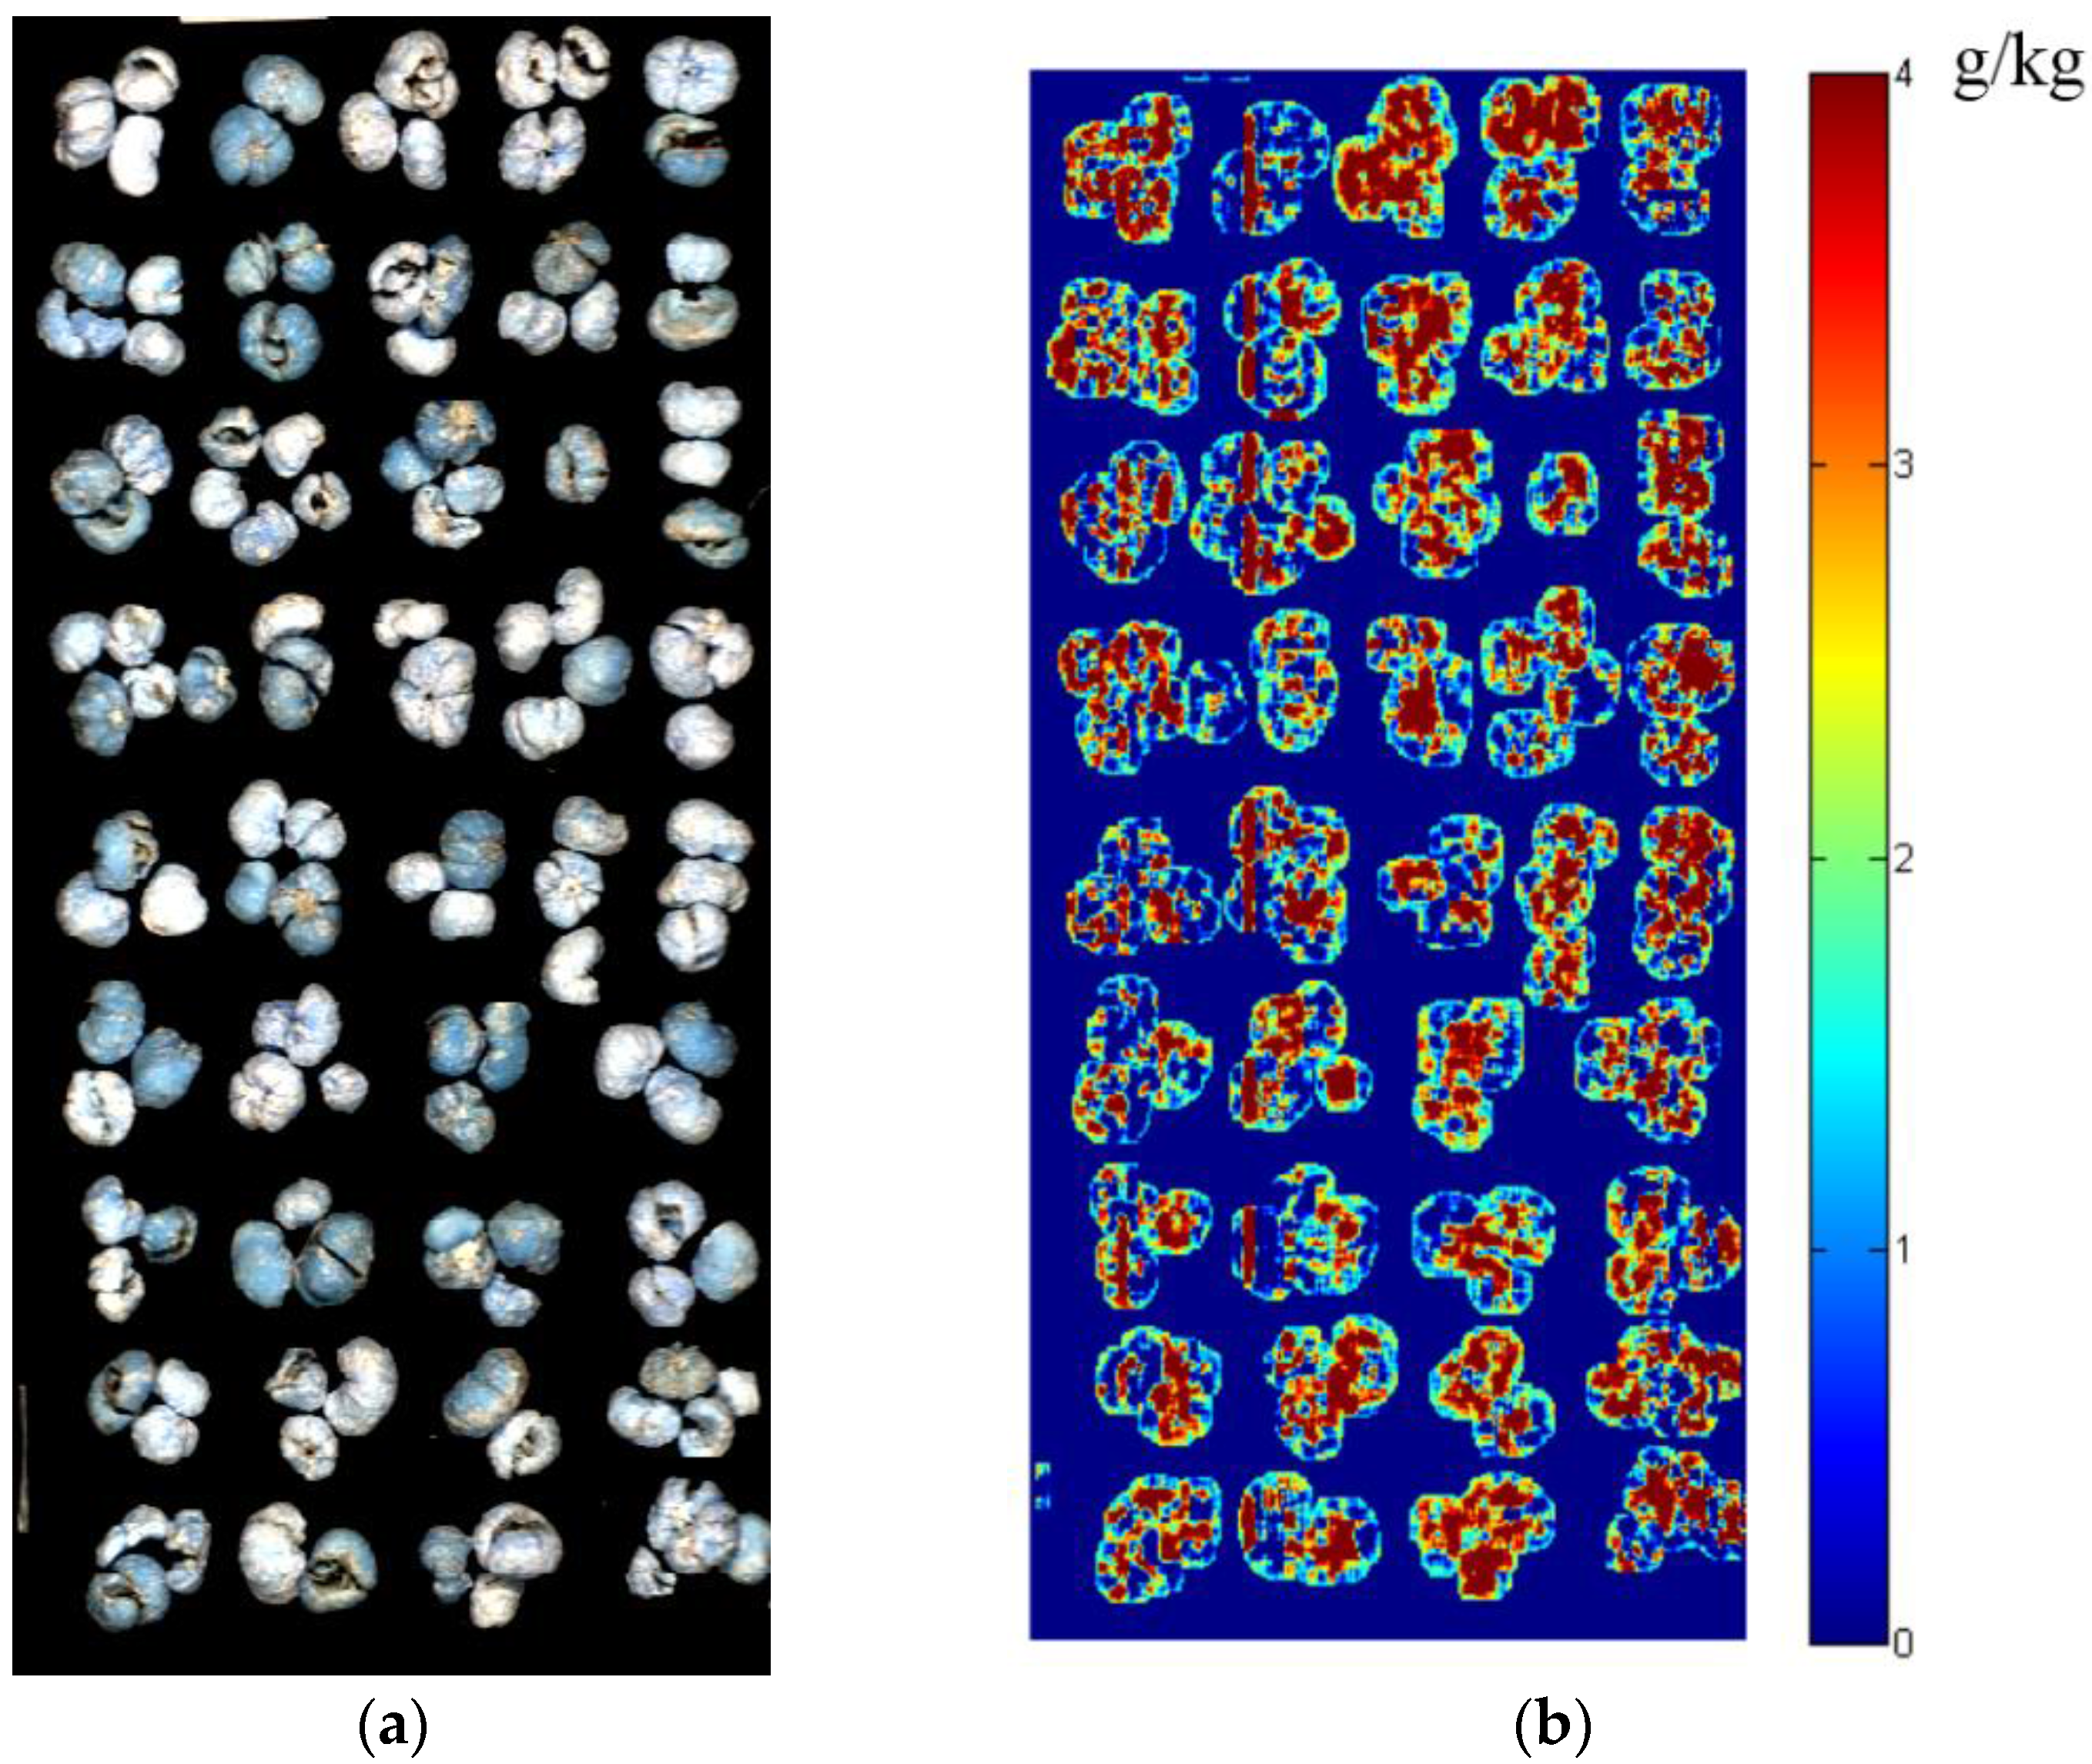
3.6. Visualization of SO2 Residual Content Distribution

A full-spectra PLSR model obtained good performance for SO2 residual content determination. As mentioned in section “Image Visualization”, full spectra of all pixels within the hyperspectral images was a heavy computational task and required high-level computational hardware. A fact that Bw-PLSR obtained similar performances as the full spectrum, and the amount of data was significantly reduced by 88.9%. Thus, the Bw-PLSR model was applied to predict the SO2 residual content of each pixel within the hyperspectral images. Firstly, the samples were isolated from the background to make the reflectance of the background zero. Secondly, the spectrum of each pixel was extracted, and the sample preprocessing methods were applied on the extracted pixel-wise spectra. Thirdly, the optimal wavelength selected by Bw from the pixel-wise full spectra was extracted. Fourthly, the Bw-PLSR model expressed as Equation (2) was applied to predict the SO2 residual content of each pixel, and the predicted pixels were formed as a prediction map. The prediction map of a hyperspectral image of the samples fumigated by 10 g sulfur per 500 g samples is shown in Figure 5. The prediction map was acquired on a computer for less than two minutes with an Intel Core (TM) i7-6700 processor (3.40 GHZ), a NVIDIA GeForce GTX 750 Ti graphics cards and a 256 GB solid state disk.
As shown in Figure 4, the distribution of SO2 residual content in sulfur-fumigated Fritillaria thunbergii Bulbus was non-uniform. The samples within the hyperspectral images showed the average measured SO2 residual contents in the range of 1.1–3.464 g/kg, and it could be found that most of the predicted SO2 residual contents were in the measured range, indicating the efficiency of the prediction map. The distribution of SO2 residual content could be directly visualized from the prediction map.
In fact, it was difficult to measure the actual SO2 residual contents of each pixel; thus, the accuracy of the prediction map now evaluated by the theoretical distribution and the average prediction value of the samples. The calibration model was essential in image visualization, a representative, robust, and accurate model was needed to ensure the prediction performance.
The prediction maps showed that HSI combined with the chemometric methods could be used to detect and visualize SO2 residual content in Fritillaria thunbergii Bulbus, providing a new method for online visualization and monitor of the quality of Fritillaria thunbergii Bulbus and other Chinese medicines.
However, the disadvantage of HSI to detect residual SO2 in Fritillaria thunbergii Bulbus could be attributed to the high cost of the instruments, and establishment and maintenance of the calibration models. The cost of the instruments would decrease with the development of HSI-related manufacturing techniques. Establishment and maintenance of calibration models is essential in practical application. The calibration models should be accurate and robust, and maintenance of calibration models to cover more features of the unknown samples would enhance the prediction accuracy and model applicability.

4. Conclusions

HSI (874–1734 nm), combined with the PLSR multivariate analysis method and optimal wavelength selection methods (SPA, Bw, RF, and CARS), were used to detect and visualize the SO2 residual content in Fritillaria thunbergii Bulbus. The pixel-wise spectra were preprocessed by WT (Daubechies 8 wavelet function and the decomposition level 3) and MAS (seven smoothing points) for spectra extraction and image visualization. SPA, Bw, RF, and CARS selected 15, 21, 24, and 26 optimal wavelengths, respectively. PLSR models using full spectra and optimal wavelengths obtained good performance, with rc and rp over 0.9 (except the RF-PLSR model), indicating the efficiency of optimal wavelength selection. The Bw-PLSR was applied on a hyperspectral image to form a prediction map, and the prediction map showed good performance with most of the prediction values in the measured SO2 residual content range. The overall results indicated that HSI could be applied as a useful and efficient technique for detection and visualization of SO2 residual in Fritillaria thunbergii Bulbus. The results of this study could be helpful to detect residual SO2 in other Chinese medicines, as well as the quality of Chinese medicines. The pixel-wise prediction for visualizing SO2 residuals in Fritillaria thunbergii Bulbus would help to develop online, rapid, and real-time visual detection systems for Chinese medicine quality in the future. More importantly, selections of optimal wavelengths carrying useful information related to the quality parameters could significantly improve the model efficiency and robustness.

Acknowledgments

This work was supported by 863 National High-Tech Research and Development Plan (2013AA102301), and Science and Technology Project of Zhejiang Province (2015C37060).

Author Contributions

Juan He., Chu Zhang, and Yong He conceived and designed the experiments; Juan He performed the experiments; Juan He., Chu Zhang, and Yong He analyzed the data; Juan He contributed reagents/materials/analysis tools; Juan He., Chu Zhang, and Yong He wrote the paper.

Conflicts of Interest

The authors declare no conflict of interest.

References

  1. Duan, B.; Huang, L.; Chen, S. Study on the destructive effect to inherent quality of Fritillaria thunbergii Miq. (Zhebeimu) by sulfur-fumigated process using chromatographic fingerprinting analysis. Phytomedicine 2012, 19, 562–568. [Google Scholar] [CrossRef] [PubMed]
  2. Jiang, X.; Huang, L.F.; Zheng, S.H.; Chen, S.L. Sulfur fumigation, a better or worse choice in preservation of traditional Chinese medicine. Phytomedicine 2013, 20, 97–105. [Google Scholar] [CrossRef] [PubMed]
  3. Song, A.; Liao, Q.; Li, J.; Lin, F.; Liu, E.; Jiang, X.; Deng, L. Chronic exposure to sulfur dioxide enhances airway hyperresponsiveness only in ovalbumin-sensitized rats. Toxicol. Lett. 2012, 214, 320–327. [Google Scholar] [CrossRef] [PubMed]
  4. Zhang, Q.; Tian, J.; Bai, Y.; Yang, Z.; Zhang, H.; Meng, Z. Effects of sulfur dioxide and its derivatives on the functions of rat hearts and their mechanisms. Procedia Environ. Sci. 2013, 18, 43–50. [Google Scholar] [CrossRef]
  5. Ding, K.; Cao, G.; Xu, Z.; Chen, X. Quantitative analysis coupled with toxic evaluation to investigate the influence of sulfur-fumigation on the quality of Chrysanthemum morifolium. Nat. Prod. Commun. 2014, 9, 1357–1358. [Google Scholar] [PubMed]
  6. Chinese Pharmacopoeia Commission. Chinese Pharmacopoeia; China Medical Science Press: Beijing, China, 2015. [Google Scholar]
  7. Wu, X.Y.; Chao, Z.M.; Sun, W.; Wang, C. Qualitative and quantitative research on sulfur fumigation of Angelicae Dahuricae Radix (Baizhi) by near-infrared spectroscopy. China J. Chin. Mater. Med. 2014, 39, 1863–1868. [Google Scholar]
  8. Zhang, H.; Wu, T.; Zhang, L.; Zhang, P. Development of a Portable Field Imaging Spectrometer: Application for the Identification of Sun-Dried and Sulfur-Fumigated Chinese Herbals. Appl. Spectrosc. 2016, 70, 879–887. [Google Scholar] [CrossRef] [PubMed]
  9. Geladi, P.; Kowalski, B.R. Partial least-squares regression: A tutorial. Anal. Chim. Acta 1986, 185, 1–17. [Google Scholar] [CrossRef]
  10. Wold, S.; Sjöström, M.; Eriksson, L. PLS-regression: A basic tool of chemometrics. Chemom. Intell. Lab. 2001, 58, 109–130. [Google Scholar] [CrossRef]
  11. Araújo, M.C.U.; Saldanha, T.C.B.; Galvao, R.K.H.; Yoneyama, T.; Chame, H.C.; Visani, V. The successive projections algorithm for variable selection in spectroscopic multicomponent analysis. Chemom. Intell. Lab. 2001, 57, 65–73. [Google Scholar] [CrossRef]
  12. ElMasry, G.; Sun, D.W.; Allen, P. Near-infrared hyperspectral imaging for predicting colour, pH and tenderness of fresh beef. J. Food. Eng. 2012, 110, 127–140. [Google Scholar] [CrossRef]
  13. Li, H.D.; Xu, Q.S.; Liang, Y.Z. Random frog: An efficient reversible jump Markov chain Monte Carlo-like approach for variable selection with applications to gene selection and disease classification. Anal. Chim. Acta 2012, 740, 20–26. [Google Scholar] [CrossRef] [PubMed]
  14. Li, H.; Liang, Y.; Xu, Q.; Cao, D. Key wavelengths screening using competitive adaptive reweighted sampling method for multivariate calibration. Anal. Chim. Acta 2009, 648, 77–84. [Google Scholar] [CrossRef] [PubMed]
  15. Cope, M.; Delpy, D.T.; Wray, J.S.; Reynolds, E.O.R. A CCD spectrophotometer to quantitate the concentration of chromophores in living tissue utilising the absorption peak of water at 975 nm. In Oxygen Transport to Tissue XI; Springer: New York, NY, USA, 1989; pp. 33–40. [Google Scholar]
  16. Sonnenschein, R.; Jarmer, T.; Vohland, M.; Werner, W. Spectral determination of plant water content of wheat canopies. In Proceedings of the 4th EARSel Workshop of Imaging Spectroscopy; New Quality in Environmental Studies; Warsaw University: Warsaw, Poland, 2005; pp. 727–737. [Google Scholar]
  17. Kawamura, K.; Watanabe, N.; Sakanoue, S.; Inoue, Y. Estimating forage biomass and quality in a mixed sown pasture based on partial least squares regression with waveband selection. Grassl. Sci. 2008, 54, 131–145. [Google Scholar] [CrossRef]
  18. Lee, M.H.; Cavinato, A.G.; Mayes, D.M.; Rasco, B.A. Noninvasive short-wavelength near-infrared spectroscopic method to estimate the crude lipid content in the muscle of intact rainbow trout. J. Agric. Food Chem. 1992, 40, 2176–2181. [Google Scholar] [CrossRef]
  19. Wu, D.; Chen, X.; Cao, F.; Sun, D.-W.; He, Y.; Jiang, Y. Comparison of infrared spectroscopy and nuclear magnetic resonance techniques in tandem with multivariable selection for rapid determination of ω-3 polyunsaturated fatty acids in fish oil. Food Bioprocess Tech. 2014, 7, 1555–1569. [Google Scholar] [CrossRef]
  20. Weyer, L.G.; Lo, S.C. Spectra– Structure Correlations in the Near-Infrared. In Handbook of Vibrational Spectroscopy; John Wiley & Sons, Inc.: New York, NY, USA, 2006; pp. 1817–1837. [Google Scholar]
  21. Rogel-Castillo, C.; Boulton, R.; Opastpongkarn, A.; Huang, G.; Mitchell, A.E. Use of near-infrared spectroscopy and chemometrics for the non-destructive identification of concealed damage in raw almonds (Prunus dulcis). J. Agric. Food Chem. 2016, 64, 5958–5962. [Google Scholar] [CrossRef] [PubMed]
  22. De la Roza-Delgado, B.; Soldado, A.; de Faria Oliveira, A.F.G.; Martínez-Fernández, A.; Argamentería, A. Assessing the value of a portable near infrared spectroscopy sensor for predicting pork meat quality traits of “Asturcelta autochthonous swine breed”. Food Anal. Methods 2014, 7, 151–156. [Google Scholar] [CrossRef]
  23. Workman, J.J., Jr. Interpretive spectroscopy for near infrared. Appl. Spectrosc. Rev. 1996, 31, 251–320. [Google Scholar] [CrossRef]
  24. Stuart, B.H. Infrared Spectroscopy: Fundamentals and Applications; John Wiley & Sons Ltd.: Chichester, UK, 2004. [Google Scholar]
Figure 1. (a) Full spectra and (b) average spectra of the samples under 4 different treatments; (c) Average spectrum, average spectrum minus standard deviation spectrum, and average spectrum plus standard deviation spectrum of a randomly selected sample.
Applsci 07 00077 g001aApplsci 07 00077 g001b
Figure 2. Prediction results of (a) the calibration set and (b) the prediction set of the PLSR model using the full spectrum.
Applsci 07 00077 g002
Figure 3. Optimal wavelengths selected by different methods.
Applsci 07 00077 g003
Figure 4. Prediction results of the calibration set (a) and the prediction set (b) of the Bw-PLSR model
Applsci 07 00077 g004
Figure 5. Pseudo-image (a) and prediction map (b) of a hyperspectral image of the samples fumigated by 10 g sulfur per 500 g samples.
Applsci 07 00077 g005
Table 1. Statistical analysis of SO2 residual content in the calibration set and the prediction set.
Sample SetNumberRange (g/kg)Means (g/kg)Standard Deviation (g/kg)
Calibration set1110–6.7362.5021.950
Prediction set370–6.5362.4721.963
Table 2. Number of optimal wavelengths and optimal wavelengths selected by SPA, Bw, random frog, and CARS.
MethodNumberWavelength (nm)
SPA151581.51, 1611.96, 1483.46, 1318.09, 1345.0601, 1281.01, 1372.05, 1213.65, 1159.8108, 1112.72, 1554.45, 1436.1801, 1237.22, 975.01, 1055.59
Bw21975.01, 995.15, 1018.65, 1028.72, 1052.23, 1075.75, 1106, 1173.26, 1210.29, 1233.85, 1281.01, 1314.72, 1348.4399, 1388.92, 1422.67, 1449.6801, 1480.08, 1507.12, 1537.54, 1578.13, 1611.96
Random frog241581.51, 1503.74, 1524.02, 1605.2, 1500.36, 1473.33, 1469.95, 1554.45, 1507.12, 1608.58, 1534.16, 1584.89, 975.01, 1520.64, 1527.4, 1601.8101, 1476.71, 1530.78, 1496.98, 1210.29, 1206.92, 1449.6801, 1466.5699, 1446.3101
CARS26975.01, 981.72, 1156.4399, 1163.9, 1206.92, 1230.49, 1233.85, 1247.33, 1250.6899, 1257.4301, 1311.35, 1338.3199, 1449.6801, 1463.1899, 1466.5699, 1469.95, 1500.36, 1503.74, 1524.02, 1527.4, 1530.78, 1534.16, 1554.45, 1581.51, 1605.2, 1608.58
Table 3. Results of PLSR models using optimal wavelengths selected by four different methods.
MethodsModelPar *rcRMSEC (g/kg)rpRMSEP (g/kg)
SPAPLSR130.9390.6680.9120.819
Random frogPLSR70.8880.8920.8451.064
BwPLSR130.9420.6530.9170.786
CARSPLSR120.9560.5680.9090.840
* par: par means the parameter of the model, i.e., number of LVs in PLSR model.

