Article

Estimation of Lamina Stiffness and Strength of Quadriaxial Non-Crimp Fabric Composites Based on Semi-Laminar Considerations

School of Aeronautics, Northwestern Polytechnical University, P.O. Box 120, Xi’an 710072, Shaanxi, China
*
Authors to whom correspondence should be addressed.
Appl. Sci. 2016, 6(9), 267; https://doi.org/10.3390/app6090267
Submission received: 5 July 2016 / Revised: 11 September 2016 / Accepted: 14 September 2016 / Published: 19 September 2016
(This article belongs to the Section Materials Science and Engineering)

Abstract

:
Quadriaxial non-crimp fabric (QNCF) composites are increasingly being used as primary structural materials in aircraft and automotive applications. Predicting the mechanical properties of QNCF lamina is more complicated compared with that of unidirectional (UD) composites, because of the knitting connection of different plies. In this study, to analyze the stiffness and strength of the QNCF composites, a novel modeling strategy for the meso-scale features is presented based on the semi-laminar assumption. Following the view of the mechanical properties of single composite lamina, the complex QNCF layer is decomposed into individual plies. Three different representative unit cells along fiber direction are selected to predict the mechanical performance of QNCF, including in-plane stiffness, damage initiation, and stiffness degradation. To validate the developed modeling strategy, the predictions are compared with existing experimental results, where a good agreement is presented on the prediction of in-plane stiffness and strength. Furthermore, the effect of in-plane fiber distortion, induced by the stitching yarn on the mechanical properties, is studied.

Graphical Abstract

1. Introduction

Non-crimp fabric (NCF) is constituted by a large amount of fairly straight fiber tows that are placed side by side and bounded by warp-knitting [1]. Compared with the unidirectional (UD) pre-preg composites, NCF composites have many advantages, such as lower production cost, higher out-of-plane damage tolerance and fracture toughness. Thus, it is becoming more popular in the manufacture of complex and thicker parts than UD pre-preg composites [2]. The NCF has two main types, open structure and continuous plies [3]. The fiber tows of continuous plies are laid as closely as possible to reduce the waviness of the fiber tows. However, fiber distortion still exists in the plies [4].
Mechanical properties of single lamina are the basic parameters for composites. Many theories and failure criteria are developed based on the assumptions that each lamina of the laminated composites is homogeneous and orthotropic [5]. Since each lamina in the NCF has a unique fiber direction, it can be considered as semi-laminar [6]. For the mechanical analysis of NCF composite structures, the basic mechanical properties of the semi-laminar composites should be known. To obtain the mechanical properties of each lamina of quadriaxial non-crimp fabric (QNCF) composites (the material is supplied with a layer stacking sequence (45°/90°/−45°/0°)) through experiment, four kinds of UD specimens need to be produced (one for each fiber direction, including the through-thickness yarn) [7]. This process is very complicated and costly, for it is not very easy to adjust the warp-knitting machine for a small batch production of these UD specimens. Alternatively, the mechanical properties of NCF composites can be predicted by using a multiscale analysis approach. However, a complete multiscale analysis is also very time-consuming [6].
An equivalent analysis method was proposed based on semi-laminar considerations [6,8,9]. In this method, the mechanical properties of NCF lamina are determined by equivalent UD composite lamina, which is multiplied with knock-down factors to take into consideration the effect of fiber waviness. The effect of fiber waviness on the mechanical properties was studied using different modeling methods in references [10,11,12]. The knock-down factor or stiffness reduction in the previous works mainly focused on the out-of-plane fiber waviness of opening structure NCF composites. However, the waviness of continuous plies NCF composites mainly presents in the in-plane direction of the fabrics rather than the out of plane direction. Thus, the effect of in-plane fiber waviness should be considered when evaluating the mechanical performance of this kind of NCF composites.
Several researchers have studied the mechanical properties of continuous plies NCF using either experimental or multiscale modeling approach. Truong et al. [13] compared the experimental results of the elastic modulus with that of classical laminate theory (CLT) predictions, and found that the effect of stitching on the stiffness of this material was not significant. However, earlier works [14,15] claimed that the experimental measurements were about 17% lower than those obtained by the CLT. Mikhaluk et al. [16] used acoustic emission (AE) registration and X-ray imaging to detect damage initiation and evolution in quadriaxial laminates under tensile load, and the numerical simulation of the failure process was also carried out. Ivanov et al. [17] summarized the previous meso-scale model, and set up a meso-scale mechanically representative volume (mRVE), and predicted the effect of stitching on the mechanical properties of non-crimp fabric composite, such as, stiffness, failure initiation, stiffness degradation and strength. The current researches were focused on the performance of a whole continuous plies QNCF layer or laminate, but few studies has been done on the lamina mechanical properties of the materials. Since the NCF composites can be addressed as being semi-laminar [6], the stiffness and strength of QNCF can be estimated from the view of the mechanical properties of single QNCF lamina. After the evaluation, the QNCF lamina can be equivalent to UD lamina combined with knock-down factor or effective mechanical properties of lamina. Then, the general method can be applied to analysis the QNCF composites, such as CLT, layerwise theory, FE-shell element, etc. Following this idea, a simplified modeling strategy is presented for meso-scale analysis to predict effective stiffness properties and ply strength of QNCF.
Considering the limitations described above, there are two main contributions in this paper. Firstly, the stiffness and strength of QNCF lamina composites is predicted, and the effect of in-plane fiber distortion on the mechanical properties is studied at the lamina level. The results can be used to create an equivalent continuum model for the composites at the macroscale level. Secondly, a novel modeling strategy for the meso-scale features of QNCF is presented. It is feasible for rapid modeling and meshing due to the simply description of the inter-structure of QNCF.

2. Modeling Approach

To perform a meso-scale analysis based on mechanical properties of single NCF lamina, detailed internal structure of continuous plies NCF composites should be known. Internal geometry of a continuous plies NCF stitched by warp-knitting was investigated in Reference [4]. Based on this verified geometry data, a continuous plies QNCF which has a layer sequence of (45°/90°/–45°/0°) is selected for a mesomechanical model, this quasi-isotropic layer is widely used in engineering, and its complex internal structure contains a variety of known types of stitch yarn induced fiber distortion (SYD). In this way, the typical form of SYD in the QNCF composites can be accounted for multiscale analysis. The stitching threads are ignored, following the assumption in Reference [18]. In this modeling strategy, QNCF laminate is considered as a semi-laminar, and is assumed to be separated from others.

2.1. Modeling Strategy Based on Mechanical Properties of Single NCF Lamina

The mesomechanical unit cell of a QNCF is shown in Figure 1a. The models include deviations of the fiber orientations in inner and outer plies, such as cracks and channels. For continuous plies NCF, the disturbance caused by the stitch in fiber direction is different in different plies. In the outer fibrous plies, the stitching pulls fibers aside forming long “channels” in the 0° lamina and rhomboidal “cracks” in 45° lamina. In the inner, rhomboidal “cracks” are induced in the 90° and −45° lamina, and the size of these inner cracks is smaller than that of outer cracks. The direction of the large diagonal of the rhomb and the channel corresponds to the fiber direction in the ply.
The different openings in the individual plies in QNCF composites will lead to a difference in mechanical properties of single NCF lamina. In property testing of NCF composites, different non-crimped UD specimens are requires to test to determinate the mechanical properties of single QNCF lamina. The schematic diagrams of production these different warp-knitted non-crimped UD specimens are shown in Figure 2, and the angle between the fibers and the process direction are 90°, 0° and 45°, respectively. Remarkably, the fiber distortions of the UD specimens induced by the stitch yarn are different. Geometrical model of unit cells of these different specimens, are shown in Figure 3. These UD specimens also include different gaps and channels. After injection molding, the composite laminates are cut out following in the fiber direction for mechanical testing. In meso-scale analysis, the unit cells of QNCF should also include the meso-scale geometry features of different non-crimped UD specimens as shown in Figure 3.
To improve the efficiency of meso-scale analysis, the QNCF layer is decomposed into individual plies as shown in Figure 1b. Considering that the testing method of mechanical properties of single QNCF lamina, the unit cells are select along fiber direction as shown in Figure 1b. Since inter −45° and 90° lamina have the same volume fraction and crack size, they are classified as one model. Then three types of unit cells of individual QNCF lamina are formed, which are shown in Figure 1c. Although this modeling strategy decomposes the QNCF layer, the major fiber architecture is still considered in the model, including channel, inter small crack, face large crack, and local fiber contents.

2.2. Multiscale Modelling Procedure of QNCF Composites

The workflow of multiscale analysis in this paper is given in Figure 4. On the microscale, mechanical properties of the resin and fiber are input to micro-scale analysis model, which are then used to determine mechanical properties of the composites tows. A periodic microstructure three-dimensional (3D) finite element (FE) model is constructed, with the assumption that fibers are uniformly distributed in the matrix, as shown in Figure 4a. In this micromechanics model, the fiber-matrix interface is modeled as perfectly bonded with nodes merged in a conventional mesh. In the failure analysis process, the failure state of the interface is evaluated by the failure of fiber and matrix that is adjacent to the interface. Similar modeling methods are explained in reference [7]. Henceforth, the term “composite tows” is refers straight fiber tows impregnated with resin. “1-direction” and “longitudinal direction” are the direction along the axial of the fiber, “2-direction” and “transverse direction” are the direction transverse to the axial of the fiber, and “3-direction” is in the thickness direction of the fabrics.
On the mesoscale, three unit cells are used to describe the fiber distortion patterns in the NCF plies (Figure 4b). The in-plane stiffness and strength of the NCF lamina are obtained by numerical analysis. These 3D FE models of single NCF lamina are developed based on the previous geometries (Figure 1c). The meso-scale models are shown in Figure 5, where Cell A is unit cell with a large crack, Cell B is unit cell with a small crack, Cell C is unit cell with a channel, and b and l are the width and length of the crack, respectively. In this mechanical model, the local variation of fibers orientation (Area with distorted fiber direction) is also shown in Figure 5.
The local variation of the fiber orientations can be localized near the crack in ply. It is assumed that the width of the area with distorted fiber direction has the same size as small crack, which is shown in Figure 5b. Based on the experiment data [4], the value of large crack width is 0.480 mm and length is 7.20 mm, and the value of small crack width is 0.352 mm and length is 2.64 mm, and the fiber in-plane crimp angle θ = 4°. The fiber crimp angle can be modeled by the rotation of material orientation according to the actual distorted fiber direction [11].
The volume fraction of composite tows (is also the local fiber volume fraction) is calculated in Reference [4]. The averaged fiber volume fraction of the lamina V f l and the volume fraction of composite tows V f t are related according to the Equation (1).
V f t = V f l A l A t = V f l A × B A × B S Void
where Al is the cross-section of the lamina, At is the cross-section of the tow, and SVoid is the area of a crack or a channel per one knitting needle. A, B is the space of stitching loops, A is perpendicular to the machine direction, B is in the machine direction (see Figure 1), and assuming B = 2.74 mm, and A = 5.07 mm in this paper.

3. Boundary Conditions and Material Models

3.1. Boundary Conditions

To obtain homogenized material properties, it is necessary to apply normal and shear loads on the micro and mesomechanical unit cells. A simplified periodic boundary condition is applied on these unit cells [7], as shown in Figure 6.
The displacement load δ x is applied on the planes x = a1 (Figure 6a), and the corresponding boundary conditions can be described as
u ( 0 , y , z ) = 0 , u ( a 1 , y , z ) = δ x v ( x , 0 , z ) = 0 w ( x , y , 0 ) = 0 v ( x , a 2 , z ) = v ( a 1 , a 2 , a 3 ) = δ y = c o n s t w ( x , y , a 3 ) = w ( a 1 , a 2 , a 3 ) = δ z = c o n s t
Simple shear displacements are applied in x-direction (Figure 6b), and the boundary conditions is as follows,
u ( x , 0 , z ) = 0 u ( x , a 2 , z ) = δ x v ( x , 0 , z ) = v ( x , a 2 , z ) = 0 u ( 0 , y , z ) = u ( a 1 , y , z ) v ( x , 0 , z ) = v ( x , a 2 , z ) w ( x , y , 0 ) = w ( x , y , a 3 ) = 0
The boundary conditions of other direction are similar to Equations (2) and (3). In most finite element analysis (FEA) commercial packages, the boundary conditions can be enforced using coupling constraint equations. In addition, the boundary condition used in stiffness prediction process will be adjusted, which will be introduced in the Section 3.2.

3.2. The Stiffness Calculation Method Based on Average Stress and Strain

To evaluate the stiffness properties of a heterogeneous material, it is necessary to calculate the average stress and strain over the unit cells. The constitutive relation of the average stress and strain of the homogeneous composite material [19] is shown in Equation (4).
σ ¯ α = C α β ε ¯ β
where α , β = 1 , , 6 . C α β is the stiffness tensor.
For an orthotropic material, the tensor C α β can be written in the form:
C α β = [ c 11 c 12 c 13 0 0 0 c 21 c 22 c 23 0 0 0 c 31 c 32 c 33 0 0 0 0 0 0 c 44 0 0 0 0 0 0 c 55 0 0 0 0 0 0 c 66 ]
Then, the relations between the effective engineering constant of composites and the stiffness tensor C α β can be written as
E 1 = C 11 2 C 12 C 21 / ( C 22 + C 23 ) E 2 = [ C 11 ( C 22 + C 23 ) 2 C 12 C 21 ] ( C 22 C 23 ) / ( C 11 C 22 C 12 C 21 ) G 12 = C 66 , G 23 = C 44 v 12 = C 12 / ( C 22 + C 23 ) v 23 = ( C 11 C 23 C 12 C 21 ) / ( C 11 C 22 C 12 C 21 )
where E 1 and E 2 are longitudinal and transverse Young’s modulus. v 12 and v 23 are Poisson’s ratios. G 12 is in-plane shear modulus.
To obtain the components of the stiffness tensor C α β , the six components of strain ε i j 0 ,   i , j = 1 , ,   3 are applied by enforcing the following boundary conditions on the displacement components as shown in Figure 6.
u i ( a 1 , y , z ) u i ( 0 , y , z ) = a 1 ε i 1 0 u i ( x , a 2 , z ) u i ( x , 0 , z ) = a 2 ε i 1 0 u i ( x , y , a 3 ) u i ( x , y , 0 ) = a 3 ε i 3 0
The boundary conditions (Equation (7)) means that a j ε i j 0 is the displacement required to enforce a strain of ε i j 0 over a distance a j .
Using Equation (7), a surface strain ε β 0 can be applied on the unit cell. The relationship between ε β 0 and ε i j 0 [19] can be written as
ε β = ε i j = ε j i
where β = i , if i = j else β = 9 i j .
The volume average strain ε ¯ β in the unit cells equals to the applied surface strain ε β 0 ,
ε ¯ β = 1 V V ε β 0 d V = 1 V [ V f ε β 0 d V + V m ε β 0 d V ] = ε β 0
where V is the volume of unit cells, V f is the volume of fiber, and V m is the volume of matrix.
The corresponding volume average stress σ ¯ α is described as:
σ ¯ α = 1 V V σ α d V = 1 V [ V f σ α d V + V m σ α d V ]
where σ α is stress field in the unit cells.
For discrete finite elements, Equation (10) can be written by
σ ¯ α = ( k 1 = 1 n σ k 1 + k 2 = 1 m σ k 2 ) / ( k 1 = 1 n V k 1 + k 2 = 1 m V k 2 ) = k = 1 n + m σ k / k = 1 i + j V k
where n and m are the number of element representing the fiber and matrix in the FE model, respectively, σ k is the stress at the element integration point, and V k is the volume of a single element.
The numerical homogenization method in this section can be carried out using the commercial finite element software with scripting language, such as Abaqus and Python statements [19]. In Abaqus, to determine the components C i 1 , with i = 1, 2, 3, in x-direction, symmetry boundary conditions are applied on the planes of x = 0, y = 0, z = 0. A uniform displacement is applied on the plane x = a1. The y and z direction boundary are similarity to x-direction except for the loads applied on the respective surfaces. To determine the shear modulus, the simple shear loads are applied in the three principal planes. For postprocessing, a Python script is created to extract the stress of the integration point. The stiffness tensor C α β is calculation by Equation (4) based on the average stress and strain, and then the effective engineering constant can be obtained by Equation (6).

3.3. Multiscale Failure Analysis

3.3.1. Failure and Softening Formulation for Fiber

In this paper, the fiber is treated as a transversely isotropic material in micromechanical model, thus some failure criteria for laminated composites can be applied to fiber failure analysis. A widely used polynomial failure criterion for composite materials proposed by Tsai and Wu [20] is used. The criterion can be expressed as:
F i σ i + F i j σ i σ j + F i j k σ i σ j σ k 1 i , j , k = 1 , , 6
where σi, σj, and σk are stress components. Fi, Fij, and Fijk are components of the lamina strength tensors in the principal material axes. The third-order tensor Fijk is usually ignored from a practical standpoint due to the large number of material constants required. Then, the general polynomial criterion can be reduced to a general quadratic criterion given by
F 1 σ 1 + F 2 σ 2 + F 3 σ 3 + 2 F 12 σ 1 σ 2 + 2 F 13 σ 1 σ 3 + 2 F 23 σ 2 σ 3 + F 11 σ 1 2 + F 22 σ 2 2 + F 33 σ 3 2 + F 44 σ 4 2 + F 55 σ 5 2 + F 66 σ 6 2 1
For the mechanical properties of the dry fibers, the fiber manufacturer only provides tension and compressive strength parameters; therefore, Equations (12) and (13) are modified as
F 1 σ 1 + F 2 σ 2 + F 3 σ 3 + 2 F 12 σ 1 σ 2 + 2 F 31 σ 3 σ 1 + 2 F 23 σ 2 σ 3 + F 11 σ 1 2 + F 22 σ 2 2 + F 33 σ 3 2 1
where the tensors in Equations (13) and (14) can be determined as follows.
F 1 = 1 X C 1 X T ,   F 2 = 1 Y C 1 Y T ,   F 3 = 1 Z C 1 Z T F 11 = 1 X T X C ,   F 22 = 1 Y T Y C ,   F 33 = 1 Z T Z C F 12 = 1 2 X T X C Y T Y C ,   F 23 = 1 2 Y T Y C Z T Z C ,   F 31 = 1 2 Z T Z C X T X C
where XT, YT, and ZT are the tensile strength in 1-direction, 2-direction, and 3-direction, respectively. XC, YC, and ZC are the compression strength in 1-direction, 2-direction, and 3-direction, respectively.
The modified Tsai-Wu Criterion is an expression that only considers the tensile and compressive strength, and we use the criterion to determine the initial failure of the fiber.
Post-initial failure in fiber direction is modeled by a gradual unloading model, where one or more of the elastic material properties of a lamina are set to zero or a small fraction of the original value once failure is detected. The degradation equations are given in Reference [21]. Furthermore, in the finite element models, the material softening laws with Tsai–Wu failure criteria have been implemented using user defined subroutines USDFLD (User subroutine to redefine field variables at a material point) of Abaqus (Version 6.11, Dassault systemes simulia Corp, Providence, RI, USA, 2011).
For a micromechanical analysis, the properties of fibers are essential, the material data of 12K Toray T700 50C are used in the analysis of this paper as shown in Table 1. The elastic data are cited from Reference [13], tensile strength is obtained from data sheet of the fiber manufacturer, compressive strength are calculated with an empirical correction k = 0.8, and the empirical correction is determined according to the ratio of compressive strength and tensile strength of T300 fiber, the data are summarized in the World-Wide Failure Exercise [22].

3.3.2. Elastic-Plastic Material Model for Epoxy Resin

This elastic-plastic material model is intended to describe the mechanical performance of the pure resin, such as, the matrix in micromechanical model and the resin-rich zone in mesomechanical model. The elastic properties of resin (Epoxy resin Epikote 828) are obtained from Reference [13]. The plastic deformation and failure data of Epikote 828 are obtained from References [23,24]. In summary, the matrix properties utilized in this paper are presented in Table 2.
To account different yielding behavior under uniaxial tension, uniaxial compression and shear, the von Mises criterion and the Drucker-Prager yield criterion are chosen. The von Mises are used to define the yield and inelastic flow behavior of a metal at relatively low temperatures. In this paper, this criterion is applied to describe the tensile behaviors of the epoxy resin. The Drucker-Prager criterion is applied to model the failure behavior of the pure matrix materials under compression and shear load. Marklund [2] has proved that using this criterion to predict failure of matrix materials is feasibility, and the two criteria are readily available in Abaqus.

3.3.3. Failure Model for Composites Tows

A 3D progressive failure model [21] is used to predict the final failure of composites tows. This failure model connects the material elastic properties with internal state variables that functions of the type of damage. Before the local structural failures develop, the composite tows typically behave are considered as linear elastic manner, and the constitutive relations for undamaged are given by Equation (4).
To detect the onset 3D failure including fiber direction failure and transverse direction failure, the modified Hashin failure criterion is used. In each direction, the tensile and compressive failures are handled separately. The failure modes are modified for the case of 3D Stress as follow.
Fiber failure mode [25],
σ 11 > 0 f ft = ( σ 11 X T ) 2 + ( τ 12 S 12 ) 2 + ( τ 13 S 13 ) 2 ; f f t 1
σ 11 < 0 f fc = ( σ 11 X C ) 2 ; f fc 1
Matrix failure mode,
σ 22 > 0 f mt = ( σ 22 Y T ) 2 + ( τ 12 S 12 ) 2 + ( τ 23 S 23 ) 2 ; f mt 1
σ 22 < 0 f mc = ( σ 22 Y C ) 2 + ( τ 12 S 12 ) 2 + ( τ 23 S 23 ) 2 ; f mc 1
where S12, S13 and S23 are the strength for shear in 1–2 plane, shear in 1–3 plane and shear in 2–3 plane, respectively. τ12, τ13 and τ23 are the shear stress in 1–2 plane, shear in 1–3 plane and shear in 2–3 plane, respectively. σ11 and σ22 are normal stress in 1-direction and 2-direction, respectively. fft and ffc, are the failure indices for fiber tension and fiber compression, respectively. fmt is the failure indices for matrix tension or shear cracking. fmc is the failure indices for matrix compression or shear cracking.
The material stiffness changes, after local failures within the tows. The effects of damage on the stiffness of the tows are represented using internal state variables. These state variables associated with crack density under loading, a more detailed description is given in [21].
The progressive failure model is implemented as a user-defined material model using Abaqus user interface UMAT (user subroutine to define a material’s mechanical behavior). In this procedure, a nonlinear analysis is performed until a converged solution is obtained.

4. Results and Discussion

The stiffness and strength of QNCF lamina are obtained using the meso-scale analysis procedure. The numerical predictions of QNCF lamina are compared with the experimental results of the non-crimped UD laminate in Reference [13]. In the experiment, mechanical properties of non-crimped UD specimens with warp-knitted was reported, however, that is just one the types of UD specimens mentioned in this paper.
In this section, E 1 t , E 2 t , E 3 t , G 12 t , G 13 t , v 12 t , and v 13 t are the elastic properties of the composite tows for tensile in 1-direction, tensile in 2-direction, tensile in 3-direction, shear in 1–2 plane, shear in 1–3 plane, Poisson’s ratio in 1–2 plane and Poisson’s ratio in 1–3 plane, respectively. X T t , X C t , Y T t , Y C t , and S 12 t are the strength of composite tows for tension in 1-direction, compression in 1-direction, tension in 2-direction, compression in 2-direction and shear in 1–2 plane, respectively. E 1 l is the longitudinal Young’s modulus of QNCF lamina, and E 2 l is the transverse Young’s modulus of QNCF lamina, and v 12 l is the Poisson’s ratio in 1–2 plane of QNCF lamina and G 12 l in the in-plane shear modulus of QNCF lamina. X T l , X C l , Y T l , Y C l , and S 12 l are the strength of QNCF lamina for tension in 1-direction, compression in 1-direction, tension in 2-direction, compression in 2-direction and shear in 1–2 plane, respectively.

4.1. Mechanical Properties of the UD Composite Tows

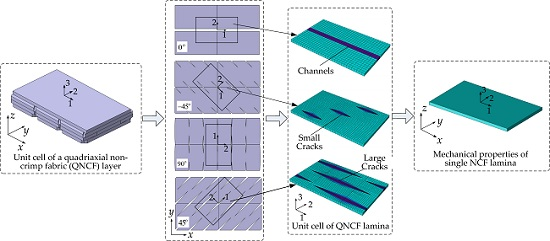
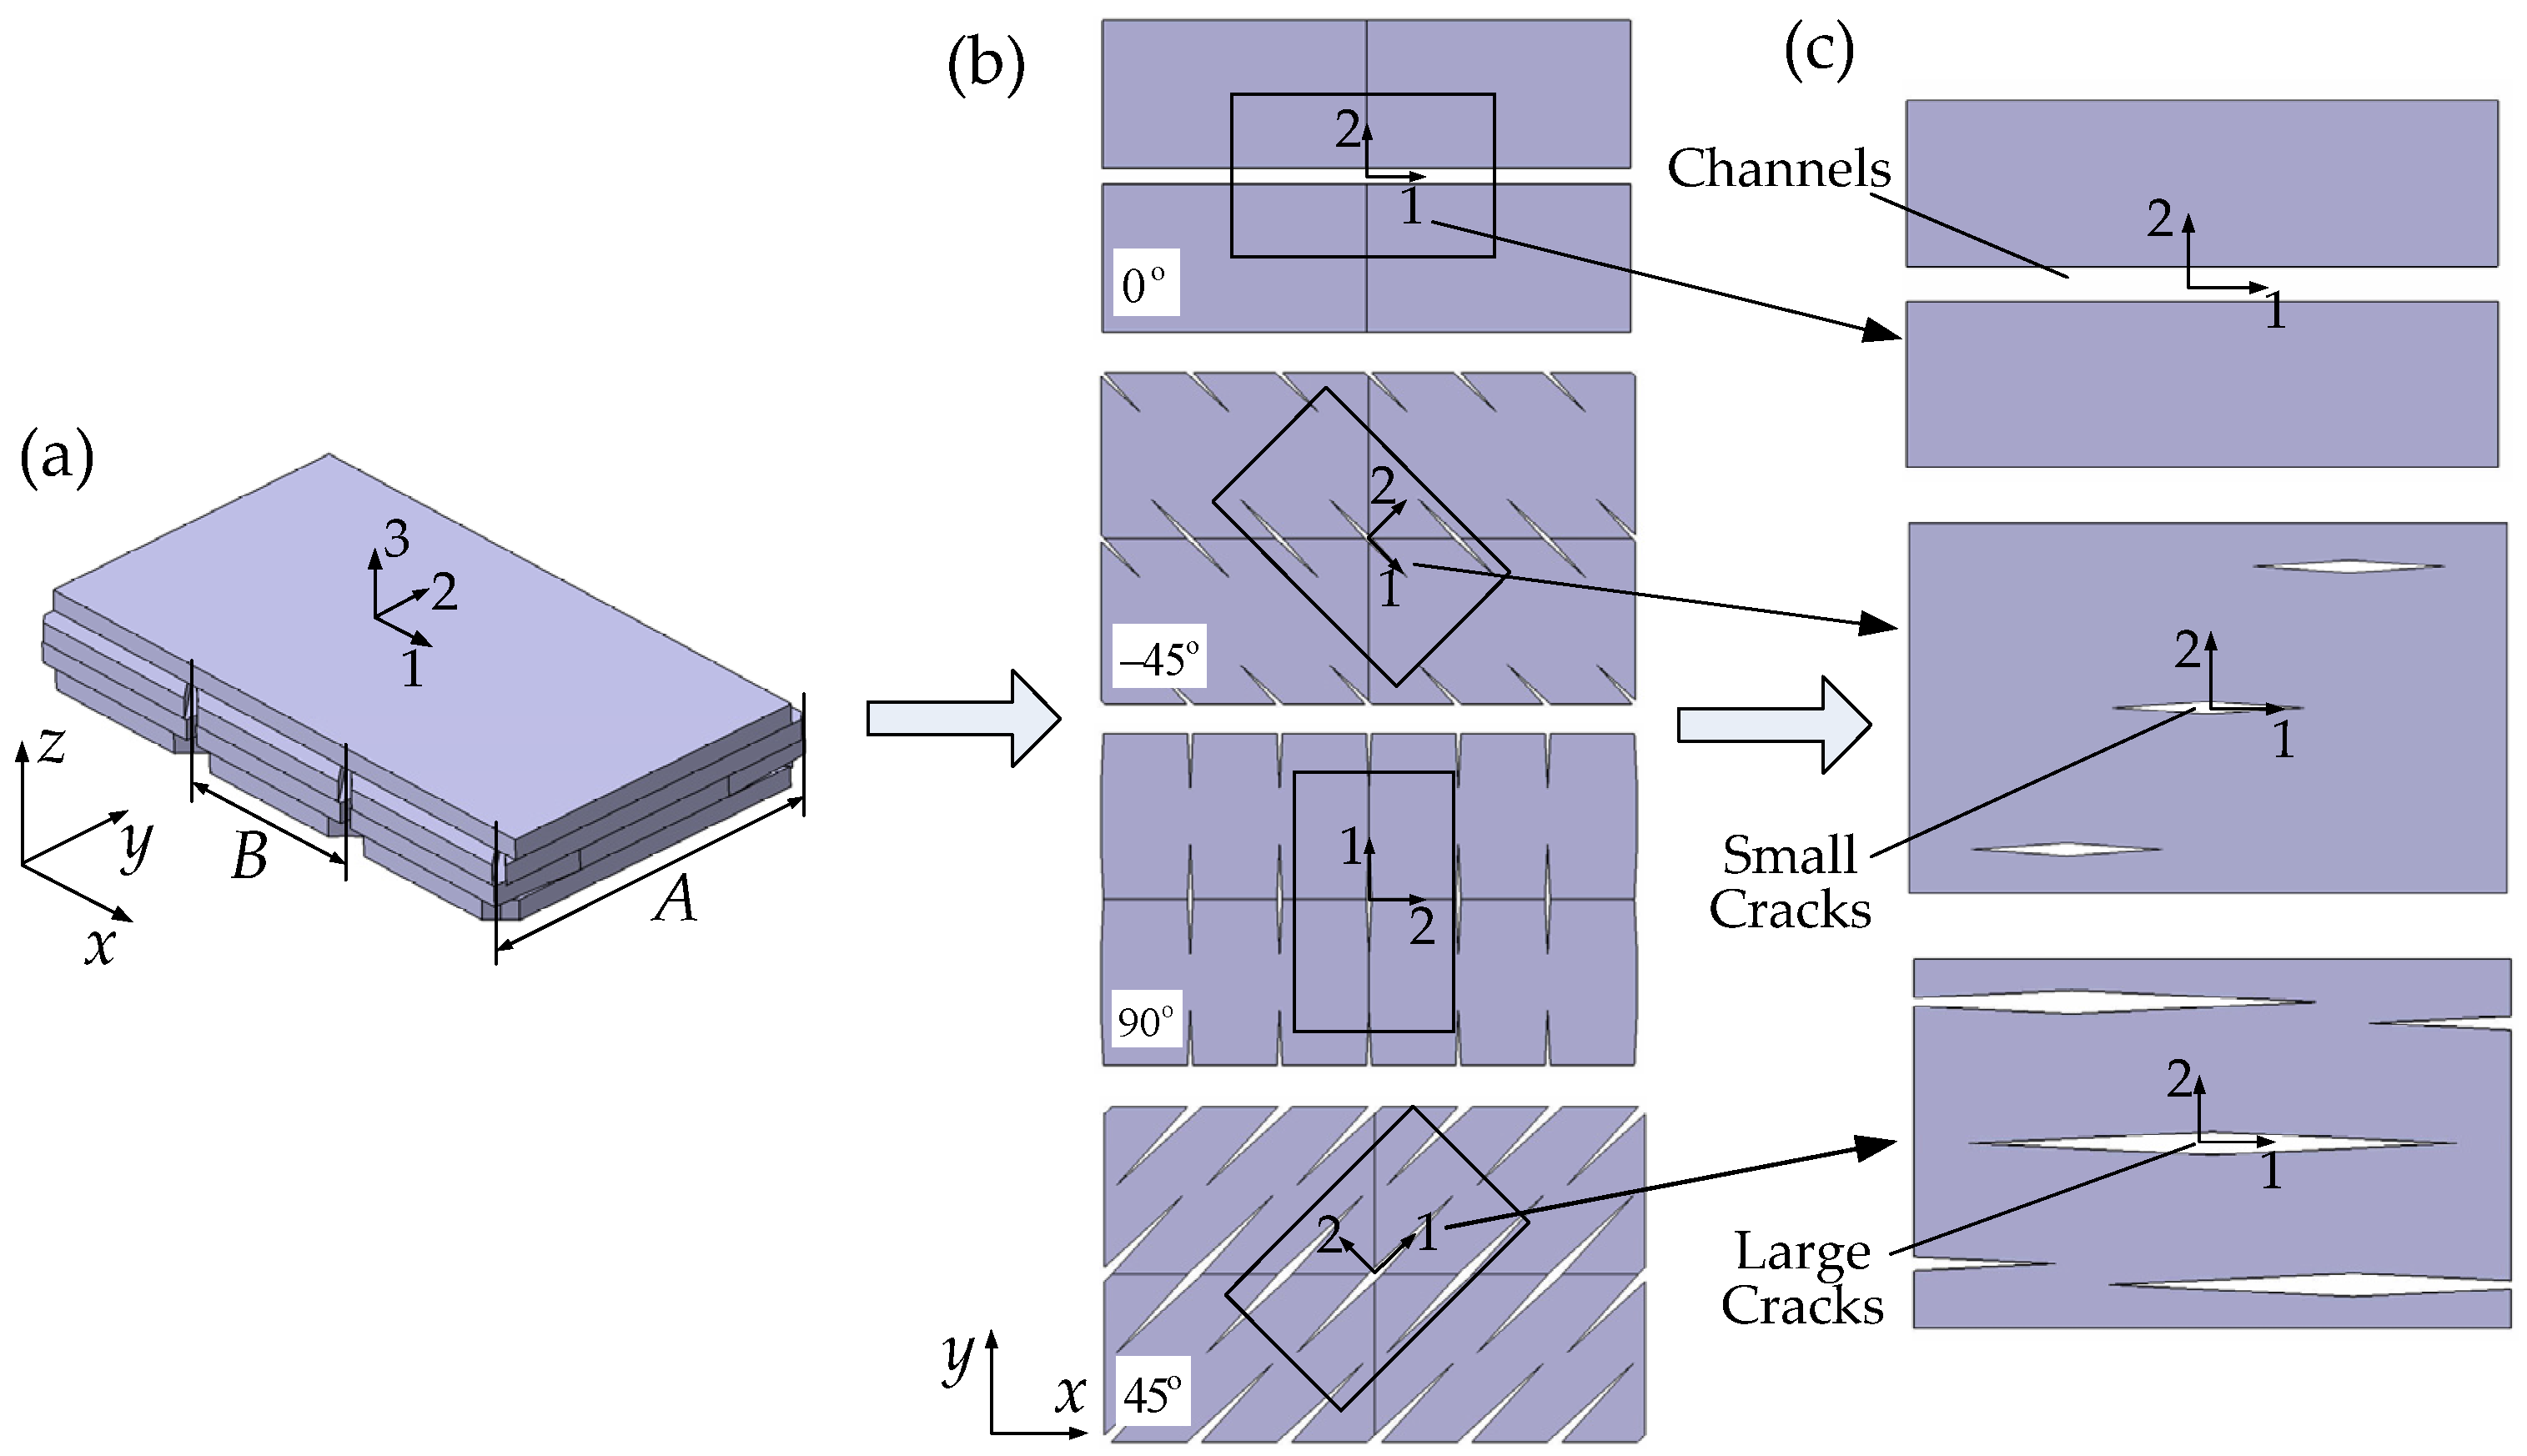
In QNCF lamina, the area except for resin-rich zones can be considered as UD composites, and V f t of the outer and inner plies are different. The QNCF fabric laminate to be analyzed by the mechanical models with V f l = 42.1%. This fiber volume fraction is experimental measurements values in Reference [13]. In this case, according to Equation (1), V f t is shown in Table 3. As the diameter of inner stitching yarn for the QNCF layer is small, the volume of the resin-rich zones is about 3.34% of the total volume of the NCF lamina, which contributes to V f t in the inner −45° and 90° lamina close to V f l as shown in Table 3. In addition, the stitching yarn can cause obvious fiber cracking in the outer 45° and 90°, which makes V f t in outer layer higher than that in inner layer.
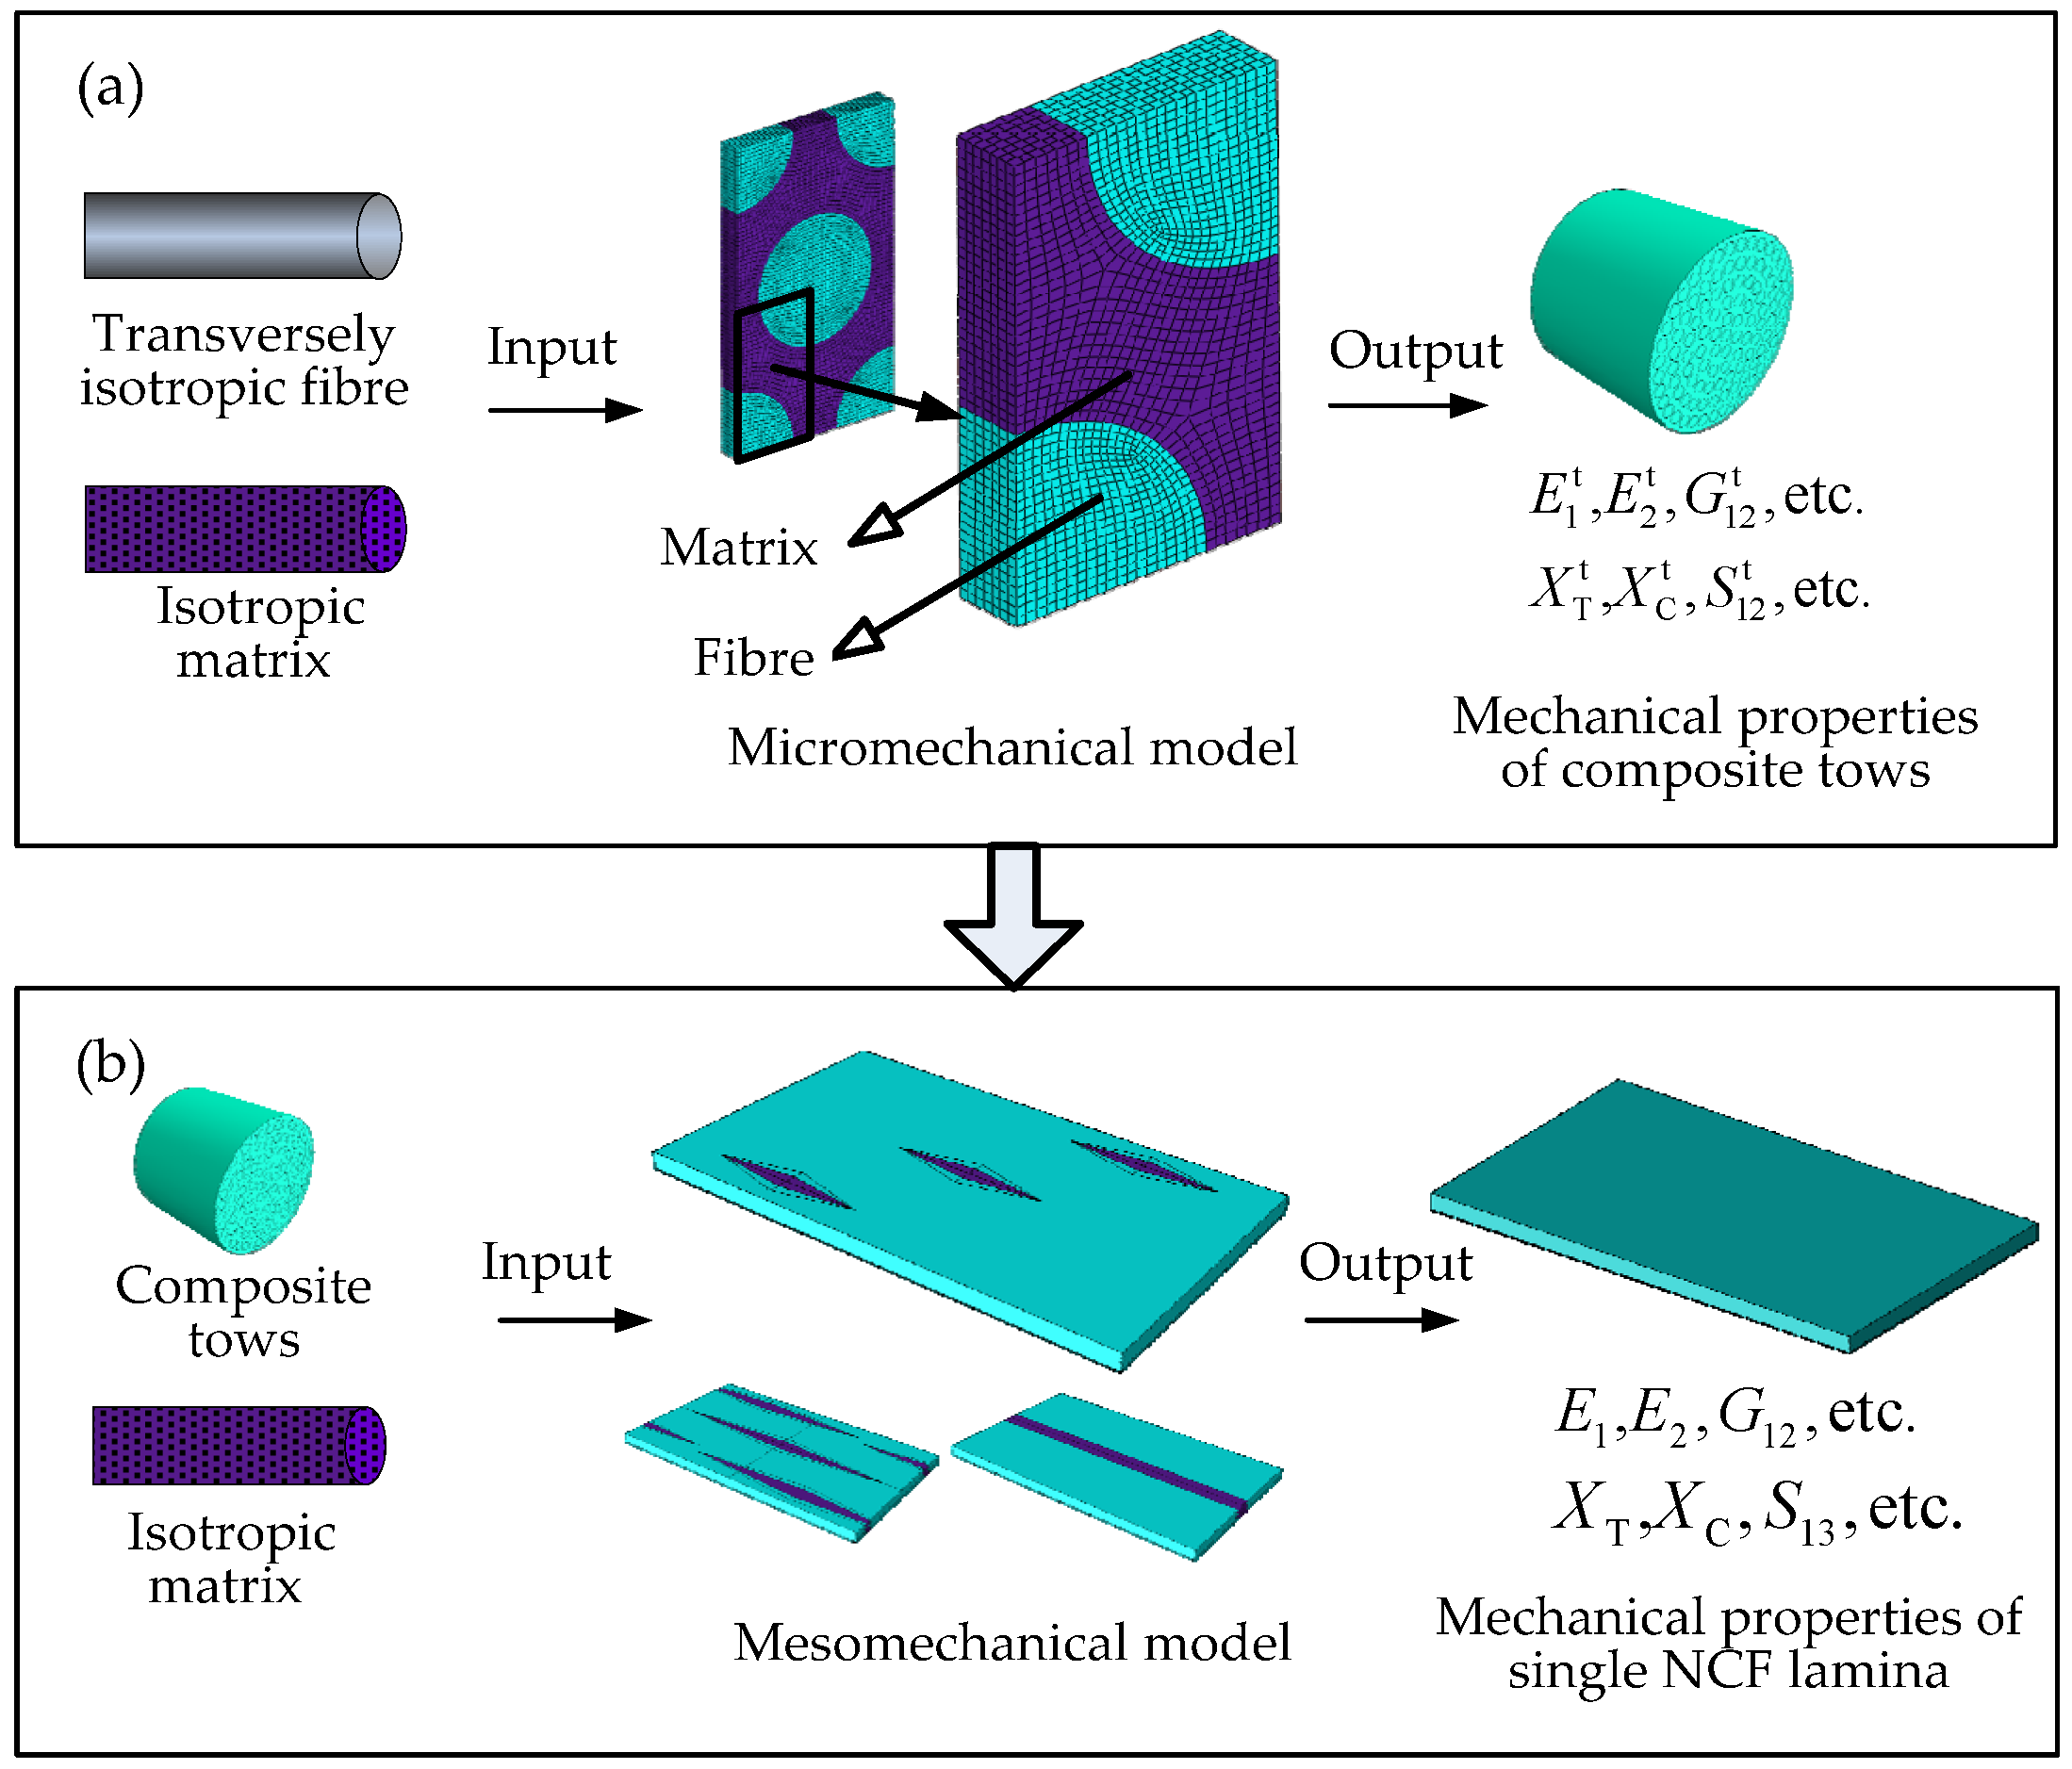
The mechanical properties of composite tows obtained with the micro-scale analysis procedure are shown in Table 4. E 1 t , E 2 t , G 12 t , v 12 t , and v 23 t are calculated by the numerical homogenization method, and E 3 t and G 23 t are determined by transversely isotropic material assumption. The stiffness properties of the UD tows estimated by an averaging technique based on the rule of mixtures (RM) [26] is also given in Table 4. This analytical model can calculate the value of E 1 t and v 12 t , but has a less accurate result for G 12 t and E 2 t because of the assumption of rectangle section for fiber. Therefore, the analytical values of E 1 t , v 12 t are used in this section.
According to Table 4, it is clear that the results obtained using the numerical models are consistent with those obtained using the RM. Among the unit cells, composite tows in Cell A has the highest fiber volume fraction ( V f t = 48.1 % ), correspondingly, the longitudinal Young’s modulus of the tows is also higher than the other two cases. This is because the longitudinal Young’s modulus of composites is a fiber-dominated property. For the numerical predictions of E 2 t and G 12 t , the tows with high local fiber volume fraction also has a larger transverse and shear modulus compared with low fiber volume fractions. This can be interpreted that although the transverse and shear modulus of UD composite materials are matrix-dominated, the fiber volume fraction, the ratio of matrix property and fiber property also affects the modulus simultaneously [26].
“Ref-RM” is reference value obtained with the rule of mixtures, and “Ref-FEM” is reference value obtained by micromehanical model for UD un-stitched composites, and “In Cell A”, “In Cell B” and “In Cell C” mean that the composite tows in Cell A, Cell B and Cell C, respectively.
The numerical predicted strength properties of composite tows with different fiber volume fractions are shown in Table 5. The analytical values of X T t and X C t based on the RM are also presented for a comparison. The analytical values are obtained by Equations (20) and (21). The existing simple analytical models cannot accurately predict transverse strength and shear strength at the micromechanical level. Therefore, the analytical results of Y T t , Y C t , and S 12 t are not presented here.
X T t = X fT [ V f t + V m t E m E f 1 ]
X C t = X fC [ V f t + V m t E m E f 1 ]
where V m t is the matrix volume fraction of composite tows.
Compared with the reference values (Ref-RM), the numerical predictions value (Ref-FEM) X T t and X C t of composite tows are decreased by 14.5% and 27%, respectively. Although the difference is obvious, considering that the RM is less accurate in the prediction of strength than the predicting of elastic properties, this comparison just illustrates the possible strength value of this material with different volume fraction. Therefore these strength properties of UD tows obtained by micromechanical model still can be used for the calculation of the meso-scale model, and this paper compares the numerical predicted and experimental values on the mesoscale.

4.2. In-Plane Stiffness of QNCF Lamina

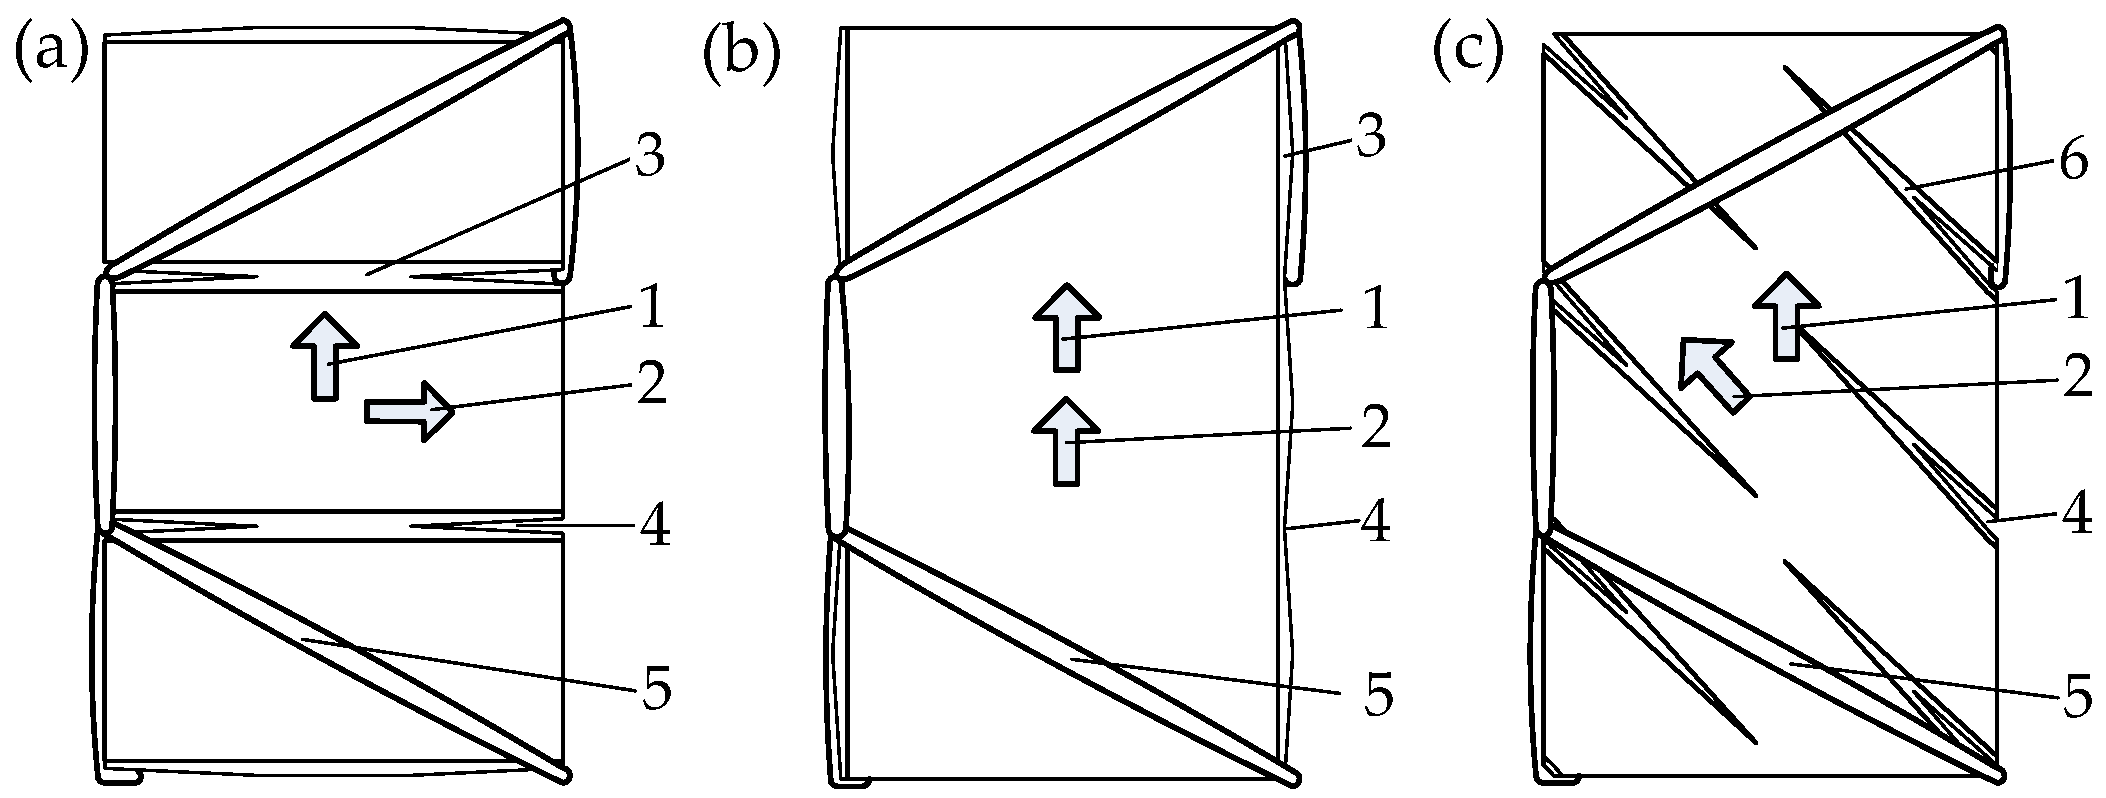
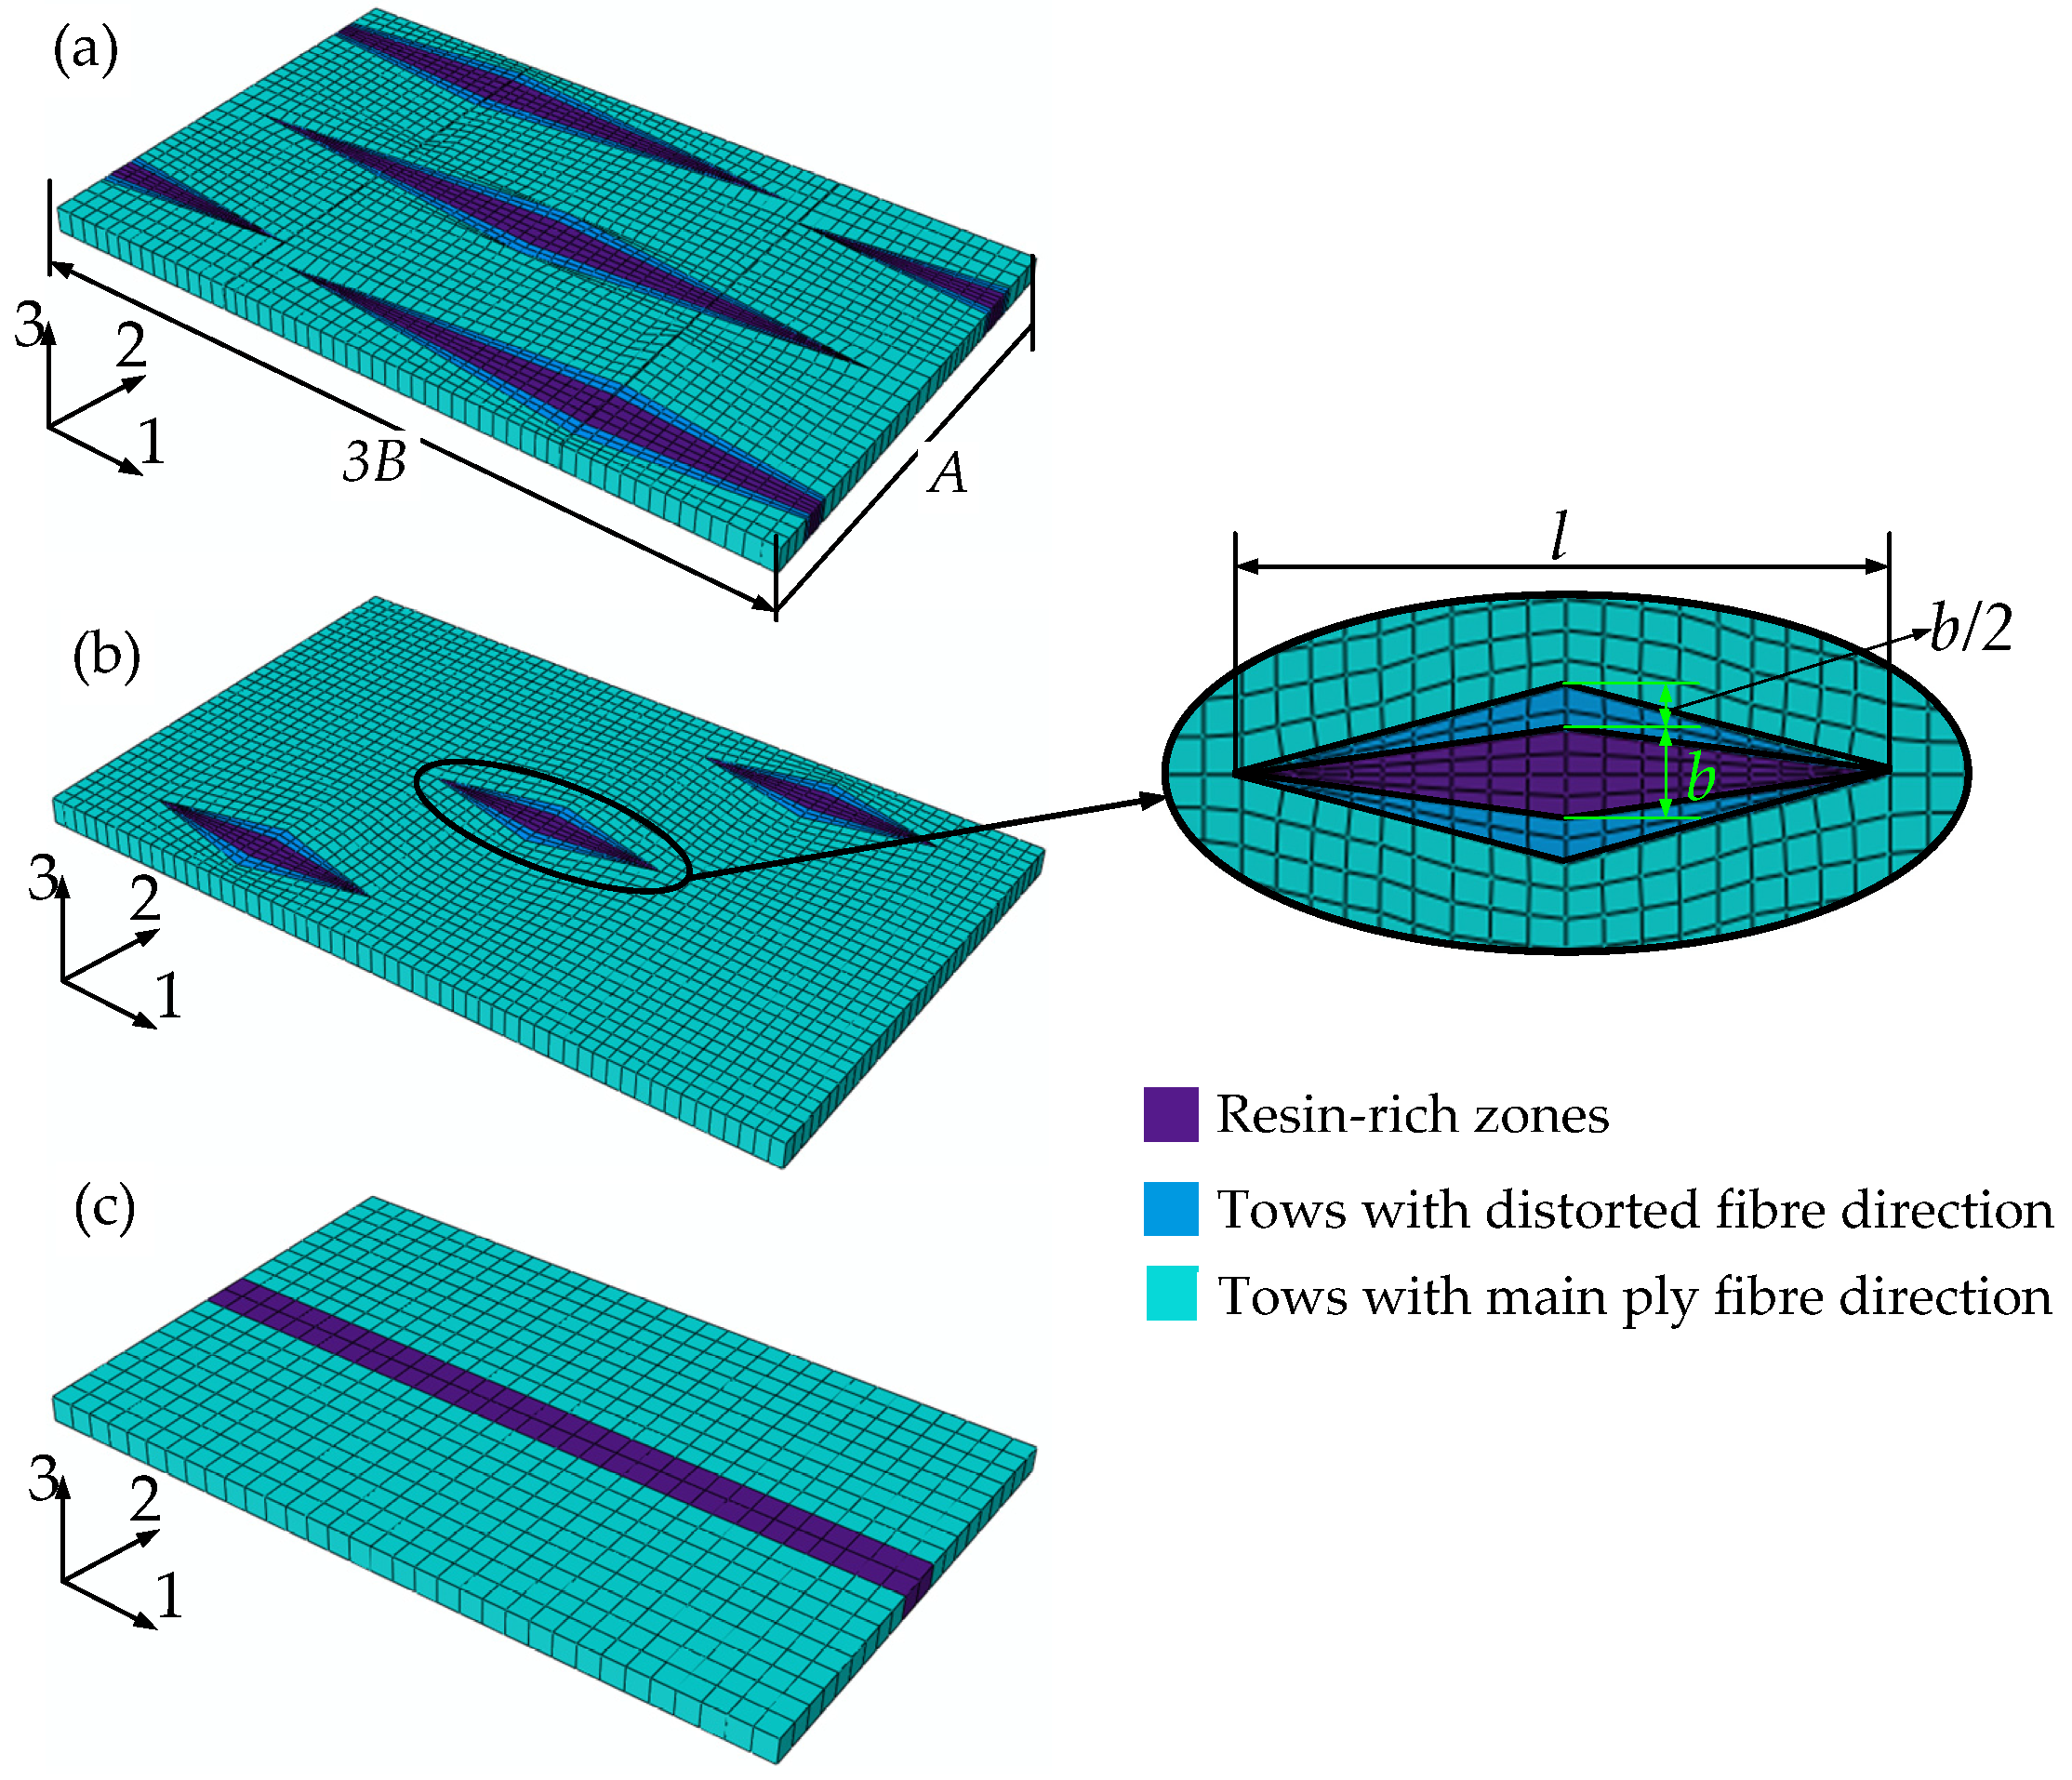
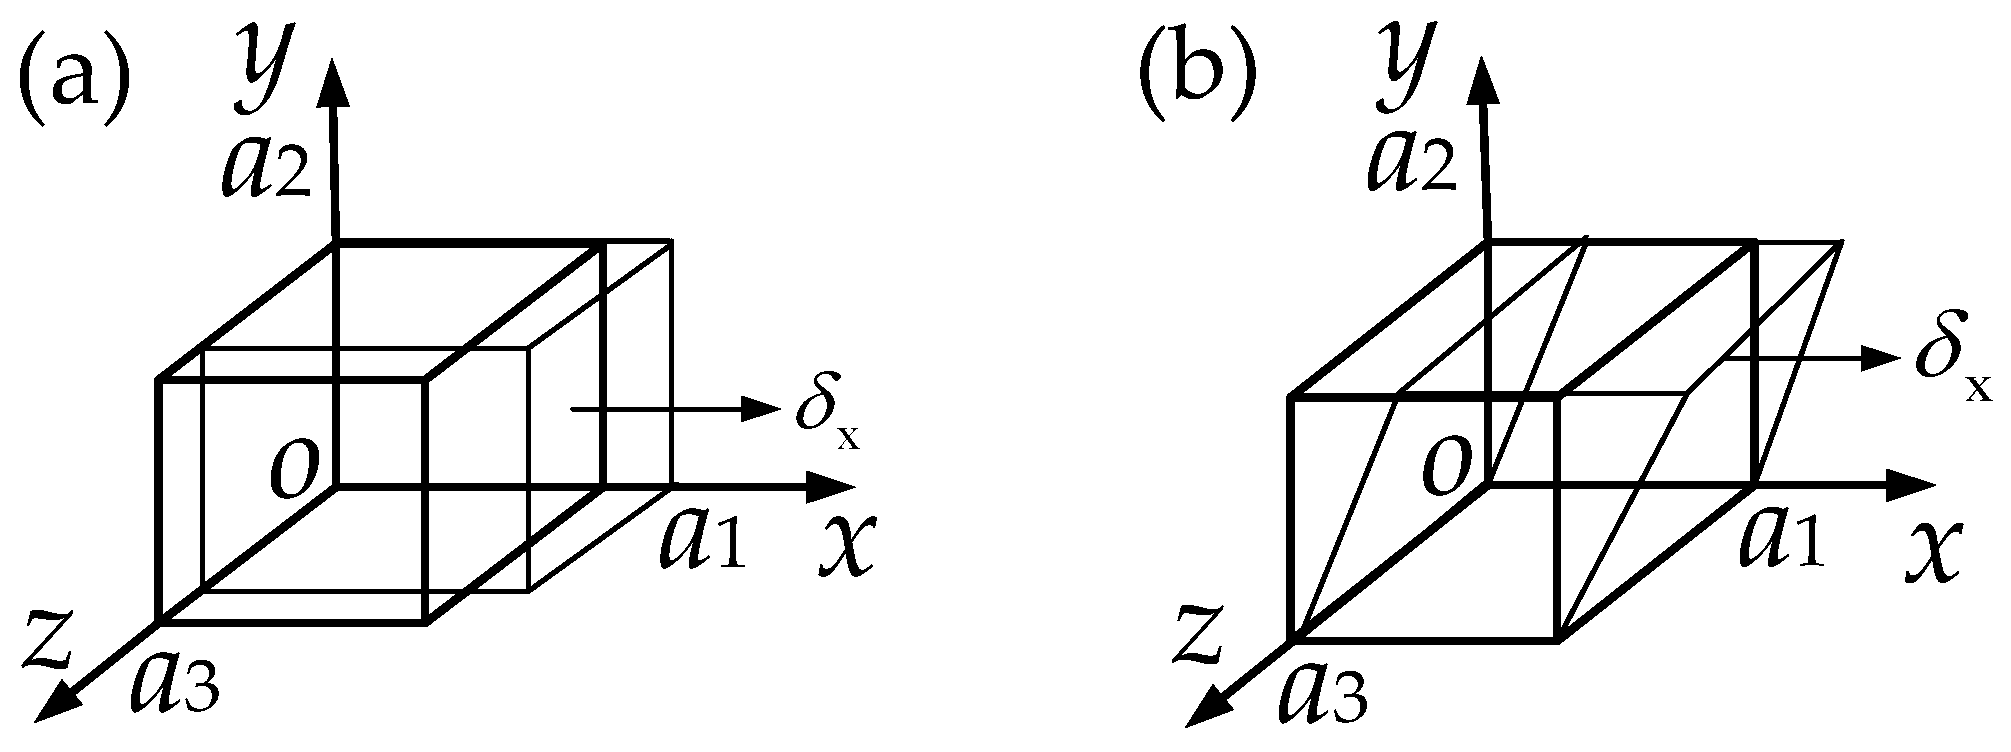
According to the inter-structure of QNCF lamina, three kinds of unit cells have been established. Certainly, the predicted results with any of the three unit cells cannot represent the actual values. As the method of taking data average is commonly used in the data processing of composite stiffness test, the averaged value of the predicted results employing the three unit cells is taken as stiffness properties of the QNCF lamina.
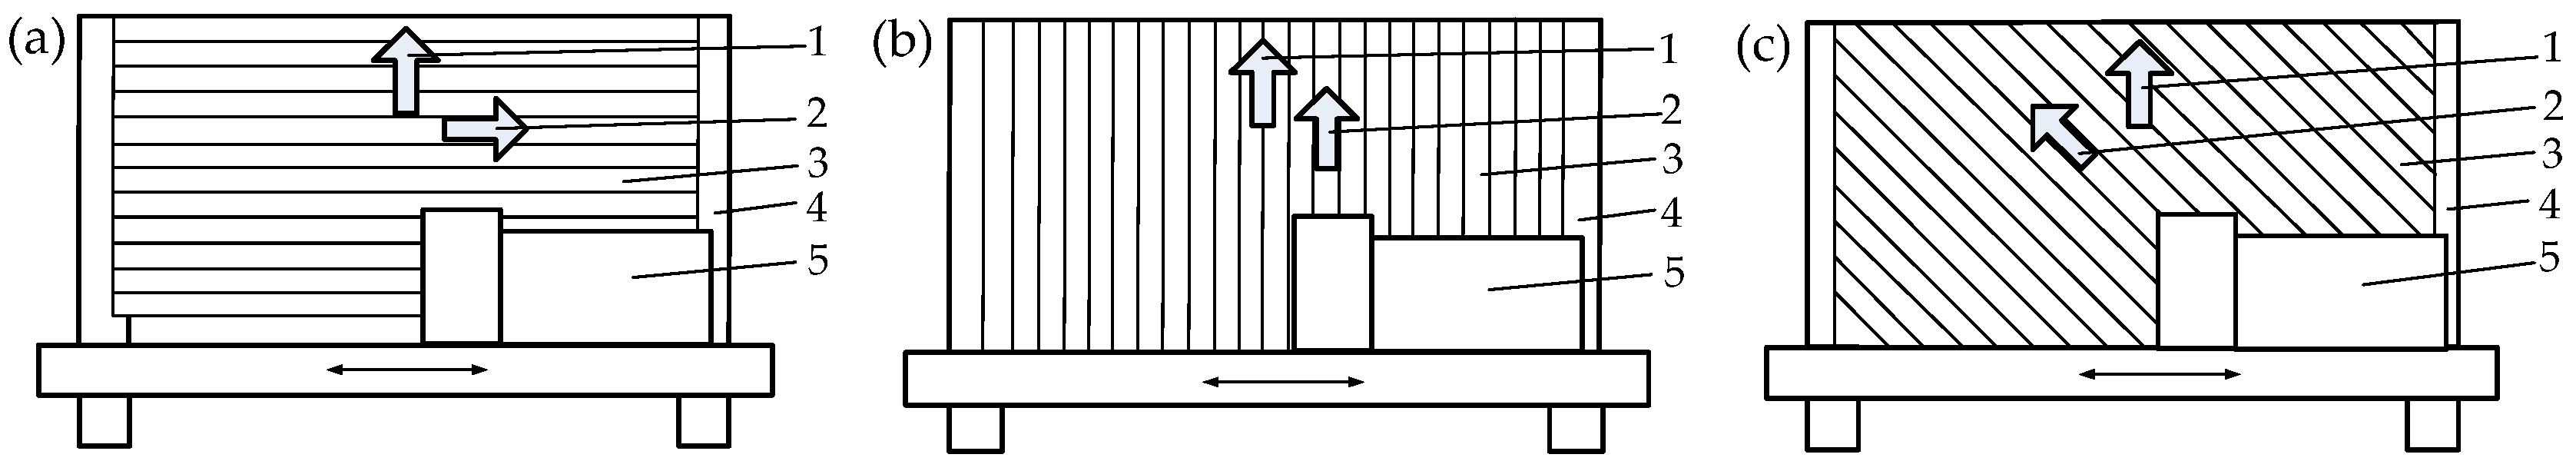
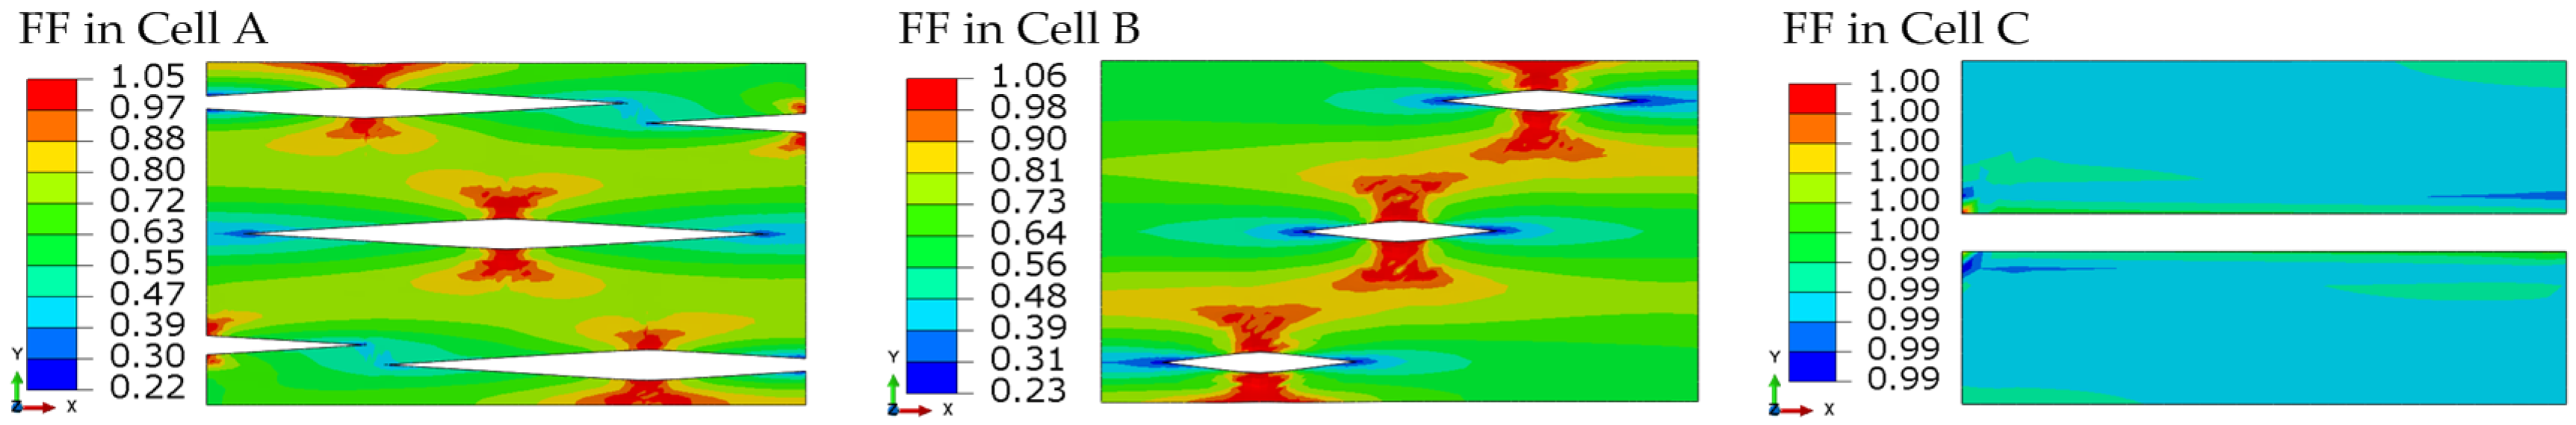
The displacement load is applied on the surface of the three kinds of representative volume elements, and the deformation and stress distribution of the three unit cells are shown in Figure 7.
The estimated in-plane effective engineering constants E 1 l , E 2 l , v 12 l , and G 12 l are listed in Table 6. The averaged stiffness of the three unit cells and the numerical homogenization results obtained by micromechanical model for UD composite tows are also presented in Table 6 as a reference.
The averaged stiffness obtained with the three unit cells are in a good agreement with experimental results. The elastic data of UD laminate test in Reference [13] are used in this comparison. The average value of E 1 l and v 12 l are 0.9% and 6.3% higher than the corresponding experiment results, respectively, and the average value of G 12 l is 5.3% lower than the test value. Considering that, the procedures for predicting the stiffness is done in the linear elastic range of the material, and the stiffness of the constituent materials attributed to the numerical calculation are experimental data, and reasonable boundary conditions are used in the numerical homogenization method, which make it possible to get a relatively accurate results.
When we compare the average value with the reference value (Ref-FEM), as shown in Table 6, E 1 l is reduced by 3.34%, but this difference is not significant. The maximum difference of E 1 l is about 4.8% among the three unit cells. To consider the same averaged fiber volume fraction, this difference in the elastic properties could be caused by fiber distortion. This result is consistent with the view of Reference [13], which concluded that absence of a significant difference in stiffness between experimental results and classical laminate theory predictions. We confirm this conclusion by multiscale analysis. Stitch yarn induces the localized crack in the fibrous ply. If the width of the localized crack is seen as the amplitude of fiber waviness, the amplitude of a single crack (for large crack, b = 0.48 mm) accounts for 9.5% of the unit cell width (A = 5.07 mm). With a constant fiber volume fraction, these localized in-plane cracks are such small amplitude and waviness angle that effect on stiffness might be not obvious. Stitching has minor effect on the in-plane stiffness of continuous plies, which is different from traditional conclusions. It is generally considered that the stitching can reduce the in-plane stiffness by 10%–20% [15,27], these contrary conclusions may only be applicable for stiffness of the open structure NCF composite.
For E 2 l and G 12 l , the average values are almost the same as the reference values (Ref-FEM in Table 6): they are reduced by 1.7% and 1.3% compared to the reference values, respectively. The transverse and shear modulus of the QNCF lamina are separately close to the UD. The possible reason for this phenomenon is that the stitch yarn induces fiber distortion, which occurs in the direction of fiber tows, and the transverse and shear modulus of composite materials are matrix-dominated. Moreover, considering that there is no change in matrix properties, the difference between the predictions employing the three unit cells and the reference value is not obvious.

4.3. In-Plane Strength of QNCF Lamina

The in-plane strength is predicted by meso-scale failure model. The progress failure model is introduced in Section 3.3.3 that used to predict the failure of composite tows. The von Mises criterion and the Drucker–Prager yield criterion are introduced to predict the failure of the resin pocket under different loads. Failure analysis is performed by the Abaqus commercial FE code combined with the user subroutine UMAT, axial displacement load and in-plane shear load are applied on the surface of the unit cells, and then the predictions of in-plane strength are listed in Table 7.
The strength data of non-crimp UD laminate that tested in Reference [13] are used in this section as a comparison. Each of these three unit cells represents a QNCF lamina, and the predicted strength of each unit cell represents possible values of the QNCF lamina. For these reasons, the individual prediction of each unit cell and average value are both compared with experimental results. Similar to that described above, the averaged value of the predicted results is taken as strength properties of the QNCF lamina.
Compared with the experimental results in reference [13], the average value of X T l obtained using the above three unit cells is 11.4% higher than the experimental results. 
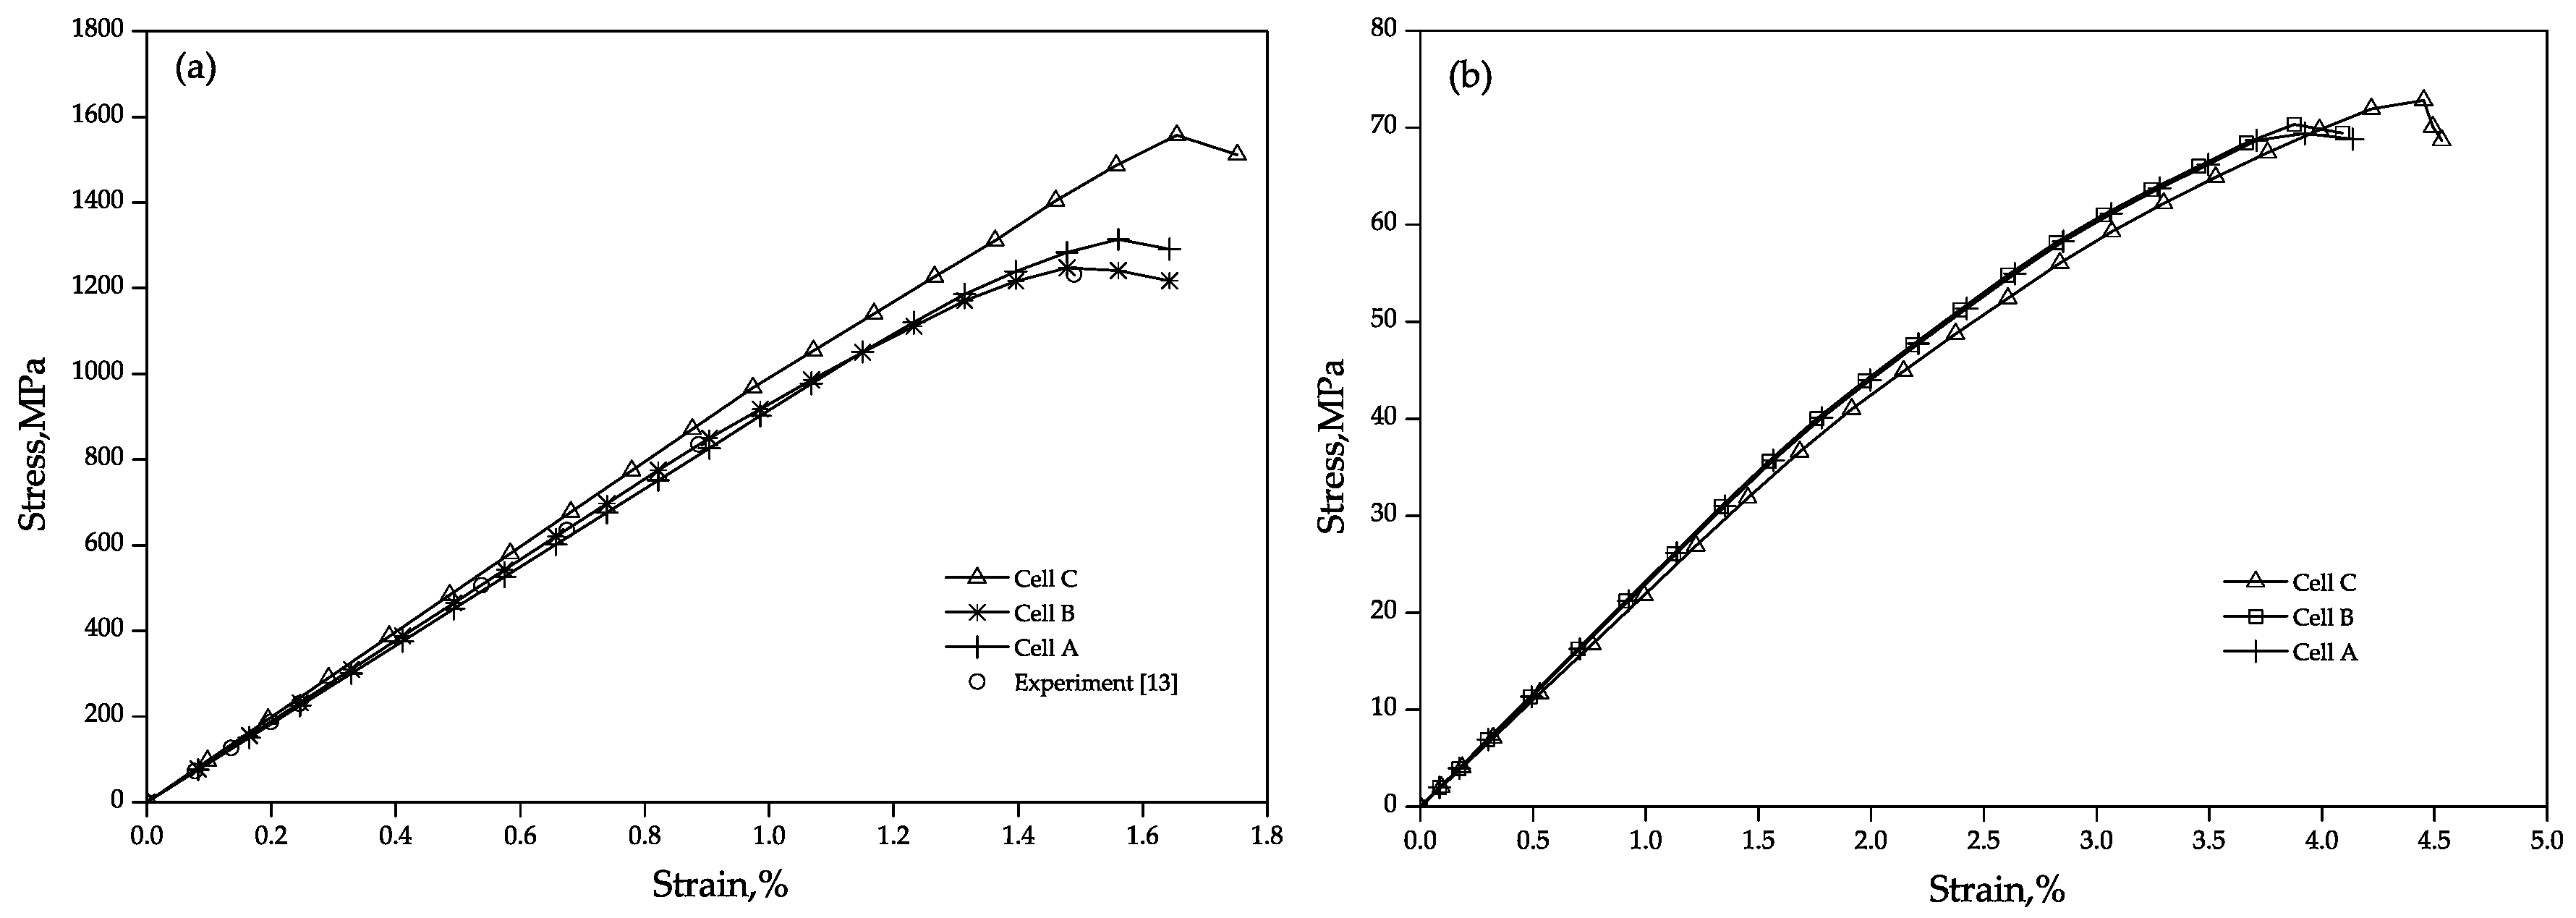
Figure 8 shows the fiber tension failure modes in the unit cells and Figure 9a presents the stress-strain response of the unit cells subjected to uni-axial tension parallel to fiber. As shown in Figure 9a, the numerically determined curves agree well with the experiment, although a slight overestimate of the tensile strength is observed.
Although fiber reinforced composite materials are often considered as brittle materials, a certain non-linear behavior is observed in Figure 9a. This non-linear behavior is caused by material stiffness degradation after local failures within the composite tow. In fact, the test data in Reference [13] also have a stiffness reduction. For non-crimp UD laminate in the test, the initial Young’s modulus is 94.3 GPa, and Young’s modulus is 82.8 GPa in the end of the test. It can be concluded that stiffness of the laminate is reduced by 12.2% at the ultimate failure.
As shown in Figure 9a, the curves of Cell A and Cell B have more obvious stiffness reduction compared with that of Cell C. This result can be explained by the rhomboidal cracks in the laminas which are more likely to cause stress concentration compared with the channels in the 0° lamina. The QNCF layer discussed in this work is composited with four laminas, and three laminas are provided with the cracks, so the lamina with the cracks is more representative of the actual stress state. Compared with Cell C, Cell A and Cell B are unit cells with cracks, thus the numerical predictions employing these two kinds of unit cells are closer to the experiment values.
From Table 7, Y T l is 15.3% higher than test value, and the average shear strength is close to test value. For composite tows under shear loading, the nonlinear behavior of material should be considered in failure analysis. Generally, this nonlinear behavior is caused by micro crack and plasticity of matrix. According to the failure model above, the internal state variables of material degradation are used to analyze the combined influence of the two factors. The engineering analysis method is also used in Reference [21] to predict matrix shear cracking. Based on this method, the stress-strain response of the unit cells subjected to simple shear load are shown in Figure 9b. The stiffness decreased about ε = 1.8 % due to local damage in matrix according to Figure 9b. After elastic range, the nonlinear curves are obtained. With the progressive damage method, reasonable shear behaviors are obtained. However, since mechanical properties of the fiber/matrix interface are modeled perfectly in a conventional mesh, a high transverse strength value is predicted. Considering the dispersion parameters of strength of composites and the reference experiment is only for one type of non-crimped UD specimen, therefore, the three unit cells given here can predict in-plane strength of the QNCF lamina with sufficient engineering accuracy.
As can be seen in Table 7, in the fiber direction, the longitudinal tensile strength X T l obtained by employing Cell B with fiber waviness is 19.8% lower than Cell C, and the average value of X T l is 23.4% lower than the reference value (Ref-FEM). For longitudinal compressive strength X C l , the maximum difference among the three unit cells reaches to 28.0%. Generally, the differences between mechanical properties obtained using the cells with fiber waviness and the cell with no waviness are quite obvious. The average value can still be reduced by approximately 20% relative to the reference value. Considering the same volume friction of the three unit cells, this difference could be caused by the local stress concentration, which is a result of fiber waviness induced by the stitch yarn in this material. This difference between the three unit cells or difference between the average value and the reference value is obvious. Moreover, this may explain the results of Bibo [14] who found that the tensile strength of NCF composite is 34.7% lower than the UD composites and the compress strength is 40% lower than the UD, which is caused by the effect of the stitching in the materials.
The difference of Y T l or Y C l between the three unit cells and the corresponding reference value (Ref-FEM) is not obvious, S 12 is also a similar trendy. This indicates that fiber disturbance has no significant effect on the strength in the direction transverse to the fibers. According to the failure mechanism, the transverse strength and shear strength are also matrix-dominated, and it has little relation with the strength of the fiber itself. Therefore, the changes of transverse and shear strength of NCF lamina caused by fiber disturbance are insensitivity.

5. Conclusions

From the view of mechanical properties of single non-crimp fabric (NCF) lamina, the in-plane stiffness and strength of quadriaxial non-crimp fabric (QNCF) composites and the effect of in-plane fiber distortion on mechanical properties are estimated. A new modeling strategy for the meso-scale features of QNCF is presented. The idea of this modeling approach is derives from the testing method of mechanical properties of single NCF lamina. According to this idea, the complex inter-structure of QNCF is decomposed into some individual ply, and the unit cells along fiber direction are selected. This simplified engineering modeling approach can improve the efficiency of modeling in multiscale analysis of QNCF. Furthermore, it can be used to create an equivalent continuum model for continuous plies NCF at macroscale level, such as engineering models based on semi-laminar consideration. In accordance with this modeling strategy, the stiffness and strength of composites are evaluated on the meso-scale, and the following results are obtained.
(1)
The modeling strategy based on mechanical properties of single NCF lamina can be used to evaluate in-plane stiffness and strength of QNCF composite lamina. The E 1 l , G 12 l , and S 12 l are in agreement with experimental results; v 12 l is 5.9% higher than experimental results; and X T l , Y T l are 11.4%, 15.3% higher than test value, respectively.
(2)
The effects of in-plane fiber distortion, induced by the stitch yarn on longitudinal elastic modulus, is not significant, and modulus of the QNCF lamina has a difference of 3.34% compared with the same type UD un-stitched composites. This conclusion on the stiffness of QNCF composites is different from the open structure NCF composite in which the stitching may reduce in-plane elastic properties by 10%–20%. In addition, stitching induces an assignable effect on longitudinal strength of QNCF lamina, and has only slight effect on transverse stiffness and transverse strength of the materials.

Acknowledgments

The first author is thankful to Fuqiang Yang and Dongping Zhao for English revisons. Additionally, the authors would like to thank the three anonymous reviewers and associate editors for their valuable comments.

Author Contributions

Y.C. conducted the research and wrote the paper; Y.F. and W.W. supervised the research and helped in the preparation of manuscript; D.W. and Z.Z. contributed data analysis work and revision of this paper.

Conflicts of Interest

The authors declare no conflict of interest.

References

  1. Lomov, S.V. Understanding and modelling the effect of stitching on the geometry of non-crimp fabrics. In Non-Crimp Fabric Composites: Manufacturing, Properties and Applications; Lomov, S.V., Ed.; Woodhead: Cambridge, UK, 2011; pp. 84–102. [Google Scholar]
  2. Marklund, E.; Asp, L.E.; Olsson, R. Transverse strength of unidirectional non-crimp fabric composites: Multiscale modelling. Compos. Part B Eng. 2014, 65, 47–56. [Google Scholar] [CrossRef]
  3. Lomov, S.V.; Verpoest, I.; Robitaille, F. Manufacturing and internal geometry of textiles. In Design and Manufacture of Textile Composites; Long, A.C., Ed.; Woodhead: Cambridge, UK, 2005; pp. 1–60. [Google Scholar]
  4. Lomov, S.V.; Belov, E.B.; Bischoff, T.B.; Ghosh, S.B.; Truong Chi, T.; Verpoest, I. Carbon composites based on multiaxial multiply stitched preforms. Part 1. Geometry of the preform. Compos. Part A Appl. Sci. Manuf. 2002, 33, 1171–1183. [Google Scholar] [CrossRef]
  5. Reddy, J.N. Mechanics of Laminated Composite Plates and Shells: Theory and Analysis, 2nd ed.; CRC: Boca Raton, FL, USA, 2004; pp. 111–113. [Google Scholar]
  6. Marklund, E.; Varna, J.; Asp, L.E. Modelling stiffness and strength of non-crimp fabric composites: Semi-laminar analysis. In Non-Crimp Fabric Composites: Manufacturing, Properties and Applications; Lomov, S.V., Ed.; Woodhead: Cambridge, UK, 2011; pp. 402–436. [Google Scholar]
  7. Ernst, G.; Vogler, M.; Huhne, C.; Rolfes, R. Multiscale progressive failure analysis of textile composites. Compos. Sci. Technol. 2010, 70, 61–72. [Google Scholar] [CrossRef]
  8. Zrida, H.; Marklund, E.; Ayadi, Z.; Varna, J. Master curve approach to axial stiffness calculation for non-crimp fabric biaxial composites with out-of-plane waviness. Compos. Part B Eng. 2014, 64, 214–221. [Google Scholar] [CrossRef]
  9. Edgren, F.; Asp, L.E. Approximate analytical constitutive model for non-crimp fabric composites. Compos. Part A Appl. Sci. Manuf. 2005, 36, 173–181. [Google Scholar] [CrossRef]
  10. Gonzalez, A.; Graciani, E.; Federico, P. Prediction of in-plane stiffness properties of non-crimp fabric laminates by means of 3D finite element analysis. Compos. Sci. Technol. 2008, 68, 121–131. [Google Scholar] [CrossRef]
  11. Ferreira, L.M.; Graciani, E.; Paris, F. Modelling the waviness of the fibres in non-crimp fabric composites using 3D finite element models with straight tows. Compos. Struct. 2014, 107, 79–87. [Google Scholar] [CrossRef]
  12. Zrida, H.; Marklund, E.; Ayadi, Z.; Varna, J. Effective stiffness of curved 0°-layers for stiffness determination of cross-ply non-crimp fabric composites. J. Reinf. Plast. Compos. 2014, 33, 1339–1352. [Google Scholar] [CrossRef]
  13. Truong, T.C.; Vettori, M.; Lomov, S.; Lomov, S.; Verpoest, I. Carbon composites based on multi-axial multi-ply stitched preforms. Part 4. Mechanical properties of composites and damage observation. Compos. Part A Appl. Sci. Manuf. 2005, 36, 1207–1221. [Google Scholar] [CrossRef]
  14. Bibo, G.A.; Hogg, P.J.; Kemp, M. Mechanical characterisation of glass- and carbon-fibre-reinforced composites made with non-crimp fabrics. Compos. Sci. Technol. 1997, 57, 1221–1241. [Google Scholar] [CrossRef]
  15. Ferreira, L.M. Study of the Behaviour of Non-Crimp Fabric Laminates by 3D Finite Element Models. Ph.D. Thesis, Universidad de Sevilla, Sevilla, Spain, 6 June 2012. [Google Scholar]
  16. Mikhaluk, D.S.; Truong, T.C.; Borovkov, A.; Lomov, S.V.; Verpoest, I. Experimental observations and finite element modelling of damage initiation and evolution in carbon/epoxy non-crimp fabric composites. Eng. Fract. Mech. 2008, 75, 2751–2766. [Google Scholar] [CrossRef]
  17. Ivanov, D.S.; Lomov, S.; Verpoest, I. Predicting the effect of stitching on the mechanical properties and damage of non-crimp fabric composites: Finite element analysis. In Non-Crimp Fabric Composites: Manufacturing, Properties and Applications; Lomov, S.V., Ed.; Woodhead: Cambridge, UK, 2011; pp. 360–383. [Google Scholar]
  18. Truong, T.C.; Ivanov, D.S.; Klimshin, D.V.; Lomov, S.V.; Verpoest, I. Carbon composites based on multi-axial multi-ply stitched preforms. Part 7: Mechanical properties and damage observations in composites with sheared reinforcement. Compos. Part A Appl. Sci. Manuf. 2008, 39, 1380–1393. [Google Scholar] [CrossRef]
  19. Barbero, E.J. Finite Element Analysis of Composite Materials Using Abaqus; CRC: Boca Raton, FL, USA, 2013; pp. 215–232. [Google Scholar]
  20. Sleight, D.W. Progressive Failure Analysis Methodology for Laminated Composite Structures; NASA, Langley Research Center: Hampton, VA, USA, March 1999.
  21. Camanho, P.P.; Matthews, F.L. A progressive damage model for mechanically fastened joints in composite laminates. J. Compos. Mater. 1999, 33, 2248–2277. [Google Scholar] [CrossRef]
  22. Soden, P.D.; Hinton, M.J.; Kaddour, A.S. Lamina properties, lay-up configurations and loading conditions for a range of fibre-reinforced composite laminates. Compos. Sci. Technol. 1998, 58, 1011–1022. [Google Scholar] [CrossRef]
  23. Jumahat, A.; Soutis, C.; Abdullah, S.A.; Kasolang, S. Tensile properties of nanosilica/epoxy nanocomposites. Procedia Eng. 2012, 41, 1634–1640. [Google Scholar] [CrossRef]
  24. Jumahat, A.; Soutis, C.; Mahmud, J.; Ahmad, N. Compressive properities of nanoclay/epoxy nanocomposite. Procedia Eng. 2012, 41, 1607–1613. [Google Scholar] [CrossRef]
  25. Zhou, Y.; Nezhad, H.Y.; Hou, C.; Wan, X. A three dimensional implicit finite element damage model and its application to single-lap multi-bolt composite joints with variable clearance. Compos. Struct. 2015, 131, 1060–1072. [Google Scholar] [CrossRef]
  26. Kollar, L.P.; Springer, G.S. Mechanics of Composite Structures; Cambridge University: Cambridge, UK, 2003; pp. 436–440. [Google Scholar]
  27. Athreya, S.R.; Ma, L.; Barpanda, D.; Jacob, G.; Verghese, N. Estimation of in-plane elastic properties of stitch-bonded, non-crimp fabric composites for engineering applications. J. Compos. Mater. 2014, 48, 143–154. [Google Scholar] [CrossRef]
Figure 1. The geometrical model of mesomechanical unit cell development for single quadriaxial non-crimp fabric (QNCF) lamina: (a) unit cells of a QNCF layer; (b) individual fibrous plies in the QNCF layer; and (c) geometrical model of unit cells of individual QNCF lamina.
Applsci 06 00267 g001
Figure 2. Schematic diagram of production different warp-knitted unidirectional non-crimp fabric (UD-NCF): (a) the production of 90° Layers; (b) the production of 0° layers; and (c) the production of 45° layers. 1—Process direction; 2—Fiber direction; 3—Thread; 4—Transport system; 5—Weft carriage system.
Applsci 06 00267 g002
Figure 3. Meso-scale geometrical model of unidirectional (UD) specimens with different angle between fiber direction and process direction: (a) 90°; (b) 0°; and (c) 45°. 1—Process direction; 2—Fiber direction; 3—Face channel; 4—Inner crack; 5—Stitching yarn; 6—Face crack.
Applsci 06 00267 g003
Figure 4. The workflow of multiscale analysis: (a) microscale; and (b) mesoscale.
Applsci 06 00267 g004
Figure 5. Finite element (FE) model of meso unit cells with different fiber distortion in the individual non-crimp fabric (NCF) lamina: (a) Cell A; (b) Cell B; and (c) Cell C.
Applsci 06 00267 g005
Figure 6. Two load cases for unit cells: (a) normal load: tension in x direction; and (b) shear load: shear in x-y plane.
Applsci 06 00267 g006
Figure 7. Deformed shape and contour plot of stress in different displacement loads.
Applsci 06 00267 g007
Figure 8. The fiber fracture (FF) failure modes in the unit cells under longitudinal tensile.
Applsci 06 00267 g008
Figure 9. Typical stress-strain curve of micromechanical non-crimp fabric (NCF) unit cells computations: (a) longitudinal tensile loads in 1-direction; and (b) shear in 1–2 plane.
Applsci 06 00267 g009
Table 1. The mechanical properties of fiber carbon.
ParameterValue
Tensile modulus, GPaEf1 = 230, Ef2 = 28
Poisson’s ratiovf12 = 0.23
Shear modulus, GpaGf12 = 50
Tensile strength, MpaXfT, YfT, ZfT = 4900
Compressive strength, MpaXfC, YfC, ZfC = 3920
Table 2. Mechanical properties of Matrix.
Tensile ModulusPoisson’s RatioTensile FailureCompressive Yield
Em = 2.73 GPavm = 0.4 σ = 85.25 MPa σ = 133 MPa
ε = 3.62 % ε = 6.5 %
Table 3. V f t of each lamina with V f l = 42 . 1 % .
Ply45°−45°90°
V f t 48.1%43%43%47.3%
Table 4. The engineering constants of the composite tows with different fiber volume fraction obtained using micromechanical model/GPa.
Model V f t E l t E 2 t = E 3 t v 12 t v 13 t G 12 t = G 13 t G 23 t
Ref-RM42.1%98.41-0.328---
Ref-FEM42.1%98.446.1960.3230.5572.3031.990
In Cell A48.1%111.986.9870.3130.5422.6582.267
In Cell B43%100.366.2930.3220.5512.3522.029
In Cell C47.3%110.166.9170.3140.5422.6072.243
Table 5. Strength of composite tows obtained using micromechanical model/MPa.
Model V f t X T t X C t Y T t Y C t S 12 t
Ref-RM42.1%2095.21677.3---
Ref-FEM42.1%1792.3122472.3148.072.5
In Cell A48.1%2247187181.0160.873.6
In Cell B43%1906146075.0154.772.3
In Cell C47.3%2234185080.2156.773.7
Table 6. In-plane stiffness of the NCF (non-crimp fabric) lamina obtained with mesomechanical analysis procedure (GPa).
Description V f l V f t E 1 l E 2 l v 12 l G 12 l
Cell A42.1%48.1%93.456.070.3492.301
Cell B42.1%43%93.856.110.3472.322
Cell C42.1%47.3%98.166.10.3242.2
Average42.1%-95.156.090.342.274
Ref-FEM42.1%-98.446.1960.3232.303
Experiment [13]42.8% ± 0.8%-94.3 ± 8.2-0.32 ± 0.042.4 ± 0.8
Table 7. In-plane strength of the non-crimp fabric (NCF) lamina evaluated with mesomechanical failure analysis procedure/MPa.
Description V f l V f t X T l X C l Y T l Y C l S 12 l
Cell A42.1%48.1%1314.41055.166.7148.169.4
Cell B42.1%43%1247.6965.269.5150.270.3
Cell C42.1%47.3%1557.51340.470.1153.072.8
Average42.1%-1373.21120.268.8150.470.8
Ref-FEM42.1%-1792.3122472.3148.071.5
Experiment [13]42.8% ± 0.8%-1233-59.6-71.3

