Article

Prediction of the Hot Compressive Deformation Behavior for Superalloy Nimonic 80A by BP-ANN Model

State Key Laboratory of Mechanical Transmission, School of Material Science and Engineering, Chongqing University, Chongqing 400044, China
*
Author to whom correspondence should be addressed.
Appl. Sci. 2016, 6(3), 66; https://doi.org/10.3390/app6030066
Submission received: 30 December 2015 / Revised: 7 February 2016 / Accepted: 19 February 2016 / Published: 25 February 2016
(This article belongs to the Special Issue Applied Artificial Neural Network)

Abstract

:
In order to predict hot deformation behavior of superalloy nimonic 80A, a back-propagational artificial neural network (BP-ANN) and strain-dependent Arrhenius-type model were established based on the experimental data from isothermal compression tests on a Gleeble-3500 thermo-mechanical simulator at temperatures ranging of 1050–1250 °C, strain rates ranging of 0.01–10.0 s−1. A comparison on a BP-ANN model and modified Arrhenius-type constitutive equation has been implemented in terms of statistical parameters, involving mean value of relative (μ), standard deviation ( w ), correlation coefficient (R) and average absolute relative error (AARE). The μ -value and w -value of the improved Arrhenius-type model are 3.0012% and 2.0533%, respectively, while their values of the BP-ANN model are 0.0714% and 0.2564%, respectively. Meanwhile, the R-value and ARRE-value for the improved Arrhenius-type model are 0.9899 and 3.06%, while their values for the BP-ANN model are 0.9998 and 1.20%. The results indicate that the BP-ANN model can accurately track the experimental data and show a good generalization capability to predict complex flow behavior. Then, a 3D continuous interaction space for temperature, strain rate, strain and stress was constructed based on the expanded data predicted by a well-trained BP-ANN model. The developed 3D continuous space for hot working parameters articulates the intrinsic relationships of superalloy nimonic 80A.

Graphical Abstract

1. Introduction

Nimonic 80A, as a nickel-based superalloy, has been widely used in jet engines for aircraft, gas turbines for power plant and marine diesel engines because of its high creep strength, superior oxidation resistance and strong resistance to corrosions at high temperature [1,2,3]. Generally, the Nimonic 80A is used to fabricate exhausting valve. The upsetting and closed die forging are traditionally applied to form the exhausting valve. However, in recent years, the electric upsetting process with isostatic loading and high heating efficiency is developed to form the exhausting valves [4,5]. It is well known that the hot deformation behavior for a specific material is sensitive to the hot deformation parameters involving strain, strain rate and temperature, and is highly non-linear during hot deformation. The flow behavior of materials is often complex due to the comprehensive function of hardening and softening mechanisms. Consequently, modeling and prediction of the constitutive stress-strain relationships with a high precision is quite complex in nature; meanwhile, it is significant to study and understand the hot deformation behavior and furthermore optimize the deformation process (electric upsetting, forging and extrusion) by numerical simulations. How to obtain an accurate strain-stress relationship becomes critical for the correct calculation of the finite element model [6].
So far, a large amount of research on the characterization for complex non-linear relationships between true stress and deformed parameters such as strain, strain rate and temperature at elevated temperatures has been proposed. Numerous efforts have been made to three types of constitutive models involving the analytical constitutive model, phenomenological constitutive model and artificial neural network [7]. In analytical models, constitutive relations are derived based on physical theories, which require very clear understanding of the processes that control the deformation of the materials. The phenomenological constitutive model is an accurate mathematical model and has relatively many coefficients that need to be calibrated with experimental data. A phenomenological model including the Arrhenius-type equation with hyperbolic laws was proposed to predict flow stress [8]. Furthermore, an improved Arrhenius-type constitutive model incorporating the strain effect on the hot deforming parameters, has been developed to describe and predict the flow behavior for diverse materials or alloys. Lin et al. proposed a modified hyperbolic sine constitutive equation, in which the influence of strain was incorporated to predict the flow stress of 42CrMo steel [9]. Later, the modified Arrhenius-type equation was precise for describing the elevated temperature flow stress of Aermet100 steel [10], Ti60 titanium alloy [11], Al–Zn–Mg–Er–Zr alloy [12], etc. Such constitutive equations are typically only applicable to the limited materials with specific conditions due to the poor adaptability for the new experimental data. Additionally, the artificial neural network (ANN) model with a back-propagation learning algorithm has been successfully used to predict the hot working behavior of material to overcome the gross approximations introduced by the regression methods [6,13,14,15,16,17,18,19,20,21,22,23]. The back-propagational artificial neural network (BP-ANN) is a model emulating some functions of biological neural networks with a data-driven black-box structure [24], thus it merely needs a collection of some typical examples from the anticipant mapping functions for training regardless of explicit professional knowledge of deformation mechanisms. The BP-ANN model with a data-driven black-box provides a novel way to predict the flow stress by learning the complex and non-linear relationships of flow stress, strain rate, strain and temperature with true stress-strain data. Ji et al. applied a feed-forward back-propagation ANN model to predict the flow stress of Aermet100 steel [13]. Haghdadi et al. developed a feed-forward back propagation ANN with single hidden layer to predict the flow behavior of an A356 aluminum alloy [15]. Several such works reveal that the predicted results are well consistent with experimental results; furthermore, the neural network is an effective tool to predict the hot deformation behavior of non-linear characteristic materials.
Accordingly, in this work, the stress-strain data of superalloy nimonic 80A were obtained from a series of isothermal compression tests carried out in a wide temperature range of 1050–1250 °C and strain rate range of 0.01–10 s−1 on a Gleeble 3500 thermo-mechanical simulator (Dynamic Systems Inc., New York, NY, United States). A BP-ANN model which takes temperature ( T ), strain rate ( ε ˙ ) and strain ( ε ) as the input variables, and true stress ( σ ) as the output variable was established by determining proper network structure and parameters to predict the non-linear complex flow behaviors. Meanwhile, a strain-dependent Arrhenius-type constitutive model was constructed to predict the flow stress of nimonic 80A. Subsequently, a comparative analysis on the performance of two such models has been carried out by a series of evaluators such as relative error (δ), average absolute relative error (AARE) and correlation coefficient (R), which predictably indicates that the former has higher prediction accuracy. In the following, as described previously, a 3D continuous interaction space within the temperature range of 950–1250 °C, strain rate range of 0.01–10 s−1, and strain range of 0.1–0.9 was constructed.

2. Materials and Experimental Procedure

The chemical compositions (wt. %) of superalloy nimonic 80A used in this study were as follows: C—0.069, Mn—0.630, Cr—2, Fe—1.260, Ti—2.070, Al—0.680, Si—0.550, S—0.001. Twenty nimonic 80A specimens with a diameter of 10 mm and a height of 12 mm were processed from the same extruded billet by wire-electrode cutting. A thermo-mechanical simulator, Gleeble-3500, with a high speed heating system, a servo hydraulic system, a digital control system and a data acquisition system, was used for compression testing. It is common to be used for simulating both mechanical and thermal process at a wide range during hot deformation. Twenty specimens were resistance heated to a proposed deformation temperature with a heating rate of 5 °C/s and then held at that temperature for 180 s by thermo-coupled-feedback-controlled AC current to obtain a homogeneous temperature field. Afterwards, all twenty-four specimens were compressed to a true strain 0.9163 (a fixed height reduction of 60%) at five different temperatures of 1050 °C, 1100 °C, 1150 °C, 1200 °C and 1250 °C, and four different strain rates of 0.01 s−1, 0.1 s−1, 1 s−1 and 10 s−1 [25]. After each compression, the deformed specimen was immediately quenched into water to retain the high temperature microstructures.
During the compression process, the variations of strain and stress were continuously monitored by the computer equipment with the automatic data acquisition system. Generally, the true stain and true stress were derived from the nominal stress-strain relationship based on the following formula: σT = σN(1 + εN), εT = ln(1 + εN), where σT is true stress, σN is nominal stress, εT is true strain and εN is nominal strain.

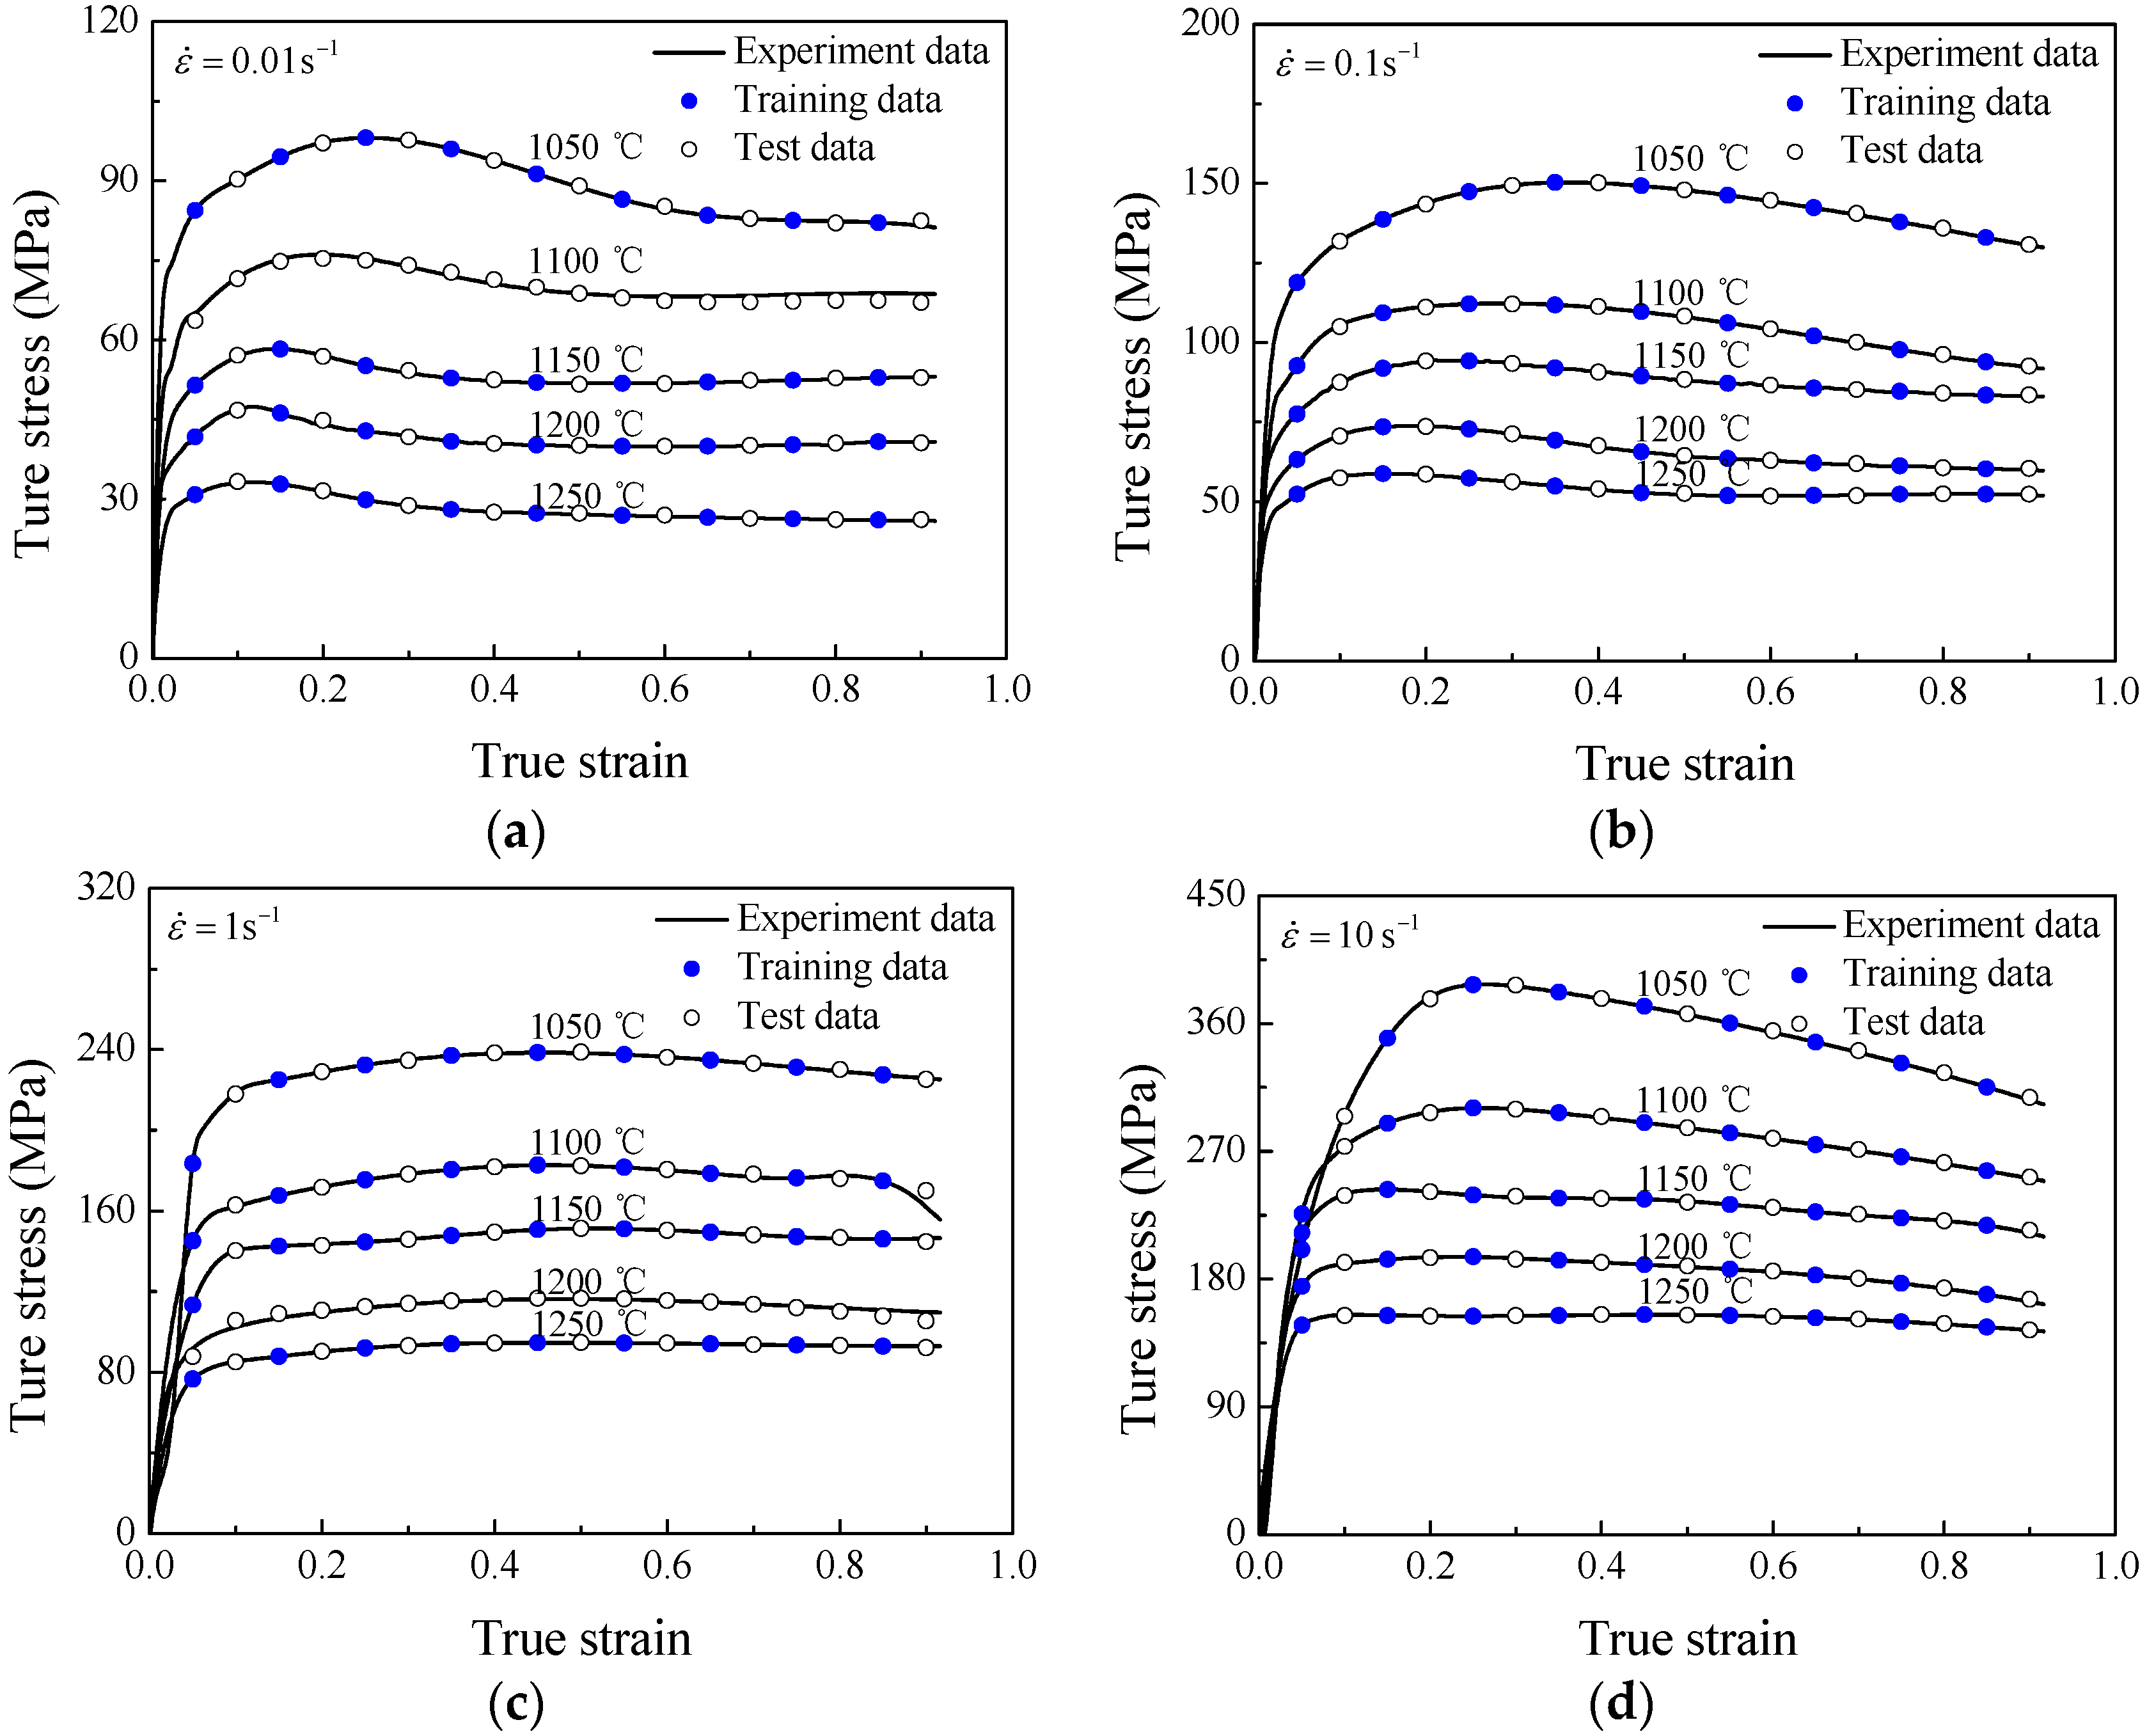
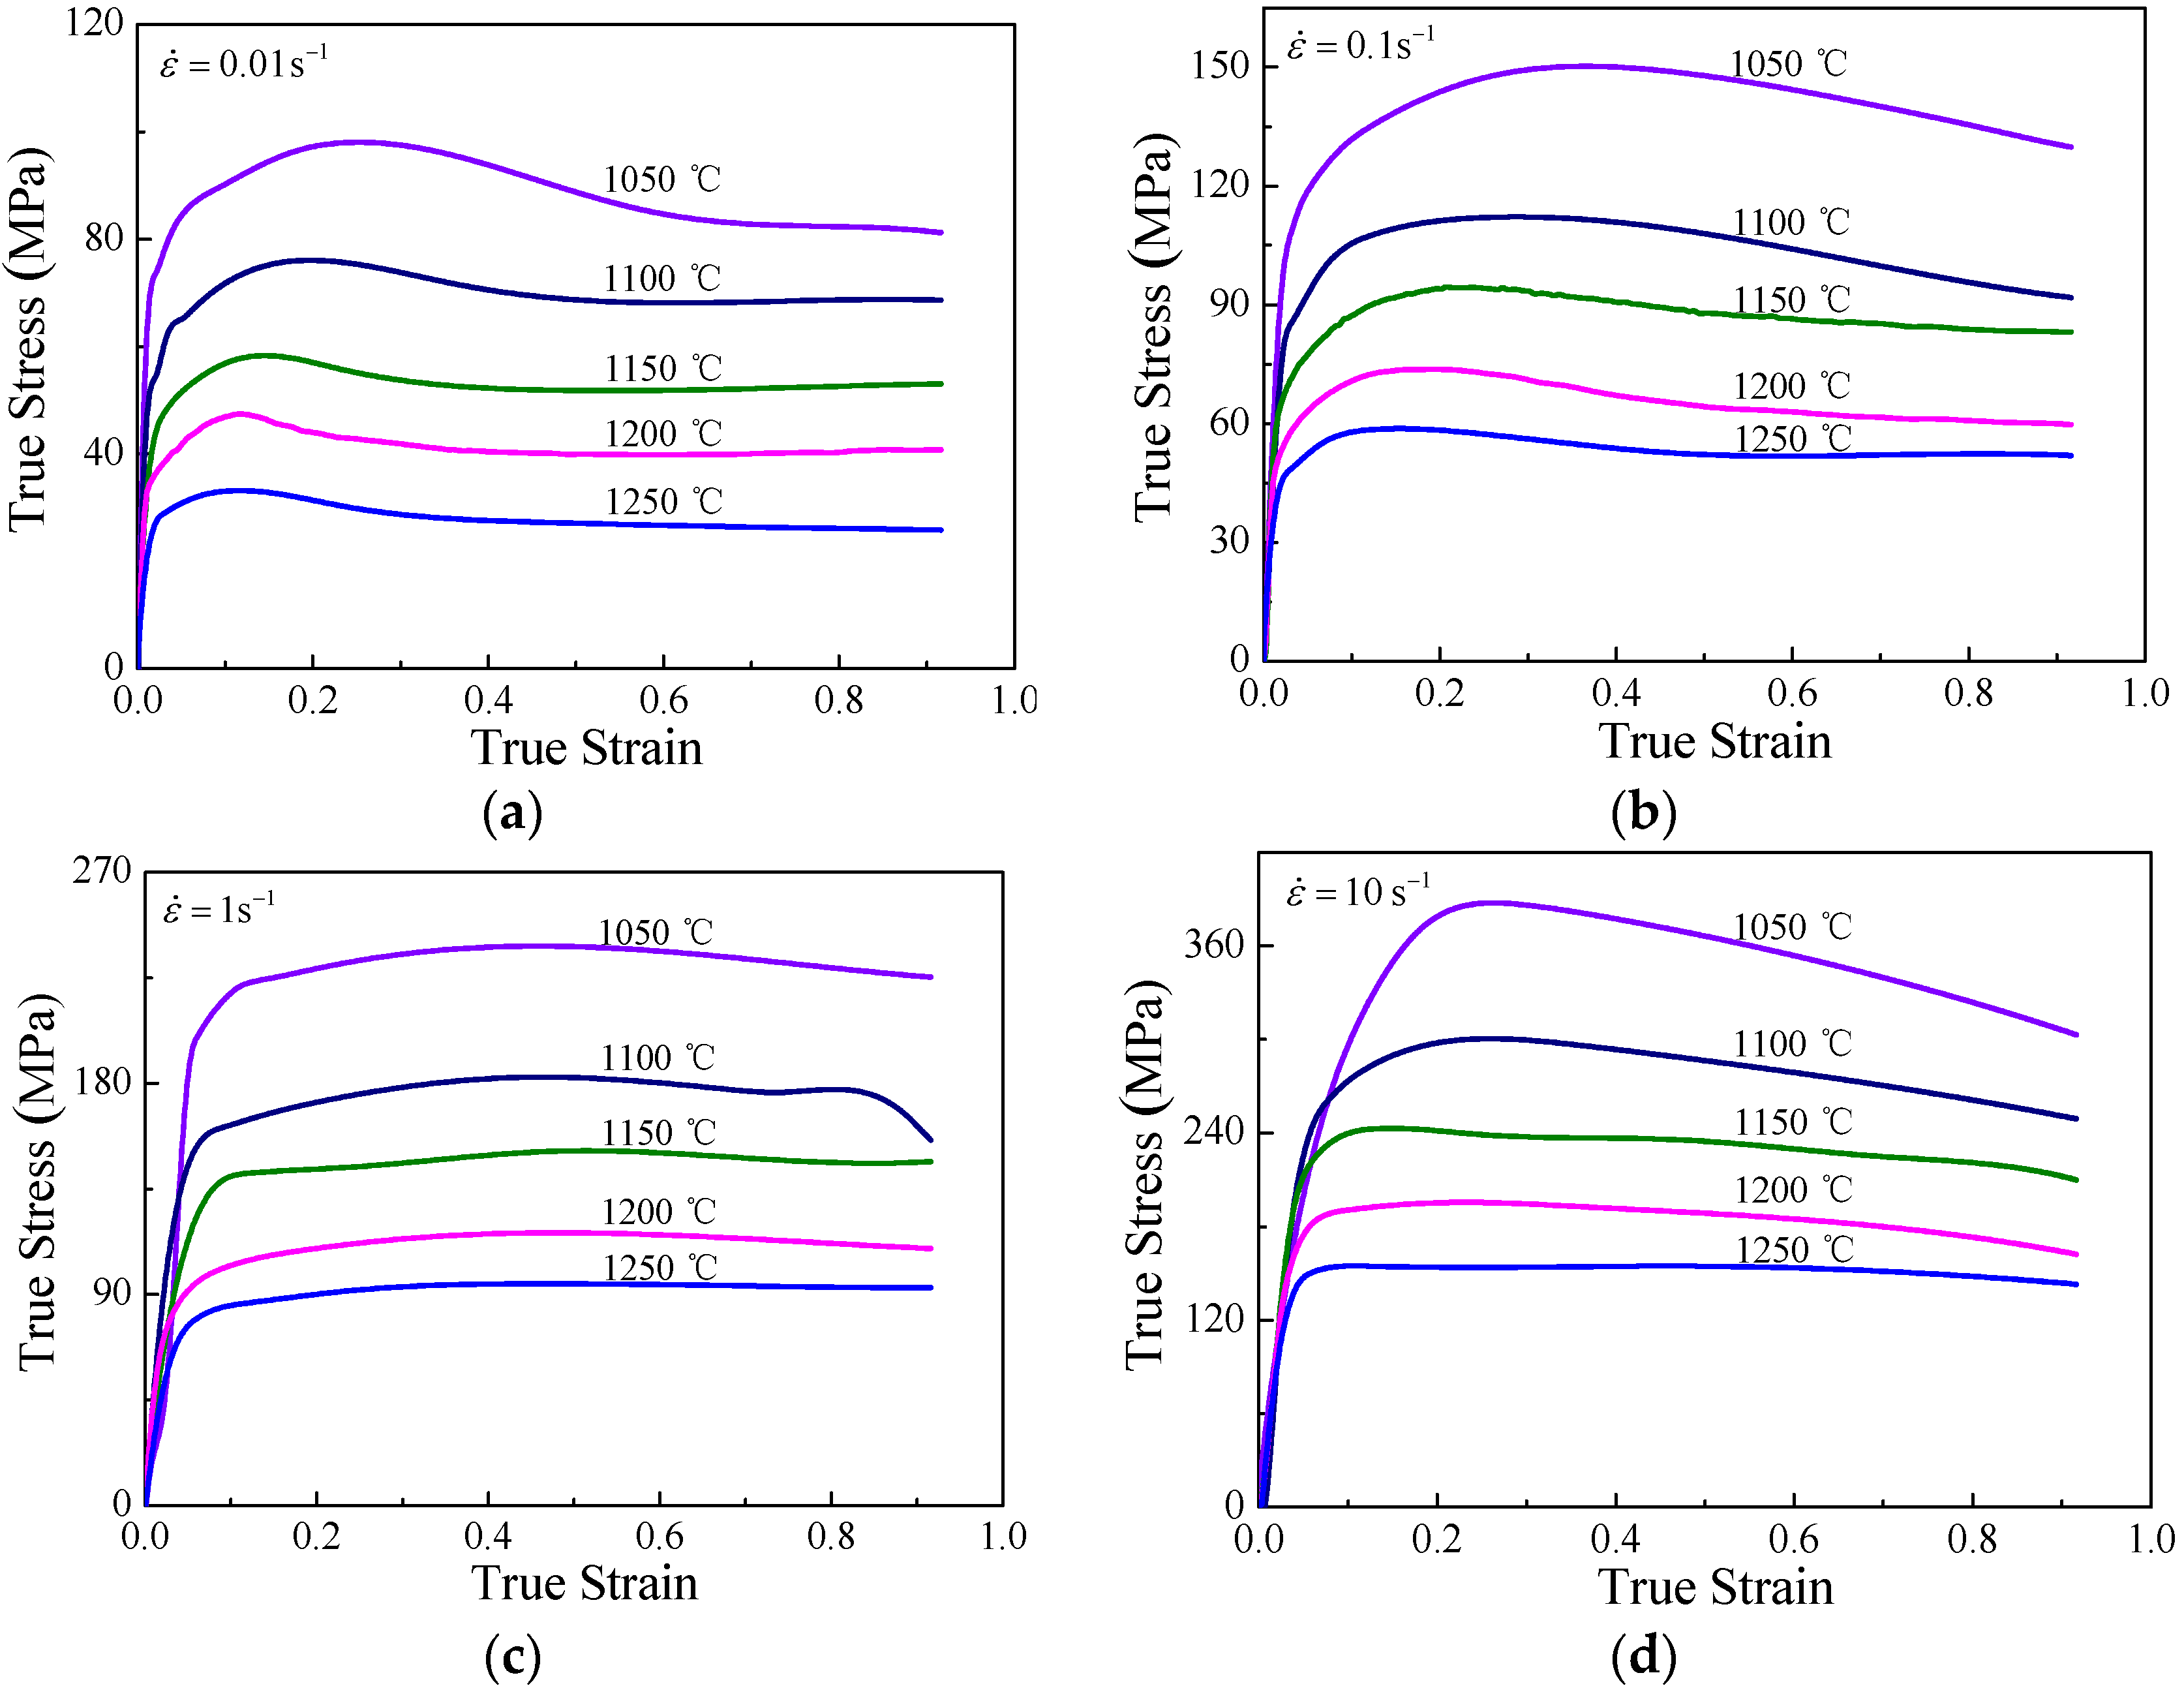
3. Flow Behavior Characteristics of Superalloy Nimonic 80A

The true compressive stress-strain curves for nimonic 80A, heat-resisting alloy, are illustrated in Figure 1a–d, which show that both deformation temperatures and strain rates have considerable influence on the flow stress of nimonic 80A heat-resisting alloy.
As shown in Figure 1, the strain rate and temperature have a significant effect on the flow curves. Apparently, the flow stress decreases markedly as the temperature increases at a specific strain rate. In contrast, the flow stress increases with the increasing of the strain rate while for a fixed temperature, which is owing to an increase of the dislocation multiplication rate and dislocation density [4]. All the true strain-stress can be summarized in three distinct stages of the stress evolution with strain [4,6,7]. At the first stage of the forming process, the flow stress rapidly increases to a critical value, where work hardening (WH) predominates. At the second stage, where the thermal softening owing to dynamic recrystallization (DRX) and dynamic recovery (DRV) gets more and more predominant, flow stress slowly increases to the peak value even exceeds work hardening. At the third stage, the curves can be divided into two types based on the variation tendency. Evidence of DRX softening, the flow stress decreases continuously, which corresponds to the conditions of 0.01 s−1 and 1050–1250 °C, 0.1 s−1 and 1050–1200 °C and 1–10 s−1 and 1050–1200 °C. However, in the parameter domains of 0.1–10 s−1 and 1250 °C, the stress approximately keeps a steady state with significant DRV softening. From the previous descriptions, the typical form of flow curve with DRX softening involved a single peak followed by a flow of steady state. The reason lies in the fact that the highter rate of work hardening slows down the DRX softening rate with lower temperatures and higher strain rates, therefore, the onset of steady state flow is shifted to higher levels [4].

4. Development of Constitutive Relationship for Superalloy Nimonic 80A
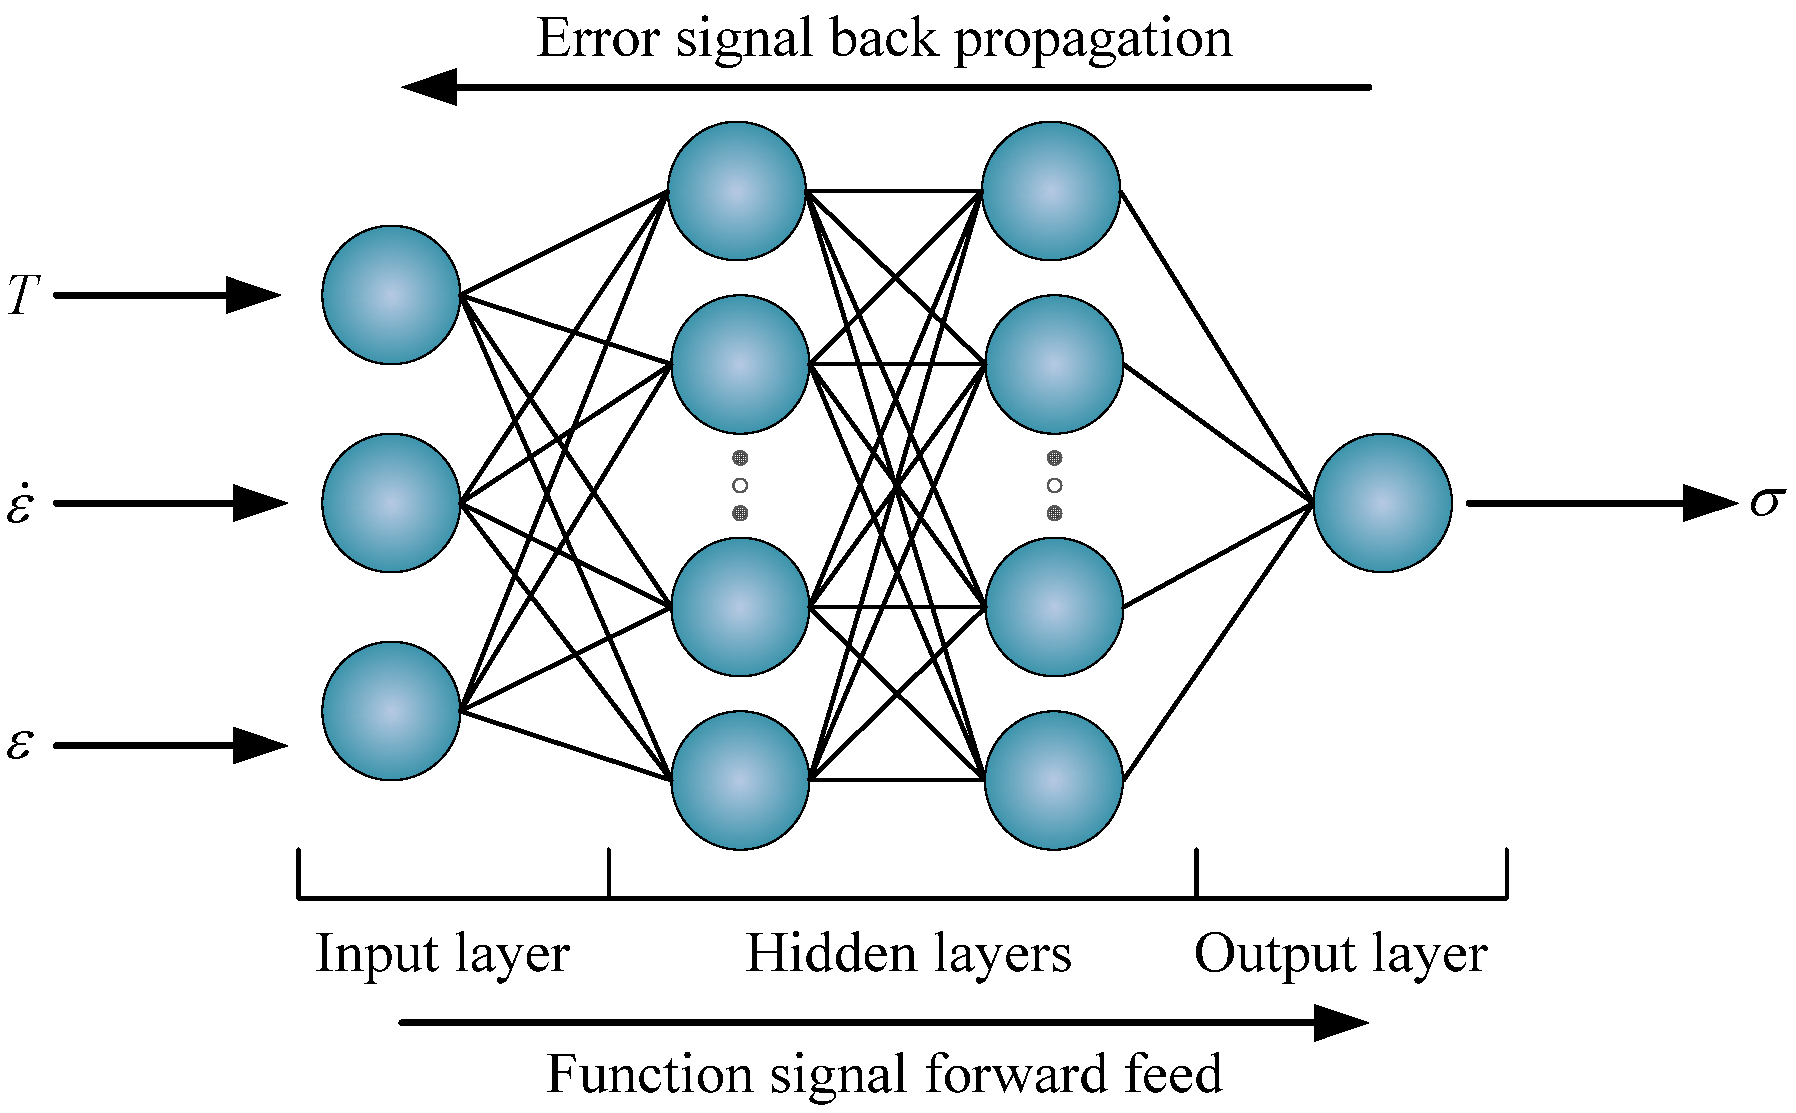
4.1. BP-ANN Model

BP-ANN has been widely used to process complex non-linear relationships among several variables [6,20,21,22,23,26]. It is a quite efficient computing tool to learn and predict the hot deformation behavior between inputs and outputs by simulating the neural networks structure of the biological neurons. The typical artificial neural network contains three layers, which are input layer, hidden layer and output layer. The input layer receives outside signals and then the output layer generates output signals, while the hidden layer provides the complex network architecture to mimic the non-linear relationship between input signals and output signals [20]. Basically, a feed forward network, which was trained by the back propagation algorithm, was used to establish the back-propagation (BP) neural network. Back-propagation (BP) algorithm adjusts the biases and weights aiming to minimize the target error through gradient descent during training procedure, while learning the relationships between input data and output data.
In this investigation, the input variables of BP-ANN include deformation temperature ( T ), strain rate ( ε ˙ ) and strain ( ε ), while the output variable is flow stress ( σ ). The schematic representation of the BP-ANN architecture was shown in Figure 2. All the data from twenty stress-strain curves were divided into training dataset and independent test dataset. In order to ensure the efficiency of training, each continuous stress-strain curve was discretely handled by strain parameter from 0.05 to 0.9 at an interval of 0.01. Hence, a total of 1386 discrete data points from the eighteen stress-strain curves were defined as the training data of this BP-ANN work. The testing dataset was determined as the others curves involving the curves under 0.01 s−1 and 1100 °C and 1 s−1 and 1200 °C. Among such two curves, the stress values of 36 points picked out from 0.05 to 0.9 with a strain interval of 0.05, and 162 points from the other eighteen training curves in a strain range of 0.05 to 0.9 with a strain interval of 0.1 were considered as the test data for the BP-ANN work performance. The BP-ANN model was trained based on the training dataset, and generalization property of the trained network was assessed by the test dataset selected with a fixed strain rate.
The selected experimental data have been measured in different units, and thus different data have great differences, which induce the poor convergence speed and predicted accuracy of a BP-ANN model. From the stress-strain curves, it can be seen that the input strain data varies from 0.05 to 0.9, strain rate data varies from 0.01 to 10 s−1, and temperature data varies from 1050 to 1250 °C, the output flow stress data varies from 25.93 MPa to 387.63 MPa. Therefore, before training the network, the input and output datasets have been normalized to avoid value concentrating on weights and some neurons when the iterative calculation of BP-ANN. The main reason for normalizing the data matrix is to recast them into the dimensionless units to remove the arbitrary effect of similarity between the different data. In this research, the normalization processing was realized by Equation (1) [6,17]. The coefficients of 0.05 and 0.25 in Equation (1) are regulating parameters for the sake of narrowing the magnitude of the normalized data within 0.05 to 0.3. Furthermore, it should be noted that the initial numerical values of true stain rates exhibit great magnitude distinction, thereby a logarithm was taken for transforming the true stain rate data before normalization processing.
x n = 0.05 + 0.25 × x 0.95 x min 1.05 x max 0.95 x min
where x is the initial data of input or output variables; xmin is the minimum value of x and xmax is the maximum; xn is the value of x after normalization processing.
The structural parameter settings of the BP-ANN are very complex, which require an appropriate transfer function and an appropriate number of neurons for the hidden layers. It has been proved that two hidden layers are necessary to construct the BP-ANN model to ensure the training accuracy. The determination of the neurons number for hidden layers has a direct relationship with the number of training samples which are often settled by the experience of designers and a trail-and-error procedure. In order to achieve the proposed accuracy, the BP-ANN model was trained with only two neurons for each hidden layer at the beginning; afterwards, the neuron number was adjusted continually (three, four, etc.). After repeated trials by changing the neuron number, two hidden layers and 11 neurons in each hidden layer are determined for the final network architecture. Here, “trainbr” function and “learngd” function were empirically chosen as the training function and learning function respectively. In the meantime, the transfer function of the hidden layers was assumed as “tansig” function, whereas the output layer adopted “purelin” function. In addition, an evaluator, sum square error (SSE) between experimental and predicted values is introduced into this net to check the ability of the ANN training model. SSE is expressed as Equation (2) [6]. Here, the proposed accuracy, i.e., the maximum SSE-value is set as 0.0001. The work was accomplished by the neural network toolbox available with MATLAB software (R2013b, MathWorks, Natick, MA, United State, 2013).
S S E = i = 1 N ( E i P i ) 2
where, E i is the sample of experimental value; P i is the sample of predicted value by the BP-ANN model; and N is the number of true stress-strain samples.
Based on the well-trained BP-ANN model, the true stress values under experimental conditions, which include the deformation conditions corresponding to the previous training points and test points, were predicted. Figure 3 exhibits the comparisons between the true stresses predicted by BP-ANN model and the corresponding experimental true stresses for superalloy nimonic 80A. Apparently, the predicted true stress decreases with temperature increasing or strain rate decreasing, which is consistent with experimental stress-strain curves. The phenomenon predictably indicates that the BP-ANN model is able to effectively grasp the stress-strain evolution rules, that is, it possesses excellent capability to track the dynamic softening (including DRX and DRV) and work hardening regions of superalloy nimonic 80A. Additionally, the test data including the data under 0.01 s−1 and 1100 °C and 1 s−1 and 1200 °C, are used to assess the generalization property of the BP-ANN model. The result of comparisons shows that the true stresses predicted by BP-ANN model has good agreement with experimental stress-strain curves, which indicates the high generalization property of the BP-ANN model.

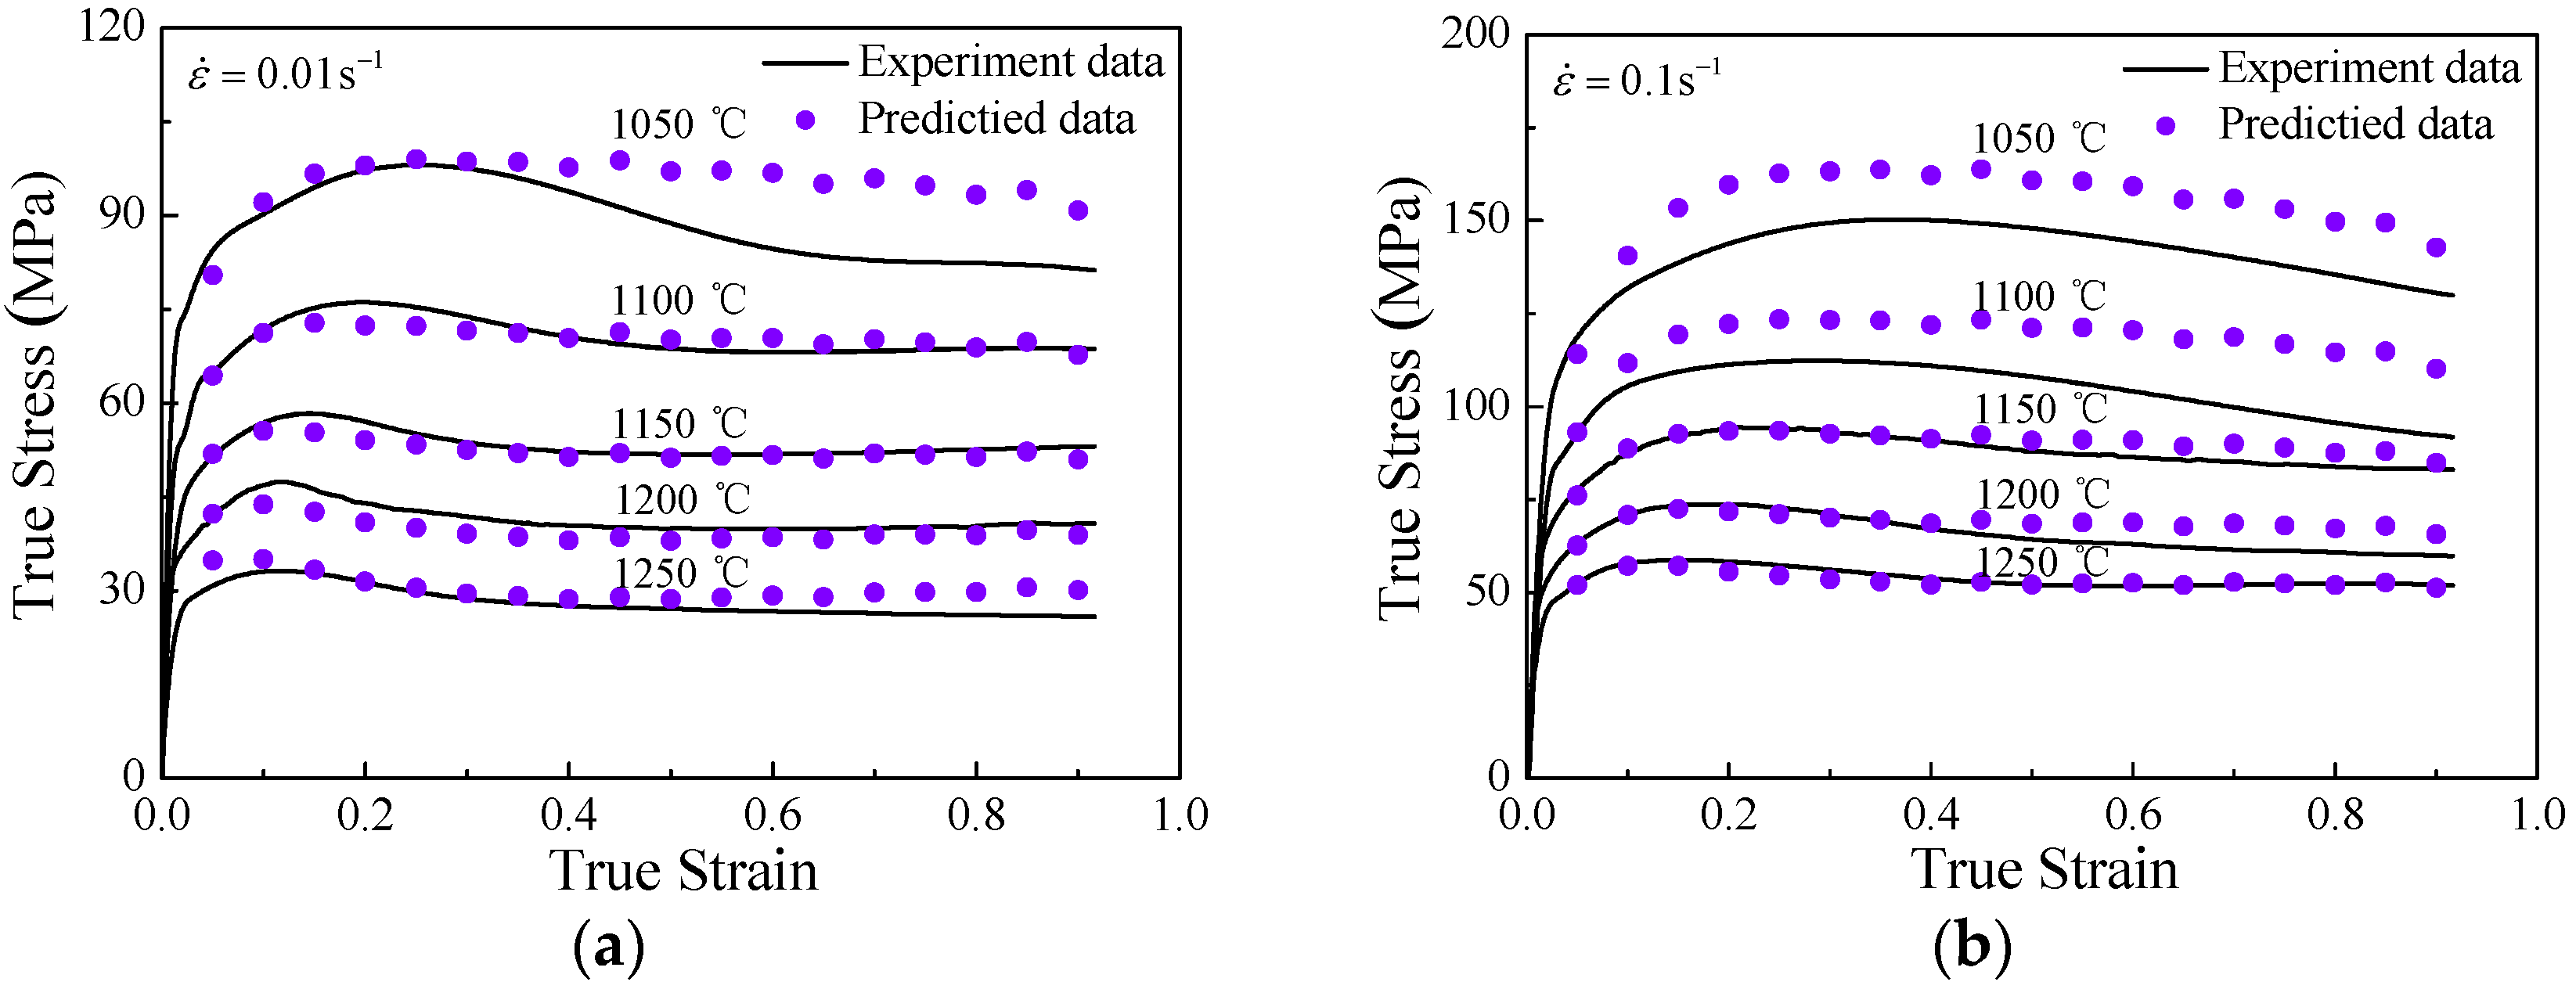
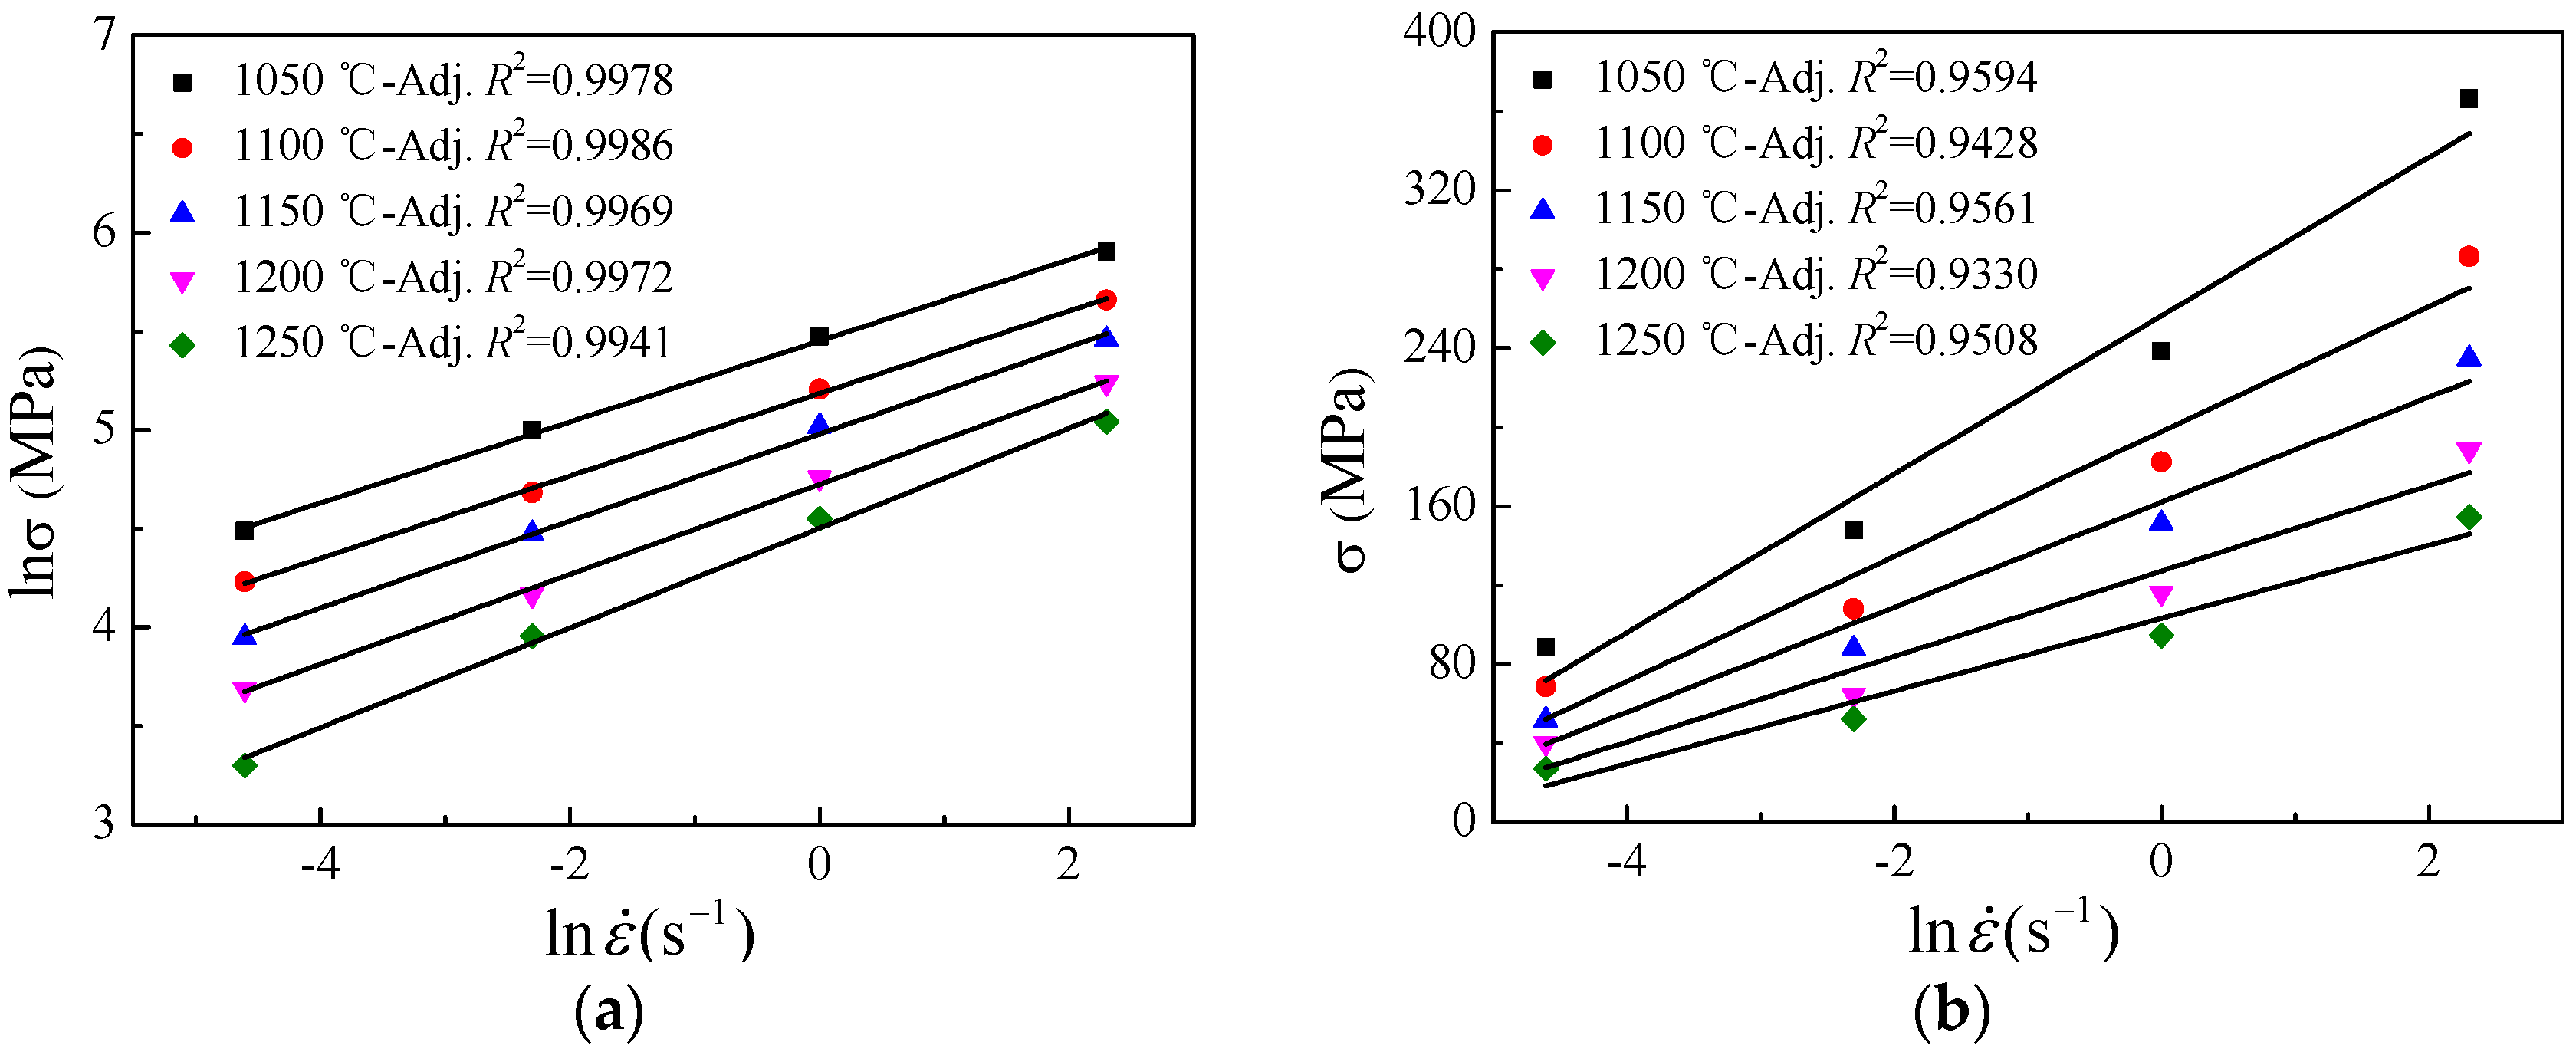
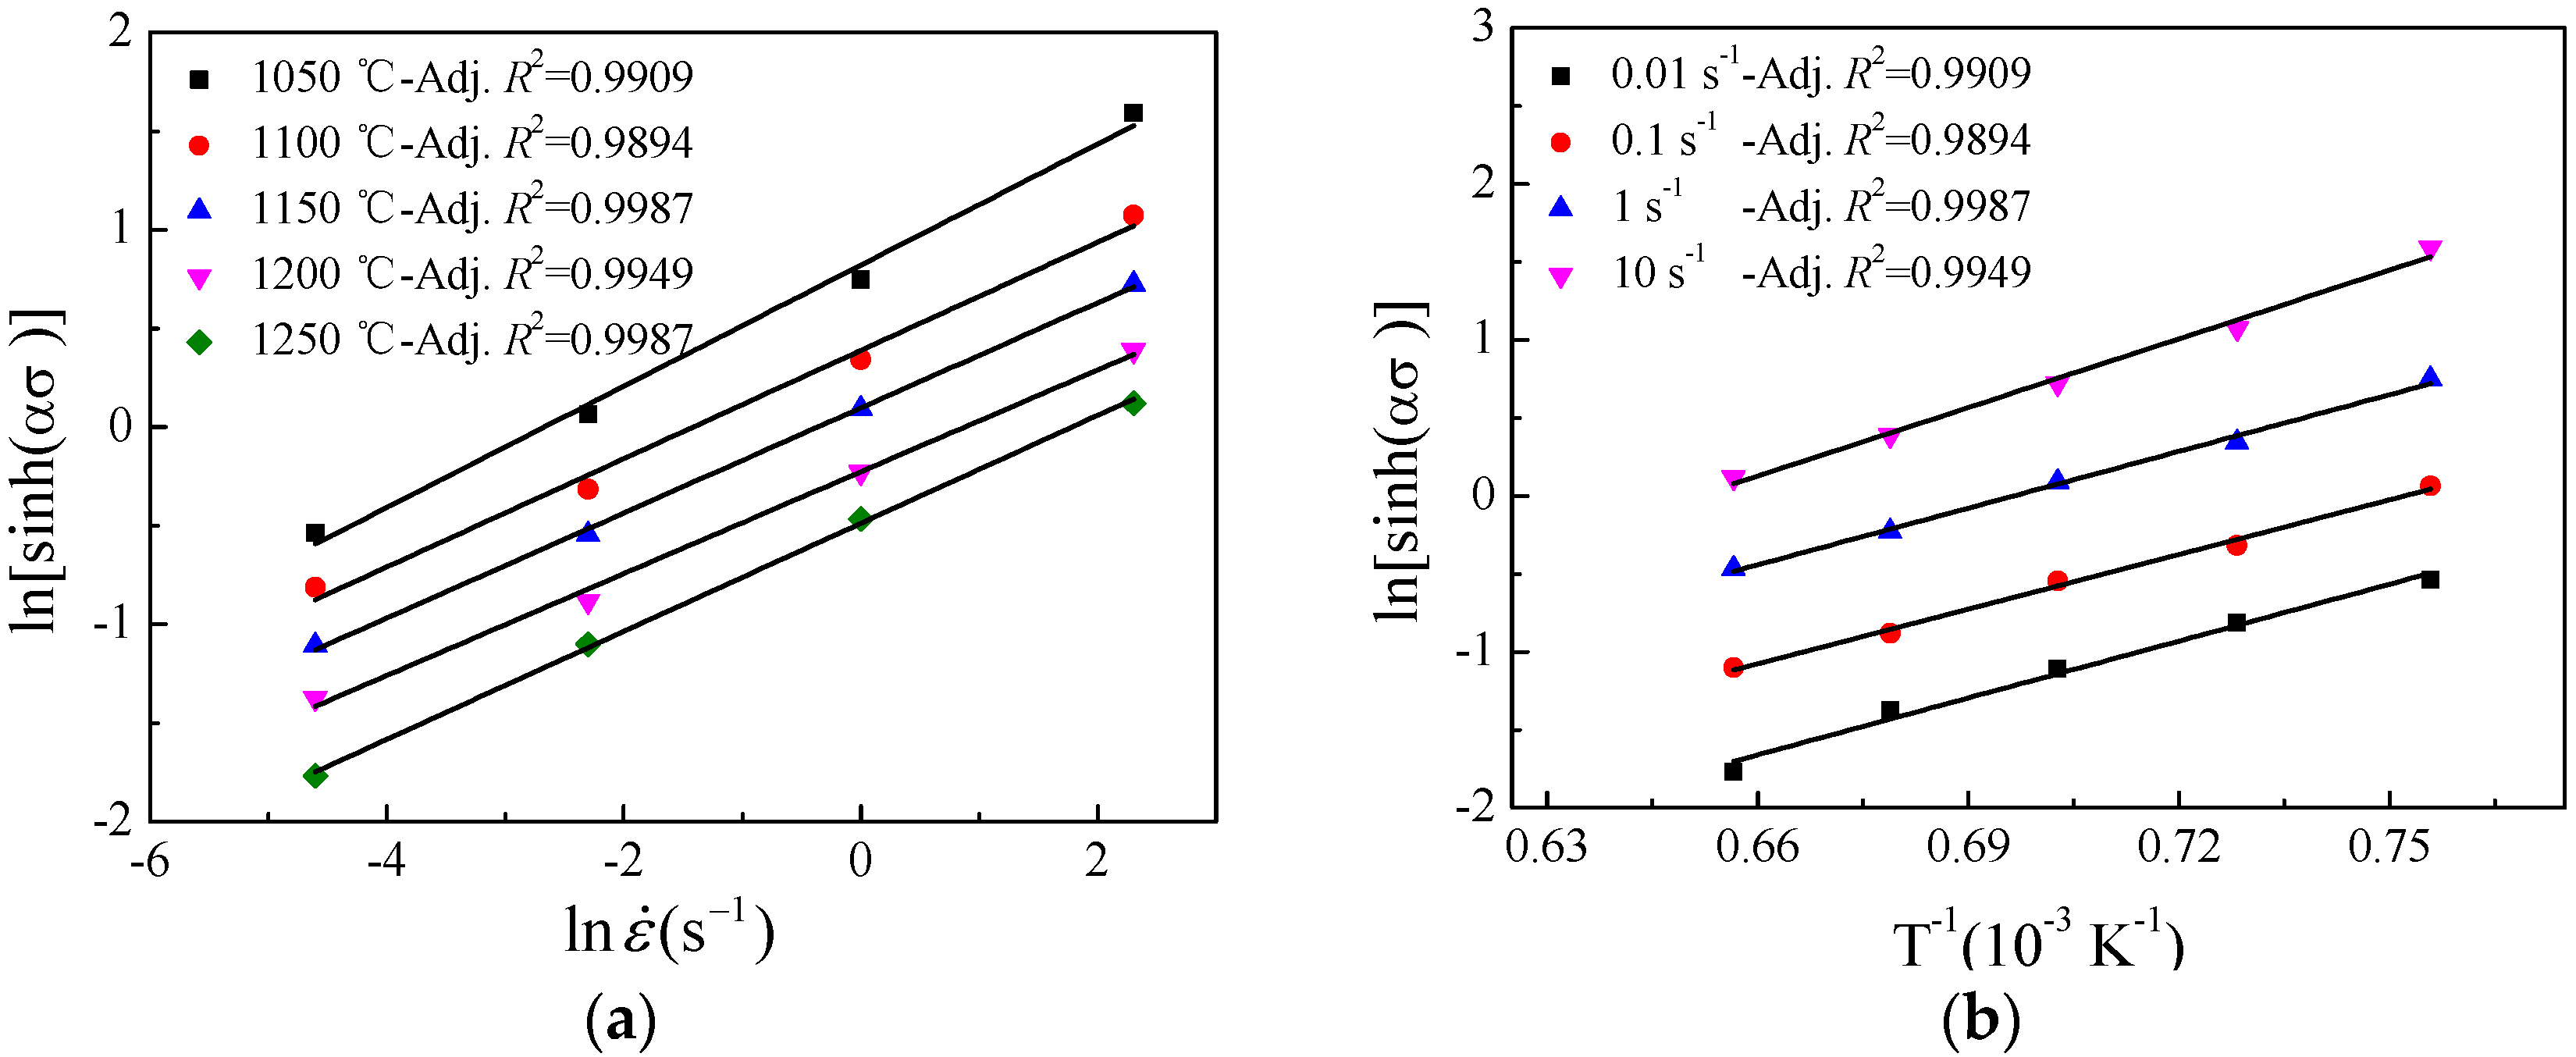
4.2. Arrhenius-Type Constitutive Model

Generally, Arrhenius type equation is expressed as Equation (3) [27], which correlates the flow stress ( σ ) with temperature ( T ) and strain rate ( ε ˙ ).
ε ˙ = A F ( σ ) exp ( Q / R T )
where F ( σ ) = { σ n             α σ < 0.8 exp ( β σ )       α σ > 1.2 [ sinh ( α σ ) ] n    f o r a l l σ , and where ε ˙ is the strain rate (s−1), R is the universal gas constant (8.31 J·mol−1·K−1), T is the absolute temperature (K), Q is the activation energy of deformation (kJ·mol−1), σ is the flow stress (MPa) for a given stain, A , α , n and n are the material constants, α = β / n .
For the low stress level ( α σ < 0.8 ), taking natural logarithms on both sides of Equation (3), the following equation can be obtained:
ln ε ˙ = ln A + n ln σ Q / R T
For the high stress level ( α σ > 1.2 ), taking natural logarithms on both sides of Equation (3) gives:
ln ε ˙ = ln A + β σ Q / R T
According to Equations (4) and (5), n = d ln ε ˙ / d ln σ and β = d ln ε ˙ / d σ . Then, the linear relationships of ln σ ln ε ˙ and σ ln ε ˙ for strain of 0.5 at the temperatures of 1050–1250 °C were fitted out as shown in Figure 4. The adjusted coefficient of determination R 2 for each condition was calculated and showed in Figure 4, which was used to prove the reliability of fitting curves. The inverse of the slopes of straight lines in ln σ ln ε ˙ and σ ln ε ˙ plots is accepted as the values of material constants n and β at each tested temperature, respectively. Thus the values of n and β at strain of 0.5 were obtained by averaging the inverse of slopes under different temperatures, which were found to be 5.3625 MPa−1 and 0.0336 MPa−1, respectively. Furthermore, the value of another material constant α = β / n = 0.0063 MPa−1 was also obtained.
For all the stress level (including low and high-stress levels), Equation (3) can be rewritten as the following:
ε ˙ = A [ sinh ( a σ ) ] n exp ( Q / R T )
Taking natural logarithms on both sides of Equation (6), the following equation can be obtained:
ln ε ˙ = { ln A + n [ ln sinh ( α σ ) ] Q } / R T
For the given deformation temperature (T), the stress exponent ( n ) is expressed as Equation (8):
n = ln ε ˙ ln ( sinh ( α σ ) ) | T
When the strain rate ( ε ˙ ) is a constant, the activation energy (Q) can be expressed as Equation (9):
Q = n R ln ( sinh ( α σ ) ) ( 1 / T ) | ε ˙
According to Equations (8) and (9), the linear relationship between ln ( sinh ( α σ ) ) and ln ε ˙ and the relationship between ln ( sinh ( α σ ) ) and 1 / T were fitted out as shown in Figure 5 and the determination coefficient R 2 have been exhibited in each figure. Consequently, the value of constant parameter n and the activation energy Q can be derived from the mean slope of lines in Figure 5a,b respectively, here, n is 3.7806 and Q is 403.81 kJ·mol−1. In addition, the material constant A can be calculated as 4.5496 × 10¹⁴ s−1.
However, the effect of temperature and strain rate on flow behavior cannot be considered in Equation (3). Zener-Hollomon parameter, Z , in an exponent-type Equation (10) [28] has been introduced to model the comprehensive function of temperature and strain rate.
Z = ε ˙ exp ( Q R T )
Base on Equations (6) and (10), the stress σ at the strain of 0.5 can be written as a function of Z parameter:
σ = 1 α ln { ( Z / A ) 1 n + [ ( Z / A ) 2 n + 1 ] 1 2 }
It is well known that the constitutive model is affected not only by the deformation temperature and strain rate, but also by the strain in the hot deformation of metal materials [7,10,12,17,29,30,31,32]. Therefore, the values of material coefficients (i.e., α , A , n , Q ) of the constitutive equation are calculated under different strains in a range of 0.05 to 0.9 with the interval of 0.05 by the same method used previously. These values were then used to fit the polynomial functions (Figure 6), and the variation of α , ln A , n and Q with true strain ε could be represented by a sixth order polynomial respectively, as shown in Equation (12). The coefficients of the sixth order polynomial functions are tabulated in Table 1:
{ α = B 0 + B 1 ε + B 2 ε 2 + B 3 ε 3 + B 4 ε 4 + B 5 ε 5 + B 6 ε 6 ln A = C 0 + C 1 ε + C 2 ε 2 + C 3 ε 3 + C 4 ε 4 + C 5 ε 5 + C 6 ε 6 n = D 0 + D 1 ε + D 2 ε 2 + D 3 ε 3 + D 4 ε 4 + D 5 ε 5 + D 6 ε 6 Q = E 0 + E 1 ε + E 2 ε 2 + E 3 ε 3 + E 4 ε 4 + E 5 ε 5 + E 6 ε 6
Thus, the improved Arrhenius type model with variable coefficients can be expressed as Equation (13).
σ = 1 g ( ε ) ln { ( ε ˙ exp [ j ( ε ) / 8.314 T ] f ( ε ) ) 1 h ( ε ) + [ ( ε ˙ exp ( j ( ε ) / 8.314 T ) f ( ε ) ) 2 h ( ε ) + 1 ] 1 2 }
where g ( ε ) , f ( ε ) , h ( ε ) , j ( ε ) are polynomial functions of strain for α , A , n , Q .
Applying the aforementioned material constants to Equation (13), the true stress values are calculated for the experimental temperature, strain and strain rate ranges. Figure 7 shows comparisons between the experimental data and the predicted results calculated from the developed constitutive equations (considering the compensation of strain) at the temperatures of 1050 °C, 1100 °C, 1150 °C, 1200 °C, and 1250 °C, and the strain rates of 0.01 s−1, 0.1 s−1, 1 s−1 and 10 s−1. It can be seen that the proposed constitutive equation gives an accurate estimation on the flow stress of superalloy nimonic 80A in most of the experimental conditions.

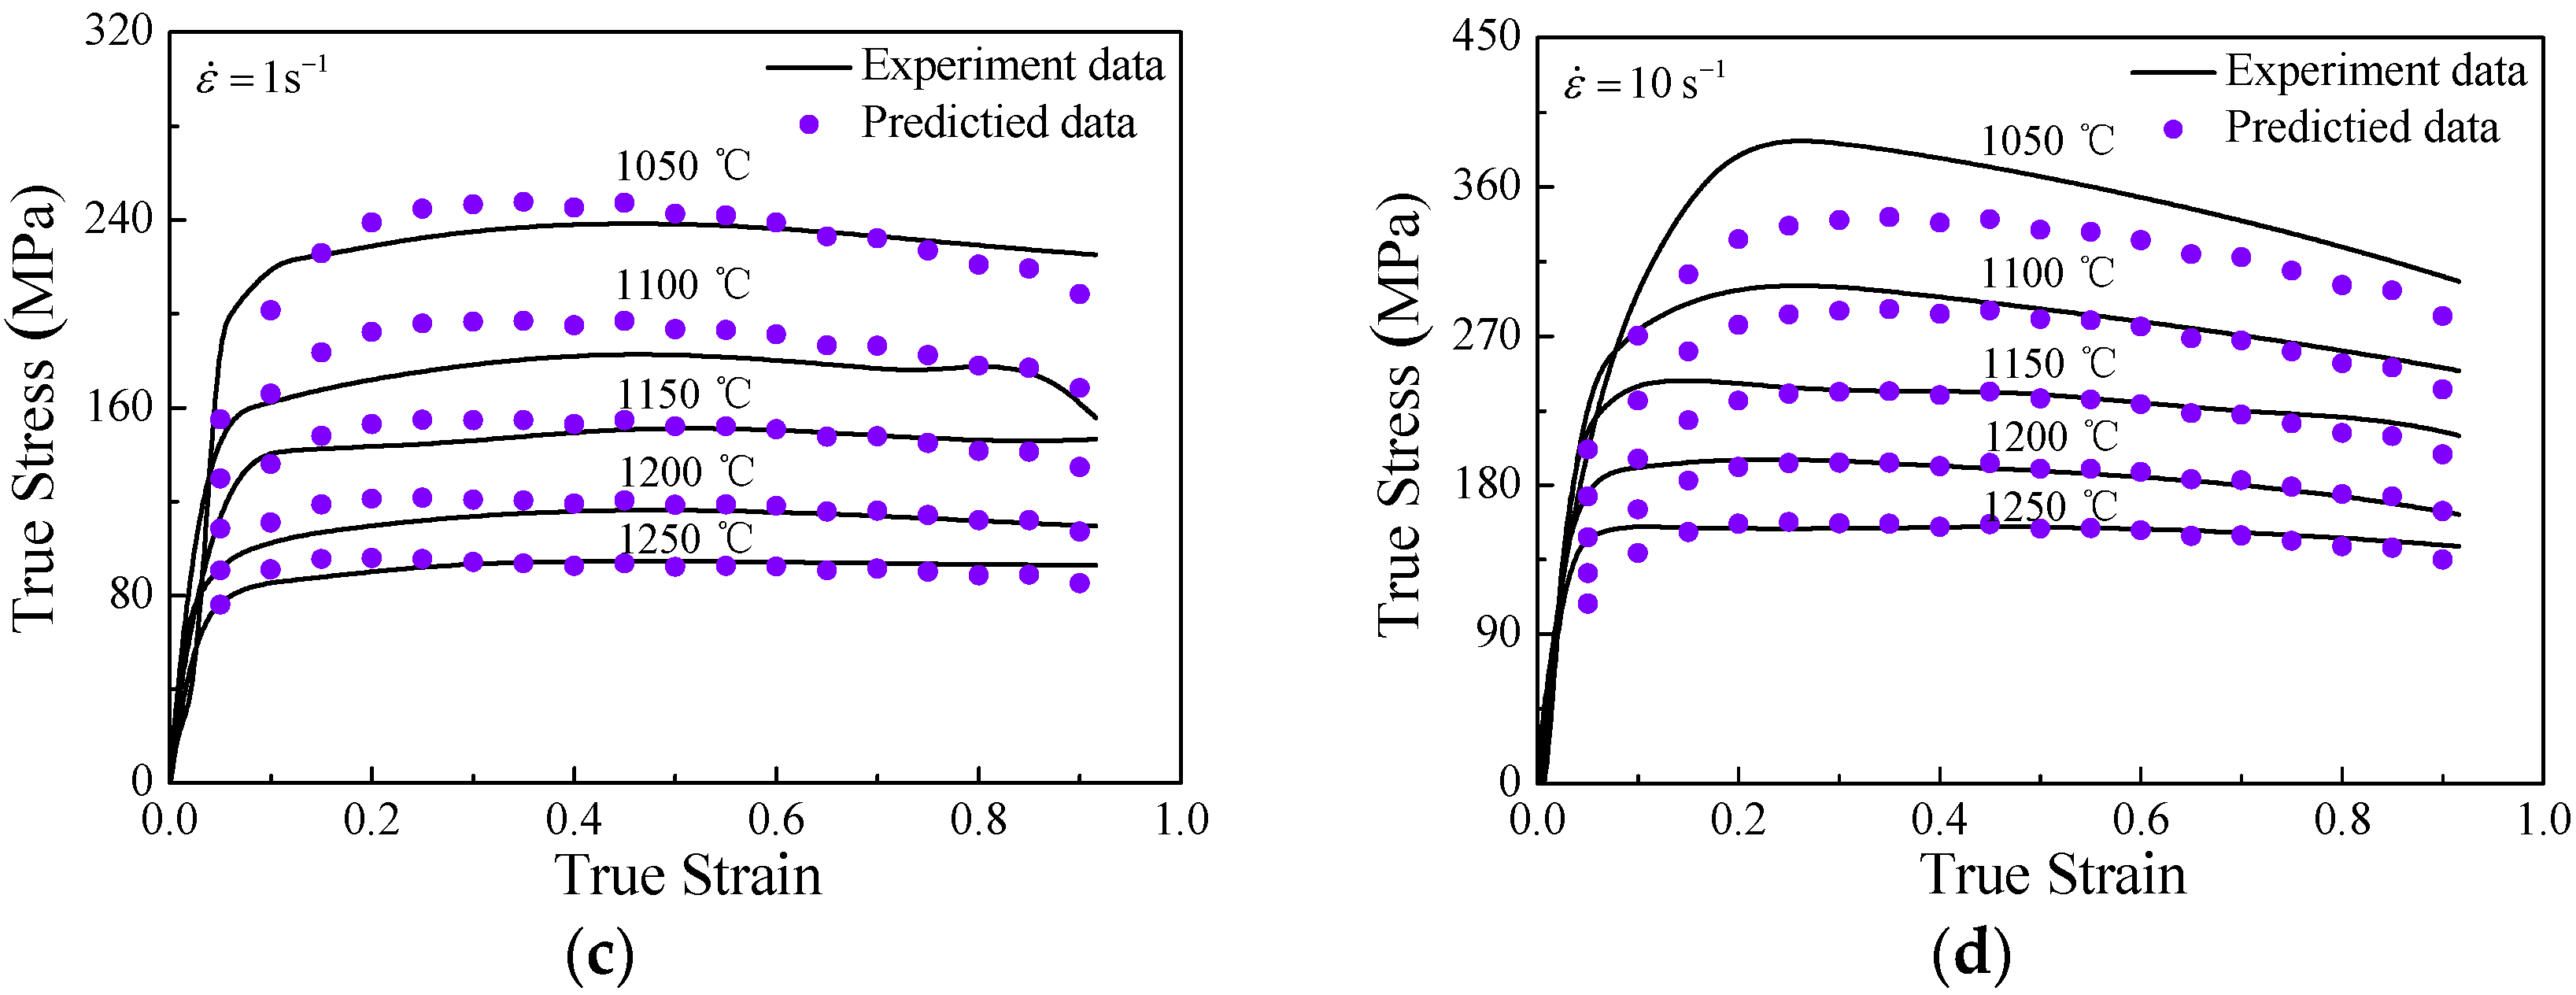
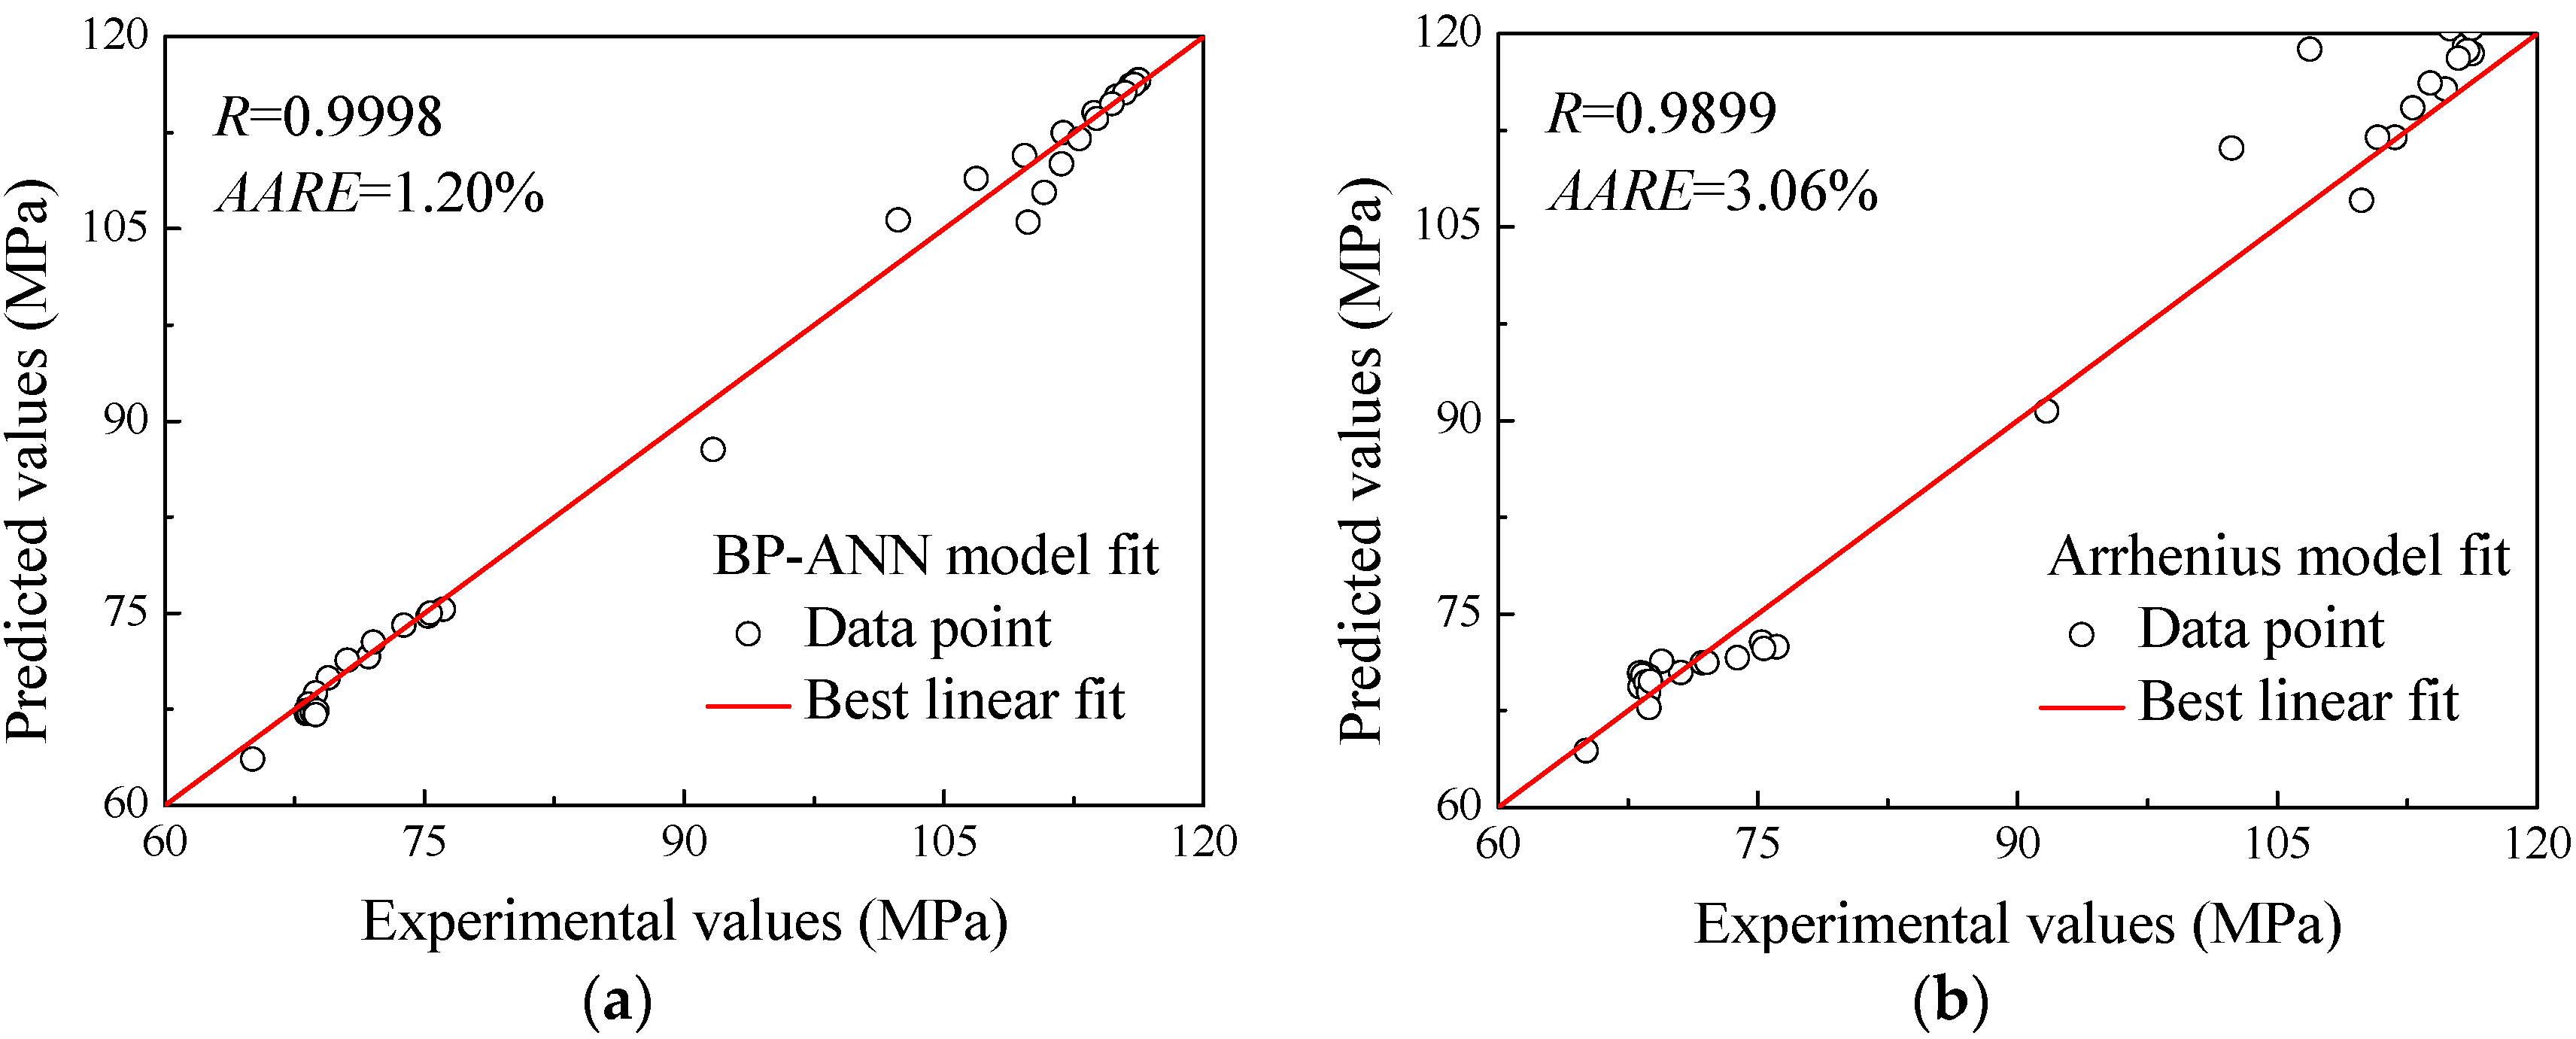
5. Prediction Capability Comparison between the BP-ANN Model and Arrhenius Type Constitutive Equation

Depending on the improved Arrhenius type constitutive equation, in this study, the true stresses of 32 points under the conditions of 1100 °C and 0.01 s−1 and 1200 °C and 1 s−1 at a strain range of 0.05 to 0.9 with a strain interval of 0.05 were calculated to compare with the true stress predicted by BP-ANN model and obtained from the isothermal compression tests. For the sake of the contrast of prediction accuracy between these two models, the relative error (δ) is introduced, which is expressed by Equation (14).
δ (%) = P i E i E i × 100 %
where E i is the sample of experimental value and P i is the sample of predicted value.
The δ-values relative to the experimental true stress was calculated by Equation (14) and listed in Table 2.
It is found in Table 2 that the relative percentage error obtained from BP-ANN model varies from −4.26% to 3.24%, whereas it is in the range from −4.83% to 11.13% for the improved Arrhenius-type constitutive model. As shown in Figure 8a,b, the relative percentage errors have been summarized in which the height of the histogram expresses the relative frequency of the relative percentage errors. Through nonlinear curve fitting, the distributions of relative percentage errors obtained from Arrhenius-type model and BP-ANN model present a typical Gaussian distribution, which was expressed as in Equation (15). In the function, the two parameters of μ and w represent the mean value and standard deviation, respectively, which are two of the most important indexes in statistical work. The mean value and standard deviation calculated by Equations (16) and (17) [6], respectively, reflect the central tendency and discrete degree of a set of data, and smaller value of w and μ close to 0 hint that better errors distribution is achieved. As shown in Figure 8a,b, the mean value ( μ ) and the standard deviation ( w ) of the Arrhenius-type model is 3.0012 and 2.0533, respectively, while the mean value ( μ ) and the standard deviation ( w ) of the BP-ANN model is 0.0714 and 0.2564, respectively, which indicate that the distribution of relative percentage errors obtained by the BP-ANN model is more centralized. It suggests that the BP-ANN model has a good generalization capability.
y = y 0 + A e ( δ i μ ) 2 2 w 2
μ = 1 N i = 1 N δ i
w = 1 N 1 i = 1 N ( δ i μ ) 2
where δi is a value of the relative error; μ, w, and y are the mean value, standard deviation and probability density of δ respectively; y0 and A are constants, and N is the number of relative errors, here N = 36.
In addition, two commonly used statistical indicators of the correlation coefficient (R) and average absolute relative error (AARE) are introduced to check the ability and the predictability of the BP-ANN model and Arrhenius-type model, which are expressed by Equations (18) and (19) [6]. R is a numerical value between −1 and 1 that expresses the strength of the linear relationship between two variables. A high R-value close to 1 illustrates that the predicted values conform to the experimental ones well. A value of 0 indicates that there is no relationship. Value close to −1 signal a strong negative relationship between the two variables. The average absolute relative error (AARE) is also computed through a term-by-term comparison of the relative error and thus is an unbiased statistical parameter to measure the predictability of a model [6,15]. Meanwhile, a low AARE-value close to 0 indicates that the sum of the errors between the predicted and experimental values tends to be 0.
R = i = 1 N ( E i E ¯ ) ( P i P ¯ ) i = 1 N ( E i E ¯ ) 2 i = 1 N ( P i P ¯ ) 2
A A R E (%) = 1 N i = 1 N | P i E i E i | × 100 %
where E i is the sample of experimental value and P i is the sample of predicted value. E ¯ is the mean value of experimental sample values, P ¯ is the mean value of predicted sample values, and N is the number of data which were employed in the investigation.
The correlation relationships between the experimental and respectively predicted true stress by BP-ANN model and modified Arrhenius-type constitutive equation were illustrated in Figure 9. It is discovered that the points in Figure 9, which take experimental true stress as horizontal axis and predicted true stress as vertical axis, lie fairly close to the best linear fitted line, suggesting that the predicted stress-strain values conform very well to the homologous experimental ones. Besides, the R-values for the predicted true stress of BP-ANN and modified Arrhenius are 0.9998 and 0.9899, respectively, from another quantitative perspective proving the strong linear relationships between the predicted and experimental true stress. Additionally, the AARE-values relative to the experimental true stress was calculated by Equation (19) and exhibited in Figure 9. According to the calculation results, it is manifest that the AARE-value for the BP-ANN model is 1.20%, but, for the constitutive equation, it reaches a higher level, 3.06%. Lower AARE-value means a smaller deviation on the whole; therefore, the BP-ANN model has higher accuracy in predicting the true stress of superalloy nimonic 80A than the constitutive equation.
By several comparison methods, the performance of the two models can be concluded that the BP-ANN model has higher prediction accuracy than the improved Arrhenius-type model. It is valuable to note that, in the training stage of the BP-ANN model, the experimental stress-strain data of two test curves under the conditions of 1100 °C and 0.01 s−1 and 1200 °C and 1 s−1 did not participate. However, when establishing the constitutive equation, they were involved. However, even on this premise, the BP-ANN model still shows smaller errors, giving the full proof that the present BP-ANN model has better prediction capability than the constitutive equation in the flow characteristics of superalloy nimonic 80A.

6. Prediction Potentiality of BP-ANN Model

There is no doubt that the well-trained BP-ANN model is effective to predict the flow stress based on the experimental data for the non-linear material. With the well-trained BP-ANN model, the flow stresses outside of the experimental conditions including 950 °C and 1000 °C were predicted for superalloy nimonic 80A. Additionally, based on the data at a temperature range of 950 to 1250 °C under strain rate of 0.01 s−1, 0.1 s−1, 1 s−1 and 10 s−1, an interpolation method was implemented to densely insert stress-strain data into these data; furthermore, a 3D continuous response space (illustrated in Figure 10) with flow stress along the V-axis and deformation temperature, logarithm of strain rate and strain and along the X, Y and Z axes, respectively, was constructed by a surface fitting process. The values of V-axis are represented by different colors. Figure 10a shows the 3D continuous interaction space, which reveals the continuous response relationship between stress and strain, strain rate and temperature of superalloy nimonic 80A. Figure 10b–d respectively exhibit the cutting slices of 3D continuous response mapping at diverse parameters, involving temperature, strain rate and strain. In the 3D continuous interaction space, all the stress-strain points are digital and can be determined, since the surface fitting step has transformed the discrete stress-strain points into continuous stress-strain surface and space. The accuracy of such a 3D continuous interaction space is strongly guaranteed by the excellent prediction performance of an optimally-constructed and well-trained BP-ANN model. As is known, the stress-strain data are the most fundamental data to predict the deformation behaviors of the superalloy nimonic 80A during electric upsetting with finite element model It is realizable to pick out dense stress-strain data from the 3D continuous interaction space and insert such continuous mapping relationships into commercial software such as Marc, etc. by program codes. In this way, the accurate simulation of one certain forming process is able to perform.

7. Conclusions

(1)
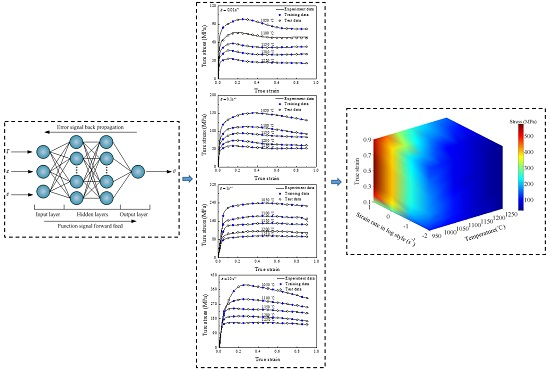
A BP-ANN model taking the deformation temperature (T), strain rate ( ε ˙ ) and strain ( ε ) as input variables and the true stress ( σ ) as output variable was constructed for the compression flow behaviors of superalloy, nimonic 80A, which presents desired precision and reliability.
(2)
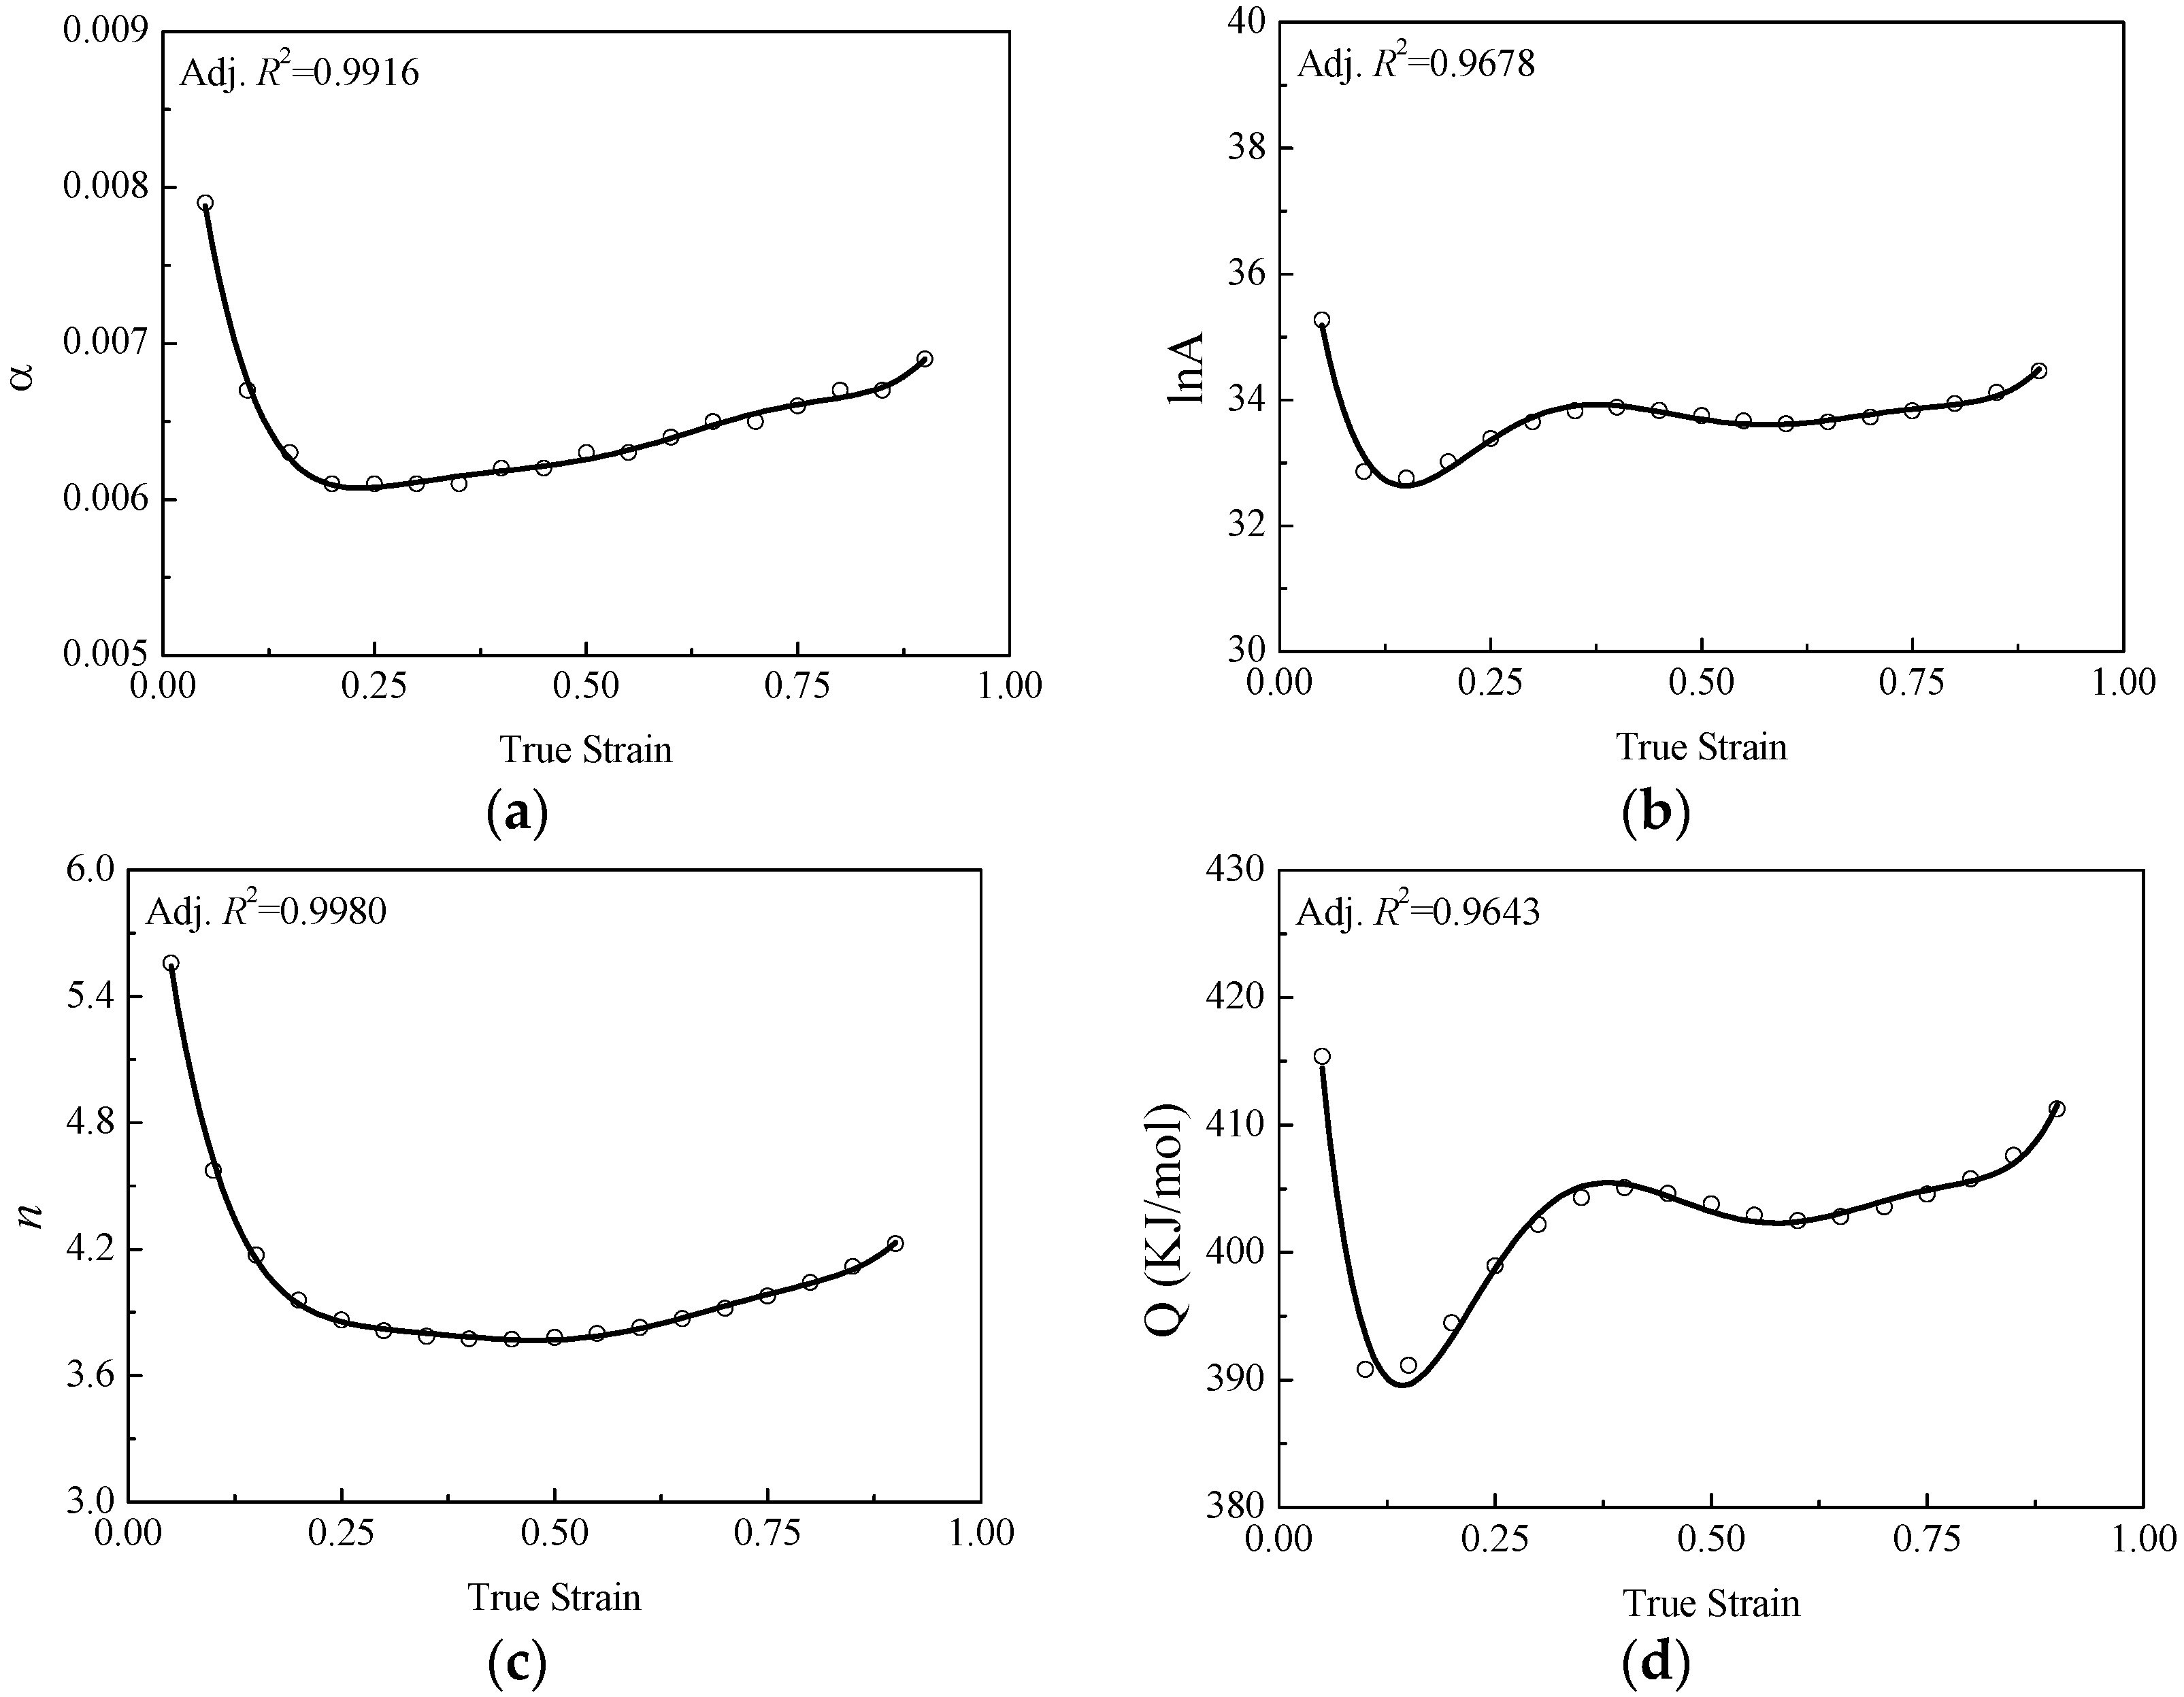
A strain-dependent Arrhenius-type model is developed to predict the flow behavior of superalloy nimonic 80A under the specific deformation conditions. A sixth order polynomial is adopted to reveal the relationships between variable coefficients (including activation energy Q , material constants n , α , and A ) and strain with good correlations.
(3)
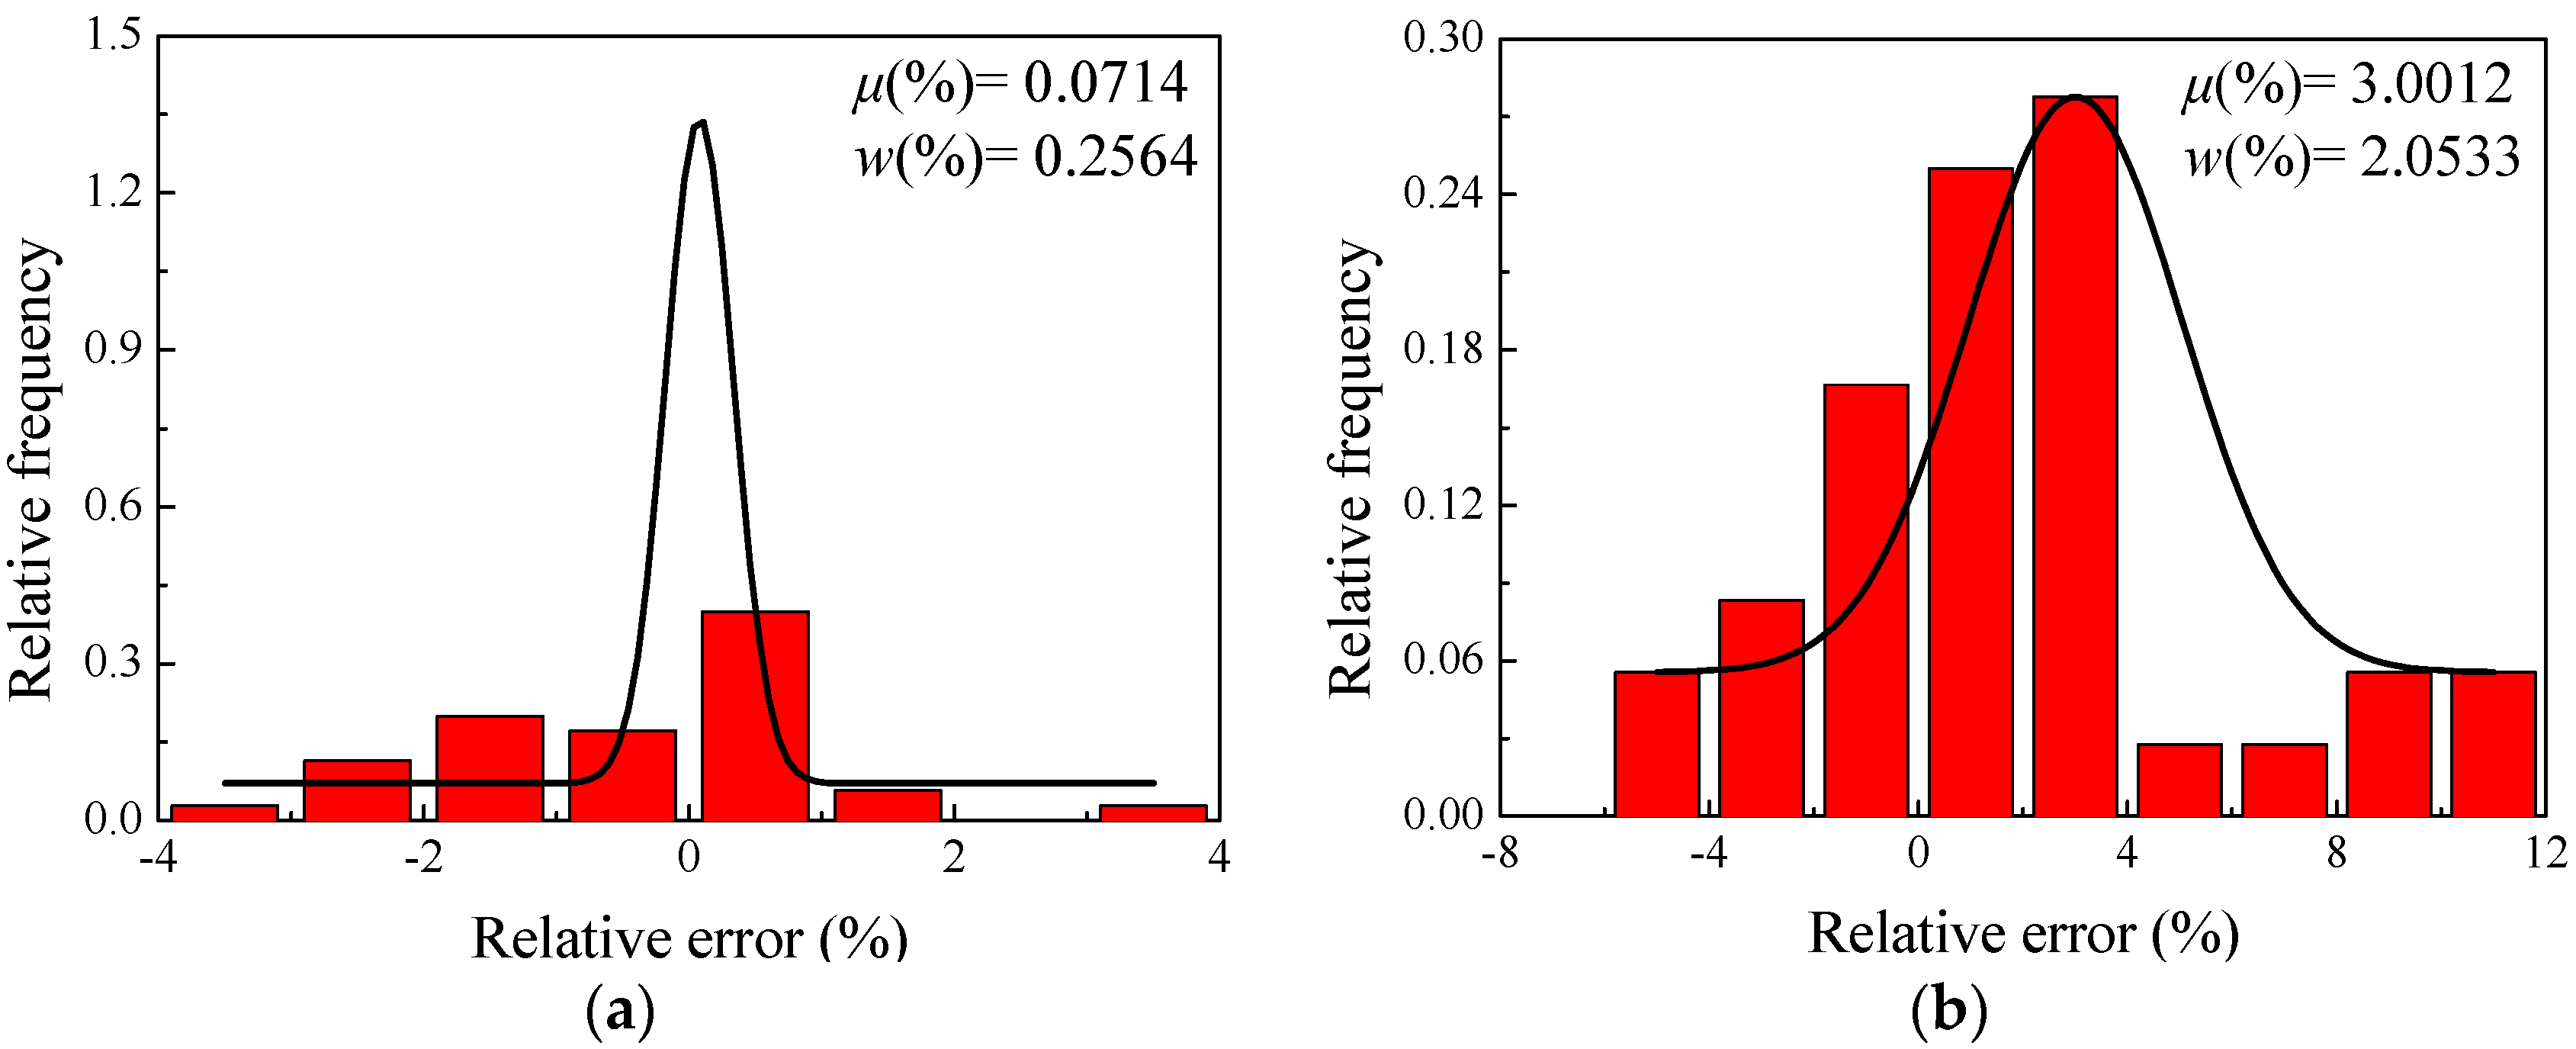
A series of statistical indexes, involving the relative error (δ), mean value ( μ ), standard deviation ( w ), correlation coefficient (R) and average absolute relative error (ARRE), were introduced to contrast the prediction accuracy between the improved Arrhenius type constitutive equation and BP-ANN model. The mean value ( μ ) and standard deviation ( w ) of the improved Arrhenius-type model are 3.0012% and 2.0533%, respectively, while their values of the BP-ANN model are 0.0714% and 0.2564%, respectively. Meanwhile, the correlation coefficient (R) and average absolute relative error (ARRE) for the improved Arrhenius-type model are 0.9899 and 3.06%, while their values for the BP-ANN model are 0.9998 and 1.20%, which indicate that the BP-ANN model has a good generalization capability.
(4)
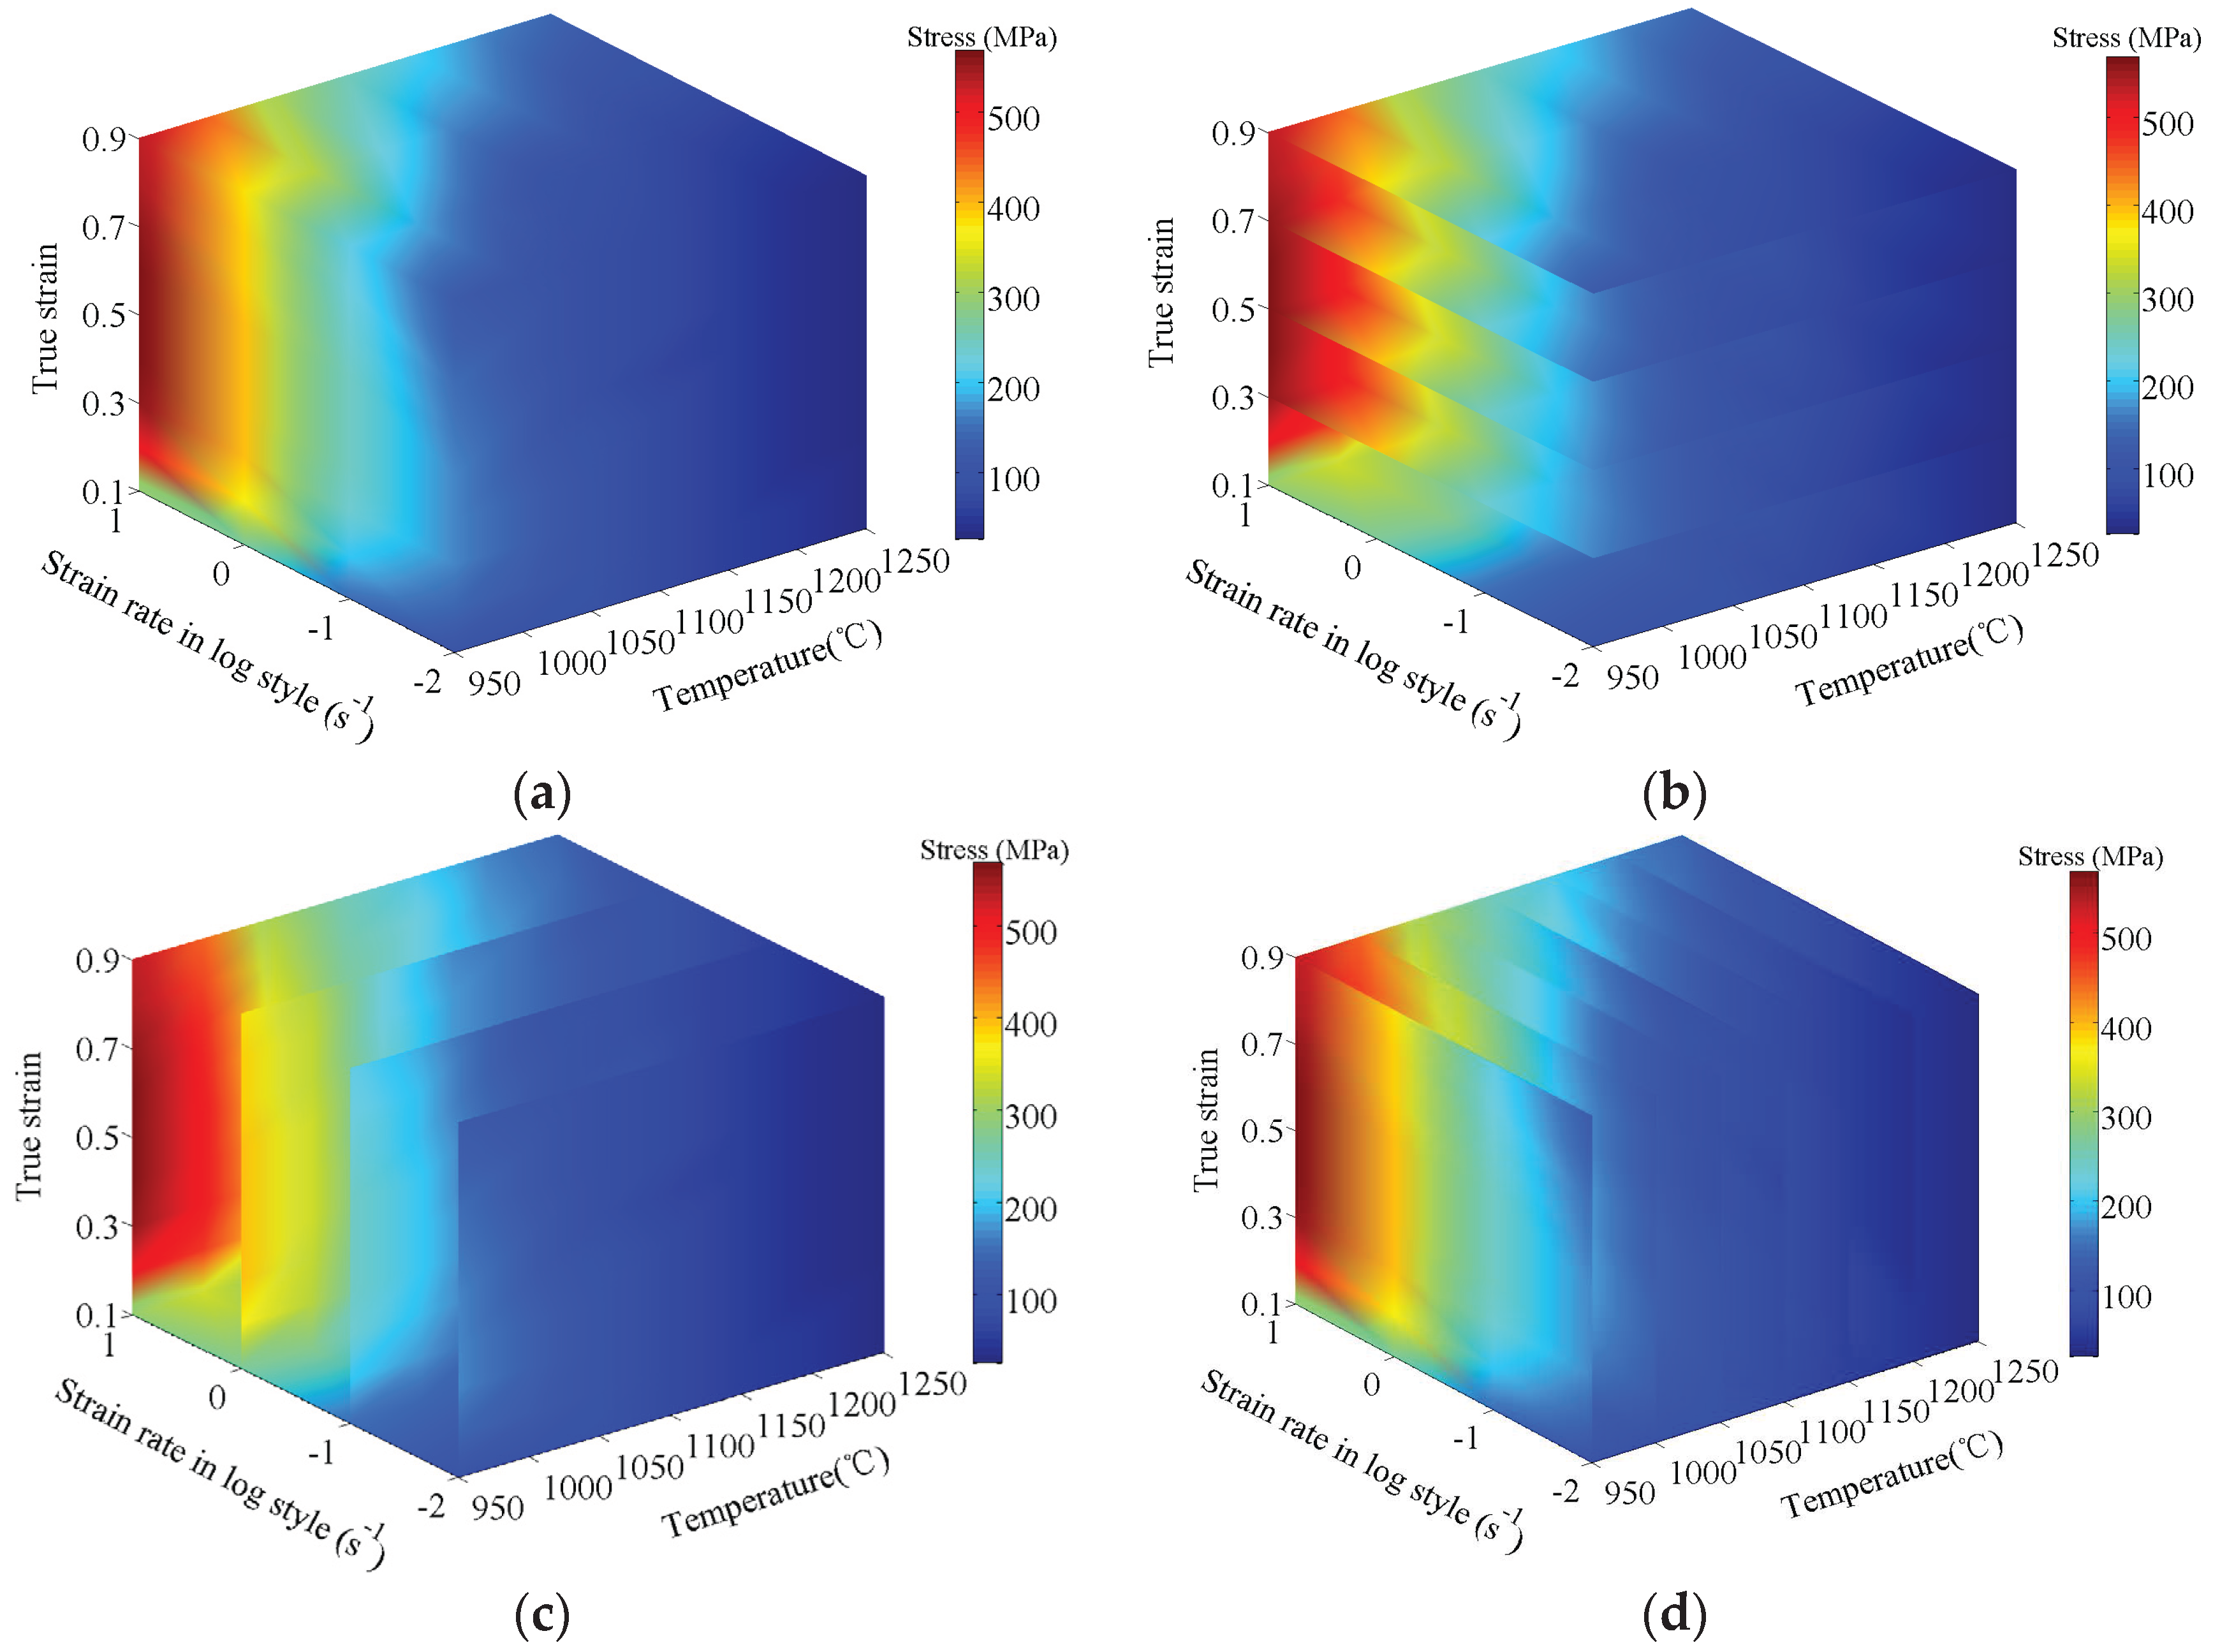
The true stress data within the temperature range of 950–1250 °C, the strain rate range of 0.01–10 s−1, and the strain range of 0.1–0.9 were predicted densely. According to these abundant data, a 3D continuous interaction space was constructed by interpolation and surface fitting methods. It significantly contributes to all the research requesting abundant and accurate stress-strain data of superalloy nimonic 80A.

Acknowledgments

This work was supported by the National Natural Science Foundation of China (51305469). The corresponding author was appreciated from the Chongqing Higher School Youth-Backbone Teacher Support Program.

Author Contributions

Guo-zheng Quan and Jia Pan conceived and designed the experiments; Xuan Wang performed the experiments; Jia Pan and Xuan Wang analyzed the data; Xuan Wang contributed reagents/materials/analysis tools; Guo-zheng Quan and Jia Pan wrote the paper.

Conflicts of Interest

The authors declare no conflict of interest.

References

  1. Kim, D.K.; Kim, D.Y.; Ryu, S.H.; Kim, D.J. Application of Nimonic 80A to the hot forging of an exhaust valve head. J. Mater. Process. Technol. 2001, 113, 148–152. [Google Scholar] [CrossRef]
  2. Zhu, Y.; Zhimin, Y.; Jiangpin, X. Microstructural mapping in closed die forging process of superalloy Nimonic 80A valve head. J. Alloys Compd. 2011, 509, 6106–6112. [Google Scholar] [CrossRef]
  3. Tian, B.; Zickler, G.A.; Lind, C.; Paris, O. Local microstructure and its influence on precipitation behavior in hot deformed Nimonic 80A. Acta Mater. 2003, 51, 4149–4160. [Google Scholar] [CrossRef]
  4. Quan, G.-Z.; Mao, A.; Luo, G.-C.; Liang, J.-T.; Wu, D.-S.; Zhou, J. Constitutive modeling for the dynamic recrystallization kinetics of as-extruded 3Cr20Ni10W2 heat-resistant alloy based on stress-strain data. Mater. Des. 2013, 52, 98–107. [Google Scholar] [CrossRef]
  5. Quan, G.-Z.; Liang, J.-T.; Liu, Y.-Y.; Luo, G.-C.; Shi, Y.; Zhou, J. Identification of optimal deforming parameters from a large range of strain, strain rate and temperature for 3Cr20Ni10W2 heat-resistant alloy. Mater. Des. 2013, 52, 593–601. [Google Scholar] [CrossRef]
  6. Quan, G.-Z.; Lv, W.-Q.; Mao, Y.-P.; Zhang, Y.-W.; Zhou, J. Prediction of flow stress in a wide temperature range involving phase transformation for as-cast Ti–6Al–2Zr–1Mo–1V alloy by artificial neural network. Mater. Des. 2013, 50, 51–61. [Google Scholar] [CrossRef]
  7. Lin, Y.C.; Chen, X.-M. A critical review of experimental results and constitutive descriptions for metals and alloys in hot working. Mater. Des. 2011, 32, 1733–1759. [Google Scholar] [CrossRef]
  8. Huang, Y.-C.; Lin, Y.C.; Deng, J.; Liu, G.; Chen, M.-S. Hot tensile deformation behaviors and constitutive model of 42CrMo steel. Mater. Des. 2014, 53, 349–356. [Google Scholar] [CrossRef]
  9. Lin, Y.-C.; Chen, M.-S.; Zhang, J. Modeling of flow stress of 42CrMo steel under hot compression. Mater. Sci. Eng. A 2009, 499, 88–92. [Google Scholar] [CrossRef]
  10. Ji, G.; Li, F.; Li, Q.; Li, H.; Li, Z. A comparative study on Arrhenius-type constitutive model and artificial neural network model to predict high-temperature deformation behaviour in Aermet100 steel. Mater. Sci. Eng. A 2011, 528, 4774–4782. [Google Scholar] [CrossRef]
  11. Peng, W.; Zeng, W.; Wang, Q.; Yu, H. Comparative study on constitutive relationship of As-cast Ti60 titanium alloy during hot deformation based on Arrhenius-type and artificial neural network models. Mater. Des. 2013, 51, 95–104. [Google Scholar] [CrossRef]
  12. Wu, H.; Wen, S.P.; Huang, H.; Wu, X.L.; Gao, K.Y.; Wang, W.; Nie, Z.R. Hot deformation behavior and constitutive equation of a new type Al–Zn–Mg–Er–Zr alloy during isothermal compression. Mater. Sci. Eng. A 2016, 651, 415–424. [Google Scholar] [CrossRef]
  13. Ji, G.; Li, F.; Li, Q.; Li, H.; Li, Z. Prediction of the hot deformation behavior for Aermet100 steel using an artificial neural network. Comput. Mater. Sci. 2010, 48, 626–632. [Google Scholar] [CrossRef]
  14. Sabokpa, O.; Zarei-Hanzaki, A.; Abedi, H.R.; Haghdadi, N. Artificial neural network modeling to predict the high temperature flow behavior of an AZ81 magnesium alloy. Mater. Des. 2012, 39, 390–396. [Google Scholar] [CrossRef]
  15. Haghdadi, N.; Zarei-Hanzaki, A.; Khalesian, A.R.; Abedi, H.R. Artificial neural network modeling to predict the hot deformation behavior of an A356 aluminum alloy. Mater. Des. 2013, 49, 386–391. [Google Scholar] [CrossRef]
  16. Lu, Z.; Pan, Q.; Liu, X.; Qin, Y.; He, Y.; Cao, S. Artificial neural network prediction to the hot compressive deformation behavior of Al–Cu–Mg–Ag heat-resistant aluminum alloy. Mech. Res. Commun. 2011, 38, 192–197. [Google Scholar] [CrossRef]
  17. Xiao, X.; Liu, G.Q.; Hu, B.F.; Zheng, X.; Wang, L.N.; Chen, S.J.; Ullah, A. A comparative study on Arrhenius-type constitutive equations and artificial neural network model to predict high-temperature deformation behaviour in 12Cr3WV steel. Comput. Mater. Sci. 2012, 62, 227–234. [Google Scholar] [CrossRef]
  18. Han, Y.; Qiao, G.; Sun, J.; Zou, D. A comparative study on constitutive relationship of As-cast 904L austenitic stainless steel during hot deformation based on Arrhenius-type and artificial neural network models. Comput. Mater. Sci. 2013, 67, 93–103. [Google Scholar] [CrossRef]
  19. Li, H.-Y.; Wang, X.-F.; Wei, D.-D.; Hu, J.-D.; Li, Y.-H. A comparative study on modified Zerilli-Armstrong, Arrhenius-type and artificial neural network models to predict high-temperature deformation behavior in T24 steel. Mater. Sci. Eng. A 2012, 536, 216–222. [Google Scholar] [CrossRef]
  20. Gupta, A.K.; Singh, S.K.; Reddy, S.; Hariharan, G. Prediction of flow stress in dynamic strain aging regime of austenitic stainless steel 316 using artificial neural network. Mater. Des. 2012, 35, 589–595. [Google Scholar] [CrossRef]
  21. Bahrami, A.; Mousavi-Anijdan, S.H.; Madaah-Hosseini, H.R.; Shafyei, A.; Narimani, R. Effective parameters modeling in compression of an austenitic stainless steel using artificial neural network. Comput. Mater. Sci. 2005, 34, 335–341. [Google Scholar] [CrossRef]
  22. Zhu, Y.; Zeng, W.; Sun, Y.; Feng, F.; Zhou, Y. Artificial neural network approach to predict the flow stress in the isothermal compression of As-cast TC21 titanium alloy. Comput. Mater. Sci. 2011, 50, 1785–1790. [Google Scholar] [CrossRef]
  23. Serajzadeh, S. Prediction of temperature distribution and required energy in hot forging process by coupling neural networks and finite element analysis. Mater. Lett. 2007, 61, 3296–3300. [Google Scholar] [CrossRef]
  24. Phaniraj, M.P.; Lahiri, A.K. The applicability of neural network model to predict flow stress for carbon steels. J. Mater. Process. Technol. 2003, 141, 219–227. [Google Scholar] [CrossRef]
  25. Srinivasa, N.; Prasad, Y.V.R.K. Hot working characteristics of nimonic 75, 80A and 90 superalloys: A comparison using processing maps. J. Mater. Process. Technol. 1995, 51, 171–192. [Google Scholar] [CrossRef]
  26. Sheikh, H.; Serajzadeh, S. Estimation of flow stress behavior of AA5083 using artificial neural networks with regard to dynamic strain ageing effect. J. Mater. Process. Technol. 2008, 196, 115–119. [Google Scholar] [CrossRef]
  27. Sellars, C.M.; Mctegart, W.J. On the mechanism of hot deformation. Acta Metall. 1966, 14, 1136–1138. [Google Scholar] [CrossRef]
  28. Zener, C.; Hollomon, J.H. Effect of strain rate upon plastic flow of steel. J. Appl. Phys. 1944, 15, 22–32. [Google Scholar] [CrossRef]
  29. Liu, Y.; Yao, Z.; Ning, Y.; Nan, Y.; Guo, H.; Qin, C.; Shi, Z. The flow behavior and constitutive equation in isothermal compression of FGH4096-GH4133B dual alloy. Mater. Des. 2014, 63, 829–837. [Google Scholar] [CrossRef]
  30. Samantaray, D.; Mandal, S.; Bhaduri, A.K. A comparative study on Johnson Cook, modified Zerilli-Armstrong and Arrhenius-type constitutive models to predict elevated temperature flow behaviour in modified 9Cr–1Mo steel. Comput. Mater. Sci. 2009, 47, 568–576. [Google Scholar] [CrossRef]
  31. Cai, J.; Wang, K.; Zhai, P.; Li, F.; Yang, J. A modified Johnson-Cook constitutive equation to predict hot deformation behavior of Ti–6Al–4V alloy. J. Mater. Eng. Perform. 2014, 24, 32–44. [Google Scholar] [CrossRef]
  32. Wang, W.-T.; Guo, X.-Z.; Huang, B.; Tao, J.; Li, H.-G.; Pei, W.-J. The flow behaviors of clam steel at high temperature. Mater. Sci. Eng. A 2014, 599, 134–140. [Google Scholar] [CrossRef]
Figure 1. The true stress-strain curves of superalloy nimonic 80A under the different temperatures with strain rates (a) 0.01 s−1; (b) 0.1 s−1; (c) 1 s−1; (d) 10 s−1.
Applsci 06 00066 g001
Figure 2. The schematic of the back-propagational artificial neural network architecture.
Applsci 06 00066 g002
Figure 3. The comparison of the BP-ANN prediction with experimental values at different temperatures and strain rates (a) 0.01 s−1; (b) 0.1 s−1; (c) 1 s−1; (d) 10 s−1.
Applsci 06 00066 g003
Figure 4. Relationship between (a) ln σ and ln ε ˙ and (b) σ and ln ε ˙ .
Applsci 06 00066 g004
Figure 5. Relationships between: (a) ln ( sinh ( α σ ) ) and ln ε ˙ (b) ln ( sinh ( α σ ) ) and 1 / T .
Applsci 06 00066 g005
Figure 6. Relationships between: (a) α ; (b) lnA; (c) n; and (d) Q and true strain ε by polynomial fit.
Applsci 06 00066 g006
Figure 7. Comparisons between predicted and measured under different deformation temperatures with strain rates of (a) 0.01 s−1; (b) 0.1 s−1; (c) 1 s−1 and (d) 10 s−1.
Applsci 06 00066 g007aApplsci 06 00066 g007b
Figure 8. The relative errors distribution on the true stress points predicted by (a) the BP-ANN model and (b) the Arrhenius type constitutive equation relative to the experimental ones.
Applsci 06 00066 g008
Figure 9. The correlation relationships between the predicted and experimental true stress for the (a) BP-ANN model and (b) Arrhenius-type model.
Applsci 06 00066 g009
Figure 10. The 3D relationships among temperature, strain rate, strain and stress: (a) 3D continuous interaction space, 3D continuous mapping relationships under different (b) temperatures; (c) strain rates and (d) strains.
Applsci 06 00066 g010
Table 1. Polynomial fitting results of superalloy nimonic 80A.
αlnAnQ
B00.01006C040.29126D07.23447E0467.28232
B1−0.05783C1−144.12464D1−44.03632E1−1502.21622
B20.33009C2982.95072D2234.75515E210438.62694
B3−0.95142C3−3062.36904D3−653.05658E3−32768.83516
B41.47519C44851.02761D4984.16398E452125.14469
B5−1.16554C5−3813.23640D5−756.88970E5−41.091.74522
B60.36783C61183.77777D6232.91924E612784.92195
Table 2. Relative errors of the predicted results by the back-propagational artificial neural network (BP-ANN) model and constitutive equation to experimental results under the condition of 1100 °C and 0.01 s−1 and 1200 °C and 1 s−1.
Strain Rate (s−1)Temperature (°C)StrainTrue Stress (MPa)EquationRelative Error (%)
ExperimentalBP-ANNBP-ANNEquation
0.0111000.0565.0863.5964.37−2.29−1.08
0.1071.8071.5871.18−0.31−0.86
0.1575.2474.7572.79−0.64−3.25
0.2076.0975.3172.42−1.03−4.83
0.2575.3574.9972.30−0.47−4.04
0.3073.8174.0571.590.33−3.01
0.3572.0672.7571.230.96−1.15
0.4070.5771.3170.431.04−0.20
0.4569.4769.9371.330.672.68
0.5068.7368.7770.150.052.06
0.5568.3267.9070.40−0.623.04
0.6068.1767.3670.40−1.183.28
0.6568.2067.1369.34−1.561.68
0.7068.3467.1370.24−1.782.77
0.7568.5467.2669.70−1.871.69
0.8068.7267.3968.91−1.930.28
0.8568.8067.3769.76−2.081.39
0.9068.7367.0867.71−2.41−1.49
112000.0591.6787.7690.72−4.26−1.04
0.10102.36105.69111.123.248.55
0.15106.88108.91118.771.9011.13
0.20109.66110.69121.140.9410.47
0.25111.91112.48121.600.518.66
0.30113.69114.08120.830.356.28
0.35114.99115.35120.390.314.69
0.40115.82116.21119.020.342.76
0.45116.23116.63120.400.343.59
0.50116.27116.61118.440.301.87
0.55115.99116.25118.690.222.33
0.60115.45115.62118.070.142.26
0.65114.71114.75115.690.040.86
0.70113.82113.58116.16−0.202.06
0.75112.83112.03114.25−0.711.26
0.80111.81110.07111.94−1.550.12
0.85110.80107.84111.96−2.671.05
0.90109.86105.50107.05−3.97−2.56

