Review

The Spectrum of Density Fluctuations of Noble Gases Probed by THz Neutron and X-ray Spectroscopy

by
Alessandro Cunsolo
National Synchrotron Light Source II, Brookhaven National Laboratory, Upton, NY 11973, USA
Appl. Sci. 2016, 6(3), 64; https://doi.org/10.3390/app6030064
Submission received: 24 November 2015 / Revised: 21 January 2016 / Accepted: 25 January 2016 / Published: 26 February 2016
(This article belongs to the Special Issue Frontiers in Terahertz Science and Technology)

Abstract

:
Approximately 50 years of inelastic scattering studies of noble gases are reviewed to illustrate the main advances achieved in the understanding of the THz dynamics of simple systems. The gradual departure of the spectral shape from the hydrodynamic regime is discussed with an emphasis on the phenomenology of fast (sub-ps) relaxation processes. This review shows that relaxation phenomena in noble gases have an essentially collisional origin, which is also revealed by the parallelism between their characteristic timescale and the interatomic collision time. Additionally, recent THz spectroscopy results on noble gases at extreme thermodynamic conditions are discussed to illustrate the need for a revision of our current understanding of the supercritical phase.

1. Introduction

The study of the collective molecular dynamics of liquids and glassy materials has been a vibrant field of research since the dawn of modern science. However, in spite of an intensive theoretical, experimental and computational scrutiny, the dynamic response of these systems still presents many unsettled aspects, mainly owing to the inherent disorder and complex movements of their microscopic constituents.
Among various variables unveiling the dynamic behavior of a fluid, the spectrum of density fluctuations, S(Q), is of particular interest, since it is directly accessible by both spectroscopic techniques and computer simulation methods. In spectroscopy experiments, S(Q) is probed by generating density fluctuations on a target sample through the collision with a beam of particle-waves, i.e., photons or neutrons. During this collision, an energy ℏω and a momentum ℏQ (here ℏ = h/2π with h being the Plank constant) are transferred from the probe particles to the sample and the former are scattered over the entire solid angle. It was demonstrated that for both neutron [1] and X-ray [2] probes, the scattering intensity is proportional to the dynamic structure factor, S(Q,ω), which provides a snapshot of the dynamic response of the sample through an average over timescales ∝ ω−1 and distances ∝ Q−1.
Therefore, the (Q) region explored in a spectroscopy measurement can be expanded enough to cover the whole transition of the dynamics from the macroscopic regime to the microscopic one. The shape of S(Q) is exactly predicted within these two limits and essentially unknown in between, i.e. in the so-called mesoscopic region, corresponding to Q’s and ω’s matching the inverse of intermolecular separations and cage oscillation frequencies, respectively. Investigations of this region may unravel fundamental aspects of molecular motions and mutual interactions in disordered systems and can be ideally performed by X-ray (IXS) and neutron (INS) scattering techniques, as well as by computational methods. Due to the lack of rigorous theoretical predictions, our understanding of the dynamics of disordered systems at mesoscopic scales is often limited to a phenomenological analysis of experimental and computational results.

1.1. The Dynamics of Molecules at Mesoscopic Scales

In the macroscopic limit, a liquid appears as a continuum, whose dynamic response is averaged over a large amount of intermolecular interactions. For such a system, the hydrodynamic theory can be consistently used to describe S(Q) and ultimately leads to predict a sharp triplet profile [3]. This is composed by the heat diffusion (Rayleigh) central peak, relating to entropy fluctuations, which diffuse at constant pressure (P), and the two Brillouin acoustic side peaks, connected to P fluctuations, propagating at constant entropy.
In the opposite regime, customarily referred to as single particle or impulse approximation limit, the probed dynamic event is essentially the free recoil of the single struck atom after the collision with the probe and before any successive interaction with first neighboring atoms. In this limiting region, the dynamic response of the fluid reflects the momentum distribution of the struck atom, which is Gaussian in shape for both classical and quantum systems.
Several theoretical models have been developed in an attempt to account for the gradual departure of the spectral shape from the hydrodynamic regime. Perhaps the most successful approach is based upon the framework of the Zwanzig-Mori [4,5], or memory function, formalisms. Its core assumption is that the departure from the hydrodynamic regime is gradual enough to be accurately described by leaving the formal structure of hydrodynamic equations unchanged, yet generalizing some thermodynamic and transport parameters as local variables of space and time. From a physical point of view, this local character reflects the non-homogeneous, non-stationary nature of matter at mesoscopic scales.
A similar approach was successfully proposed by a large number of IXS works on samples of increasing complexity, including:
(1)
noble gases [6,7];
(2)
diatomic liquids [8];
(3)
liquid metals [9,10,11];
(4)
hydrogen-bonded systems [12,13,14];
(5)
glass formers [15,16,17,18].

1.2. The Departure from Hydrodynamic Regime and the Onset of Relaxation Processes

Among various phenomena occurring at the departure from the hydrodynamic regime, the coupling of density fluctuations with relaxation phenomena is perhaps the most solidly understood [6,7,12,13,19]. To gain a basic insight on the physics of a relaxation process, one may start from considering that scattering-generated density waves bring the sample away from its local equilibrium. In response, energy redistributions take place from the density perturbation toward internal degrees of freedom, ultimately driving the sample to a new local equilibrium. The timescale needed by the sample to relax to the equilibrium, τ, depends both on the wavelength λ = 2π/Q of the considered density wave and on the sample characteristics. For instance, if λ increases so do both the number of rearranging molecules and the relaxation time.
Furthermore, the timescale of structural relaxations has a temperature (T-)dependence roughly as steep as the one of viscosity, due to the circumstance that viscous resistance hampers internal rearrangements.
These last considerations only apply the so-called structural relaxations, involving collective rearrangements of the structure, which are dominating in highly interconnected many body systems.
Conversely, for monatomic fluids relaxation phenomena mostly have a collisional nature [7,20], especially when λ matches first neighboring molecules’ separations. Collisional relaxations relate to energy transfers between density fluctuations and mutual inter-particle collisions. Compared to structural relaxations, they are faster (usually spanning the 10−13 s range) and weakly dependent on thermodynamic conditions [7,20].
In general, collisional and structural relaxations coexist in a given fluid and their relative relevance depends on the nature of intermolecular interactions, thermodynamic conditions and probed Q value.
Experimental studies of the Q or T-transition between structural and collisional relaxation regimes often present major challenges, as the required access to large Q (or T) intervals and the high statistical accuracy in the spectral shape measurement. Furthermore, advances in the field are currently held back by instrumental limitations, especially concerning resolution width and spectral contrast. Nonetheless, important advances in the understanding of these phenomena have been made and, most importantly, next generation instruments with the required performance will be soon available for the scientific community.

1.3. The Central Role of Noble Gases

Noble gases are ideal samples to investigate relaxation phenomena, due to their extremely simple microscopic constituents and mutual interactions, which make them ideal prototypes to test theoretical models. In contrast to molecular fluids, their microscopic components lack internal degrees of freedom and, contrary to, e.g., metallic liquids, they have simple and short-ranged inter-particle interactions. For instance, the intrinsic simplicity of these samples is crucial to reliably approximate the interatomic potential in molecular dynamics (MD) computer simulations [21]. Another advantage of noble gases is the large compressibility, which is a key factor to achieve substantial variations of density or, equivalently, of the strength of atomic interactions, even with moderate thermodynamic changes.
The purpose of this review is to provide a short overview of THz spectroscopy studies of S(Q) in noble gases and in particular, to discuss the insight they shed on fast relaxation phenomena. Following an essentially chronological order, the review covers a period of approximately 50 years, from the mid-1960s to the present. Beginning from pioneering INS studies mostly seeking for reminiscences of an hydrodynamic S(Q) shape beyond the continuous limit, it discusses the new opportunities offered by the development of IXS toward the end of the past millennium, while illustrating the insight they provide onto the viscoelastic character of the THz dynamics of noble gases. The last sections of this review illustrate recent measurements in the deeply supercritical region calling for a global reconsideration of our understanding of the phase diagram of a fluid.

2. Measurements of the THz Spectrum of Noble Gases up to the 1990s

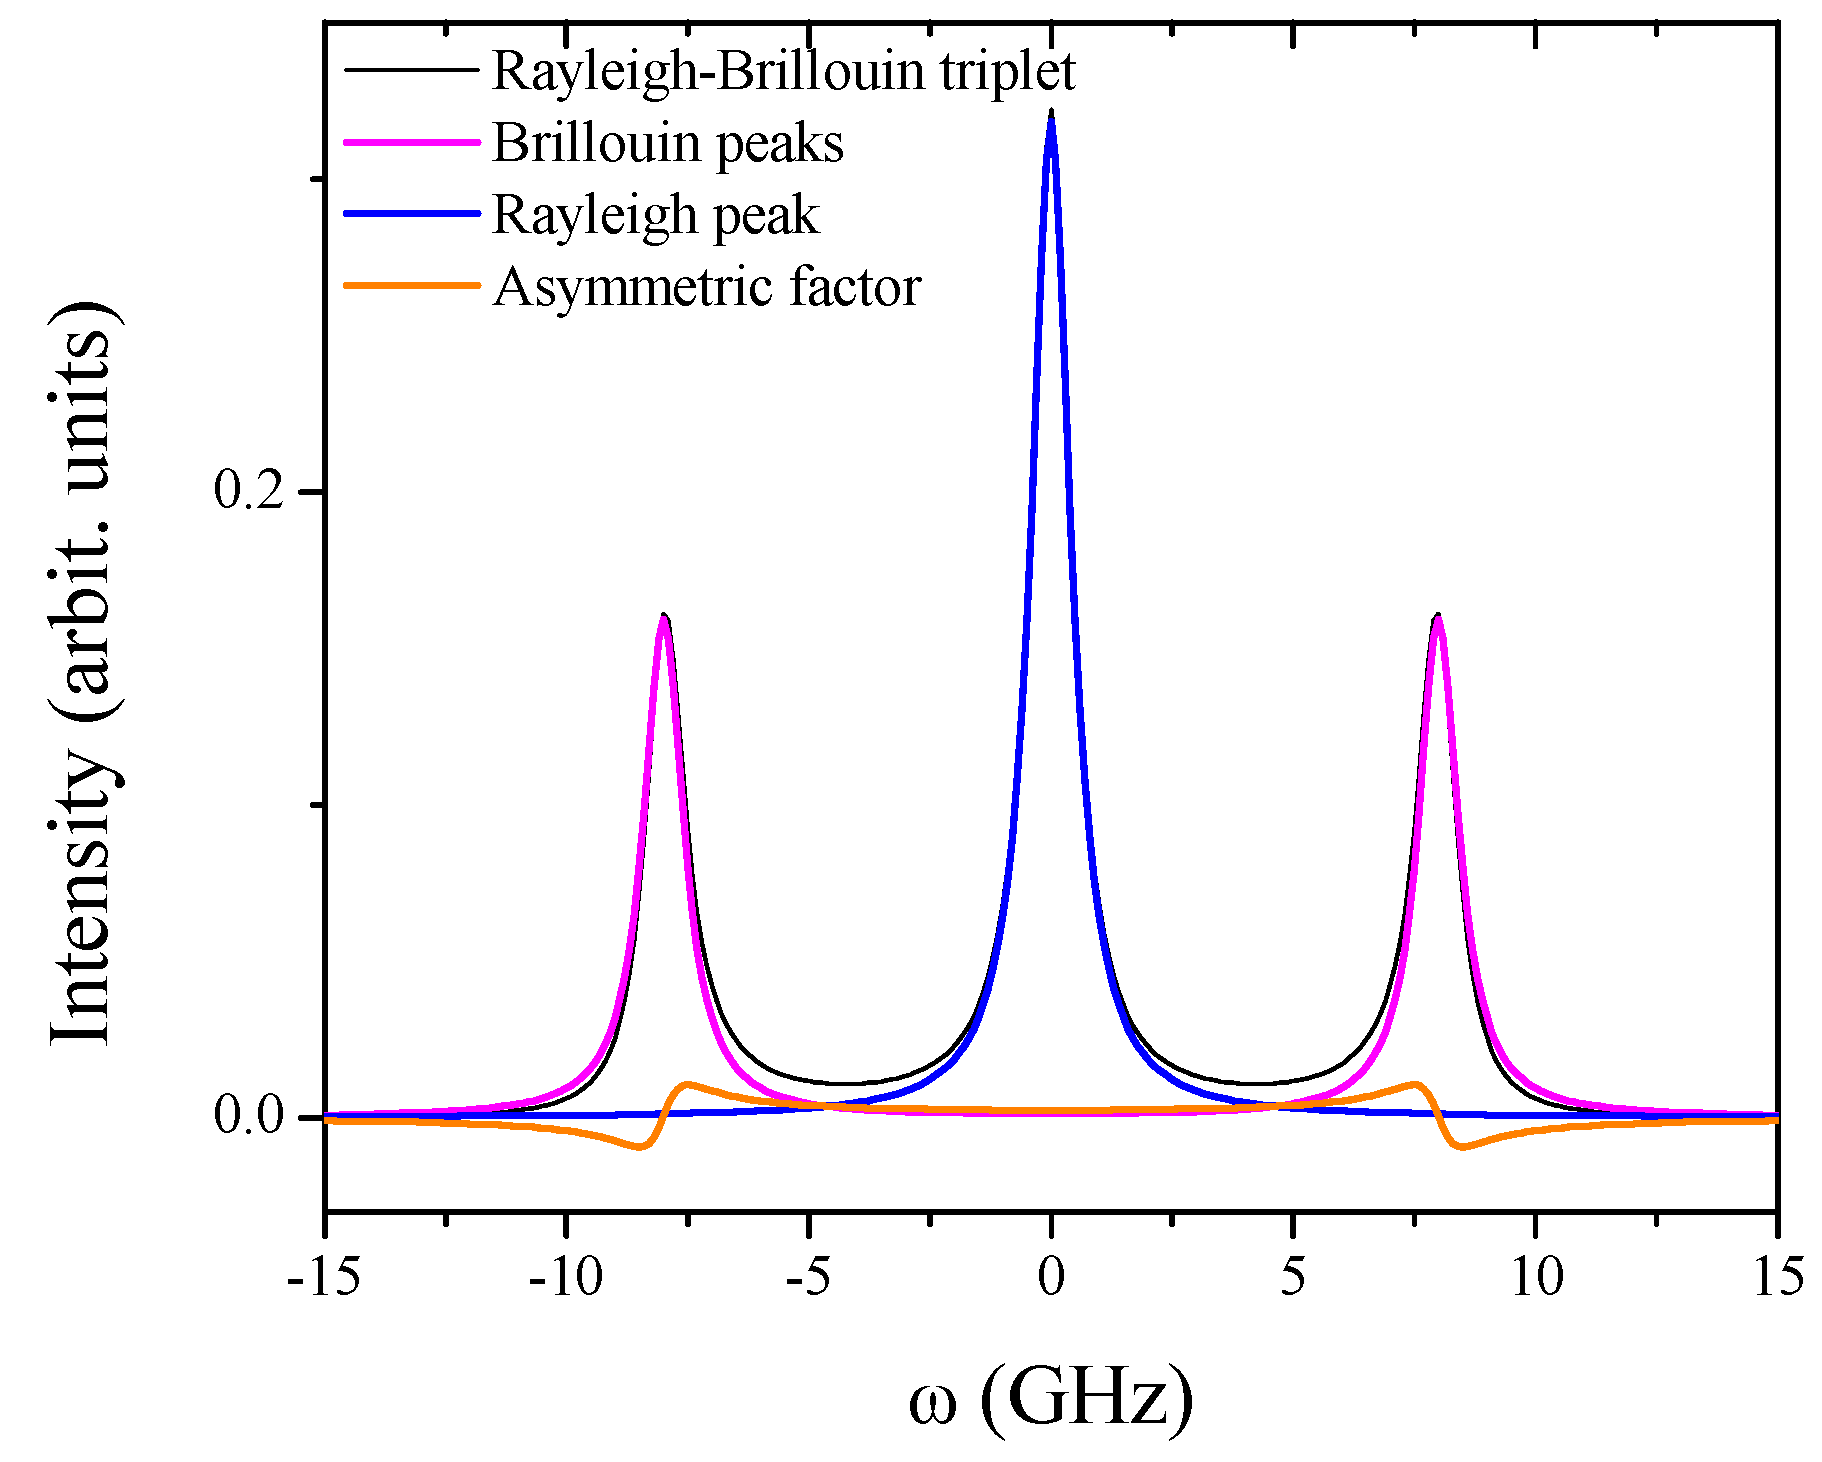
2.1. The Spectral Line-Shape in the Continuous Limit

As mentioned in the introductory section, the variable of interest for this review is the spectrum of density fluctuations, or dynamic structure factor:
S ( Q , ω ) = V d r + δ ρ ( r , t ) δ ρ * ( r , 0 ) e x p [ i ( Q r ω t ) ] d t
with δ ρ ( r , t ) being the space ( r ) and time (t) dependent density fluctuation of the target sample having volume V.
In the quasi-macroscopic regime, S(Q) can be described using the hydrodynamic theory of continuous media [3]. This approach stems from the formal expression of the conservation laws of the (density of) mass, momentum and energy of the fluid plus two constitutive laws: the Navier-Stokes’ and heat transport’s equations. As extensively discussed in several monographies [3,22], the derived spectral shape is dominated by few long-lived collective modes, customarily referred to as hydrodynamic modes. These modes form a triplet well approximated by the following expression:
S ( Q , ω ) = S ( Q ) π { A h z h ω 2 + z h 2 + A S [ z S ( ω ω S ) 2 + z S 2 + z S ( ω + ω S ) 2 + z S 2 ] + + A S b [ ( ω ω S ) ( ω ω S ) 2 + z S 2 ( ω + ω S ) ( ω + ω S ) 2 + z S 2 ] }
with b = [ A h z h / ( 1 A h ) + z s ] / ω s and I s = ( 1 I h ) / 2 .
One readily recognizes the three main components of the spectral shape (from left):
(1)
The heat diffusion (Rayleigh) central peak, which relates to entropy fluctuations diffusing at constant pressure (P).
(2)
The two Brillouin acoustic side peaks, connected to P-fluctuations propagating at constant entropy.
(3)
An additional contribution (term ∝ b) asymmetric around the Brillouin peaks position having negative tails. This term distorts the Lorentzian terms 1) and 2) ultimately enabling the convergence of the spectral moments + ω n S ( Q , ω ) d ω , with n ≤ 2.
The hydrodynamic profile in Equation (2) contains shape parameters whose Q-dependence is not explicitly considered here. However, at low Qs the latter can be expressed through a polynomial Q-expansion (see, e.g., Equations (42)–(45) of [23]), which at the lowest order reads:
{ ( 3 a ) ω s = c s Q ( 3 b ) z s = [ ( γ 1 ) D T + ν L ] Q 2 / 2 ( 3 c ) z h = D T Q 2
Here cs, DT and υL are, respectively, the adiabatic sound velocity the thermal diffusivity and the longitudinal kinematic viscosity.
It should be recognized that Equation (3a–c) are valid only if D T Q 2 , Γ Q 2 < < c s Q , that is if the lifetime of hydrodynamic modes is much longer than the acoustic period. Under these conditions, the hydrodynamic modes are long-lived excitations appearing in the spectrum as well-resolved and sharp peaks, customarily referred to as Rayleigh-Brillouin triplet. Experimental methods such as Brillouin light scattering (BLS) provide a measurement of Rayleigh-Brillouin triplet by typically spanning the 10−3–10−2 nm−1 Q-range. An example of the simplified hydrodynamic spectrum is presented in Figure 1 along with the three separate components discussed above.
The Rayleigh-Brillouin triplet in Equation (2) will be hereafter quoted as either generalized or simplified hydrodynamic spectrum, respectively with or without the lowest order Q approximation in Equation (3a–c).

2.2. 1922–1969: From Theoretical Prediction to Actual Measurements

The hydrodynamic shape of the spectrum was theoretically predicted since the seminal work of Brillouin [24] and the successive theoretical work of Landau and Plazeck during the 1930s [25] (see also the review by Mountain). However, the first experimental measurements of the Brillouin spectrum of liquids could only be performed much later [26], mainly owing to the extremely fine resolving power (ΔE/E < 10−7) required for similar measurements in typical liquid samples. This performance imposes severe technical challenges that can only be addressed by complex interferometric techniques. In regards to noble gases, the first Brillouin study dates back to the measurement on Ar and Ne along the coexistence line [27] performed with a single-pass Fabry-Perot interferometer. Figure 2 provides an example of the Brillouin spectrum of dense Ar measured in this work. The hydrodynamic spectrum reconstructed using thermophysical and transport properties of the sample is also reported for comparison. It clearly appears that the latter profile essentially consists of three extremely narrow peaks, in full consistency with the simple hydrodynamic condition D T Q 2 , Γ Q 2 < < c s Q . Indeed the width of triplet components measured in [27] was either coincident with the resolution function (for the Raileigh peak) or only slightly larger (for Brillouin peaks).
From the position of the peak in the Rayleigh-Brillouin spectrum, Fleury and Boon derived a value of sound velocity slightly lower than the one previously measured by ultrasound (US) absorption techniques at ≈1 MHz. Although such an apparent frequency-decrease of sound velocity, also observed in water [29], initially raised some interest, it lacks a particular physical significance [30] (see also [22], page 263). Rather, it follows from the circumstance that the sound velocity measured by BLS (hypersonic velocity) is expectedly lower by few percent than the counterpart measured by US (ultrasonic velocity), unless competing viscoelastic effects become relevant.
Overall, the shape of the spectrum predicted by the hydrodynamic theory was experimentally confirmed by Brillouin measurement in [27], even though a slight ω-dependence of viscosity was inferred. At this stage the occurrence of a hydrodynamic triplet at macroscopic scales seemed well-assessed experimentally, while a remaining question concerned the persistence of a suitably generalized hydrodynamic profile down to mesoscopic scales. Most experimental studies described in the following paragraphs attempted to answer to this question.

2.3. 1964–1967: Seeking for a Triplet Shape at Mesoscopic Scales

The use of a bare hydrodynamic description of the spectrum becomes questionable when approaching the mesoscopic regime, as therein the matter is no longer continuous, nor stationary. However, there are solid reasons to assume a suitably generalized hydrodynamic theory to hold validity even in this time-space domain. To illustrate this point, it is useful to recognize that for a system at densities typical of the liquid phase, the mean free path spans the 10−10 m window, potentially becoming much smaller than the atomic size. Under these conditions, the movements permitted to the atoms are mainly short, vibration-like, cage oscillations (≈10−13 s). Consequently, even in the (Q ≈ nm−1, ω ≈ THz) mesoscopic range, the response of the system is still “averaged” over a large number of elementary dynamic interactions, which is a necessary pre-requisite for a suitably generalized hydrodynamic description. In this perspective, the persistence of spectral features in the THz spectrum reminiscent of Brillouin hydrodynamic peaks did not appear to be a groundless expectation. Indeed, several INS experiments performed during the mid-1960s aimed at validating this hypothesis by examining inelastic peaks in the spectrum of simple fluids. For instance, this is the case of an INS measurements on dense Ne, Ar and D2 [31], which clearly documented the presence of “extended hydrodynamic” modes in the spectrum. Due to the largely coherent cross section of these samples, both inelastic and quasi-elastic spectral features appeared in the measured spectrum. In particular, it was observed that at low Q values the inelastic shift of the side peaks approached from above the linear hydrodynamic law csQ predicted by Equation (3a). This urged the authors to interpret these peaks as the finite-Q extensions of the acoustic Brillouin peaks to mesoscopic scales. Conversely, Kroo et al. [32] reported no direct evidence of inelastic structures, however they inferred the existence of phonon like excitations indirectly from a comparison between liquid and solid phase spectra. The discrepancy between the results of Chen and those of Kroo is a likely consequence of the different incident wavelength used in the two experiments (4.1 Å and 5.3 Å respectively), which made the two sets of data hardly comparable.
In a successive INS work, Sköld et al. [33] measured the spectrum of Ar in liquid (at T = 94 K and 102 K) and solid (at T = 68 K and 78 K) phases. The authors observed a linear Q-dependence of the inelastic peak at the lowest Qs, with a slope consistent to the adiabatic sound velocity. Furthermore, they showed that, at higher Qs, the sound dispersion curve of the liquid sample vaguely resembles the phonon dispersion curve of the solid, thus suggesting that the local pseudo-periodicity of the liquid structure gives rise to quasi-periodic zones reminiscent of the Brillouin zones of a crystal. Since clear signatures of acoustic excitations in the liquid were found in a Q range equivalent to the second pseudo-Brillouin zone, the authors concluded that at least two somehow “loose” pseudo-Brillouin zones could be identified in liquid argon. A similar conclusion was reached by an earlier INS investigation on liquid Pb [34], as well as a computer simulation on Rb [35]. The latter work used an inter-particle potential model characterized by an oscillatory decay to zero [36] instead of the Lennard-Jones potential routinely used to simulate noble gases. These differences in the interatomic interaction explain why in liquid metals inelastic modes are well-resolved up to almost the position of first diffraction peak (Qm), whereas in noble gases they become overdamped for Q > Qm/2.

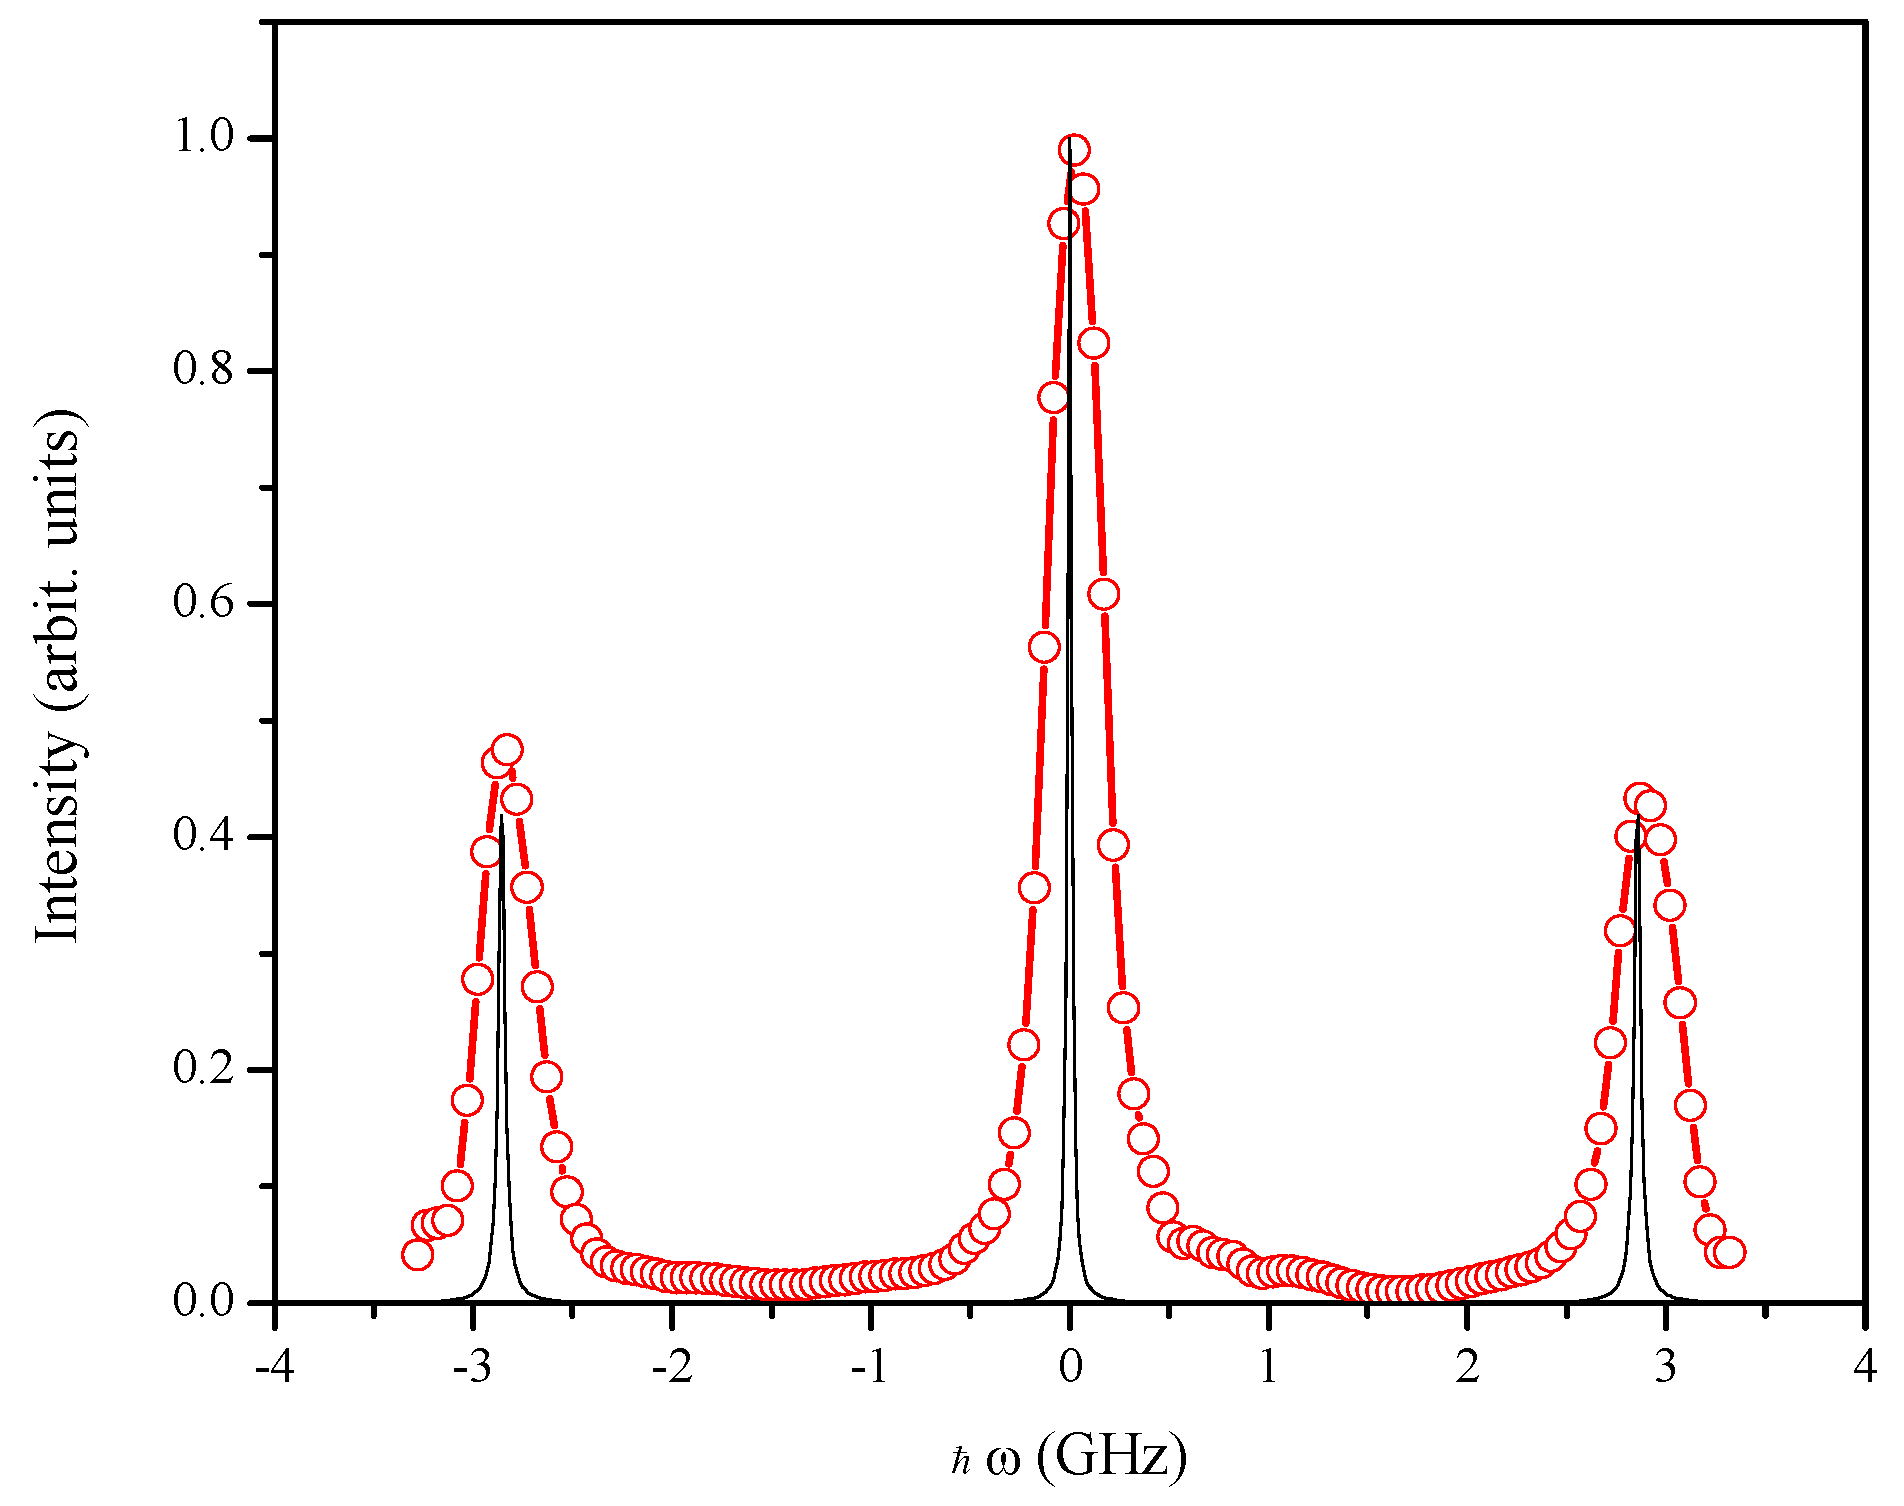
2.4. 1971: First Evidences of a Rayleigh-Brillouin triplet beyond the Continuous Limit

The first convincing evidence of the persistence of well-defined inelastic peaks beyond the hydrodynamic regime was reported in an INS measurement of Bell and collaborators on supercritical neon [37]. This work spanned unusually low Q values (0.6 nm−1Q ≤ 1.4 nm−1), which substantially reduced the dynamic gap existing between the quasi-continuous regime probed by BLS (with Q spanning the 10−2 nm−1 window) and the range covered by “standard” INS measurements (typically Q ≥ 2–3 nm−1). A best fit of measured line-shape with a simplified hydrodynamic similar to the one defined by Equations (2) and (3a–c) enabled the authors to conclude that the simple hydrodynamic theory consistently describes the spectral shapes measured well beyond the continuous approximation. Figure 3 provides an example of the spectral profiles measured by Bell et al., clearly showing the persistence of neat side peaks reminiscent of the hydrodynamic acoustic excitations.
Again, the inelastic shift of side peaks reportedly depends linearly on Q, with a slope consistent with the known value of adiabatic sound velocity. Interestingly, the linear dispersion seemed to persist over the whole Q-range explored by Bell et al., even when the side peaks transform to broad shoulders, for which the simple hydrodynamic approximation ( D T Q 2 , Γ Q 2 < < c s Q ) is clearly unfulfilled. Additionally, the widths of both inelastic (Brillouin) and quasi-elastic (Rayleigh) peaks were found to depend on Q nearly consistently with the predictions of Equations (3a–c). These aspects will be discussed in greater detail below.
It is worth acknowledging that comparably well-resolved THz inelastic peaks were previously observed in a largely quantum system as superfluid He at 1.1 K [38] and in the mentioned work on liquid metals by Dorner et al. [39].

2.5. 1973–1975: First Signatures of A Viscoelastic Behavior in Real and Simulated Noble Gases

A successive experiment performed on neon by Bell et al. [37] covered Q values largely exceeding the simple hydrodynamic limit (2.7 nm−1Q ≤ 15 nm−1), strongly overlapping the range covered by more “standard” INS measurements. Not surprisingly, the modeling of the line-shape at these higher Qs was less straightforward, requiring a generalization of transport variables, as prescribed by the “molecular hydrodynamic” approach. Specifically, the used line-shape model consisted in a generalization of the simple Brillouin triplet defined by Equations (2) and (3a–c) in which allowance was made for a Q and/or ω-dependence for some thermodynamic and transport parameters appearing in the hydrodynamic equations.
In particular, it was observed that the finite Q generalization of both DT and γ had the form of a sharp, nearly Lorentzian, decay, indicating a decreasing weight of thermal fluctuations at mesoscopic distances. Furthermore, the longitudinal viscosity needed to be generalized as a frequency dependent variable as a typical manifestation of viscoelasticity. Although viscoelastic effects on the line-shape will be discussed in greater detail in a successive section, it’s worth emphasizing here that the core feature of viscoelastic fluids is their sharply frequency dependent dynamic response, resembling either the one of a liquid or the one of a solid at low or high frequency, respectively. The crossover between the liquid-like (or viscous) and solid-like (or elastic) regimes is marked by the relaxation frequency 1/τ. In a scattering experiment the viscous-to-elastic transition can be observed when the applied perturbation (e.g., a scattering generated acoustic waves) attains a frequency (csQ) much larger than 1/τ. In practice, this can be obtained by increasing Q and/or τ (by lowering T).
On this ground, it is reasonable to expect that even a simple fluid at some Q, T values can exhibit solid-like properties, such as, for instance, the ability of supporting transverse acoustic waves. This possibility could only be tested using computer MD simulation, which can determine the correlation function between transverse components of atomic velocities, or its Fourier transform, customarily referred to as the transverse current spectrum. The transverse plane is defined as orthogonal to the momentum exchanged in the scattering event, Q . Indeed, the first indication of a high Q transverse acoustic propagation in a monatomic system was inferred from the presence of a clear inelastic peak in the transverse current spectrum of a Lennard-Jones model representing Ar [41]. In this work, viscoelastic effects on the spectrum of density fluctuations were described assuming a Gaussian time decay of memory function. A successive MD simulation performed on a Lennard-Jones model of Ar at the triple point [42] used instead a “more standard” exponential ansatz for the memory function within the assumptions of either a single or a double timescale. It was observed that the two alternative hypotheses did not yield appreciably different best-fit results. Furthermore, this study confirmed the previous observation of a Q-decay of “the thermal” parameters DT and γ and indicated a relaxation time τ ranging in the 10−1 ps interval with smooth variations.

2.6. 1978–1987: The Failure of the Three Modes Description High Q in Liquid Noble Gases and the Test of Kinetic and Mode Coupling Theories

Successive INS works on Ne [43] and Ar [43,44,45,46,47] proposed a line-shape modeling consisting on the sum of generalized Lorentzian terms. Different versions of such a sum were used by superimposing the convergence of spectral moments of increasing order. Overall, it was observed that a spectral shape similar to the one in Equation (2) provides an accurate description of the spectrum of both liquid and supercritical noble gases. However, the use of such a model led to somehow controversial results for liquid sample at high Qs, as the presence of a propagation gap, that is a Q-region where ωs = 0.
A similar gap was also reported by INS measurements in molten salts [48] and liquid He [49,50] and its presence was also predicted by the kinetic theory [51]. Its physical origin was connected to the prevalence of dissipative forces over elastic ones, which prevent the sound from propagating at some Qs. In this regard, it is interesting that the gap seemingly disappeared upon increasing the density and approaching solidification [45].
An example of the pressure dependence of this effect is proposed by Figure 4. There, the various dispersion curves are divided for the corresponding sound velocity, thus expectedly joining the same hydrodynamic linear law, upon approaching the Q = 0 limit. From the plot it can be readily noticed that the Q-window for which ωs = 0 reduces upon increasing the pressure. Although the presence of a region of forbidden sound propagation raised some initial interest among researchers, its physical significance seemed also controversial. In this regard, it should be acknowledged that the observed gap is centered on the position of the first diffraction peak, where the so-called de Gennes narrowing occurs [52], and the spectral shape is reduced to a narrow featureless peak. For this reason, the use of a “three pole” line-shape modeling may give questionable results in this Q-window, also considering that inelastic features in the spectrum become dramatically overdamped [53,54], and their real position somehow ill-determined.
Apart from those based on Equation (2), no other line-shape modeling used in the literature ever indicate the occurrence of such a gap and, furthermore, its presence leads to a clear physical inconsistency. In fact from a simple finite Q extension of the compressibility theorem ([55], see also Equation (13a)) one has ω s k B T / S ( Q ) , from which it can be deduced that a vanishing ωs implies a diverging S(Q), which clearly has no physical foundation for a disordered system.
Aside from these high Qs flaws, the “three pole” profile in Equation (2) has, in principle, a solid physical ground. In fact, from one side, it can be derived using a macroscopic description of density fluctuations as the hydrodynamic theory; on the other, it is consistent with the result of a truly microscopic approach as the kinetic theory [56,57]. This can be demonstrated by developing the S(Q,ω) as a sum of generalized Lorentzian terms [58], upon retaining only the three dominant ones and superimposing on them the fulfilment of the first three sum rules.
It is worth noting that the kinetic approach provides, in principle, a microscopically rigorous theory of density fluctuation. This stems from the assumption that the dynamic variables of the system depend on both atomic velocities and spatial coordinates, as required for a reliable account of microscopic interactions. Unfortunately, the predictions performed using the kinetic theory usually give poor results at high density due to the increasing weight of correlated collisions. The INS measurements of Postol and Pelizzari on supercritical Ar [60] proposed an experimental test of the kinetic theory predictions based on the generalized Enskog approach. As a result, no quantitative agreement was demonstrated between theoretical and experimental results, although at the low density (10.5 atoms/nm3) and high temperature (295 K) probed in the experiment it was reasonable to assume the kinetic theory description to hold validity.
A successive work on liquid Ar at different pressures by de Schepper et al., whose results are reported in Figure 4, attempted a general test of the mentioned Lorentzian sum development of S(Q,ω) [47]. The effect of spectral rule fulfillment was therein analyzed by comparing the results obtained by imposing the fulfillment of sum rules of increasing order (≤ 2). Furthermore, in such a work the authors attempted to describe the measured dispersion curves in terms of the predictions of the mode-coupling theory (MCT) (see e.g. [61]). The non-analytic dispersion relations predicted by the MCT, having the form of truncated Q-expansions with fractional exponents, were compared with experimental dispersions. The accuracy of the MCT prediction can be judged by comparing the dashed curves in Figure 4 with the low Q portion of the dispersion curves. The comparison clearly demonstrates that at the lowest Qs the sound dispersion curve is well described by the MCT for all explored pressures, although for Q > 4 nm−1 this theory does not provide a consistent account of the observed behavior of quasi-elastic and inelastic linewidths of the spectrum.

2.7. 1990: “Extended Hydrodynamics Modes” up to Q ≈ 1 nm−1

After the first low Q measurement on Ne by Bell et al., a second INS experiment was performed by Bafile et al. [62] on supercritical Ar at extremely low Q’s (0.35 nm−1Q ≤ 1.25 nm−1). This measurement further extended the probed dynamic region to lower Qs, thus reducing the gap with light scattering measurements. Figure 5 displays two typical spectral shapes measured in this INS work, which clearly confirm the persistence of extended Brillouin peaks at mesoscopic scales.
Most importantly, in this measurement the superior accuracy in the count statistics coupled with the unprecedented dense Q-grid, enabled a very detailed analysis of the Q-dependence of line-shape parameters of Equation (2). Best fit values of such parameters are reported in Figure 6 and therein compared with either the simple hydrodynamic prediction (Equation (3a–c)) or a higher-order polynomial expansion (see, e.g., Equations (42)–(45) of [23]). In the same Figure, the result previously obtained by Bell and collaborator on neon is also reported for comparison along with the corresponding simple hydrodynamic prediction of Equation (3a–c).
All hydrodynamic curves included in the figure were obtained using thermodynamic and transport parameters reported in the original works.
Overall, data in Figure 6 confirm that the Q-dependence of line-shape parameters is roughly consistent with the low Q approximation in Equation (3a–c). This clearly indicates that “extended hydrodynamic” modes survive well above the hydrodynamic limit, up to Q values exceeding the light scattering domain by nearly two orders of magnitude.

2.8. 1998: First IXS Measurements of the THz Spectrum of Noble Gases

The only THz spectroscopic technique available until the mid-90s was INS, a method intrinsically hampered by kinematic constraints (see, e.g., [63] pp. 63–101) limiting the accessible portion of dynamic plane (Q,ω). These limitations are particularly penalizing at low Qs, where the collective nature of structural rearrangements become dominating, as well as at large ω values, where instead short-time, collisional events have a visible influence on density fluctuations.
These problems were successfully overcome after the development of the first high resolution IXS, a spectroscopic technique virtually free from kinematic limitations [2,64].
The first IXS measurement on a dense noble gas was performed on deeply supercritical neon (T = 295 K, n = 29.1 atoms/nm3) and discussed in combination of a MD simulation on a Lennard-Jones model representative of the same sample [65]. In Figure 7, two representative IXS spectra (upper panels) and corresponding MD simulations (lower panels) are compared (middle panels) after the former have been multiplied with the detailed balance factor and convoluted with the instrumental energy resolution function. The good agreement between measured and computed line-shapes suggests that the Lennard-Jones model provides a consistent description of the spectrum. Furthermore, it is apparent that even at Q values extending well above 1 nm−1, the inelastic peaks are visible in the MD simulated line-shapes and, in spite of some resolution limitations, in the experimental spectra as well.
At this stage, a pending question relates to the Q-threshold, Qh, defining the limit of validity for the “extended hydrodynamic” regime. Based on the fit of MD spectra reported in Figure 8 and discussed in Refs. [65,66,67], one could conclude that, at least for dense supercritical neon, Qh is as high as 7.5 nm−1. According to the plot, the transport parameters derived from best-fit results through Equation (3a–c) are essentially consistent with the macroscopic, or hydrodynamic, limit at least for Q lower than the values included in the shadowed area. Thanks to the high statistical accuracy of Q-dependent data in Figure 8, one may infer that the simple hydrodynamic approximation is not accurate for the thermal diffusivity. In fact, low-Q values of DT seem slightly lower than the macroscopic value.

2.9. The Onset of a Positive Sound Dispersion in Liquid Noble Gases

In the various works on noble gases reported in literature, it was observed that transport parameters drastically change upon relatively moderate P and T variations. This may not be surprising, given that the large compressibility of these systems leads to substantial variations of inter-particle distances and, consequently, of interaction strengths.
For instance, clear transformations were observed in the Q-dependence of the acoustic frequency and damping when measured either in the liquid or in the supercritical phase. In particular, it was generally found that, in liquid Ne and Ar [43,44,58,68] ωs systematically exceeds the hydrodynamic prediction at low/intermediate Qs. A similar effect was also observed in liquid He [48,69,70], although the quantum character of this sample makes this finding less straightforward to interpret. Furthermore, in liquid phase samples an “anomalous” Q-dependence was also reported for the sound absorption coefficient, as derived from the width of inelastic peaks, zs. Conversely, all these dispersive effects seem to disappear at extreme supercritical conditions [40,62,65,66].
These trends are clearly exemplified by Figure 9, which compares spectral parameters obtained in supercritical [65] and liquid [71] neon. Overall, data reported therein indicate that, while in liquid Ne the sound frequency (ωs) and absorption (zs) at low Qs are, respectively, higher and lower than predicted by Equations (3a–c), no substantial discrepancy is instead observed in supercritical Ne. In Figure 9 it can be also noticed that for the latter sample the agreement with the simple hydrodynamic prediction is excellent up to Q ≈ 7.5 nm−1.
As mentioned, “anomalous” dispersive effects observed for the liquid sample can be ascribed to the onset of a viscoelastic response induced by the coupling with a relaxation process.
To illustrate this point, it is useful to recognize that, in a spectroscopy experiment, the scattering-excited acoustic waves cause a time-dependent perturbation of the local equilibrium of the target sample. As a response, decay channels redistribute the energy carried by the acoustic wave toward some internal degrees of freedom of the fluid. These energy rearrangements ultimately drive the sample to relax in a new local equilibrium within a timescale τ.
Two limiting scenarios can thus occur: (1) the time-dependent acoustic perturbation has period, s, much longer than any internal degrees of freedom of the system. Under these conditions, the latter relaxes to equilibrium “instantaneously” (i.e., within a timescale τ << 1s) and the acoustic propagation essentially takes place over successive equilibrium states (viscous limit); (2) Conversely, if the acoustic wave has an extremely short period, it “perceives” internal rearrangements as frozen-like (τ >> 1s) and does not couple with them. Consequently, the acoustic propagation is elastic, i.e., it occurs with virtually no energy loss (elastic limit).
Therefore, when a relaxation is active, the response of a system to the acoustic propagation depends on how the acoustic frequency, ωs, compares to the relaxation time. When ωs increases from the viscous (ωsτ << 1) to the elastic limit (ωsτ >> 1), the viscoelastic transition manifests itself through a systematic decrease of acoustic dissipation and a corresponding increase of sound velocity. Since in scattering experiments ωs is typically varied by changing Q (through the dispersion relation ωs = ωs(Q)), in these measurements viscoelastic behavior is reflected by a Q-increase of ωs and a Q-decrease of zs.
This explains why in panels 9b and 9d these shape parameters are, at the lowest Qs, respectively larger and lower than their hydrodynamic predictions.
Once the phenomenological signature of a viscoelastic behavior is experimentally assessed, a more quantitative understanding of this phenomenon could only come from the modeling of measured line-shape with a viscoelastic model. The next section is devoted to the derivation of such a model within the framework of the memory function formalism.

3. A Model for the Measured Spectral Shape

3.1. The Memory Function Formalism

Let A ( t ) = [ A 1 ( t ) . . . . . . . . . . A ν ( t ) ] be a vector whose components are stochastic variables describing the properties of a system of N interacting particles (with N > υ). It can be shown that under very general conditions, the equation of motion of A ( t ) has the following form:
d A ( t ) d t = i Ω A ( t ) 0 t K ( τ ) A ( t τ ) d τ + f ( t )
In the formula above the following quantities have been introduced:
  • The antisymmetric matrix i Ω = A ( 0 ) , i L A ( 0 ) A ( 0 ) , A ( 0 ) 1 is the proper frequency of the system, which describes the oscillatory behavior of A ( t ) . This matrix depends on equilibrium (static) properties of the system. Here the symbol . . . . . . . indicates a statistical (thermal) average.
  • The variable f ( t ) = e i ( 1 P ˜ ) L t i ( 1 P ˜ ) L A ( 0 ) is the random fluctuating force. Noticeably, the presence of the ( 1 P ˜ ) term implies that A ( 0 ) , f ( t ) = 0 , namely that the fluctuating force is orthogonal (statistically uncorrelated) to A ( 0 ) .
  • The matrix K ( t ) = f , f ( t ) A ( 0 ) , A ( 0 ) 1 is memory matrix, or memory function if υ = 1, as in the cases of interest here. It is worth noticing that the integrand in Equation (4) includes all A ( t ) values between 0 and t, “weighted” by the memory, which thus defines the ability of the system to keep memory of the past.
The equation of motion for the correlation matrix C ( t ) = A ( t ) A ( 0 ) can be readily derived from Equation (4) through a scalar product, while using the orthogonality between A ( 0 ) and f ( t ) . Explicitly:
d C ( t ) d t = i Ω C ( t ) 0 t K ( τ ) C ( t τ ) d τ
Equations (4) and (5) are referred to as memory equation or generalized Langevin equation either for dynamic variables or for their correlations, respectively.
When dealing with a single dynamic variable, time reversal requirements impose Ω = 0. Using a procedure described in various monographies [22,63], the Langevin equation can be solved following an iterative approach, which eventually leads to the following recursive formula:
C ˜ ( s ) C ( 0 ) = [ s + K 1 ( 0 ) s + K 2 ( 0 ) s + K 3 ( 0 ) s + ] 1
customarily referred to as the continued fraction expansion. Here Ki(t) is the i-th (iteration) order memory function associated to the variable of interest,
C ˜ ( s ) = 0 d t e z t C ( t )
while is the Laplace transform of the correlation function. The t = 0 values of the i-th order memory function Ki(t) can be determined by superimposing the sum rule fulfillment, which for the few lowest orders yields:
K 1 ( 0 ) = ω 2
K 2 ( 0 ) = K ¨ 1 ( 0 ) 2 K 1 ( 0 ) = ω 4 ω 2 ω 2 ω 0
K 3 ( 0 ) = K ¨ 2 ( 0 ) 2 K 2 ( 0 ) = 1 Δ 2 [ ω 6 ω 2 ( ω 4 ω 2 ) 2 ]
Here ω n = i n [ d n C ( t ) d t n ] t = 0 [ C ( 0 ) ] 1 = + ω n C ( ω ) d ω [ C ( 0 ) ] 1 is the n-order spectral moment of the correlation function C(ω).
Among all possible fluctuating variables, we are here interested in density fluctuations since the Fourier-Laplace transform of their correlation function, S(Q) is directly measured by both IXS and INS. S(Q) can be derived as the Fourier anti-transform of the intermediate scattering function F ( Q , t ) = V δ ρ ( r , t ) δ ρ * ( r , 0 ) e x p ( i Q r ) d r . The latter can be expressed through the continued fractions expansion of Equation (4), whose 2-nd order truncation yields:
F ( Q , s ) S ( Q ) = [ s + ω 2 s + m L ( Q , s ) ] 1
Where m L ( Q , s ) is the second order memory function for density fluctuations while S(Q) = F(Q,0) is the static structure factor. The S(Q) can be derived from Equation (7) as follows:
S ( Q , ω ) S ( Q ) = 1 π R e [ F ( Q , s = i ω ) S ( Q ) ] = 1 π R e [ i ω + ω 2 i ω + m L ( Q , s = i ω ) ] 1
The last term of the above formula can be calculated explicitly to eventually obtain:
S ( Q , ω ) S ( Q ) = 1 π ω 2 m L ( Q , ω ) [ ω 2 ω 2 ω m L ( Q , ω ) ] 2 + ω 2 [ m L ( Q , ω ) ] 2
where m L ( Q , ω ) and m L ( Q , ω ) are, respectively, real and imaginary parts of the Fourier transform of mL(Q,t). At this stage, the problem of choosing the most appropriate model is shifted from S(Q) to mL(Q,t), or mL(Q). In many literature works on liquid systems attempting a memory function based modeling of the spectrum (see e.g. [13,73]), it can be shown that a sensible ansatz for the time dependent memory function is given by:
m L ( Q , t ) = Δ T 2 e x p ( t / τ T ) + Δ α 2 e x p ( t / τ α ) + 2 Γ μ δ ( t )
The three terms in the right hand side of Equation (9) are (from left):
(1)
The thermal contribution. The first term describes diffusive thermal motions triggered by spontaneous temperature gradients. Its timescale and amplitude are τ T = ( γ D T Q 2 ) 1 and Δ T 2 = ( γ 1 ) ( c T Q ) 2 respectively, with DT, cT, γ and being the generalized diffusivity, the isothermal velocity and the constant pressure to constant volume specific heats ratio.
(2)
The viscous relaxation contribution. The second term accounts for relaxation processes affecting the viscosity and having a timescale τ α and amplitude Δ α 2 = ( c 2 γ c T 2 ) Q 2 , where c is the generalized infinite frequency or “elastic” sound velocity of the sample.
(3)
The instantaneous contribution. The last term accounts for the coupling of density fluctuations with the ultra-fast vibrational dynamics here accounted by a δ(t) profile. It was often found that the amplitude 2 Γ μ has a quadratic Q-dependence and is essentially insensitive to thermodynamic changes [20].
It is immediate to recognize that real and imaginary parts of Fourier transform of the memory function in Equation (9) read as:
m L ( Q , ω ) = Δ T 2 τ T 1 + ( ω τ T ) 2 + Δ α 2 τ α 1 + ( ω τ α ) 2 + Γ μ
ω m L ( Q , ω ) = Δ T 2 ( ω τ T ) 2 1 + ( ω τ T ) 2 + Δ α 2 ( ω τ α ) 2 1 + ( ω τ α ) 2
respectively. These two equations can be inserted in Equation (8) to obtain a model for the classical part of the line-shape.
It should be emphasized that at mesoscopic scales all transport and thermodynamic coefficients introduced above and in the following, unless otherwise specified, are Q-dependent generalizations of their macroscopic counterparts, although such a dependence in not made explicit in the notation.
The model used for the memory function often results from suitable approximation of Equation (9) as appropriate to the sample, thermodynamic conditions and dynamic range probed. For simplest systems as noble gases, the single exponential decay or viscoelastic model has shown to provide a reasonable approximation [42].
Regardless on the approximation adopted, the exponential ansatz for the viscoelastic term, lends itself two at least these two fundamental objections:
(1)
In principle, structural relaxation phenomena in highly viscous systems can be better described by assuming a stretched exponential rather than a simple exponential time-decay of the memory function [17,74,75]. However, the use of this model would introduce an unwanted additional parameter (the stretching coefficient) and, perhaps more importantly, its Fourier transform cannot be cast on an analytical form. Fortunately, for simplest systems as noble gases, of interest in this paper, it is reasonable to assume that the simple exponential decay is a rather accurate approximation.
(2)
A second remark concerns the possible presence in the spectrum of a second inelastic excitation as observed in systems as diverse as liquid water [73,76,77,78], tetrahedrally arranged glasses [79], glass formers [80] liquid metals [81,82,83,84,85], complex biophysical samples [86,87,88] and mixtures [89]. The presence of this low frequency mode in the S(Q) is customarily ascribed to the onset of shear mode propagation, although this assignment could seem suspicious as S(Q) couples primarily with longitudinal movements only. In a liquid, the onset of shear waves in the spectrum of density fluctuations can only occur via the so-called longitudinal-transverse coupling [73,76,90], that is a mixing between acoustic modes having orthogonal polarization. The presence of this mode-mixing is not properly accounted for by any known analytic model for the memory function. However, such a coupling has never been observed in noble gases, likely due to the highly isotropic character of their interatomic interaction, and will not be discussed in the remainder of this paper.

3.2. The Departure from the Hydrodynamic Shape of the Spectrum

In the hydrodynamic regime, density fluctuations are probed for long time lapses (t >> τ) over which the viscous relaxation is perceived as a very rapid decay, well approximated by a Markovian term (∝ δ(t)) in the time-dependence of memory function. Overall, it can be shown that the following memory function:
m L , h y d ( Q , t ) = ( γ 1 ) ( c T Q ) 2 e x p ( γ D T Q 2 t ) + 2 ν L Q 2 δ ( t )
is fully consistent with the Rayleigh-Brillouin triplet expressed by Equation (2) under the approximation defined by Equation (3a–c)
As mentioned, at mesoscopic scales all parameter entering in Equation (11) should be generalized as Q dependent variables. Due to the lack of firm theories describing analytically the departure of the spectrum from the simple hydrodynamic regime, this Q-dependence is usually determined empirically through the best-fit modeling of spectra measured at different Qs.
Albeit phenomenological in character, this approach has proven to be successful in shedding a deep light on the fast dynamics of various disordered systems, including noble gases. In particular, it has elucidated many phenomenological aspects associated to the coupling of density fluctuations with THz relaxation processes.

3.3. The Simple Viscoelastic Model

The simplest method to account for THz viscoelastic effects on the spectrum of density fluctuation is to assume a single exponential decay of the memory function:
m L ( Q , t ) = Δ 2 e x p ( t / τ )
where the amplitude of the memory function is fixed by the superimposition of sum rules to the spectrum, which eventually leads to:
( 13 a ) ω o 2 = ω 2 ω 0 = k B T M S ( Q ) Q 2 ( 13 b ) ω 2 = ω 4 ω 2 ( 13 c ) Δ 2 = ( c 2 c 0 2 ) Q 2 = ω 4 ω 2 ω 2 S ( Q )
here ω 0 = S ( Q ) , while kB and M are the Boltzmann constant and atomic mass, respectively;
Equations (12) and (13a–c) define the so called Debye [91] or simple viscoelastic model [92]. Clearly, this model can hold validity only if: (1) thermal relaxations have a negligible weight on the time decay of memory function, i.e., if γ ≈ 1 and (2) the contribution from fast relaxation (term ∝ δ(t) in Equation (9)) phenomena is also negligible.
Conceptually, the simple viscoelastic description stems from the idea that, upon crossing the viscoelastic transition, the sound velocity cS, changes from c 0 = ω 0 / Q = B / ρ with B being the bulk modulus—as appropriate for a liquid—to c = ω / Q = M / ρ with M = B + 4 / 3 G and G being, respectively, the elastic and the shear modulus—as appropriate for solids. The superimposition of sum rules links the finite Q generalization of B and M to the second and fourth normalized moments, respectively. In a way the viscoelastic model through the sum rules’ fulfillment interpolates between the low Q, viscous, response and the high Q elastic one. Specifically, one side, Equation (13a) extends to intermediate Qs the macroscopic compressibility result [55] c T = K B T / M S ( 0 ) on the other side, the high Q link between M and normalized fourth moment, [1] is here extended down to the same Qs values.

4. 2001–2007: The Memory Function-Based Modeling of IXS Spectra of Noble Gases

The success of the memory function based modeling of experimental spectra was ultimately enabled by the dramatic improvement of the incident flux and, consequently, of the count statistics prompted by the development of IXS. Furthermore, these high fluxes coupled with the reduced beam cross section enabled spectroscopy measurements on substantially smaller samples, thus opening the access to extreme thermodynamic conditions.
The first IXS work investigating viscoelastic effects on liquid and supercritical neon [6] took advantage of these opportunities there by exploring an unprecedented broad thermodynamic range. Measurements were performed on dense neon from liquid to supercritical conditions following both an isochoric (n = 29 atoms/nm3) and an isothermal (T = 32 K) path. The sound dispersion curves of neon determined in such a work are reported in Figure 10. Best fit values of ω 0 = c 0 Q and ω = c Q derived from the best fit modeling of the line-shape are compared with the acoustic frequency evaluated from the position of the maxima of current spectra CL(Q,ω), Ωl. The current spectrum is defined as the Fourier transform of the correlation function between longitudinal components of atomic velocities. The position of its maxima is often identified as the dominant acoustic frequency, this identification being rigorous in the hydrodynamic limit only. Within the viscoelastic approach, Ωl is assumed to undergo a transition between the viscous and the elastic limit respectively represented by ω0 and ω.
Figure 10 displays the values of Ωl, ω0 and ω of liquid (upper panel) and supercritical (bottom panel) neon reported in Ref. [6] and compares them with the hydrodynamic straight line csQ.
From the inspection of the two plots the following trends are readily noticed:
(1)
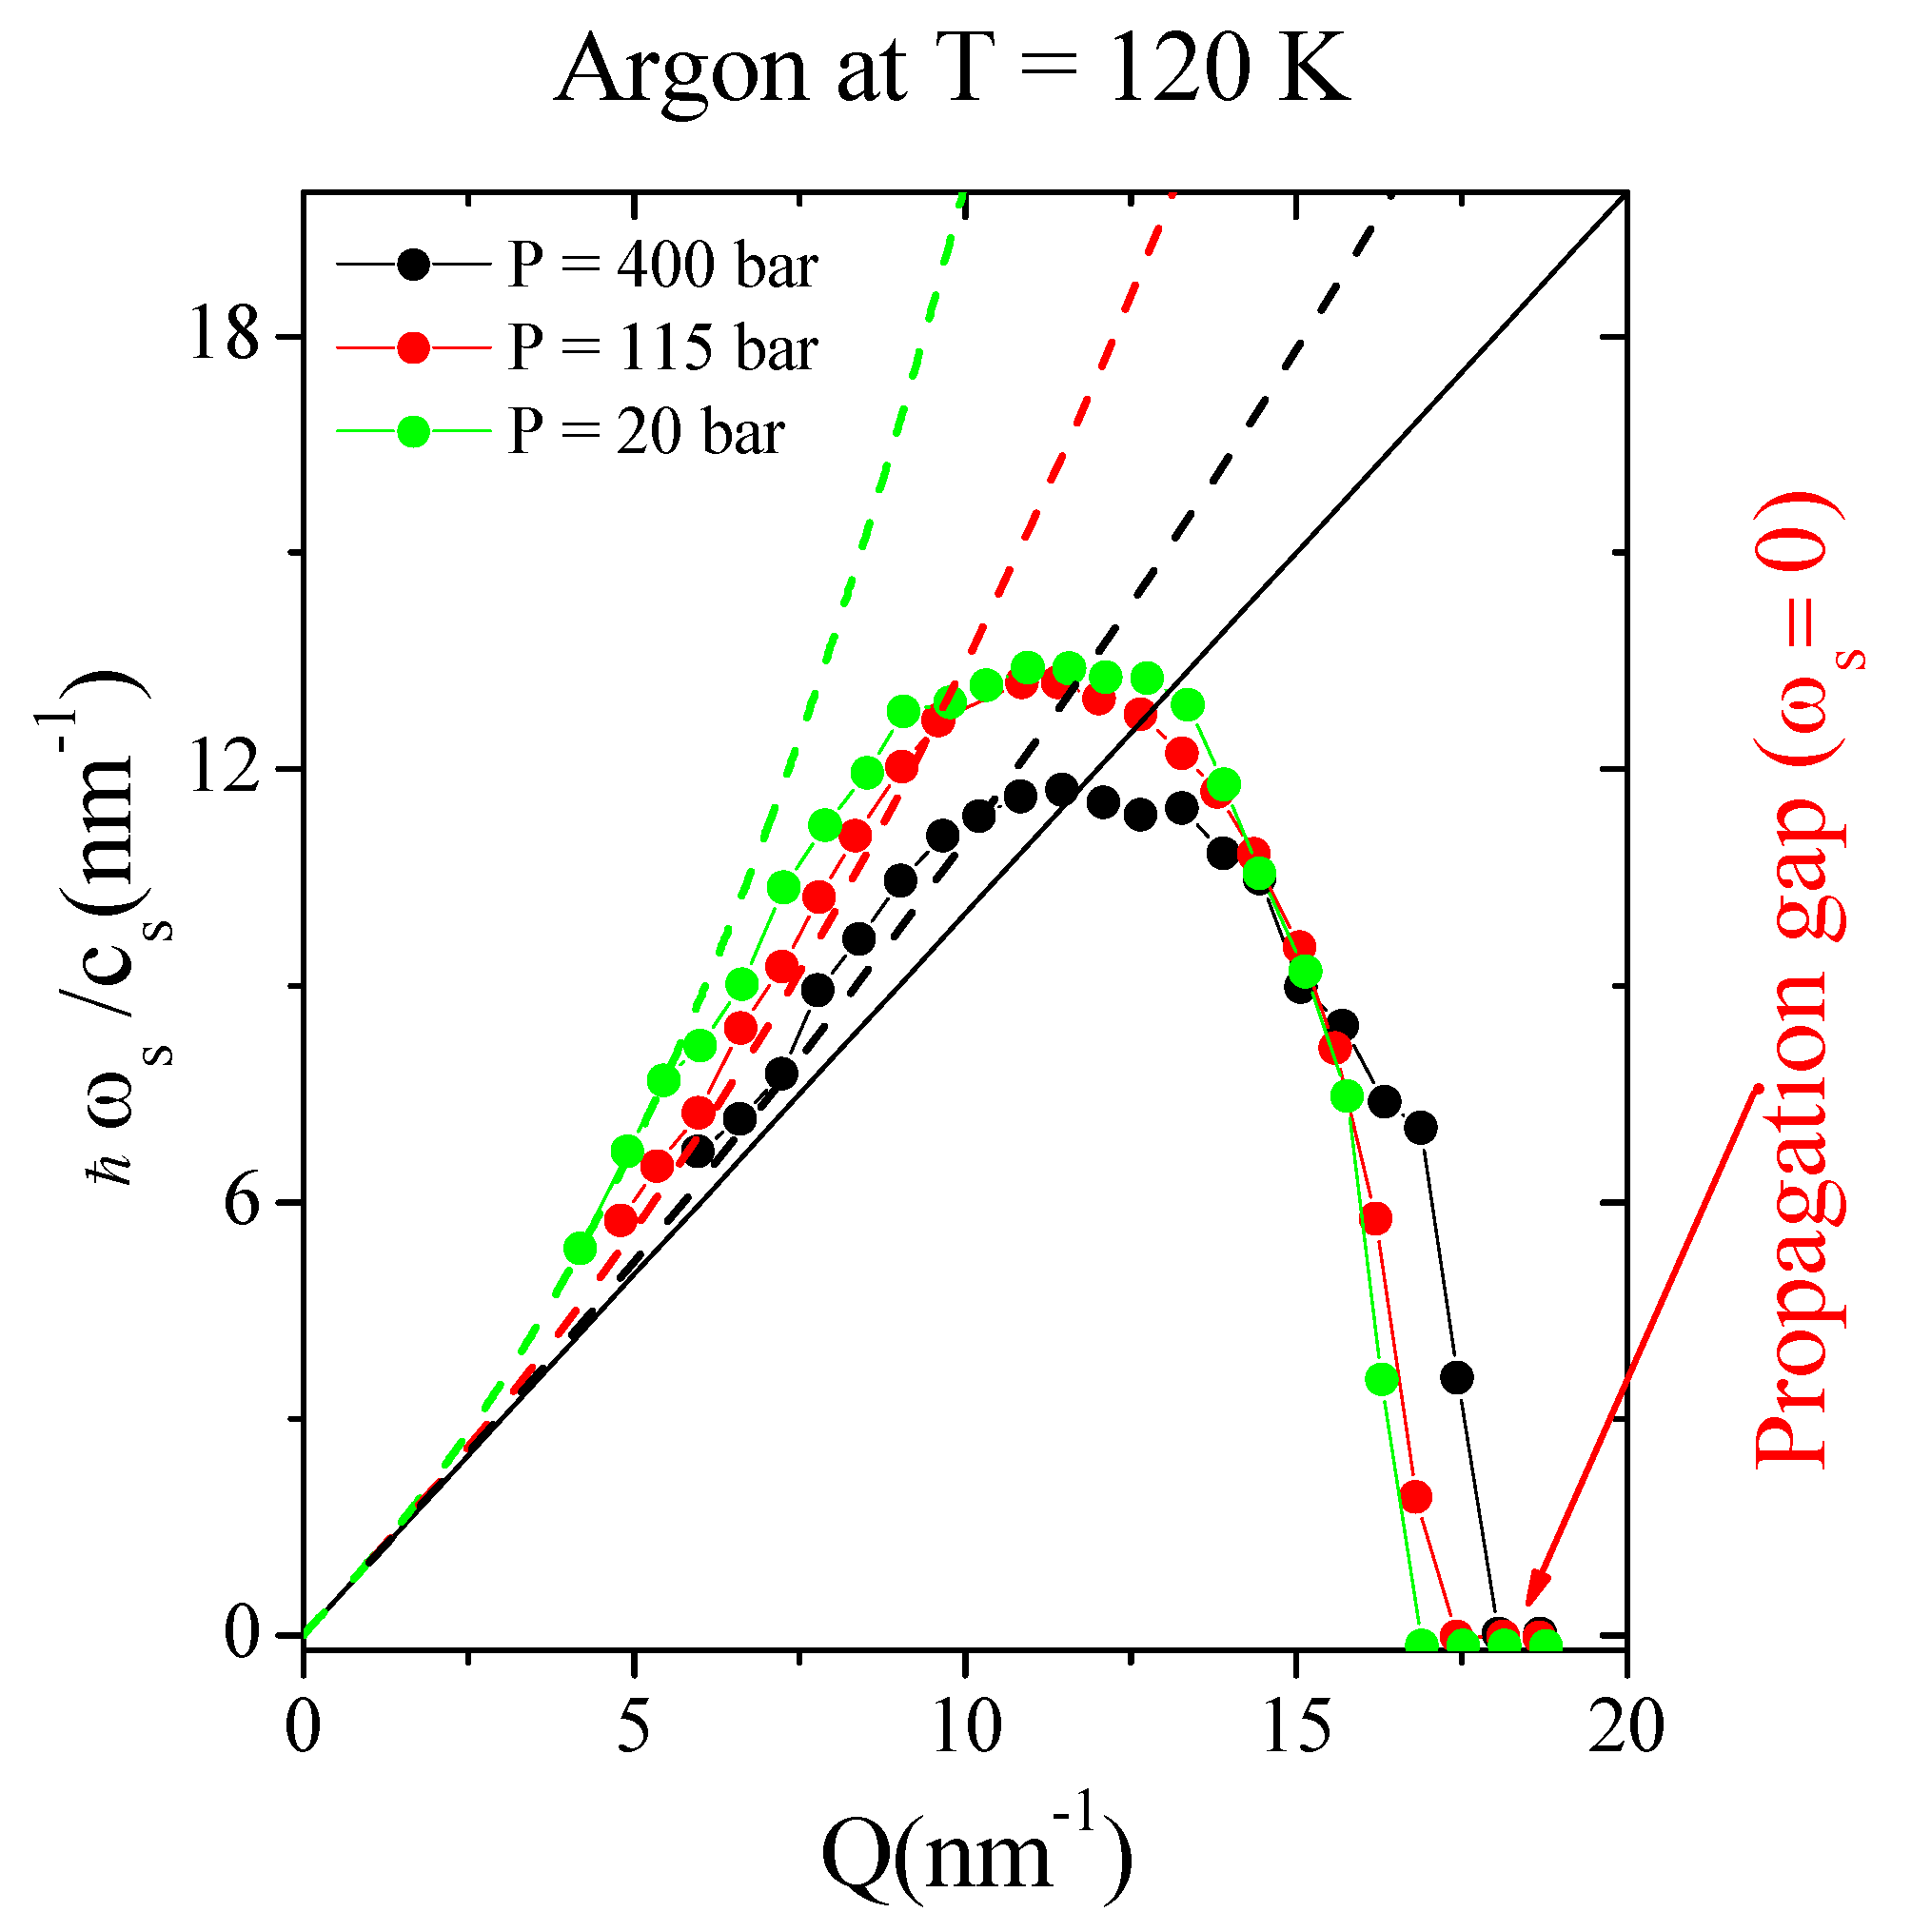
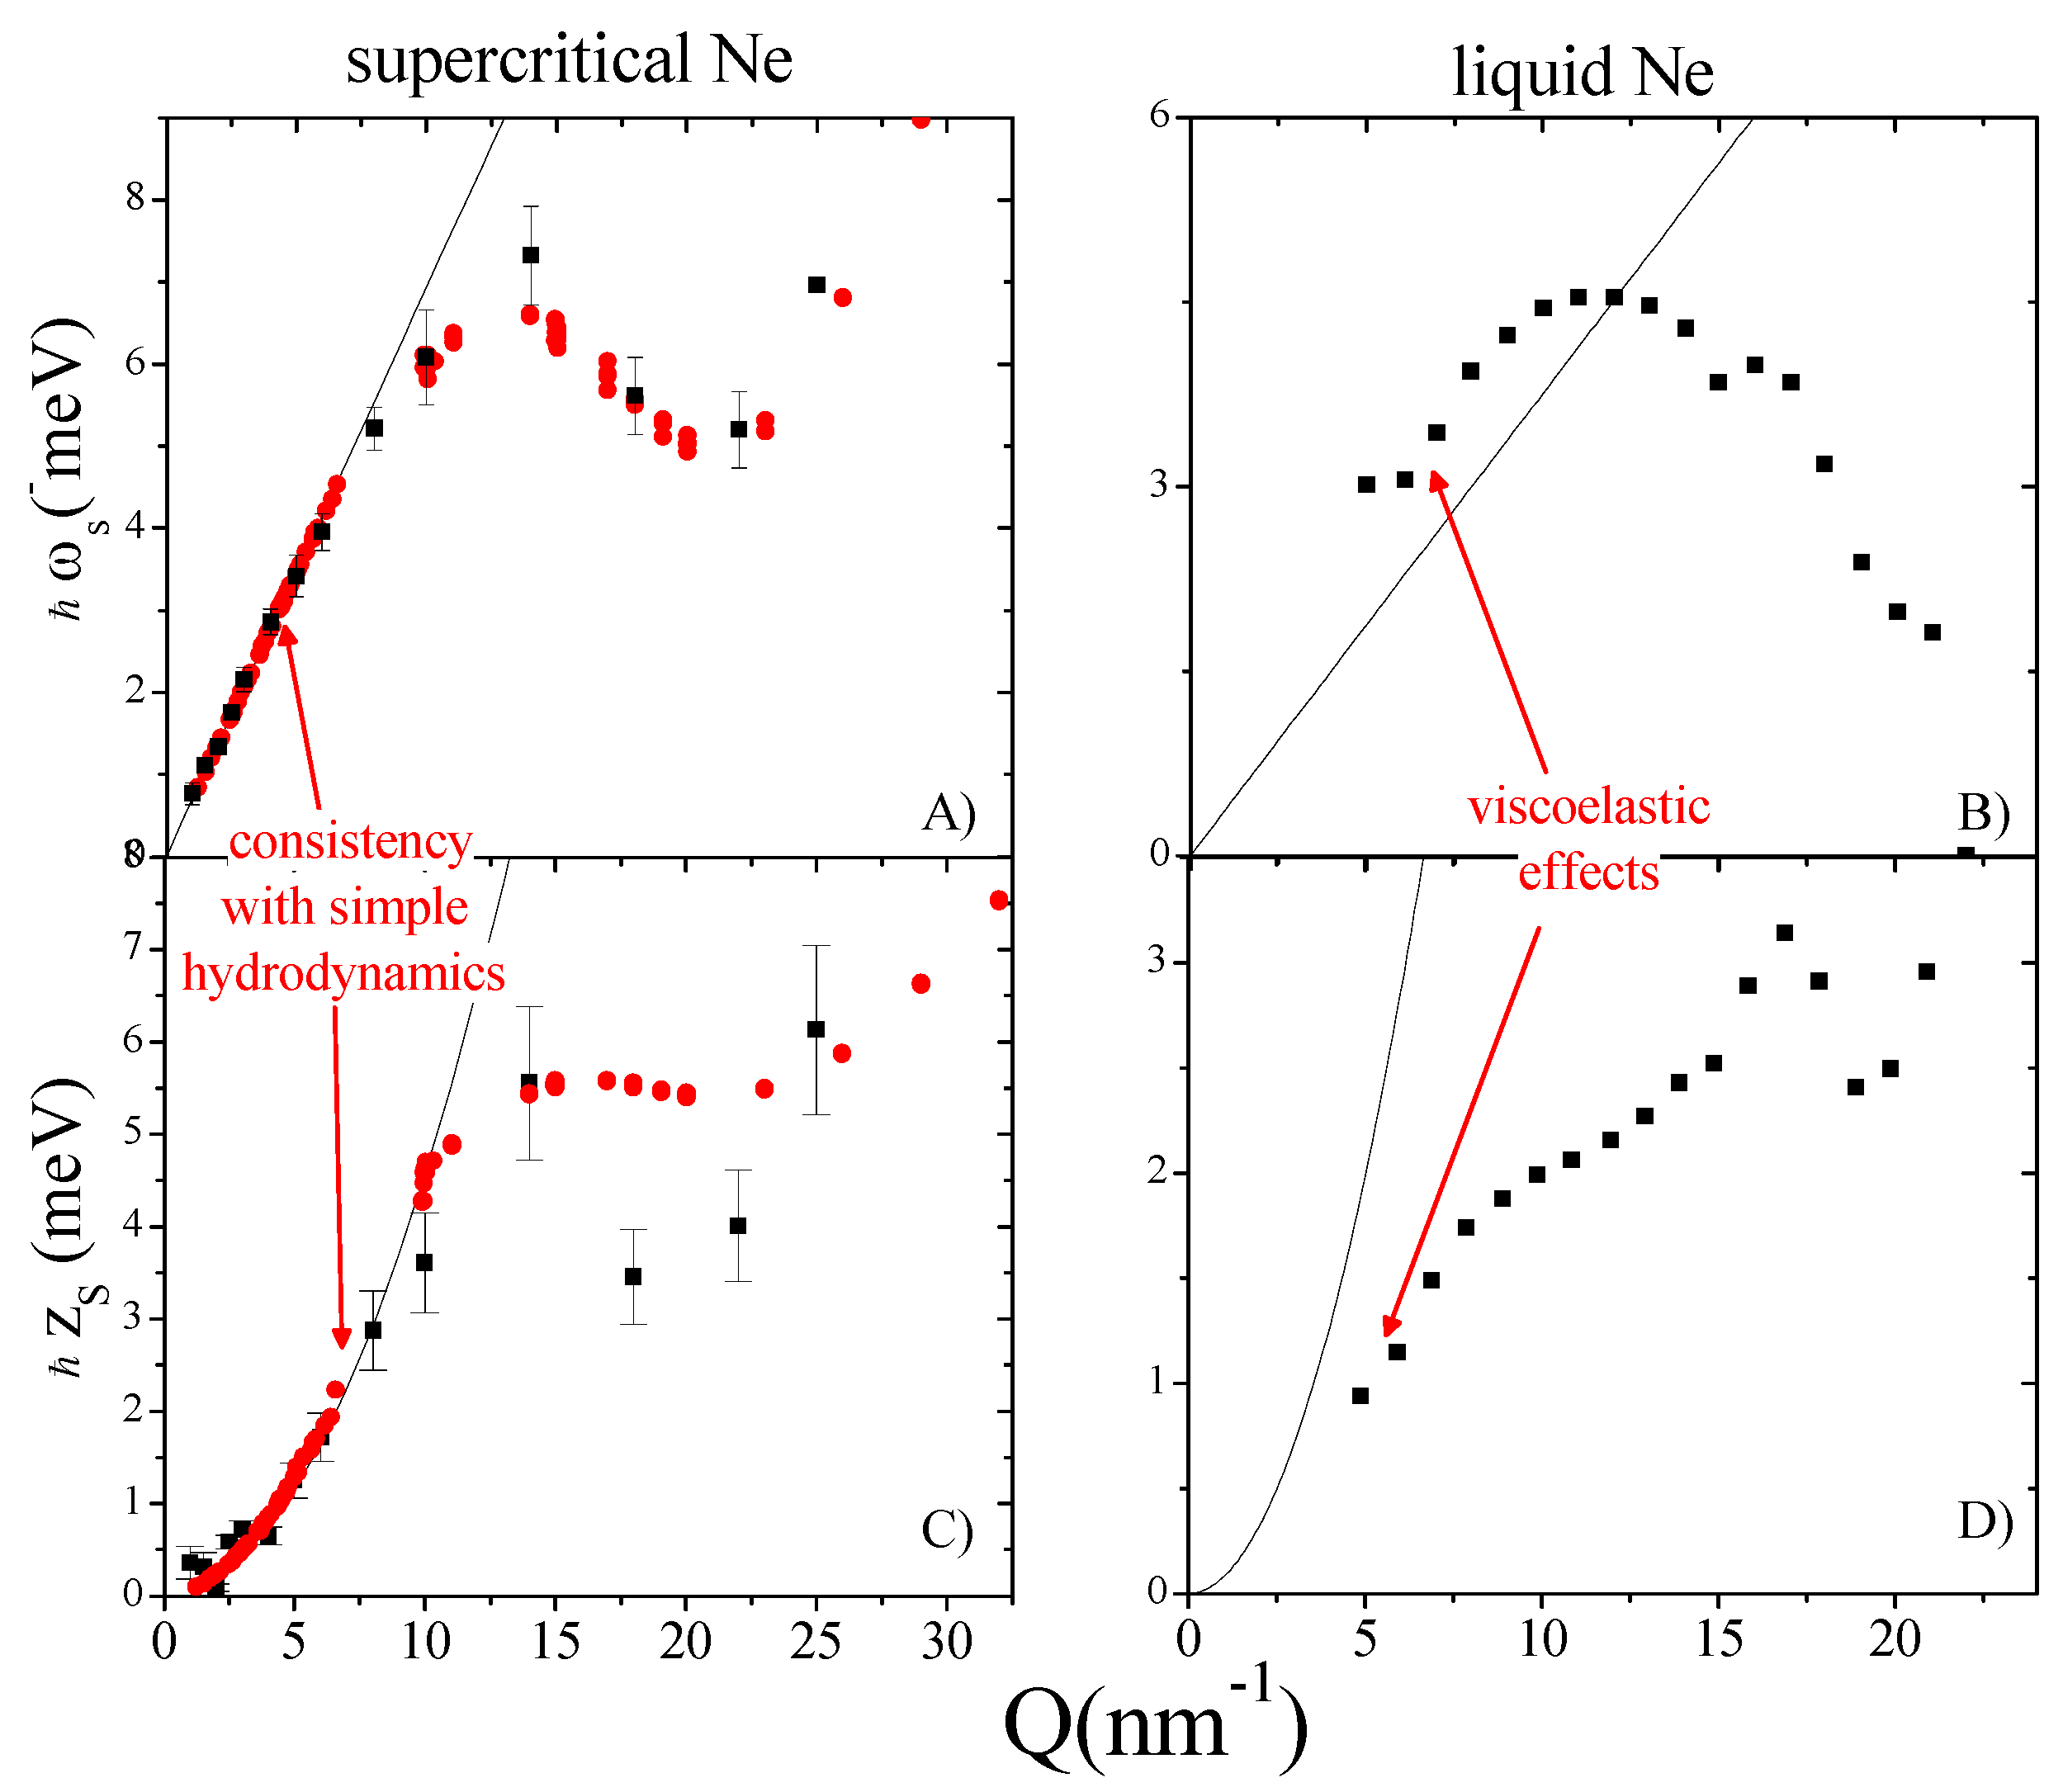
the liquid phase datum bears evidence for the more-than-linear behavior of Ωl (purple dots) for Q ≤ 10 nm−1, i.e., the systematic bending of Ωl upwards the hydrodynamic linear law and toward ω (the mentioned PSD effect) . Conversely, the liquid phase point is characterized by a sizable PSD.
(2)
At higher Qs one can observe the “backward transition” of Ωl from ω to ω0, which is actually joined for Q larger than the position of the first di QM (≈22 nm−1).
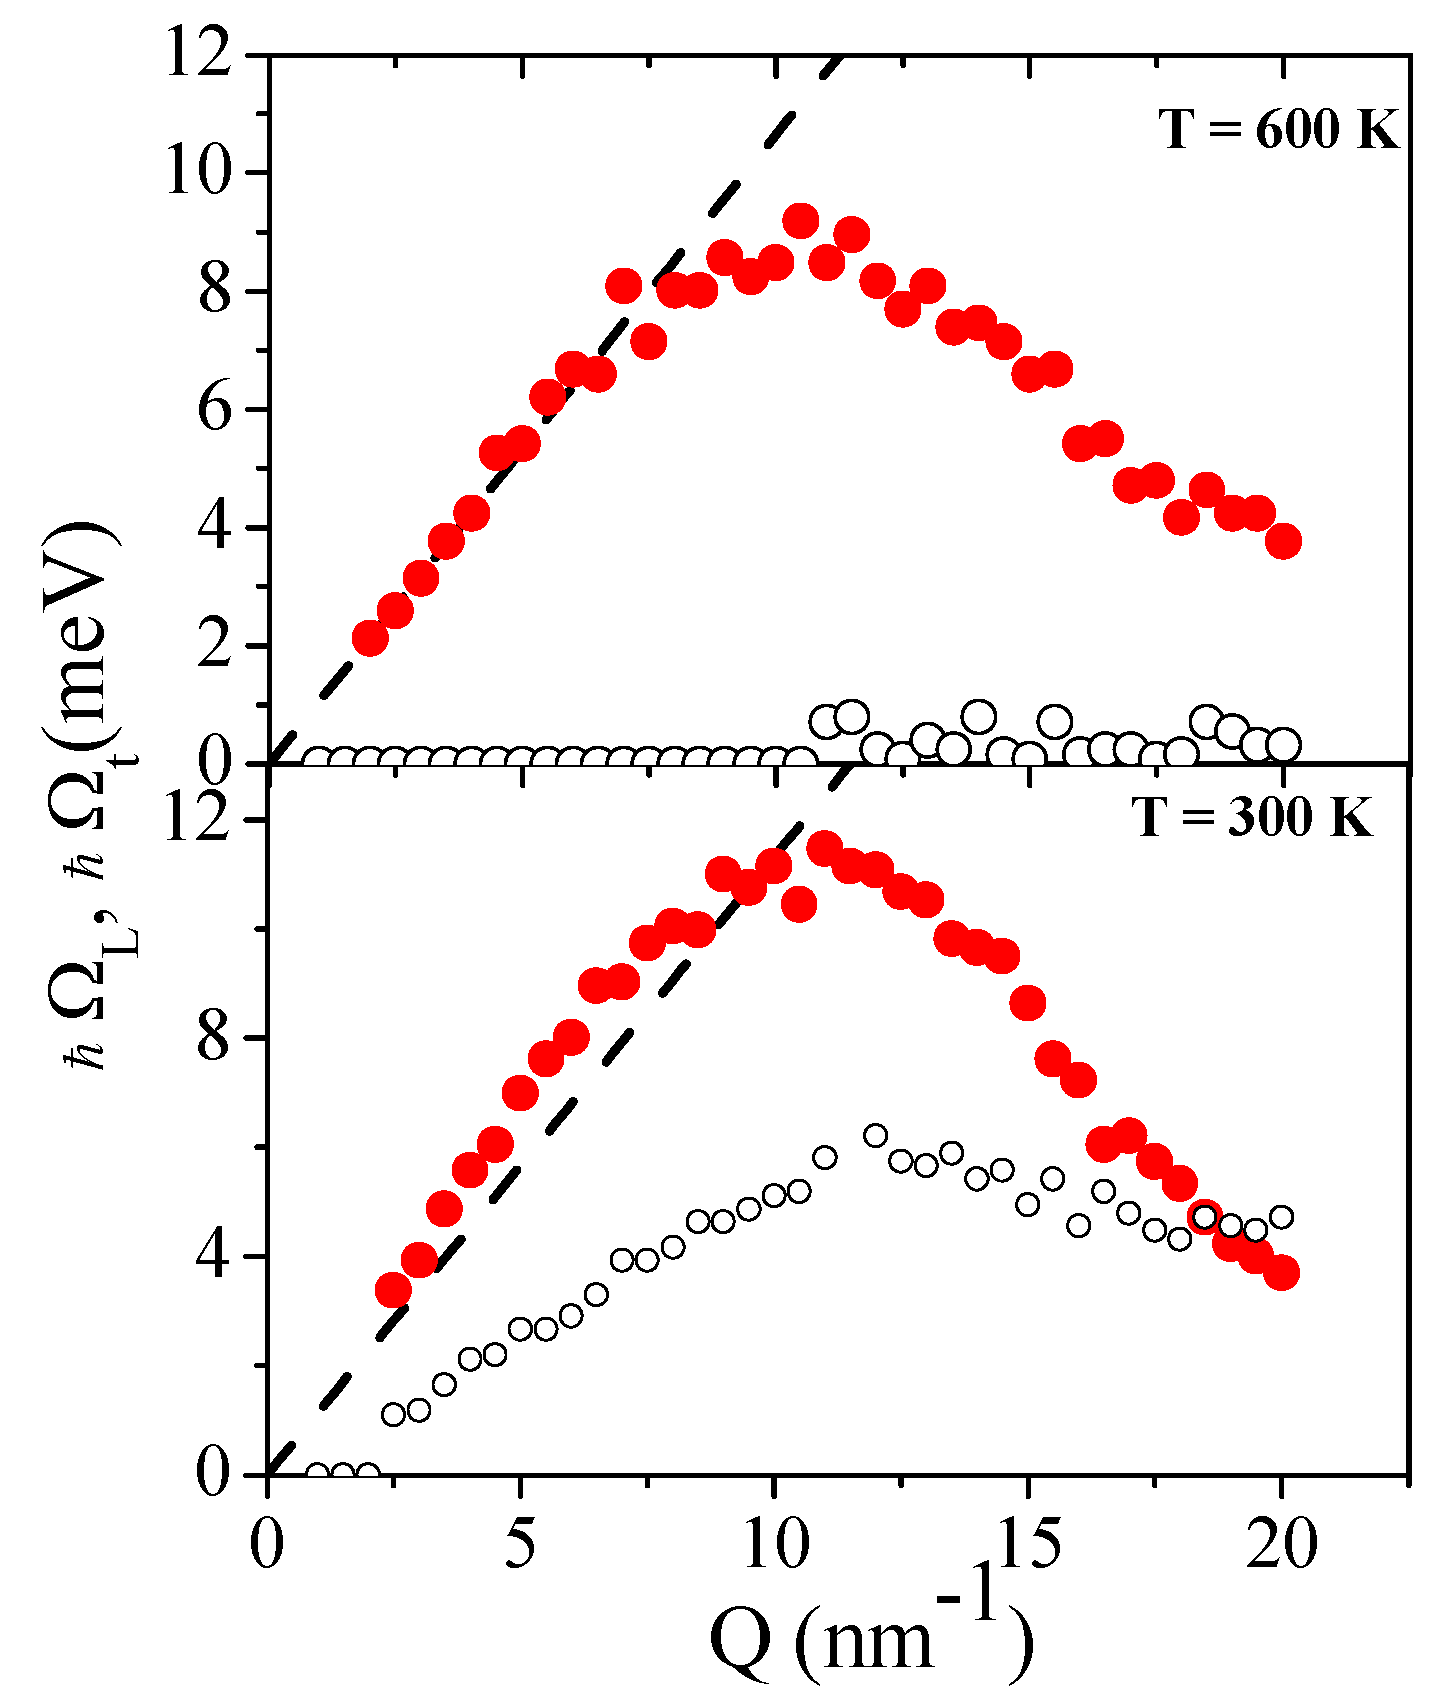
(3)
Again, viscoelastic effects disappear in deeply supercritical conditions (lower panel) since ω0, Ωl and ω merge into each other (at least at the lowest Qs), thus suggesting that the viscous relaxation term in Equation (9) has a vanishing strength.
As previously mentioned, the validity of the simple viscoelastic model demands that the thermal contribution to the memory function decay has negligible amplitude (γ ≈ 1). The soundness of this assumption is supported by the bottom panel of Figure 11, where the value of γ computed for supercritical Ne [65,66] is reported.
The curve is consistent with the macroscopic limit at the lowest Qs; however both curves suggest that the weight of the thermal contribution (proportional to γ − 1) is drastically reduced beyond Q ≈ 7 nm−1 since therein γ differs from 1 by less than 10%.
The generalized thermal diffusivity obtained from the same work is reported in the upper plot. One can confidently conclude that thermal diffusivity drastically decreases with Q consistently with the INS result of Bell et al. [40]. Furthermore, it appears that in the supercritical sample the departure from the hydrodynamic value happens at higher Q values and is much smoother. This seems consistent with the extended hydrodynamic behavior (up to ≈8 nm−1) of acoustic parameters already discussed in reference to Figure 10. It has to be noticed that trends similar to the ones in Figure 11 were also reported in a previous MD work on a Lennard Jones system representative of Ar at the triple point.
A final remark concerns the instantaneous term in the memory function decay (last term in Equation (9)). It is reasonable to expect that this contribution is rather weak for low-viscosity and non-associated fluids as noble gases. This conclusion is support the soundness of a simple viscoelastic assumption. On the other hand in Ref. [42], using a double exponential model allows one to extract essentially the same value for the two timescales involved, at least for Q > 4–5 nm−1.

4.1. Microscopic vs. Structural Relaxations
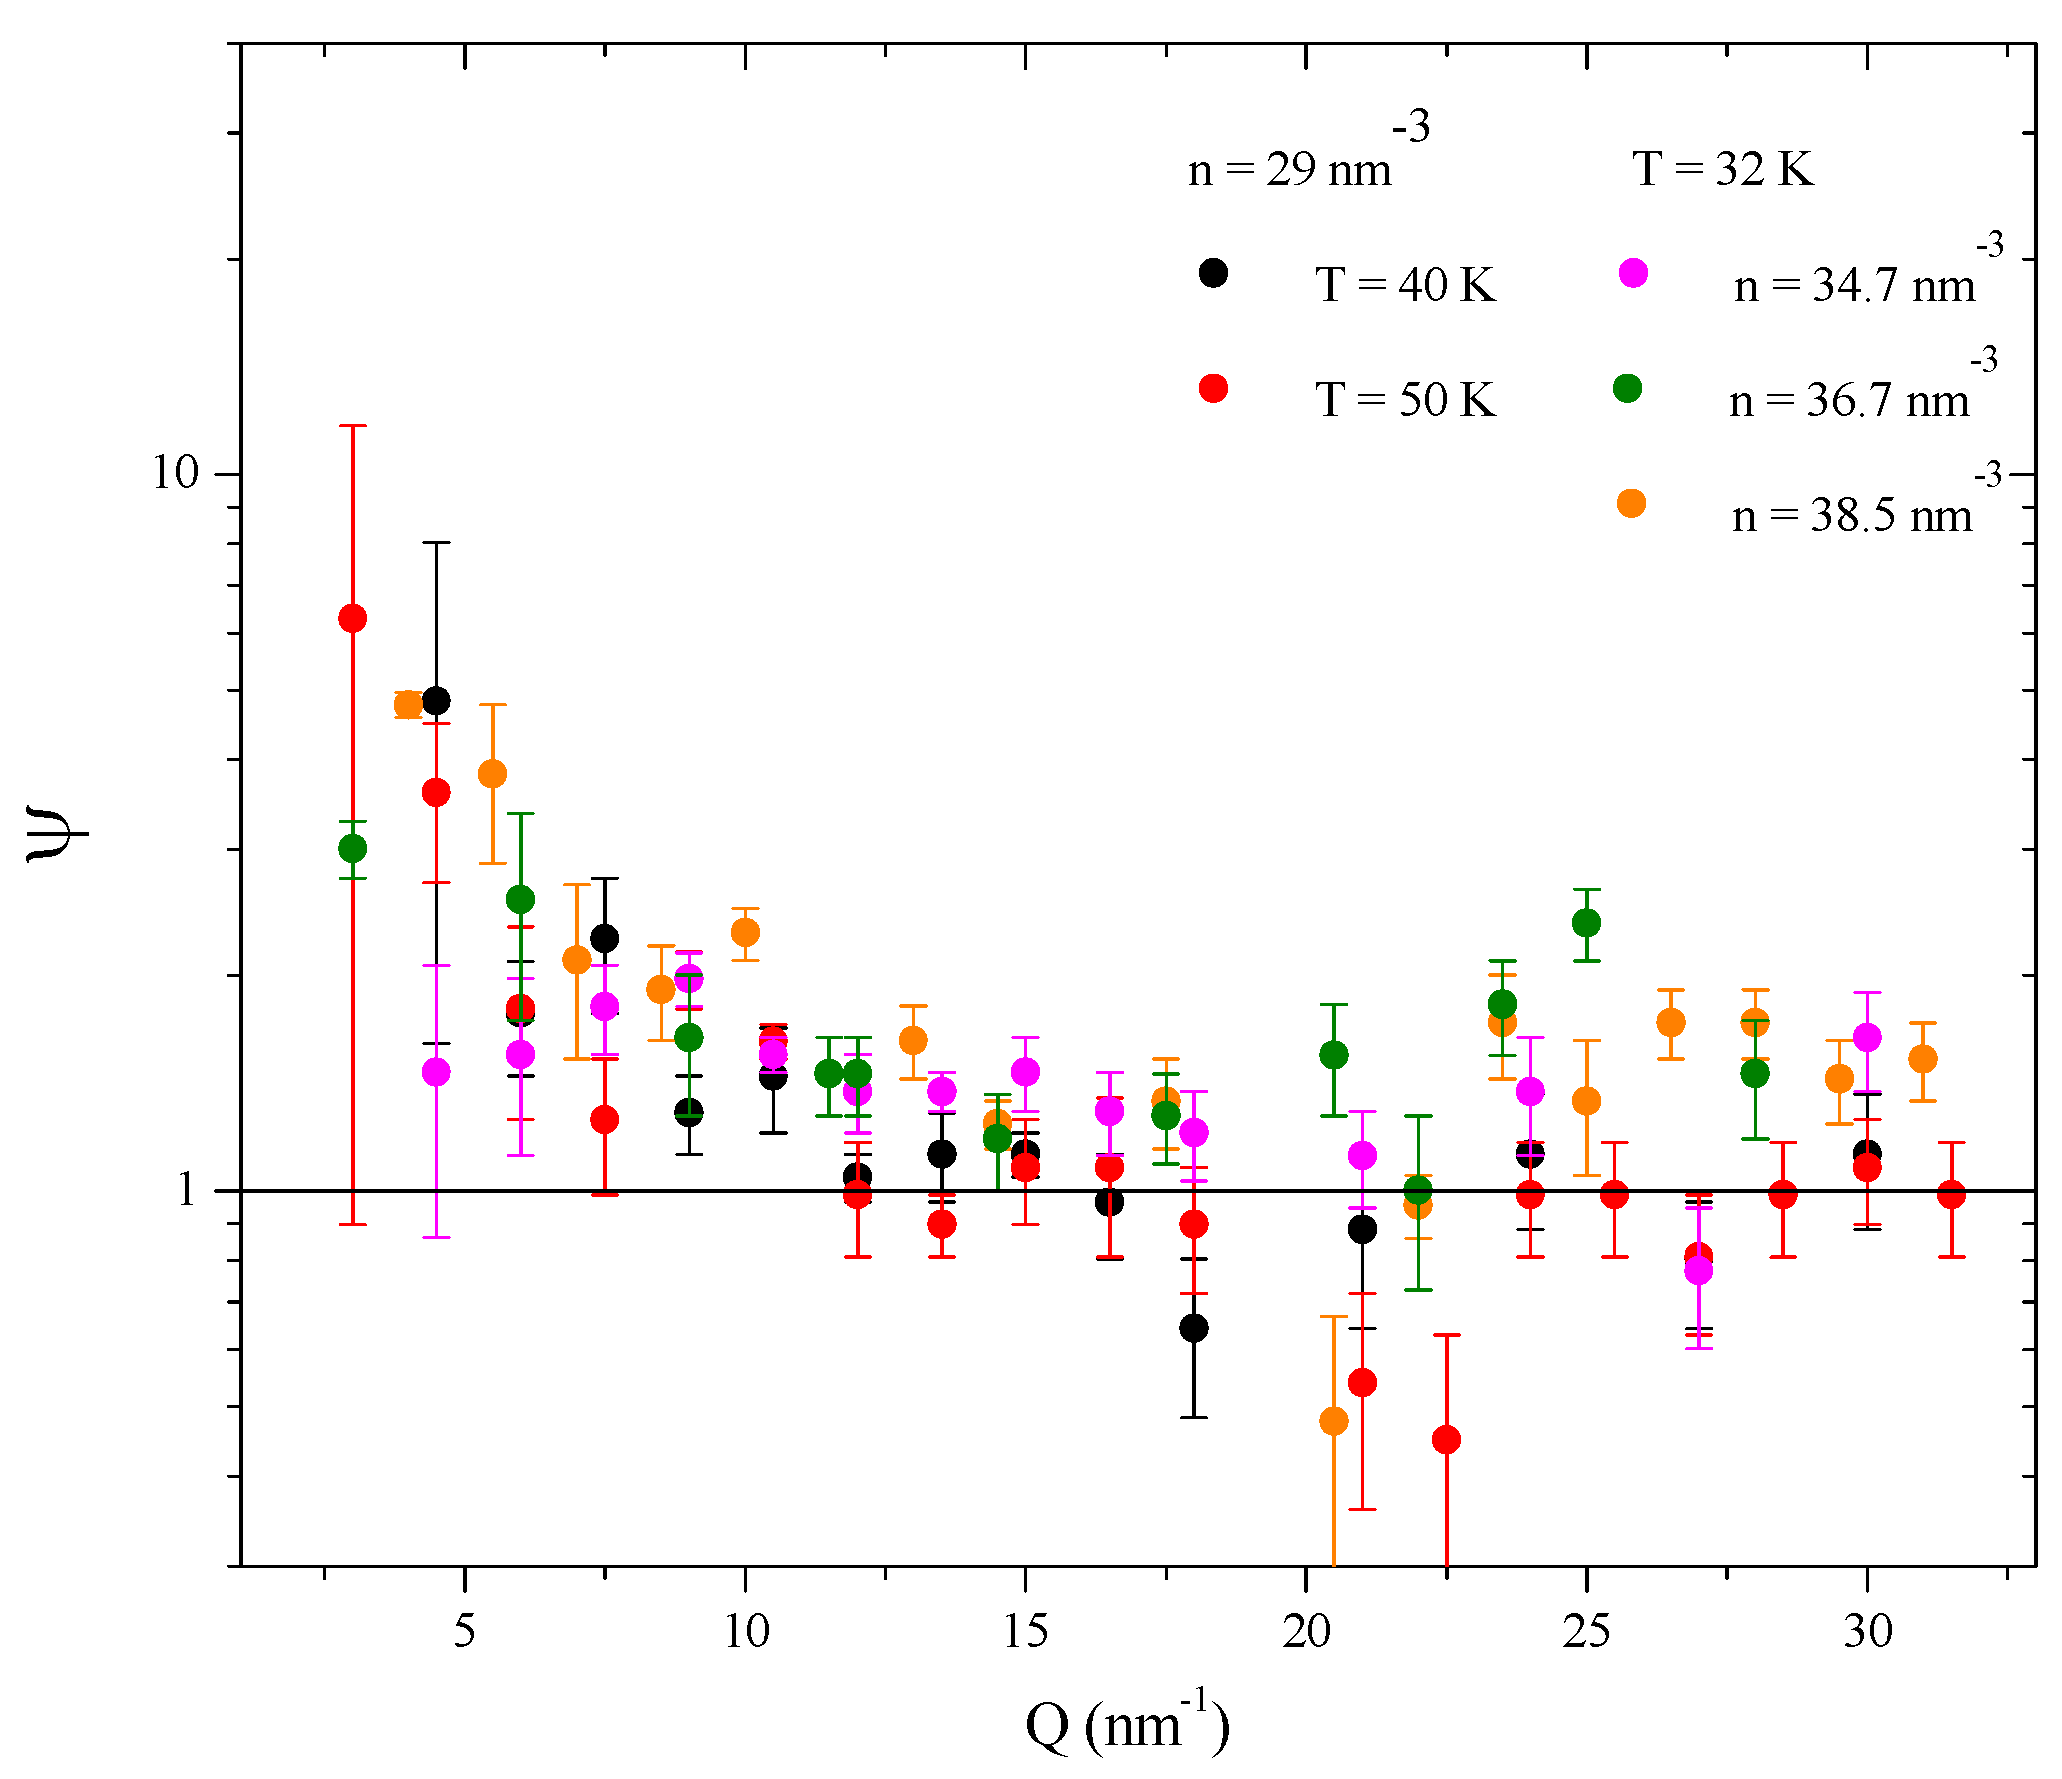
The results discussed in [6] indicate that the relaxation phenomenon causing the viscoelastic response of neon has a microscopic origin as opposite to the structural character of relaxations routinely observed in associated and/or highly viscous fluids. It should be emphasized that structural and microscopic relaxations have different physical origin and phenomenology: the former are cooperative in character and involve readjustments of the structure in response to a mechanical or a scattering-induced perturbation. Consequently, they are prevalent in glass-forming systems or associated fluids, i.e., fluids with extended network of bonds, this is, e.g., liquid water [12,13,93,94,95], hydrogen fluoride [14], glycerol [17]. Since collective rearrangements of the structure are hampered by viscous processes, the timescale of structural relaxation follows a temperature dependence roughly as steep as the one of viscosity.
Conversely, microscopic relaxations are induced by single molecules’ motions in the 10−13 s window and are dominating in simple systems, such as dense gases and non-associated, weakly viscous, fluids. These fast motions can be naturally identified with vibration-like cage oscillations. Due to their non-cooperative nature, microscopic relaxations are not significantly slowed down by viscosity and their timescale exhibits only a weak dependence on thermodynamic conditions.
To quantitatively assess the hypothesized microscopic nature of viscoelastic processes in neon, sensible variable to take as a reference is the mean free time between interatomic collisions, τc. This depends on atomic size, mass and shape, as well as on the interaction potential and thermodynamic state of the system. Without sophisticated calculations, a reasonable estimate can be obtained assuming as model a hard sphere gas following the Maxwell-Boltzmann statistics. For this system the inter-collision time can be easily calculated as:
τ c = M 16 π d 4 k B T
where d is the hard sphere diameter. In this context τc can be identified as the characteristic timescale of interatomic interactions and for microscopic, or collisional, relaxations is reasonable that the relaxation time τα and τc have comparable values. In Figure 12 the Q-dependence of the reduced relaxation time Ψ = ταc is reported as obtained using τα values measured in neon in Ref. In spite of the important scattering of data, it is clear that for Q larger than about 8 nm−1 Ψ approaches the unit value, as expected in the merely collisional limit. In this perspective, data in Figure 12 lead to the conclusion that for Q > 8 nm−1 THz relaxation processes of neon are intimately related to interatomic collisions.
This may be an expected conclusion, particularly since relaxation processes are activated by the coupling of density fluctuations with some internal degree of freedom of the system. Given that microscopic components of a monatomic fluid lack internal degrees of freedom, it seems natural to identify local cage oscillations as the internal degree of freedom that density fluctuations couple to.
At this stage, THz viscoelastic data available in literature can be used to compare the case of Ne to the one even more studied of water. This comparison seems particularly meaningful due to the disparate nature of microscopic structure and, in particular, to the presence of a large-scale connectivity in water.
A meaningful reference to compare viscoelastic effects in different materials is provided by the generalized longitudinal viscosity, whose link the viscoelastic spectral parameters is given by the formula:
η l = ρ ( ω 2 ω 0 2 ) τ Q 2
Figure 7 displays the Q-dependence of ηl extracted (through Equation (15)) from the viscoelastic modeling of neon spectra in [6] at the thermodynamic conditions considered in Figure 4. Results on neon are compared with those obtained in liquid water from an IXS [13] and a joint INS and INS result on heavy water [78]. Some clear features readily emerge from the comparison:
(1)
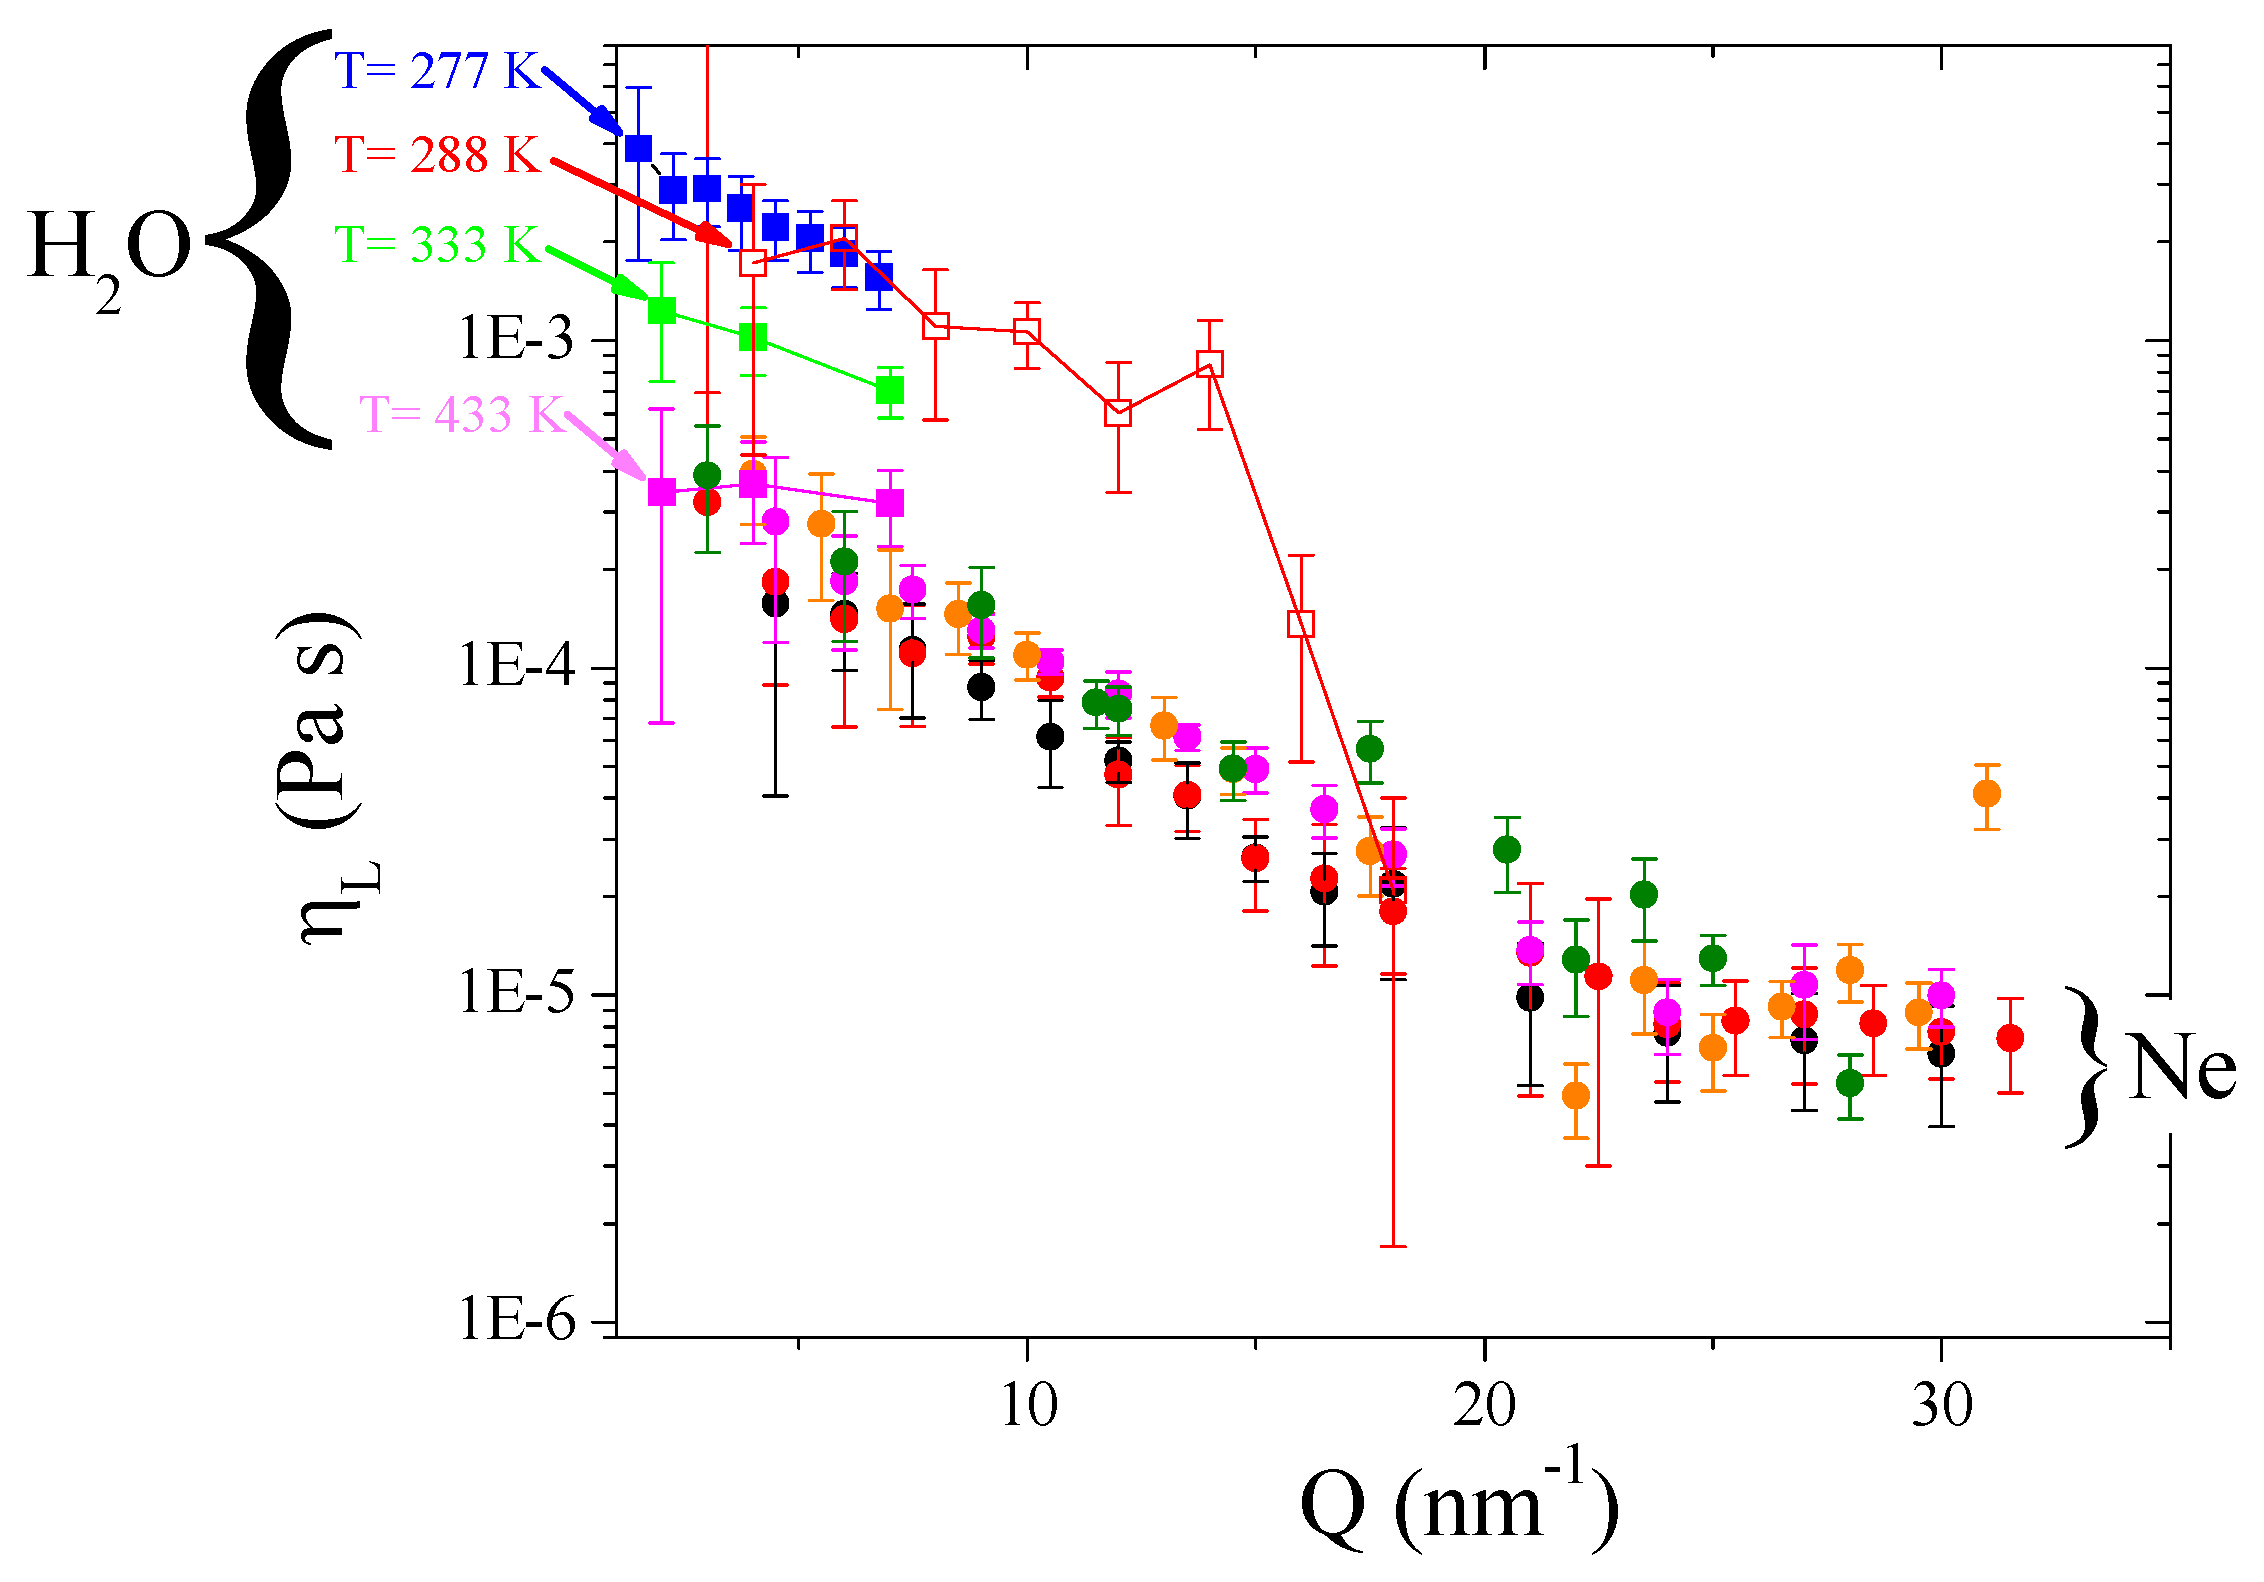
Viscosity curves of Ne are only weakly dependent on thermodynamic conditions, although the macroscopic viscosity in the spanned thermodynamic interval undergoes important variations. Combined thermodynamic [72] and bulk viscosity data [28] of neon lead to estimate a more than 300% variation of ηl within the probed thermodynamic range, clearly non reproduced by mesoscopic measurements. Conversely, viscosity data of water in the same plot have a T dependence as sharp as the one of macroscopic viscosity [96]. This discrepancy is likely due to the large weight of structural processes in water, especially at the low Qs covered by data of [13]. Structural relaxations, owing to their collective nature can only be observed over long distances, or, equivalently, at high Qs and are expectedly dominating in associate liquids.
(2)
High T values of ηl approach from above low-Q neon data. This seems consistent with the inferred link between structural relaxation and local readjustment of the hydrogen bond (HB) network in water [12,13]. At the highest Ts the average number of HBs per molecule is sensibly lower which weakens the strength of structural relaxations [13,19].
(3)
The strong Q-dependence of ηl in water suggests that at Q higher than the values covered by Ref. [13], viscosity curves of water and neon tend to get closer to each other also considering that the latter have an essentially flat Q-dependence at high Qs. This impression is confirmed by ηl data derived from extremely high resolution INS measurements of on deuterated water (line + open squares symbols) at T = 288 K, which covered a Q-range larger than those of other water data reported in the same plot.
Overall, data in Figure 13 lead to the conclusion that the merely collisional component of relaxation in water becomes more relevant either at high T, i.e., upon approaching supercritical condition, or at high Qs, where structural relaxation become less prevalent.

4.2. 2001–2003: Quantum Effects on the Line-Shape

The treatment discussed so far is fully classical in character, being based on the assumption that all involved operators are commuting and the correlation functions are even function of time or, equivalently, that the spectral shape is symmetric in ω. It can be assumed that the onset of quantum effects primarily induces an asymmetry on the shape of S(Q) due to the different statistical population of states having distinct ω values. In all experimental and computational works mentioned in this review, the spectrum is described within a quasi-classical approximation. According to such approximation, quantum effects only influence the statistical populations of states having different ωs, through the so-called detailed balance principle [97]. This can be fulfilled in infinite possible ways; one of the most commonly used consisting in the multiplication of the classical S(Q) profile by the factor n ( ω , T ) = ω / k B T [ 1 e x p ( ω / k B T ) ] , i.e.:
S ( Q , ω ) = ω k B T [ 1 1 e x p ( ω / k B T ) ] S C ( Q , ω )
Here S C ( Q , ω ) is the “classical”, or symmetric, part of the spectrum which is essentially the Fourier transform of the intermediate scattering F(Q,t). While deriving a model for S C ( Q , ω ) it is assumed that the operator defining the time evolution of density are classical commuting variables. However, in real fluids quantum deviations may be important.
In this respect, it’s worth distinguishing between two possible quantum effects on S(Q): i) “diffraction” or “delocalization” effects, which arise from the non-commutative nature of Hamiltonian operators; and ii) exchange effects, reflect the symmetry restriction to be fulfilled in a many body system of identical particles.
Both effects depend on the de Broglie wavelengh Λ = ( 2 π / m k B T ) 1 / 2 , however:
  • Diffraction effects are relevant only when Λ matches the length-scales over wich the interparticle potential U(rij) varies apppreciably.
  • Exchange effects are instead relevant when Λ becomes comparable with interatominc centers of mass distance and are thus observable only for small mass atoms, for which such a distance can be relatively small. These effects only emerge at very low temperature and responsible for few “spectacular” quanto-mechanical manifestations, such as, e.g., Bose condensation and superfluidity.
One can reasonably assume that all sampple considerd in this review are either fully classical or moderately quantum fluids, for which exchange effects can be discarded, while quantum deviation can be achieved through ℏ-order corrections of classical results. For moderately quantum fluids, one can still derive F(Q,t) using a memory function formalism. However, the operators defining the Hamiltonian of the system are generally non-commuting. For these systems, the time dependence of density fluctuation is derived as the solution of the Heisenberg equation of motion:
δ ρ ˙ . ( Q , t ) = i [ δ ρ , H ] = i m [ e x p [ i Q r m ( t ) ] , H ]
where the Hamiltonian, H, for a N particle system reads as:
H = i = 1 , N i 2 2 M + i j U ( r i j )
where i 2 is the Laplacian operator and U ( r i j ) is a pair potential acting between the i-th and j-th atoms.
Three IXS works performed at the beginning of the new millennium were focused on the onset of quantum effects on the spectrum of supercritical He [98] and liquid Ne [99,100]. Whilst in the first work , quantum effects were investigated for moderate Qs as a function of temperature and density; in the two IXS works on Ne, due to the unprecedented wide Q range the whole transition in Q form the classical (continuous) to the quantum (single particle) regimes was crossed.
In all these IXS works, quantum effects were sought for in the coefficients governing the short time dynamics, i.e. the spectral moments, which for a quantum fluid read as:
ω n = 1 / i n ( n / t n ) F ( q , t ) | t = 0 = [ [ [ ρ , H ] H ] . . . . . . . H ] | t = 0
In principle the ω n can be computed from direct integration of IXS intensity. However, a rigorous computation is non-trivial, since one must cope with all spurious intensity effects and the contribution to the integral from the finite instrumental resolution. One can easily eliminate spurious intensity effect—as long as these are ω-independent—by dealing with spectral moments’ ratios. Conversely, eliminating the resolution contribution would require a numerical deconvolution of the measured line-shape, which is ill-determined unless the spectral shapes has the form of a single featureless peak. In the IXS works mentioned above spectral moments were instead computed from direct integration of best fit (non-convoluted) model line-shape. This procedure led to estimate that, for instance, quantum effects in the neon measurement of Figure 12 and Figure 13, although clearly sizable, are < 15%–20%, even at the lowest Ts and/or the highest densities. This estimate is roughly consistent with the one reported by Bell et al. [40]. One may wonder what influence these effects can have on the relaxation process.
It can be shown that the so-called quantum viscoelastic [101], an exponential ansatz, can still be used. The direct consequence of quantum effects is a global softening of the interaction potential. This stems from the delocalized nature of the tagged particle, which enables a deeper penetration in the region where the interatomic potential is repulsive.

5. 2006-Present: Toward a New Vision of the Supercritical Phase
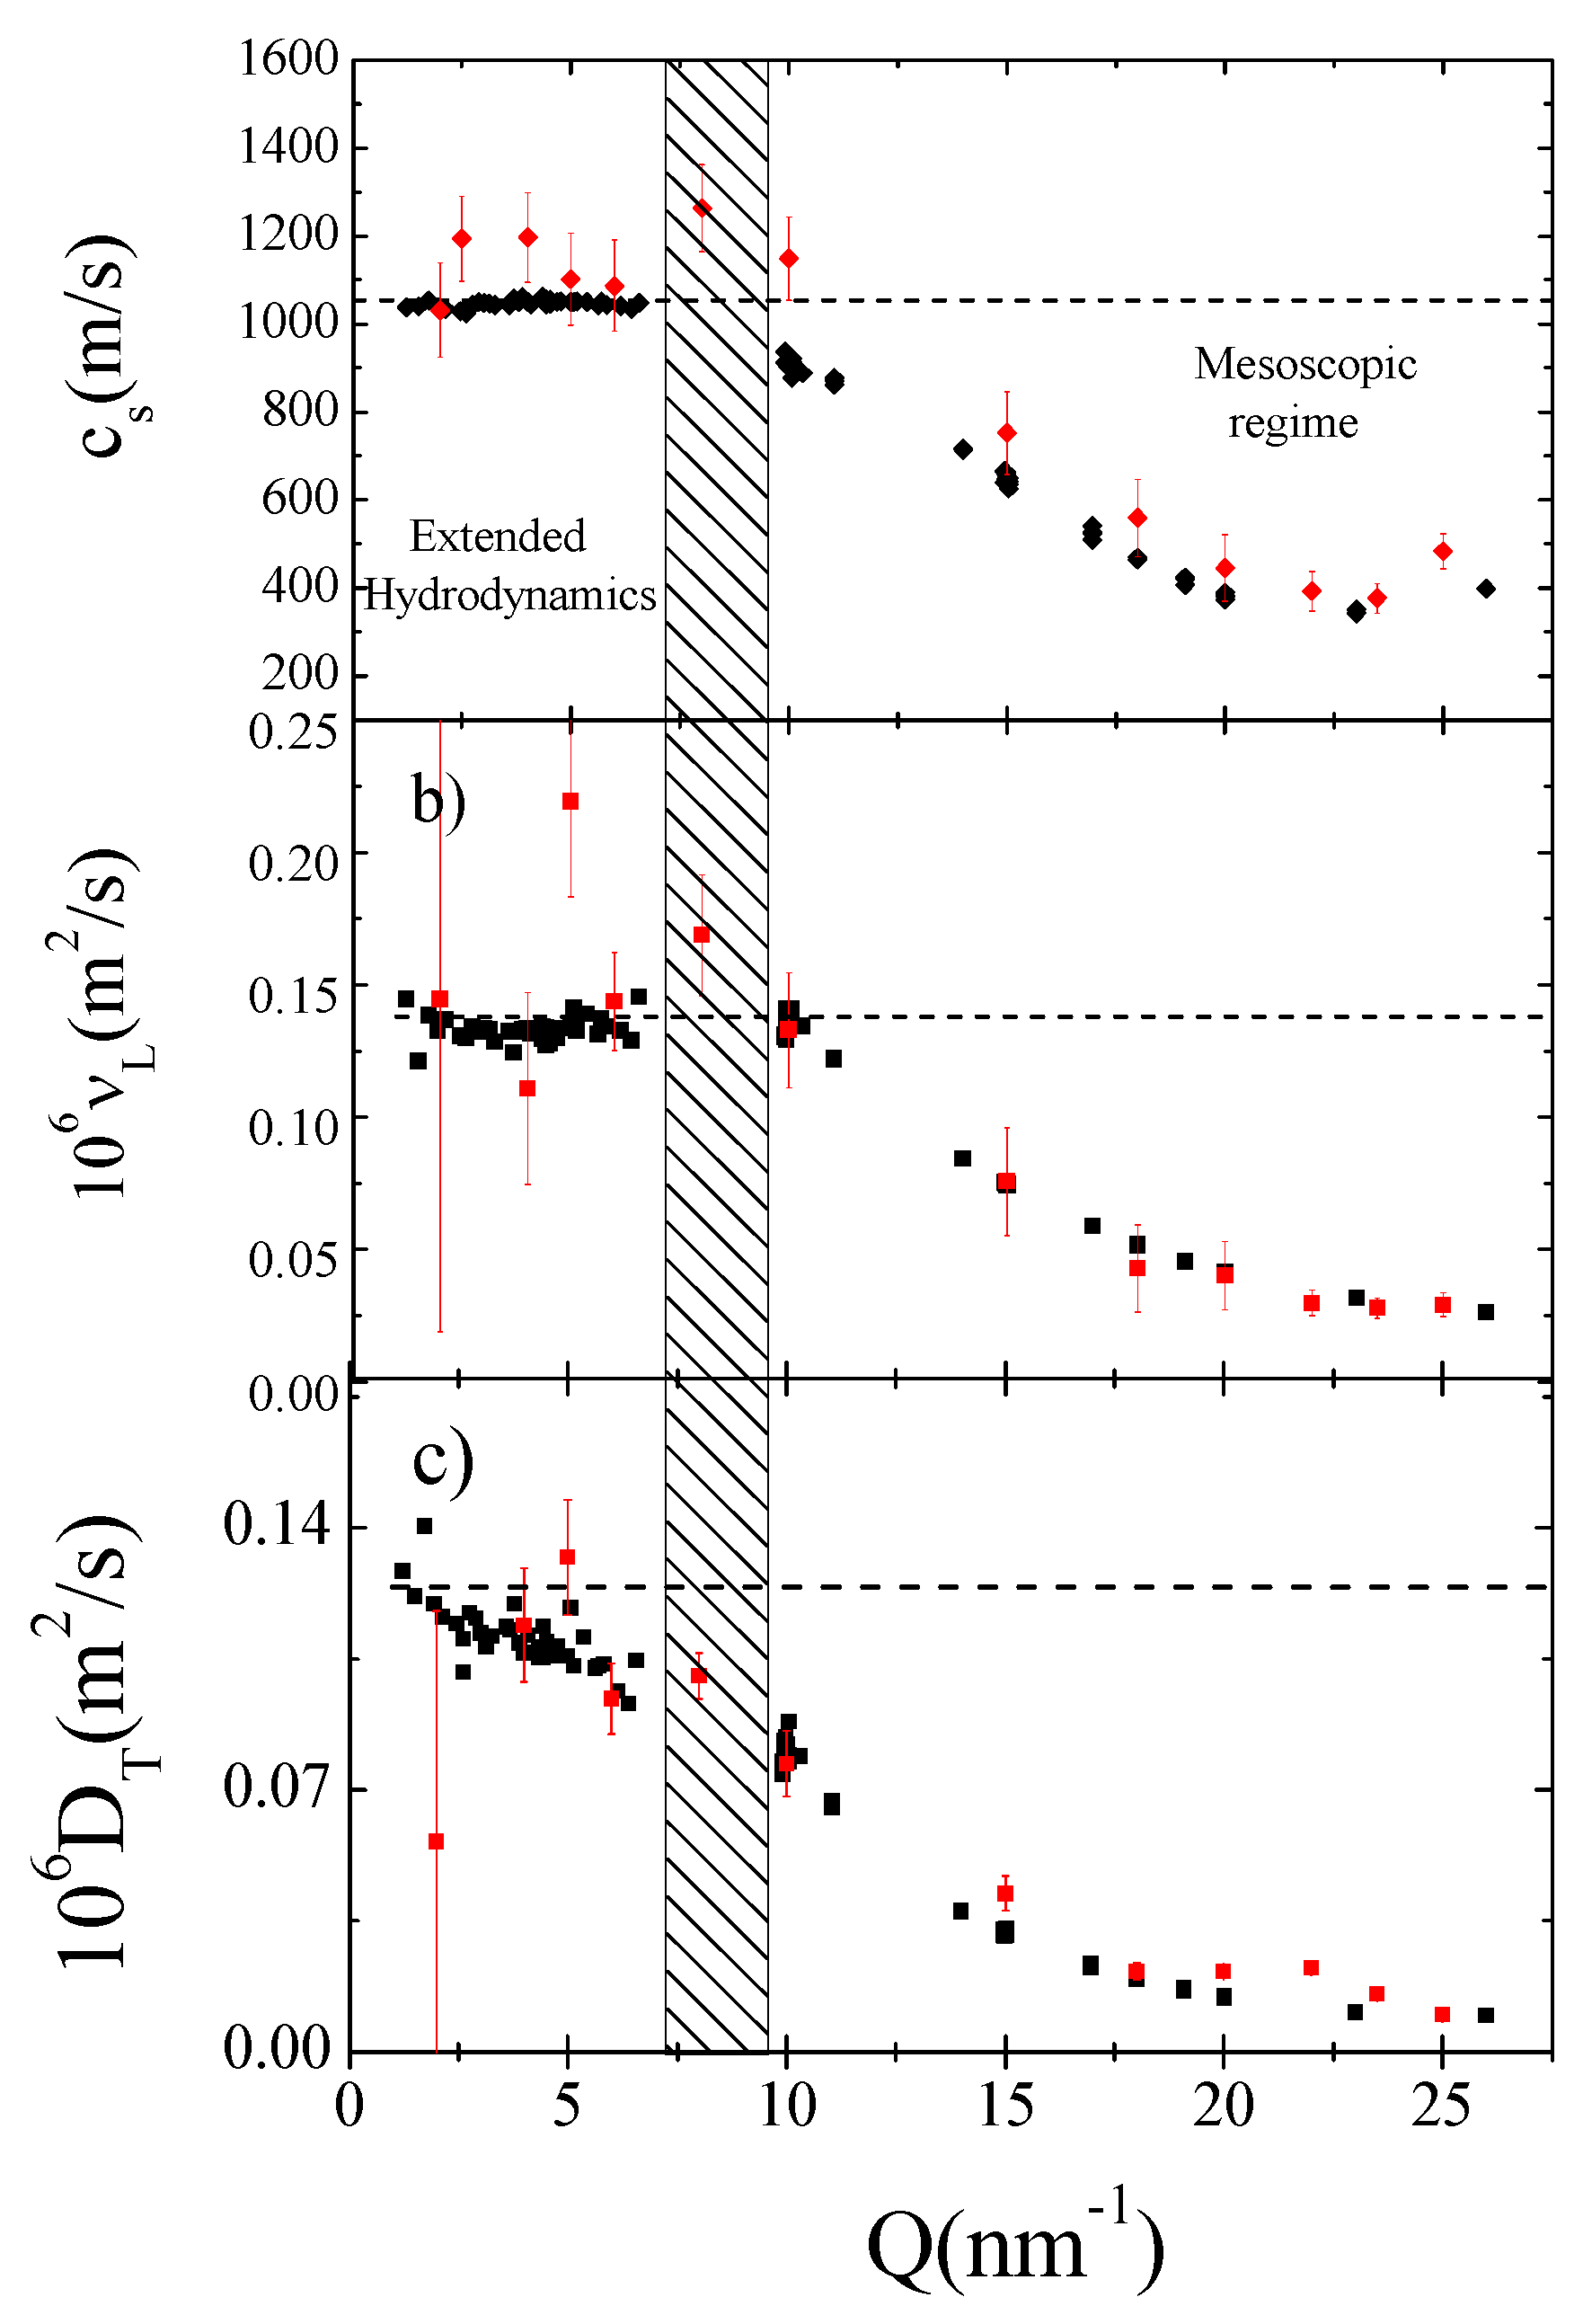
Based on the results previously discussed, it may be natural to conclude that the viscoelastic behavior is a dynamic fingerprint of the liquid phase, which disappears when supercritical conditions are reached. Indeed, the PSD has often been considered an almost universal feature of liquid aggregates, since almost ubiquitously observed in liquid systems as disparate as, for instance hard sphere [102] and Lennard-Jones models [103], noble gases [43,46,71], as well as diatomic [8], associated [12,13] and glass forming [15,17] systems. Its disappearance at deeply supercritical conditions was considered as an indication that supercritical fluids do not exhibit a high frequency viscoelasticity.
The actual test of this conjecture requires a thorough investigation of the THz spectral shape of supercritical fluid at extreme P and T values. For many decades, this has been an almost prohibitive task, owing to a number of experimental difficulties. As mentioned, the development of IXS brought about a substantial narrowing of the beam cross section, while the improved performance of undulators and crystal optics have dramatically enhanced the flux achievable in ordinary THz spectroscopy measurements. This paved the way to new class of IXS experiments at extreme pressures based upon the use of diamond anvil cells (DACs). Taking advantage of this opportunity, an IXS DACs measurement on deeply supercritical oxygen demonstrated that a PSD of about 20% in amplitude is visible at temperatures as high as nearly twice the critical one [104]. The results of this measurement imposed a global revision of the previous idea that THz viscoelasticity phenomena could represent a dynamical fingerprint of the liquid phase. Another breakthrough came from a successive joint IXS and MD work on Ar at extreme pressures [105], which showed the occurrence of a dynamic transition upon crossing a boundary in the supercritical domain. A dramatic reduction in the amplitude of PSD was, in fact, observed upon crossing the Widom line [106] and was interpreted as a crossover between a “liquid like” and a “gas like” sub-regions of the supercritical phase. As a reminder, the Widom line is defined as the locus of specific heat maxima, which emanates from the critical point toward the supercritical domain with essentially the same slope as the coexistence line. For this reason, the Widom line is often considered a “prosecution” of the coexistence line beyond the critical point.
Perhaps the most intriguing aspect of these results is that the mere existence of a boundary in the thermodynamic plane challenges the long-standing vision of the supercritical phase as intrinsically uniform [107], thus opening up unexplored theoretical scenarios and novel investigation opportunities.
Another important result came from the recent conclusion that PSD effects are intimately related to the onset of shear propagation.
The occurrence of a shear mode propagation in argon was first demonstrated by a MD simulation on a Lennard Jones Ar [41,42]. As a common result, it was observed that at some wavelengths transverse current spectra bore evidence for a well-defined maximum, indicating the occurrence of a shear mode propagation.
More recently, a joint IXS and MD simulation work on deeply supercritical argon [108] evidenced a close connection between the ability of a fluid system to support shear mode propagation and the presence of a sizeable PSD. In this work IXS spectra were measured along a nearly isobaric path (with P ≈ 1 GPa) with T spanning the 300 K–436 K temperature range, while MD data spanned the same isobar within a larger T-interval (up to 800 K).
As a result, it was there shown that the disappearance of the PSD in deep supercritical conditions is accompanied by a parallel shear modes overdamping (see Figure 14). Overall, the fundamental character of the PSD and its link to thermodynamic transformations (previously disputed by [109]), are convincingly demonstrated in the work of Bolmatov et al. There, in fact, the PSD and the shear mode propagation are linked together and interpreted as different manifestations of the same universal property of fluids: the onset of a high frequency viscoelasticity.
The results of this work suggest that the dynamic response of supercritical fluids is characterized by different regimes characteristic of distinct thermodynamic subdomains:
(1)
A gas-like domain, featured by the absence of PSD effects and the related inability of the fluid to support transverse wave propagation and
(2)
A liquid-like domain in which the system exhibits merely viscoelastic features such as a sizable PSD and the onset of shear mode propagation.
Furthermore, in the work of Bolmatov and collaborators [108] the Frenkel line [110] was identified as the crossover line between the two thermodynamic regions. The interpretation of the Frenkel line as a crossover line demarcating the presence/absence of transverse acoustic propagation was originally discussed in [111]. It was also previously predicted that the occurrence, across the Frenkel line, of both dynamic and structural crossovers accompanied by changes in phonon states [112,113,114,115]. Finally, it is worth mentioning a more recent work on deeply supercritical Ar [116], which provides compelling evidence for important dynamical changes occurring upon crossing the Frenkel line and having the form of strong localization of the longitudinal sound mode.
Most importantly, the assessed parallelism between the disappearance of the PSD and the overdamping of shear mode finally indicates that the observed viscoelastic behavior in noble gases is related relaxation process primarily affecting the shear viscosity.

6. Conclusions and Future Perspectives

This brief review results THz studies on the viscoelastic response of simplest systems as noble gases have, across the years evidenced a rather complex behavior. The study of relaxation processes in noble gases and, in particular, the comparison with those observed in more complex, associated fluids led the scientific community to identify a new class of relaxation phenomena completely different from structural (or α-)relaxations routinely observed glass formers and highly viscous materials. These new relaxation phenomena are faster (in the sub-ps) and only weakly dependent on thermodynamic conditions. Furthermore, their timescale is weekly affected by first neighbors’ arrangement, as suggested to its flat Q-dependence which presents no reminiscence of S(Q) oscillations. These collisional relaxations become visible also in associate fluids at temperature approaching critical conditions—due to the decrease in network connectivity—and/or over short distances, over which collective rearrangements cannot take place. These phenomena have recently observed to drastically affect the shear components of viscosity and to be intimately related to the presence of transverse acoustic modes propagation.
Most importantly, the study of viscoelastic phenomena at extreme supercritical conditions challenges the long-standing vision of the supercritical phase as inherently uniform state of matter. Nowadays these results call for a new and more complex understanding of the supercritical domain, based on the existence of liquid-like (viscoelastic) and gas-like (merely viscous) sub-domains separated by a thermodynamic boundary. Shedding further light onto this revolutionary hypothesis is certainly one of the main motivations for the scientific community working in the field.
Looking ahead, further advances in the study of relaxation phenomena in noble gases and more specifically in noble gases are still held back by inherent limitation in the used techniques. If from one side INS is still hampered by both incident flux and kinematic limitation, the main drawback of current IXS is the broad and slowly decaying (essentially Lorentzian) resolution wings. When focusing on relaxation processes the relevant spectral information is gathered in the extremely low frequency or quasi-elastic spectral window, often on the side of a dominating central peak. A narrow resolution width is thus required to properly resolve the spectral features of interest, while a superior contrast is necessary to discern them from the broad wings of the elastic line.
Fortunately, a new concept optics for both monochromatization and energy analysis holds the promise for new generation spectrometers meting the required performance [117]. This will enable to perform IXS experiments with a resolution function <1 meV broad and essentially Gaussian in shape. The feasibility of such high resolution optical schemes has been demonstrated in a recent work [118], while a beamline based on this working principle has recently become operative at the new synchrotron NSLS II of Brookhaven National Laboratory [119]. This new opportunity is certainly quite encouraging and, in the near future, deemed to further advance our knowledge of the complex THz dynamics of simple liquids.

Acknowledgments

I wish to thank Tawandra Rowell-Cunsolo for the help in the manuscript preparation. Work performed at the National Synchrotron Light Source II, Brookhaven National Laboratory, was supported by the U.S. Department of Energy, Office of Science, Office of Basic Energy Sciences, under Contract No. DE-SC0012704.

Conflicts of Interest

The authors declare no conflict of interest.

References

  1. Lovesey, S.W. Theory of Neutron Scattering from Condensed Matter; Clarendon Press: Oxford, UK, 1984; Volume 1. [Google Scholar]
  2. Sinha, S.K. Theory of inelastic X-ray scattering from condensed matter. J. Phys. Condens. Matter. 2001, 13, 7511–7523. [Google Scholar] [CrossRef]
  3. Berne, B.J.; Pecora, R. Dynamic Light Scattering; John Wiley: New York, NY, USA, 1976. [Google Scholar]
  4. Zwanzig, R. Lectures in Theoretical Physiscs; Brittin, W., Ed.; Wiley-Inerscience: New York, NY, USA, 1961; Volume 3, pp. 106–141. [Google Scholar]
  5. Mori, H. A continued-fraction representation of the time-correlation functions. Prog. Theor. Phys. 1965, 34, 399–416. [Google Scholar] [CrossRef]
  6. Cunsolo, A.; Pratesi, G.; Verbeni, R.; Colognesi, D.; Masciovecchio, C.; Monaco, G.; Ruocco, G.; Sette, F. Microscopic relaxation in supercritical and liquid neon. J. Chem. Phys. 2001, 114, 2259–2267. [Google Scholar] [CrossRef]
  7. Bencivenga, F.; Cunsolo, A.; Krisch, M.; Monaco, G.; Orsingher, L.; Ruocco, G.; Sette, F.; Vispa, A. Structural and collisional relaxations in liquids and supercritical fluids. Phys. Rev. Lett. 2007, 98, 085501. [Google Scholar] [CrossRef] [PubMed]
  8. Bencivenga, F.; Cunsolo, A.; Krisch, M.; Monaco, G.; Ruocco, G.; Sette, F. Adiabatic and isothermal sound waves: The case of supercritical nitrogen. Europhys. Lett. 2006, 75, 70–76. [Google Scholar] [CrossRef]
  9. Scopigno, T.; Balucani, U.; Ruocco, G.; Sette, F. Evidence of two viscous relaxation processes in the collective dynamics of liquid lithium. Phys. Rev. Lett. 2000, 85, 4076–4079. [Google Scholar] [CrossRef] [PubMed]
  10. Scopigno, T.; Balucani, U.; Ruocco, G.; Sette, F. Inelastic X-ray scattering study of the collective dynamics in simple liquid metals. J. Non-Cryst. Solids 2002, 312–314, 121–127. [Google Scholar] [CrossRef]
  11. Scopigno, T.; Ruocco, G.; Sette, F. Microscopic dynamics in liquid metals: The experimental point of view. Rev. Mod. Phys. 2005, 77, 881–933. [Google Scholar] [CrossRef]
  12. Cunsolo, A.; Ruocco, G.; Sette, F.; Masciovecchio, C.; Mermet, A.; Monaco, G.; Sampoli, M.; Verbeni, R. Experimental determination of the structural relaxation in liquid water. Phys. Rev. Lett. 1999, 82, 775–778. [Google Scholar] [CrossRef]
  13. Monaco, G.; Cunsolo, A.; Ruocco, G.; Sette, F. Viscoelastic behavior of water in the terahertz-frequency range: An inelastic X-ray scattering study. Phys. Rev. E 1999, 60, 5505–5521. [Google Scholar] [CrossRef]
  14. Angelini, R.; Giura, P.; Monaco, G.; Ruocco, G.; Sette, F.; Verbeni, R. Structural and microscopic relaxation processes in liquid hydrogen fluoride. Phys. Rev. Lett. 2002, 88, 255503. [Google Scholar] [CrossRef] [PubMed]
  15. Fioretto, D.; Buchenau, U.; Comez, L.; Sokolov, A.; Masciovecchio, C.; Mermet, A.; Ruocco, G.; Sette, F.; Willner, L.; Frick, B.; et al. High-frequency dynamics of glass-forming polybutadiene. Phys. Rev. E 1999, 59, 4470–4475. [Google Scholar] [CrossRef]
  16. Scarponi, F.; Comez, L.; Fioretto, D.; Palmieri, L. Brillouin light scattering from transverse and longitudinal acoustic waves in glycerol. Phys. Rev. B 2004, 70, 054203. [Google Scholar] [CrossRef]
  17. Giugni, A.; Cunsolo, A. Structural relaxation in the dynamics of glycerol: A joint visible, UV and X-ray inelastic scattering study. J. Phys. Condens. Matter. 2006, 18, 889–902. [Google Scholar] [CrossRef]
  18. Comez, L.; Fioretto, D.; Monaco, G.; Ruocco, G. Brillouin scattering investigations of fast dynamics in glass forming systems. J. Non-Cryst. Solids 2002, 307, 148–153. [Google Scholar] [CrossRef]
  19. Bencivenga, F.; Cimatoribus, A.; Gessini, A.; Izzo, M.G.; Masciovecchio, C. Temperature and density dependence of the structural relaxation time in water by inelastic ultraviolet scattering. J. Chem. Phys. 2009, 131, 144502. [Google Scholar] [CrossRef] [PubMed]
  20. Bencivenga, F.; Cunsolo, A.; Krisch, M.; Monaco, G.; Ruocco, G.; Sette, F. High frequency dynamics in liquids and supercritical fluids: A comparative inelastic X-ray scattering study. J. Chem. Phys. 2009, 130, 064501. [Google Scholar] [CrossRef] [PubMed]
  21. Allen, M.P.; Tildesley, D.J. Computer Simulation of Liquids; Oxford University Press: Oxford, UK, 1989. [Google Scholar]
  22. Boon, J.P.; Yip, S. Molecular Hydrodynamics; Courier Dover Publications: Dover, UK, 1980. [Google Scholar]
  23. Bafile, U.; Guarini, E.; Barocchi, F. Collective acoustic modes as renormalized damped oscillators: Unified description of neutron and X-ray scattering data from classical fluids. Phys. Rev. E 2006, 73, 061203. [Google Scholar] [CrossRef] [PubMed]
  24. Brillouin, L. Diffusion of light and X-rays by a transparent homogeneous body. Ann. Phys. 1922, 17, 88. [Google Scholar]
  25. Landau, L.; Placzek, G. The structure of undisplaced scattered lines. Physik. Z. Sowjet. 1934, 5, 172. [Google Scholar]
  26. Fabelinskii, I. Some aspects of the molecular scattering of light in liquids. Phys. Usp. 1957, 63, 355–410. [Google Scholar] [CrossRef]
  27. Fleury, P.A.; Boon, J.P. Brillouin scattering in simple liquids—Argon and neon. Phys. Rev. 1969, 186, 244–254. [Google Scholar] [CrossRef]
  28. Castillo, R.; Castaneda, S. The bulk viscosity in dense fluids. Int. J. Thermophys. 1988, 9, 383–390. [Google Scholar] [CrossRef]
  29. Rouch, J.; Lai, C.C.; Chen, S.H. Brillouin-scattering studies of normal and supercooled water. J. Chem. Phys. 1976, 65, 4016–4021. [Google Scholar] [CrossRef]
  30. Fleury, P.; Boon, J.-P. Laser light scattering in fluid systems. Advances in Chemical Physics 1973, 24, 1–93. [Google Scholar]
  31. Chen, S.H.; Eder, O.J.; Egelstaf, P.; Haywood, B.C.G.; Webb, F.J. Co-operative modes of motion in simple liquids. Phys. Lett. 1965, 19, 269–271. [Google Scholar] [CrossRef]
  32. Kroô, N.; Borgonovi, G.; Skôld, K.; Larsson, K.-E. Inelastic scattering of cold neutrons by condensed argon. In Proceedings of the Symposium on Inelastic Scattering of Neutrons, Bombay, India, 15–19 December 1964; IAEA: Bombay, India, 1964. [Google Scholar]
  33. Sköld, K.; Larsson, K.E. Atomic motion in liquid argon. Phys. Rev. 1967, 161, 102–116. [Google Scholar] [CrossRef]
  34. Randolph, P.D.; Singwi, K.S. Slow-neutron scattering and collective motions in liquid lead. Phys. Rev. 1966, 152, 99. [Google Scholar] [CrossRef]
  35. Rahman, A. Propagation of density fluctuations in liquid rubidium: A molecular-dynamics study. Phys. Rev. Lett. 1974, 32, 52–54. [Google Scholar] [CrossRef]
  36. Price, D.L. Effects of a volume-dependent potential on equilibrium properties of liquid sodium. Phys. Rev. A 1971, 4, 358–363. [Google Scholar] [CrossRef]
  37. Bell, H.G.; Kollmar, A.; Alefeld, B.; Springer, T. Investigation of collective excitations in liquid neon by means of neutron-scattering at small scattering vectors. Phys. Lett. A 1973, 45, 479–480. [Google Scholar] [CrossRef]
  38. Henshaw, D.G.; Woods, A.D.B. Modes of atomic motions in liquid helium by inelastic scattering of neutrons. Phys. Rev. 1961, 121, 1266–1274. [Google Scholar] [CrossRef]
  39. Dorner, B.; Plesser, T.; Stiller, H. Brillouin scattering of neutrons from liquids. Discuss. Faraday Soc. 1967, 43, 160–168. [Google Scholar] [CrossRef]
  40. Bell, H.; Moellerwenghoffer, H.; Kollmar, A.; Stockmeyer, R.; Springer, T.; Stiller, H. Neutron Brillouin-scattering in fluid neon. Phys. Rev. A 1975, 11, 316–327. [Google Scholar] [CrossRef]
  41. Ailawadi, N.K.; Rahman, A.; Zwanzig, R. Generalized hydrodynamics and analysis of current correlation functions. Phys. Rev. A 1971, 4, 1616–1625. [Google Scholar] [CrossRef]
  42. Levesque, D.; Verlet, L.; Kürkijarvi, J. Computer "experiments" on classical fluids. Iv. Transport properties and time-correlation functions of the lennard-jones liquid near its triple point. Phys. Rev. A 1973, 7, 1690–1700. [Google Scholar] [CrossRef]
  43. Van Well, A.A.; Verkerk, P.; de Graaf, L.A.; Suck, J.B.; Copley, J.R.D. Density-fluctuations in liquid argon—Coherent dynamic structure factor along the 120-K isotherm obtained by neutron-scattering. Phys. Rev. A 1985, 31, 3391–3414. [Google Scholar] [CrossRef] [PubMed]
  44. De Schepper, I.M.; Verkerk, P.; van Well, A.A.; de Graaf, L.A. Short-wavelength sound modes in liquid argon. Phys. Rev. Lett. 1983, 50, 974–977. [Google Scholar] [CrossRef]
  45. Verkerk, P.; van Well, A.A.; de Schepper, I.M. Disappearance of the sound-propagation gap in liquid argon at very high-densities. J. Phys. C: Solid State Phys. 1987, 20, L979–L982. [Google Scholar] [CrossRef]
  46. Van Well, A.A.; de Graaf, L.A. Density fluctuations in liquid argon. Ii. Coherent dynamic structure factor at large wave numbers. Phys. Rev. A 1985, 32, 2384–2395. [Google Scholar] [CrossRef] [PubMed]
  47. De Schepper, I.M.; Verkerk, P.; van Well, A.A.; de Graaf, L.A. Non-analytic dispersion relations in liquid argon. Phys. Lett. A 1984, 104, 29–32. [Google Scholar] [CrossRef]
  48. McGreevy, R.L.; Mitchell, E.W.J. Collective modes in molten alkaline earth chlorides: III. Inelastic neutron scattering from molten MGCL2 and CACL2. J. Phys. C Solid State Phys. 1985, 18, 1163–1178. [Google Scholar] [CrossRef]
  49. Crevecoeur, R.M.; Verberg, R.; de Schepper, I.M.; de Graaf, L.A.; Montfrooij, W. Overdamped phonons in fluid helium at 4 K. Phys. Rev. Lett. 1995, 74, 5052–5055. [Google Scholar] [CrossRef] [PubMed]
  50. Montfrooij, W.; de Graaf, L.A.; de Schepper, I.M. Viscoelastic behavior of helium at 39-K and 114-bar. Phys. Rev. A 1991, 44, 6559–6563. [Google Scholar] [CrossRef] [PubMed]
  51. Zuilhof, M.J.; Cohen, E.G.D.; de Schepper, I.M. Sound-propagation in fluids and neutron-spectra. Phys. Lett. A 1984, 103, 120–125. [Google Scholar] [CrossRef]
  52. De Gennes, P.G. Liquid dynamics and inelastic scattering of neutrons. Physica 1959, 25, 825–839. [Google Scholar] [CrossRef]
  53. Lovesey, S.W. Comment on “short-wavelength sound modes in liquid argon”. Phys. Rev. Lett. 1984, 53, 401. [Google Scholar] [CrossRef]
  54. De Schepper, I.M.; Verkerk, P.; van Well, A.A.; de Graaf, L.A.; Cohen, E.G.D. de Schepper et al. Respond. Phys. Rev. Lett. 1985, 54, 158. [Google Scholar] [CrossRef]
  55. Hansen, J.-P.; McDonald, I.R. Chapter 3—Static properties of liquids: Thermodynamics and structure. In Theory of Simple Liquids, 3rd ed.; Hansen, J.-P., McDonald, I.R., Eds.; Academic Press: Burlington, VT, USA, 2006; pp. 46–77. [Google Scholar]
  56. Cohen, E.G.D. Fifty years of kinetic theory. Physica A 1993, 194, 229–257. [Google Scholar] [CrossRef]
  57. Yip, S. Renormalized kinetic-theory of dense fluids. Annu. Rev. Phys. Chem. 1979, 30, 547–577. [Google Scholar] [CrossRef]
  58. Kamgar-Parsi, B.; Cohen, E.G.; de Schepper, I.M. Dynamical processes in hard-sphere fluids. Phys. Rev. A 1987, 35, 4781–4795. [Google Scholar] [CrossRef] [PubMed]
  59. Rabinovich, V.A.; Vasserman, A.A.; Nedostup, V.I.; Veksler, L.S. Thermophysical Properties of Neon, Argon, Krypton, and Xenon; Hemisphere Pub. Corp.: Washington, DC, USA, 1987. [Google Scholar]
  60. Postol, T.A.; Pelizzari, C.A. Neutron-scattering study of thermally excited density fluctuations in a dense classical fluid. Phys. Rev. A 1978, 18, 2321–2336. [Google Scholar] [CrossRef]
  61. Ernst, M.H.; Haines, L.K.; Dorfman, J.R. Theory of transport coefficients for moderately dense gases. Rev. Mod. Phys. 1969, 41, 296–316. [Google Scholar] [CrossRef]
  62. Bafile, U.; Verkerk, P.; Barocchi, F.; de Graaf, L.A.; Suck, J.; Mutka, H. Onset of depature from linearized hydrodynamic behavior in argon gas studied with neutron brillouin scattering. Phys. Rev. Lett. 1990, 65, 2394–2397. [Google Scholar] [CrossRef] [PubMed]
  63. Balucani, U.; Zoppi, M. Dynamics of the Liquid State; Clarendon Press Oxford: Oxford, UK, 1994. [Google Scholar]
  64. Krisch, M.; Sette, F. Neutron and X-ray Spectroscopy; Springer Verlag: Berlin, Germany, 2007; pp. 317–370. [Google Scholar]
  65. Cunsolo, A.; Pratesi, G.; Ruocco, G.; Sampoli, M.; Sette, F.; Verbeni, R.; Barocchi, F.; Krisch, M.; Masciovecchio, C.; Nardone, M. Dynamics of dense supercritical neon at the transition from hydrodynamical to single-particle regimes. Phys. Rev. Lett. 1998, 80, 3515–3518. [Google Scholar] [CrossRef]
  66. Cunsolo, A.; Pratesi, G.; Rosica, F.; Ruocco, G.; Sampoli, M.; Sette, F.; Verbeni, R.; Barocchi, F.; Krisch, M.; Masciovecchio, C.; et al. Is there any evidence of a positive sound dispersion in the high frequency dynamics of noble gases? J. Phys. Chem. Sol. 2000, 61, 477–483. [Google Scholar] [CrossRef]
  67. Cunsolo, A. Relaxation phenomena in the THZ dynamics of simple fluids probed by inelastic X-ray scattering. PhD Thesis, Université J. Fourier, Grenoble, France, 1999. [Google Scholar]
  68. Verkerk, P.; van Well, A.A. Short wavelength sound dispersion in liquid argon close to solidification. Physica B + C 1986, 136, 168–171. [Google Scholar] [CrossRef]
  69. Cowley, R.A.; Woods, A.D.B. Neutron scattering from liquid helium at high energies. Phys. Rev. Lett. 1968, 21, 787–789. [Google Scholar] [CrossRef]
  70. Montfrooij, W.; de Graaf, L.A.; de Schepper, I.M. Propagating microscopic temperature-fluctuations in a dense helium fluid at 13.3-K. Phys. Rev. B 1992, 45, 3111–3114. [Google Scholar] [CrossRef]
  71. Van Well, A.A.; de Graaf, L.A. Density fluctuations in liquid neon studied by neutron scattering. Phys. Rev. A 1985, 32, 2396–2412. [Google Scholar] [CrossRef] [PubMed]
  72. Thermodynamic Data are from the Database. Available online: http://webbook.nist.gov/chemistry/form-ser.html (accessed on 1 September 2015).
  73. Pontecorvo, E.; Krisch, M.; Cunsolo, A.; Monaco, G.; Mermet, A.; Verbeni, R.; Sette, F.; Ruocco, G. High-frequency longitudinal and transverse dynamics in water. Phys. Rev. E 2005, 71, 011501. [Google Scholar] [CrossRef] [PubMed]
  74. Torre, R.; Bartolini, P.; Righini, R. Structural relaxation in supercooled water by time-resolved spectroscopy. Nature 2004, 428, 296–299. [Google Scholar] [CrossRef] [PubMed]
  75. Masciovecchio, C.; Santucci, S.C.; Gessini, A.; Di Fonzo, S.; Ruocco, G.; Sette, F. Structural relaxation in liquid water by inelastic UV scattering. Phys. Rev. Lett. 2004, 92, 255507. [Google Scholar] [CrossRef] [PubMed]
  76. Sampoli, M.; Ruocco, G.; Sette, F. Mixing of longitudinal and transverse dynamics in liquid water. Phys. Rev. Lett. 1997, 79, 1678–1681. [Google Scholar] [CrossRef]
  77. Cimatoribus, A.; Saccani, S.; Bencivenga, F.; Gessini, A.; Izzo, M.G.; Masciovecchio, C. The mixed longitudinal-transverse nature of collective modes in water. New J. Phys. 2010, 12, 053008. [Google Scholar] [CrossRef]
  78. Cunsolo, A.; Kodituwakku, C.N.; Bencivenga, F.; Frontzek, M.; Leu, B.M.; Said, A.H. Transverse dynamics of water across the melting point: A parallel neutron and X-ray inelastic scattering study. Phys. Rev. B 2012, 85. [Google Scholar] [CrossRef]
  79. Cunsolo, A.; Li, Y.; Kodituwakku, C.N.; Wang, S.; Antonangeli, D.; Bencivenga, F.; Battistoni, A.; Verbeni, R.; Tsutsui, S.; Baron, A.Q.; et al. Signature of a polyamorphic transition in the Thz spectrum of vitreous GEO2. Sci. Rep. 2015, 5, 14996. [Google Scholar] [CrossRef] [PubMed]
  80. Scopigno, T.; Pontecorvo, E.; Di Leonardo, R.; Krisch, M.; Monaco, G.; Ruocco, G.; Ruzicka, B.; Sette, F. High-frequency transverse dynamics in glasses. J. Phys. Condens. Matter. 2003, 15, S1269–S1278. [Google Scholar] [CrossRef]
  81. Hosokawa, S.; Inui, M.; Kajihara, Y.; Matsuda, K.; Ichitsubo, T.; Pilgrim, W.C.; Sinn, H.; Gonzalez, L.E.; Gonzalez, D.J.; Tsutsui, S.; et al. Transverse acoustic excitations in liquid Ga. Phys. Rev. Lett. 2009, 102, 105502. [Google Scholar] [CrossRef] [PubMed]
  82. Giordano, V.M.; Monaco, G. Inelastic X-ray scattering study of liquid Ga: Implications for the short-range order. Phys. Rev. B 2011, 84, 052201. [Google Scholar] [CrossRef]
  83. Hosokawa, S.; Inui, M.; Kajihara, Y.; Matsuda, K.; Ichitsubo, T.; Pilgrim, W.C.; Sinn, H.; Gonzalez, L.E.; Gonzalez, D.J.; Tsutsui, S.; et al. Transverse excitations in liquid Ga. Eur. Phys. J. 2011, 196, 85–93. [Google Scholar]
  84. Hosokawa, S.; Munejiri, S.; Inui, M.; Kajihara, Y.; Pilgrim, W.C.; Ohmasa, Y.; Tsutsui, S.; Baron, A.Q.; Shimojo, F.; Hoshino, K. Transverse excitations in liquid sn. J. Phys. Condens. Matter. 2013, 25, 112101. [Google Scholar] [CrossRef] [PubMed]
  85. Hosokawa, S.; Pilgrim, W.C.; Sinn, H.; Alp, E.E. The possibility of transverse excitation modes in liquid Ga. J. Phys. Condens. Matter. 2008, 20, 114107. [Google Scholar] [CrossRef] [PubMed]
  86. Paciaroni, A.; Orecchini, A.; Haertlein, M.; Moulin, M.; Conti Nibali, V.; De Francesco, A.; Petrillo, C.; Sacchetti, F. Vibrational collective dynamics of dry proteins in the terahertz region. J. Phys. Chem. B 2012, 116, 3861–3865. [Google Scholar] [CrossRef] [PubMed]
  87. Violini, N.; Orecchini, A.; Paciaroni, A.; Petrillo, C.; Sacchetti, F. Neutron scattering investigation of high-frequency dynamics in glassy glucose. Phys. Rev. B 2012, 85, 134204. [Google Scholar] [CrossRef]
  88. Li, M.D.; Chu, X.Q.; Fratini, E.; Baglioni, P.; Alatas, A.; Alp, E.E.; Chen, S.H. Phonon-like excitation in secondary and tertiary structure of hydrated protein powders. Soft Matter. 2011, 7, 9848–9853. [Google Scholar] [CrossRef]
  89. Cunsolo, A.; Kodituwakku, C.N.; Bencivenga, F.; Said, A.H. Shear propagation in the terahertz dynamics of water-glycerol mixtures. J. Chem. Phys. 2013, 139, 184507. [Google Scholar] [CrossRef] [PubMed]
  90. Balucani, U.; Brodholt, J.P.; Vallauri, R. Dynamical properties of liquid water. J. Phys. Condens. Matter. 1996, 8, 9269–9274. [Google Scholar] [CrossRef]
  91. Debye, P. Zur theorie der spezifischen wärmen. Ann. Phys. 1912, 344, 789–839. [Google Scholar] [CrossRef]
  92. Lovesey, S.W. Density fluctuations in classical monatomic liquids. J. Phys. C Solid State Phys. 1971, 4, 3057–3064. [Google Scholar] [CrossRef]
  93. Magazu, S.; Maisano, G.; Majolino, D.; Mallamace, F.; Migliardo, P.; Aliotta, F.; Vasi, C. Relaxation process in deeply supercooled water by mandelstam-brillouin scattering. J. Phys. Chem. 1989, 93, 942–947. [Google Scholar] [CrossRef]
  94. Maisano, G.; Migliardo, P.; Aliotta, F.; Vasi, C.; Wanderlingh, F.; Darrigo, G. Evidence of anomalous acoustic behavior from brillouin-scattering in supercooled water. Phys. Rev. Lett. 1984, 52, 1025–1028. [Google Scholar] [CrossRef]
  95. Cunsolo, A.; Nardone, M. Velocity dispersion and viscous relaxation in supercooled water. J. Chem. Phys. 1996, 105, 3911–3917. [Google Scholar] [CrossRef]
  96. Franks, F. Water: A Comprehensive Treatise; Plenum: New York, NY, USA, 1972; Volume 1. [Google Scholar]
  97. Coester, F. Principle of detailed balance. Phys. Rev. 1951, 84, 1259. [Google Scholar] [CrossRef]
  98. Verbeni, R.; Cunsolo, A.; Pratesi, G.; Monaco, G.; Rosica, F.; Masciovecchio, C.; Nardone, M.; Ruocco, G.; Sette, F.; Albergamo, F. Quantum effects in the dynamics of he probed by inelastic X-ray scattering. Phys. Rev. E 2001, 64, 021203. [Google Scholar] [CrossRef] [PubMed]
  99. Monaco, G.; Cunsolo, A.; Pratesi, G.; Sette, F.; Verbeni, R. Deep inelastic atomic scattering of X-rays in liquid neon. Phys. Rev. Lett. 2002, 88, 227401. [Google Scholar] [CrossRef] [PubMed]
  100. Cunsolo, A.; Monaco, G.; Nardone, M.; Pratesi, G.; Verbeni, R. Transition from the collective to the single-particle regimes in a quantum fluid. Phys. Rev. B 2003, 67, 024507. [Google Scholar] [CrossRef]
  101. Rabani, E.; Reichman, D.R. A self-consistent mode-coupling theory for dynamical correlations in quantum liquids: Rigorous formulation. J. Chem. Phys. 2002, 116, 6271–6278. [Google Scholar] [CrossRef]
  102. Gotze, W.; Mayr, M.R. Evolution of vibrational excitations in glassy systems. Phys. Rev. E 2000, 61, 587–606. [Google Scholar] [CrossRef]
  103. De Schepper, I.M.; Cohen, E.G.; Bruin, C.; van Rijs, J.C.; Montfrooij, W.; de Graaf, L.A. Hydrodynamic time correlation functions for a lennard-jones fluid. Phys. Rev. A 1988, 38, 271–287. [Google Scholar] [CrossRef] [PubMed]
  104. Gorelli, F.; Santoro, M.; Scopigno, T.; Krisch, M.; Ruocco, G. Liquidlike behavior of supercritical fluids. Phys. Rev. Lett. 2006, 97, 245702. [Google Scholar] [CrossRef] [PubMed]
  105. Simeoni, G.G.; Bryk, T.; Gorelli, F.A.; Krisch, M.; Ruocco, G.; Santoro, M.; Scopigno, T. The widom line as the crossover between liquid-like and gas-like behaviour in supercritical fluids. Nat. Phys. 2010, 6, 503–507. [Google Scholar] [CrossRef]
  106. Widom, B. Phase Transitions and Critical Phenomena; Domb, C.G., Ed.; Academic Press: Waltham, MA, USA, 1972; Volume 2. [Google Scholar]
  107. Zemansky, Y. Heat and Thermodynamics : An Intermediate Textbook, 7th ed.; McGraw-Hill: New York, NY, USA, 1937. [Google Scholar]
  108. Bolmatov, D.; Zhernenkov, M.; Zavyalov, D.; Stoupin, S.; Cai, Y.Q.; Cunsolo, A. Revealing the mechanism of the viscous-to-elastic crossover in liquids. J. Phys. Chem. Lett. 2015, 6, 3048–3053. [Google Scholar] [CrossRef] [PubMed]
  109. Brazhkin, V.V.; Fomin, Y.D.; Lyapin, A.G.; Ryzhov, V.N.; Tsiok, E.N.; Trachenko, K. “Liquid-gas” transition in the supercritical region: Fundamental changes in the particle dynamics. Phys. Rev. Lett. 2013, 111, 145901. [Google Scholar] [CrossRef] [PubMed]
  110. Frenkel, J. Kinetic Theory of Liquids; Oxford University Press: Oxford, UK, 1947. [Google Scholar]
  111. Brazhkin, V.V.; Fomin, Y.D.; Lyapin, A.G.; Ryzhov, V.N.; Trachenko, K. Two liquid states of matter: A dynamic line on a phase diagram. Phys. Rev. E 2012, 85, 031203. [Google Scholar] [CrossRef] [PubMed]
  112. Bolmatov, D.; Musaev, E.T.; Trachenko, K. Symmetry breaking gives rise to energy spectra of three states of matter. Sci. Rep. 2013, 3, 2794. [Google Scholar] [CrossRef] [PubMed]
  113. Bolmatov, D.; Brazhkin, V.V.; Trachenko, K. The phonon theory of liquid thermodynamics. Sci. Rep. 2012, 2, 421. [Google Scholar] [CrossRef] [PubMed]
  114. Bolmatov, D.; Zavyalov, D.; Zhernenkov, M.; Musaev, E.T.; Cai, Y.Q. Unified phonon-based approach to the thermodynamics of solid, liquid and gas states. Ann. Phys. 2015, 363, 221–242. [Google Scholar] [CrossRef]
  115. Bolmatov, D.; Brazhkin, V.V.; Trachenko, K. Thermodynamic behaviour of supercritical matter. Nat. Commun. 2013, 4, 2331. [Google Scholar] [CrossRef] [PubMed]
  116. Bolmatov, D.; Zhernenkov, M.; Zav’yalov, D.; Stoupin, S.; Cunsolo, A.; Cai, Y.Q. Thermally triggered phononic gaps in liquids at thz scale. Sci. Rep. 2016, 6, 19469. [Google Scholar] [CrossRef] [PubMed]
  117. Shvyd’ko, Y. X-ray Optics—High-Energy-Resolution Applications, Optical Science; Springer: Berlin, Germany; New York, NY, USA, 2004; Volume 98. [Google Scholar]
  118. Shvyd’ko, Y.; Stoupin, S.; Shu, D.; Collins, S.P.; Mundboth, K.; Sutter, J.; Tolkiehn, M. High-contrast sub-millivolt inelastic X-ray scattering for nano- and mesoscale science. Nat. Commun. 2014, 5, 4219. [Google Scholar] [CrossRef] [PubMed]
  119. Cai, Y.Q.; Coburn, D.S.; Cunsolo, A.; Keister, J.W.; Honnicke, M.G.; Huang, X.R.; Kodituwakku, C.N.; Stetsko, Y.; Suvorov, A.; Hiraoka, N.; et al. The ultrahigh resolution ixs beamline of nsls-II: Recent advances and scientific opportunities. J. Phys. Conf. Ser. 2013, 425, 202001. [Google Scholar] [CrossRef]
Figure 1. Typical shape of the Rayleigh-Brillouin triplet measured by Brillouin light scattering. The separate contributions to the total shape are represented by line of different color, as indicated in the legend.
Applsci 06 00064 g001
Figure 2. The Rayleigh Brillouin spectrum of Ar measured along the coexistence line by Brillouin light scattering. The data are redrawn with permission from [27], copyrighted by the American Physical Society. The hydrodynamic spectrum reconstructed using tabulated thermophysical properties of the sample and bulk viscosity measurements [28] are reported for comparison as a black line.
Applsci 06 00064 g002
Figure 3. Spectral lineshapes of neon measured by inelastic neutron scattering INS in neon at the low exchanged momenta indicated in the plot, the red line through data roughly connects the tops of inelastic peaks. Data are redrawn with permission from [40].
Applsci 06 00064 g003
Figure 4. The sound dispersion curves measured in Ar at increasing pressure [47] and normalized to the respective sound velocities, as derived from thermodynamic data [59]. The arrow indicates the presence of a propagation gap, i.e., of a Q region where the sound frequency vanishes. The solid line represents the hydrodynamic limiting dispersion expectedly joined by all curves in the Q = 0 limit. The dashed curves are the low Q prediction of the Mode Coupling Theory as derived for the curves of corresponding color.
Applsci 06 00064 g004
Figure 5. Two representative INS spectral lineshapes of Ar measured by Bafile et al. [62] at low exchanged momenta.
Applsci 06 00064 g005
Figure 6. Relevant shape parameters of the S(Q,ω) of supercritical Ne and Ar as measured, at the indicated thermodynamic conditions, in [40,62], respectively. The reported solid and dashed lines are the hydrodynamic predictions referring to symbols of corresponding color as derived from the lowest Q expansion in Equation (3a–c).
Applsci 06 00064 g006
Figure 7. Upper panels: low Q inelastic X-ray scattering IXS spectra measured on deeply supercritical neon (T =295 K, n = 29.1 atoms/nm3). The raw data (open circles) are compared with corresponding resolution functions (dashed lines). Lower panels: corresponding MD spectra computed on a Lennard Jones model representative of the same sample (blue lines). Middle panels: Comparison between IXS spectra (open circles) and the corresponding molecular dynamics (MD) ones convoluted with the resolution functions (red lines). Data are redrawn with permission from [65], which is copyrighted bt the American Physical Society.
Applsci 06 00064 g007
Figure 8. The relevant transport parameters deduced from the fits of of IXS spectra of deeply supercritical neon [67] and those of MD spectra from a Lennard Jones model representative of the same sample [65]. The shadowed area roughly locates the transition from the extended hydrodynamics and the mesoscopic regime. Horizontal dashed lines represent the macroscopic (hydrodynamic) values deduced from thermodynamic [59] and US spectroscopy data [28].
Applsci 06 00064 g008
Figure 9. Left column: shift (panel a) and half width (panel c) of the inelastic peak in the spectrum of supercritical Ne at T = 294 K and n = 29 atoms/nm3 as derived from a best fit line-shape with Equation (2). Red and black dots are IXS and MD data from [65] and [67] respectively. Data from [65] are redrawn with permission from the original publication, under the copyright of the American Physical Society. The solid lines represent the corresponding simplified hydrodynamic prediction in Equation (3a–c) In which literature values of thermodynamic properties [72] and bulk viscosity [28] coefficients were inserted. Right column: the corresponding quantities are reported for liquid neon at T = 35 K and n = 36.65 atoms/nm3. These data are adapted with permission from [71] , which is copyrighted by the American Physical Society.
Applsci 06 00064 g009
Figure 10. The acoustic frequency Ωl derived from the maxima of current spectra (magenta dots) are reported against the zero (black dots) and infinite frequency (blue dots) limiting dispersions extracted from best fits the IXS spectra of neon. Fits were obtained with a single exponential viscoelastic model for the memory function decay (Equations (12)). The linear hydrodynamic sound dispersion (see Equations (3a)) is also reported for reference as derived using tabulated values of the adiabatic sound speed [71]. Data are adapted with permission from [6] copyrighted by American Physical Society.
Applsci 06 00064 g010
Figure 11. Lower panel: the generalized specific heat ratio as derived from MD computations for Lennard Jones models simulating deeply supercritical neon ([66], red dots). The unit value is reported as a dashed line for reference. Lower panel: the thermal diffusivity, as derived from MD simulations in [66], while using the simplified hydrodynamic expression in Equations (3c). In all plots horizontal dashed line indicate the macroscopic values (from National Institute of Standards and Technology NIST database [72] of the symbols having corresponding color.
Applsci 06 00064 g011
Figure 12. The Q-dependence of reduced relaxation time Ψ = ταc as obtained from Ne data at the thermodynamic conditions indicated in the plot. Data are adapted with permission from [6] copyrighted by American Physical Society. The horizontal line marks the unit value characteristic of the collisional regime.
Applsci 06 00064 g012
Figure 13. Longitudinal viscosity data derived using Equation (15) either from IXS measurements [13], on normal water (line + squares symbols), or from joint IXS and INS measurements [78] on heavy water (line + open squares). Data are redrawn with permission from [13] and [78] copyrighted by the American Physical Society. The temperatures are indicated in the plot. Neon data correspond to the same thermodynamic conditions and symbols as in Figure 4 and are redrawn with permission from [6] copyrighted by American Physical Society.
Applsci 06 00064 g013
Figure 14. The dispersion curve of deeply supercritical Ar at P = 1 GPa, as evaluated from the maxima position of MD simulated longitudinal (red dots) and transverse current spectra (open circles). The corresponding hydrodynamic dispersion is also reported as a dashed line for comparison. Adapted with permission from [108]. Copyright (2016) of American Chemical Society.
Applsci 06 00064 g014

