
Atmospheric Pressure Plasma Surface Treatment of Rayon Flock Synthetic Leather with Tetramethylsilane

Abstract
:
1. Introduction
2. Experimental Section
2.1. Materials
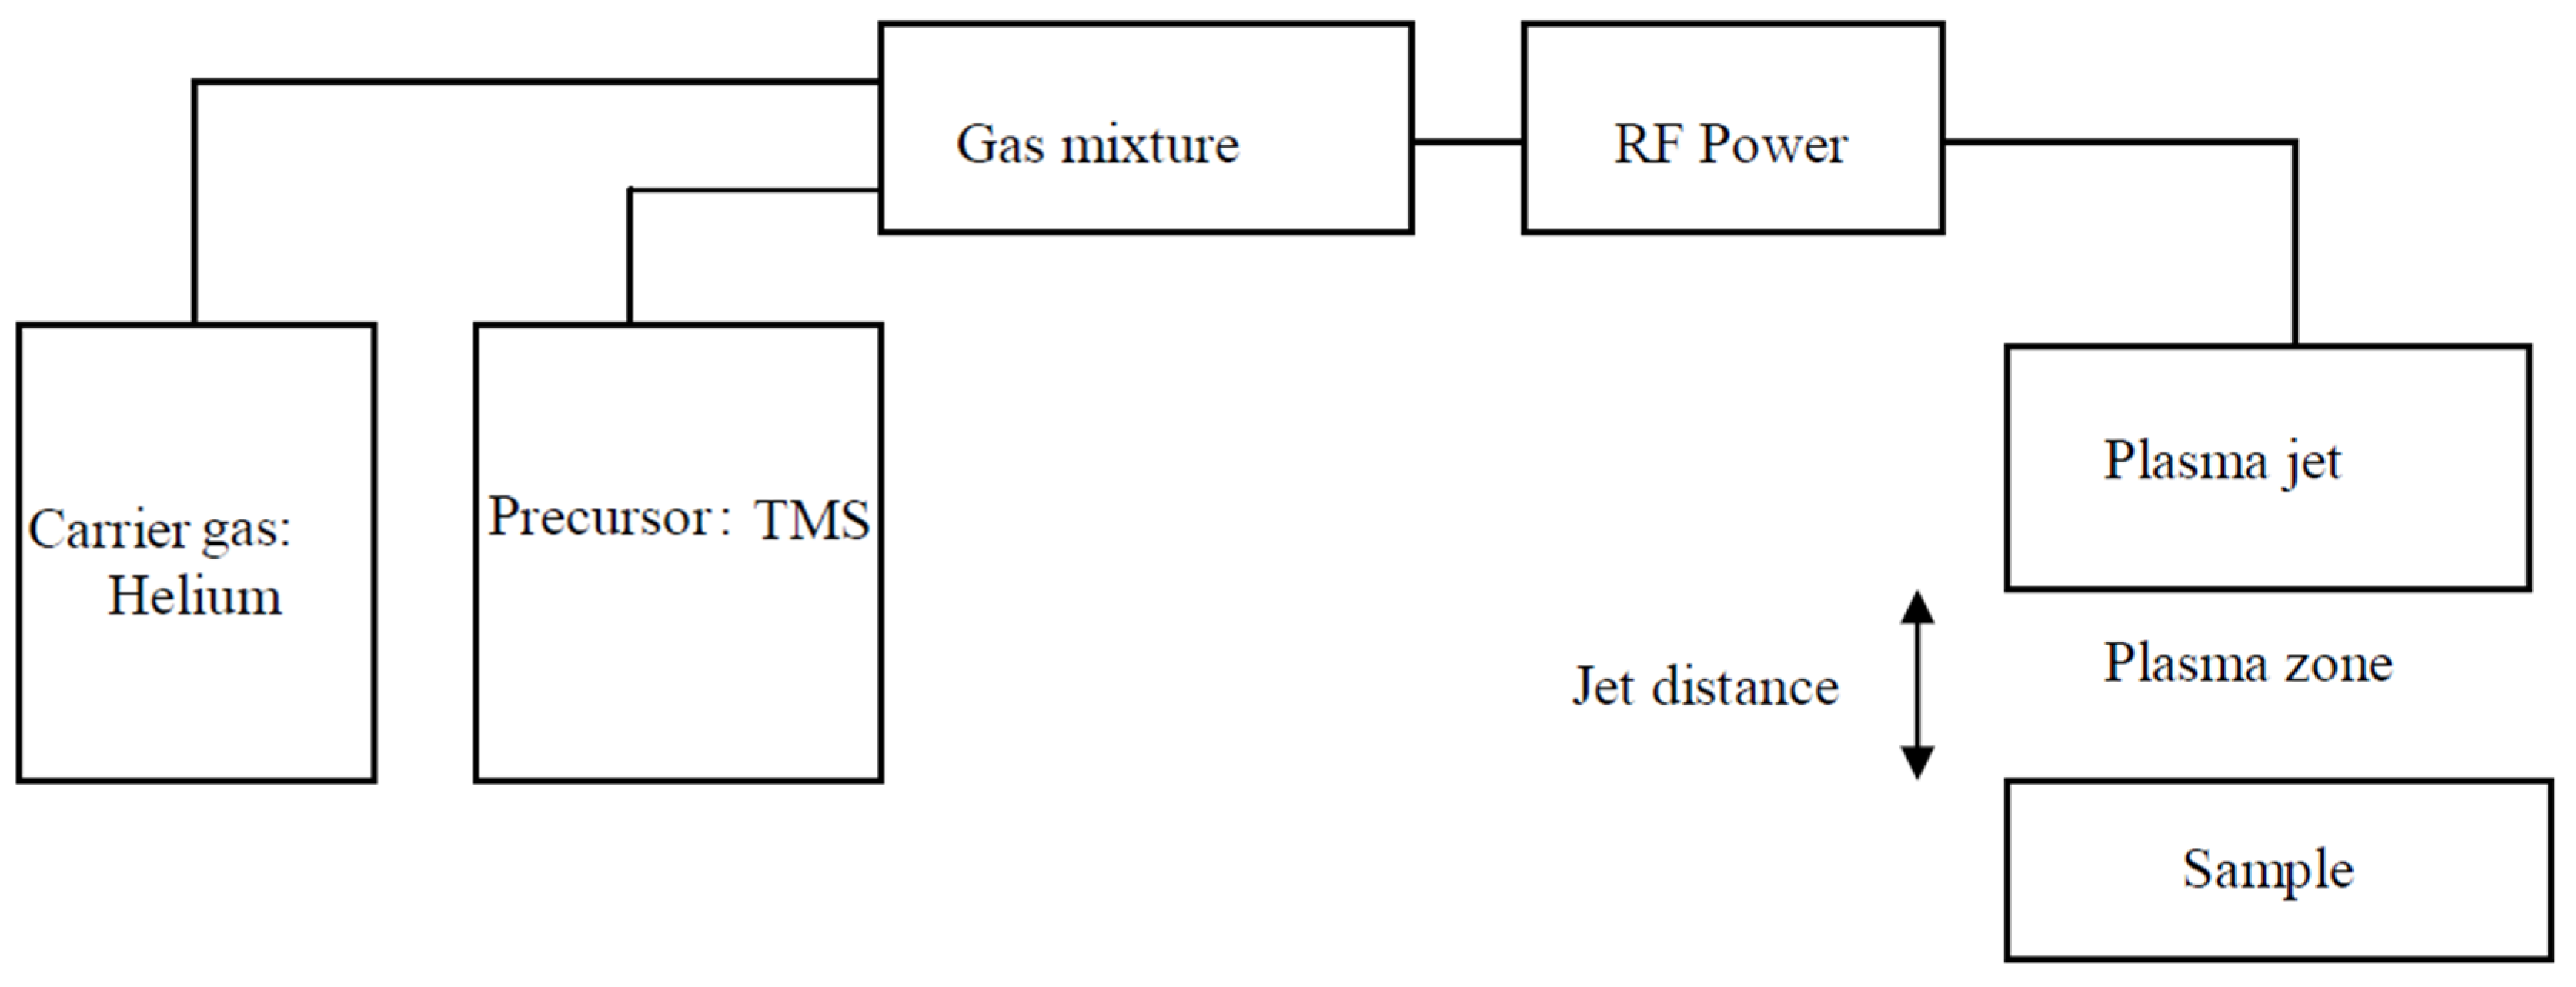
2.2. Atmospheric Pressure Plasma (APP) Treatment
2.3. Contact Angle and Surface Energy
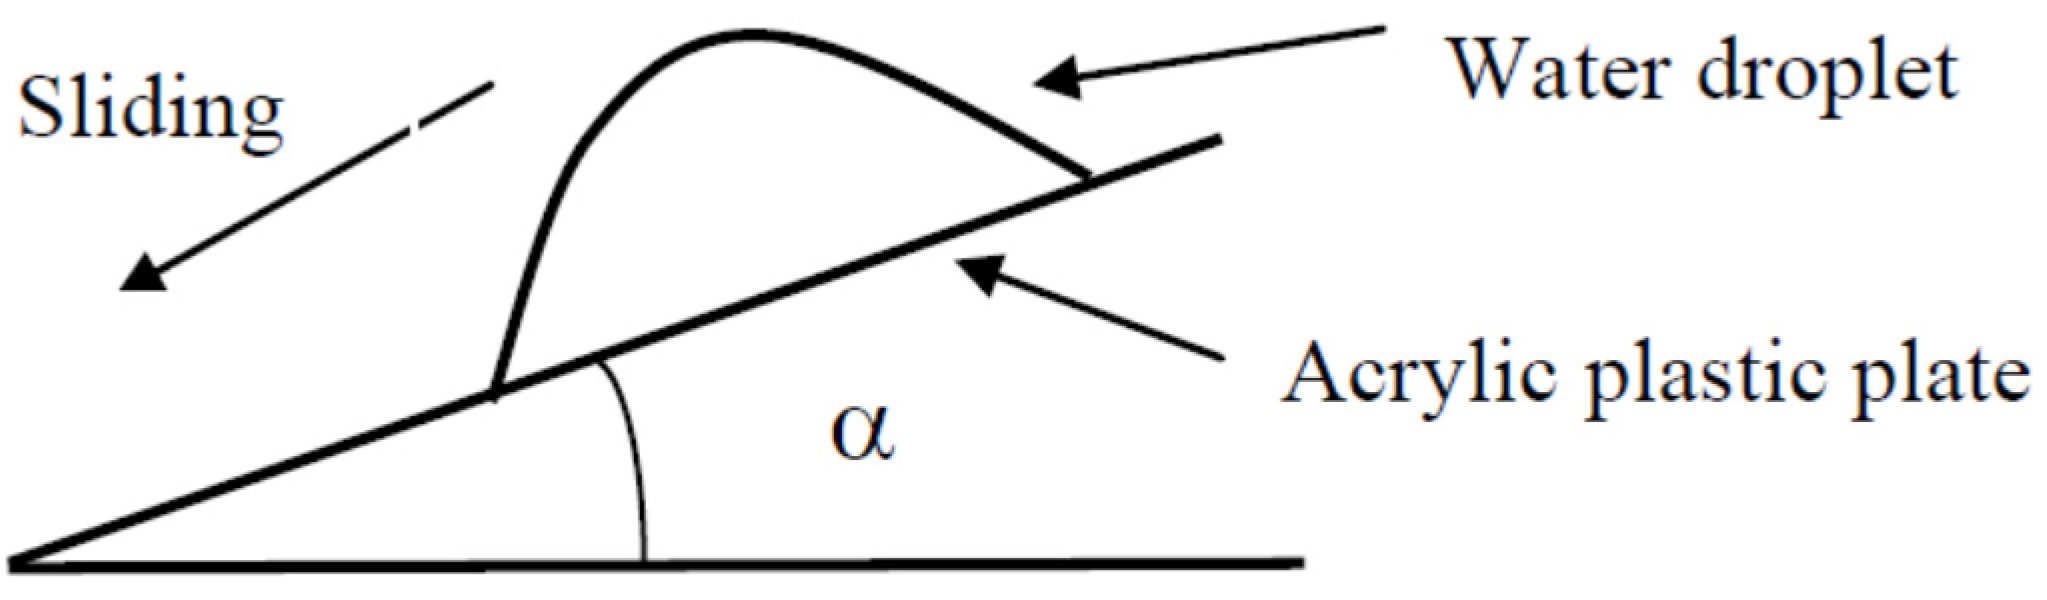
2.4. Sliding Angle Measurement
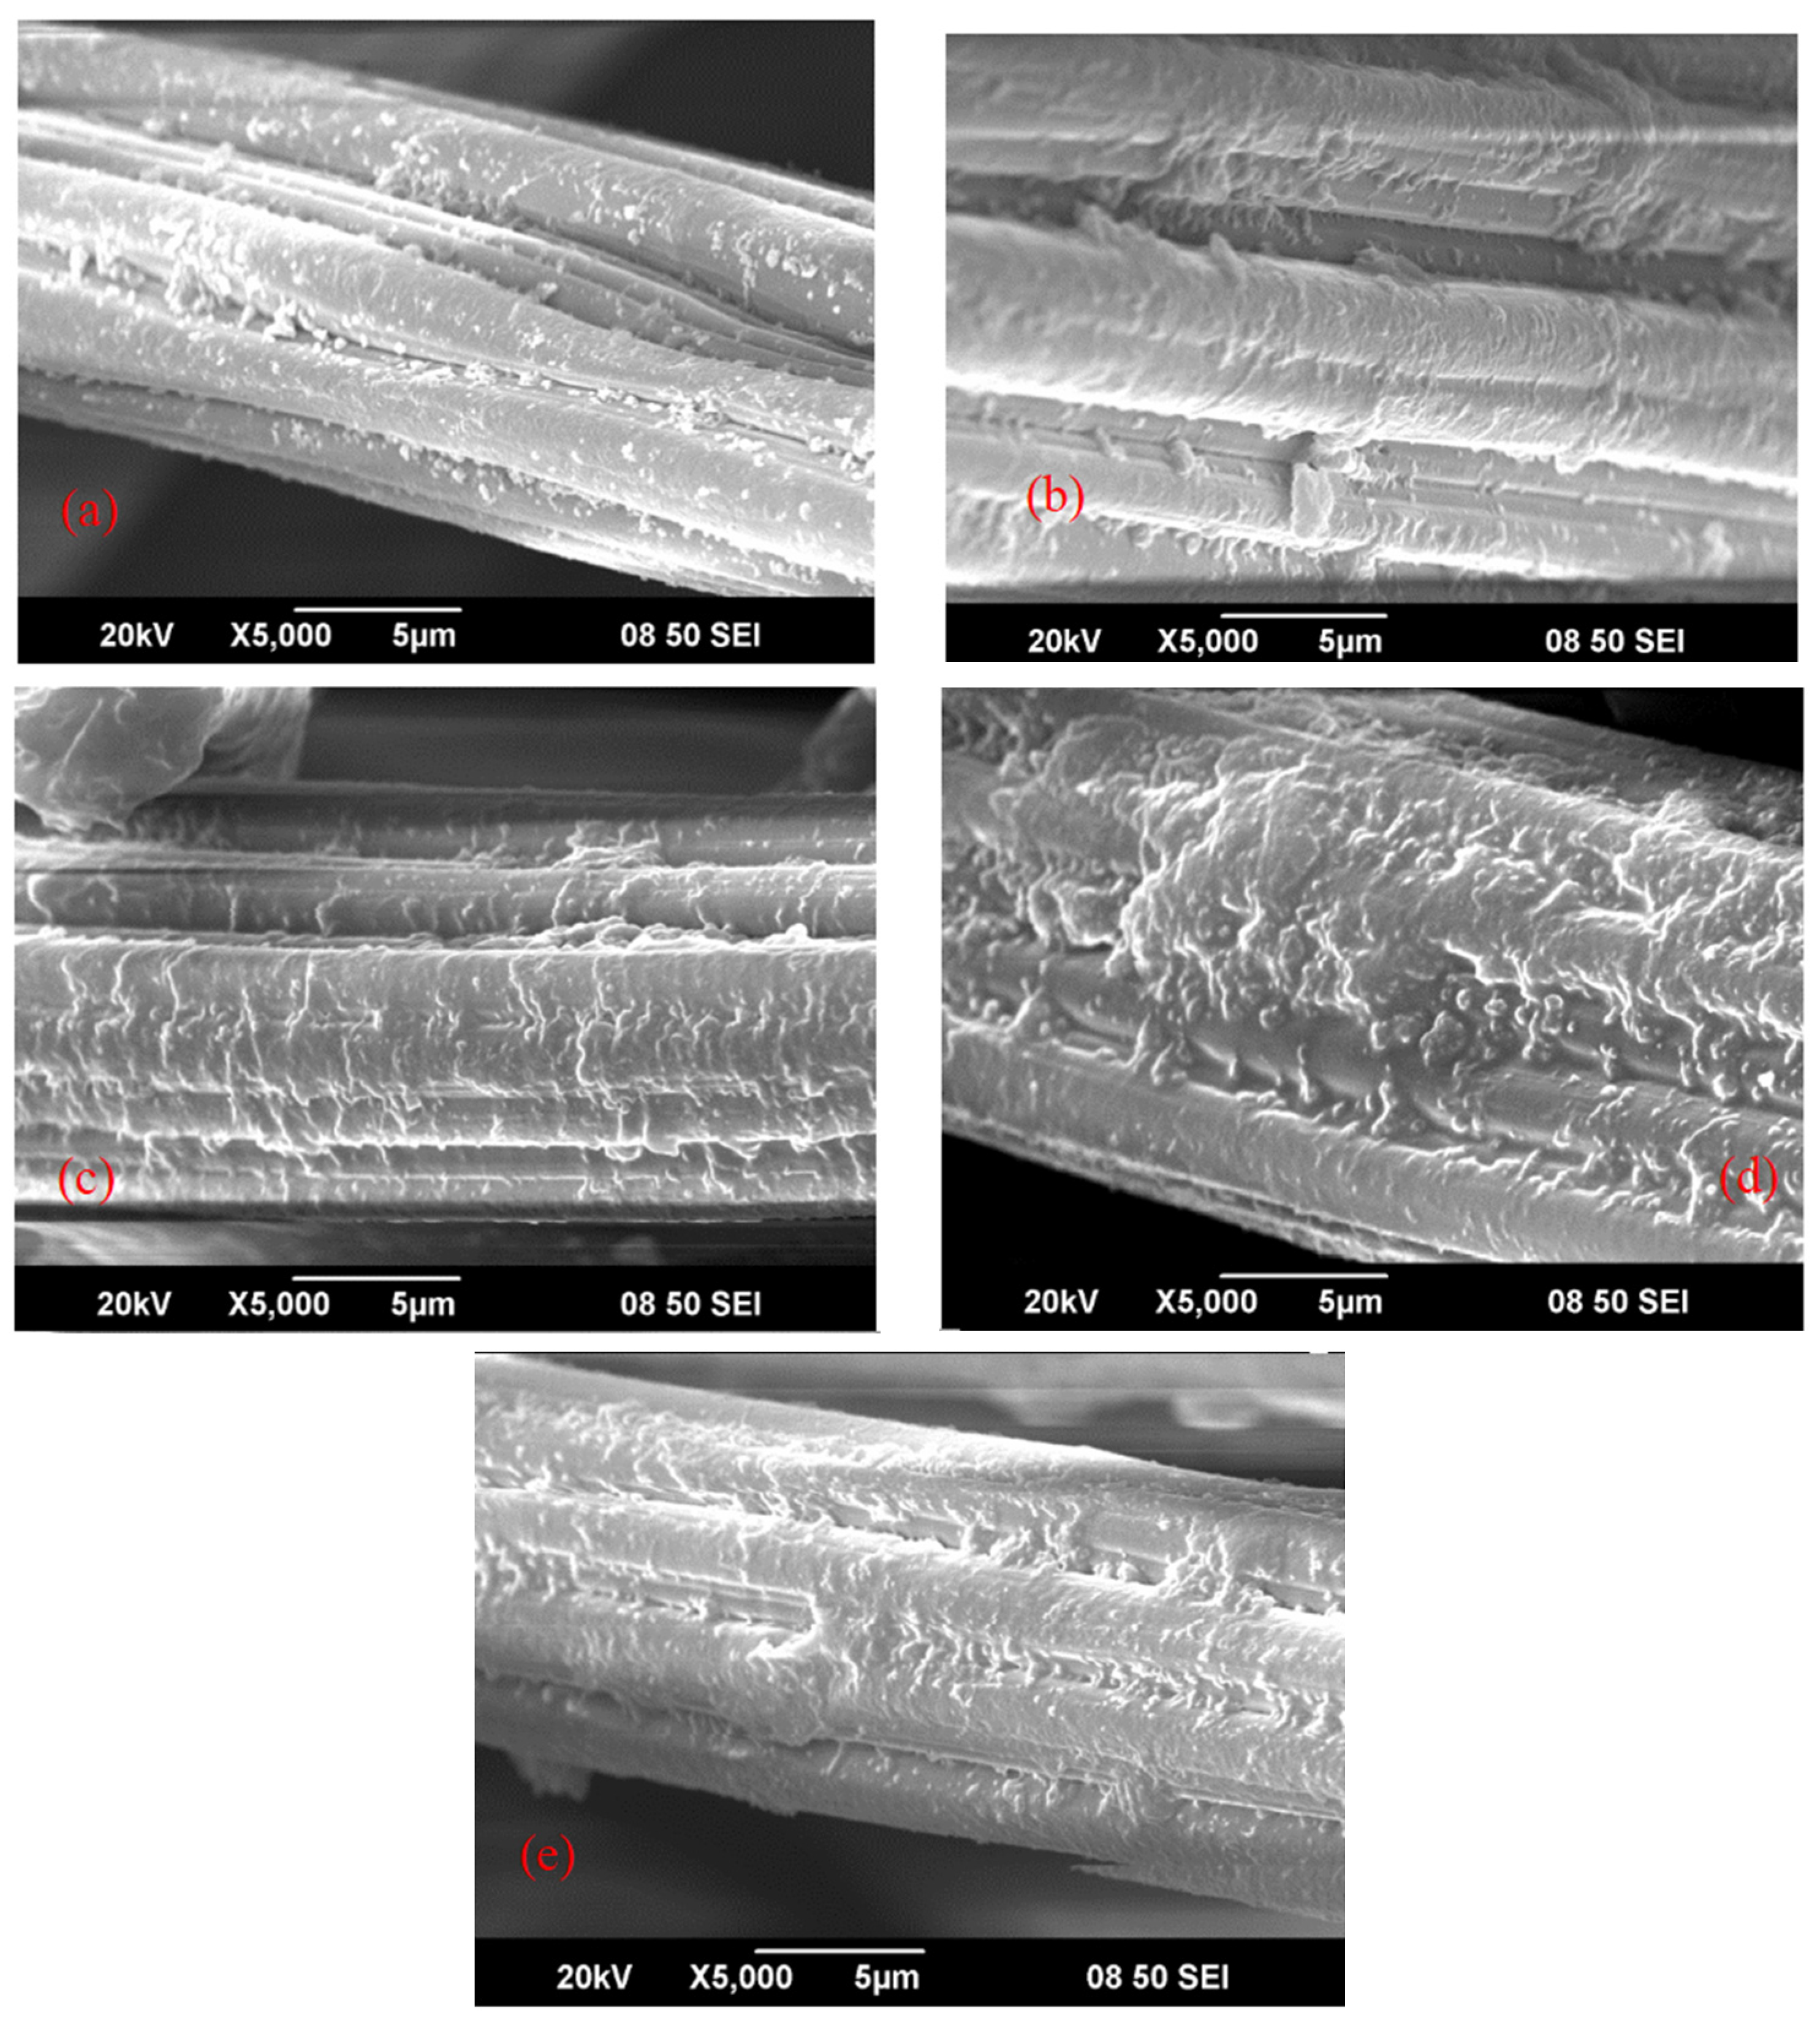
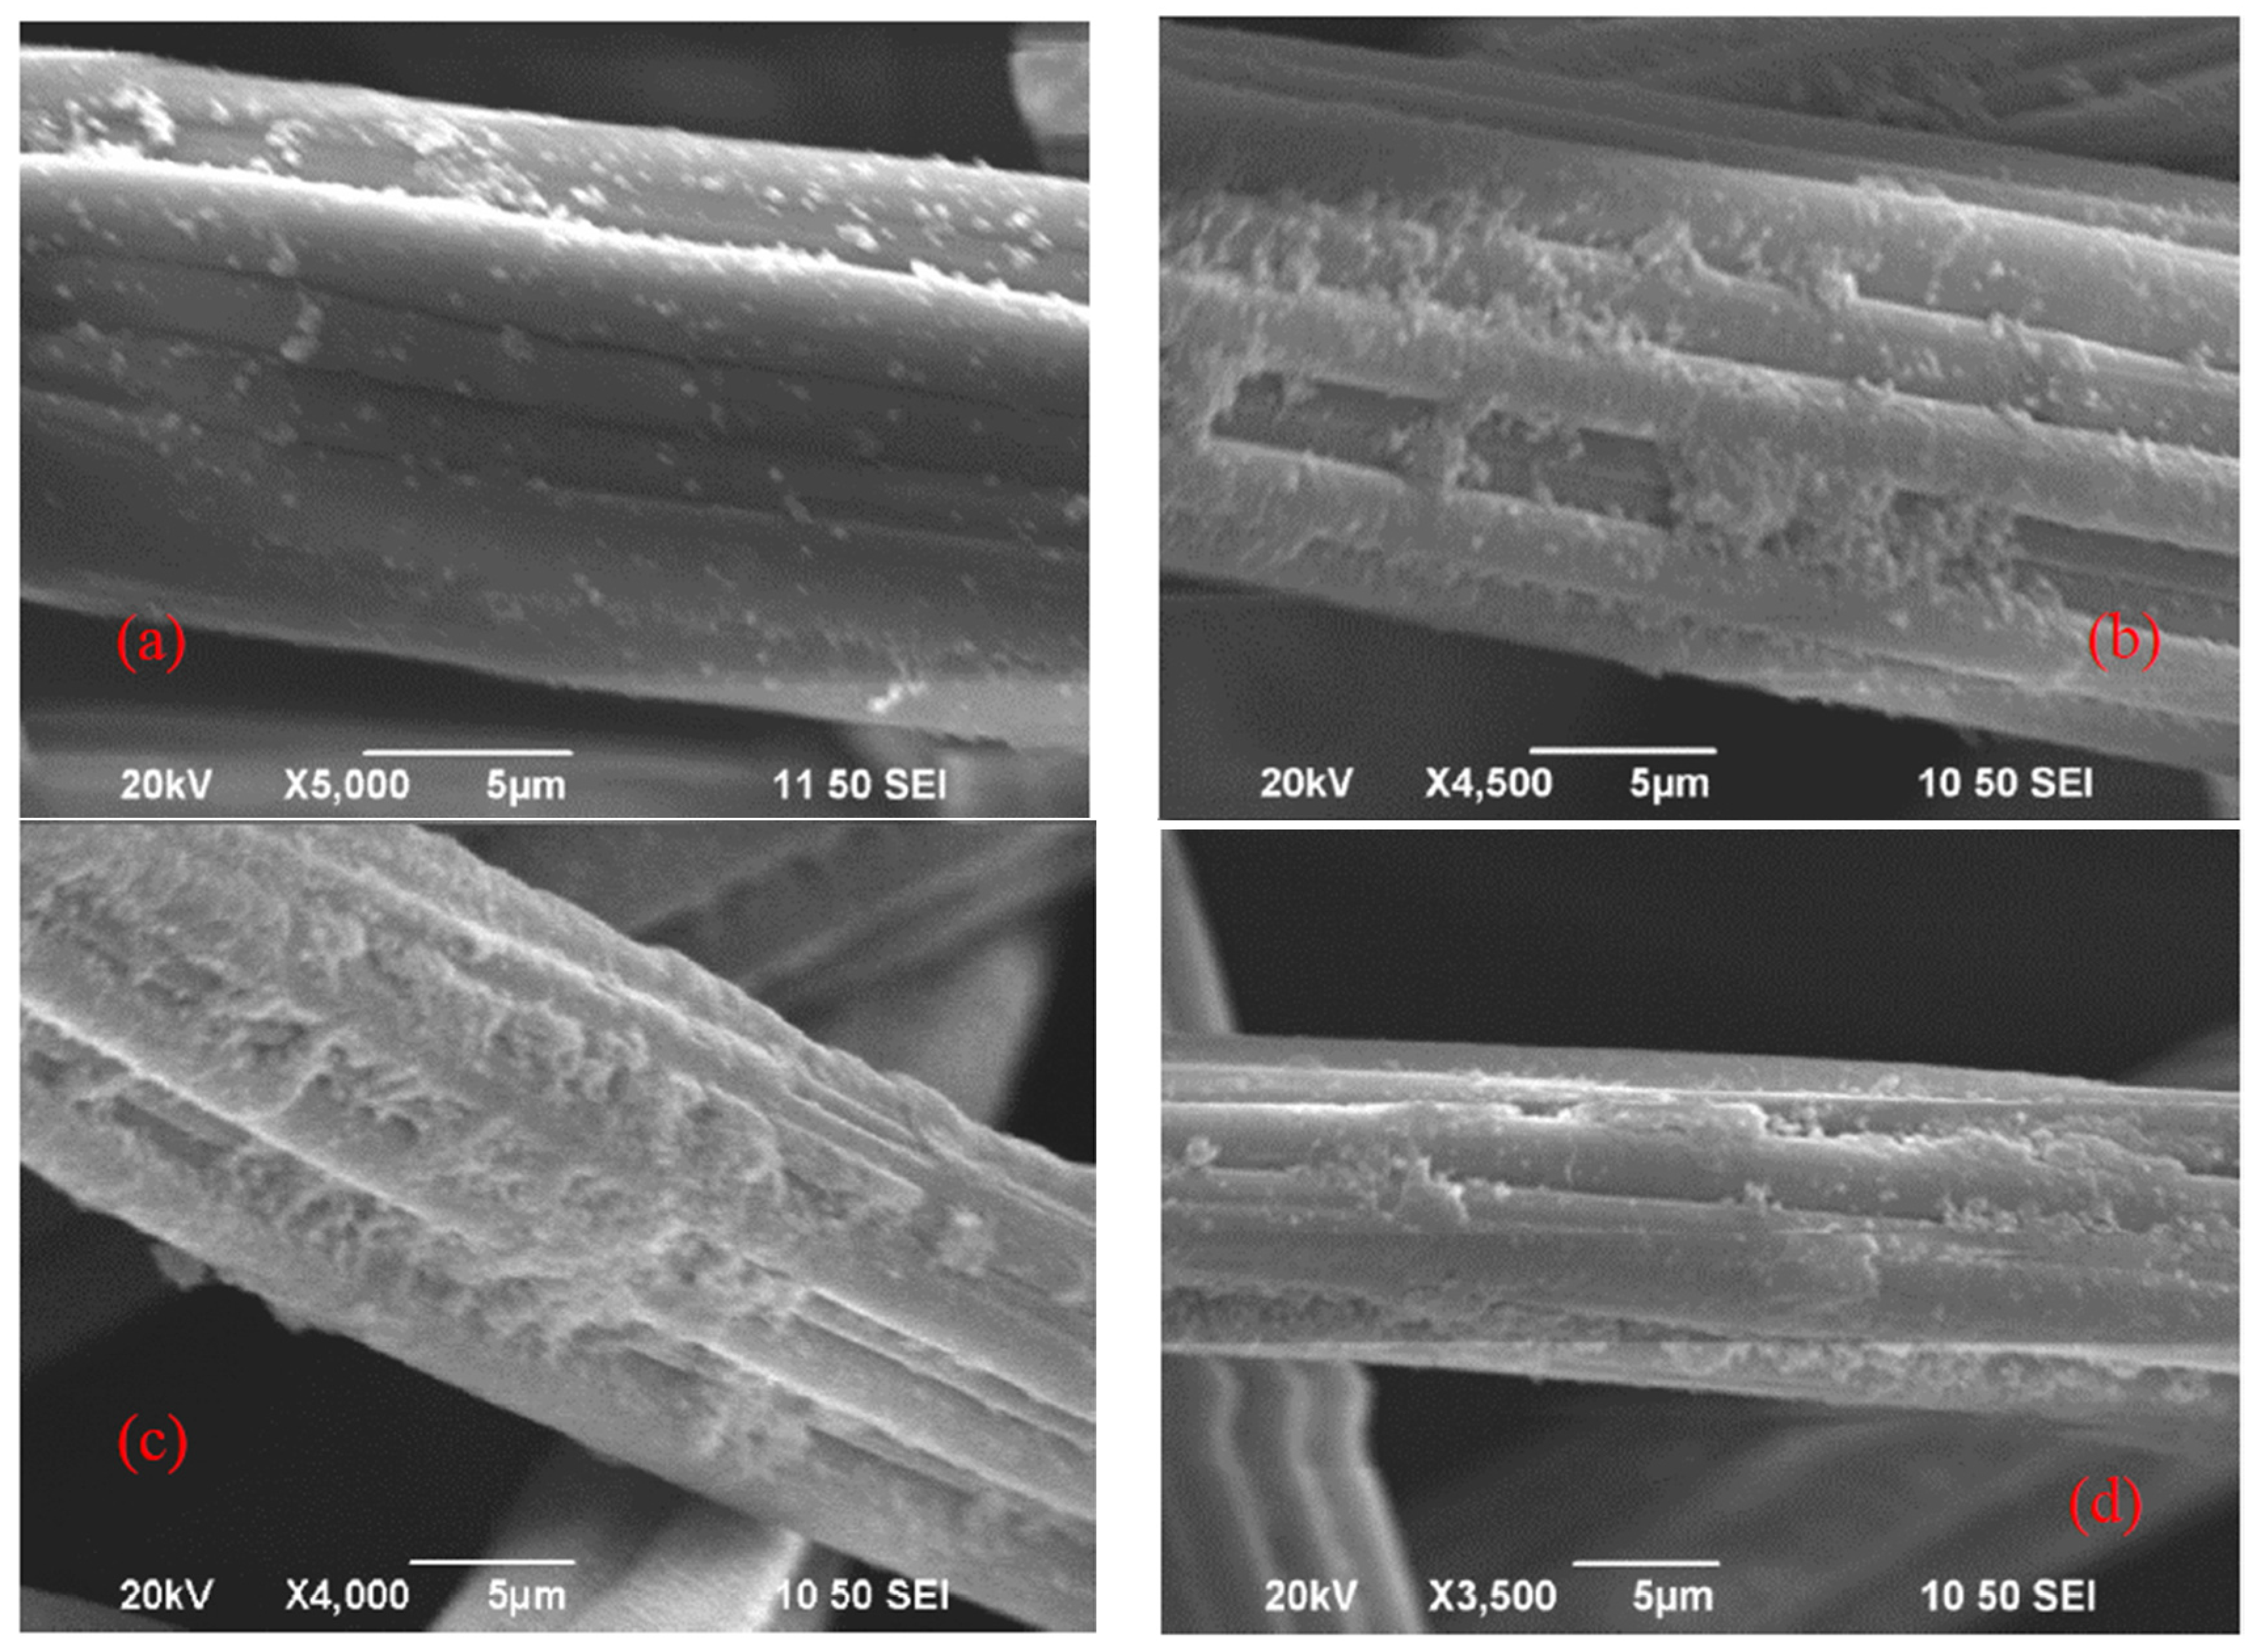
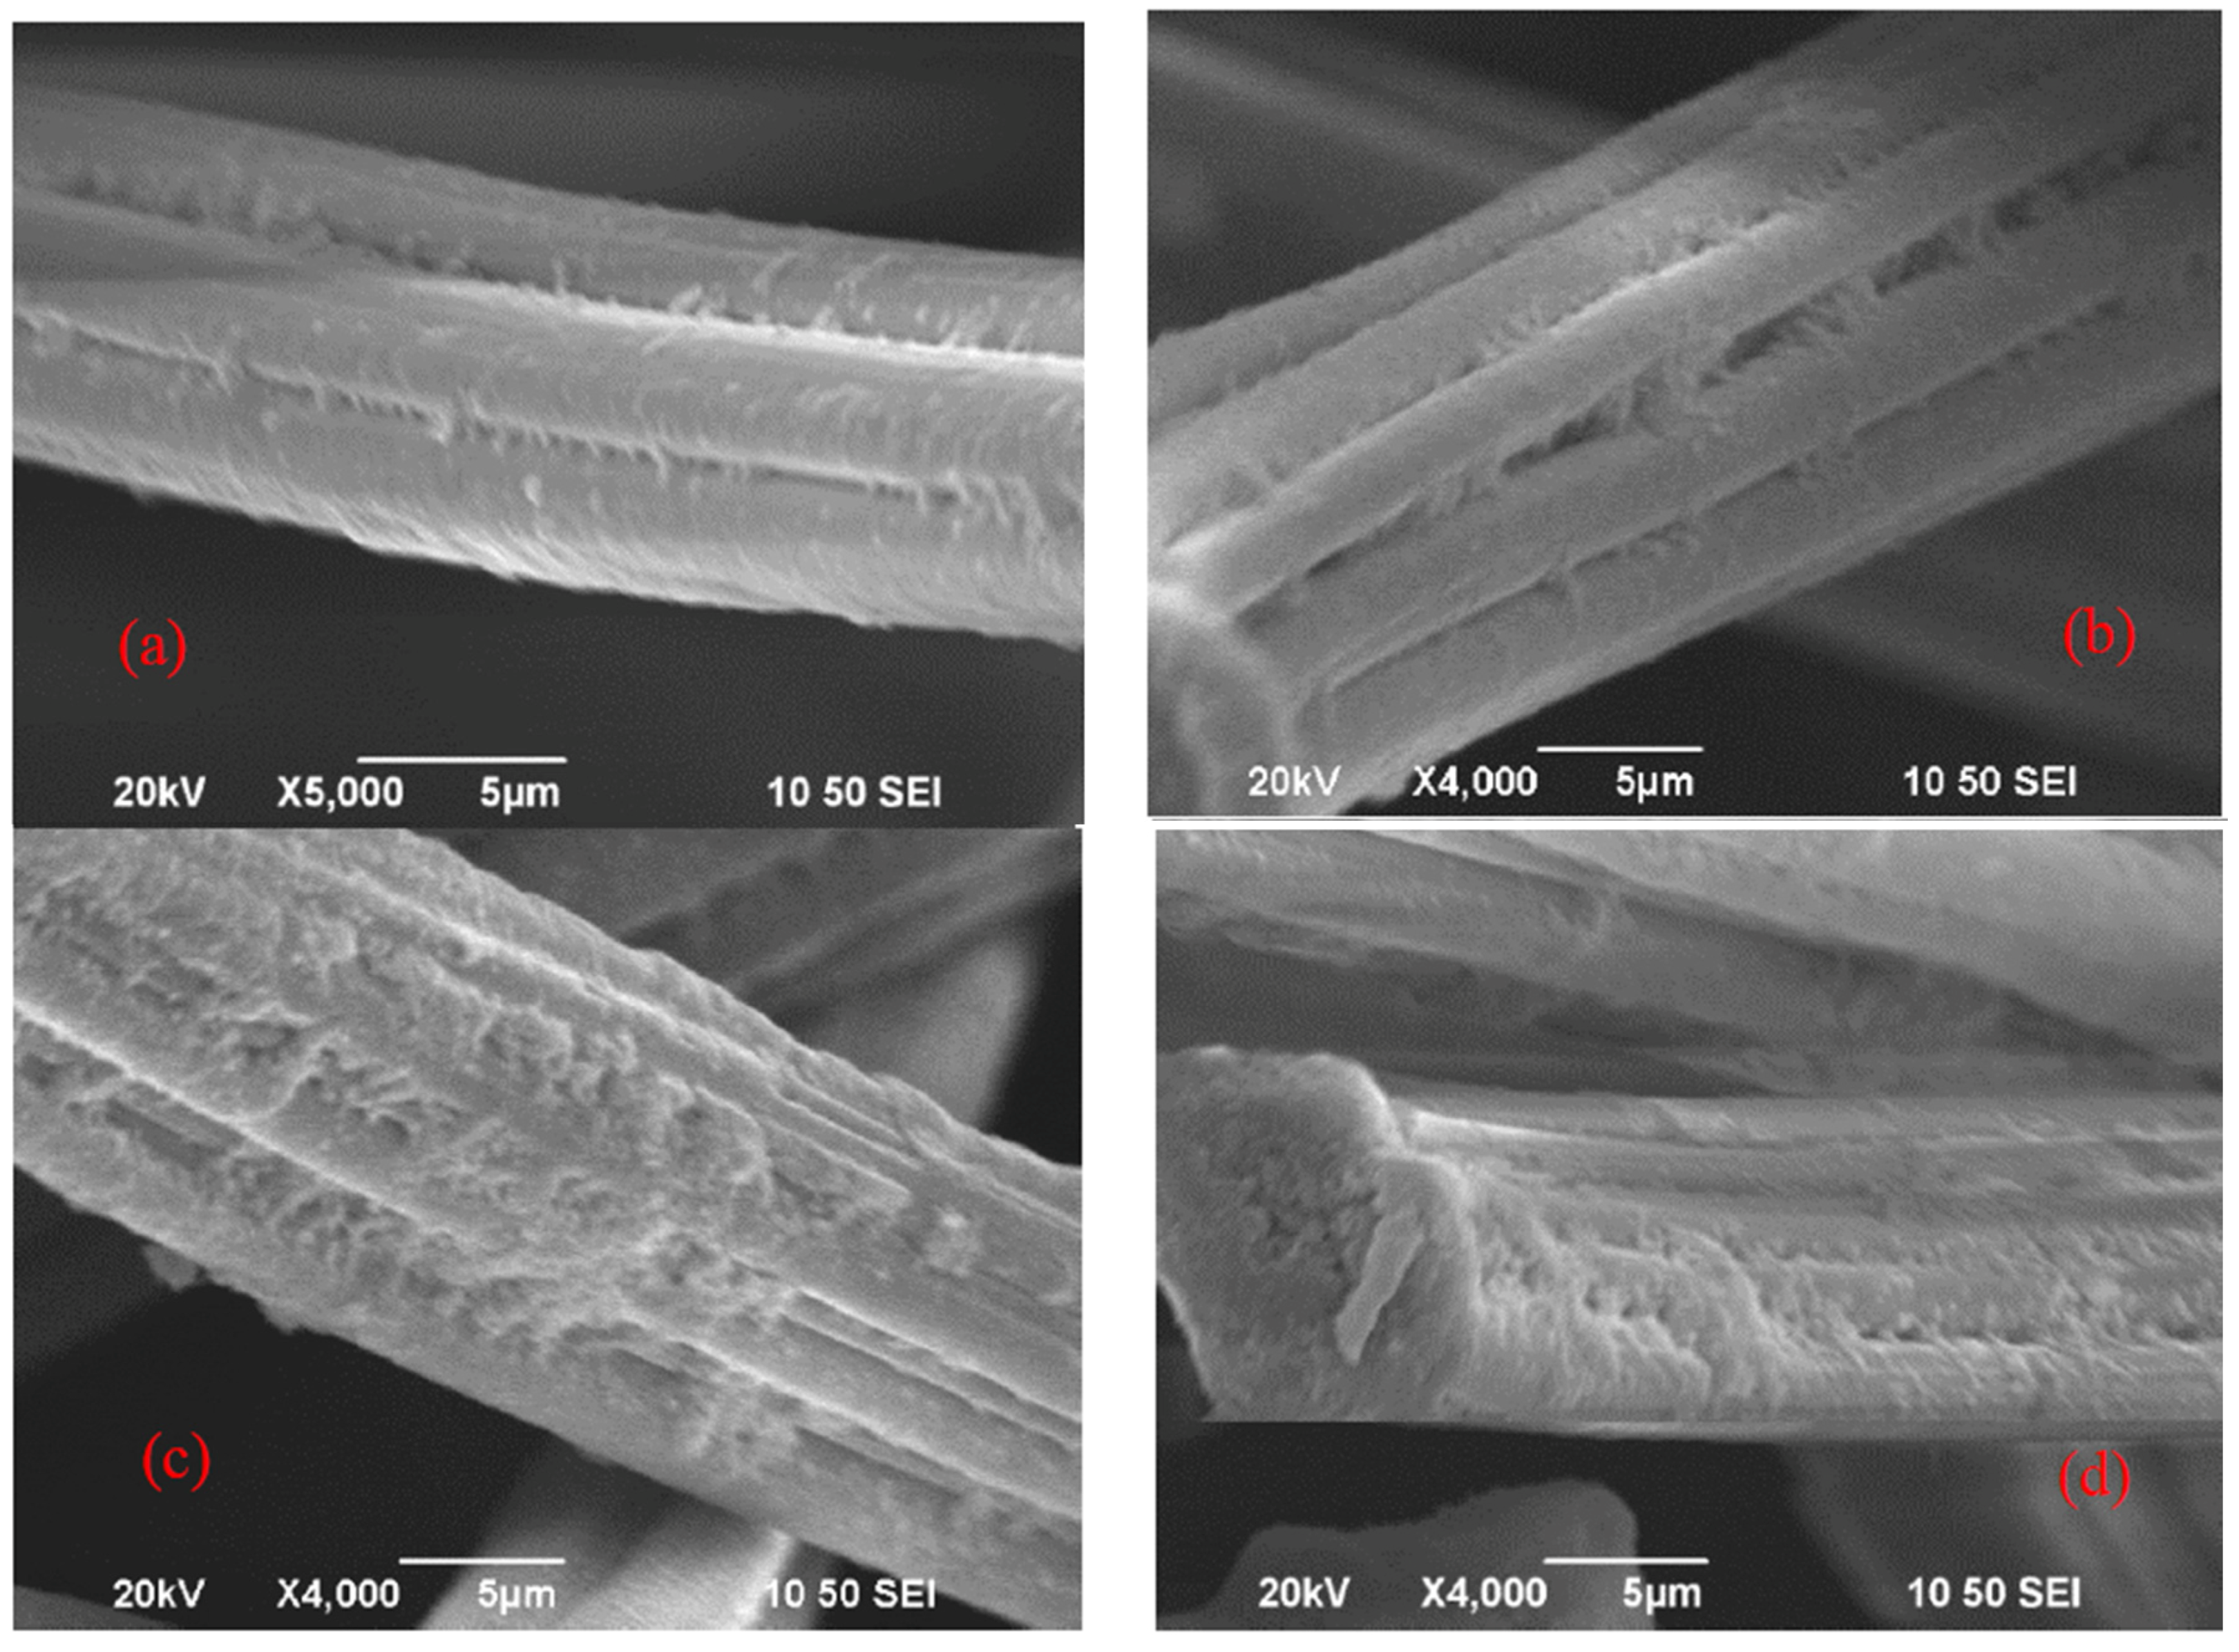
2.5. Scanning Electron Microscopy (SEM)
2.6. Fourier Transform Infrared Spectroscopy (FTIR-ATR)
2.7. X-Ray Photoelectron Spectroscopy (XPS)
2.8. Multiple Linear Regression Model
3. Results and Discussion
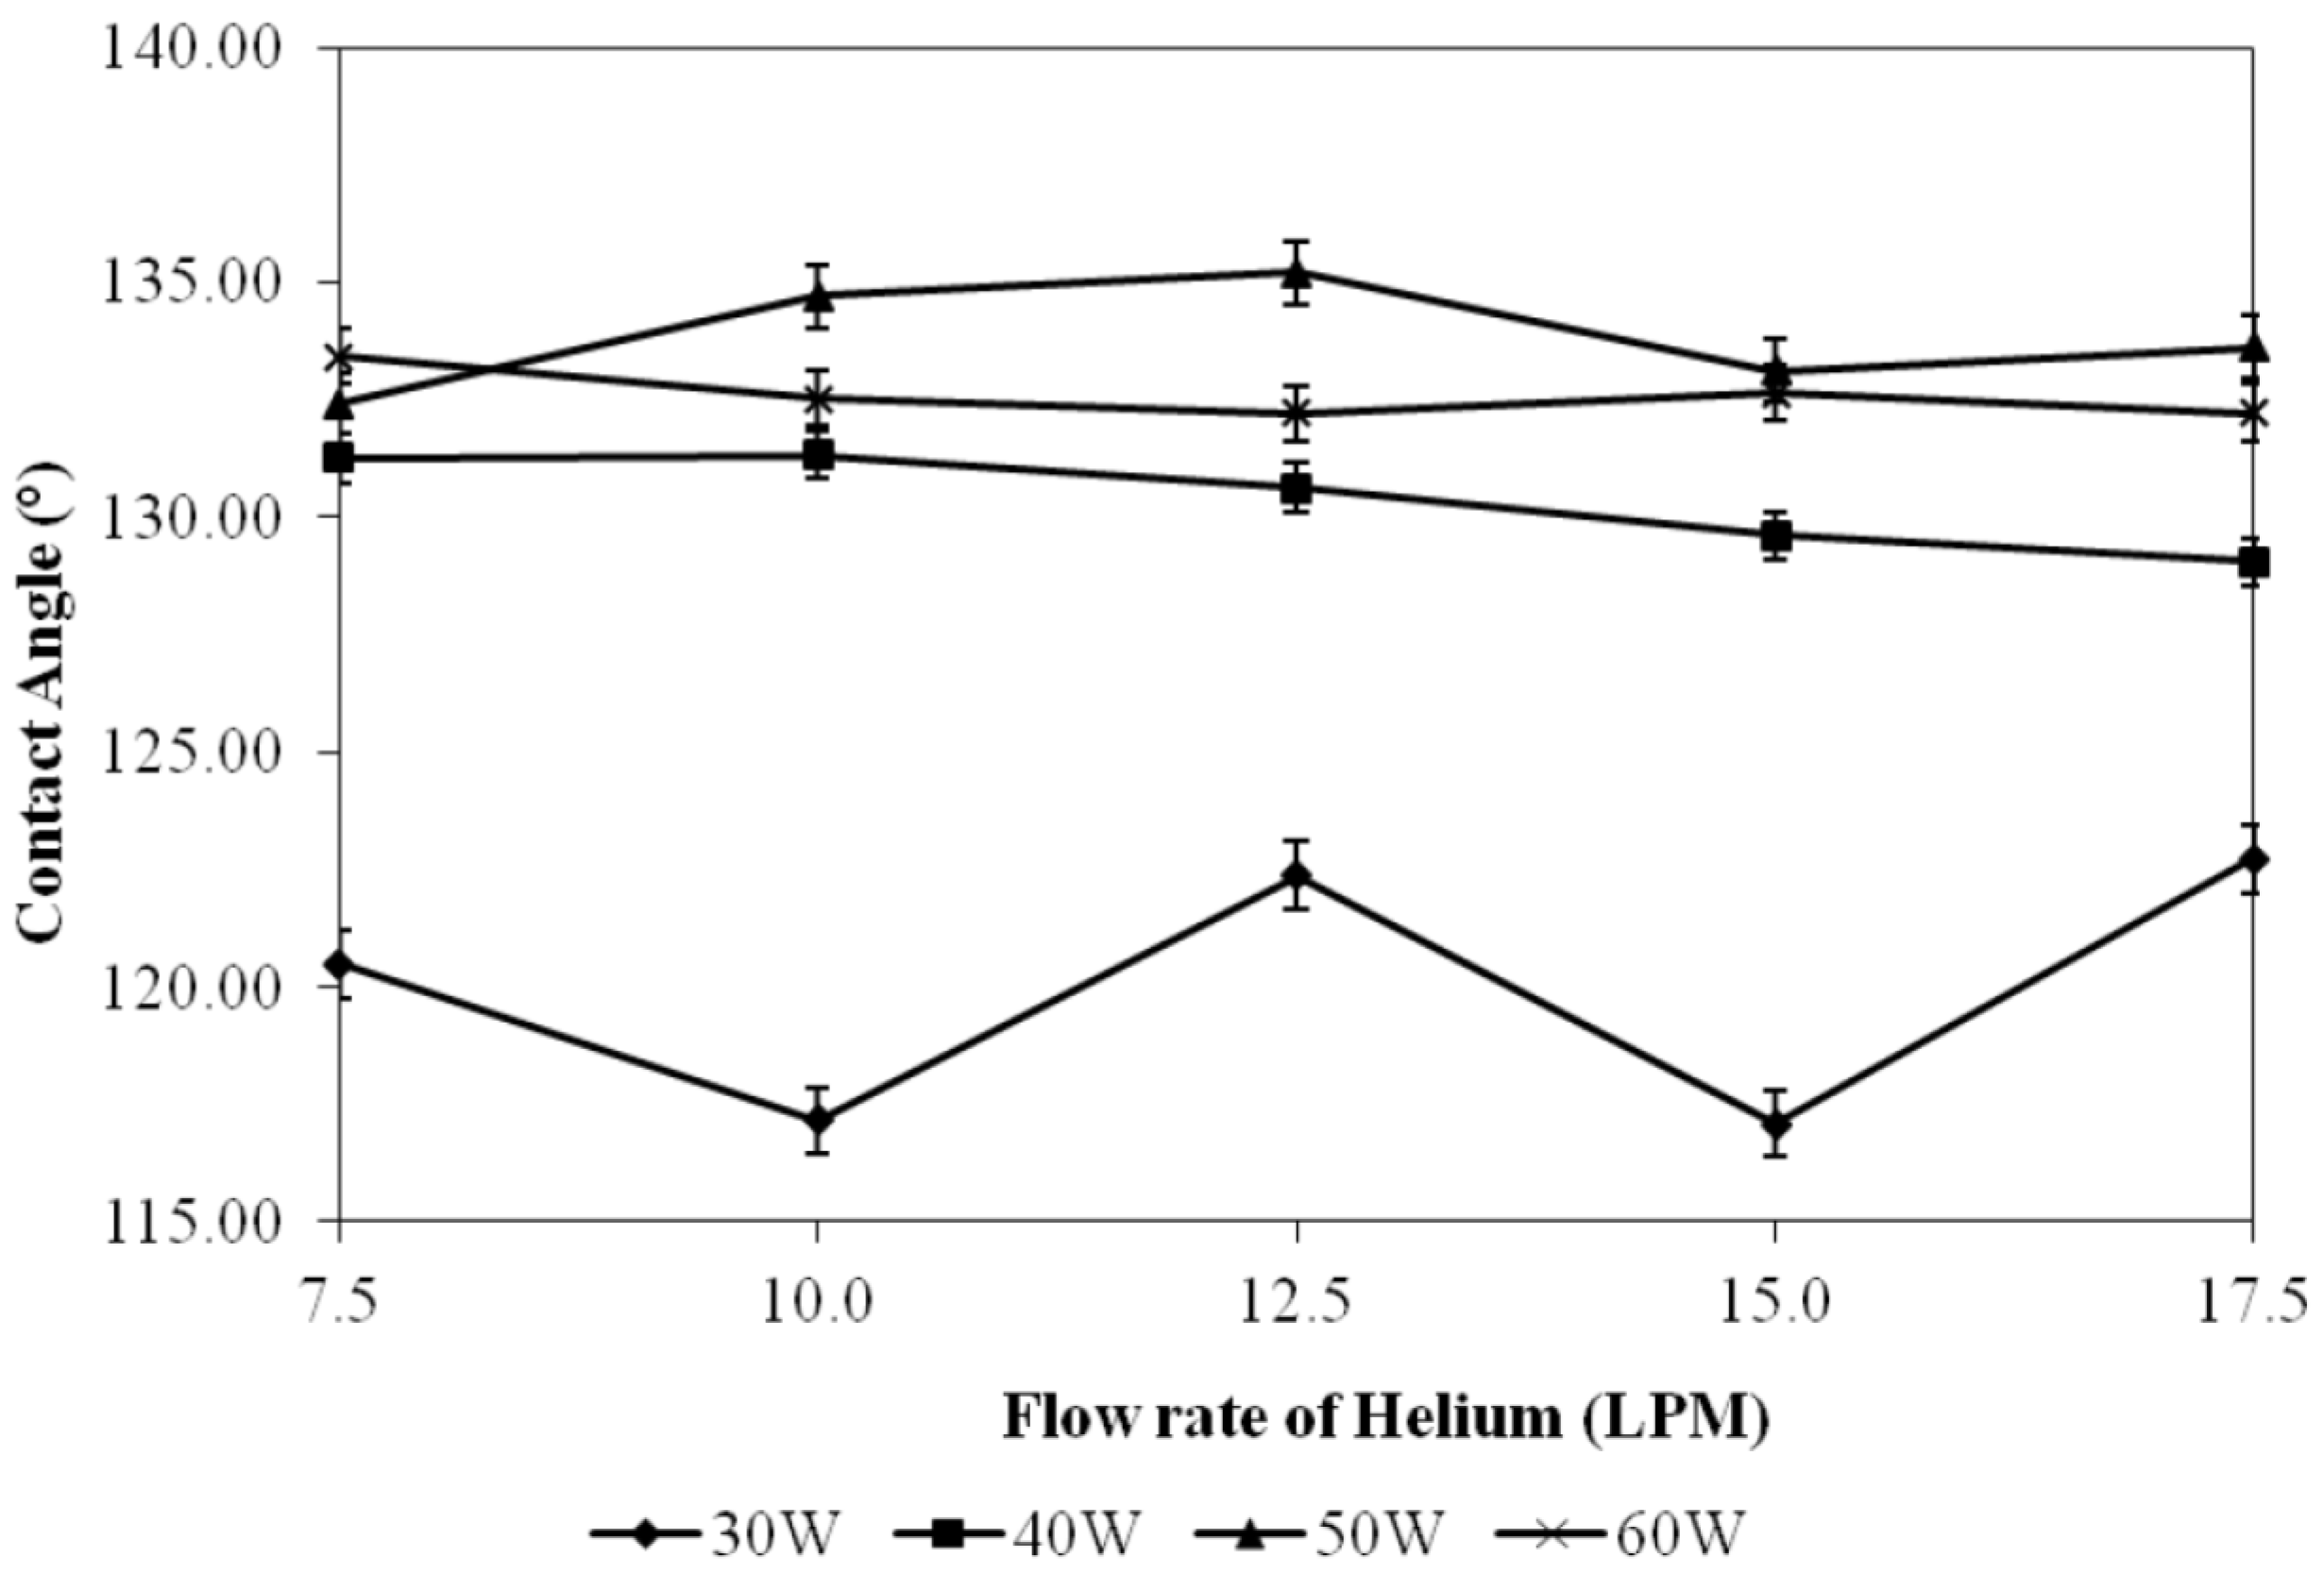
3.1. Effects of Discharge Power and Flow Rate of Helium
3.2. Effect of Treatment Time
3.3. Effect of Amount of TMS
3.4. Optimum Treatment Parameters
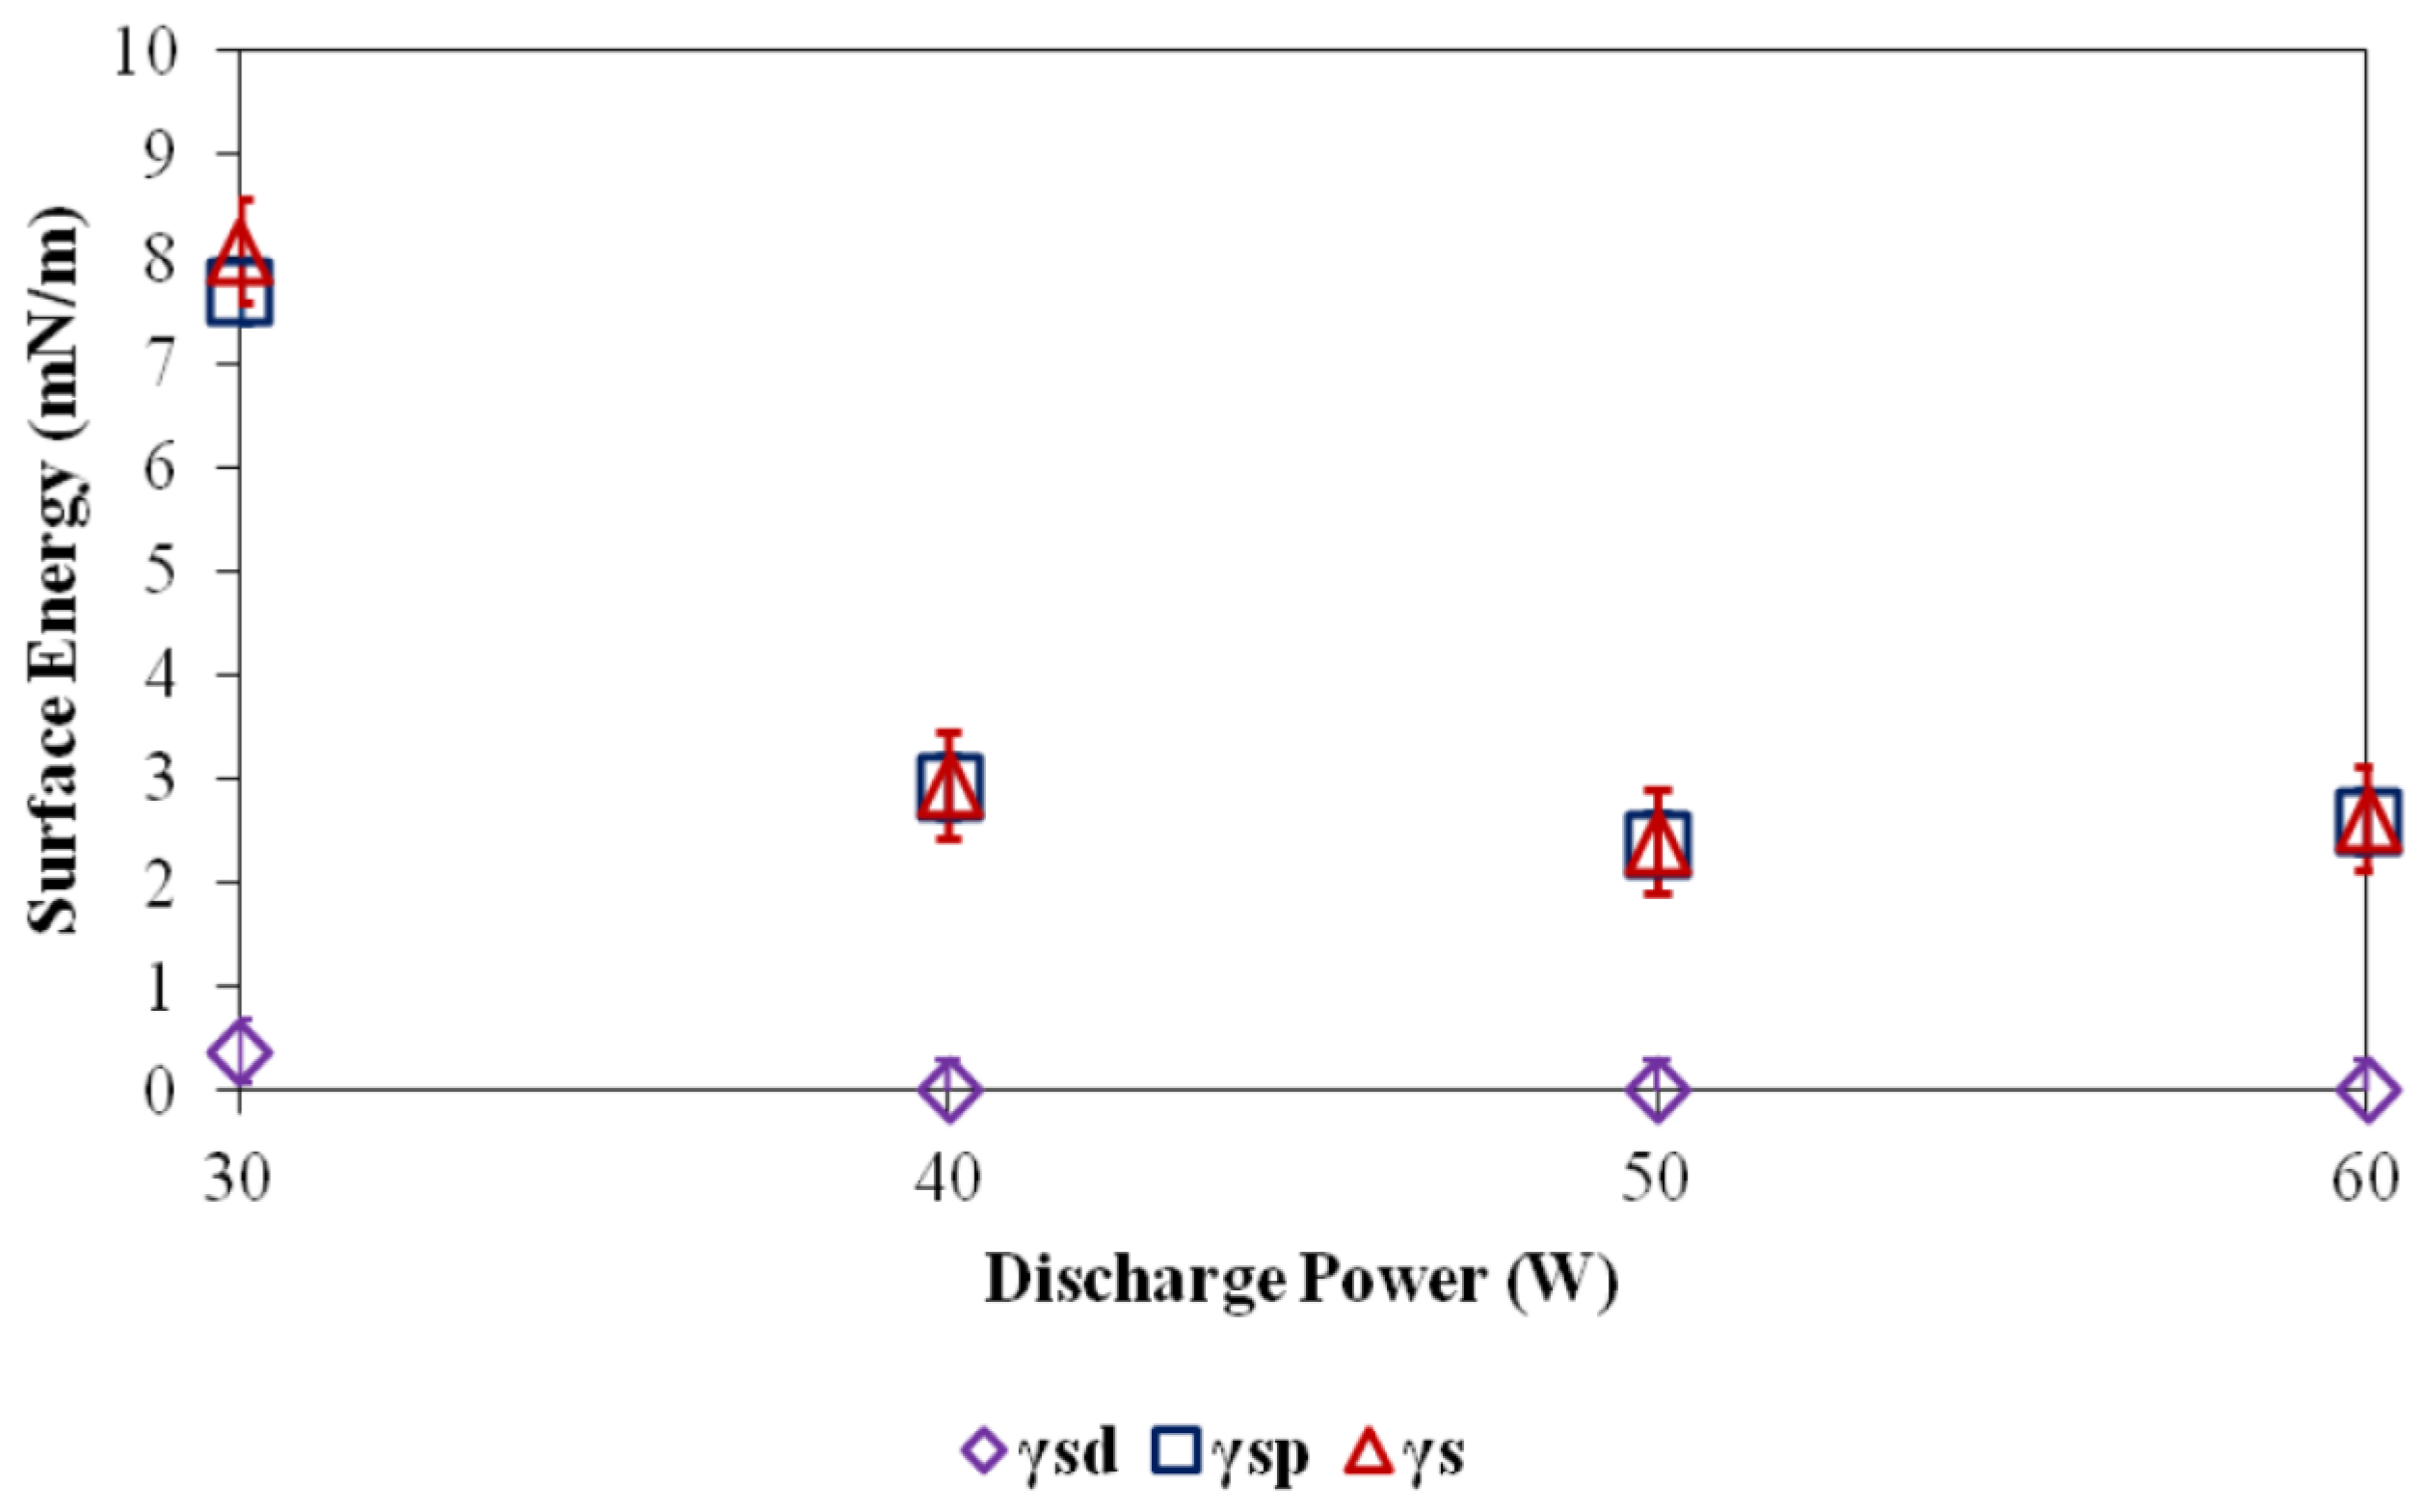
3.5. Surface Energy
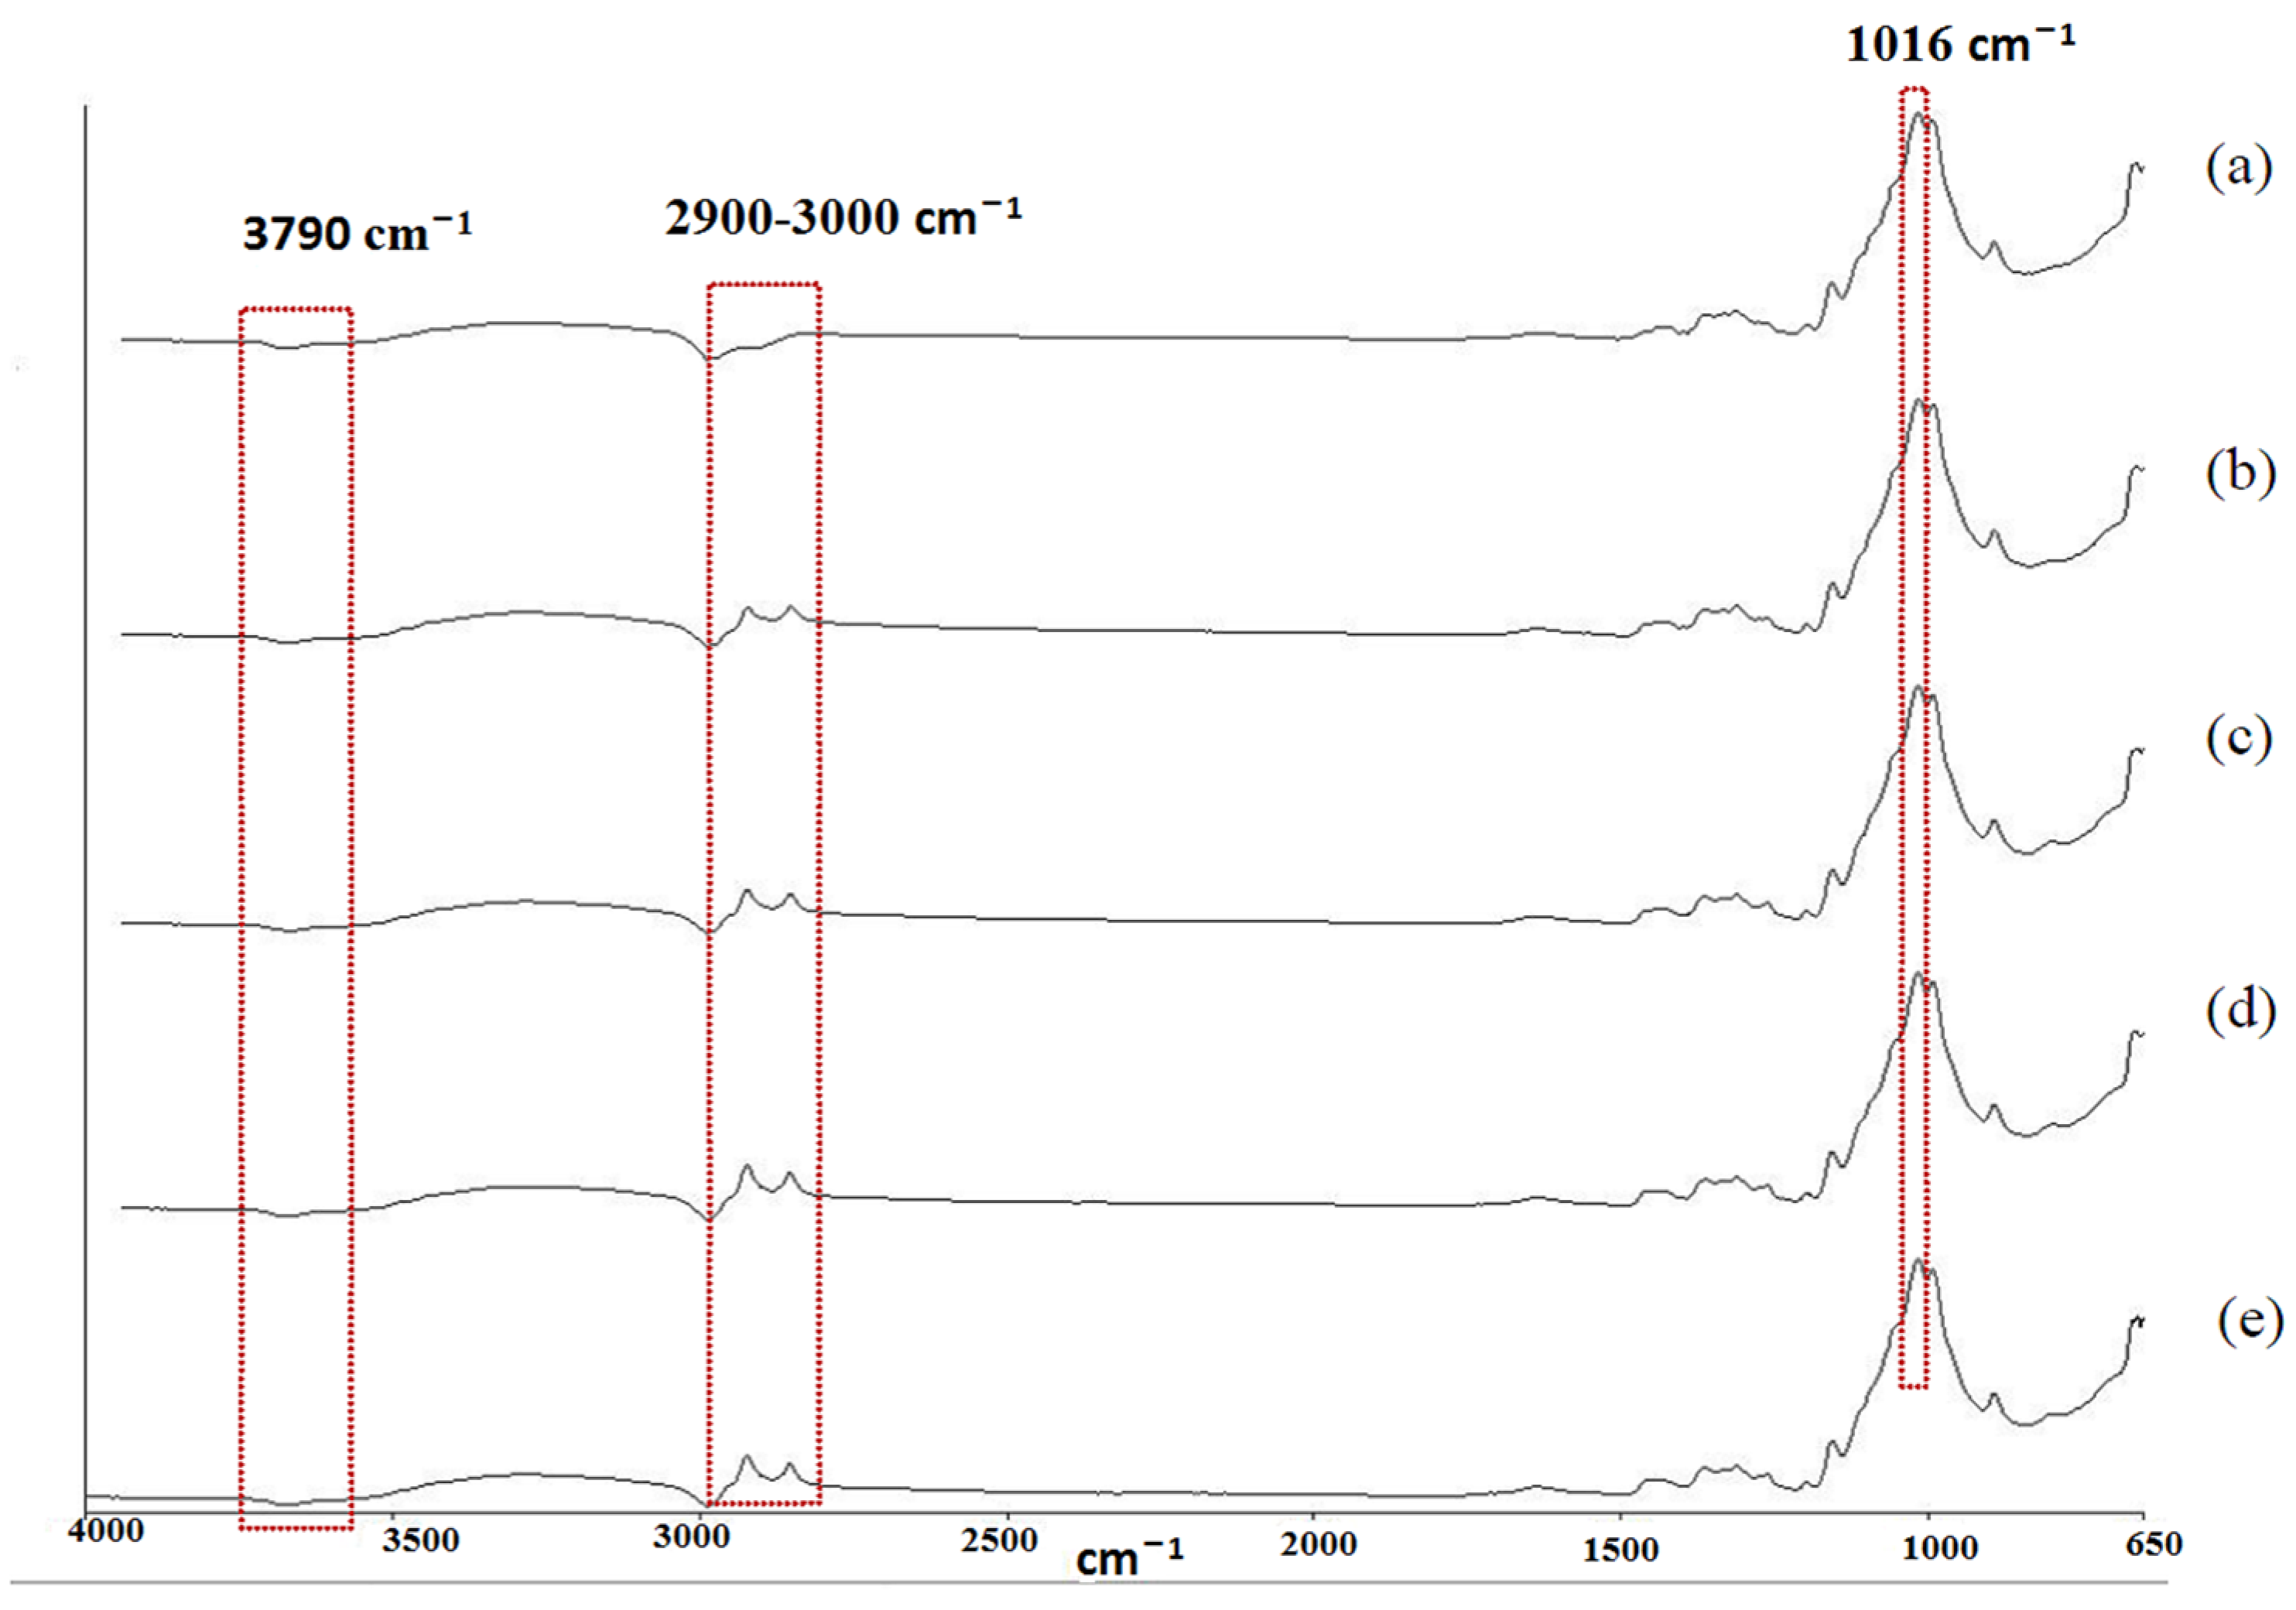
3.6. FTIR-ATR
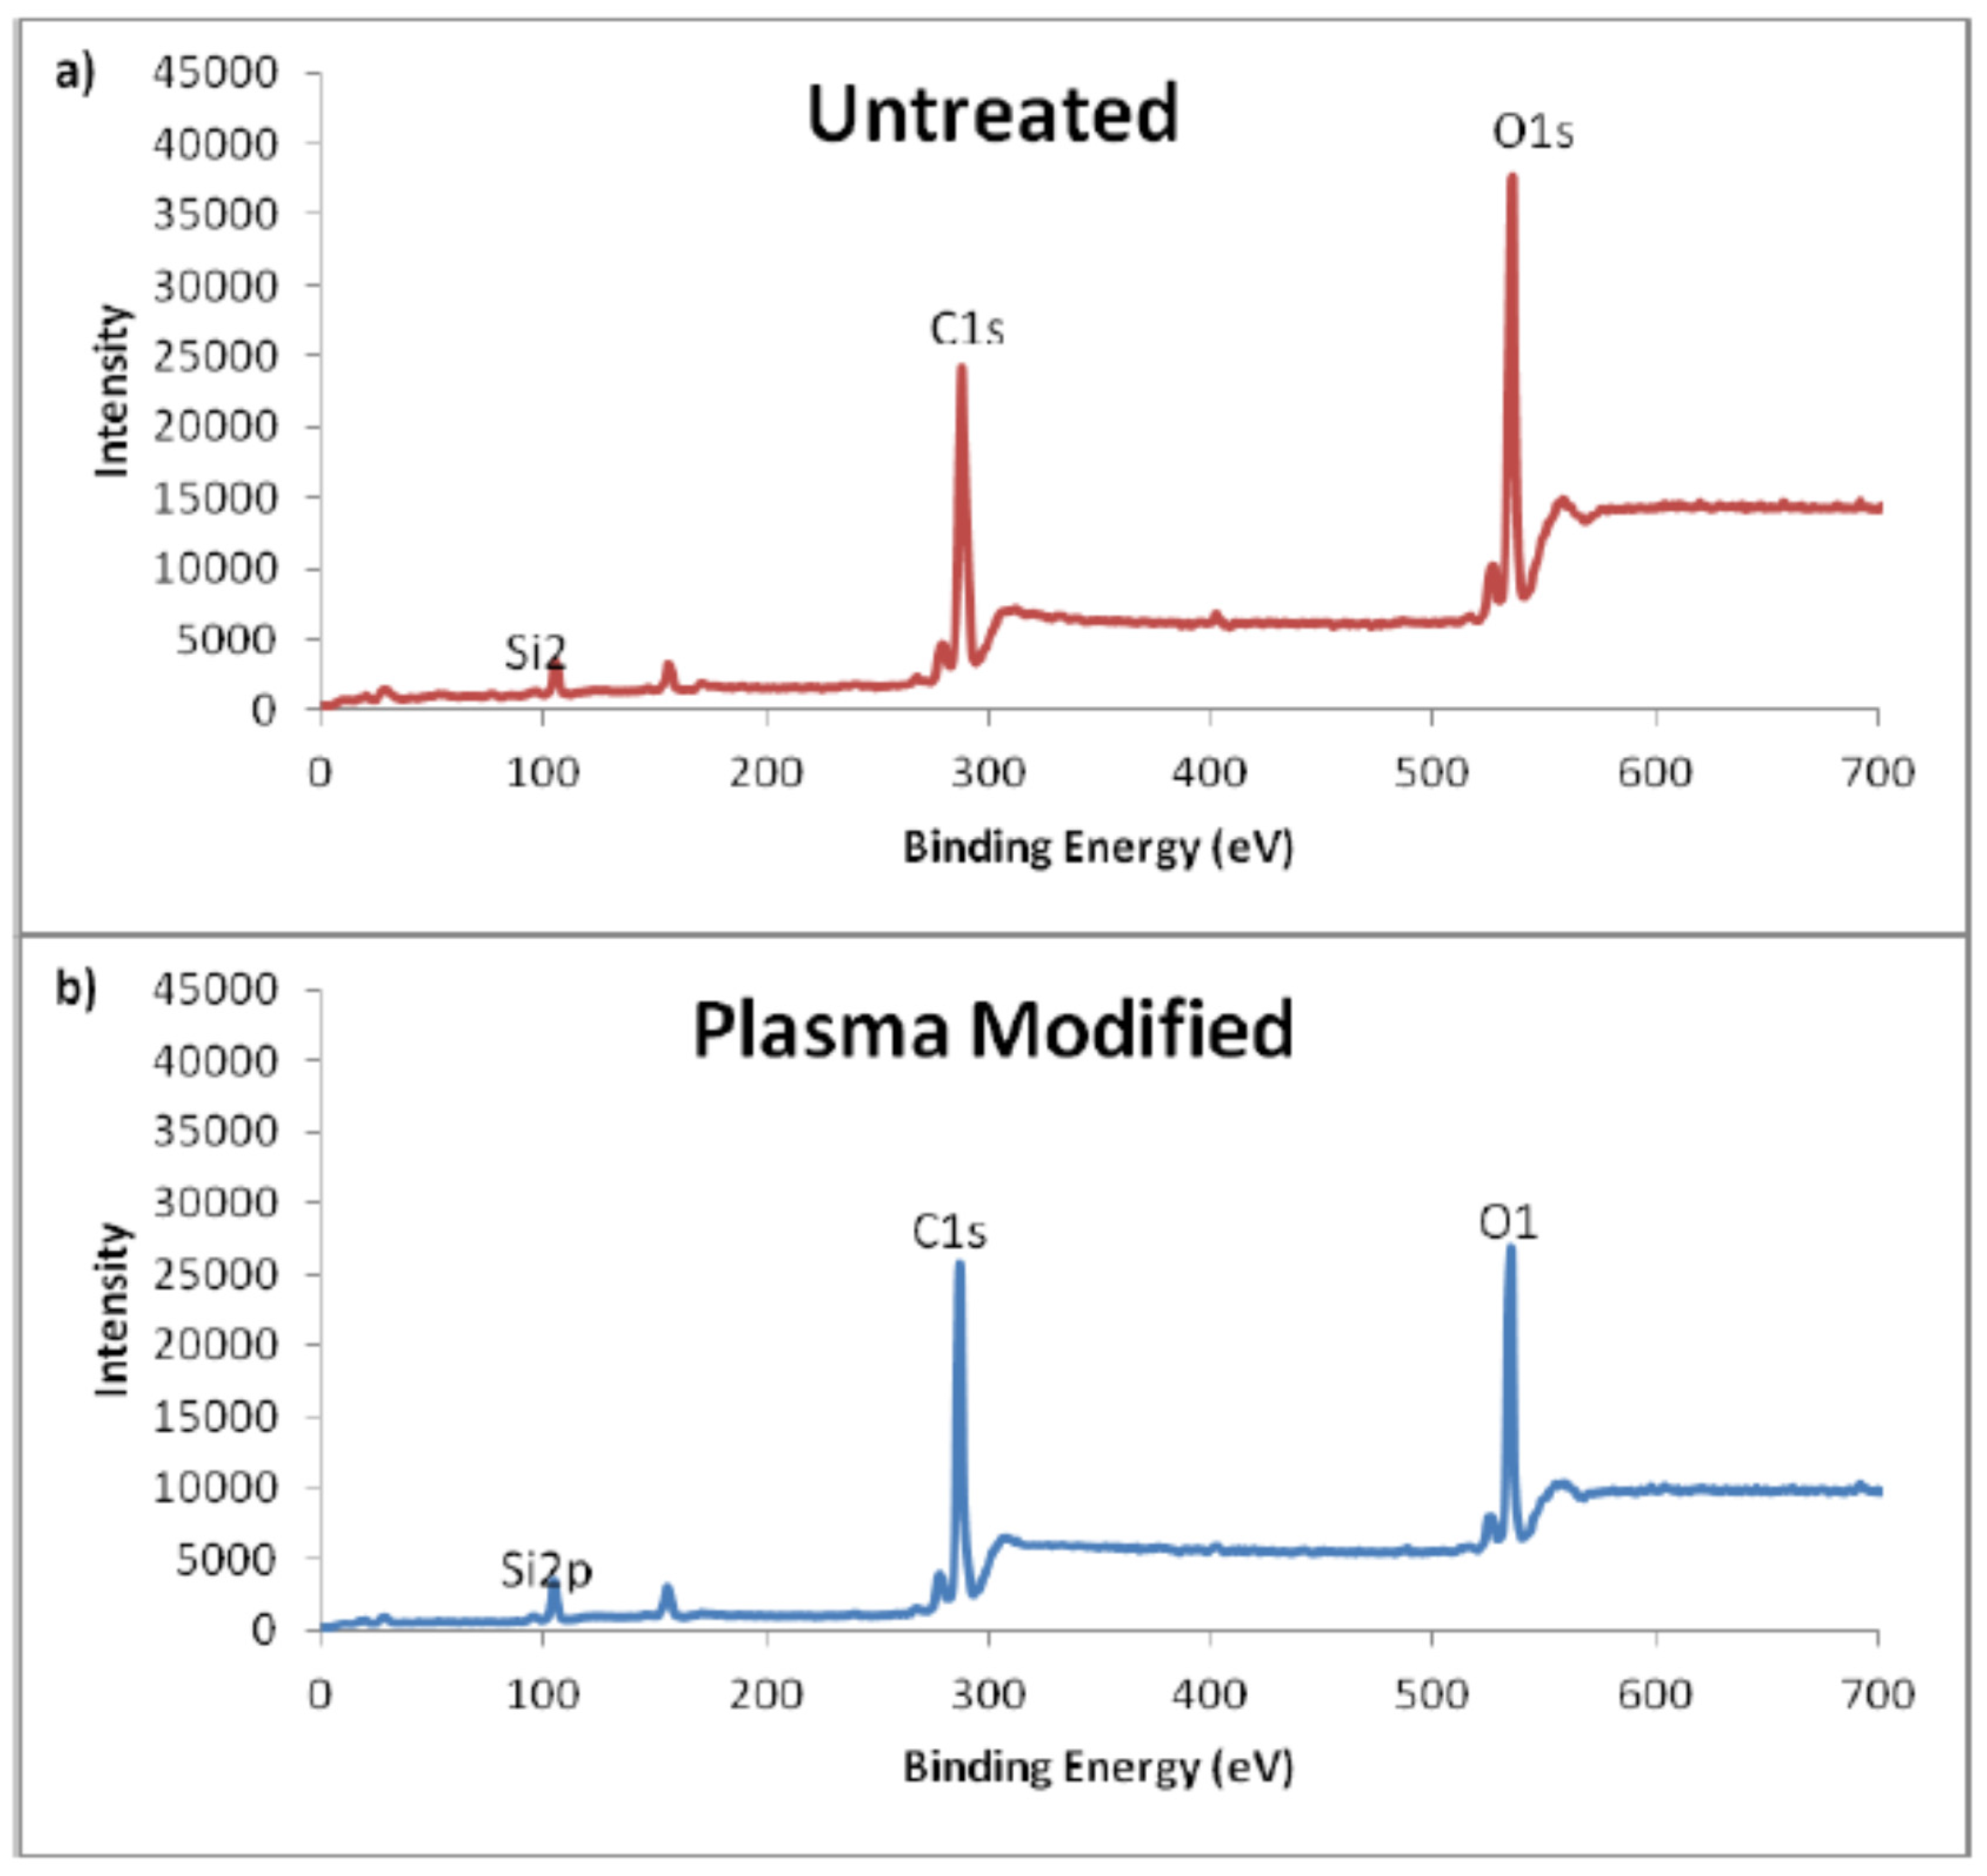
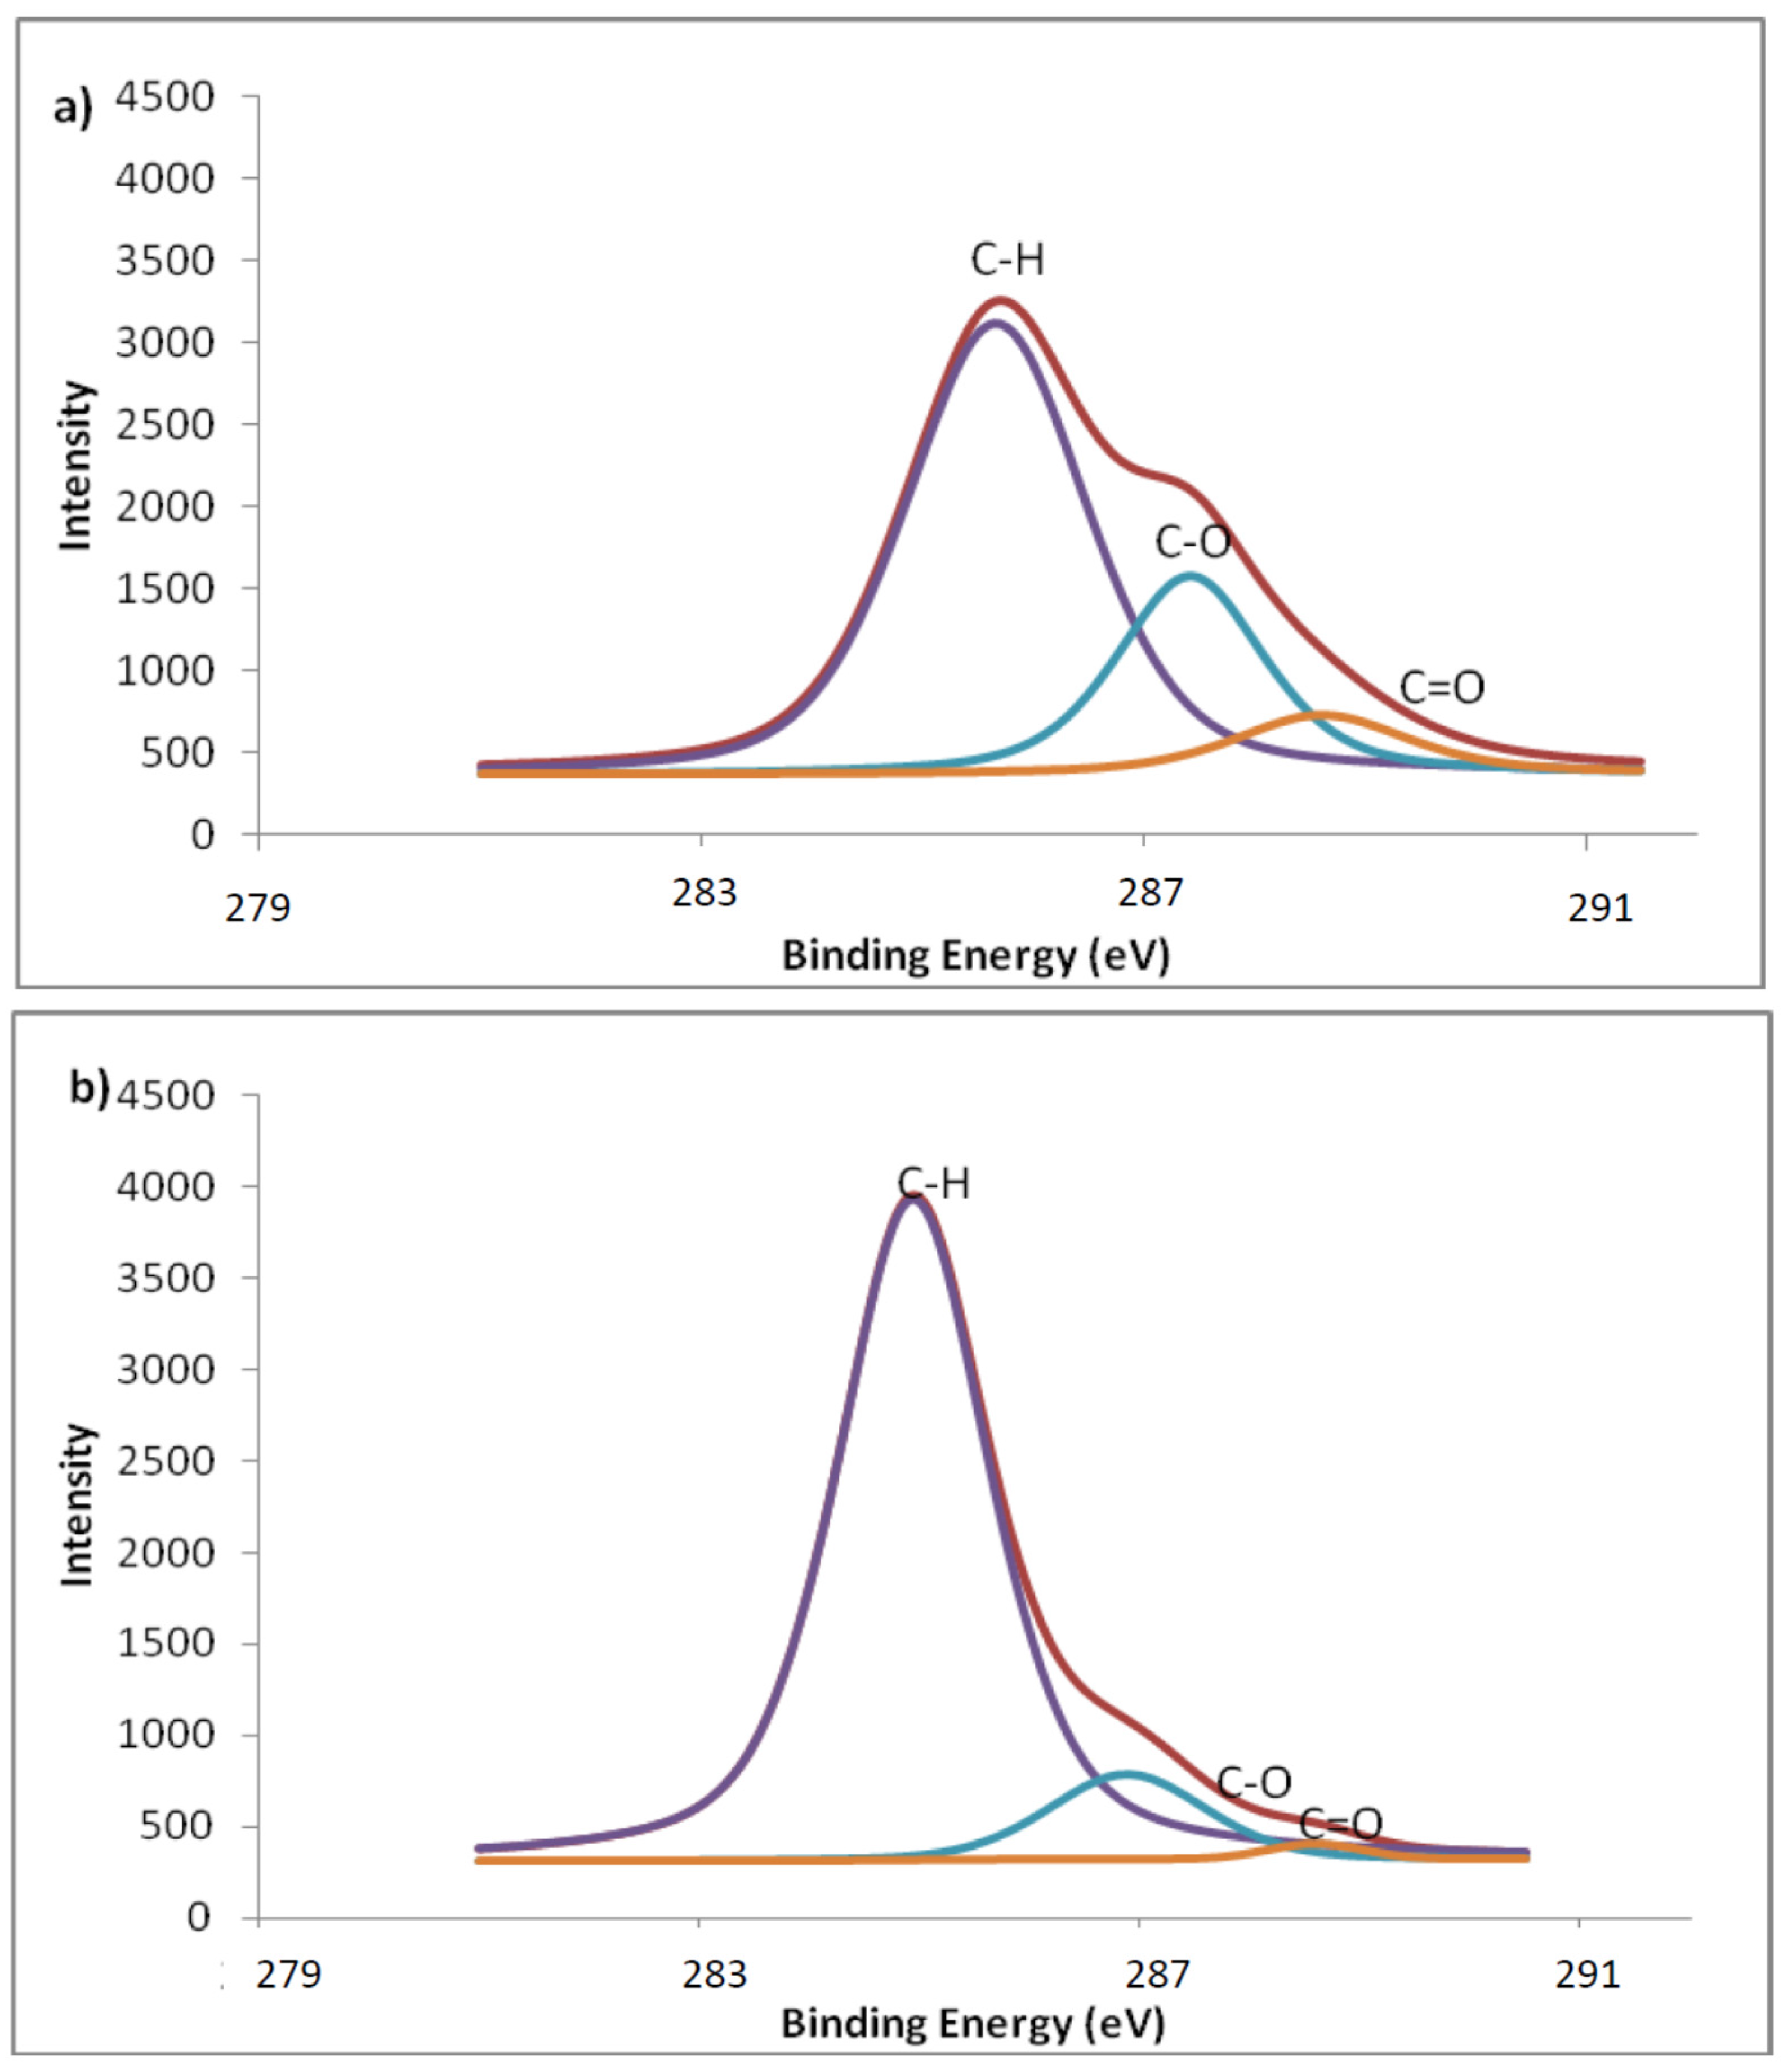
3.7. XPS
3.8. Multiple Linear Regression Analysis
4. Conclusion
Acknowledgments
Author Contributions
Conflicts of Interest
References
- Shang, M.H.; Wang, Y.; Limmer, S.J.; Chou, T.P.; Takahashi, K.; Cao, G.Z. Optically transparent superhydrophobic silica-based films. Thin Solid Films 2005, 472, 37–45. [Google Scholar] [CrossRef]
- Huang, L.; Lau, S.P.; Yang, H.Y.; Leong, E.S.P.; Yu, S.F.; Prawer, S. Stable superhydrophobic surface via carbon nanotubes coated with a ZnO thin film. J. Phys. Chem. B 2005, 109, 7746–7748. [Google Scholar] [CrossRef] [PubMed]
- Lee, H.J.; Michielsen, S. Preparation of a superhydrophobic rough surface. J. Polym. Sci. Part B Polym. Phys. 2007, 45, 253–261. [Google Scholar] [CrossRef]
- Kim, S.H.; Kim, J.; Kang, B.; Uhm, H. Superhydrophobic CFx coating via in-line atmospheric RF plasma of He−CF4−H2. Langmuir 2005, 21, 12213–12217. [Google Scholar] [CrossRef] [PubMed]
- Tsougeni, K.; Vourdas, N.; Tserepi, A.; Gogolides, E. Mechanisms of oxygen plasma nanotexturing of organic polymer surface: stable super hydrophilic to super hydrophobic surfaces. Langmuir 2009, 25, 11748–11759. [Google Scholar] [CrossRef] [PubMed]
- Raballand, V.; Benedikt, J.; von Keudell, A. Deposition of carbon-free silicon dioxide from pure hexamethyldisiloxane using an atmospheric microplasma jet. Appl. Phys. Lett. 2008, 92, 091502. [Google Scholar] [CrossRef]
- Kwong, C.H.; Ng, S.P.; Kan, C.W.; Yuen, C.W.M.; Chan, C.K.; Molina, R. Plasma treatment to enhance hydrophobicity of textiles. Textile Asia 2013, 44, 20–23. [Google Scholar]
- Man, W.S.; Kan, C.W.; Ng, S.P.; Yuen, C.W.M.; Chan, C.K. Pigment application on fabric with atmospheric pressure plasma. Textile Asia 2013, 44, 17–19. [Google Scholar]
- Lam, C.F.; Kan, C.W.; Chan, C.K.; Ng, S.P.; Yuen, C.W.M. Plasma treatment in cotton desizing. Textile Asia 2013, 44, 17–19. [Google Scholar]
- Schütze, A.; James, Y.J.; Steven, E.B.; Park, J.; Selwyn, G.S.; Hicks, R.F. The atmospheric-pressure plasma jet: A review and comparison to other plasma sources. IEEE Trans. Plasma Sci. 1998, 26, 1685–1694. [Google Scholar] [CrossRef]
- Cheng, C.; Liye, Z.; Zhan, R.J. Surface modification of polymer fibre by the new atmospheric pressure cold plasma jet. Surf. Coat. Technol. 2005, 200, 6659–6665. [Google Scholar] [CrossRef]
- Fonseca, J.L.C.; Apperley, D.C.; Badyal, J.P.S. Plasma polymerization of tetramethylsilane. Chem. Mater. 1993, 5, 1676–1682. [Google Scholar] [CrossRef]
- Favia, P.; Lamendola, R.; D’Agostino, R. The role of substrate temperature and bias in the plasma deposition from tetramethylsilane. Plasma Sources Sci. Technol. 1992, 1, 59–66. [Google Scholar] [CrossRef]
- Fonseca, J.L.C.; Tasker, S.; Apperley, D.C.; Badyal, J.P.S. Plasma-enhanced chemical vapor deposition of organosilicon materials: A comparison of hexamethyldisilane and tetramethylsilane precursors. Macromolecules 1996, 29, 1705–1710. [Google Scholar] [CrossRef]
- Park, S.Y.; Kim, H.; Hong, S.U.; Sasabe, H. Plasma polymerization of hexamethyldisilazane. Polym. J. 1990, 22, 242–249. [Google Scholar] [CrossRef]
- Kan, C.W.; Kwong, C.H.; Ng, S.P. Hydrophobisation of hydrophilic imitation leather with polyester surface by atmospheric pressure plasma treatment. J. Textile Inst. 2016, 107, 91–94. [Google Scholar] [CrossRef]
- Kan, C.W.; Kwong, C.H.; Ng, S.P. Surface Modification of polyester synthetic leather with tetramethylsilane by atmospheric pressure plasma. Appl. Surf. Sci. 2015, 346, 270–277. [Google Scholar] [CrossRef]
- Kan, C.W.; Kwong, C.H.; Ng, S.P. Effect of plasma treatment on the hydrophobicity of imitation leather with 100% polyurethane surface. Fibers Polym. 2015, 16, 702–704. [Google Scholar] [CrossRef]
- Kwong, C.H.; Ng, S.P.; Kan, C.W.; Molina, R. Inducing hydrophobic surface on polyurethane synthetic leather by atmospheric pressure plasma. Fibers Polym. 2014, 15, 1596–1600. [Google Scholar] [CrossRef]
- Kan, C.W.; Kwong, C.H.; Ng, S.P.; Yuen, C.W.M. Treating of rayon-flocked fabric by atmospheric pressure plasma. Mater. Sci. Medzg. accepted.
- Kan, C.W.; Yuen, C.W.M. Effect of atmospheric pressure plasma treatment on wettability and dryability of synthetic textile fibres. Surf. Coat. Technol. 2013, 228, S607–S610. [Google Scholar] [CrossRef]
- Kaelble, D.H. Dispersion-polar surface tension properties of organic solids. J. Adhes. 1970, 2, 66–81. [Google Scholar] [CrossRef]
- Gao, Q.; Zhu, Q.; Guo, Y.; Yang, C.Q. Formation of highly hydrophobic surface on cotton and polyester fabrics using silica sol nanoparticles and nonfluorinated alkylsilane. Ind. Eng. Chem. Res. 2009, 48, 9797–9803. [Google Scholar] [CrossRef]
- Paynter, R.W. XPS studies of the ageing of plasma-treated polymer surfaces. Surf. Interface Anal. 2000, 29, 56–64. [Google Scholar] [CrossRef]
- Tsoi, W.Y.I.; Kan, C.W.; Yuen, C.W.M. Using ageing effect for hydrophobic modification of cotton fabric with atmospheric pressure plasma. BioResources 2011, 6, 3424–3439. [Google Scholar]
- Inagaki, N.; Katsuoka, H. Gas separation members made by plasma polymerization of silanes and fluoromethane. J. Membr. Sci. 1987, 34, 297–305. [Google Scholar]
- Tajama, I.; Yamamoto, M. Characterization of plasma polymers from tetramethylsilane, octamethylcyclotetrasiloxane, and methyltrimethoxysilane. Polym. Sci. Part A Polym. Chem. 1987, 25, 1737–1744. [Google Scholar] [CrossRef]
- Coopes, I.H.; Griesser, H.J. The structure of organosilicon plasma-polymerized coatings on metal substrates. J. Appl. Polym. Sci. 1989, 37, 3413–3422. [Google Scholar] [CrossRef]


| Composition | Picture |
|---|---|
| Flocking facing with woven backing (100% rayon flock, 100% rayon woven backing) |  |
| Liquid | γl | γld | γlp |
|---|---|---|---|
| Water | 72.8 | 21.8 | 51.0 |
| Glycerol | 63.4 | 37.0 | 26.4 |
| Amount of TMS (mL) | Untreated | 0 (Treated With Helium Plasma Only) | 0.1 | 0.15 | 0.2 | 0.25 |
|---|---|---|---|---|---|---|
| Contact angle (°) | 0 | 0 | 47.4 ± 0.1 | 74.9 ± 0.2 | 135 ± 0.1 | 102.2 ± 0.2 |
| Sliding angle (°) | 0 | 0 | 72 ± 0.2 | 56 ± 0.2 | 32 ± 0.2 | 45 ± 0.3 |
| Peak | Position (eV) | FWHM |
|---|---|---|
| C1s | 284.08–292.15 | 1.01–1.67 |
| O1s | 531.50–538.30 | 1.00–2.03 |
| Si2p | 102.05–107.39 | 1.88 |
| Peak | Feature | Peak Position (eV) |
|---|---|---|
| C1 | C–H, C–C | 285.0 |
| C2 | C–O | 286.9 |
| C3 | C=O | 288.0 |
| C4 | O–C–O | 288.7 |
| Sample | C | O | Si | N | O/C | Si/O |
|---|---|---|---|---|---|---|
| Untreated | 61.17 | 32.02 | 5.54 | 1.27 | 0.52 | 0.17 |
| 0 mL TMS (treated with He plasma only) | 62.32 | 32.52 | 3.89 | 1.27 | 0.52 | 0.12 |
| 0.1 mL TMS | 64.37 | 29.45 | 6.18 | N/A | 0.46 | 0.21 |
| 0.15 mL TMS | 66.29 | 27.19 | 6.52 | N/A | 0.41 | 0.24 |
| 0.2 mL TMS | 66.44 | 26.08 | 7.48 | N/A | 0.39 | 0.29 |
| 0.25 mL TMS | 67.01 | 26.18 | 6.81 | N/A | 0.39 | 0.26 |
| Independent Variable | Significance (1-Tailed) |
|---|---|
| Helium | 0.334 |
| TMS | 0.000 |
| Power | 0.298 |
| Independent Variable | Unstandardized Coefficients | Standardized Coefficients | Collinearity Statistics Tolerance |
|---|---|---|---|
| (Constant) | –69.216 | N/A | N/A |
| Helium | –0.642 | –0.071 | 1.000 |
| TMS | 548.704 | 0.804 | 1.000 |
| Power | 0.846 | 0.248 | 1.000 |
© 2016 by the authors; licensee MDPI, Basel, Switzerland. This article is an open access article distributed under the terms and conditions of the Creative Commons by Attribution (CC-BY) license (http://creativecommons.org/licenses/by/4.0/).
Share and Cite
Kan, C.-W.; Kwong, C.-H.; Ng, S.-P. Atmospheric Pressure Plasma Surface Treatment of Rayon Flock Synthetic Leather with Tetramethylsilane. Appl. Sci. 2016, 6, 59. https://doi.org/10.3390/app6020059
Kan C-W, Kwong C-H, Ng S-P. Atmospheric Pressure Plasma Surface Treatment of Rayon Flock Synthetic Leather with Tetramethylsilane. Applied Sciences. 2016; 6(2):59. https://doi.org/10.3390/app6020059
Chicago/Turabian StyleKan, Chi-Wai, Chi-Ho Kwong, and Sun-Pui Ng. 2016. "Atmospheric Pressure Plasma Surface Treatment of Rayon Flock Synthetic Leather with Tetramethylsilane" Applied Sciences 6, no. 2: 59. https://doi.org/10.3390/app6020059