Article

Reallocating Charging Loads of Electric Vehicles in Distribution Networks

by
Mohammed Jasim M. Al Essa
* and
Liana M. Cipcigan
School of Engineering, Cardiff University, Cardiff CF24 3AA, UK
*
Author to whom correspondence should be addressed.
Appl. Sci. 2016, 6(2), 53; https://doi.org/10.3390/app6020053
Submission received: 21 December 2015 / Revised: 22 January 2016 / Accepted: 6 February 2016 / Published: 16 February 2016
(This article belongs to the Special Issue Smart Grid: Convergence and Interoperability)

Abstract

:
In this paper, the charging loads of electric vehicles were controlled to avoid their impact on distribution networks. A centralized control algorithm was developed using unbalanced optimal power flow calculations with a time resolution of one minute. The charging loads were optimally reallocated using a central controller based on non-linear programming. Electric vehicles were recharged using the proposed control algorithm considering the network constraints of voltage magnitudes, voltage unbalances, and limitations of the network components (transformers and cables). Simulation results showed that network components at the medium voltage level can tolerate high uptakes of uncontrolled recharged electric vehicles. However, at the low voltage level, network components exceeded their limits with these high uptakes of uncontrolled charging loads. Using the proposed centralized control algorithm, these high uptakes of electric vehicles were accommodated in the network under study without the need of upgrading the network components.

1. Introduction

Electric vehicles (EVs) have an important role to play in supporting the UK target of an 80% reduction in CO2 emissions by 2050s relative to CO2 emissions in 1990s [1,2]. The UK short-term goal is to cut emissions by a third by 2020 [1,2]. The current emphasis of the UK government on greening the private and commercial vehicles can help in decarbonizing a substantial part of the transport sector [1,2].
Many studies investigated the impact of EV uptake on distribution networks depending on the technical characteristics of the considered EVs and networks. Both temporal and spatial characteristics of (un)controlled EV charging loads have been studied in the literature [3,4] considering different types of distribution networks. A stochastic method has been used to study the impact of EV charging loads on UK distribution networks using real datasets acquired from smart meters of real trials [5]. It was suggested that the uncertainties of EV charging loads can be reduced with a cooperative framework between aggregators and distribution network operators (DNOs) [5]. The maximum uptakes of EVs have been calculated based on the transformer capacity at neighborhood levels [6]. A simple optimal charging strategy was proposed to efficiently integrate these EVs into the modeled network [6].
Previous studies concluded that, with high uptakes of EVs, existing distribution networks will frequently exceed their limits [7,8,9]. The thermal ageing of distribution transformers can significantly deteriorate with high levels of EV charging loads [8]. Results have shown that a 50% uptake of EVs can significantly affect the loss-of-life of distribution transformers [9]. Reinforcement can be used to strengthen the existing networks; however, a widespread adoption of infrastructure upgrades would be very expensive. For example, it has been concluded that the required grid reinforcement may reach up to 15% of the grid cost from a case without EV integrations [10]. Alternatively, smartening the distribution networks have the potential to develop an efficient use of the network components. Responsive loads such as EVs can be used to achieve an optimal energy matching by reshaping the energy demand. Optimal rescheduling strategies of EV (dis)charging loads have been presented with and without renewable energy resources, considering different constraints [11,12,13,14]. Smartening the networks can be implemented using multi-agent systems, adaptive controllers, (de)centralized managements, or coordinated schedules [15,16,17,18,19].
EV charging loads have been coordinated using agent-based strategies to mitigate their effects on distribution networks [15,20,21,22]. In one study [15], a multi-agent system was experimentally implemented for smart charging of EVs. The agent-based controller was developed using search methods based on neural networks. EV charging loads were designed to follow the low electricity price while maintaining grid constraints. In another study [16], an adaptive controller was proposed to coordinate EV charging schedules. The on-line adaptive controller was used to reduce the EV impact on distribution networks, considering EV charging costs, EV owner preferences, voltage magnitudes, and voltage unbalances. A direct current (DC) power flow was used in the optimization process, whereas an alternating current (AC) power flow has been performed to validate the results. In yet another study [17], load management based on a real-time control method was developed to coordinate EV charging loads within a five-minute time resolution. The cost of energy generation was minimized to achieve the coordination of EV charging loads considering energy losses, voltage fluctuations, and overloads.
This cost of energy was further reduced by finding a better local solution using fuzzy theory [18]. An on-line fuzzy coordination algorithm was used for EV charging loads in a smart network with distributed wind generators. The proposed control algorithm reduced the total cost of energy generation based on dynamic energy prices, including power losses. EV users were prioritized according to their preferred charging time periods. It was ensured that voltage profiles cannot exceed their limits when EVs were charged using the on-line fuzzy coordination algorithm [18].
In one study [19], EV charging loads were formulated considering the present and the expected constraints of a real network. A linear model was developed based on the dynamic nature of EV charging loads along with their arrival and departure times. Meanwhile, phase unbalances, voltage magnitudes and limitations of the distribution cables and transformers were considered in the proposed charging method [19]. Numerical optimization techniques have been reviewed for optimal scheduling of EV charging loads, discussing dynamic programming, linear programming, and non-linear programming [23,24]. Meta-heuristic methods have also been presented to illustrate multi-objective scheduling problems with probabilistic charging and discharging of EVs [23,24].
In this paper, the proposed control algorithm reallocates EV charging loads in advance based on the short-term load forecasting. It is assumed that the proposed control algorithm receives the short-term load forecasting from DNOs. However, the performance of the proposed control algorithm is tested with the real daily profiles of EV charging loads acquired from the smart meters during trials of the Customer-Led Network Revolution (CLNR) project. These profiles were used to synthesize stochastic charging durations for each EV with one-minute time resolution considering unbalanced EV charging loads across the three phases. Therefore, the proposed control algorithm can be used in the real-time monitoring applications of smart grids [25]. Distribution networks will evolve into smart grids using two-way communication technologies with smart meters and measuring sensors [26,27]. The results of the proposed methodology can be interpreted into lookup tables to assist DNOs in creating introductory assessments of the hosting capacity of their existing network components, as illustrated in another paper [28].
The main contributions of this paper are outlined as follows. It develops the centralized control algorithm to reallocate EV charging loads with one-minute time resolution considering the predefined constraints. This algorithm can be easily integrated into existing power system control paradigms. It implements non-iterative unbalanced optimal power flow calculations for the centralized control algorithm.
The rest of this paper is structured as follows. The centralized control algorithm is described in Section 2. A non-iterative unbalanced power flow solver is implemented in Section 3. The studied network is described in Section 4 along with profiles of the synthesized EV charging loads and residential loads. Results and conclusions are discussed in Section 5 and Section 6, respectively.

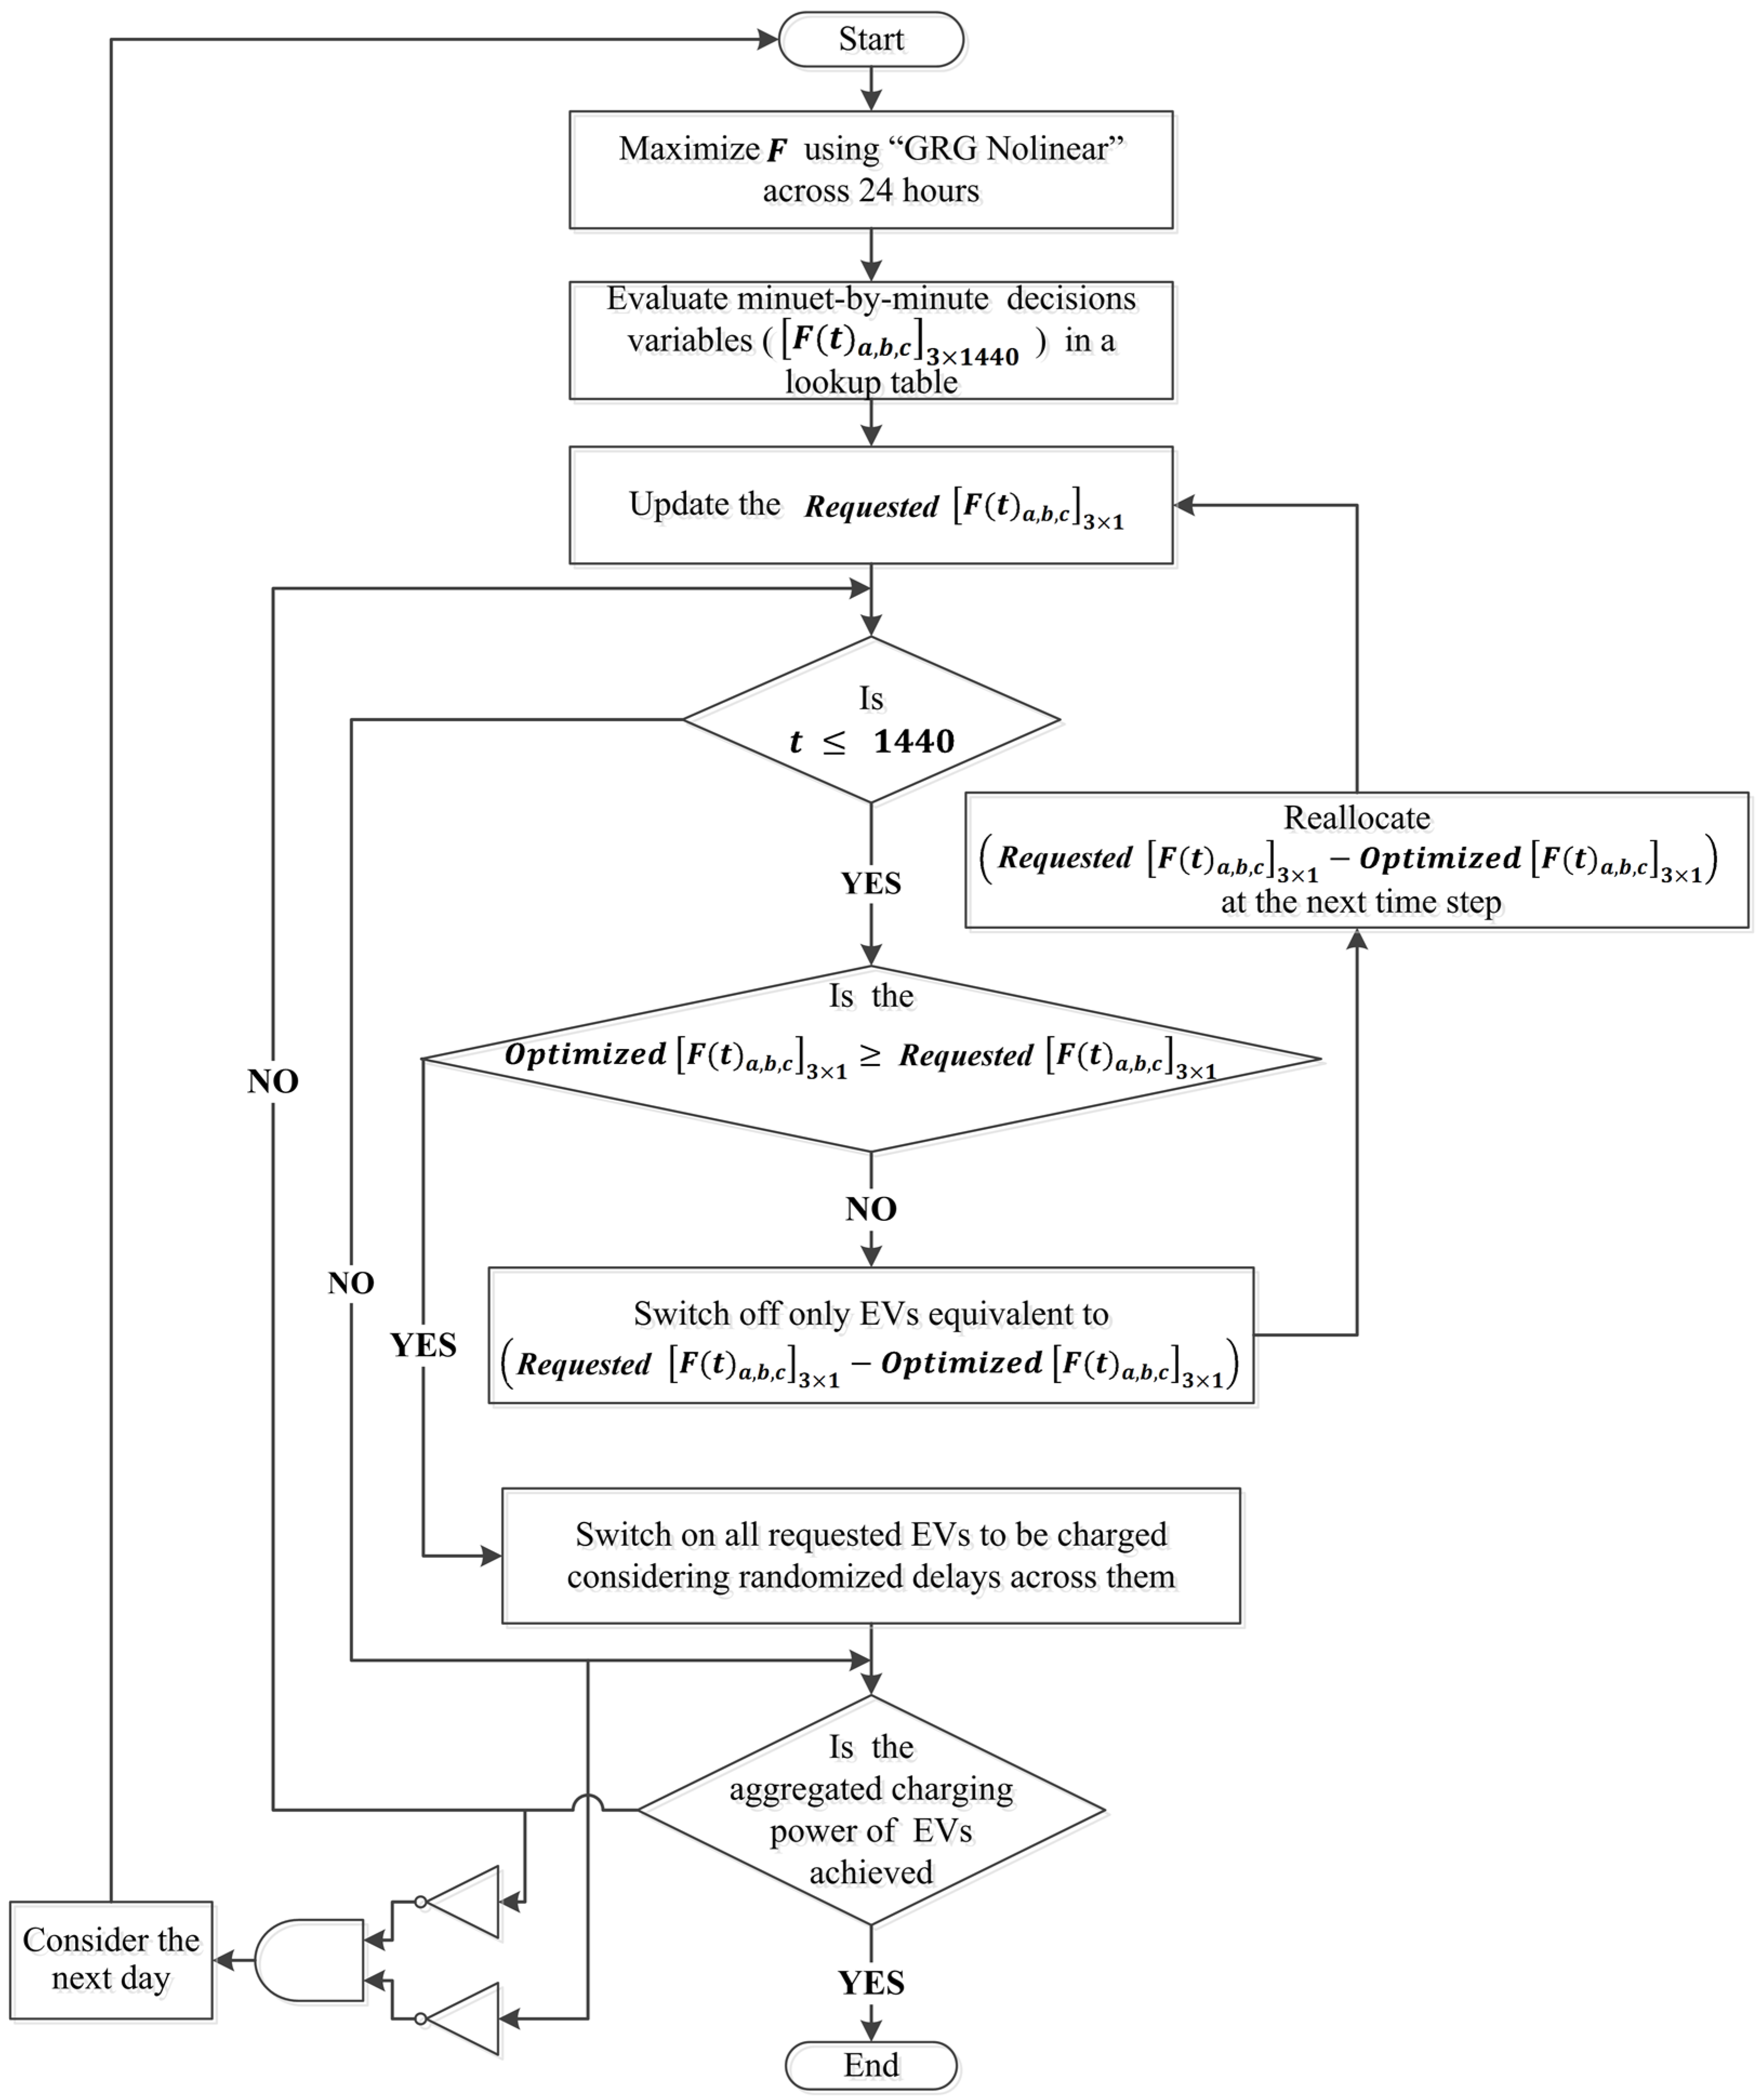
2. The Control Algorithm

2.1. Objective Function

One contribution of this work is related to the reallocation of EV charging time periods to avoid violating network limits using non-linear programming algorithms. The aggregated EV charging power was maximized across the three phases using Equation (1), considering the dynamic model of aggregated residential loads in every minute.
M a x i m i z e   F = t = 0 1440 ( [ F ( t ) a , b , c ] 3 × 1   + l = 1 N p ( t ) a , b , cCust . n l )     N +
here
[ F ( t ) a , b , c ] 3 × 1 = ( k = 1 M P ( t ) aEV k + k = 1 M P ( t ) bEV k + k = 1 M P ( t ) cEV k )     M +
where F is the objective function representing the aggregated charging power of EV loads in kW during a day (i.e., 1440 min), t is the current time step, and a , b , c are the three phases of the considered system. [ F ( t ) a , b , c ] 3 × 1 represents the requested EV charging loads across the three phases (i.e., decision variables). P ( t ) aEV ,   P ( t ) bEV   and   P ( t ) cEV represent the charging power of each EV per minute per phase in kW. p ( t ) a , b , cCust . n is the dynamic residential load for each customer per minute across the three phases in kW. M   and   N are the total number of EVs and customers, respectively. + is the real integer positive number.
The hosting capacity of the network components is calculated with F in every minute across the three phases. Further, this high time resolution means fast-queuing time process in reallocating EV charging loads. Therefore, the inconveniences of deferred EV users are reduced with this one-minute time resolution.
The main advantage of the proposed centralized control algorithm is that EV charging loads are regularly shifted toward new charging time periods. If EV charging loads violate the network constraints, the centralized control algorithm will evaluate the number of EVs that should be deferred.
The total loading power was determined using Equation (3) for each low voltage (LV) distribution transformer.
S ( t ) Tr . loading = j = 1 N f S ( t ) L N f +
where S ( t ) Tr . loading is the apparent power of the distribution transformer in kVA at the time step t , N f is the total number of radial feeders that are served by the distribution transformer, and S ( t ) L is the aggregated apparent power per LV feeder in kVA at the time step t . The predefined constraints are assigned as follows:
V min V ( t ) a , b , cn V max
V U F ( t ) n % V U F % max
I ( t ) a , b , cL I a , b , c L rating
S ( t ) Tr . loading S Tr . rating
where V min , V max are the lower and the upper limits of steady-state voltages ( V ( t ) a , b , cn ) per phase in V, V U F % max is the maximum percentage of the voltage unbalance factor ( V U F ( t ) n ) that can be allowed, I a , b , c L rating is the rated current of steady-state currents ( I ( t ) a , b , cL ) per phase at the main distribution lines in Amps, and S Tr . rating is the rated power of the distribution transformer in kVA.

2.2. Control Algorithm

Aggregated EV charging loads are considered to be the decision variables. These aggregated EV charging loads are optimally reallocated across the three phases to maintain the network constraints within their limits. The flowchart of the proposed control algorithm (see Figure 1) can be illustrated step by step as follows. Decision variables are evaluated using the generalized reduced gradient “GRG Nonlinear” solver (Frontline Systems, Incline Village, NV, USA) with Microsoft Excel (Microsoft Office 365, Microsoft Corporation, Reading, UK, 2013). However, this solver is limited in terms of assigning the number of decision variables and constraints. Therefore, these decision variables are evaluated with hourly time resolution (i.e., 3   ×   24   values) across the three phases during a day. Accordingly, the evaluated decision variables are interpolated into a lookup table of ( 3   ×   1440 elements) using MATLAB (R2015a, MathWorks, Cambridge, UK, 2015), as shown in the next step. This lookup table represents the hosting capacity of the network components (i.e., [ F ( t ) a , b , c ] 3 × 1440 ) during a day with one-minute time resolution across the three phases. The fluctuations of unbalanced residential loads and unbalanced EV charging loads are considered based on real daily load profiles from CLNR trials. The hosting capacity for each minute (i.e., O p t i m i z e d   [ F ( t ) a , b , c ] 3 × 1 ) is then compared to the R e q u e s t e d   [ F ( t ) a , b , c ] 3 × 1 , as shown in Figure 1. The R e q u e s t e d [ F ( t ) a , b , c ] 3 × 1 is directly calculated in this step using Equation (2) based on the charging power of each EV per minute per phase ( P ( t ) aEV , P ( t ) bEV , P ( t ) cEV ).
If O p t i m i z e d [ F ( t ) a , b , c ] 3 × 1 R e q u e s t e d [ F ( t ) a , b , c ] 3 × 1 is true, all requested EV charging loads can occur at this minute considering randomized delays (i.e., less than 60 s) among them. Otherwise, a number of EVs with the amount of power of ( R e q u e s t e d [ F ( t ) a , b , c ] 3 × 1 O p t i m i z e d [ F ( t ) a , b , c ] 3 × 1 ) will be reallocated to charge at other time steps, whenever the predefined constraints can be maintained. Then, EV users can accordingly reschedule their smart charging. If the aggregated EV charging power is not achieved during that day, the algorithms allow the remaining EVs to complete their charging demand on the next day depending on Boolean signals from “AND” gate (see Figure 1).

3. Non-iterative Unbalanced Power Flow Calculations

A non-iterative unbalanced power flow solver was developed by the authors to calculate voltage magnitudes, voltage unbalances, and electric loads of network components. The developed solver was implemented based on the forward and backward sweep method [29]. The main advantage of the developed solver is the non-iterative method compared to the forward and backward sweep method, which is iterative. Unbalanced power flow results were compared using these two methods. Very close results were observed using both methods with the advantage of significantly reducing the number of calculation steps.
Phase voltage matrices were represented with complex quantities using Euler’s method. The unbalanced power flow requires phase impedance matrices between any two adjacent nodes along radial feeders. Equation (8) represents the phase impendence matrix between adjacent nodes, including impedances due to self and mutual inductances [29].
[ Z a , b , c ] 3 × 3 = [ Z aa Z ab Z ac Z ba Z bb Z bc Z ca Z cb Z cc ]
where [ Z a , b , c ] 3 × 3 is the phase impedance matrix of the feeder in Ω. The diagonal elements of this matrix are the impedances due to the self-inductance (e.g., Z aa ). The off diagonal elements are the impedances due to the mutual-inductance (e.g., Z ab ). If only positive ( Z 1 ) and zero ( Z 0 ) sequence impedances are available, the impedance matrix is approximated as follows [29]:
[ Z a , b , c ] 3 × 3 = 1 3 [ ( 2 Z 1 + Z 0 ) ( Z 0 Z 1 ) ( Z 0 Z 1 ) ( Z 0 Z 1 ) ( 2 Z 1 + Z 0 ) ( Z 0 Z 1 ) ( Z 0 Z 1 ) ( Z 0 Z 1 ) ( 2 Z 1 + Z 0 ) ]
Then, the phase voltage matrix is calculated using Equation (10).
[ V ( t ) a , b , cn exp ( i ( t ) a , b , cn ) ] 3 × 1 = [ V ( t ) a , b , c 1 exp ( i ( t ) a , b , c 1 ) ] 3 × 1 [ Z a , b , c ] 3 × 3 [ I ( t ) a , b , cLn exp ( i θ ( t ) a , b , cn ) ] 3 × 1
where [ V ( t ) a , b , c 1 exp ( i ( t ) a , b , c 1 ) ] 3 × 1 is the phase voltage matrix at the swing bus in V, [ V ( t ) a , b , cn exp ( i ( t ) a , b , c n ) ] 3 × 1 is the phase voltage matrix at the adjacent node n in V, [ I ( t ) a , b , cLn exp ( i θ ( t ) a , b , cn ) ] 3 × 1 is the phase current matrix consumed by all groups of customers at node n in Amps, ( t ) a , b , cn is the angle between phase voltage and reference axis at the end node n in degree, θ ( t ) a , b , cn is the angle between phase current and reference axis at the specified node n in degree, and i = 1 . The phase current matrix at node n is calculated using the following equation:
[ I ( t ) a , b , cLn exp ( i θ ( t ) a , b , cn ) ] 3 × 1 = [ S ( t ) aLn * V ( t ) an exp ( i ( t ) an ) S ( t ) bLnt * V ( t ) bn exp ( i ( t ) bn ) S ( t ) cLnt * V ( t ) cn exp ( i ( t ) cn ) ]
where S ( t ) a , b , cLn is the apparent power of aggregated customers at node n in kVA per phase at the time step t . * is the conjugated value. Equation (10) is modified into Equation (12) by substituting Equation (11) in Equation (10) for a unity power factor.
[ V ( t ) a , b , cn exp ( i ( t ) a , b , cn ) ] 3 × 1 = [ V ( t ) a , b , c 1 exp ( i ( t ) a , b , c 1 ) ] 3 × 1   [ Z a , b , c ] 3 × 3 [ ( P ( t ) a , b , cLn V ( t ) a , b , cn ) exp ( i ( t ) a , b , cn ) ] 3 × 1
where P ( t ) a , b , cLn is the aggregated power consumed by all groups of customers at the specified node n in kW per phase at the time step t . The power term (i.e., P ( t ) a , b , cLn ) in (12) is determined by the following equations:
P ( t ) a , b , cLn = P ( t ) a , b , cln + P ( t ) a , b , cEVsn
where
P ( t ) a , b , cln =   l = 1 N p ( t ) a , b , cCust . n l   P ( t ) a , b , cEVsn = k = 1 M y a , b , ck × p ( t ) a , b , cEVn k M , N +
where p ( t ) a , b , cCust . n   and   P ( t ) a , b , cln are the power consumed by individual and aggregated customers, respectively, at node n in kW without EV per phase at the time step t , and p ( t ) a , b , cEVn   and   P ( t ) a , b , cEVsnt are the power consumed by individual and aggregated EV chargers, respectively, at node n in kW per phase at the time step t .
y a , b , ck = { 1 ,   f o r   E V   c h a r g i n g   s t a t e s 0 ,   f o r   E V   i d l e   s t a t e s
Equation (12) is rewritten considering the aggregated power of EVs and customers from Equation(13) as shown below:
[ V ( t ) a , b , cn exp ( i ( t ) a , b , cn ) ] 3 × 1 = [ V ( t ) a , b , c 1 exp ( i ( t ) a , b , c 1 ) ] 3 × 1 [ B ( t ) a , b , cn ] 3 × 1
where
[ B ( t ) a , b , cn ] 3 × 1 = [ Z a , b , c ] 3 × 3 × [ ( exp ( i ( t ) a , b , cn ) V ( t ) a , b , cn ) ( l = 1 N p ( t ) a , b , cCust . n l + P ( t ) a , b , cEVsn ) ] 3 × 1   N +
where [ B ( t ) a , b , cn ] is the matrix resulted from multiplying ( 3 × 3 ) impedance matrix by ( 3 × 1 ) phase current matrix at the time step t . Across all phases, the objective function is derived from Equations (16) and (17) by discriminating the aggregated charging power of EVs ( P ( t ) a , b , cEVsn ) as follows:
[ F ( t ) a , b , c ] 3 × 1 = { [ Z a , b , c ] 3 × 3 1 × [ B ( t ) a , b , cn ] 3 × 1 × V ( t ) a , b , cn × exp ( i ( t ) a , b , cn ) } l = 1 N p ( t ) a , b , cCust . n l N +
where [ F ( t ) a , b , c ] 3 × 1 is the aggregated charging power of EVs to be maximized per phase, excluding all residential loads, and Δ ( t ) a , b , c are the phase differences between adjacent phase voltages in degree. By adding residential loads to the both sides of Equation (18), the objective function F across the three phases during a day with one-minute time resolution was rewritten as follows:
F = t = 0 1440 ( [ F ( t ) a , b , c ] 3 × 1 + l = 1 N p ( t ) a , b , cCust . n l ) N +
It can be observed that Equations (1) and (19) are identical. The V U F ( t ) n % is calculated in percentage using (20) for each time step t .
V U F ( t ) n = M A X ( | V ( t ) A V ( t ) an | , | V ( t ) A V ( t ) bn | , | V ( t ) A V ( t ) cn | ) V ( t ) A × 100 %
where V ( t ) A = ( V ( t ) an + V ( t ) bn + V ( t ) cn ) 3 at each time step t .

4. Configurations of the System under Study

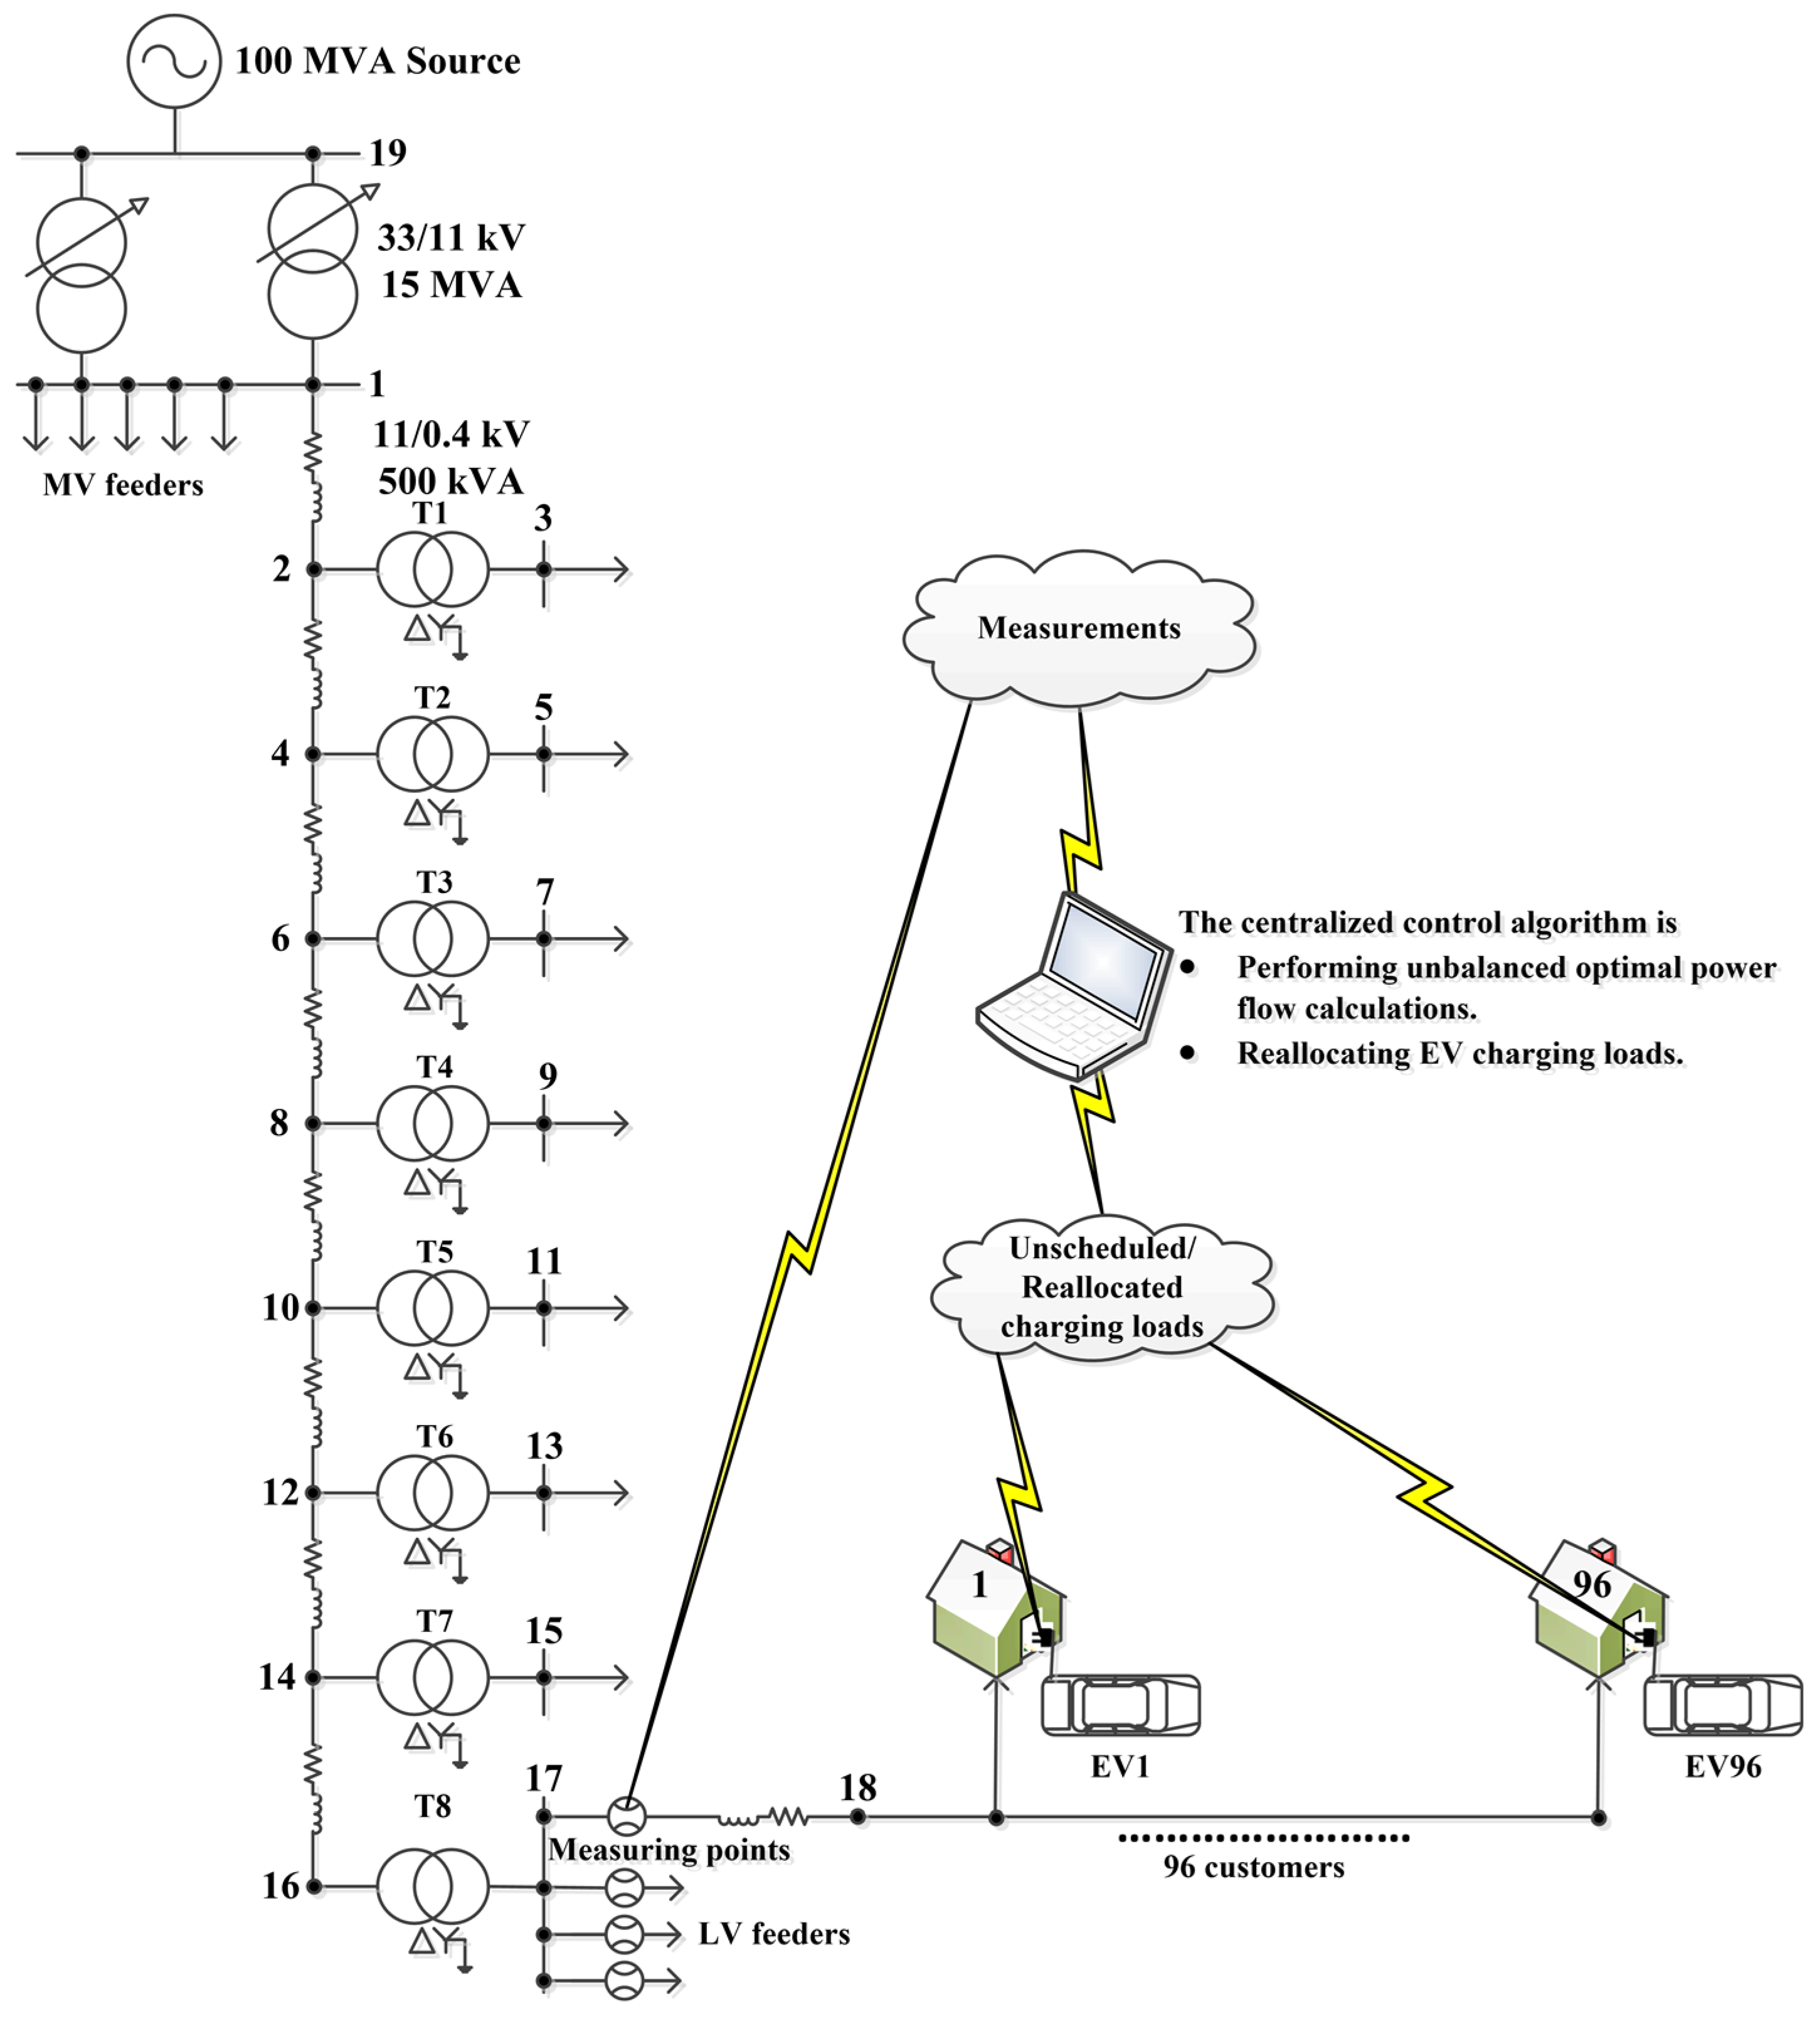
4.1. The Network under Study

Figure 2 illustrates the proposed architecture of the centralized controller. An adapted UK generic distribution network (UKGDN) [30] was used to test the performance of the centralized control algorithm for the smart charging of EVs.
Six radial feeders are emanating from the medium voltage (MV) side of the two parallel on-line tap changing transformers. The capacity of each transformer is 15 MVA 33/11 kV. The MV feeders serve 18,432 customers with 3,072 customers for each feeder. Each MV feeder is divided into 8 segments, serving 8 ground-mounted distribution transformer. Each one (i.e., 500 kVA 11 kV/0.4 kV ground-mounted distribution transformer) serves 384 customers distributed across 4 LV feeders. Ninety-six customers were distributed along each LV feeder (See Figure 2). More details about the original UKGDN can be found in the literature [30].
Metering points were allocated at the emanating point of each LV feeder. These meters are used to upload readings of measured phase currents using two-way communications (see Figure 2). When these readings are received by the centralized control algorithm, unbalanced power flow calculations are performed to reallocate EV charging loads. The unbalanced power flow updates voltage magnitudes, voltage unbalances and electric loads of network components. If EV users upload their unscheduled EV charging loads via these two-way communications, EV users can accordingly reschedule their smart charging based on the charging duration received from the control algorithm. EV charging loads will be accordingly reallocated using the centralized control algorithm as illustrated in Section 2.2.
To solve the power flow for the UKGDN (Figure 2) using the developed solver, the following steps are followed:
  • Calculation of the total power at node 1 using Equations (13) and (14).
  • Calculation of the total current at node 1 using Equation (11).
  • Calculation of the phase voltages at node 2 using Equation (12).
  • Sequentially repeat the above calculations to determine the phase voltages at nodes 2, 4, 6, 8, 10, 12, 14, and 16.

4.2. Residential Load Model

Loads can be modeled as a constant active/reactive power (PQ), a constant current (I), a constant impedance (Z) or a combination of PQ, I and Z [29]. In this study, residential loads were modeled as a dynamic PQ changing their values in every minute. Daily load profiles were created using means and standard deviations recorded in CLNR project during real trials [31]. Figure 3a shows aggregated daily load profiles of 384 customers for each distribution transformer with one-minute time resolution. Daily profiles of the standard deviations and means were selected to represent 18 of January 2014 as reported in “Peak Demand Day” workbook by CLNR project [31]. Figure 3b shows the minute-by-minute mean profile (i.e., stochastically created with 3072 customers) compared to the half-hourly mean profile (i.e., recorded in CLNR project).

4.3. Electric Vehicle Load Model

EVs were modeled as a dynamic PQ capturing EV charging loads in every minute. Daily profiles of EV charging loads were synthesized based on real datasets. A real diurnal mean profile was selected as a reference from the CLNR project “TC6 Dataset” workbook (i.e., the daily mean profile of charging power for 93 EVs in January 2014) [31]. EV charging profiles were individually generated in MATLAB using the “randi” function to produce the diversity across EV charging profiles. This function generates integer random numbers. Matrices of zeros and ones were generated using the “randi” function (one for charging state and zero for idle state). Departure and arrival times were assigned per EV based on the National Travel Surveys (NTS) of the UK from the Department for Transport [32] during working days.
At transformer T8, all residential customers were assumed to have a single phase charger of 3.3 kW per hour at slow charging mode. Therefore, a 100% EV uptake was considered across residential customers at transformer T8 (see Figure 2). EV load profiles were synthesized as follows:
  • Generate the requested minutes for charging each EV (less than or equal 480 min a day) using the “randi” function.
  • Synthesize the daily load profile of each EV by assigning zero for idle state and one for charging state.
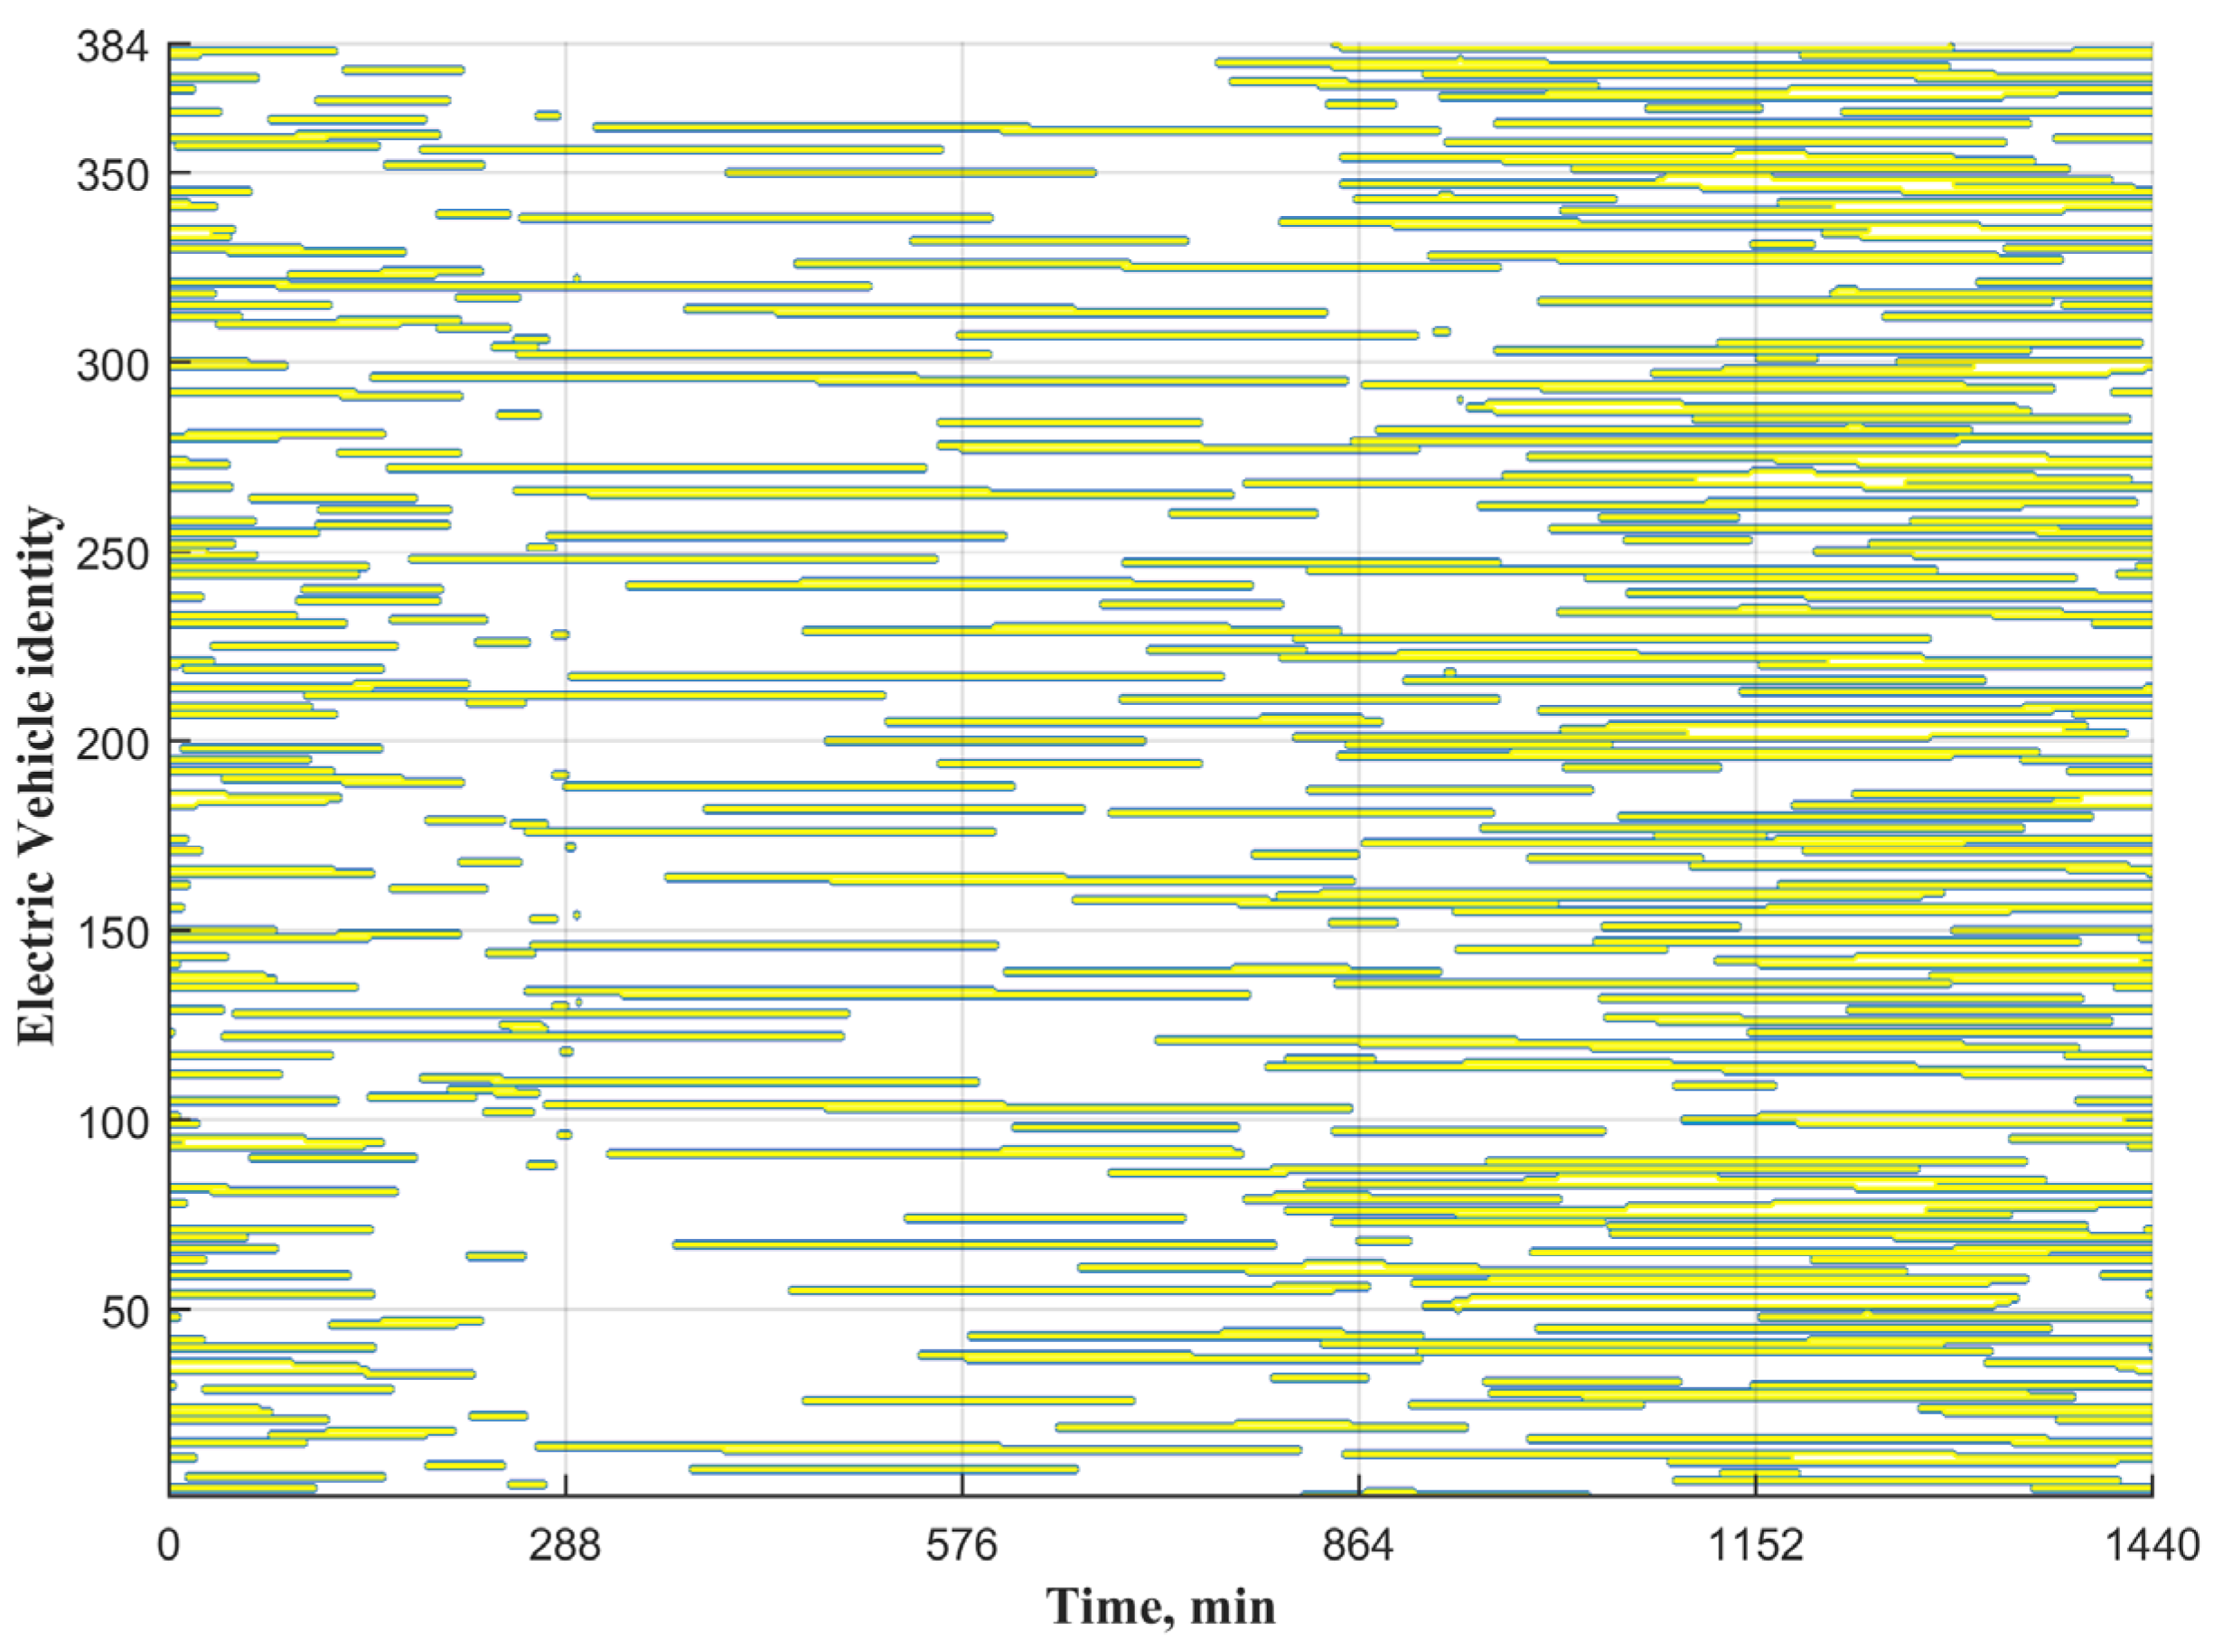
  • Concatenate minute-by-minute the charging profiles of 384 EVs in one matrix ( 384 × 1440 ).
  • Shift charging loads of the produced matrix according to arrival and departure times to match the pattern of the real daily mean profile from [31].
Figure 4 represents the comparison between the daily mean of the synthesized EV charging loads and the daily mean of the real EV charging loads. It can be seen that the synthesized daily mean of 384 EVs is greater than the daily mean of 93 EVs obtained from CLNR datasets. However, their daily patterns are approximately similar. Figure 5 illustrates charging durations of 384 EVs during a day with one-minute time resolution.

5. Simulation Results

To monitor the performance of the centralized control algorithm, steady-state profiles of the UKGDN were calculated with one-minute time resolution for two scenarios:
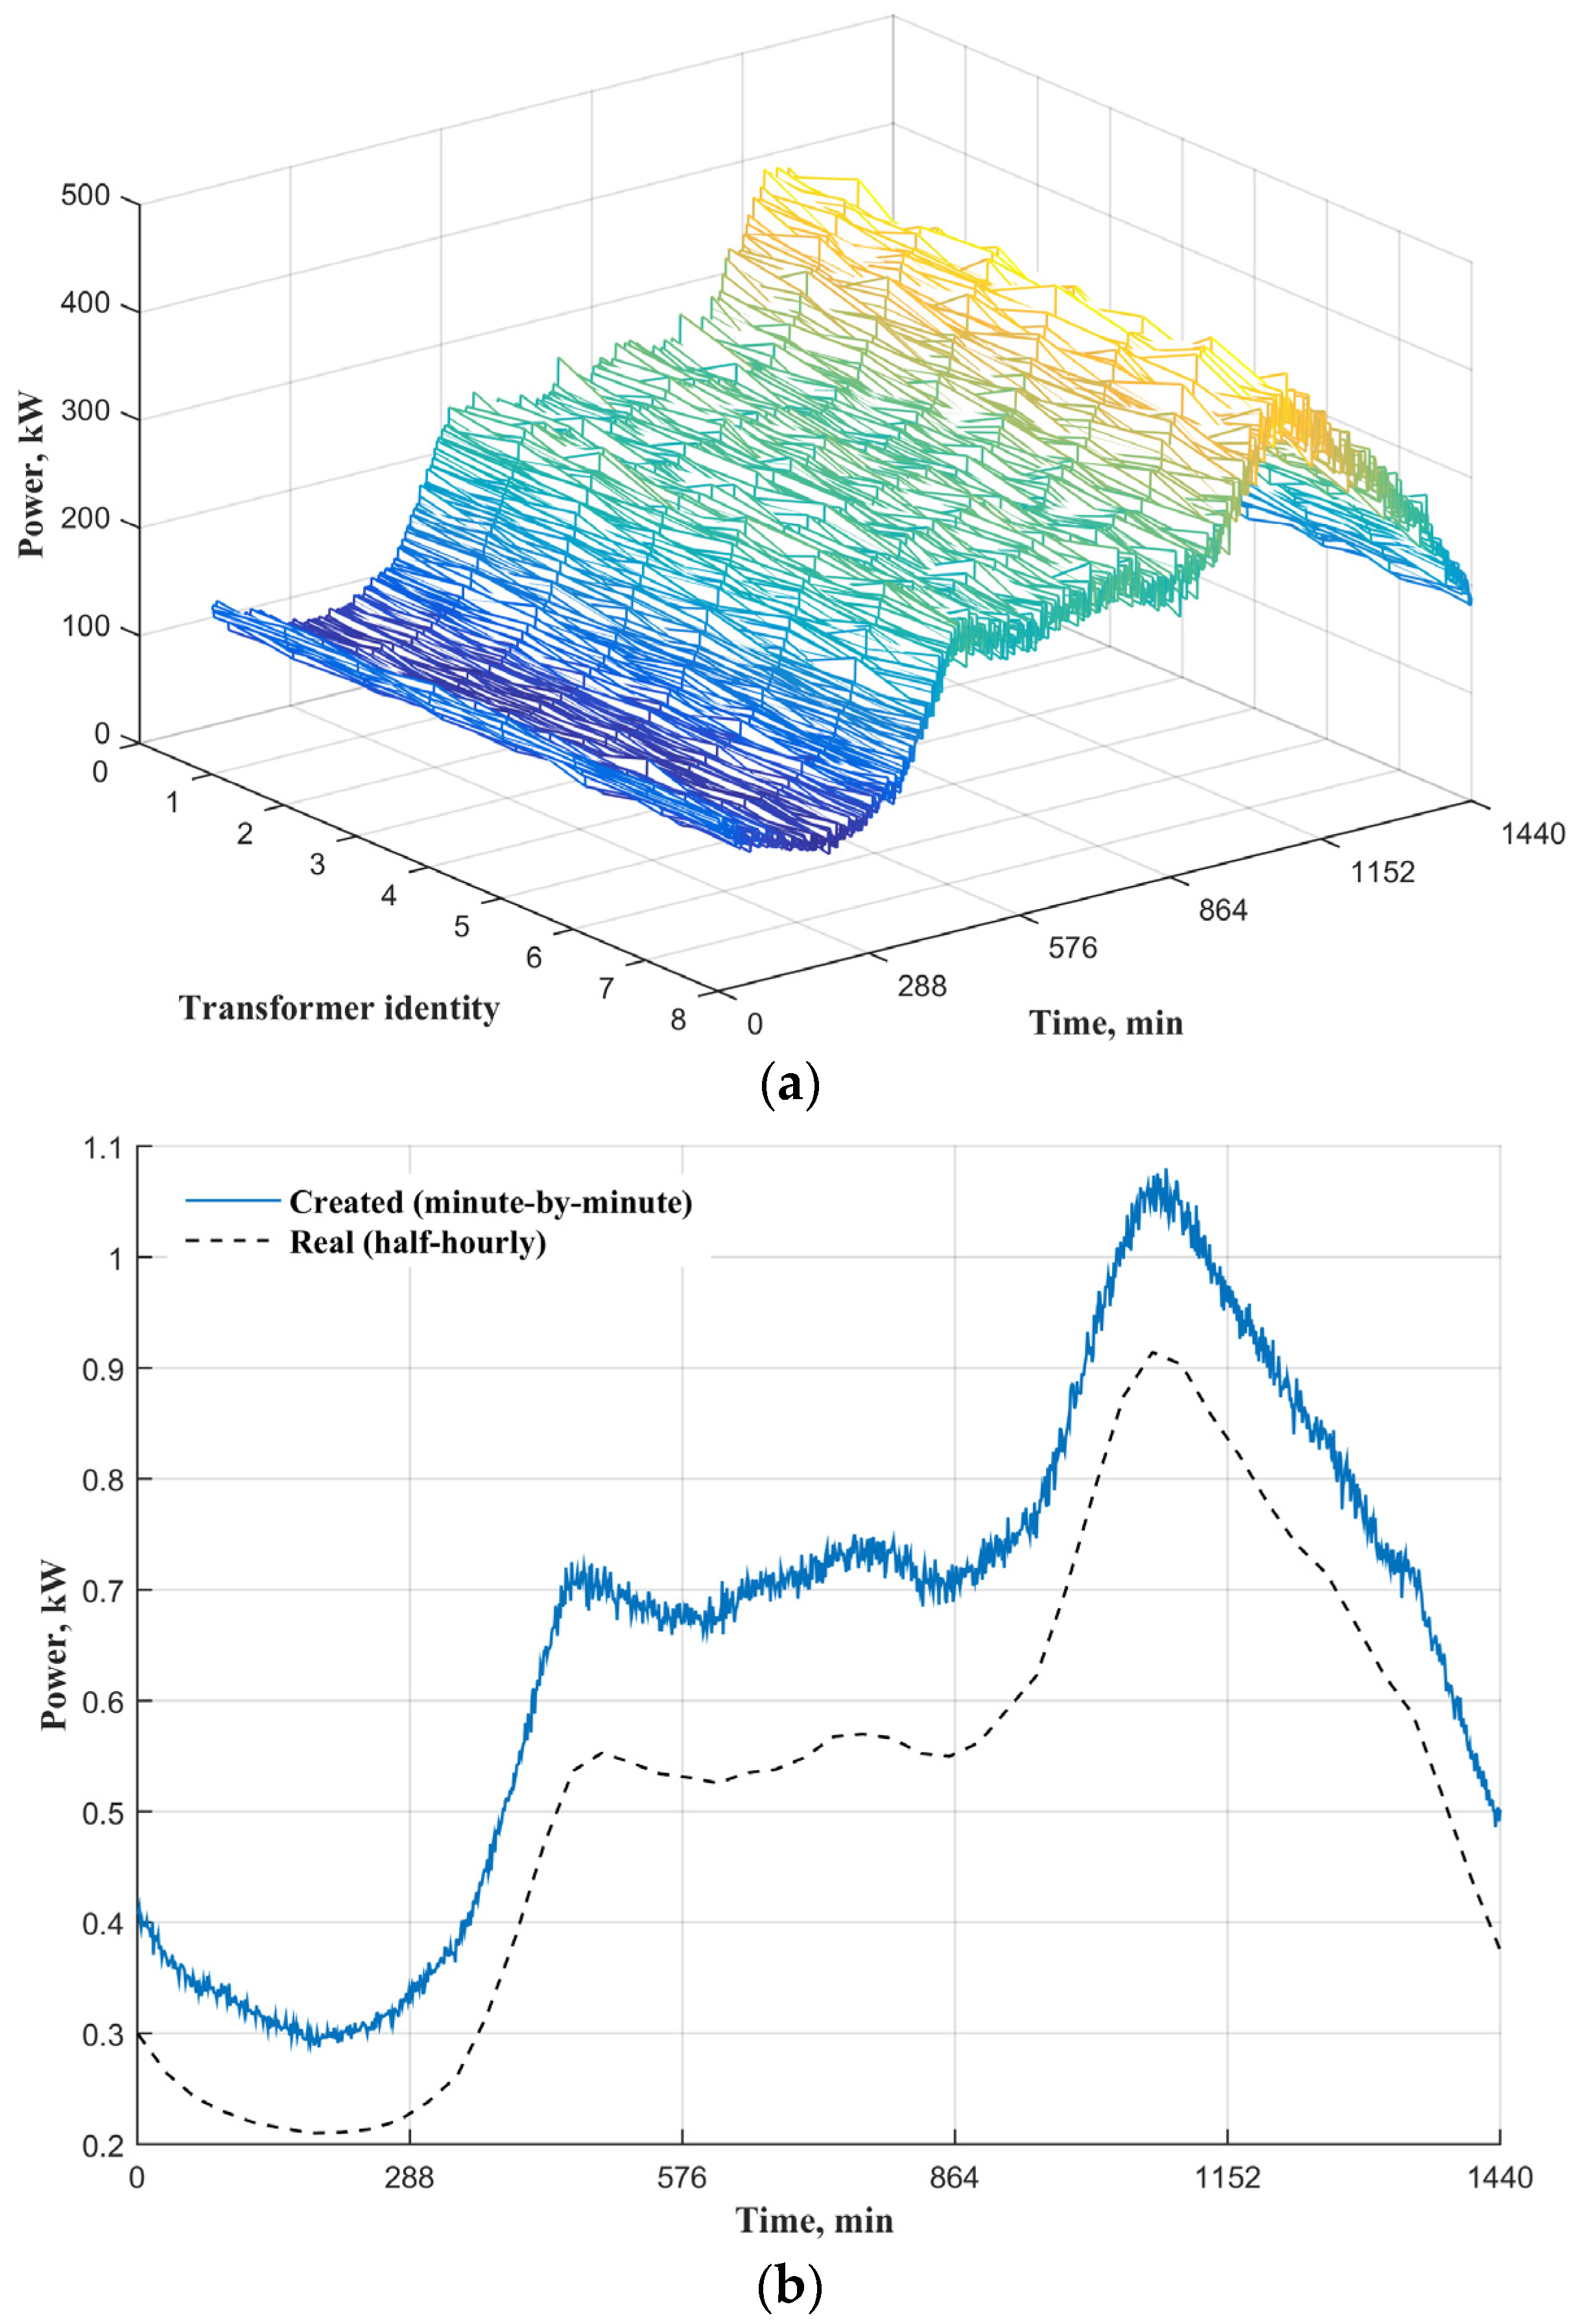
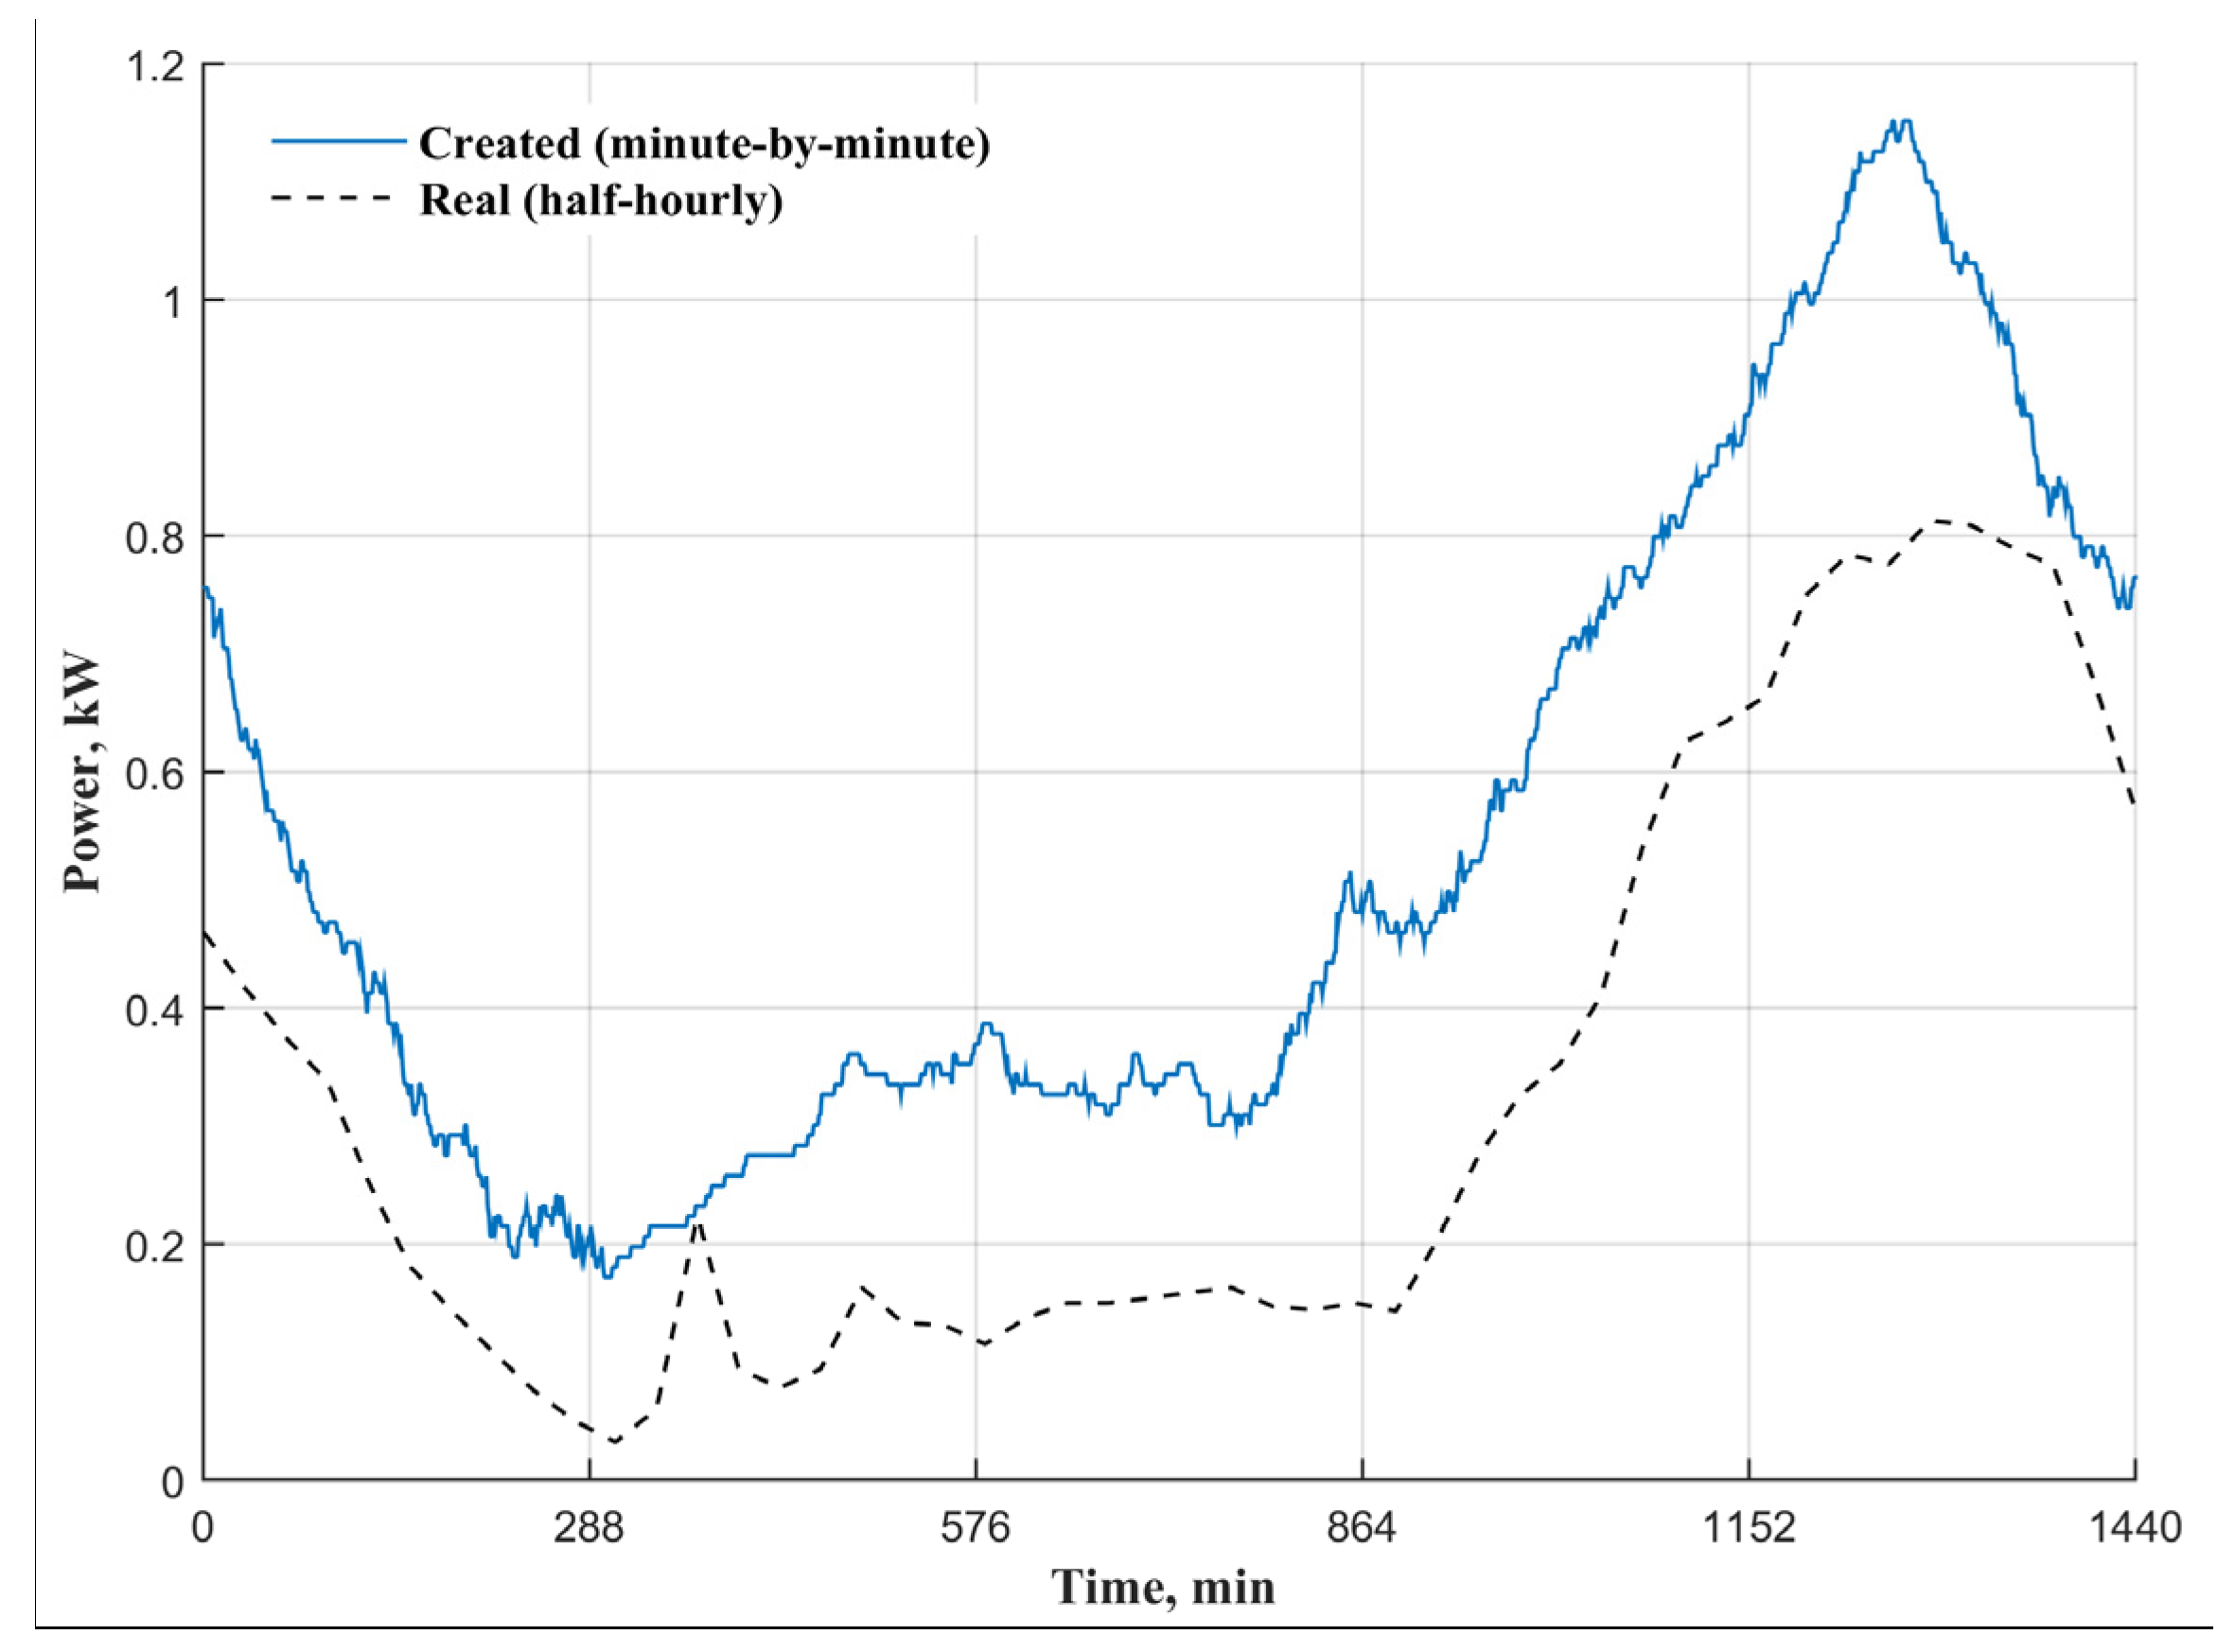
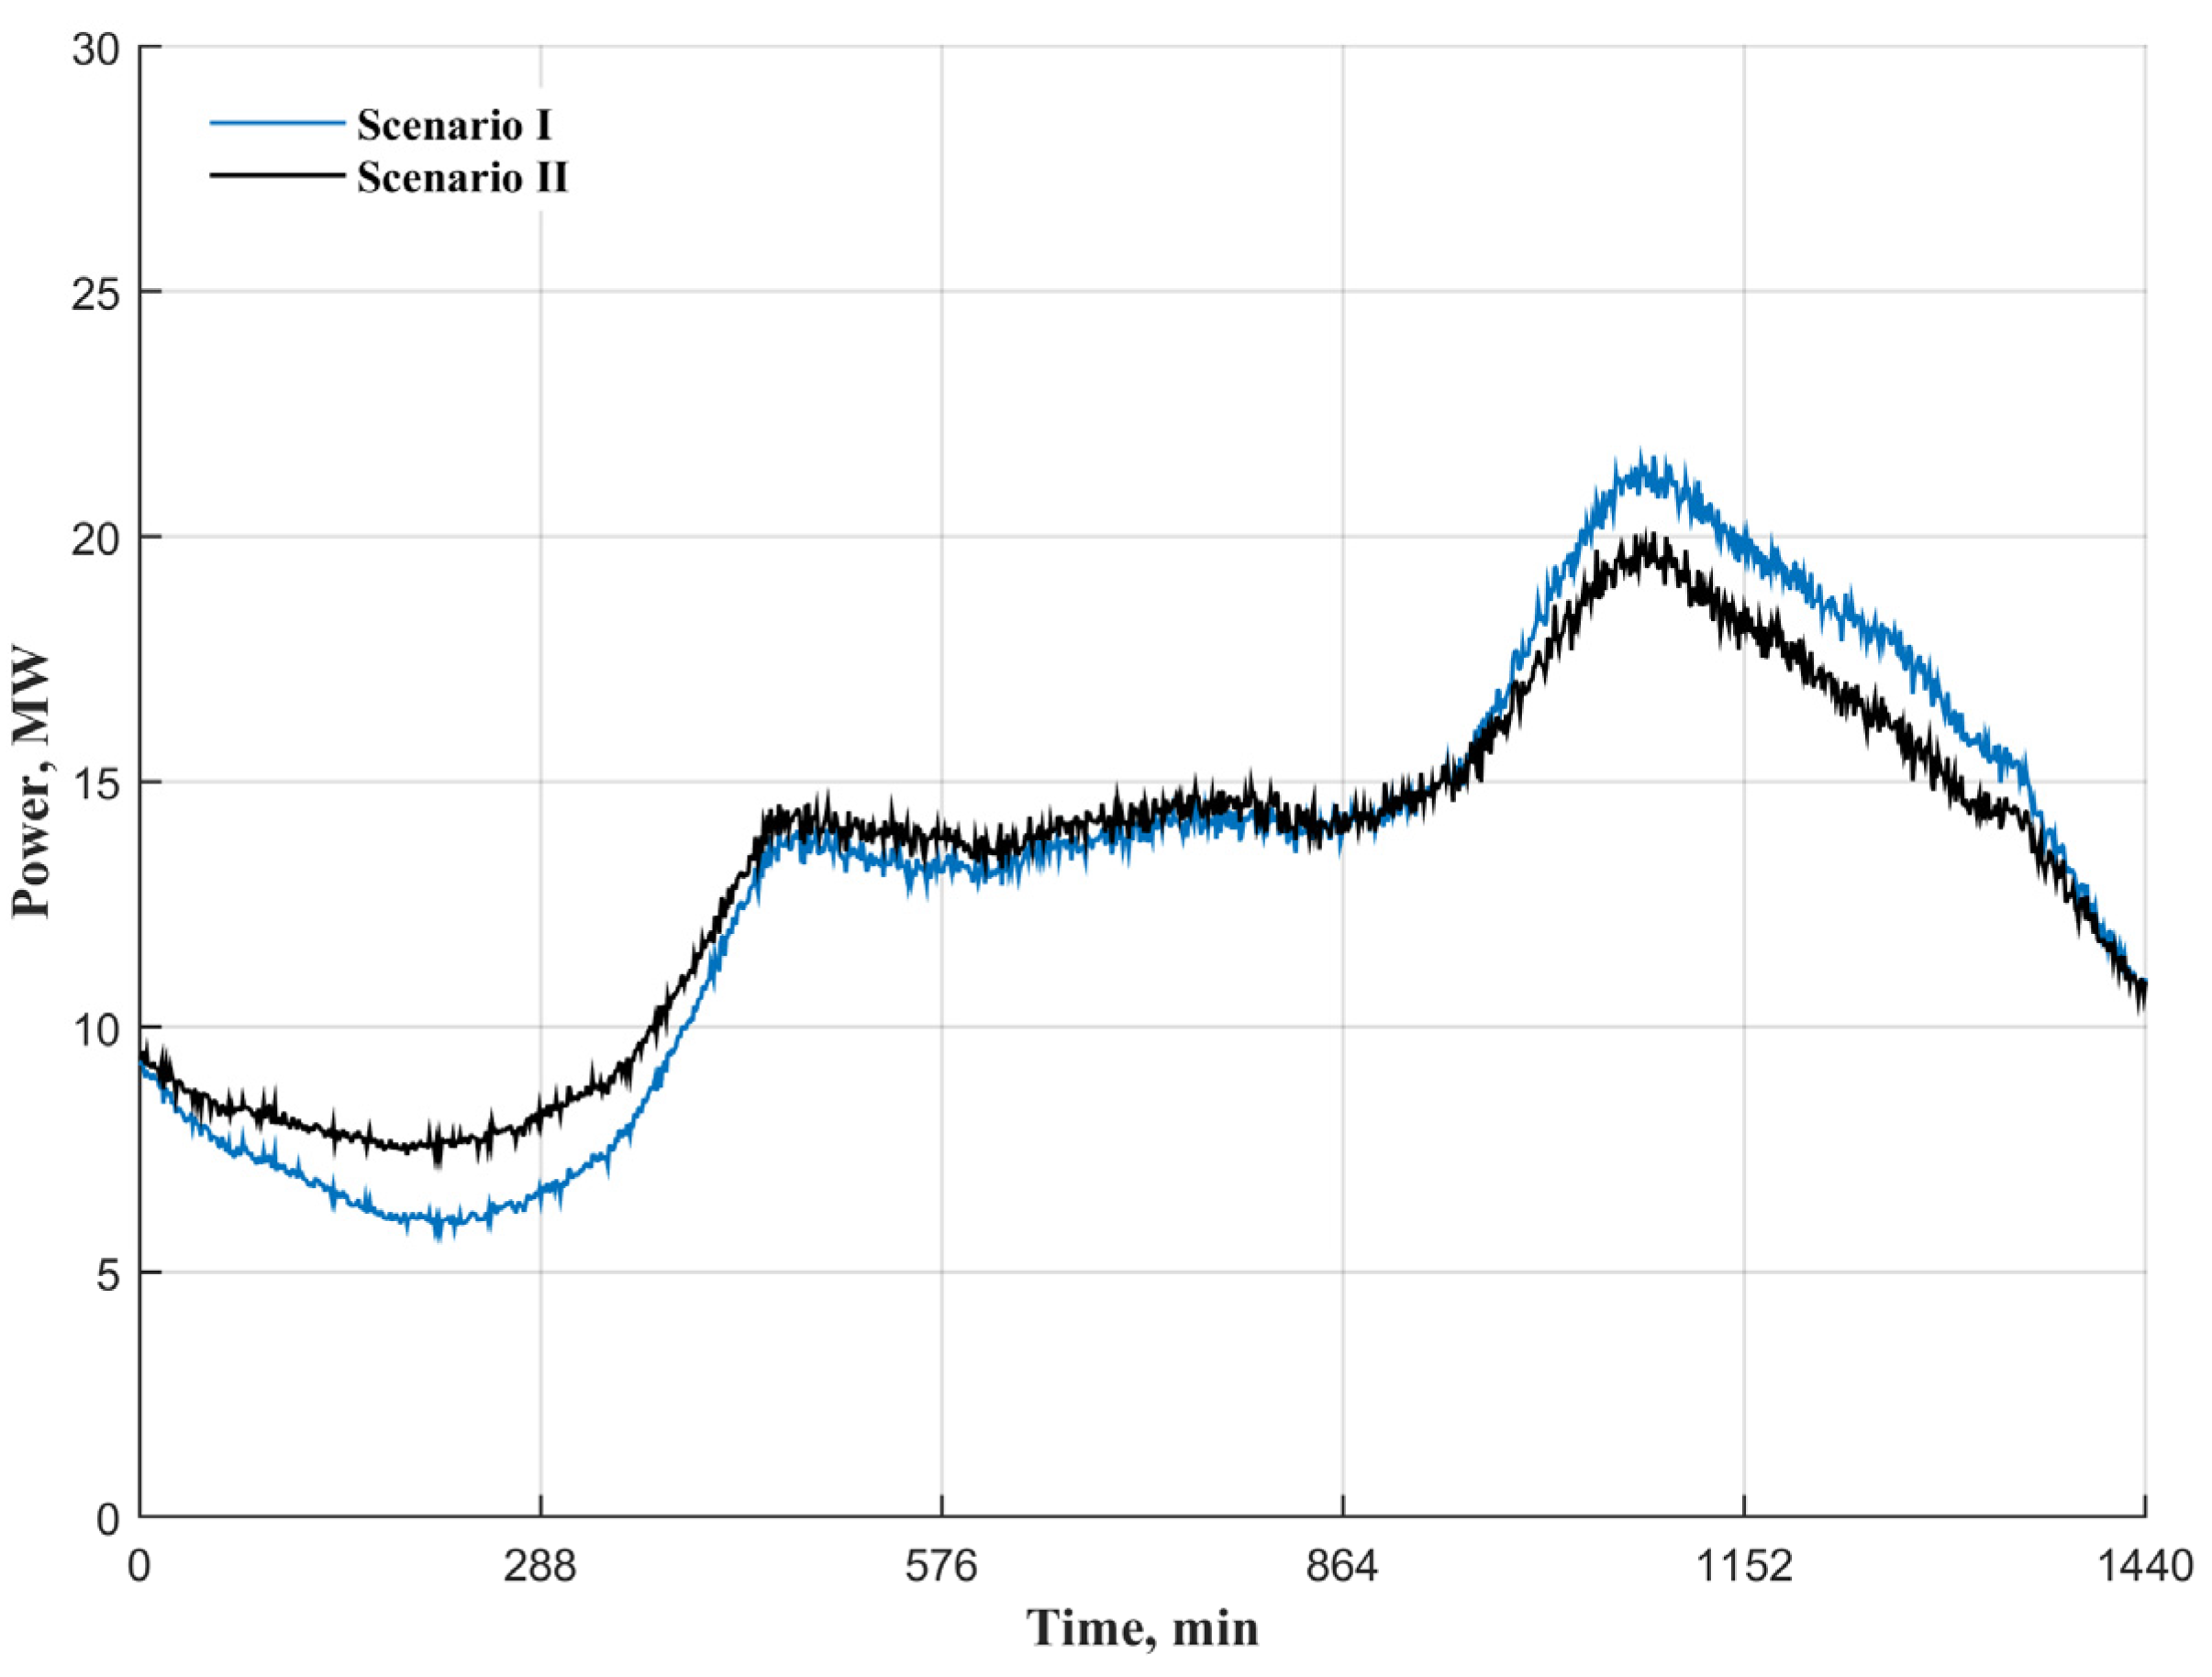
  • Scenario I (without smart allocation): 384 EVs at the distribution transformer T8 were charged, as modeled in Section 4.3.
  • Scenario II (with smart allocation): 384 EVs at T8 were charged with the centralized control algorithm. Equations (1)–(3), (12), (16)–(18), and (20) were used to model the considered network in a spreadsheet using Microsoft Excel. Equations (4)–(7) were used to assign the constraints of the solver used in Excel. Then, the objective function was solved using “GRG Nonlinear” in a matter of seconds. Simulation results were performed using an Intel® Core™ i7-4500U CPU, 1.80 GHz, 8.00 GB installed RAM laptop (LenovoTM, Hook, UK), operating with Microsoft Windows 10 Pro (Microsoft Corporation, Reading, UK, 2015). 64-bit operating system. MATLAB R2015a (R2015a, MathWorks, Cambridge, UK, 2015) was used to write the code for solving unbalanced power flow equations. Results were computed and visualized with a single MATLAB-script file in less than one minute. The constraints of the studied system were assigned according to the policy regulation for UK distribution networks as presented in the following subsections.

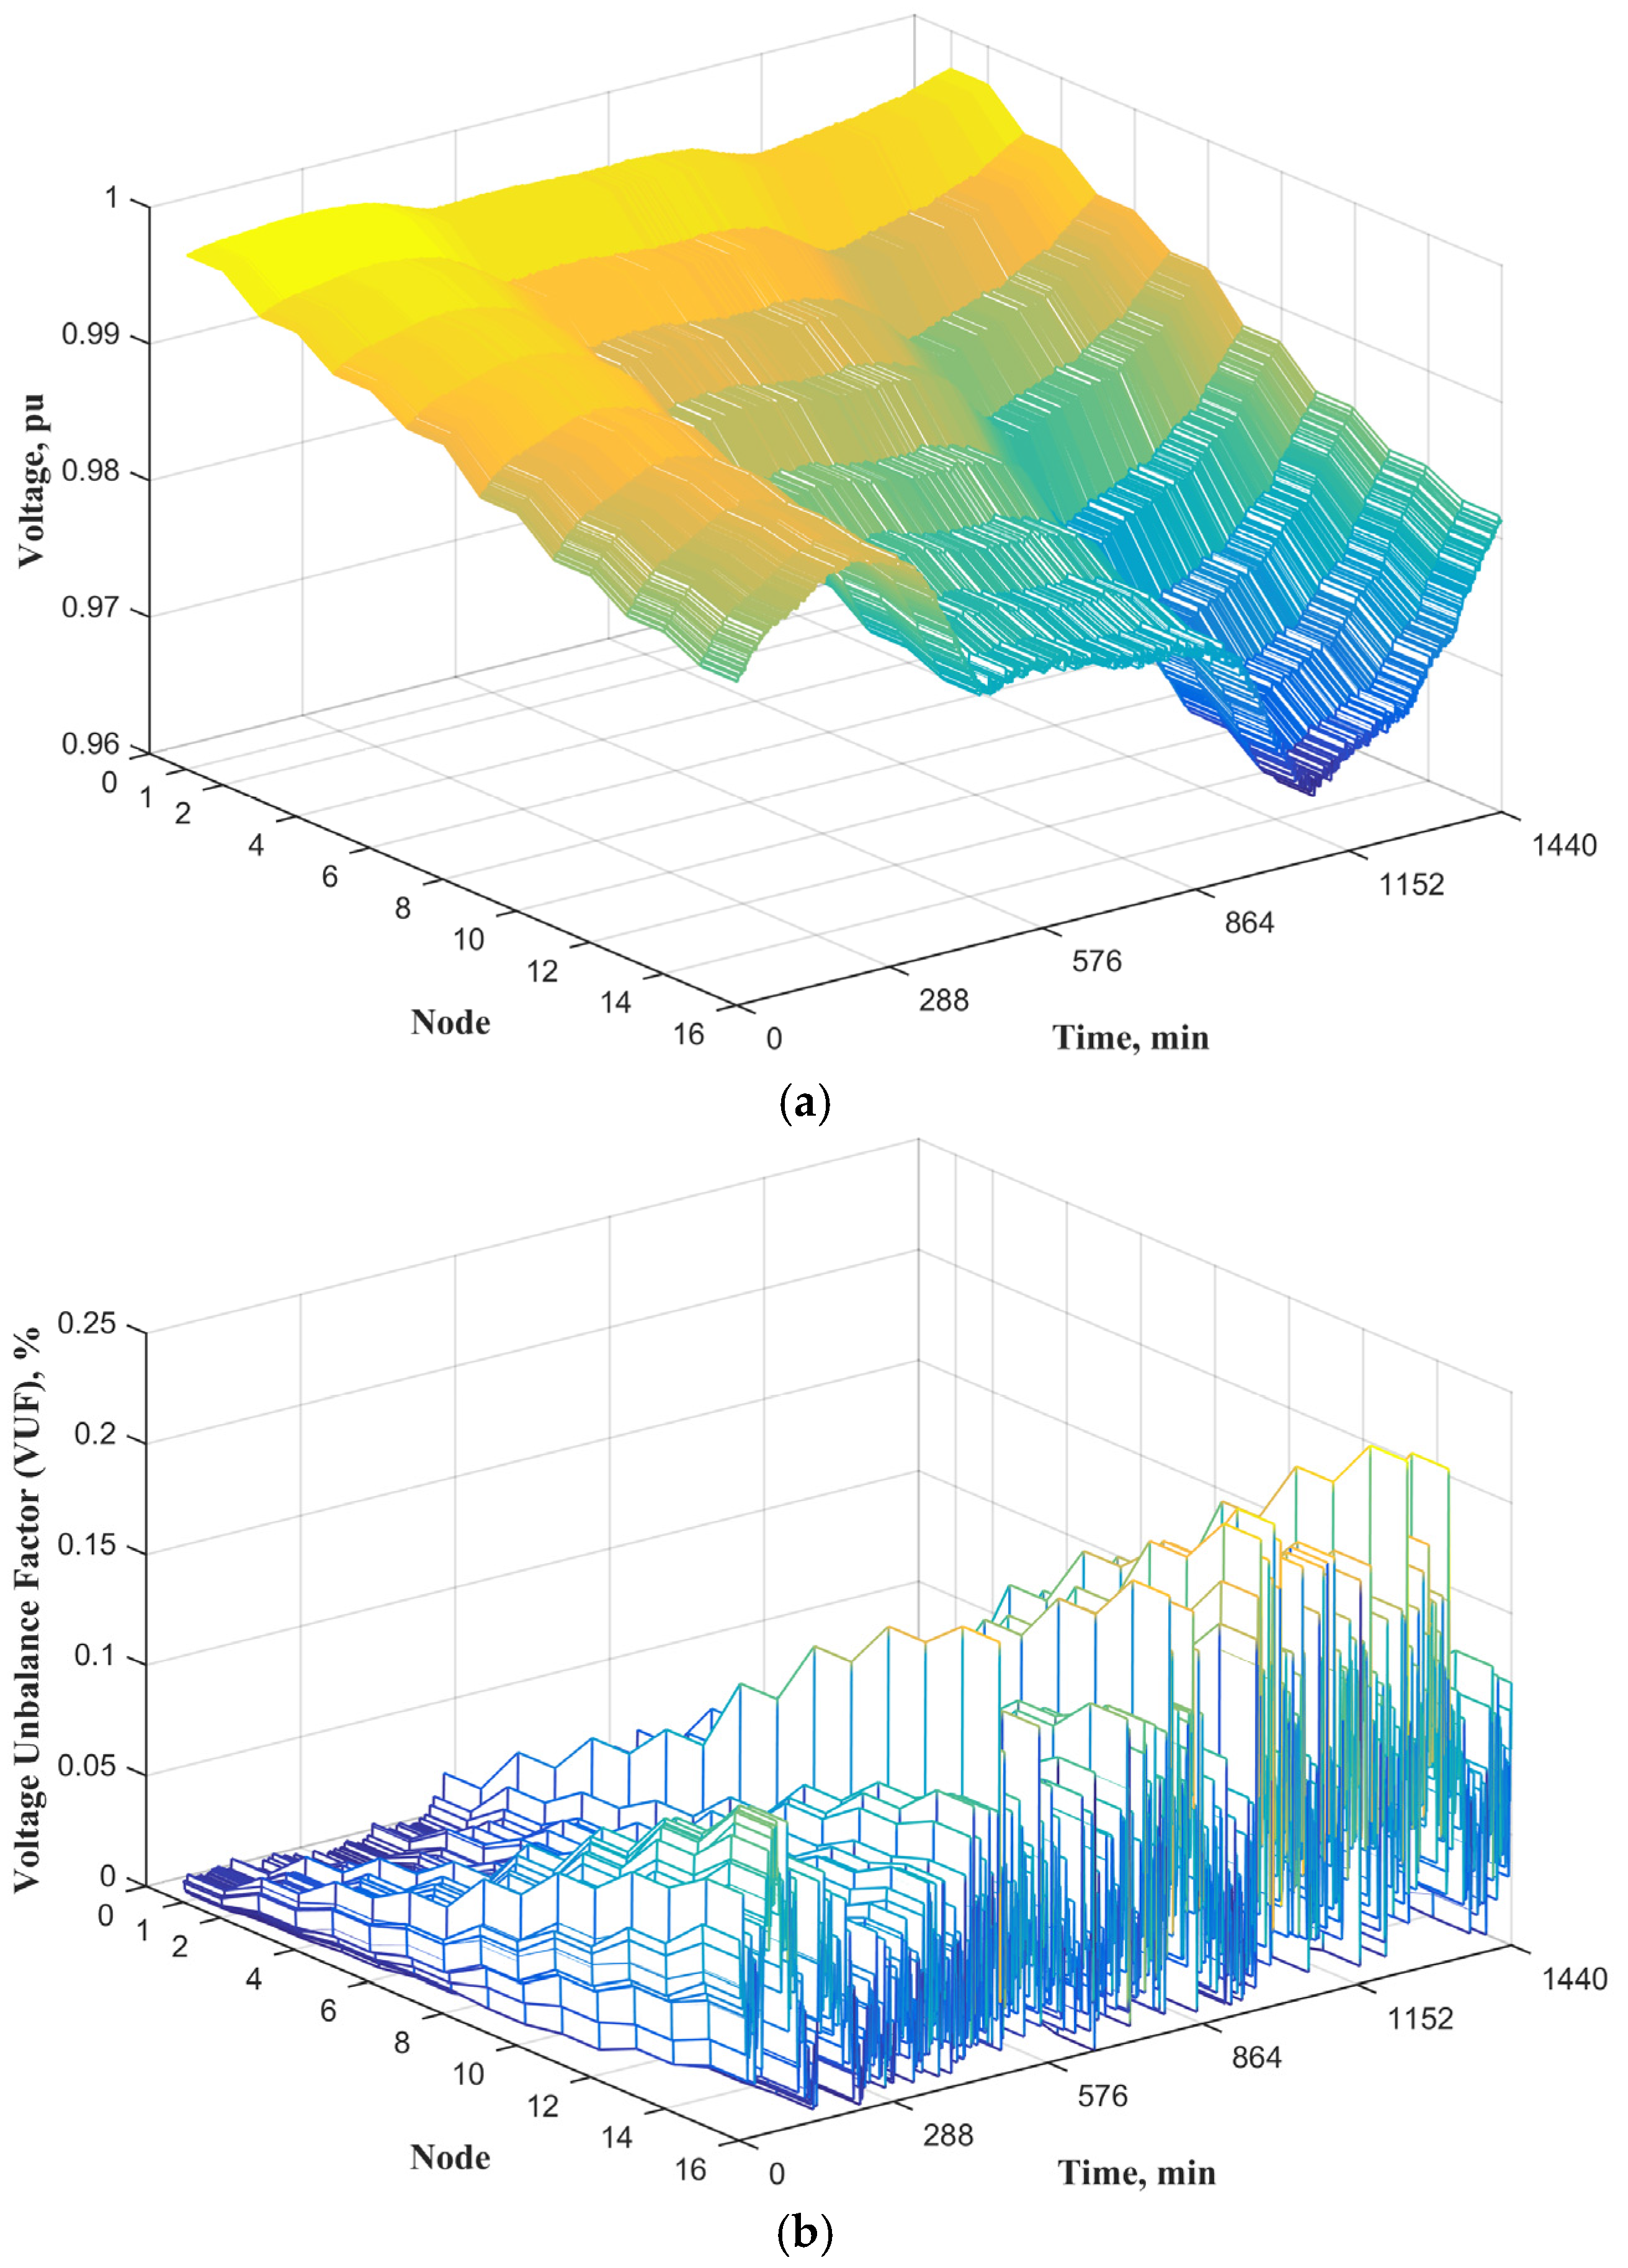
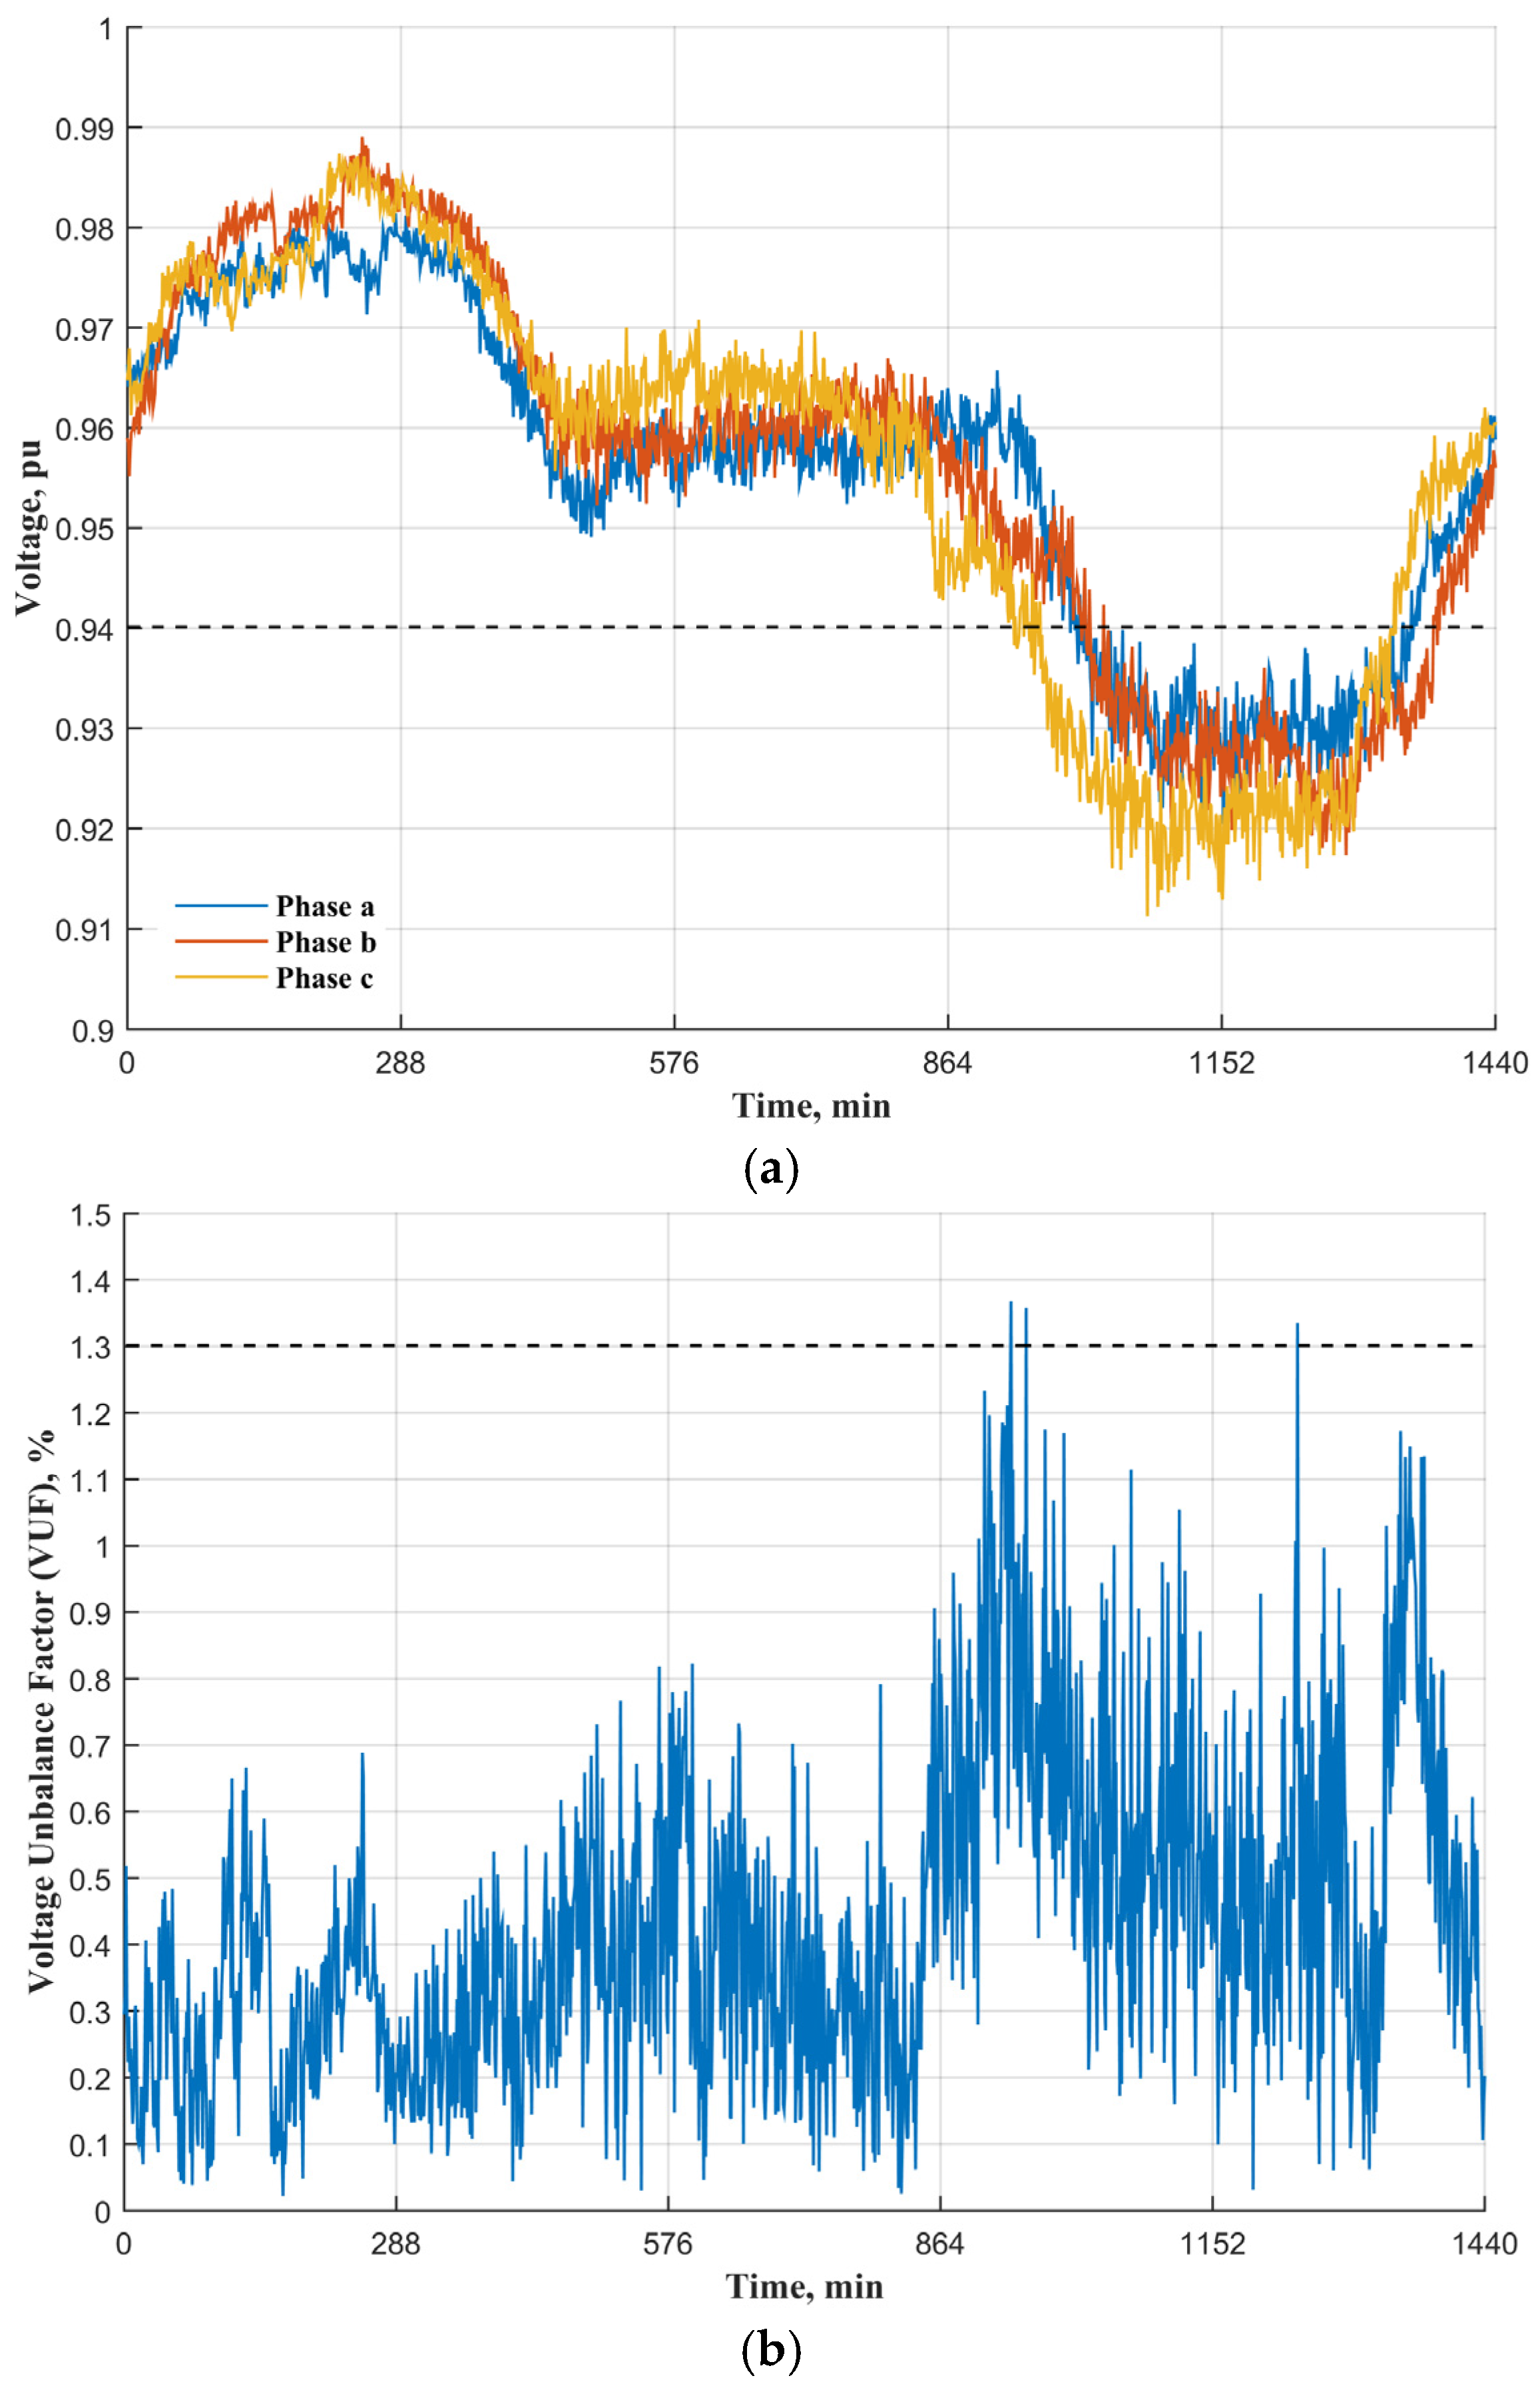
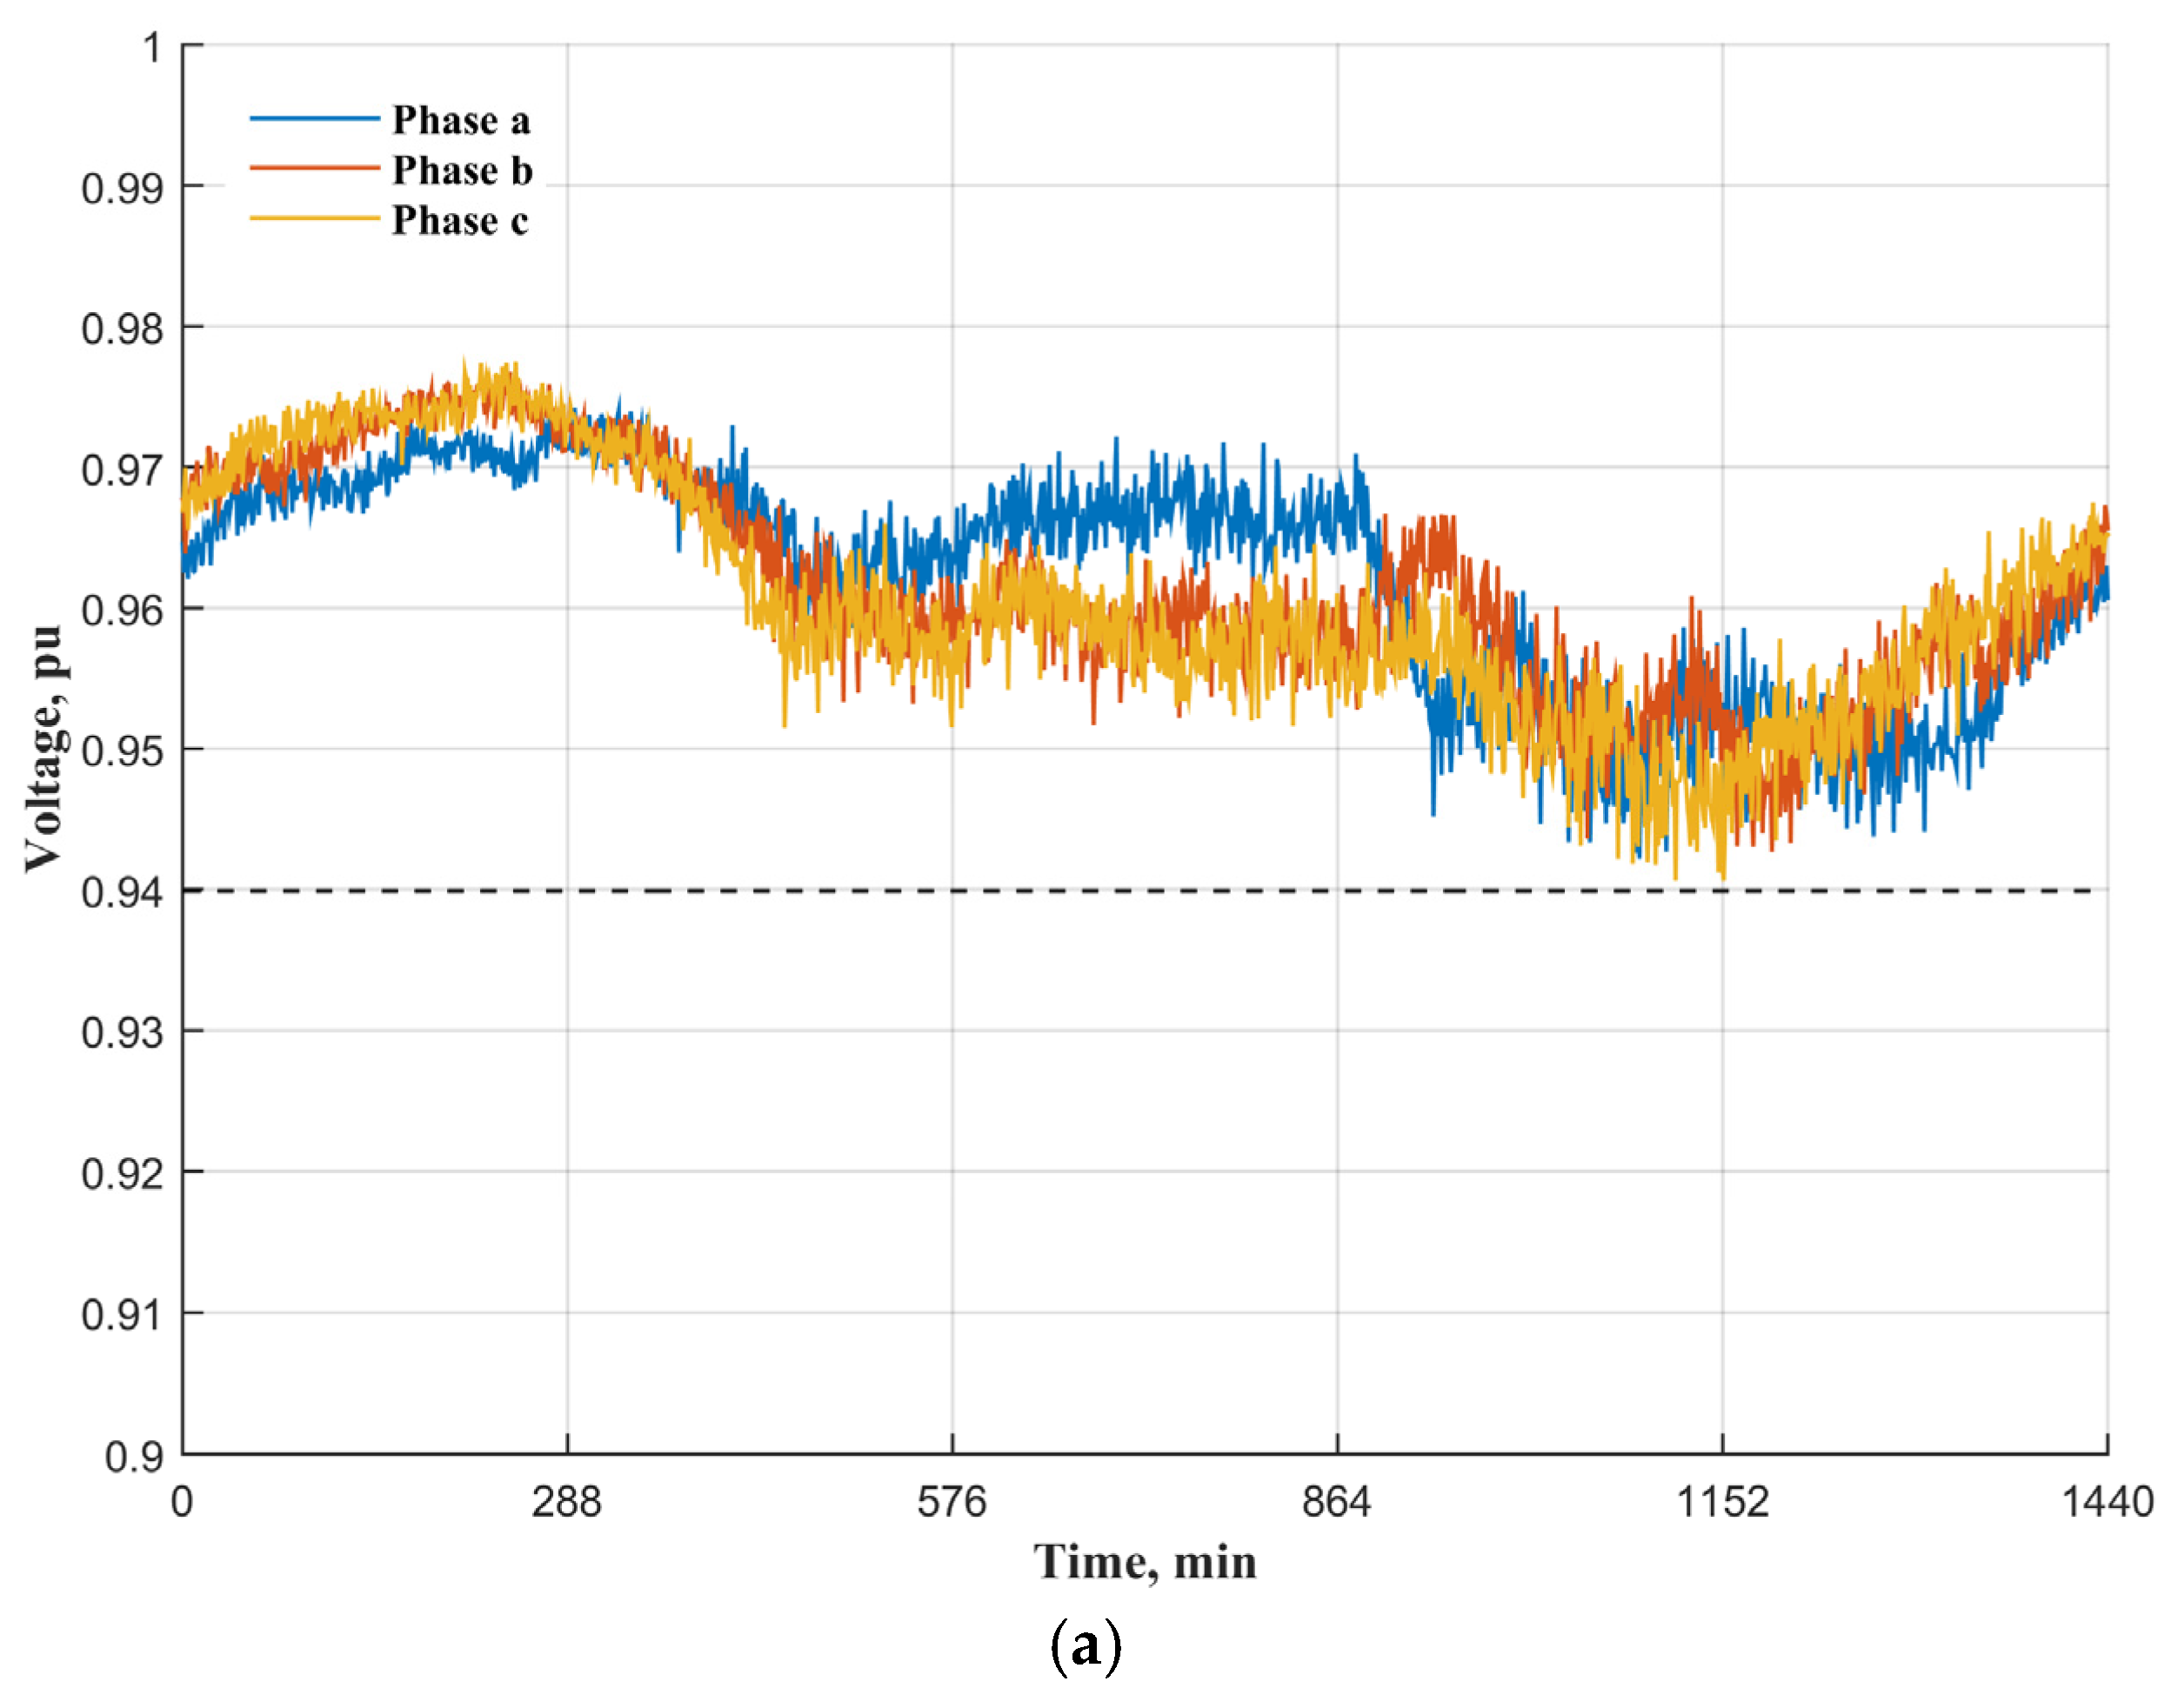
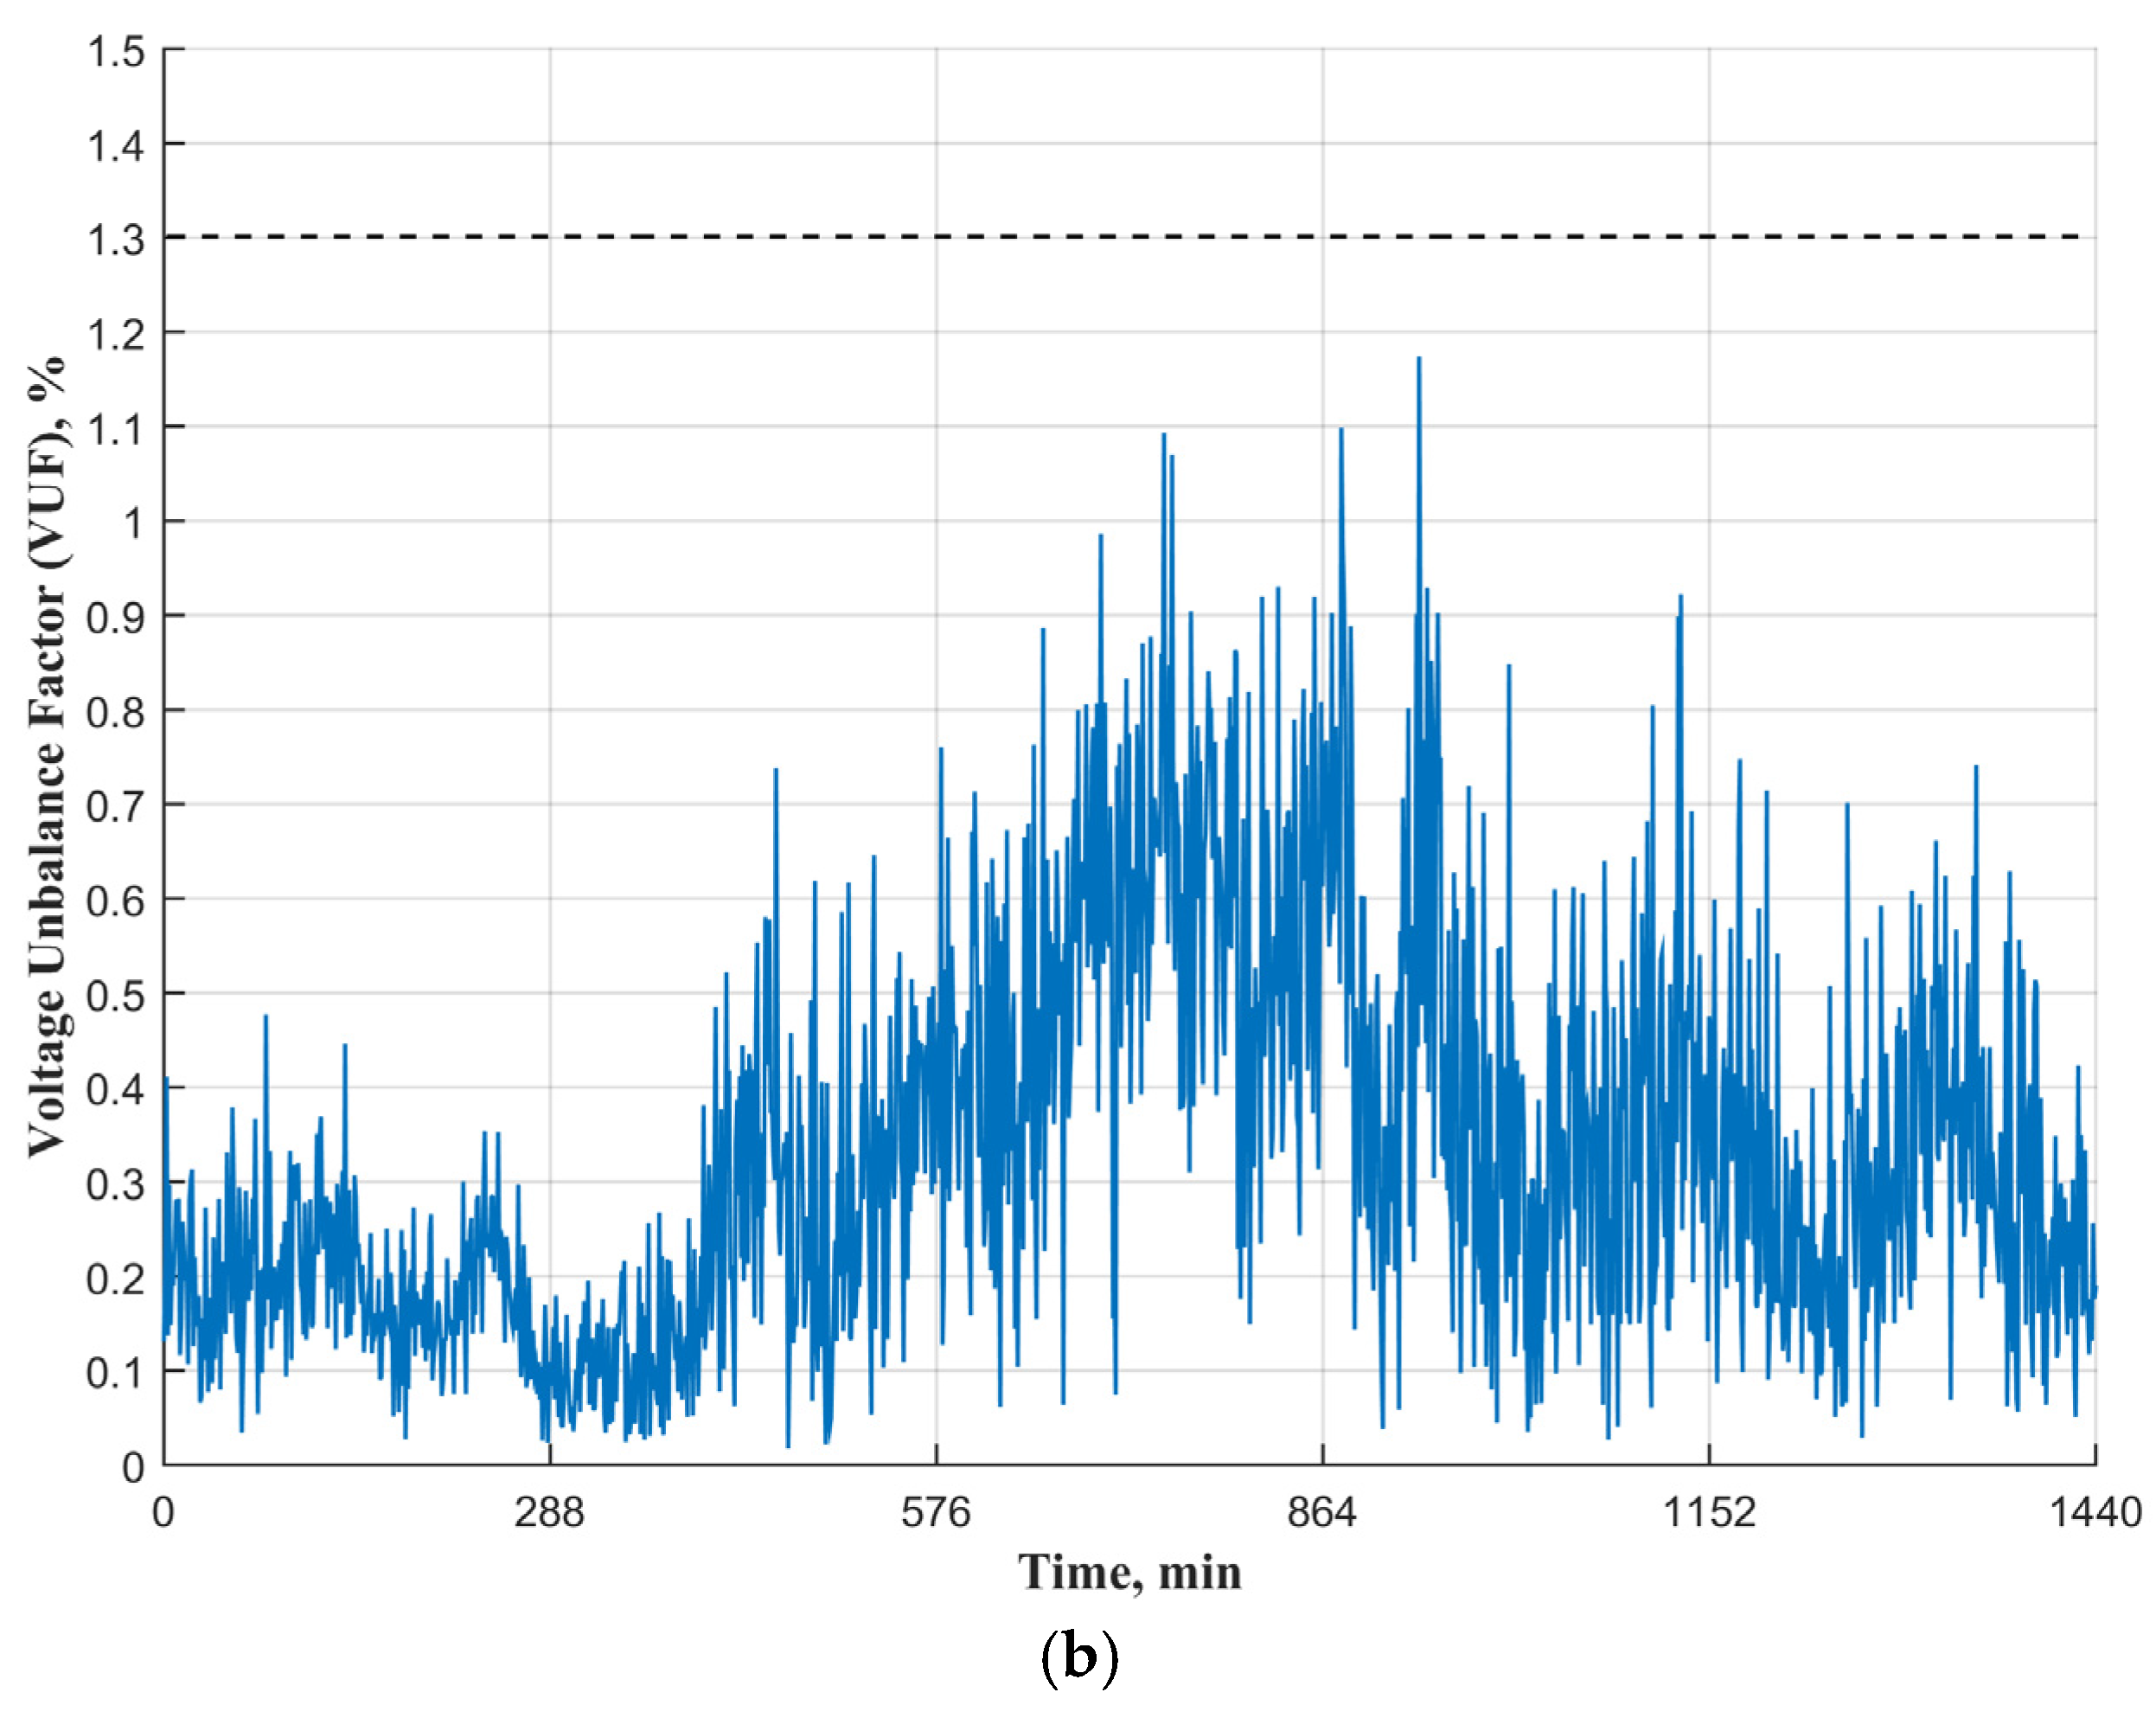
5.1. Voltage Magnitudes and Voltage Unbalances

Steady-state phase voltages and voltage unbalances was to be maintained within the limits. The upper and the lower limits of the voltage magnitude were assigned to be 1.06 pu and 0.94 pu, respectively, for the MV level. Meanwhile, these limits were adjusted to be between 1.1 pu and 0.94 pu, respectively, for the LV level [30,33]. The base voltage was assumed to be the nominal voltage (230 V). The V U F ( t ) n % was not to exceed 1.3% according to the Engineering Recommendations P29 [30]. A very high uptake of uncontrolled EVs was clustered at the transformer T8 as shown in Figure 2 (i.e., node 16 with 384 EVs). However, daily profiles of root mean square (RMS) voltages did not drop below the limit at the MV level, as shown in Figure 6a for Scenario I. In addition, voltage unbalances did not exceed the limit, as presented in Figure 6b. On the other hand, voltage magnitudes and voltage unbalances did exceed the limits at the LV side, as shown in Figure 7a,b, respectively. These undesired effects of EV charging loads were mitigated using the centralized control algorithm as demonstrated in Figure 8a,b, respectively.

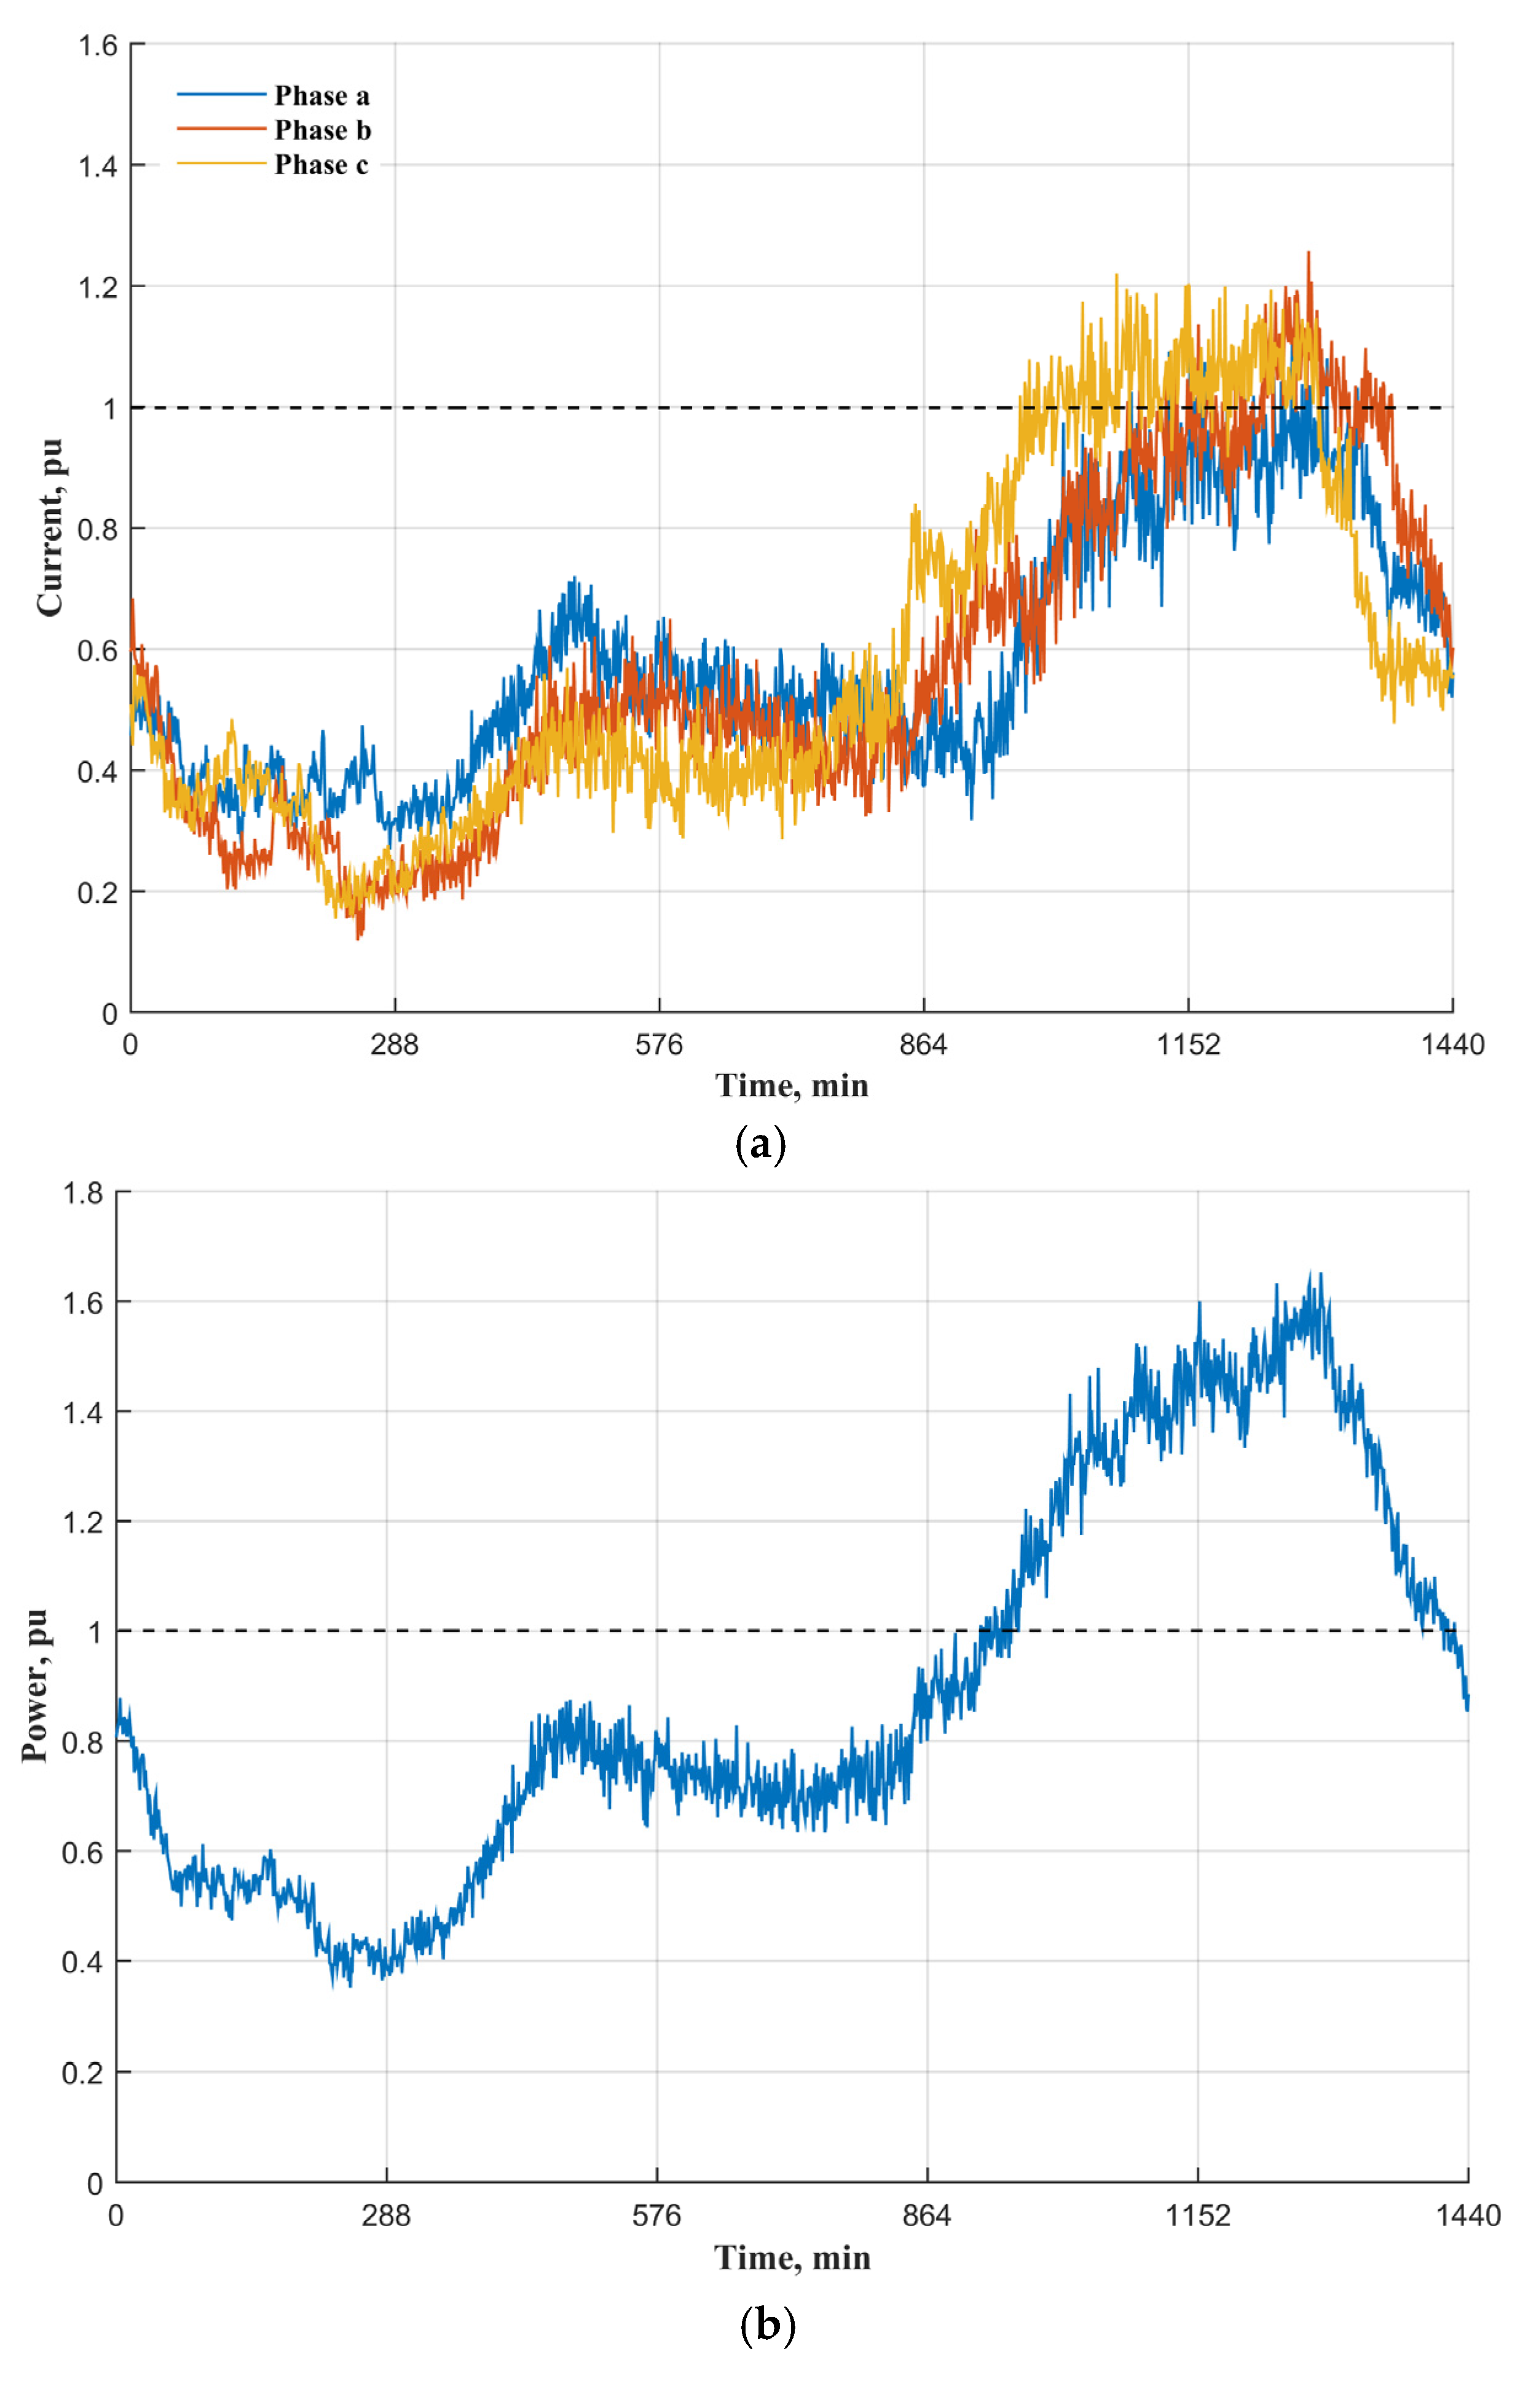
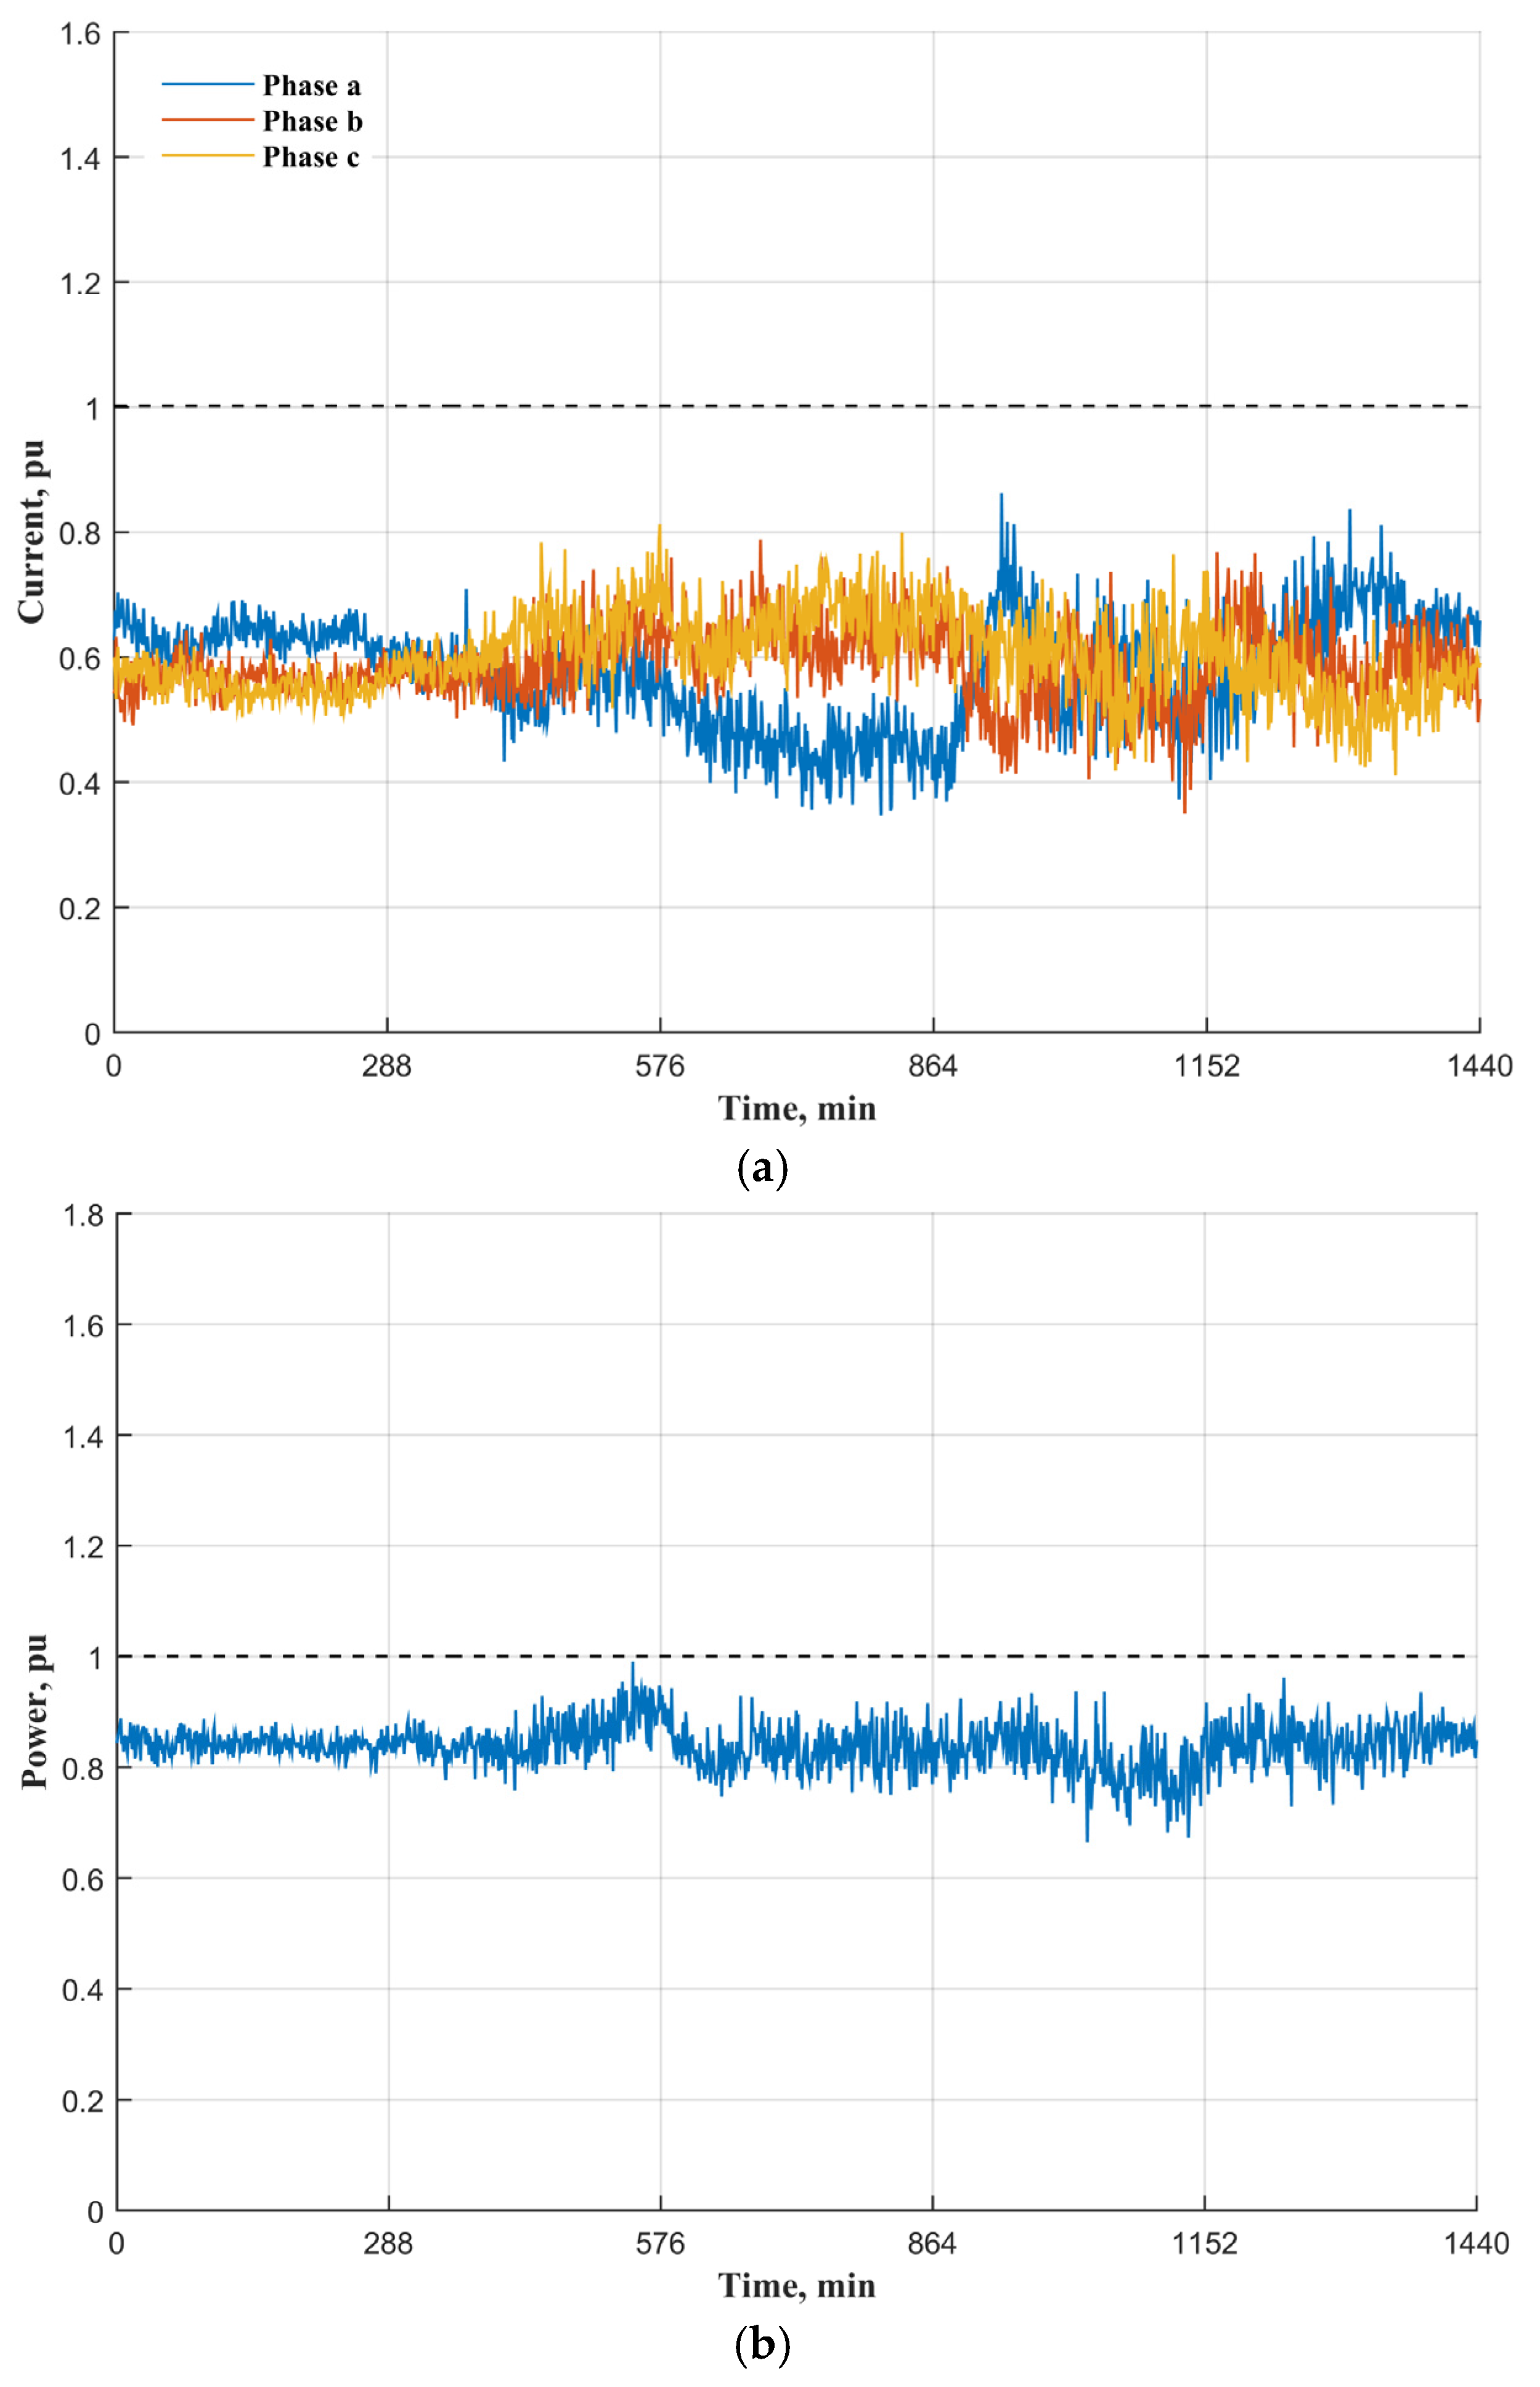
5.2. Limitations of Network Components

Daily profiles of phase currents were not to exceed the rated current of the distribution lines. Additionally, the distribution transformer was not to be overloaded beyond the rated apparent power. Base values were assigned according to the rated power of LV network components. These components were: 500 kVA distribution transformer and 185 mm2 underground cable [34]. Therefore, the limits of network components were I ( t ) a , b , cL 1 pu and S ( t ) Tr . loading 1 pu for the underground cable and distribution transformer, respectively. Figure 9 presents the daily profiles of the loading power at the main substations (i.e., the 15 MVA transformers) for the two scenarios. The considered EV charging loads had a small effect on the capacity of the MV transformers. However, these EV charging loads at the peak periods were reallocated at the suitable periods (Scenario II), as shown in Figure 9. In addition, Figure 9 shows how the fast-queuing time process can lead to the consistent reallocation of EV charging loads. Distribution transformer T8 and distribution line were significantly overloaded with uncoordinated EV charging loads (Scenario I), as depicted in Figure 10a,b. By the use of the centralized control algorithm, loading power of the underground cable and distribution transformer was maintained within the desired limits as shown in Figure 11a,b, respectively.

6. Conclusions

EV charging loads were coordinated via the proposed centralized control algorithm using unbalanced optimal power flow calculations. The non-iterative unbalanced power flow calculations were implemented to formulate the objective function. EV charging loads were reallocated according to the maximized charging power of EVs, while maintaining voltage magnitudes and voltage unbalances within their limits as well as avoiding overloading the distribution transformer and cable. Daily profiles of EV charging loads were modeled based on real datasets acquired from trials at the real project. Two scenarios were investigated to monitor the performance of the centralized control algorithm with uncontrolled and controlled EV charging loads. The results showed that network components at the MV level can cope with uncoordinated EV charging loads. However, high EV uptakes of uncoordinated charging loads can lead to the following issues at the LV level:
  • Deviating from the normal value of voltage magnitude and voltage unbalance.
  • Overloading the main distribution line and the distribution transformer.
These issues were mitigated by reallocating the EV charging loads via the centralized control algorithm with the non-linear programming (see Scenario II).
This control algorithm can be implemented to control other smart appliances. The centralized control algorithm may be adopted by distribution network operators to defer upgrading needs for network infrastructure (underground cables and distribution transformers) as can be easily integrated into existing power system control paradigms.

Acknowledgments

Mohammed Jasim M. Al Essa would like to gratefully acknowledge the financial support of the Ministry of Higher Education and Scientific Research of Iraq and University of Kufa for his Ph.D. study at Cardiff University.

Author Contributions

Mohammed Jasim M. Al Essa contributed to the paper by the overall framework and the research idea. The other author contributed to the paper by providing the network, the source for data used, and the overall supervision of this work.

Conflicts of Interest

The authors declare no conflict of interest.

References

  1. Element Energy. Pathways to high penetration of electric vehicles; Element Energy Limited: Cambridge, UK, 2013. [Google Scholar]
  2. Element Energy. Further Analysis of Data from the Household Electricity Usage Study: Correlation of Consumption with Low Carbon Technologies; Element Energy Limited: Cambridge, UK, 2014. [Google Scholar]
  3. Gonzalez Vaya, M.; Galus, M.D.; Waraich, R.A.; Andersson, G. On the Interdependence of Intelligent Charging Approaches for Plug-in Electric Vehicles in Transmission and Distribution Networks. In Proceedings of the 2012 3rd IEEE PES Innovation Smart Grid Technologies Europe (ISGT Europe), Berlin, Germany, 14–17 October 2012; pp. 1–8.
  4. Mu, Y.; Wu, J.; Jenkins, N.; Jia, H.; Wang, C. A Spatial—Temporal model for grid impact analysis of plug-in electric vehicles. Appl. Energy 2014, 114, 456–465. [Google Scholar] [CrossRef]
  5. Neaimeh, M.; Wardle, R.; Jenkins, A.M.; Yi, J.; Hill, G.; Lyons, P.F.; Hübner, Y.; Blythe, P.T.; Taylor, P.C. A probabilistic approach to combining smart meter and electric vehicle charging data to investigate distribution network impacts. Appl. Energy. in press.
  6. Xiong, J.; Wu, D.; Zeng, H.; Liu, S.; Wang, X. Impact Assessment of Electric Vehicle Charging on Hydro Ottawa Distribution Networks at Neighborhood Levels. In Proceedings of the IEEE 28th Canadian Conference on Electrical and Computer Engineering, Halifax, NS, Canada, 3–6 May 2015; pp. 1072–1077.
  7. Papadopoulos, P.; Skarvelis-Kazakos, S.; Grau, I.; Cipcigan, L.M.; Jenkins, N. Electric vehicles’ impact on British distribution networks. IET Transp. Electr. Syst. 2011, 2, 91–102. [Google Scholar] [CrossRef]
  8. Qian, K.; Zhou, C.; Yuan, Y. Electrical Power and Energy Systems Impacts of high penetration level of fully electric vehicles charging loads on the thermal ageing of power transformers. Int. J. Electr. Power Energy Syst. 2015, 65, 102–112. [Google Scholar] [CrossRef]
  9. Abdelsamad, S.F.; Morsi, W.G.; Sidhu, T.S. Probabilistic Impact of Transportation Electrification on the Loss-of-Life of Distribution Transformers in the Presence of Rooftop Solar Photovoltaic. IEEE Trans. Sustain. Energy 2015, 6, 1565–1573. [Google Scholar] [CrossRef]
  10. Fernández, L.P.; Gómez, T.; Román, S.; Cossent, R.; Domingo, C.M.; Frías, P. Assessment of the Impact of Plug-in Electric Vehicles on Distribution Networks. IEEE Trans. Power Sytems. 2011, 26, 206–213. [Google Scholar] [CrossRef]
  11. Liu, Z.; Chen, C.; Yuan, J. Hybrid Energy Scheduling in a Renewable Micro Grid. Appl. Sci. 2015, 5, 516–531. [Google Scholar] [CrossRef]
  12. Honarmand, M.; Zakariazadeh, A.; Jadid, S. Self-scheduling of electric vehicles in an intelligent parking lot using stochastic optimization. J. Franklin Inst. 2014, 352, 449–467. [Google Scholar] [CrossRef]
  13. Zakariazadeh, A.; Jadid, S.; Siano, P. Multi-objective scheduling of electric vehicles in smart distribution system. Energy Convers. Manag. 2014, 79, 43–53. [Google Scholar] [CrossRef]
  14. Ortega-vazquez, M.A. Optimal scheduling of electric vehicle charging and vehicle-to-grid services at household level including battery degradation and price uncertainty. IET Gener. Transm. Distrib. 2014, 8, 1007–1016. [Google Scholar] [CrossRef]
  15. Papadopoulos, P.; Jenkins, N.; Cipcigan, L.M.; Grau, I.; Zabala, E. Coordination of the charging of electric vehicles using a multi-agent system. IEEE Trans. Smart Grid 2013, 4, 1802–1809. [Google Scholar] [CrossRef]
  16. Hua, L.; Wang, J.; Zhou, C. Adaptive electric vehicle charging coordination on distribution network. IEEE Trans. Smart Grid 2014, 5, 2666–2675. [Google Scholar]
  17. Deilami, S.; Masoum, A.S.; Moses, P.S.; Masoum, M.A.S. Real-time coordination of plug-in electric vehicle charging in smart grids to minimize power losses and improve voltage profile. IEEE Trans. Smart Grid 2011, 2, 456–467. [Google Scholar] [CrossRef]
  18. Masoum, A.S.; Deilami, S.; Abu-Siada, A.; Masoum, M.A.S. Fuzzy approach for online coordination of plug-in electric vehicle charging in smart grid. IEEE Trans. Sustain. Energy 2015, 6, 1112–1121. [Google Scholar] [CrossRef]
  19. De Hoog, J.; Alpcan, T.; Brazil, M.; Thomas, D.A.; Mareels, I. Optimal charging of electric vehicles taking distribution network constraints into account. IEEE Trans. Power Sytems. 2015, 30, 365–375. [Google Scholar] [CrossRef]
  20. Evora, J.; Hernandez, J.J.; Barbosa, D.; Nazareno, P.; Sampaio, M. Agent-based modeling for designing an EV charging distribution systems: A case study in Salvador of Bahia. In Proceedings of the European Simulation and Modelling Conference, University of Porto, Porto, Portugal, 22–24 October 2014.
  21. Mocci, S.; Natale, N.; Pilo, F.; Ruggeri, S. Demand side integration in LV smart grids with multi-agent control system. Electr. Power Syst. Res. 2015, 125, 23–33. [Google Scholar] [CrossRef]
  22. Unda, G.; Papadopoulos, P.; Skarvelis-kazakos, S.; Cipcigan, L.M.; Jenkins, N.; Zabala, E. Management of electric vehicle battery charging in distribution networks with multi-agent systems. Electr. Power Syst. Res. 2014, 110, 172–179. [Google Scholar] [CrossRef]
  23. Yang, Z.; Li, K.; Foley, A.; Zhang, C. Optimal Scheduling Methods to Integrate Plug-in Electric Vehicles with the Power System: A Review. In Proceedings of the 19th IFAC World Congress, Cape Town, South Africa, 24–29 August 2014; pp. 8594–8603.
  24. Yang, Z.; Li, K.; Foley, A. Computational scheduling methods for integrating plug-in electric vehicles with power systems: A review. Renew. Sustain. Energy Rev. 2015, 51, 396–416. [Google Scholar] [CrossRef]
  25. Derek, S. Real-Time Mobile Communication of Power Requirements for Electric Vehicles. Technol. Innov. Manage. Rev. 2012, 2, 22–27. [Google Scholar]
  26. Organisation for Economic Co-operation and Development/International Energy Agency (OECD/IEA). How 2 Guide for Smart Grids in Distribution Networks Roadmap Development and Implementation; International Energy Agency: Paris, France, 2015. [Google Scholar]
  27. Masoum, A.S.; Deilami, S.; Moses, P.S.; Masoum, M.A.S.; Abu-Siada, A. Smart load management of plug-in electric vehicles in distribution and residential networks with charging stations for peak shaving and loss minimisation considering voltage regulation. IET Gener. Transm. Distrib. 2011, 5, 877–888. [Google Scholar] [CrossRef]
  28. Navarro-espinosa, A.; Ochoa, L.F. Probabilistic impact assessment of low carbon technologies in LV distribution systems. IEEE Trans. Power Sytems. in press.
  29. Kersting, W.H. Distribution System Modeling and Analysis; CRC Press LLC: Boca Raton, FL, USA, 2002; pp. 271–285. [Google Scholar]
  30. Ingram, S.; Probert, S.; Jackson, K. The Impact of Small Scale Embedded Generation on the Operating Parameters of Distribution Networks; PB Power, Department of Trade and Industry (DTI): London, UK, 2003. [Google Scholar]
  31. Customer-Led Led Network Revolution Project. Available online: http://www.networkrevolution.co.uk/customer-trials/ (accessed on 28 January 2016).
  32. Pasaoglu, G.; Fiorello, D.; Martino, A.; Scarcella, G.; Alemanno, A.; Zubaryeva, A.; Thiel, C. Driving and parking patterns of European car drivers—A mobility survey; Joint Research Centre: ZG Petten, The Netherlands, 2012. [Google Scholar]
  33. Department of Trade and Industry. The electricity safety, quality and continuity regulations; Stationary Office: London, UK, 2002.
  34. Haggis, T. Network Design Manual; E.ON Central Networks: Coventry, UK, 2006. [Google Scholar]
Figure 1. The flow chart of the centralized control algorithm.
Applsci 06 00053 g001
Figure 2. The proposed architecture of the centralized controller.
Applsci 06 00053 g002
Figure 3. Profiles of, (a) the aggregated load of 384 customers for each low voltage (LV) transformer, (b) the daily mean of real and generated loads.
Applsci 06 00053 g003
Figure 4. The daily mean profiles of the real/synthesized electric vehicle (EV) charging loads.
Applsci 06 00053 g004
Figure 5. The pattern of the synthesized 384 EV charging loads during a day.
Applsci 06 00053 g005
Figure 6. UK generic distribution network (UKGDN) daily profiles of Scenario I with (a) root mean square (RMS) voltages at each node of the medium voltage (MV) feeder; (b) voltage unbalance at each node of the MV feeder.
Applsci 06 00053 g006
Figure 7. UKGDN daily profiles of Scenario I with (a) phase voltages at node 18; (b) voltage unbalance at node 18.
Applsci 06 00053 g007
Figure 8. UKGDN daily profiles of Scenario II with (a) phase voltage at node 18; (b) voltage unbalance at node 18.
Applsci 06 00053 g008aApplsci 06 00053 g008b
Figure 9. UKGDN daily load profiles at the main substations (the MV transformers) for Scenario I and II, respectively.
Applsci 06 00053 g009
Figure 10. Scenario I UKGDN daily profiles (a) phase currents of the underground cable between nodes 17 and 18; (b) loading power of the transformer T8.
Applsci 06 00053 g010
Figure 11. Scenario II UKGDN daily profiles (a) phase currents of the underground cable between node 17 and node 18; (b) loading power of the transformer T8.
Applsci 06 00053 g011

