Article

Reliability Evaluation of a PSC Highway Bridge Based on Resistance Capacity Degradation Due to a Corrosive Environment

School of Civil and Environmental Engineering, Yonsei University, 50 Yonsei-ro Seodaemun-gu, Seoul 03722, Korea
*
Author to whom correspondence should be addressed.
Appl. Sci. 2016, 6(12), 423; https://doi.org/10.3390/app6120423
Submission received: 8 November 2016 / Revised: 6 December 2016 / Accepted: 7 December 2016 / Published: 10 December 2016

Abstract

:
This paper presents a method for evaluating the reliability of an in-service highway bridge that considers the resistance capacity loss due to various corrosive environments. To demonstrate the application of the suggested method, a pre-stressed concrete-I (PSC-I) type girder was selected as a sample bridge. An analytical procedure was developed to quantitatively evaluate the performance degradation of a PSC-I girder bridge considering the traffic conditions, corrosive environment, and crack damage. The bridge performance was evaluated by considering traffic conditions, including the annual average daily traffic volume, heavy vehicle volume, and corrosive environment (mild, normal, and severe). To calculate the resistance capacity, all variables regarding the materials and sections were considered through probabilistic variances, Monte Carlo simulation, and the statistical characteristics of the resistance. The results showed that the performance degradation is sensitive to the important parameters of the traffic conditions and corrosive environment, which may decrease the structural reliability and lead to bridge failure. Cracks in a PSC-I girder may accelerate the performance degradation and affect the reliability level of the bridge. Therefore, a maintenance plan should be rationally considered depending on the site environment.

1. Introduction

A bridge deteriorates because of the applied loads and surrounding environment during its service life. This causes the original performance of the bridge to degrade. The bridge structure should be maintained to retain the required performance to satisfy its intended function. However, even when bridges are constructed according to the same design standard, site conditions (e.g., traffic and corrosion) vary. The site environment should be considered for the maintenance of a bridge. Current bridge performance evaluation and maintenance procedures do not consider such aspects; a single method of repair and reinforcement is adopted according to the target performance determined in the design step. Thus, the current level of maintenance work is unsatisfactory.
Research on evaluating the performance of a structure has mainly focused on safety evaluation of aging parts, evaluation of the system, and maintenance. Recent studies have focused on using a reliability-based evaluation technique based on statistical data to examine the loads and resistance capacities of actual structures. Several studies have followed the design concept suggested by Mayer [1], which uses the average and variance of a random variable to quantitatively evaluate the resistance capacity of a structure. Kameda et al. [2] suggested evaluating the safety of an existing structure by considering the remaining strength of a deteriorated structural member and the strength degradation regarding the load through the application of reliability theory. MacGregor et al. [3] used probability theory to quantitatively analyze the safety of an existing reinforced concrete member. However, these studies did not consider the site conditions reflecting the traffic characteristics of the actual bridge. Several studies have developed models to predict the performance degradation of a bridge. Frangopol et al. [4] represented the performance degradation of a bridge as a nonlinear continuous function and developed a performance level model and reliability index model. Frangopol and Neves [5] analyzed the changes in the performance degradation of a bridge depending on the settings of the maintenance standards. However, because these studies were limited in scope, these approaches are similarly limited in their ability to evaluate performance degradation reflecting the corrosive environment and traffic characteristics of an actual bridge.
This paper presents a performance degradation and reliability evaluation method based on the history of actual bridges, reflecting various site conditions (e.g., corrosive environment, traffic characteristics), which has not been considered in previous studies. Corrosive environmental conditions are classified as mild, normal, and severe. Traffic characteristics are classified as light, normal, and heavy. The method also accounts for the probabilistic characteristics of the materials and section properties of the bridge members.

2. Resistance Capacity and Performance Degradation Analysis

2.1. Resistance Capacity Evaluation of the Sample Bridge

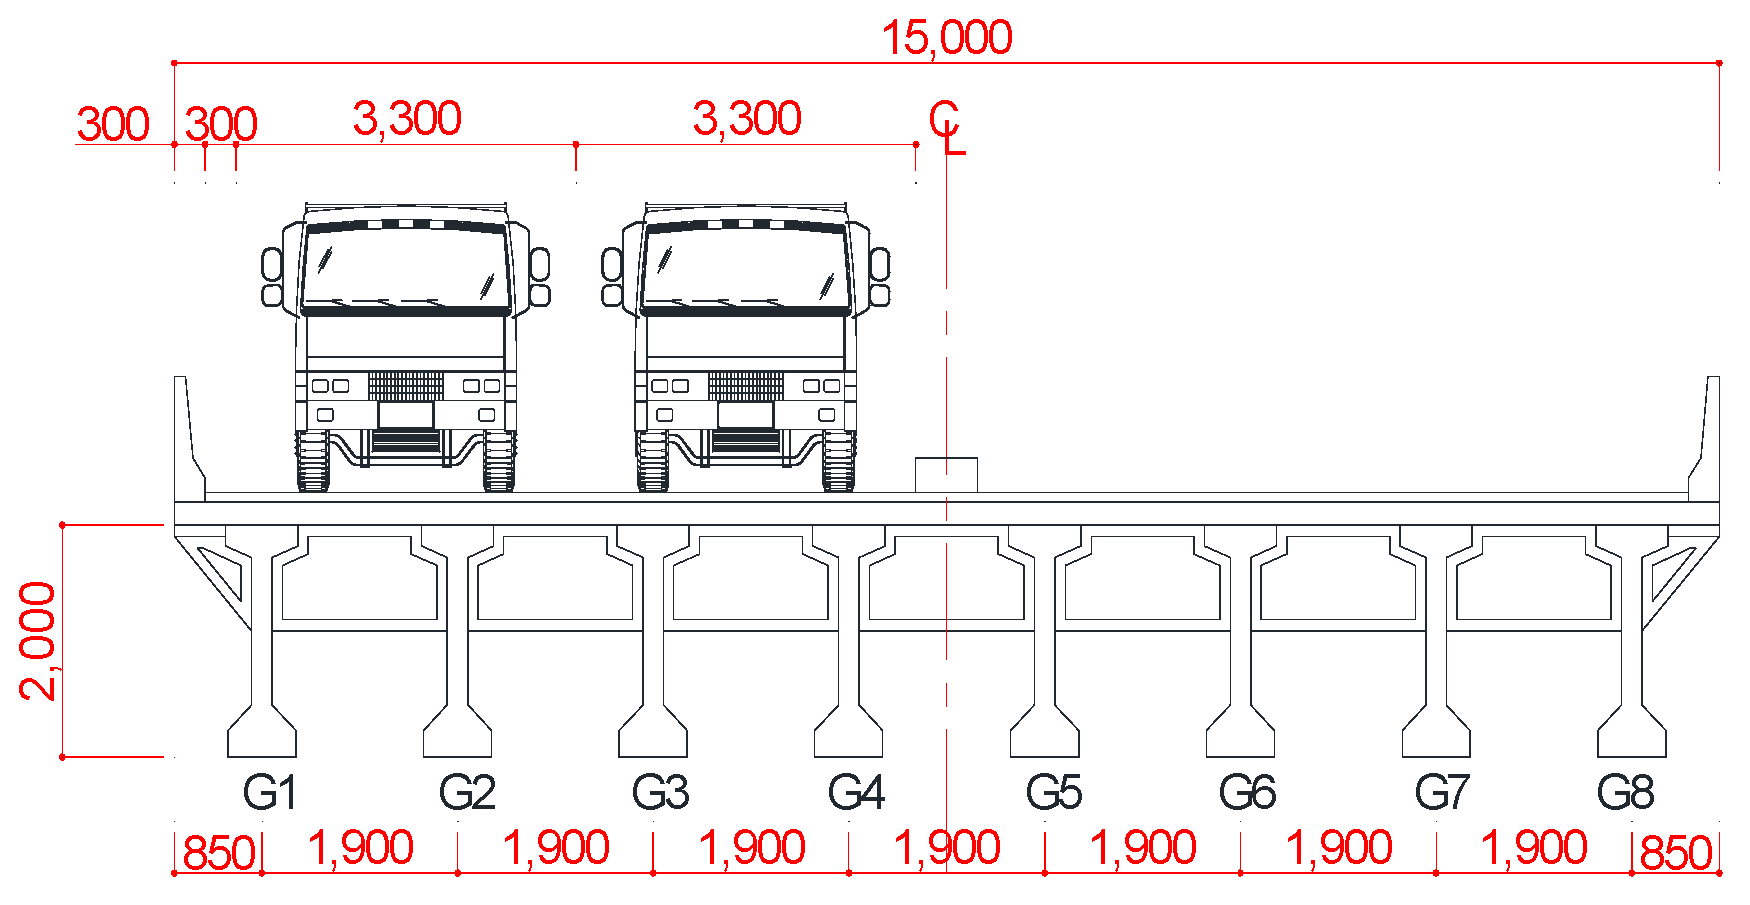
In this study, a PSC-I type girder bridge was specifically selected for examination in order to develop a method for analyzing the resistance capacity and performance degradation of bridges. The sample bridge was to be used in a two-lane expressway and comprised a single span that was 15 m in width. It was designed to satisfy the DB-24 load as outlined in the Korea highway bridge specifications [6]. The total span length of the sample bridge was set as 30 m.
To determine the appropriate cross section of the PSC-I girder, the standard cross-section of a 30-m-long PSC-I girder provided by the Korea Express Corporation (Seoul, Korea) was utilized. Table 1 and Figure 1 present the data specifications and cross-sectional profiles of the sample bridge at the mid-span.
The resistance capacity of the sample bridge was evaluated by calculating the flexural resistance, which is the material property that resists the effects of the two major loads applied to the structure: the dead load and live load. As discussed in the following sections, the resistance capacity of the PSC-I girder bridge was evaluated by using the flexural strength equation from the load-and-resistance factor design (LRFD) bridge design specifications [7].
The equations for the flexural strength of a PSC-I girder vary with the depth of the concrete stress block a   ( = c β ) and the position of the compression flange h f . If the depth of the concrete stress block is shallower than the thickness of the compression flange (i.e., a < h f ), the equations for the flexural strength of a rectangular cross-section are used:
M n = A p s f p s ( d p a 2 ) + A s f s ( d s a 2 ) A s ' f s ' ( d s ' a 2 ) ,
c = A p s f p s + A s f s A s ' f s ' 0.85 f c ' β 1 b 1 + k A p s f p u d p ,
where A p s ( mm 2 ) is the area of the pre-stressed (PS) tendon, A s ( mm 2 ) is the area of the non-pre-stressed tension reinforcing bar, A s ' ( mm 2 ) is the area of the compression reinforcing bar, f p s (MPa) is the average stress in the PS tendon, f s (MPa) is the stress in the mild steel tension reinforcing bar, f s ' (MPa) is the stress in the mild steel compression reinforcing bar, f p u (MPa) is the yield strength in the PS tendon, a ( mm ) is the depth of the equivalent stress block, b 1 ( mm ) is the width of the compression face of the member, c ( mm ) is the distance from the center of the longitudinal reinforcement to the nearest face of the concrete-encased shape on the bending plane, d s ( mm ) is the distance from the extreme compression fiber to the centroid of the non-pre-stressed tensile reinforcement, and β 1 ( mm ) is the stress block factor.
In contrast, if the depth of the concrete stress distribution block is greater than the thickness of the compression flange ( a > h f ) , the flexural strength equation for an I-type or T-type cross-section is used, as shown in Equations (3) and (4), respectively:
M n = A p s f p s ( d p a 2 ) + A s f s ( d s a 2 ) A s ' f s ' ( d s ' a 2 ) + 0.85 f c ' ( b 2 b w ) h f ( a 2 h f 2 ) ,
c = A p s f p s + A s f s A s ' f s ' 0.85 f c ' ( b 2 b w ) h f 0.85 f c ' β 1 b w + k A p s f p u d p ,
where f c ' (MPa) is the compressive strength of the concrete, b 2 ( mm ) is the width of the compression face of the member, b w ( mm ) is the web width, and h f ( mm ) is the compression flange depth. Based on the concrete compressive strength (i.e., 28 MPa) of the stress block factor ( β 1 ), the flexural strength was calculated to be in the range of 0.65–0.85. According to American Association of State Highway and Transportation Officials (AASHTO) [7], the stress block factor ( β 1 ) is calculated by considering the ductility of concrete as follows:
β 1 = 0.85   ( f c ' 28   MPa ) ,
β 1 = 0.85 0.007 (   f c ' 28 ) 0.65   ( f c ' > 28   MPa ) .
In addition, when the flexural strength of a PSC-I girder is calculated, the stress of a PS tendon ( f p s ) generated when a girder is destroyed is used instead of the yield strength ( f p y ) of the stress of the PS tendon. For the convenience of hands-on workers, AASHTO [7] presented the following approximation:
f p s = f p y ( 1 k c d p ) ,
where f p y (MPa) is the yield strength in the PS tendon, k is a type of PS tendon correction factor, c ( mm ) is the distance from the center of the longitudinal reinforcement to the nearest face of the concrete-encased shape along the plane of bending, and d p ( mm ) is the distance from the extreme compression fiber to the centroid of the PS tendons.

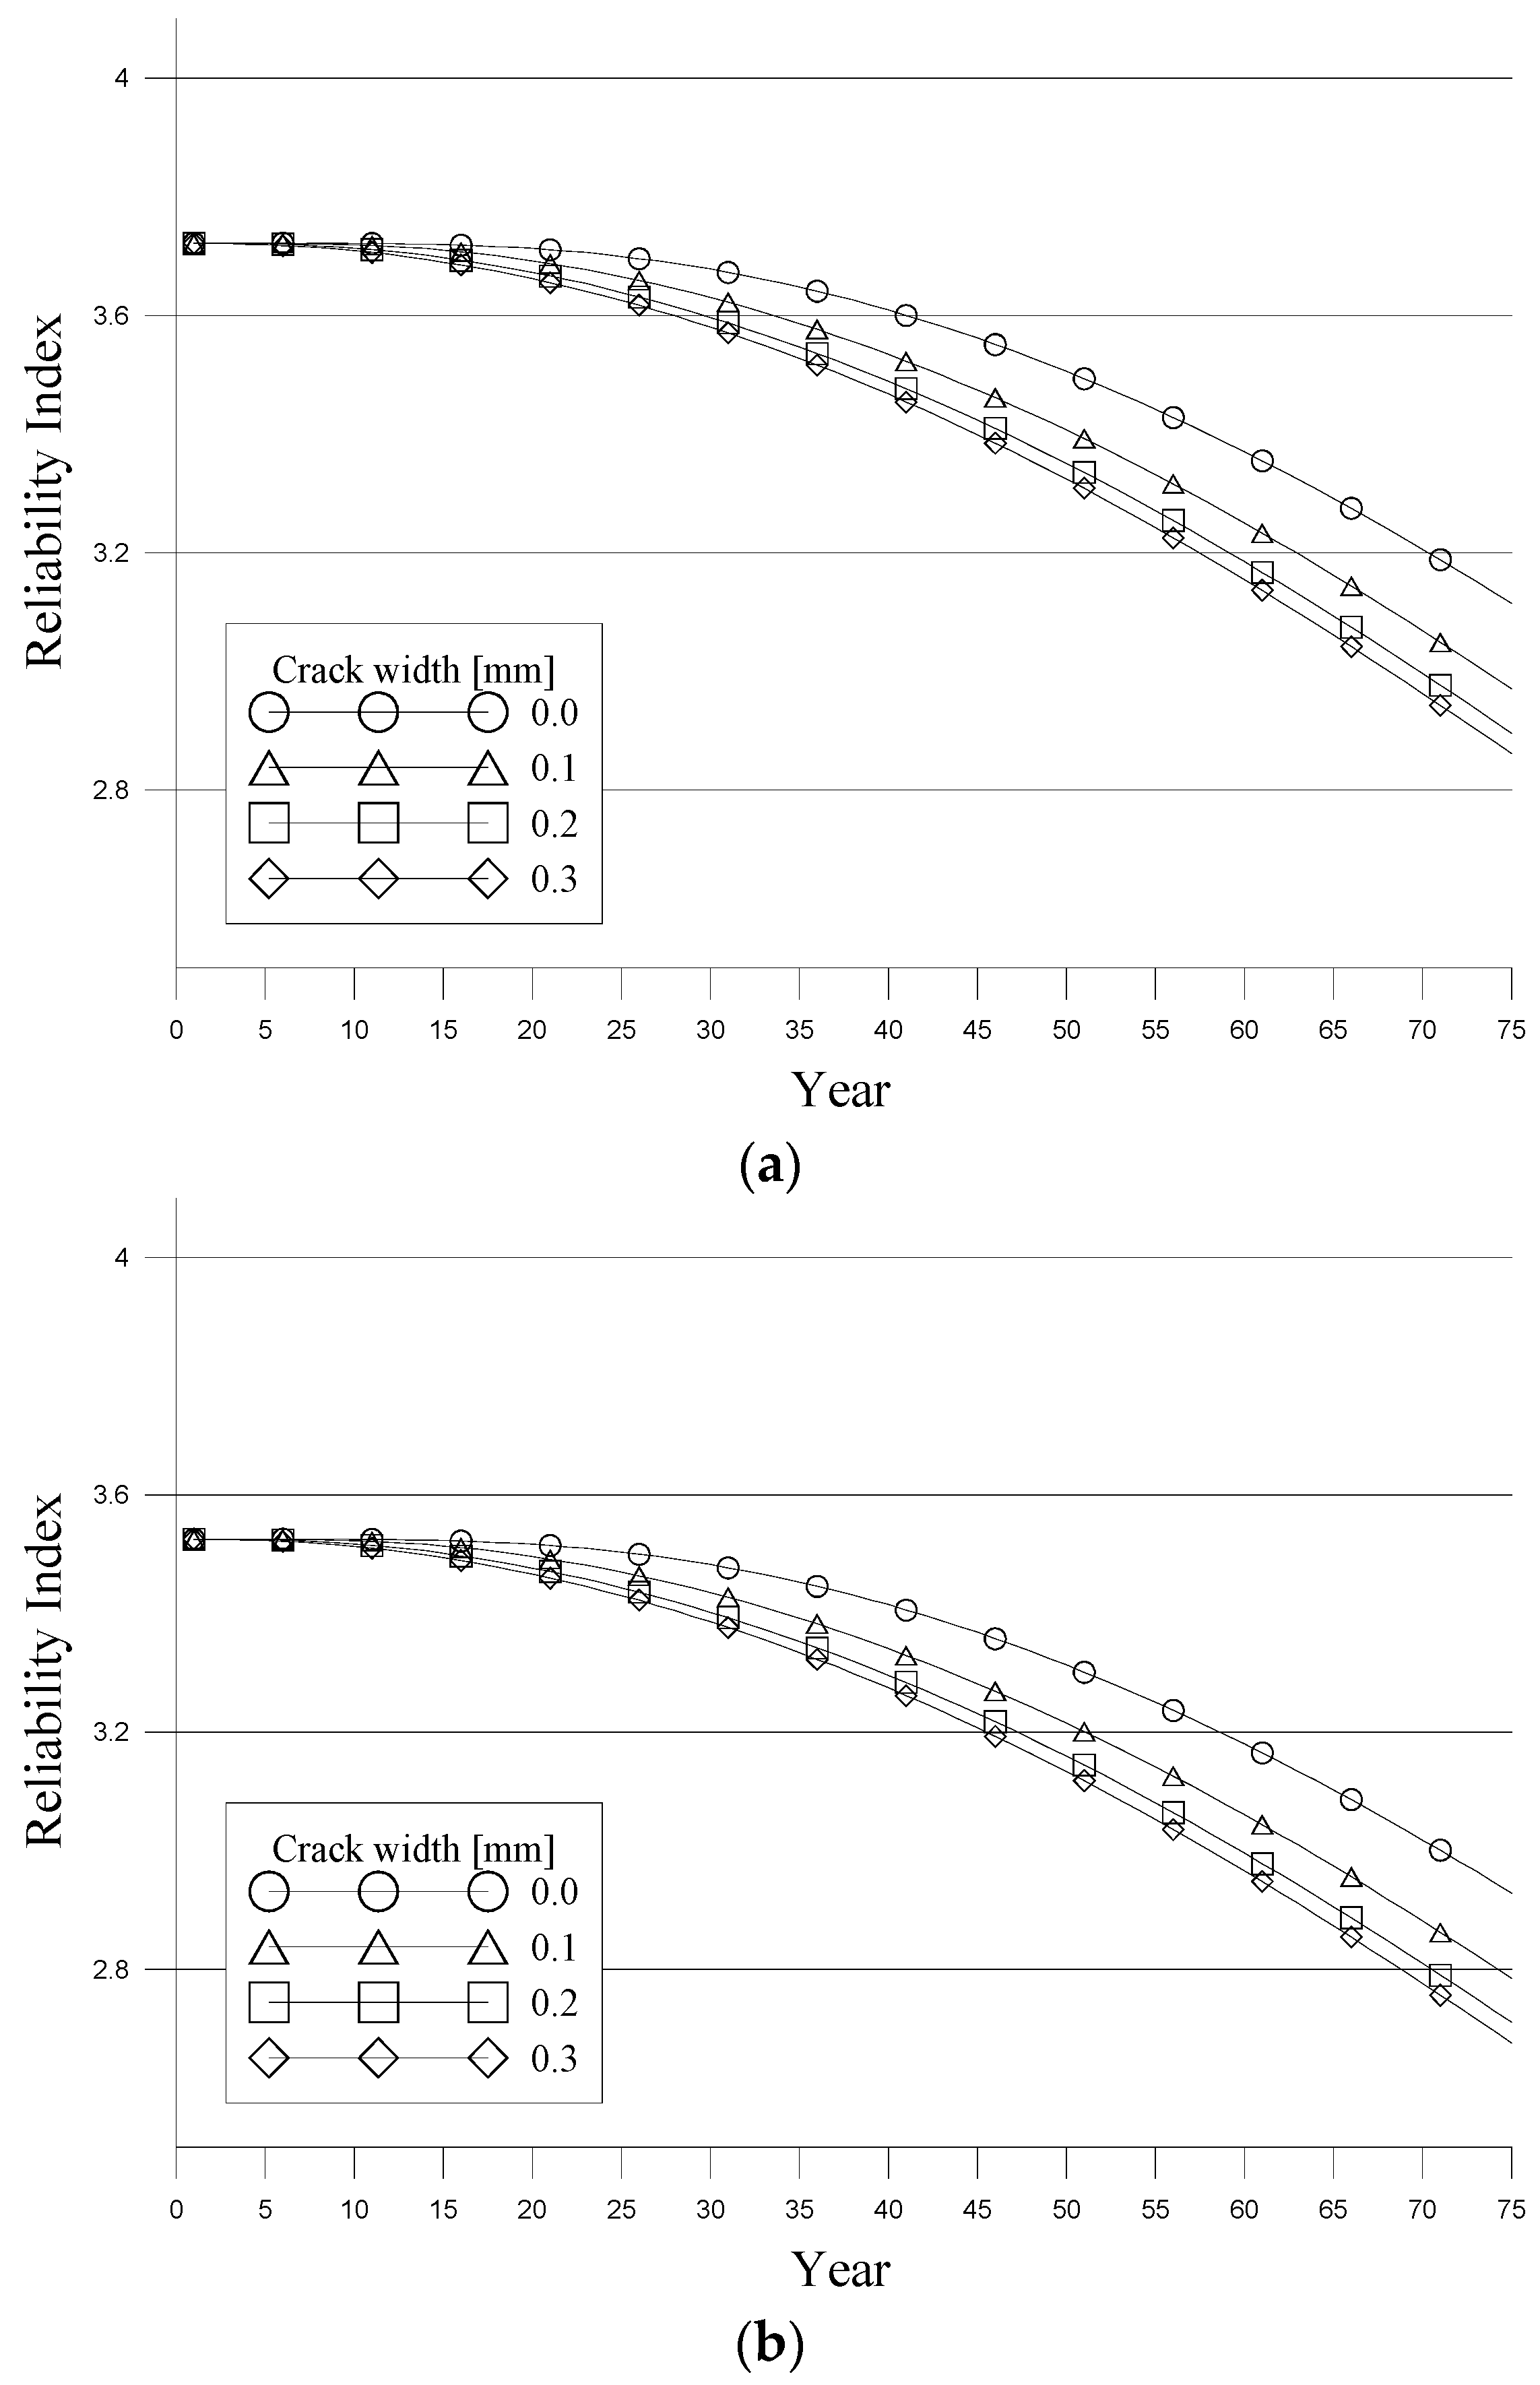
2.2. Determination of the Degradation Initiation Time of the PSC-I Girder

The performance of a reinforced concrete structure often degrades because of corrosion of the reinforcing bars. Chloride attack is a major factor in the corrosion of reinforcing bars embedded in concrete. Kwon et al. [8] proposed a chloride diffusion model based on a diffusion equation derived from Fick’s second law that considers the time dependence of the chloride diffusion coefficient ( D ¯ ) and the dependence of the diffusion coefficient correction factor ( f ( w c ) ) on the width of cracks in the concrete. In this study, the initiation time for the performance of the structure to degrade was calculated by using the improved chloride diffusion equations given below:
C ( x , t ) = C 0 | 1 erf ( x 2 D ¯ · f ( w c ) · t ) | ,
D ¯ = { D 0 1 m ( t 0 t ) m   t < t R   D 0 [ 1 + t R t ( m 1 m ) ] ( t 0 t R ) m   t t R ,
f ( w c ) = 31.61 w c 2 + 4.73 w c + 1   ( w 0.1   mm ) ,
where D ¯ is the diffusion coefficient dependent on time, f ( w c ) is the crack effect function, w c ( mm ) is the crack width, D 0 is the diffusion coefficient at t 0 , m is constant depending on the mix proportion, t 0 is the reference time, and t R is the time at which the diffusion coefficient is assumed to be constant.
When the diffused chloride reaches a certain concentration level at the depth of the rebar, the rebar corrodes. The chloride concentration that causes corrosion of the steel reinforcement is called the chloride threshold level ( C lim ). The point at which the resistance capacity degrades can be predicted by calculating the time t at which the chloride concentration in the cover thickness of the concrete x exceeds the chloride threshold value ( C lim ). Thus, the initiation time for the performance degradation of a reinforced concrete structure by steel corrosion can be determined by using the chloride concentration around the steel reinforcement in the concrete:
C ( x , t ) > C lim .
The carbonation depth from the surface of the concrete due to the presence of carbon dioxide in the atmosphere can be expressed as Equation (12), which is dependent on time [9]. The progression of internal carbonation is proportional to the square root of the total elapsed time. Based on this equation, the estimated time ( t ) when the carbonation depth exceeds its limit in the concrete can be calculated by using the degradation initial time of the PSC-I girder caused by carbonation (Equation (13)). The carbonation rate coefficient ( α d ) signifies the progress rate of carbonation and depends on the material properties of the concrete and the environmental conditions that the concrete is subjected to. The work by Park [10] was used to calculate the degradation initiation time according to the appropriate carbonation rate coefficient for the given material properties and environmental conditions (Table 2):
y p = α d t ,
y lim < y p ,
where α d ( cm / t ) is the carbonation rate coefficient, t (year) is the service life, y p ( mm ) is the predicted carbonation depth, and y lim ( mm ) is the limit depth.

2.3. Corrosion Damage Model for Reinforcing Bars Embedded in Concrete

Damage to the materials comprising the cross-sectional area of the bridge structure directly affects the resistance capacity of the bridge. The effective area of the steel reinforcement decreases when the steel is corroded by chloride penetration and carbonation. In this study, the decrease in the effective cross-section by corrosion of the reinforced steel of a floor plate and girder was considered. Val and Melchers [11] presented an equation for calculating the effective area based on the form of the corrosion (Equation (14)). The corrosion depth ( p ( t ) ) and current corrosion density ( i corr ) required to calculate the effective area ( A r ( t ) ) according to the service period were determined by using Equations (15) and (16):
A r ( t ) = { π D 0 2 4 A 1 A 2 ,   p ( t ) 2 2 D 0 A 1 A 2 ,   2 2 D 0 p ( t ) D 0 ,
a = 2 p ( t ) 1 | p ( t ) D 0 | 2 ,
A 1 = 1 2 [ θ 1 ( D 0 2 ) 2 a | D 0 2 p ( t ) 2 D 0 | ] , A 2 = 1 2 [ θ 2 p ( t ) 2 a p ( t ) 2 D 0 ] ,
p ( t ) = 0.0116 ( t t i ) i corr R ,
i corr = T k H r ( w / c ) d c ,
where A 1 and A 2 are the effective area factors, R is the penetration ratio between the maximum and average penetration, t i (year) is the time of corrosion initiation, i corr ( μ A / cm 2 ) is the corrosion current density, H r (%) is the relative humidity, T k (K) is the absolute temperature, w / c is the water–cement ratio, and d c ( mm ) is the effective depth.

3. Required Performance and Resistance Capacity Considering Environmental Factors

3.1. Required Performance Based on Traffic Conditions

The required performance of a bridge is defined according to the characteristics of the loads applied to the bridge. Many types of loads are applied to a bridge in service, and it is virtually impossible to consider all of them. This section mainly considers the flexural moment generated by the dead load and live load applied to bridges for analysis.
The dead load refers to the self-weight of a structure. When the self-weight of a bridge is calculated, the unit weights of the materials constituting the bridge and the specifications of members from the design plan are used. The Korea Highway Bridge Specifications [6] suggest unit masses of the general construction materials for bridges for calculating the dead load (Table 3). The maximum flexural moment occurs at the center of the girder from the dead load. This is calculated from the given unit mass and member specifications from the design plan, as given in Table 4. According to the calculation, the outer girder in the sample bridge was most vulnerable to the flexural moment produced by the dead load.
In this study, the uncertainty of the dead load was modeled by applying the statistical characteristics of the dead load suggested by the Federal Highway Administration (FHWA) [10]. For the calibration of the LRFD bridge design code, the statistical characteristics of the dead load were classified into three types: precast members, cast-in-place members, and wearing surface according to the members and construction conditions (Table 5).
This case had an annual average daily traffic (AADT) of 20,000 and heavy vehicle proportion of 25%, which slightly exceeds the average traffic characteristics of one-way, two-lane roads in Korea. This was set as the normal traffic conditions for the sample bridge. The case with an AADT of 10,000 and heavy vehicle proportion of 15% was set as the light traffic condition, and that with an AADT of 40,000 and heavy vehicle proportion of 35% was set as the heavy traffic condition.
In current bridge designs, the DB-24 load and DL-24 loads are applied [6]. These do not reflect the actual traffic characteristics of the bridge once it is in service. In this study, in order to determine the required performance, an annual extreme load that reflects the actual traffic characteristics was referenced, as listed in [12,13]. In these studies, the effect of the annual extreme load on bridges was calculated by considering various traffic characteristics, including the AADT, heavy vehicle proportion, vehicle running pattern, bridge, and lateral load distribution of the bridge. Table 6 presents the probabilistic distributions of passing vehicles: mobile cars (P), buses (B), mid-size trucks (T), heavy trucks (TT), and semi-trailers (ST). The first mode indicates the empty or lightly loaded condition, and the second mode represents the heavily loaded condition. In order to reflect the running patterns of vehicles passing the bridge, the running speed ratio of vehicle per AADT, the inter-vehicle distance models, and the vehicle consecutive models were measured (Table 7). Table 8 and Figure 2 present the calculated lateral load distribution coefficients of the sample bridge via finite element analysis and the results with them. The heavy vehicle distribution proportion per lane was set to 15:85 as recommended by the Korea Highway Bridge Specifications [6]. Based on the traffic characteristics suggested above, the annual extreme load applied to the sample bridge was analyzed (Table 9).

3.2. Resistance Capacity Based on Statistical Characteristics

The resistance capacity of a bridge is used as a significant index for bridge maintenance. In order to compute the resistance capacity, which reflects the statistical properties of a bridge structure, uncertainty variables that form the resistance capacity must be considered. These include the statistical characteristics ( λ M F , V M F ) of materials and sections resulting from construction and the statistical characteristics ( λ P , V P ) [14] resulting from the discrepancy between the model and actual structure. When the bridge resistance capacity is computed based on reliability theory, such uncertainty variables must be reflected. In this study, all variables in the resistance capacity equation for the PSC-I girder that describe materials and sections were regarded as probabilistic variables. A Monte Carlo simulation with 100,000 samples was performed to infer the statistical characteristics of the materials and sections. The bias factor ( λ R ) and coefficient of variation ( V R ) of the resistance capacity considering the statistical characteristics of materials, sections, and modeling can be computed as follows [15]:
λ R = λ M F λ P ,
V R = ( V M F ) 2 + ( V p ) 2 ,
where λ P is the bias factor of modeling, λ M F is the bias factor of the material and fabrication, V p is the coefficient of variation of modeling, and V M F is the coefficient of variation of the material and fabrication.
The probabilistic characteristics of the materials and the section properties should be considered. Statistical characteristics such as the area of the PS tendon, area of the reinforcing bars, effective depth, and height of the concrete section were taken from National Cooperative Highway Research Program 368 (NCHRP 368) [14]. The material properties of concrete and steel structures, such as the concrete compressive strength, reinforcing steel tensile strength, and PS strand breaking stress, were taken from Nowak and Szerszen [16]. The probabilistic characteristics of the resistance capacity were estimated through a Monte Carlo simulation run 100,000 times in total. Table 10 presents the statistical characteristics of the resistance capacity considering both the statistical characteristics and modeling error variables of the material and fabrication. The flexural resistance of the PSC-I girder was calculated to be 1.053 times greater than the nominal strength on average.

4. Reliability Analysis of the PSC-I Girder

4.1. Performance Degradation Analysis Considering a Corrosive Environment

The performance degradation of the PSC-I girder bridge was calculated based on the corrosion model presented in Section 2. In the analysis, the degradation due to corrosion of the slab was confirmed to be small. Therefore, the performance degradation due to slab corrosion was not considered in the analysis of the performance degradation of the composite PSC-I girder. In order to examine the difference in performance degradation for environments of varying corrosiveness, the corrosive environments were classified as mild, normal, and severe. Parameters such as the surface chloride content, chloride diffusion coefficient, and carbonation rate coefficient ( a d ) that greatly influence the corrosion of the PSC-I girder were varied in different corrosive environments for analysis. To determine the penetration ratio ( R ), experiments should be performed that consider each corrosion condition. However, determining the penetration ratio by actual experiments is difficult. This study referred to Val and Melcher’s work [11] to determine the penetration ratio. Table 11 presents the corrosion parameters used in the analysis [8,10,11,17].
To consider the effect of cracks on the resistance capacity, the existence and size of cracks in the girder were classified in the analysis. Based on the concrete component condition assessment criteria specified by the Korea Infrastructure Safety and Technology Corporation (Seoul, Korea) [18], the time until the concrete experiences performance degradation was analyzed under normal conditions (without cracks) and when cracks formed with widths ranging from 0.1 to 0.3 mm. Table 12 lists the conditions for resistance capacity degradation caused by chloride attack and carbonation.
The degradation initiation time ( t i ) was estimated based on the corrosive environments of the bridge and the crack width of the PSC-I girder bridge. The results are presented in Table 13. The analysis results showed that the time until performance degradation of a PSC-I girder under normal conditions was 48.4 years in a mild environment, 16.2 years in a normal environment, and 6.4 years in a severe environment. This appeared to be the result of differences in the surface chloride content according to regional characteristics. The time until performance degradation of the PSC-I girder was observed to be sensitive to the crack width. Cracks wider than 0.3 mm in the girder could cause performance degradation even within the first year after the completion of construction, depending on the environmental conditions.
Figure 3 presents the performance degradation ratio of the PSC-I girder against the service life for different corrosive environments and crack widths. The results showed that the performance degradation was more rapid with wider initial cracks and in areas with higher surface chloride content. In a mild environment, the performance degradation was 6.67% in girders without cracks, but 14.12% in the case of girders with a 0.3 mm wide crack. In a normal environment, the performance degradation was 10.19% in girders without cracks, but 14.78% in girders with a 0.3 mm wide crack. In a severe environment, the performance degradation was 13.39% in girders without cracks, but 15.17% in girders with a 0.3 mm wide crack. The performance degradation was greatest in the severely corrosive environment. In the severe environment, there were small differences in the performance degradation with and without cracks. The rate of increase in the performance degradation with cracks was significantly smaller because the performance degradation occurred even before cracking. These results indicate that a corrosive environment has a significant effect on the performance degradation of PSC-I girders.

4.2. Time-Related Reliability Analysis of the PSC-I Girder Bridge

The reliability of sample bridges was analyzed based on the limit state equation given below. The load factor in Equation (19) represents the moment exerted by each load, and the resistance factor represents the flexural strength of the structure:
g = R f D 1 D 2 L L ( 1 + I M ) ,
where R f is the resistance capacity (flexural strength), D 1 is the load effect due to the girder, D 2 is the load effect due to the barrier, sidewalk blocks, and pavement, L L is the load effect due to the live load, and I M is the impact coefficient.
The reliability degradation during the life cycle of a sample bridge was analyzed based on the resistance capacity degradation where the flexural strength decreased because of structural deterioration during the service life, as calculated in Section 4.1, and because of the live load resulting from various traffic conditions, as determined in Section 3.1 describing the reliability analysis.
Figure 4, Figure 5 and Figure 6 present the changes in the annual reliability index depending on the service life, site environment of the sample bridge, and cracks. The reliability index varied in the range of 3.29 to 2.61 depending on the formation of cracks and traffic conditions (light, normal, heavy) in a mild corrosive environment. The reliability index varied in the range of 3.11 to 2.58 depending on the formation of cracks and traffic conditions (light, normal, heavy) in a normal corrosive environment. The reliability index varied in the range of 2.94 to 2.55 depending on the formation of cracks and traffic conditions (light, normal, heavy) in a severe corrosive environment. These results indicate that the annual reliability indices for PSC-I girder bridges with 75 years of service vary significantly depending on differences in the corrosive environment, traffic conditions, and crack formation.

5. Conclusions

A method was developed to evaluate the reliability of an in-service highway bridge based on resistance capacity degradation. The suggested method was applied to a PSC-I girder bridge to verify its effectiveness. The required performance and resistance capacity of the bridge reflecting various traffic characteristics were calculated. These were then used to analyze the bridge reliability. Various traffic characteristics were considered to analyze the required performance of the sample bridge. The decrease in the resistance capacity was analyzed according to the suggested deterioration model.
The case with an AADT of 20,000 and heavy vehicle proportion of 25% was set as the normal traffic case. The case with an AADT of 10,000 and heavy vehicle proportion of 15% was set as the mild traffic case, and the case with an AADT of 40,000 and heavy vehicle proportion of 35% was set as the severe traffic case. The annual extreme load effect calculation from a previous study was used. The flexural moment generated by the dead load and live load primarily applied to bridges was analyzed to determine the required performance. The analysis results confirmed that the outer girder of the sample bridge required the highest level of performance.
For the calculation of the resistance capacity, all variables considering the uncertainty of materials and sections were regarded as probabilistic variances. The statistical characteristics of the resistance capacity, materials, and sections were calculated by running a Monte Carlo simulation 100,000 times. The flexural resistance of the PSC-I girder was calculated to be 1.053 times larger than the nominal strength on average.
The performance degradation of PSC-I girder bridges was calculated with the presented corrosion model. In order to examine the performance degradation in different corrosive environments, corrosive environments were classified as mild, normal, and severe. The results showed that the performance degradation was more rapid with wider initial cracks and in areas with higher surface chloride content. The reliability of the selected bridges was analyzed based on the limit state equation. The results showed that the annual reliability indices of PSC-I girder bridges with 75 years of service varied significantly depending on the corrosive environment, traffic conditions, and crack formation. These results indicate that reliability of a highway bridge based on the resistance capacity is quite sensitive to important parameters, including the traffic characteristics, corrosive environment, and crack damage. If such parameters are considered, the structural reliability level may decrease. Therefore, a maintenance plan for bridges should be rationally developed by considering the site environment.
In this study, a method was developed for evaluating the performance and reliability degradation according to the time history by considering the effect of traffic characteristics and a corrosive environment, and the method was applied to an actual PSC-I girder bridge as an example. Further research is needed to apply the proposed method to maintenance based on repair and reinforcement, life cycle cost analysis, and reliability evaluation of other superstructure-type bridges.

Acknowledgments

This study has been supported by a Creative Human Resources Center for Resilient Infrastructure grant funded by Yonsei University.

Author Contributions

Sang-Hyo Kim proposed the topic of this study and designed the process; Jae-Gu Choi and Sung-Min Ham performed the simulations; and Won-Ho Heo performed the analysis and wrote the paper.

Conflicts of Interest

The authors declare no conflict of interest.

References

  1. Mayer, M. Die Sicherheit der Bauwerke und Ihre Berechnung nach Grenzkräften Anstatt nach Zulässigen Spannungen; Springer: Berlin, Germany, 1926. [Google Scholar]
  2. Kameda, H.; Koike, T. Reliability theory of deteriorating structures. J. Struct. Div. 1975, 101, 295–310. [Google Scholar]
  3. MacGregor, J.G.; Mirza, S.A.; Ellingwood, B. Statistical analysis of resistance of reinforced and prestressed concrete members. ACI J. Proc. 1983, 80, 167–176. [Google Scholar]
  4. Frangopol, D.M.; Kong, J.S.; Gharaibeh, E.S. Reliability-based life-cycle management of highway bridges. J. Comput. Civ. Eng. 2001, 15, 27–34. [Google Scholar] [CrossRef]
  5. Frangopol, D.; Neves, L. Probabilistic performance prediction of deteriorating structures under different maintenance strategies: Condition, safety and cost. In Life-Cycle Performance of Deteriorating Structures; Frangopol, D.M., Brühwiler, E., Faber, M.H., Adey, B., Eds.; American Society of Civil Engineers: Reston, VA, USA, 2003; pp. 9–18. [Google Scholar]
  6. Korea Highway Bridge Specifications (KHBS); Korea Institute of Bridge and Structural Engineers: Seoul, Korea, 2015.
  7. AASHTO LRFD Bridge Design Specifications, 6th ed.; American Association of State Highway and Transportation Officials: Washington, DC, USA, 2012.
  8. Kwon, S.J.; Na, U.J.; Park, S.H.; Jung, S.H. Service life prediction of concrete wharves with early-aged crack: Probabilistic approach for chloride diffusion. Struct. Saf. 2009, 31, 75–83. [Google Scholar] [CrossRef]
  9. Development of Facility Optimum Maintenance Management System Based on Life Cycle Cost, TS-05-R3-010; Korea Infrastructure Safety and Technology Corporation: Seoul, Korea, 2012.
  10. Park, Y.K. Development of Carbonation-Prediction Equation of Concrete under Domestic Exposure Environments. Master’s Thesis, Yonsei University, Seoul, Korea, June 2002. [Google Scholar]
  11. Val, D.V; Melchers, R.E. Reliability of deteriorating RC slab bridges. J. Struct. Eng. 1997, 123, 1638–1644. [Google Scholar] [CrossRef]
  12. Development of Bridge Maintenance Technique Considering Performance Based on the Site Environment; Korea Infrastructure Safety and Technology Corporation: Seoul, Korea, 2015.
  13. Kim, S.H.; Heo, W.H.; Yu, D.W.; Choi, J.G. Analysis of extreme load effects based on various traffic characteristics and environments. In Proceedings of the Symposium on Reliability of Engineering System, Hangzhou, China, 15–17 October 2015.
  14. Calibration of LRFD Bridge Design Code, NCHRP 368; Federal Highway Administration: Washington, DC, USA, 1999.
  15. Withiam, J.L.; Voytko, E.P.; Barker, R.M.; Duncan, J.M.; Kelly, B.C.; Musser, S.C.; Elias, V. Load and Resistance Factor Design (LRFD) for Highway Bridge Substructures, FHWA HI-98-032; Federal Highway Administration: Washington, DC, USA, 1998.
  16. Nowak, A.S.; Szerszen, M.M. Calibration of design code for buildings (ACI 318): Part 1—Statistical models for resistance. Struct. J. 2003, 100, 377–382. [Google Scholar]
  17. Weyers, R.E.; Prowell, B.D.; Sprinkel, M.M.; Vorster, M. Concrete Bridge Protection, Repair, and Rehabilitation Relative to Reinforcement Corrosion: A Methods Application Manual, SHRP Report S-360; National Research Council: Washington, DC, USA, 1993. [Google Scholar]
  18. Standard for Structure Safety Inspection: Bridge Structure, RD-12-E6-024; Korea Infrastructure Safety and Technology Corporation: Seoul, Korea, 2012.
Figure 1. Cross-section of the PSC-I bridge at the mid-span (mm).
Applsci 06 00423 g001
Figure 2. Lateral load distribution coefficients of the PSC-I girder bridge for (a) lane 1 and (b) lane 2.
Applsci 06 00423 g002aApplsci 06 00423 g002b
Figure 3. Resistance capacity loss ratio of the PSC-I girder bridge considering the crack width in corrosive environments: (a) mild; (b) normal; and (c) severe.
Applsci 06 00423 g003
Figure 4. Reliability degradation considering the crack width in a mild environment: (a) light traffic (AADT: 10,000, heavy vehicle proportion: 15%); (b) normal traffic (AADT: 20,000, heavy vehicle proportion: 25%); and (c) heavy traffic (AADT: 40,000, heavy vehicle proportion: 35%).
Applsci 06 00423 g004aApplsci 06 00423 g004b
Figure 5. Reliability degradation considering the crack width in a normal environment: (a) light traffic (AADT: 10,000, heavy vehicle proportion: 15%); (b) normal traffic (AADT: 20,000, heavy vehicle proportion: 25%); and (c) heavy traffic (AADT: 40,000, heavy vehicle proportion: 35%).
Applsci 06 00423 g005aApplsci 06 00423 g005b
Figure 6. Reliability degradation considering the crack width in a severe environment: (a) light traffic (AADT: 10,000, heavy vehicle proportion: 15%); (b) normal traffic (AADT: 20,000, heavy vehicle proportion: 25%); and (c) heavy traffic (AADT: 40,000, heavy vehicle proportion: 35%).
Applsci 06 00423 g006aApplsci 06 00423 g006b
Table 1. Section properties of the pre-stressed concrete-I (PSC-I) bridge.
PropertyValue
Bridge width15 m
Cross-beam spacing5 m
Number of girders8
Span length30 m
Girder height2000 mm
Girder width700 mm
Table 2. Carbonation rate coefficient.
EnvironmentStrength Correction Factor a d ( f c : MPa)Carbonation Rate Coefficient α d ( cm / t )
Mild 0.0463 f c + 1.7048 w c > 0.6   w c 0.25 0.3 × ( 1.15 + 3 w c ) 1 a d
w c 0.6   4.6 × w c 1.76 7.2 1 a d
Normal 0.0265 f c + 1.2538
Severe 0.0184 f c + 0.8556
Table 3. Unit masses of construction materials.
MaterialUnit Mass (kg/m3)
Reinforced concrete2500
Pre-stressed concrete2500
concrete2350
Asphalt pavement2300
Table 4. Flexural moment due to the dead load.
GirderFlexural Moment (kN·m)
Girder + Slab (D1)Pavement (D2)
G13106.1228.4
G23175.0241.1
Table 5. Bias factors and coefficients of variance (COVs) of the dead load.
ComponentDistributionBias FactorCOV
Precast membersNormal1.030.08
Cast-in-place membersNormal1.050.10
Wearing surfaceNormal1.000.25
Table 6. Probabilistic characteristics of the proposed vehicle weight model 1.
Vehicle ModelModeDistribution TypeCoefficientsMin. (Tons)Max. (Tons)Correction Coefficients
μ , λ σ , ζ
P1L-N0.3980.3170.75.01.0000
B1Normal4.0891.0201.417.10.0980
2Normal11.5521.5424.024.00.9020
T1L-N1.3380.6201.2524.10.7330
2L-N2.7210.2211.2540.00.2945
TT1L-N2.4670.1787.341.30.2190
2L-N3.2530.2037.3620.7818
ST1Normal18.5413.00011.363.40.2600
2L-N3.4200.22559.7900.7421
1 P, mobile cars; B, buses; T, mid-size trucks; TT, heavy trucks; ST, semi-trailers.
Table 7. Running pattern and inter-vehicle distances for each vehicle speed. AADT, annual average daily traffic.
Vehicle Speed (km/h)Inter-Vehicle Distance (m)AADT (Two-Lane)
10,00020,00040,000
<10210%10%15%
10–30520%30%40%
30–501550%40%30%
>502520%20%15%
Table 8. Lateral load distribution coefficients for lanes.
CategoriesGirderLive Load Distribution Factor
Lane 1 ( C l a n e 1 )Lane 2 ( C l a n e 2 )
PSC-I girder bridgeG10.1240.312
G20.1530.302
G30.2190.181
Table 9. Annual extreme load considering the AADT and heavy vehicle proportion (heavy vehicle distribution = 15:85, lane 2).
GirderNon-Exceedance Probability 95%, ( kN · m )
Light TrafficNormal TrafficHeavy Traffic
10,000, 15%20,000, 25%40,000, 35%
G11730.41847.21912.5
G21775.31902.81950.1
G31585.91645.21648.3
Table 10. Statistical parameters for the resistance capacity of the example PSC-I girder.
Material/FabricationModelingResistance
Bias FactorCOVBias FactorCOVBias FactorCOV
1.0430.0241.010.061.0530.064
Table 11. Description of corrosion parameters for various corrosive environments.
ParameterMild EnvironmentNormal EnvironmentSevere Environment
c 0 2.0   kg / m 3 3.5   kg / m 3 8.5   kg / m 3
a d 0.0463 f c + 1.7048 0.0265 f c + 1.2538 0.0184 f c + 0.8556
w / c 0.60.60.6
D 0 3.87 × 10 12   cm 2 / year 3.87 × 10 12   cm 2 / year 3.87 × 10 12   cm 2 / year
R 555
Table 12. Conditions for resistance capacity degradation caused by chloride attack and carbonation.
Deterioration FactorVariableInitial Condition
Chloride attack C ( x , t ) = C 0 | 1 e r f ( x 2 D ¯ · f ( w c ) · t ) | C ( x , t ) > 1.2   kg / m 3
Carbonation y p = [ 4.6 · w / c 1.76 7.2 1 a d ] t y p > y lim
Table 13. Degradation initiation time (year) in the PSC-I girder with and without cracks.
Corrosion EnvironmentNo CrackedCrack Width
0.1 mm0.2 mm0.3 mm
Mild48.423.411.36.1
Normal16.27.93.82.1
Severe6.43.11.50.8

