Article

Experimental Study on the Force-Bearing Performance of Masonry Structures with a Marble-Graphite Slide Seismic Isolator at the Foundation

1
School of Engineering and Technology, China University of Geosciences (Beijing), No. 29, Xueyuan Road, Haidian District, Beijing 100083, China
2
School of Architectural Engineering, North China University of science and technology, No. 46, Xinghua West street, Tangshan 063009, China
3
College of Architecture and Civil Engineering, Beijing University of Technology, No. 100, Pingleyuan, Chaoyang District, Beijing 100124, China
4
Academy of Railway Sciences, Scientific & Technological Information Research Institute, No. 2, Daliushu Road, Haidian District, Beijing 100081, China
*
Author to whom correspondence should be addressed.
Appl. Sci. 2016, 6(11), 345; https://doi.org/10.3390/app6110345
Submission received: 25 August 2016 / Revised: 2 November 2016 / Accepted: 3 November 2016 / Published: 10 November 2016

Abstract

:
As part of the search for a seismic isolator for low-rise buildings, this paper proposes a marble-graphite slide seismic isolation system composed of marble-graphite slides, an upper foundation beam, the lower counterpart of the upper beam, and the corresponding stop blocks, with the stop blocks consisting of restrictive screws, positioning plates, nut connectors and stop holes linking the two foundation beams. To provide the desired isolation performance, plain mortar bars can be included at the beam interface to better control the initiating loads for foundation slippage. Tests of low-reversed cyclic loading were performed on four different masonry specimens: a recycled brick wall, a clay brick wall, an integrated recycled brick wall with flay ash blocks sandwiched between, and its clay brick counterpart. The four specimens were provided with marble-graphite slide isolators placed at the foundations. The isolator thickness was 20 mm, and the graphite and the marble served as a lubricant and a bearing, respectively. This paper then analyses all of the specimens in terms of the damage that occurred, the initiating load for slippage, the hysteretic performance, the bearing capacity and the performance of the stop blocks. The results indicate that mortar bars embedded in the marble-graphite slide isolator offer effective control of the initiating load, and the isolation system delivers good hysteretic performance. The stop blocks are capable of withstanding a large-magnitude earthquake and are a good choice for constraining the slippage displacement. Damage or failure of the specimens occurs only when the low-reversed cyclic loading continues after slippage takes place. The design is shown to be an outstanding and flexible seismic scheme for use in low-rise buildings.

1. Introduction

Low-rise masonry residential structures are a widely used engineering design, but are these structures are frequently damaged by earthquakes, leading to numerous casualties and severe property loss. Seismic isolation offers a solution to this problem, but the focus has typically been on multi-storey masonry buildings. The design solutions include friction sliding bearings, laminated rubber bearings or lead rubber bearings, which offer exceptional isolating performance but also lead to high costs and complex engineering. Therefore, engineering researchers and practitioners have been working earnestly to develop an economical seismic isolation system that involves straightforward engineering for low-rise masonry buildings.
Milestones in this research are highlighted in this section. Zimmermann et al. [1], analysed the structural behaviour of low- and normal-strength interface mortar for masonry. Zimmermann and Strauss [2,3] performed a numerical investigation of historic masonry walls under normal and shear load and studied the capacity of old brick masonry with regard to cyclic stress. Salmanpour [4], carried out cyclic quasi-static tests on full-scale unreinforced masonry walls made of clay and calcium silicate blocks to investigate the effects of the various factors. The results showed that due to the formation of a sliding mode in the calcium silicate walls, the unreinforced masonry walls were able to exhibit a higher deformation and energy dissipation capacity compared to the clay walls. Nanda et al. [5], studied four friction isolation interfaces, namely, marble–marble, marble–high density polyethylene, marble–rubber sheet, and marble–geosynthetic. For marble–marble and marble–geosynthetic interfaces, a greater than 50% reduction in absolute response acceleration at the roof level could be achieved in comparison with the response of the fixed-base structure at the cost of increasing the relative sliding displacements at the friction interface. Nanda et al. [6], proposed four different sliding interfaces, namely green marble/high density poly ethylene (HDPE), green marble/green marble, green marble/geosynthetic, and green marble/rubber layers, which had been studied in experimental and analytical investigations. Green marble and geosynthetic layers were found to be the better alternatives for use in a friction isolation system with equal effectiveness for energy dissipation as they limit the earthquake energy transmission to the superstructure during a strong earthquake, making the green marble and geosynthetic layers a low-cost durable solution for earthquake protection of masonry buildings. Zhang, el al. [7], put an integrated masonry structure of recycled bricks and adobe with one marble-graphite slide seismic isolator at its foundation into the vibration test rig. The results showed that the isolator delivered sound performance in terms of vibration isolation. Given the great mechanical properties of the overall structure, the straightforward approach of construction and the cost efficiency, the structure can well be applied to the seismic design of low-rise buildings in rural areas. Roussis et al. [8,9], developed an seismic isolation bearing in which two sliding friction pendulums linked by a connector interacted orthogonally. The design ensured isolation in the horizontal direction while simultaneously restraining any potential lifting. Koo et al. [10], studied the impact of buckling loads on the shape factors of lead rubber bearings and showed that horizontal stiffness changes are an important factor in the seismic performance of the bearing. Griffith et al. [11], embedded a displacement connector within a laminated rubber bearing; the displacement connector restrained any deformation of the bearing when its horizontal displacement exceeded a limit value. Jangid and Kelly [12], analysed seismic isolation systems in which four distinctive isolators were installed, namely, a classic laminated rubber bearing, a high-damping rubber bearing, a lead rubber bearing and an Electricite-de-France (EDF) bearing. They noticed that the last type displayed better seismic isolation performance during near-fault earthquakes.
Shang et al. [13], proposed a reinforced asphalt seismic isolation layer structure and applied a simulated earthquake ground motion in an experimental study to analyse the performance of the structure, which was satisfactory. Tsompanakis [14], performed a finite element analysis of buildings isolated using recycled tires and found that the tire cushion largely mitigated the seismic effects on the superstructure. Due to its cost efficiency, the design using recycled tires can be widely commercialized. Turer [15], tested scrap automobile tire pads under compressive tests and static shear tests to study the effects of various parameters including the tire orientation and number of layers. The tests showed that the isolator stiffness in both the horizontal and vertical directions could be altered by adjusting the number of tire layers. Turer described the isolator design as a simple, economical and environmentally friendly solution. Tsang [16], presented the idea of an isolator composed of granulated rubber mixed with soil. An experimental study and numerical simulation were performed to investigate the isolation performance of the structure and its parameters. The results indicated that the design, which is low-cost and easy to construct, largely mitigates the seismic response at the top of the structure.
Nanda [17], used geotextiles as an isolator in brick masonry buildings and performed a shake-table study. The results were then compared with the experimental outcomes of quake-proofed buildings under the same conditions. The results showed that geotextiles offer great isolation performance based on the large reduction in response acceleration at roof level. Jayalekshmi et al. [18], presented a base-isolation approach in which fibre-reinforced soil was covered by a geotextile. The design is a practical technique with satisfactory performance. Wang [19], studied the seismic isolation performance and the shake table results for various sand cushions that varied in grain size and cushion thickness. A specimen consisting of large uniform grains yielded the best performance, and the increase in cushion thickness improved performance.
Yang [20], proposed slide isolation using a granulated-rubber ceramisite mixture (RCM) in which an RCM isolator was sandwiched between the superstructure and the foundation. In a major earthquake, the energy is dissipated in the slippage and friction at the interface, protecting the superstructure from the direct effects of the event and minimizing damage. The results indicate that the RCM isolation system offers good performance in major earthquakes by reducing the acceleration response of the superstructure. However, the residual displacement of the isolator can be comparatively high. According to this study, the isolation outcomes are controlled mainly by the material properties, component proportions and isolator thickness. Toopchi-Nezhad et al. [21], conducted a numerical simulation of two-storey masonry buildings with fibre-reinforced elastomeric isolator bearings and compared the results with data obtained from a study of a traditional masonry building. The results showed that the isolation bearing delivers quite stable performance in terms of shear deformation and mitigates the seismic response of the superstructure.
Ahmad et al. [22], performed a shake table test on a 1/4-scale one-storey masonry building with coarse dry sand as the base isolator. The results were compared with experimental data from the same model without an isolator. The results indicated that the isolator greatly reduced the acceleration response at the top of the structure: no visible cracking occurred even in a major simulated earthquake, whereas cracks formed in the specimen without the isolation base. Following up on this work, Ahmad et al. [23], performed a shake table test on two 1/4-scale models that were base-isolated using a sheet and coarse dry sand. The results showed that the former design delivered better isolation under the same conditions. Panchal and Jangid [24], identified an effective solution for improving structural response in near-fault earthquakes, namely the variable friction pendulum system.
Previous research has largely focused on multi-storey buildings such as hospitals, libraries, office buildings and other large public buildings. Although laminated rubber bearings and lead rubber bearings are two well-tested methods of base isolation, their cost and engineering can be burdensome, which is an obstacle to the commercialization of these designs. In comparison, the use of scrap tires, sand, geotextiles, and Poly tetra fluoro ethylene (PTFE) sheets in base isolation, although they are economical and simple alternatives, still requires further study in terms of post-disaster restoration. Therefore, the development of an economical seismic isolator for low-rise buildings is a pressing need that deserves further investigation.
This paper therefore proposes a marble-graphite slide seismic isolation system (MG isolation system), which is unique in its combination of isolation performance, cost effectiveness, stability, durability, waste-recycling potential and straightforward engineering. Due to the spheroid nature of the marbles, embedded marbles work much better as buffer rollers than does coarse sand. In other words, the two qualities shared by graphite and marbles, acceptable engineering cost and stable physiochemical properties, make these materials ideal for base isolation.
Scrap glass from process waste, door/window glass, curtain walls and glass bottles can be used to make the marbles, and the scrap glass is melted before processing. Glass waste presents a major public disposal problem in that the waste is a non-decomposable, non-flammable and non-degradable material. In other words, there is no way to degrade scrap glass naturally, making disposal of scrap glass a key environmental concern. Therefore, the proposed use of recycled glass in construction also provides a solution for minimizing glass waste in the environment.
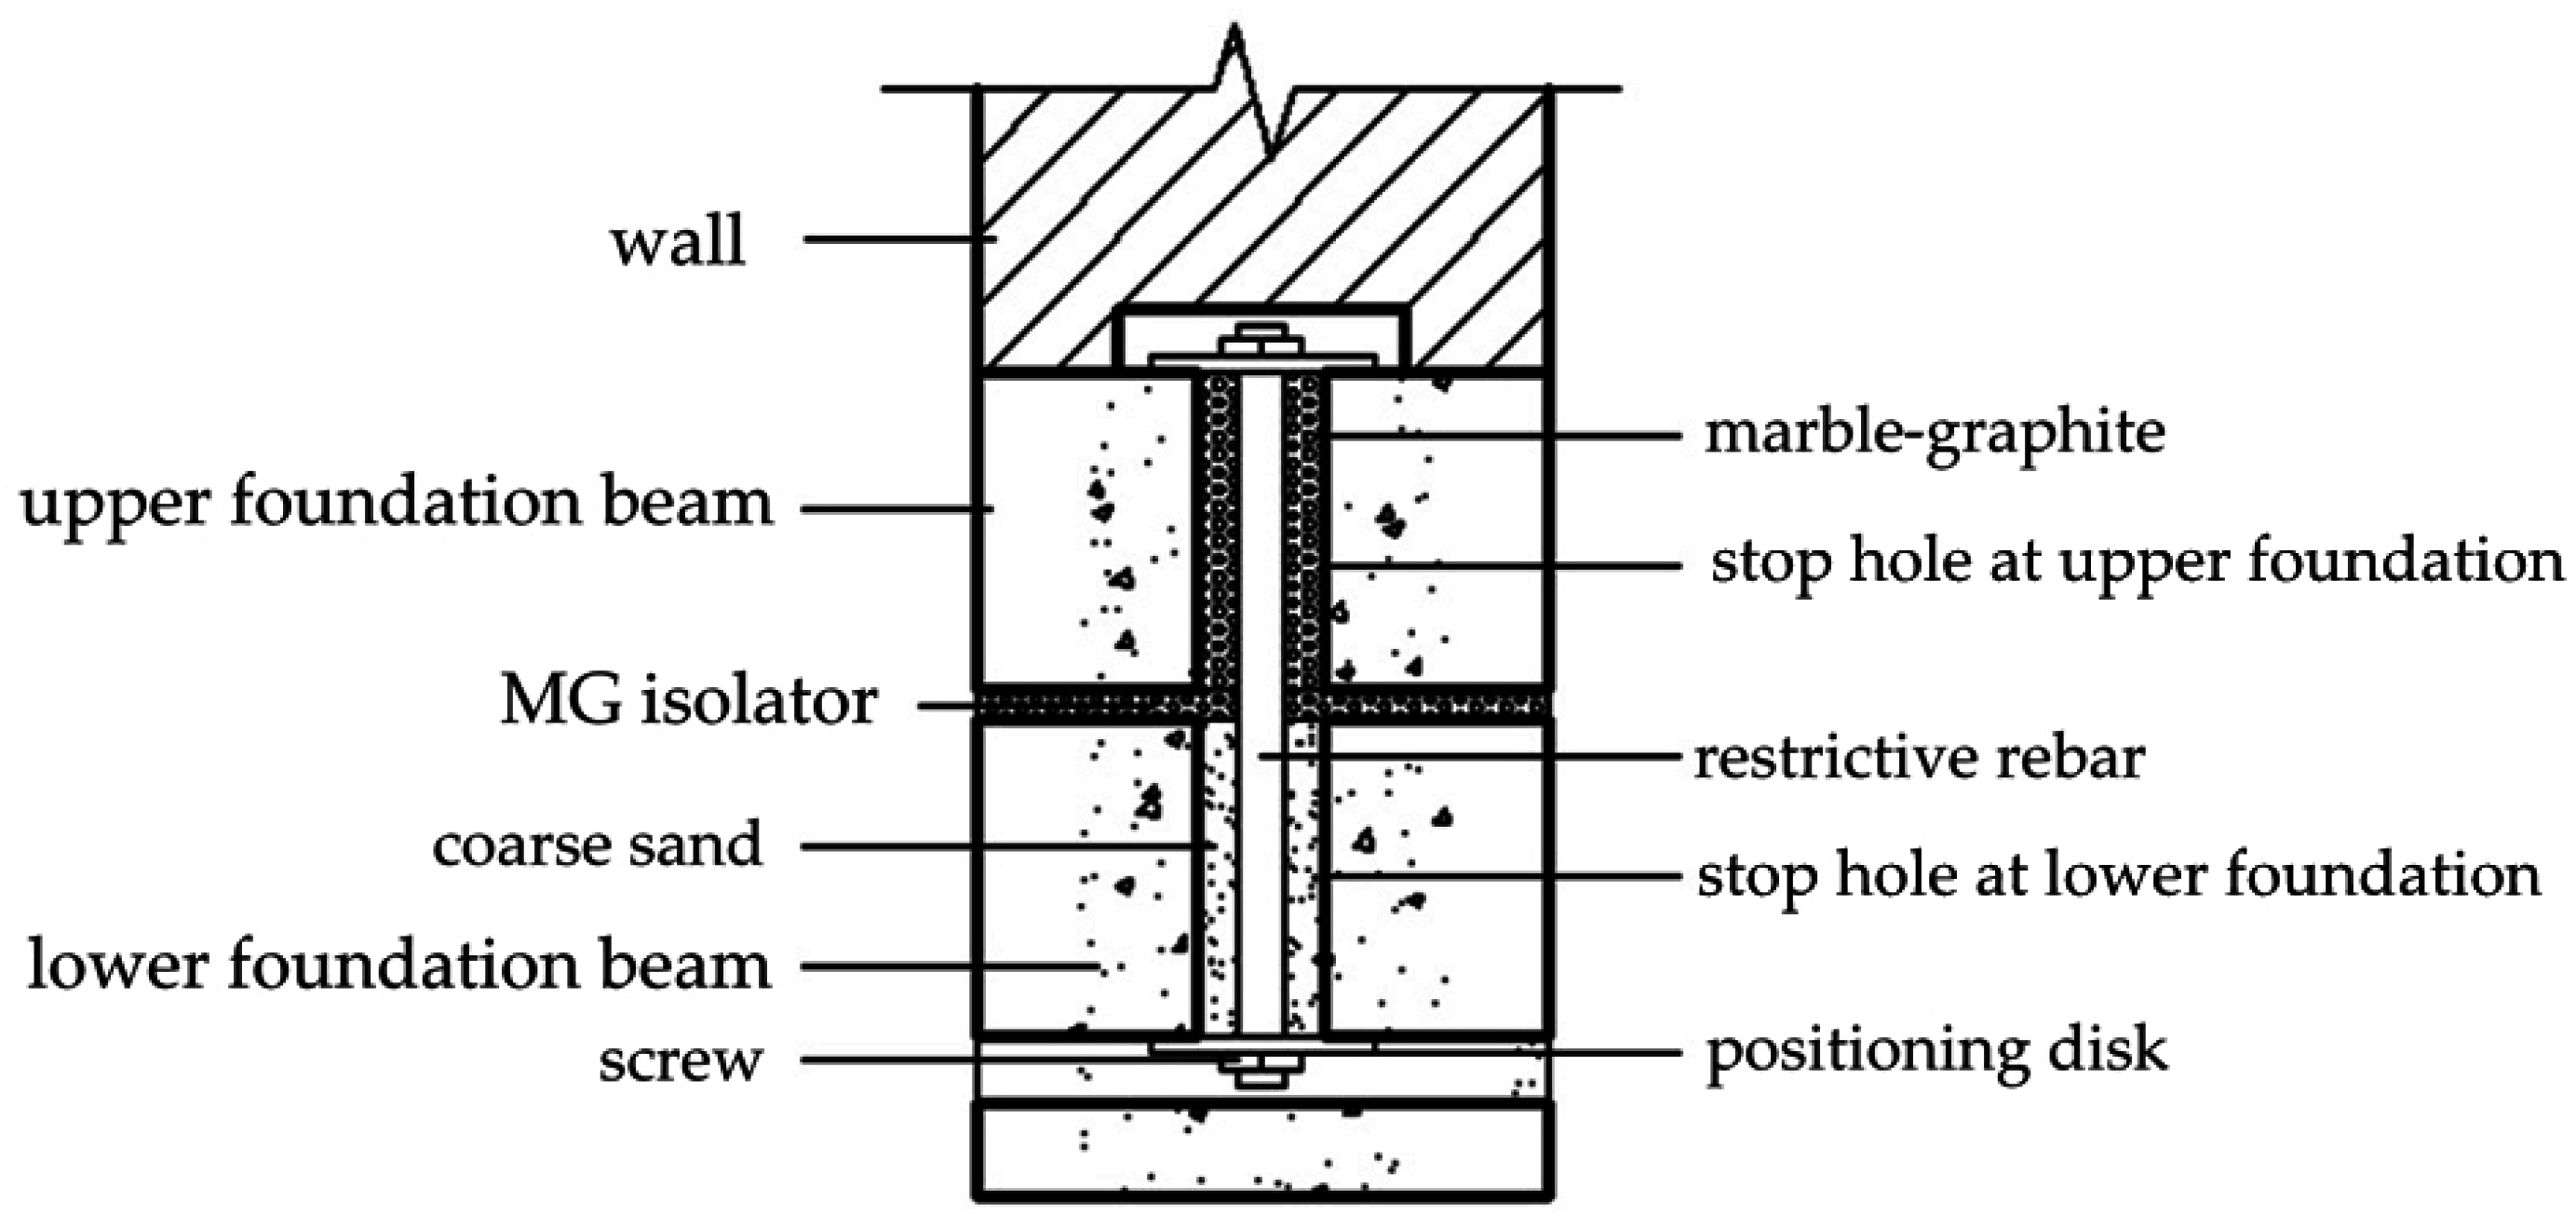
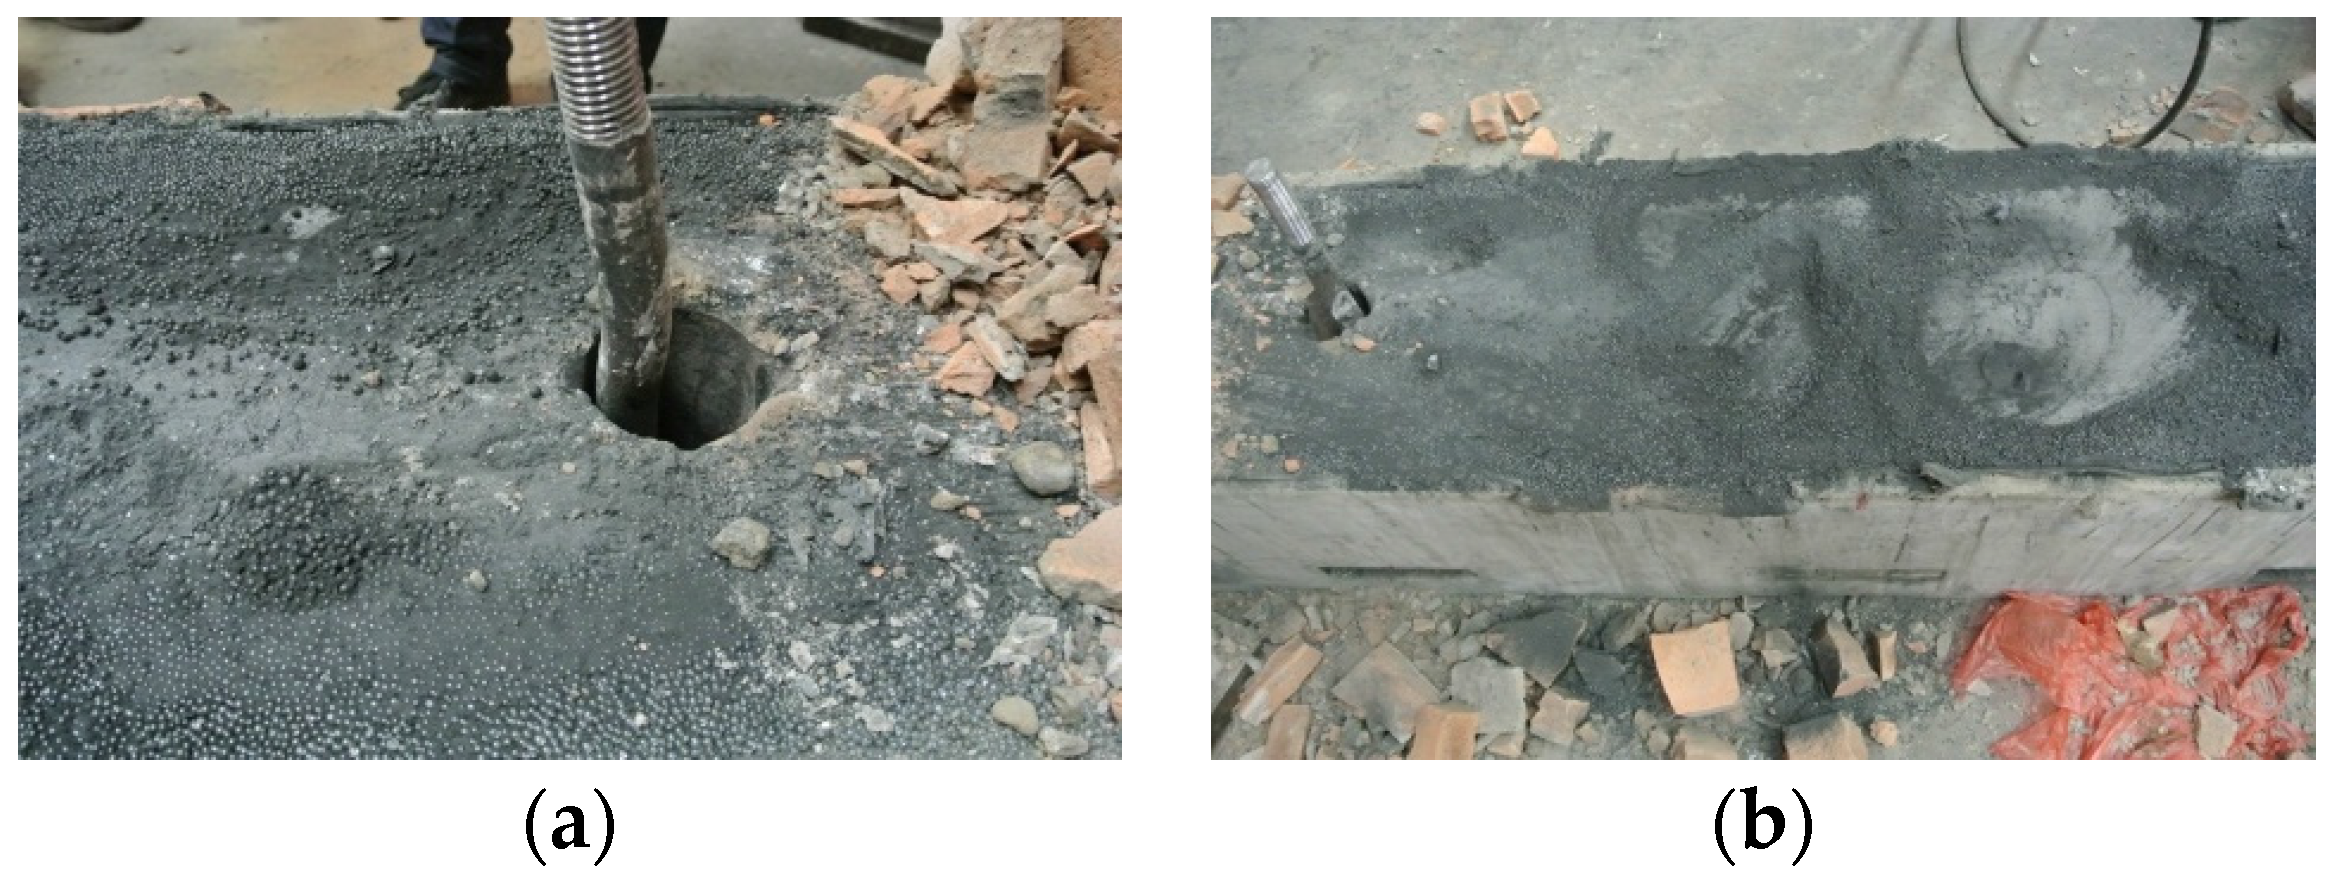
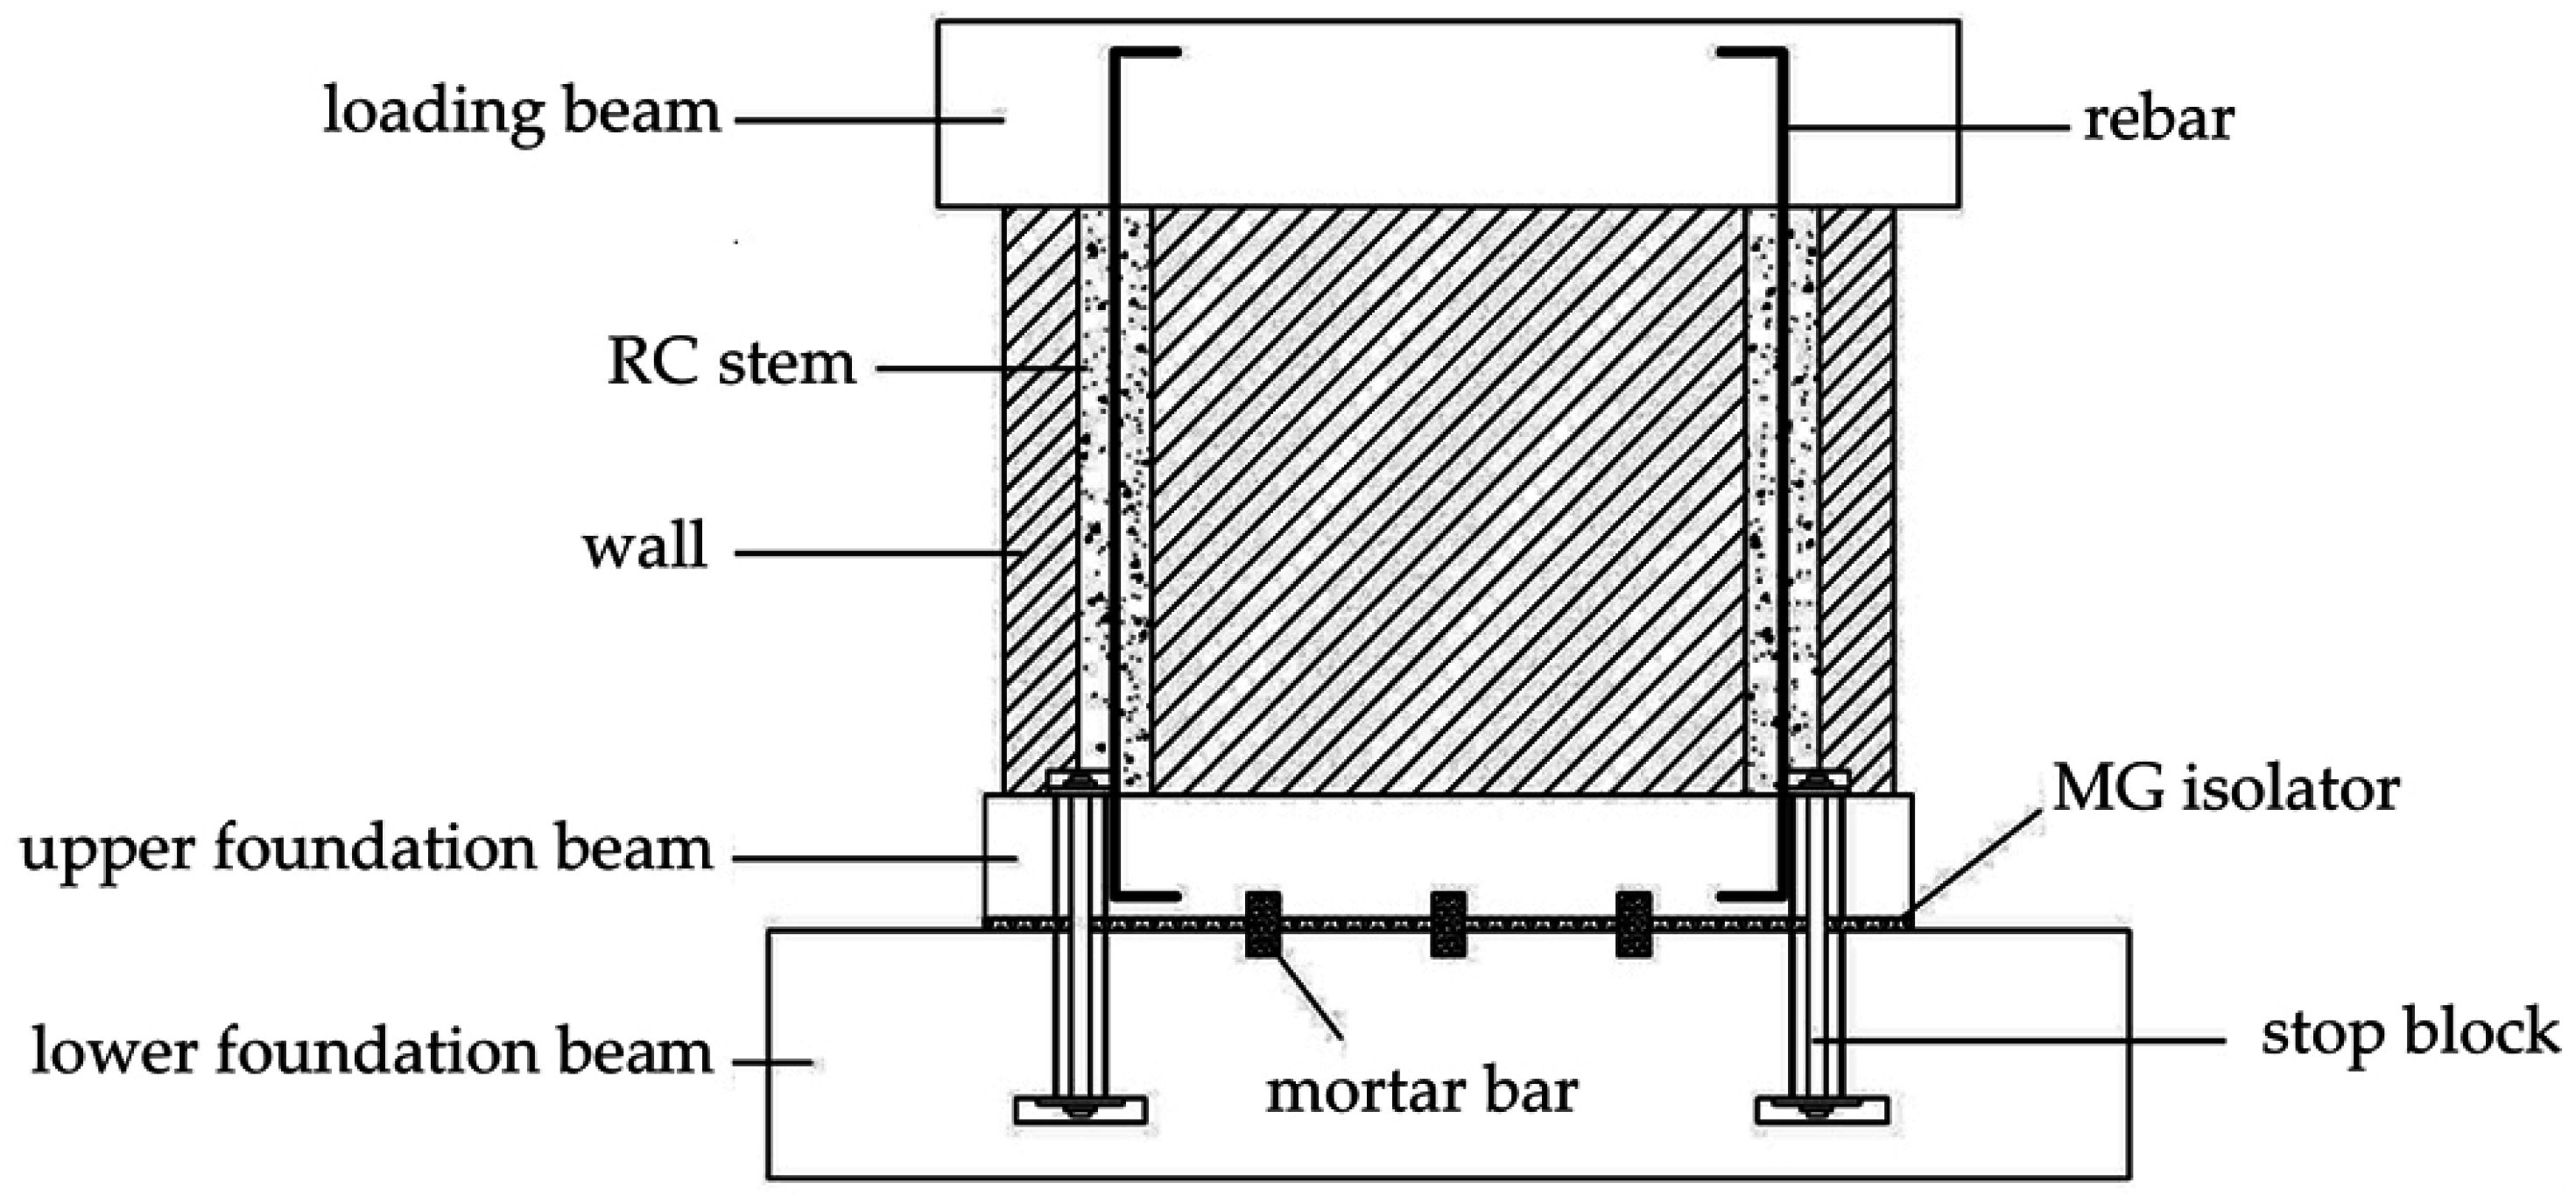
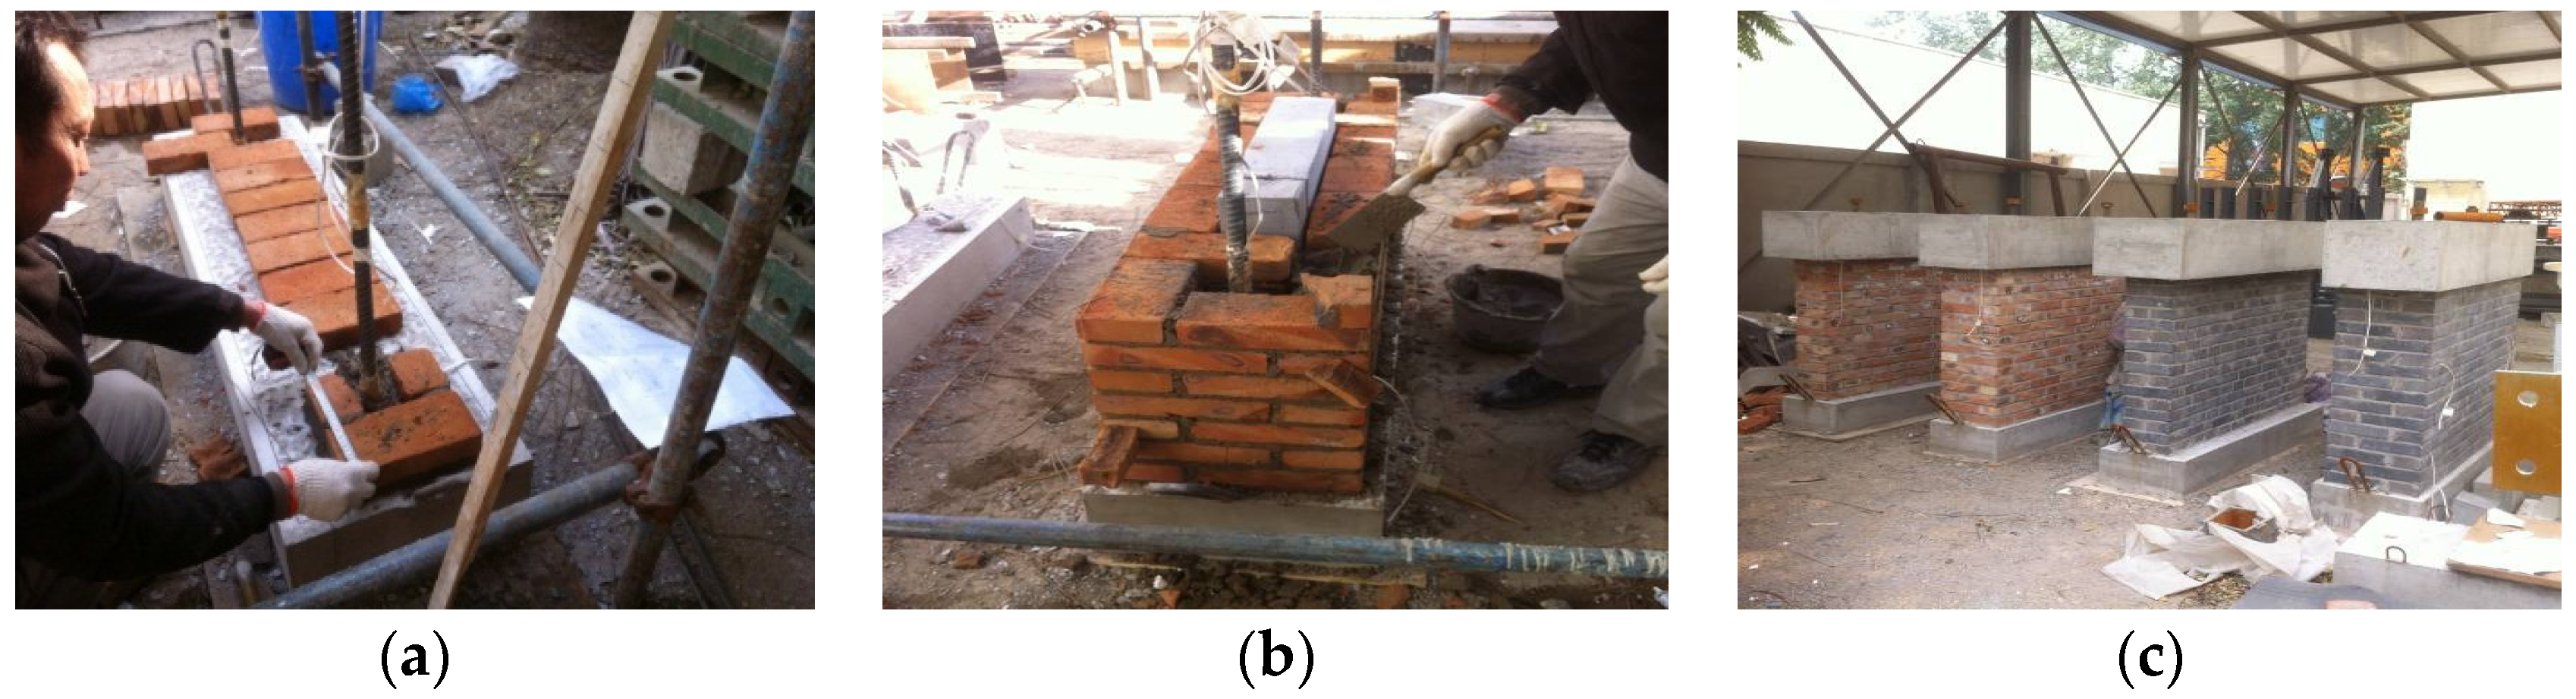
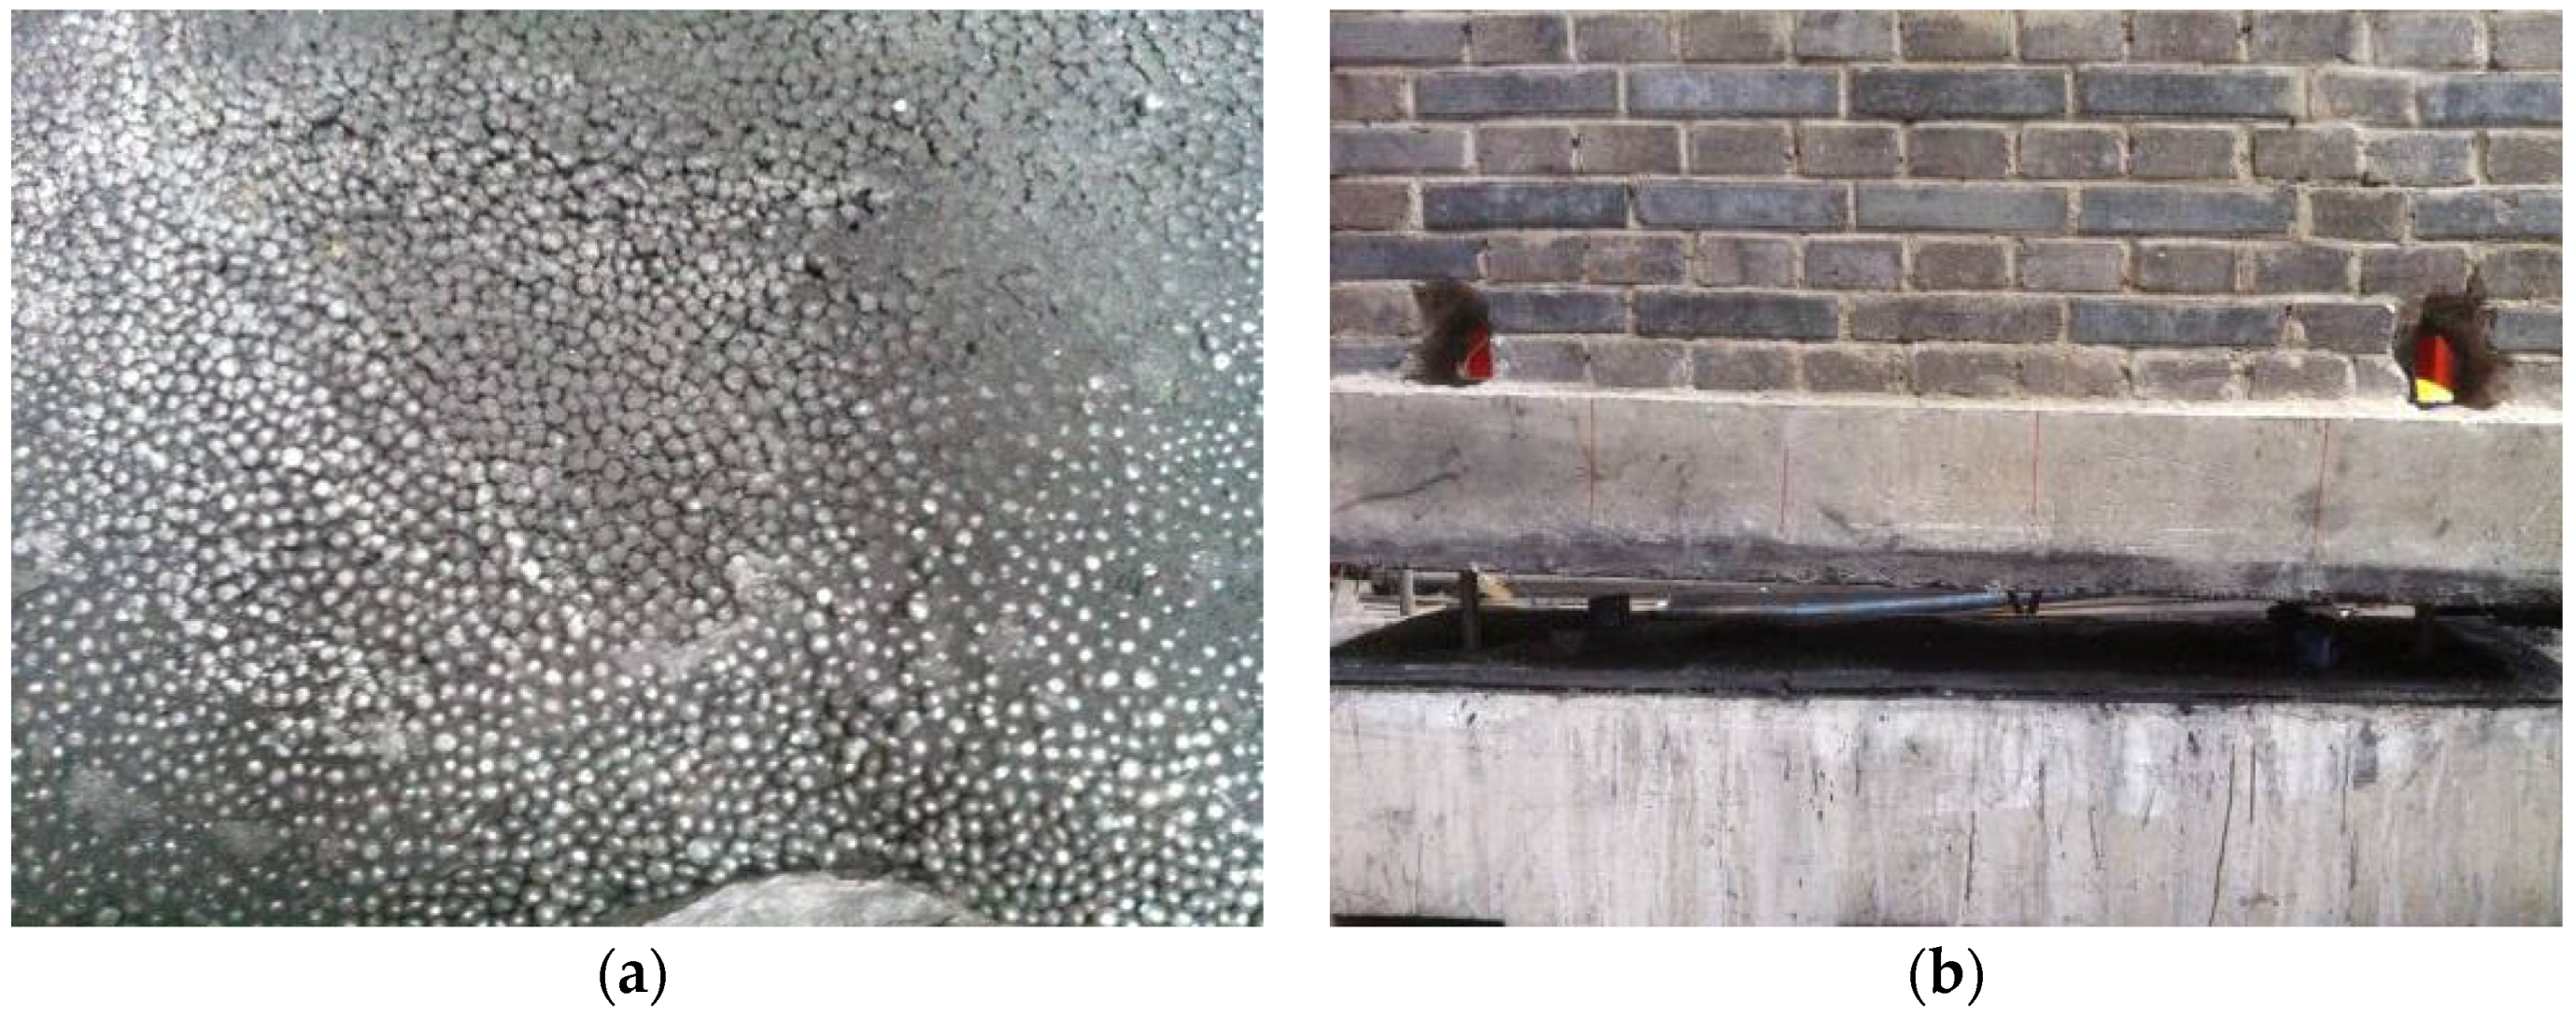
The MG isolation system is composed of a marble-graphite sliding layer (or MG slide), upper and lower foundation beams, and their corresponding stop blocks. The stop blocks include restrictive screws, positioning plates, nut connectors and stop holes linking the upper and lower foundation beams. In accordance with the seismic requirements, plain mortar bars can be provided at the beam interface to better control the initiating loads for foundation slippage at various magnitudes. The graphite and the rolling marbles serve as a lubricant and bearings, respectively.
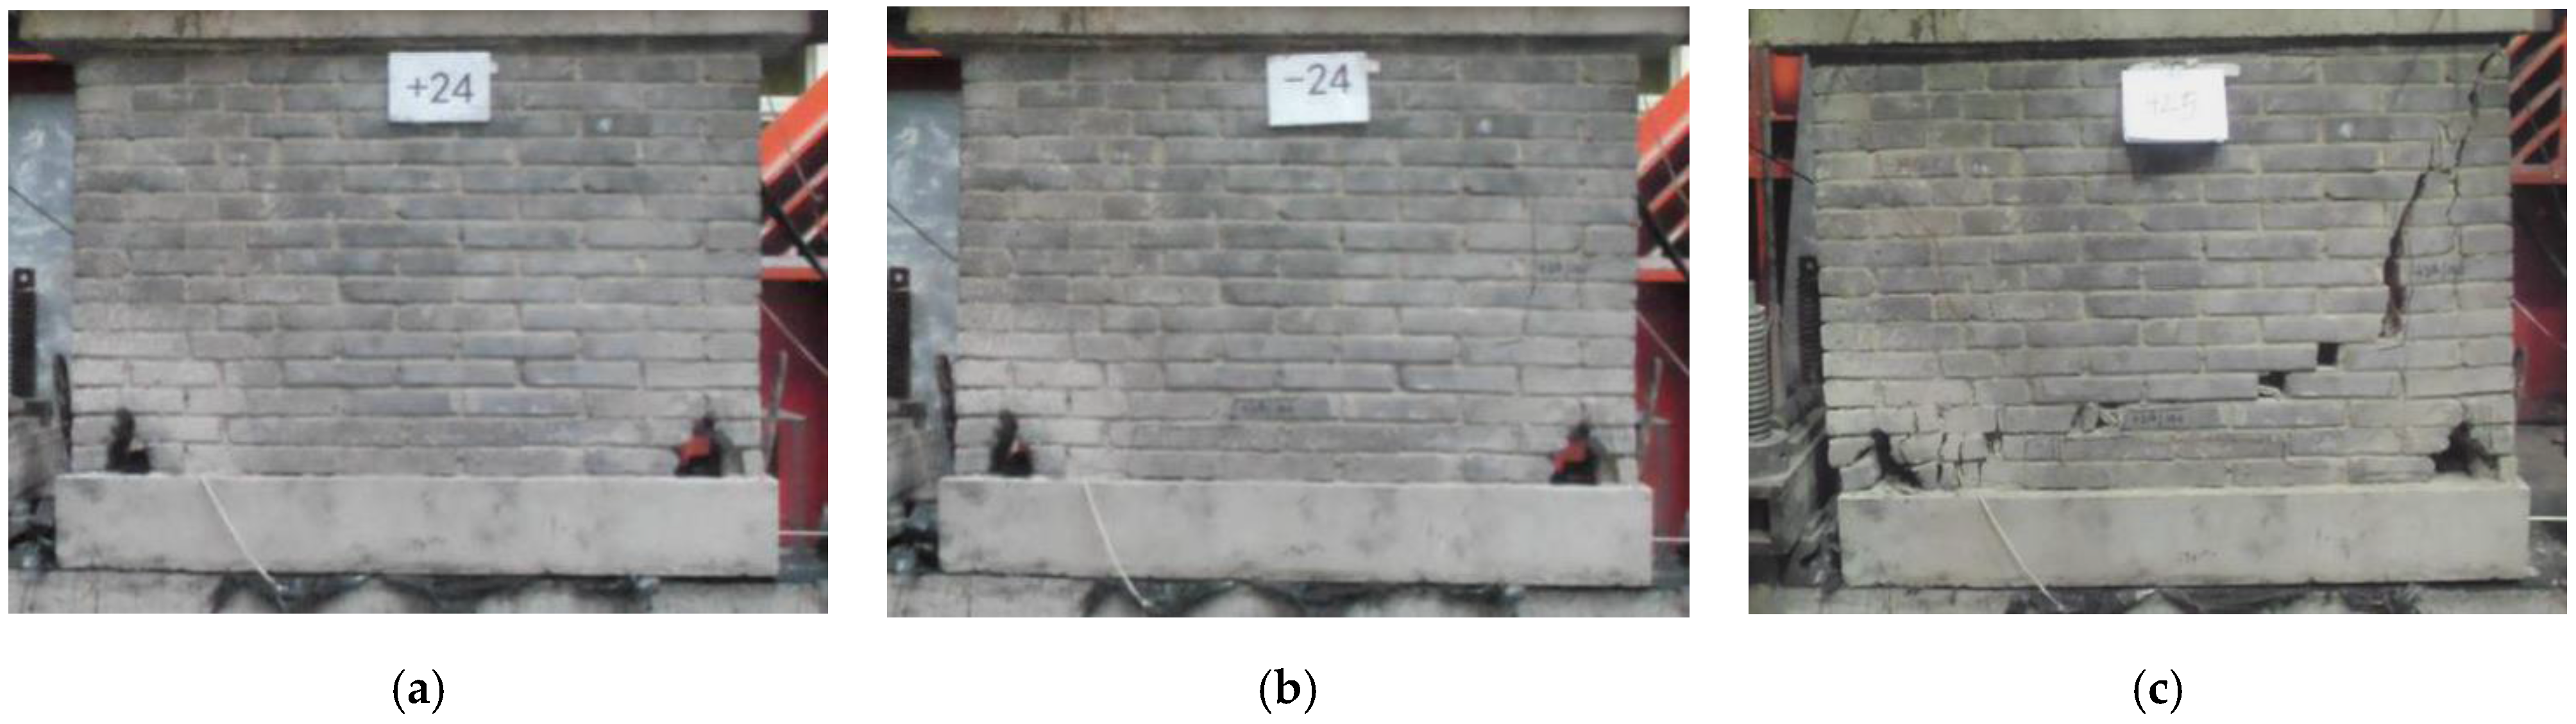
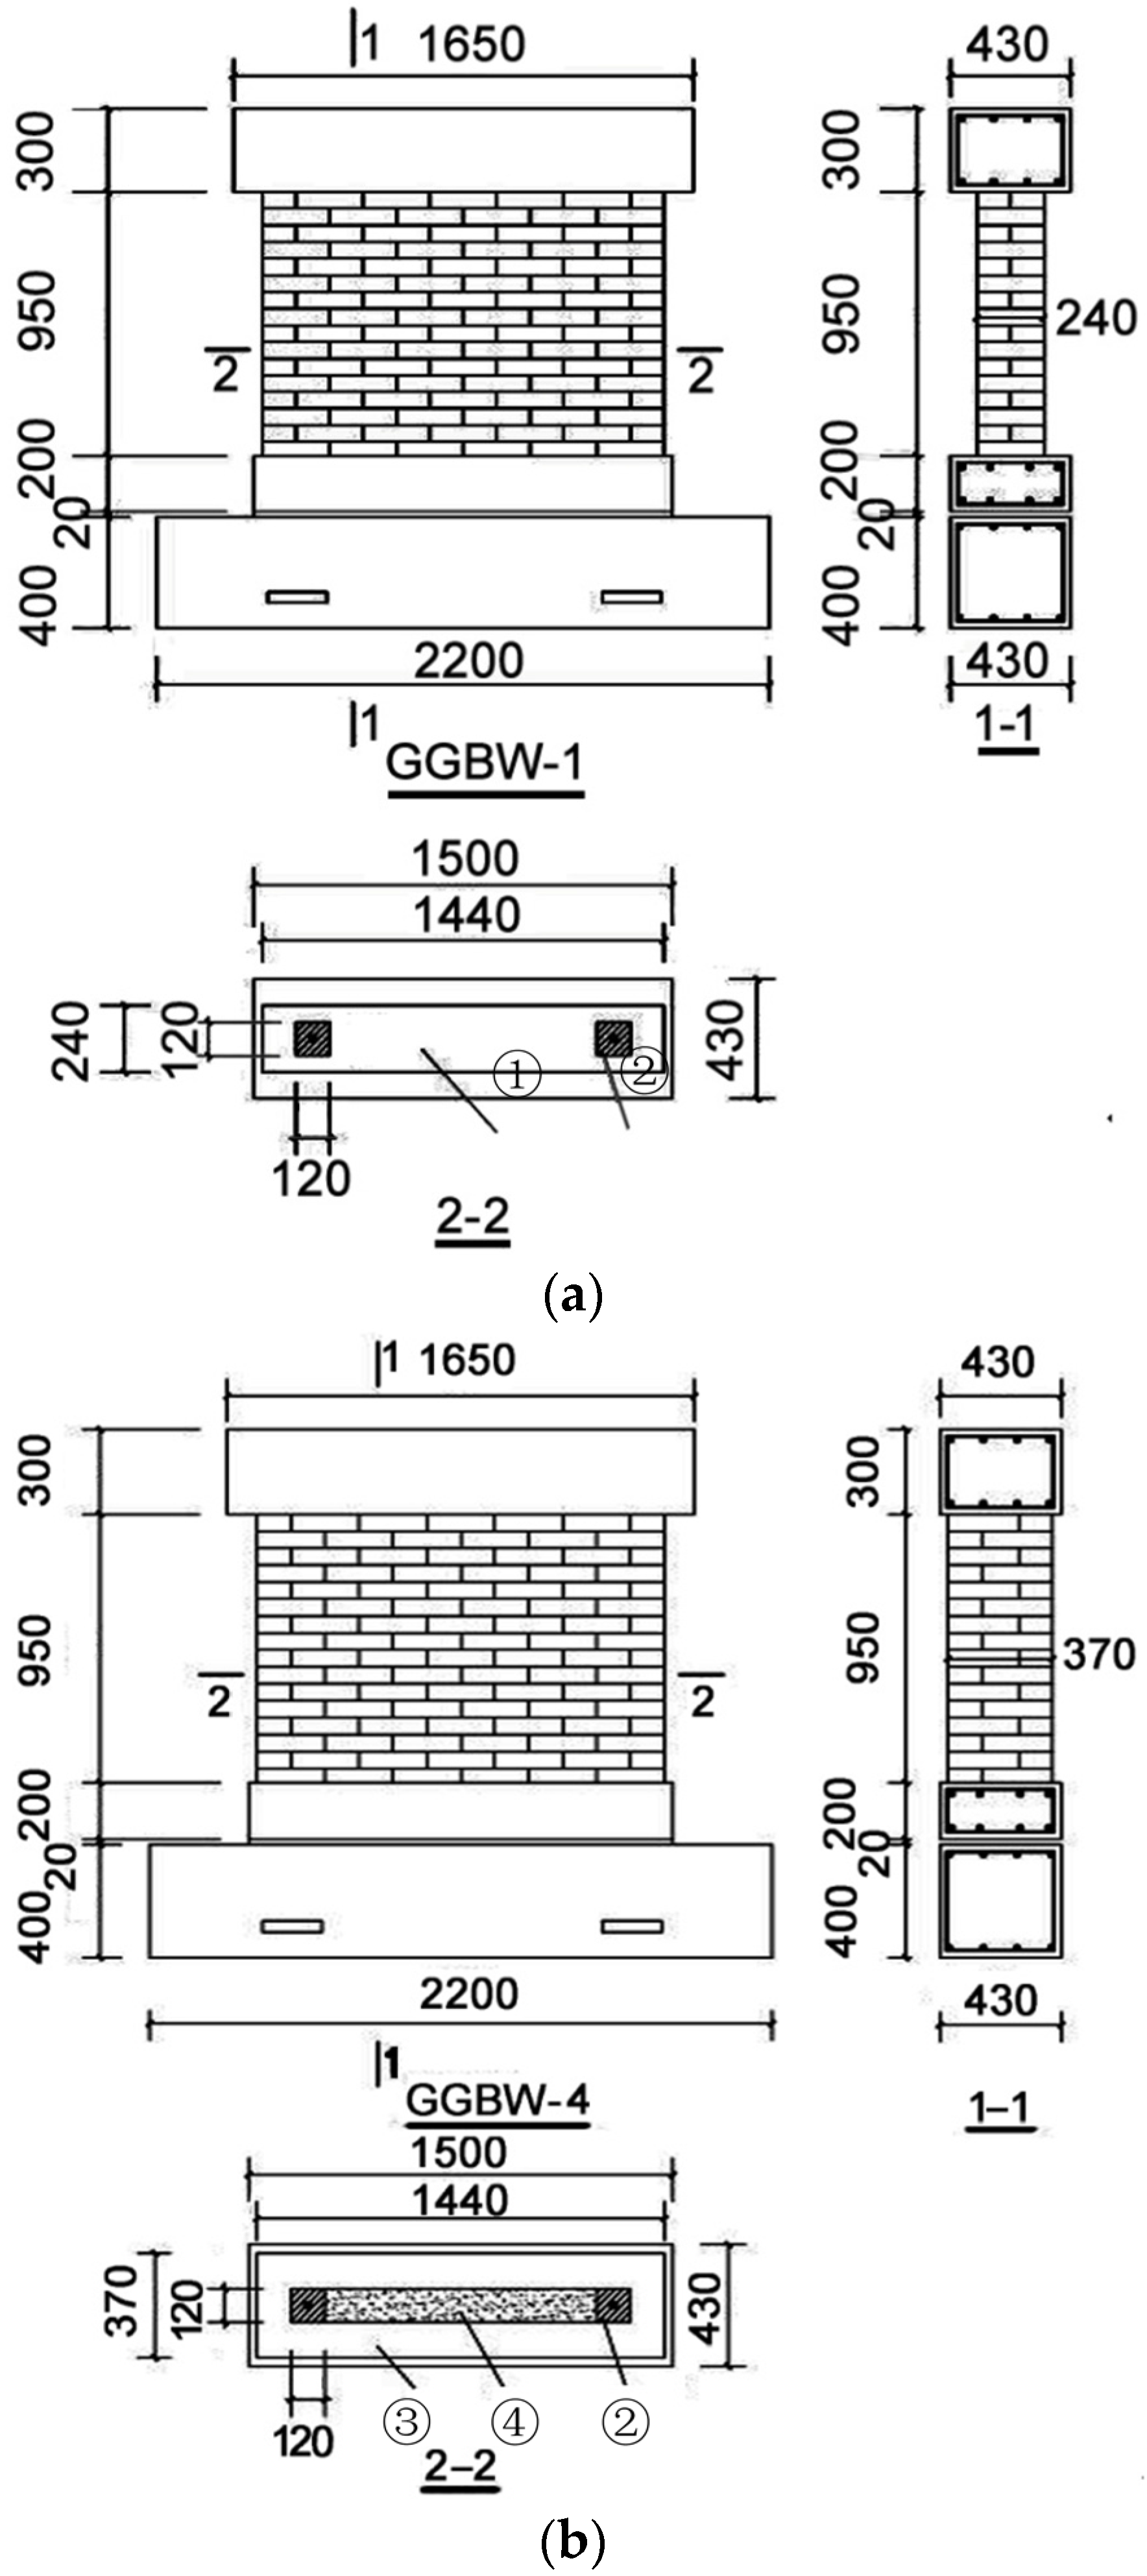
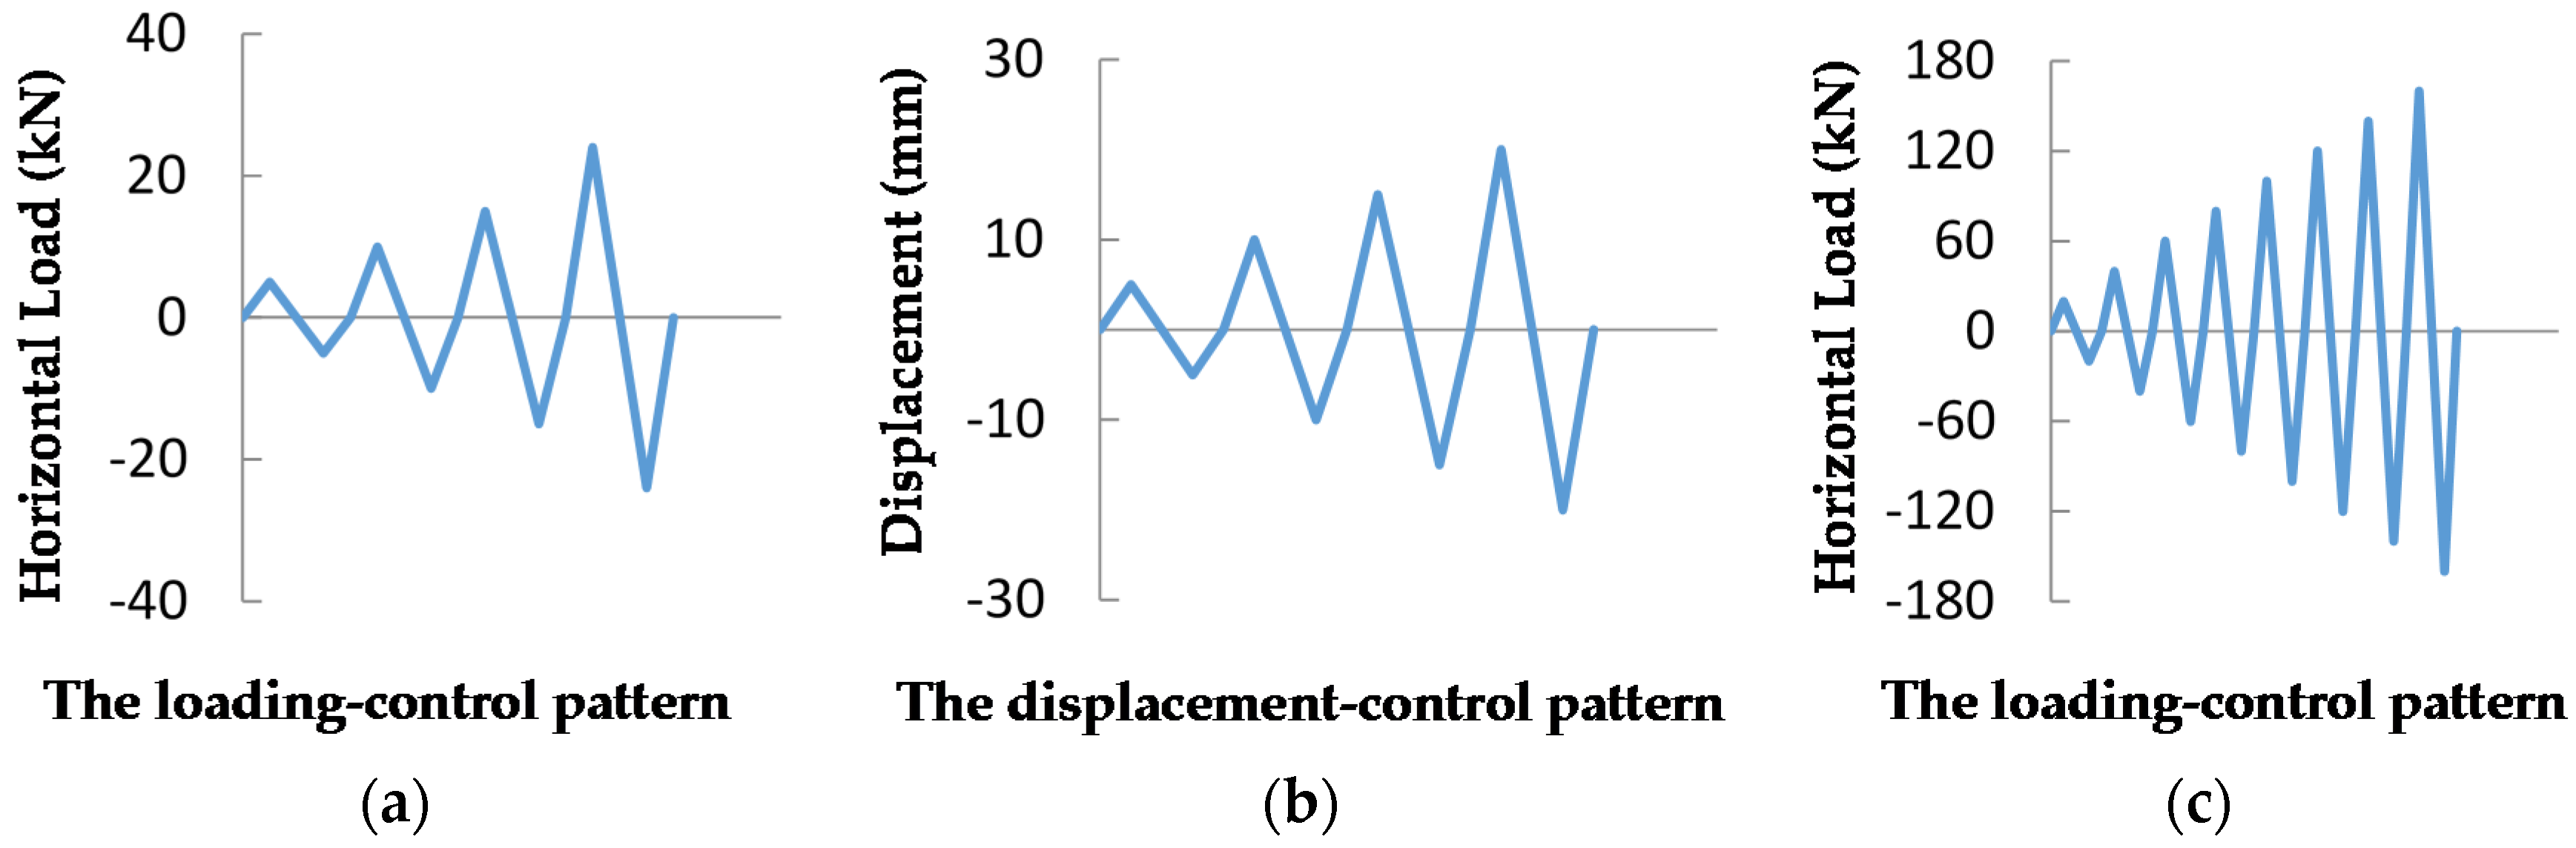
This study included low-reversed cyclic loading tests of four differently constructed walls to study the isolation performance of the mortar bar reinforced system. Then, the measured initiating loads were compared with the seismic resistance of the brick walls. The paper analyses the isolation performance of the MG slides, the effects of the mortar bars on the initiating load, the bearing performance and the damage incurred by the specimens. The results obtained facilitate, experimentally and theoretically, the application and commercialization of this new design.

2. Experiment Design

2.1. Specimen Design

The prototype is a three-storey structure which stands at 9 m in height—3 m for each storey—and 9 m × 9 m in area (with the height-width ratio being 1). With a wall thickness of 370 mm, the structure represents a symmetrical and orthogonal arrangement from the centre (surrounding arrangement excluded). The six walls measuring 9 m each are set on the 54-m-long foundation. Given that a small height-width ratio leads to the occurrence of X-shaped cracks, the paper designs the wall to be 1450 mm in height and 1440 mm in width. In other words, the height-width ratio close to 1 translates into force-bearing performance in a similar manner to what would happen in practice. The wall, taken directly from the prototype equals its original in height-width ratio (see Figure 1).
Four similar base-isolated masonry walls with MG slides were used in the study. As shown in Figure 2, the lower foundation beam, upper foundation beam, wall and loading beam are arranged sequentially from the bottom to the top. The slide isolation system consists of the two foundation beams, with the MG slide sandwiched between the beams and the two embedded stop blocks. With cement as an adhesive agent when necessary, the holes reserved for plain mortar bars are set in both the upper and the lower beams. The wall, with reinforced concrete stems (RC stems) installed at both ends, is shouldered by the upper beam of the foundation, and the two ends of the embedded steel bars are anchored to the loading beam and the upper beam.
As Figure 3 shows, the stop block is composed of restrictive screws, positioning plates, nut connectors and stop holes; the holes are set at corresponding locations in the upper and lower beams. Marble-graphite filling is poured into the stop hole in the upper beam to compensate for potential material loss during slippage under seismic excitation, and the hole in the lower beam is filled with coarse sand, which is relatively economical and blocks downward flow of the MG mixture. The restrictive screws extend through the holes in the upper and lower beams and are fastened with nuts, and the positioning plate with an elastic pad is cushioned between. The pad does not decrease the shear strength or the restrictive performance of the screws, but it helps reduce the tension induced by their inclination during slippage.
This base-isolated system works as follows. As the horizontal loading reaches the initiating load for slippage (i.e., the positive or negative load imposed by the slippage of the MG isolator as the external force exceeds the combined isolator friction and shear strength of the mortar bars), brittle strain first occurs in the mortar bars, followed by slippage of the MG isolator. In this process, the structures show a visible drop in slippage-resisting stiffness, a major increase in the natural vibration period and a significant decrease in the seismic effect on the superstructure. Simultaneously, the rolling of the marbles dissipates the seismic energy input. As a lubricant, the graphite helps avoid collisions between the marbles, thereby minimizing the initiating load for the sliding and the seismic forces on the superstructure. The coarse sand in the stop holes in the lower beam blocks the downward flow of the MG filling. The MG filling, in contrast, is poured into the stop holes in the upper beam to compensate for potential material loss during slippage with seismic motion; this mechanism resembles that of a millstone.
The configurations of the specimens are listed as follows. Specimen Glass-Graphite-Base-Wall-1 (GGBW-1) is a 240-mm-thick clay brick wall without embedded mortar bars. The diameter of the stop hole in the upper beam is 30 mm. Specimen GGBW-2 is a 240-mm-thick recycled brick wall without mortar bars and with an upper hole diameter of 30 mm. Specimen GGBW-3 is a 370-mm-thick clay brick wall with flay ash masonry blocks sandwiched between. Eight mortar bars are embedded within, and the diameter of the stop hole in the upper beam is 80 mm. Specimen GGBW-4 is a 370-mm-thick recycled brick wall with flay ash masonry blocks sandwiched between. Six mortar bars are embedded within, and the diameter of the stop hole in the upper beam is 80 mm. Figure 4 shows the designs and dimensions of the specimens.
The stop holes in the upper foundation beams of the four specimens are designed with a 30-mm diameter and an 80-mm diameter, while for the lower foundation beams the figure is set at 80 mm. The purpose of such an arrangement is to unveil the influence of diameter changes of the stop hole in the upper foundation beam on the slippage performance of the specimens, the results of which are with reference to the design of such holes in the upper foundation beam.
Given that the MG mixture layer requires a certain thickness to ensure even arrangement and satisfying performance against seismic influence, the paper set the thickness of the mixture layer at 20 mm, which is twice the thickness of the mortar joint (10 mm).
The making of the specimens is initiated by first fastening the steel bars of the upper and lower foundation beams while embedding the steel bars to the upper concrete stems (32 mm in diameter). We choose the C20 longitudinal bar and the φ6 stirrup for the process. With the mould in place, the concrete pouring starts where the strength of the concrete is set at C35. As the requirements for the concrete strength of the upper foundation beams are well met, the making of the upper wall and of the stem holes is initiated. For the 240-mm-thick specimens, recycled bricks and clay bricks are used, with the stem holes reserved at each end, while for the other two pieces—370 mm in thickness—flay ash blocks are sandwiched between either recycled brick pieces or clay brick pieces. Then, the steel bars embedded in the upper loading beams are fastened. As the mould is set, fine aggregate concrete—C35 in strength—is used for the pouring of stems and for the upper loading beams. Please see Figure 5 for the making of the specimens.

2.2. Equipment and Measurement

Figure 6 shows a drawing and photograph of the equipment and measurement setup. Two vertical jacks and one horizontal jack are used to impose the vertical and horizontal loads, respectively, while force sensors are used to measure the loading at the ends of the jacks. The sensor for the horizontal displacement is set at the end of the upper foundation beam. Dial indicators are installed at the end of the lower foundation beam to detect slippage in the horizontal direction.
Before the horizontal loading is initiated, the two vertical jacks each impose a 50-kN (or 100-kN total) force, which is held constant throughout the experiment. The vertical loading of 100 kN is chosen as it is believed to be the general case for such a section in a large force bearing. For example, for a 9 m × 9 m three-storey house (81 m2 in storey area), the total is 243 m2 in area. If the loading imposed on each square meter is assumed to be 15 kN (dead weight considered), the house totals 3645 kN in weight (243 m2 × 15 kN/m2). Given that the wall totals 54 m in length (9 m × 6), the loading borne at the bottom averages at 67.5 kN/m (3645 kN/54 m). The wall section applied for the experiment registers 1.45 m in length. Therefore, upon its application, the vertical loading imposed upon should be approximately 100 kN (67.5 kN/m × 1.45 m = 98 kN).
The loading control in the horizontal direction is applied as follows. Before isolator slippage, the testing involves a loading-controlled approach. As the specimen enters the stage of isolator slippage, the testing then changes to a displacement-controlled approach. As the slippage reaches the upper limit, the stage of seismic resistance is initiated, and a loading-controlled approach is applied. The loading approach is listed in Figure 7 (one single cycle requires 10–15 min, which is then followed by a 5–10-min break to view the results). Upon the initiation of horizontal loading, such loading is imposed gradually in 5 kN increments (fourincrements to reach the initiating load) with the peak values at each loading cycle being 5, 10, 15 kN and the initiating load. Upon the slippage of the specimens, cyclic loading is imposed to reach the maximum slippage in 5-mm increments (5, 10, 15 mm, etc.). At the stage of seismic resistance, a 20 kN interval is adopted before the specimens reach the peak value.

2.3. Material and Performance Indicator

The MG isolator, i.e., the layer consisting of the marble and graphite mixture, performs best when the volume ratio of marbles to graphite is 5:2, and the quality ratio is 5:1. Figure 8 shows photographs of the MG mixture and the MG isolator in place.
Table 1 and Table 2 present the main characteristics of the marbles and graphite.
Due to the graphite lubricant, the MG mixture delivers far better strength resistance than the marble isolator without graphite. The mortar bar, with a height of 100 mm and a diameter of 50 mm, is made of mortar-filled recycled plastic bottles. The mortar is composed of 275 kg of mortar cement, 1450 kg of sand and 300 kg of water and is typical of the mortar used in masonry walls. With a design strength of M10, the mortar has a measured compressive strength of 10.03 MPa. A certain number of marbles can be added to the mortar bar to minimize potential impacts on the MG isolator in case of a mortar bar crush. Figure 9 shows photographs of the finished bars and their placement.
Please see Table 3 for the performance indicators of the other materials.

3. Experimental Analysis

3.1. Experimental Phenomenon

The slippage and failure of the four specimens in the experiments were similar. The experimental behaviour consisted of three stages as follows:
Preliminary Deformation Stage: A preliminary deformation stage occurs from the initiation of horizontal loading to the start of the isolator slippage. The force control is applied so that a minor vibration does not generate isolator slippage. As the relevant displacement between the upper and the lower foundation beams is maintained at a relatively low rate, the wall reaches the stage of elastic deformation.
Isolator Slippage Stage: The isolator slide stage (or the stage where elastic deformation of the stop blocks occurs) is the period from the beginning of slippage to when the displacement is reached. The force-controlled approach is used so that isolator slippage is initiated under moderate seismic force, while it is brought into full play under the vibrations of a major earthquake. At this stage, the wall suffers no visible damage. The horizontal loading exceeds the initiating load, and slippage occurs at interface of the MG slide with the upper and lower beams. The horizontal loading remains quite stable, the curves of cyclic loading and slippage displacement show no visible fluctuation and the slippage performance of the isolator remains exceptional. Compared with the slippage of the foundation beams, the wall remains elastic and displays far less horizontal displacement. Upon increasing the horizontal load, the load-displacement curve shows no visible sign of returning to its original position. The deformation of the isolator is plastic, and the elastic deformation remains relatively small. Therefore, the isolation performance of the MG slide remains reliable.
Stage of Seismic Resistance of Wall: From the elastic-plastic deformation of the restrictive screw to the failure of the wall, the force is controlled to ensure the simulation of a major seismic event while avoiding the collapse of the wall. As the loading continues, the slippage displacement increases; the restrictive screws help restrain any dislocation between the stop holes in the upper beam and lower beam while preventing slippage at the foundation-beam interface. During this stage, the specimens undergo seismic resistance. As the horizontal loading increases, the relative slippage displacement between the upper and lower foundation beams declines. This process corresponds to the deformation of the restrictive screws—from elasticity to elastic plasticity—and to the interaction and compression between the seismic isolators and the components of the stop blocks. Despite the slippage of the wall relative to the upper foundation beams, no crack is observed on the surface. As the cyclic loading continues in the horizontal direction, cracks occur at both ends. When the loading limit is reached, the specimen shows widened cracks, increased displacement and a decreased capacity for force bearing, and as a result, the specimen yields. During this stage, the loading-displacement curves develop a “┌┘” pattern.
The steel bars of the stop blocks (the force imposed upon which at the preliminary deformation and isolator slippage stage is insignificant) consume only limited energy in elastic deformation, mainly due to the rolling of the marbles. At the seismic resistance of the wall stage, the loading is imposed until the yield of the restrictive rebars and the cracking of the wall, after which the loading continues until the accelerated deformation and then the failure of the wall. Therefore, in this destructive experiment, the seismic energy is consumed in the rolling of the marbles and in the deformation of the steel bars embedded in the stop blocks. However, in the interest of safety, we set a rule where the restrictive rebars should not enter the yielding stage and the wall should not crack.
Observations during the experiments are as follows.
(1) GGBW-1: The initiating load was 18.72 kN. In the positive direction, the displacement limit and the average force of slippage were 35.80 mm and 18.90 kN respectively, and in the negative direction, the two figures were 20.00 mm and 19.58 kN respectively. The split limit and the loading limit were reached at 94.0 and 132.67 kN respectively. See Figure 10 for the failure process of GGBW-1.
(2) GGBW-2: The initiating loading for GGBW-2 was 23.35 kN. In the positive direction, the displacement limit and the average force of slippage were 34.20 mm and 21.70 kN, respectively, and then changed into 22.80 mm and 21.11 kN in the negative direction. The split limit and the loading limit were reached at 120.0 kN and 142.66 kN respectively. See Figure 11 for the failure process of GGBW-2.
(3) GGBW-3: The initiating load during the testing of GGBW-3 was 29.11 kN, which was greater than the initiating load during the testing of GGBW-1 and GGBW-2 due to the reinforcement by the mortar bars. In the positive direction, the displacement limit and the average force of slippage were 41.70 mm and 17.87 kN, respectively, and in the negative direction, they were 55.50 mm and 18.80 kN. The rise in the displacement limit was greater than the diameters of their counterparts in the two previously discussed specimens. The split limit and the loading limit were 151.00 kN and 160.28 kN, respectively. See Figure 12 for the failure process of GGBW-3.
(4) GGBW-4: The initiating load for the foundation slippage of GGBW-4 was 26.54 kN. In the positive direction, the displacement limit and the average force of slippage were 65.10 mm and 21.00 kN respectively, while in the negative direction, these two values were 47.20 mm and 18.10 kN respectively. The split limit and the loading limit were 140.00 kN and 151.65 kN, respectively. Please see Figure 13 for the failure process of GGBW-4.
See Figure 14 for the MG slide and restrictive rebars.

3.2. Hysteretic Curves and Skeleton Curves

The hysteretic curves of horizontal loading (F) and the horizontal displacement of the upper foundation beam (U1) obtained from the tests are depicted in Figure 15. We can conclude that the slippage displacement and the deformational displacement jointly result in the horizontal displacement of the upper beams. More specifically, from the start of loading until the displacement limit is reached, slippage displacement prevails. During the stage of seismic resistance, the combined effects of the plastic deformation of the restrictive screws and the interaction between the stop blocks and the isolator occur.
The following patterns can be observed in Figure 16. (1) As the horizontal loading reaches the initiating load, the specimens overcome the friction at the isolator interface, and slippage begins. At this point, the loading-displacement curves develop within a moderate loading band, which indicates good performance in terms of seismic isolation; (2) The mortar bars embedded in GGBW-3 and GGBW-4 help control the initiating load, the effect of which can be seen in the visible peaks in the loading-displacement curves in the preliminary stages; (3) In comparison with their counterparts, GGBW-3 and GGBW-4 contain larger stop holes in the upper beams. Therefore, the hysteretic curves of both specimens show longer sections of moderate development. In other words, the slippage allowance can be adjusted by changing the stop hole diameter; (4) As the specimens reach the displacement limit, the stop holes restrain further movement of the restrictive screws. At this point, seismic resistance comes into play, and the gradients of the hysteretic curves increase by steps. As the loading continues to increase, the specimens are cracked and then damaged and destroyed.
Figure 15 shows the hysteretic curves of horizontal loading (F) and horizontal displacement of the loading beam (U2) of GGBW-1, GGBW-3 and GGBW-4. In the test of GGBW-2, the displacement sensor on the loading beam malfunctioned; therefore, no data were collected, and the results are not presented. The horizontal displacement (U2) is induced by the horizontal displacement of the upper foundation beam (U1) and the deformational displacement in the lateral direction of the wall.
Figure 17 shows a comparison of F-U1 and F-U2 in terms of the hysteretic curve and the skeleton curve (with the exception of specimen GGBW-2, where we fail to obtain the F-U2 hysteretic curve).
The curves in Figure 15, Figure 16 and Figure 17 lead to the following conclusions. (1) The hysteretic curves of F-U2 and F-U1 are essentially identical during the first two stages, i.e., the preliminary deformation stage and the isolator slippage stage. Therefore, the lateral deformational displacement is insignificant compared with the displacement of the upper foundation beam, indicating quite good isolation performance; (2) During the seismic resistance stage, the horizontal displacement in the F-U2 hysteretic curve largely exceeds the horizontal displacement of its counterparts, due mainly to the lateral deformational displacement of the wall. During the next stage, the slippage skeleton curves of the upper beams steepen, indicating the excellent performance of the stop blocks. In this process, the displacement of the loading beam exceeds the displacement of the upper beam, and the walls are damaged. Therefore, due to the reinforced structural columns concealed at both ends, the walls deliver good seismic resistance performance.
Table 4 shows the values of inter-storey drift with respect to the storey height attained at the peak force and at the end where the wall cracks (referred to as IDImax and IDIfinal, respectively (IDI is the index of inter-storey drift with respect to the storey height)).
Table 4 provides the displacement angles of GGBW-1, -3 and -4 under the loading limit and the angles arrived upon the failures, with the average for the former and the latter being 1.74% and 2.76%, respectively. Therefore, the displacement–angle ratio record is 1.50. That is to say, the ductility of the wall—though still falling behind in comparison with the performance of the reinforced wall—exceeds most of the masonry walls thanks to the RC stem that is embedded. Given that the test itself is destructive in nature, the displacement angle exceeds the value permitted for engineering projects. However, in practice, the slide isolator in place and the non-occurrence of wall cracking will lower the displacement angle.

4. Performance Analysis

4.1. Force-Bearing Performance of the MG Isolator

Major seismic force initiates the work of the MG isolator, which slips to minimize the transfer of seismic energy to the superstructure. The following aspects are highlighted in the design of the MG slide isolator. Under minor seismic force or wind loading, the induced friction and the mitigation of the mortar bars, if any, prevent the initiation of slippage. However, as moderate seismic vibration breaks the embedded mortar bars, slippage begins at the isolator interface. As the imposed load continues to mount and reaches the load of a major earthquake, slippage proceeds. When the restrictive screws press against the stop holes in the upper and lower foundation beams, the specimens reach the displacement limit. At this point, the stop blocks come into play to guard against over-displacement of the foundation, or worse, a collapse.
In accordance with the Code for Seismic Design of Buildings (GB50011-2010) [25], equation FEk = α1Geq can be used for calculating the horizontal seismic force imposed on the foundation of a masonry structure (FEk: benchmark value for seismic influence upon the structure in the horizontal direction; α1: coefficient for horizontal seismic influence as the structure reaches the natural vibration cycle T1; Geq: the aggregate of the vertical loading imposed and the gravity of the specimen itself).
Considering the relatively short cycle of low-rise buildings, the authors believe that the maximum horizontal seismic acceleration, αmax, can substitute for α1 in the equation. In areas where buildings are designed to withstand earthquake intensities of level eight (0.20 g), αmax is to be 0.16 and 0.90 for minor and major earthquakes respectively.
In accordance with the Code for Seismic Design of Buildings (GB50011-2010) [25], the ground acceleration in an eight-degree seismic area under middle seismic influence is 0.20 g, while for minor and major earthquakes, the coefficients for seismic influence top at 0.16 and 0.90, respectively (or αmax equals 0.16 and 0.90, respectively), which is calculated on the premise that the probability of exceedance in terms of earthquake intensity is 10% within the life cycle of the structure.
In such cases, the MG isolator should be designed as follows. The slide isolator should not initiate under a lateral force (or F) of 0.16 Geq or less. As this force reaches 0.90 Geq or less, the isolator slippage plays a major part in the mitigation of the seismic influence (protecting the superstructure), while the stop block suffers very little from elastic-plastic deformation. When the lateral force exceeds 0.90 Geq, the stop block, though showing visible signs of elastic-plastic deformation, has not yet been damaged; therefore, severe damage or collapse of the superstructure will not occur.
Table 5 lists the seismic influences and the initiating load of slippage for each specimen.
See Table 6 for a comparison of the specified loads of the specimens (initiating loads for slippage, split limit and loading limit) obtained and that of the loading limit and major seismic forces.
Table 7 presents the average slippage loading that was measured. The slippage loading is the load imposed in either the positive or negative direction during each loading cycle after the specimen reaches the initiating load. At this point, the displacement increment increases rapidly even though the loading increment remains insignificant. The average slippage loading, in contrast, is the average of the slippage loading that occurs in the horizontal direction during all cycles of the isolator slippage stage.
The following conclusions can be drawn from Table 5, Table 6 and Table 7: (1) The average slippage loading for all cases is 19.64 kN, which is 19.61% lower than the initiating load of 24.43 kN. Therefore, the initiation of the slippage enhances the slippage performance of the isolators, decreasing the slippage loading; (2) The initiating loads of all four specimens (F0) exceeds 0.16 Geq, and their averages are 31.34% greater than the average of a minor seismic influence. The explanation is that no slippage occurs under a minor seismic influence; (3) During the preliminary stage, the average split limits (Fc) of all of the specimens exceed the 0.90 Geq averages. The average loading limits (Fmax), however, are 40.35% greater than the 0.90 Geq averages, meaning that the walls are essentially capable of withstanding an earthquake at an intensity of level eight; (4) The ratio of the initiating load and the loading limit is an average of 0.166, with the highest value being 0.182 and the lowest being 0.141. The figures show that the isolator slippage can be initiated as the horizontal loading reaches approximately 16.6% of the loading limit; (5) With its excellent force-bearing performance, the MG isolator meets the requirement of initiation at an earthquake of a pre-set magnitude. Therefore, the isolator minimizes the transfer of seismic energy to the superstructure, protecting the overall structure at large; (6) A comparison of GGBW-3 and GGBW-1 indicates that due to the eight mortar bars embedded in the isolator, the initiating load required for GGBW-3 exceeds the initiating load for its counterparts. Additionally, the flay ash blocks sandwiched in GGBW-3 offer better thermal insulation performance and an improvement of 20.81% in the loading limit; (7) Compared with GGBW-2, the six mortar bars embedded in GGBW-4 increase the required initiating load; because of the flay ash blocks, the specimen delivers better thermal insulation performance and an improvement of 6.30% in the loading limit; (8) Although the diameters of the stop holes in the lower foundation beams are all 80 mm, the specimens with a 30-mm stop hole in the upper beam exhibit greater displacement limits than those with an 80-mm stop hole. Therefore, the displacement limit can be controlled by altering the diameters of the stop holes in the lower and upper beams.

4.2. Mitigation of the Initiating Load of Slippage via Mortar Bars

See Figure 18 for the hysteretic curves of the four specimens measured on site at the primary stage of initiating load (or the F-U1 hysteretic curves before they reach a displacement of 20 mm). Given that the wall deformation can be insignificant in comparison with the slide displacement of the upper foundation beams, U1or the foundation beam displacement measured–stands on par with U2or the displacement of loading beams.
A visible hump can be well observed in the skeleton curves (Figure 18) of the specimens with mortar bars embedded, be it GGBW-3 or GGBW-4, as the displacement of the two varies between −5 mm and 5 mm. However, such a hump shape tends to disappear as the displacement value rises to the range of 5 mm to 10 mm, or rather drops to −5 mm to −10 mm, which indicates that the roles of the mortar bars start to phase off. As shown in Figure 15, the hysteretic curves tend to fall flat as the displacement of the two specimens varies between −40 mm and +40 mm (right before the failure of the mortar bars). This section can be interpreted as the hysteretic curves for the MG slide, given that the restrictive rebars come into play only when the displacement value exceeds the range of −40 mm and +40 mm. Additionally, at the primary stage (see Figure 17), it takes some time for the MG slide to kick in the lubrication. The slippage loading therefore climbs by a small margin. The seismic performance of the slide is stabilized afterwards.
An analysis of Figure 18 and Table 6 indicates the following: (1) GGBW-1 and GGBW-2, which lack embedded mortar bars, display a 21.40-kN initiating load for slippage on average, whereas GGBW-3 and GGBW-4 show a 32.27% higher initiating load (27.83 kN) due to their embedded mortar bars. Therefore, the initiating load can be controlled by adding mortar bars to the specimen; (2) GGBW-3, which is reinforced by eight mortar bars, presents a 29.11-kN initiating load, and GGBW-4, which is reinforced by six mortar bars, requires a 26.54-kN initiating load. Therefore, the initiating load can also be controlled by adjusting the number of mortar bars applied and by altering the design parameters of the shear stress; (3) The hysteretic curves of GGBW-1 and GGBW-2 resemble each other, showing steady development of slide deformation. GGBW-3 and GGBW-4, which are provided with embedded mortar bars show an increase in the initiating load before the yielding of the mortar bars. However, after the shear damage of the bars occurs, the slippage loads for both specimens drop. At this point, the hysteretic loops tend to expand horizontally, indicating notable energy dissipation and seismic reduction.
Engineering design requires two walls—perpendicular to each other—at each engineering axle perfectly fit to the masonry structure. Therefore, slide isolation measures shall be taken to the foundations in both directions. In case of earthquake, the wall—perpendicular to the one under direct seismic influence—bears the major portion of the loading imposed. Given the destructive nature of the experiment (in other words, the test stops upon the failure of the specimens) and the 0.194 ratio of slippage loading to split limit (see Table 6), the wall proposed will remain at the elastic stage under seismic influence, which lives up to the requirement of engineering design.
The design standard for the MG isolation system has yet to be published. Therefore, the study and the research deliverables are of reference to future practice.

5. Conclusions

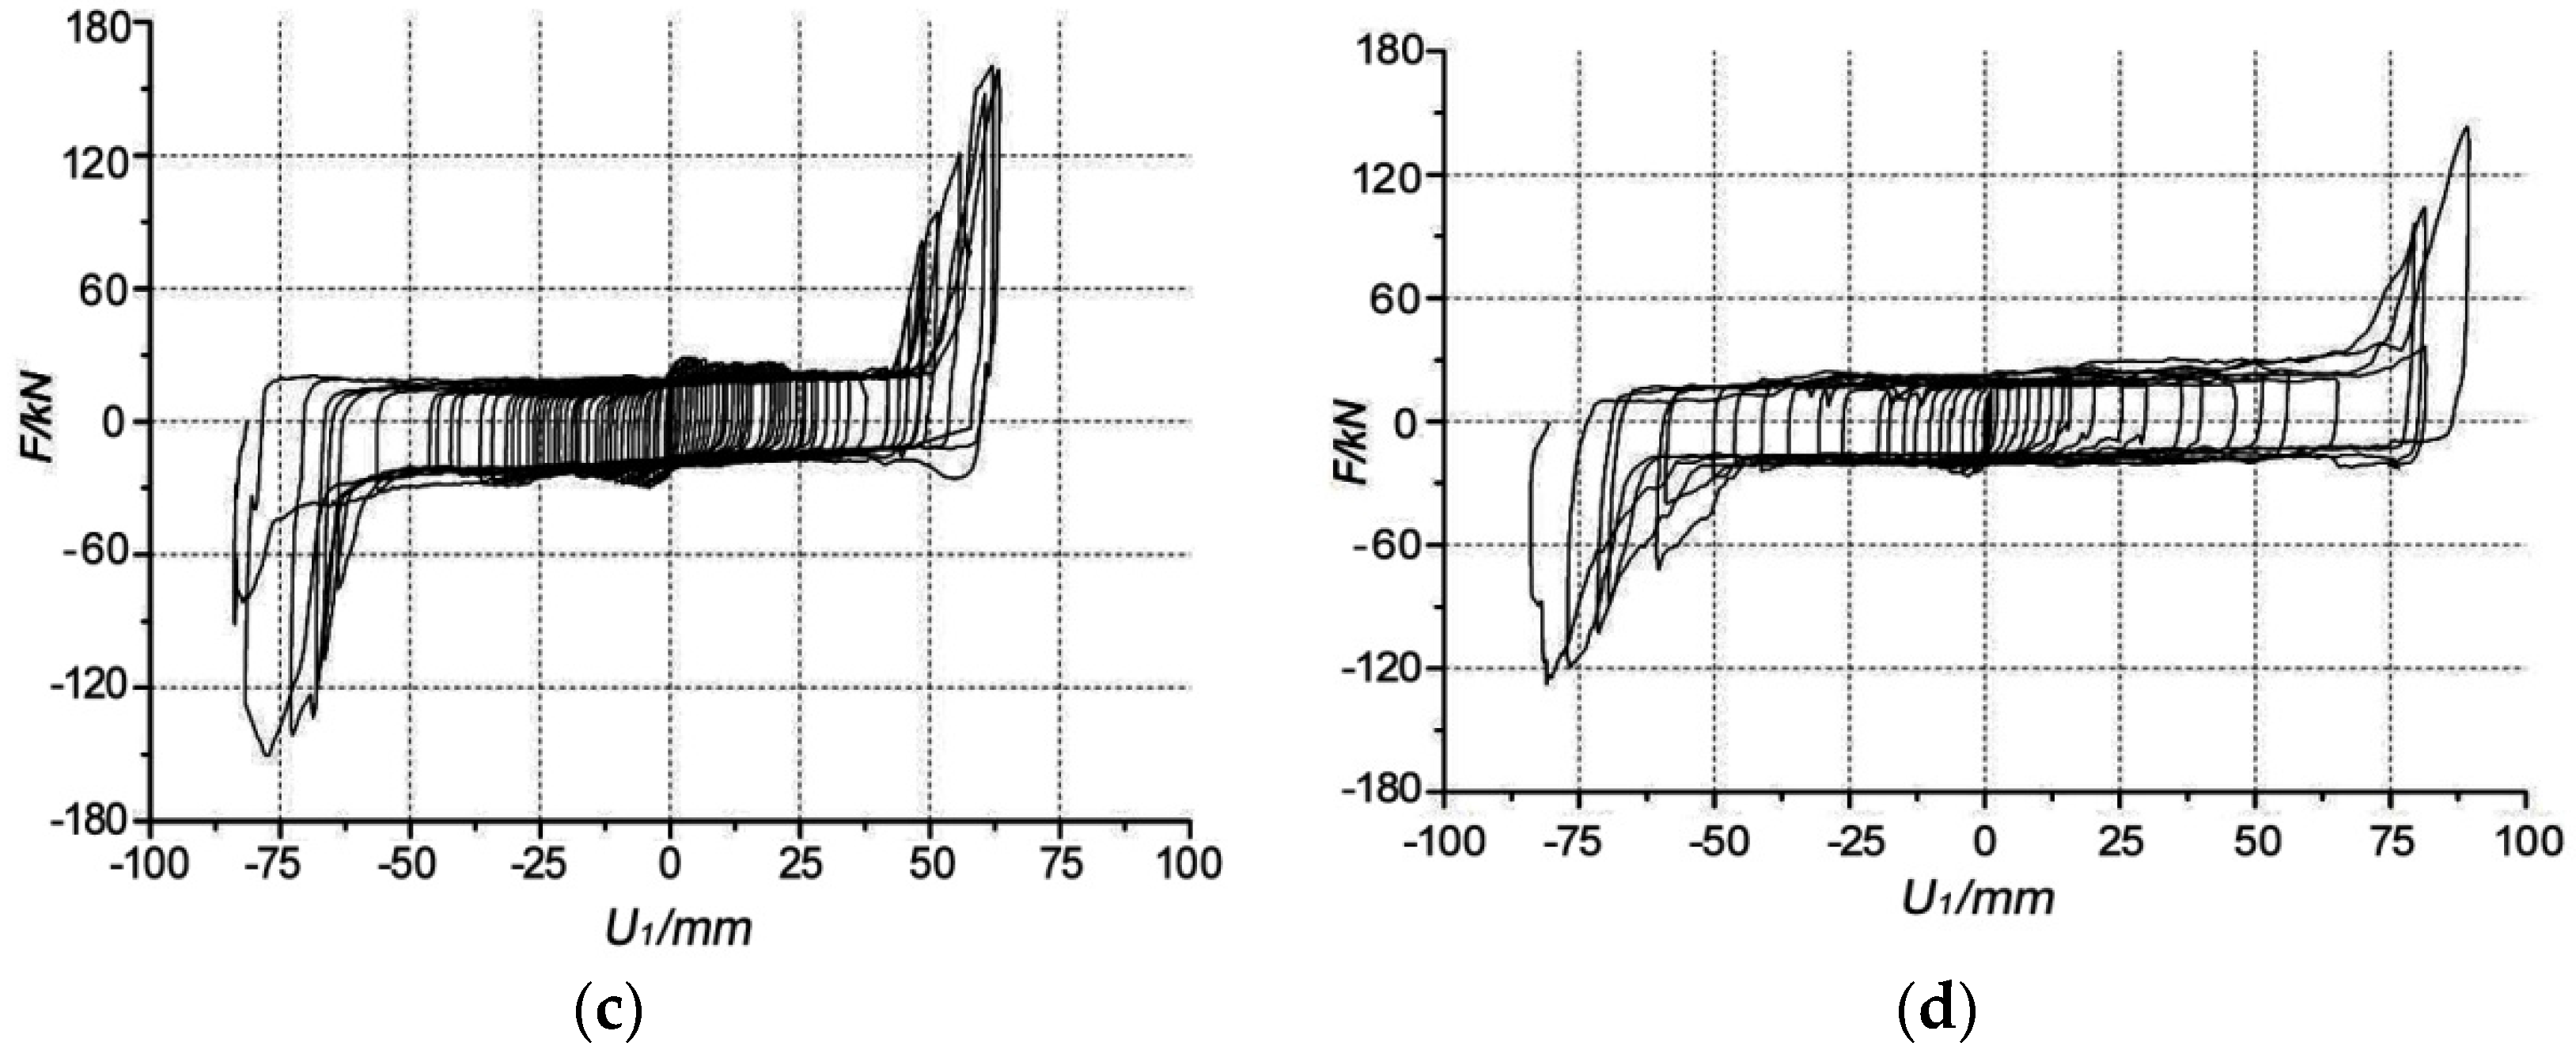
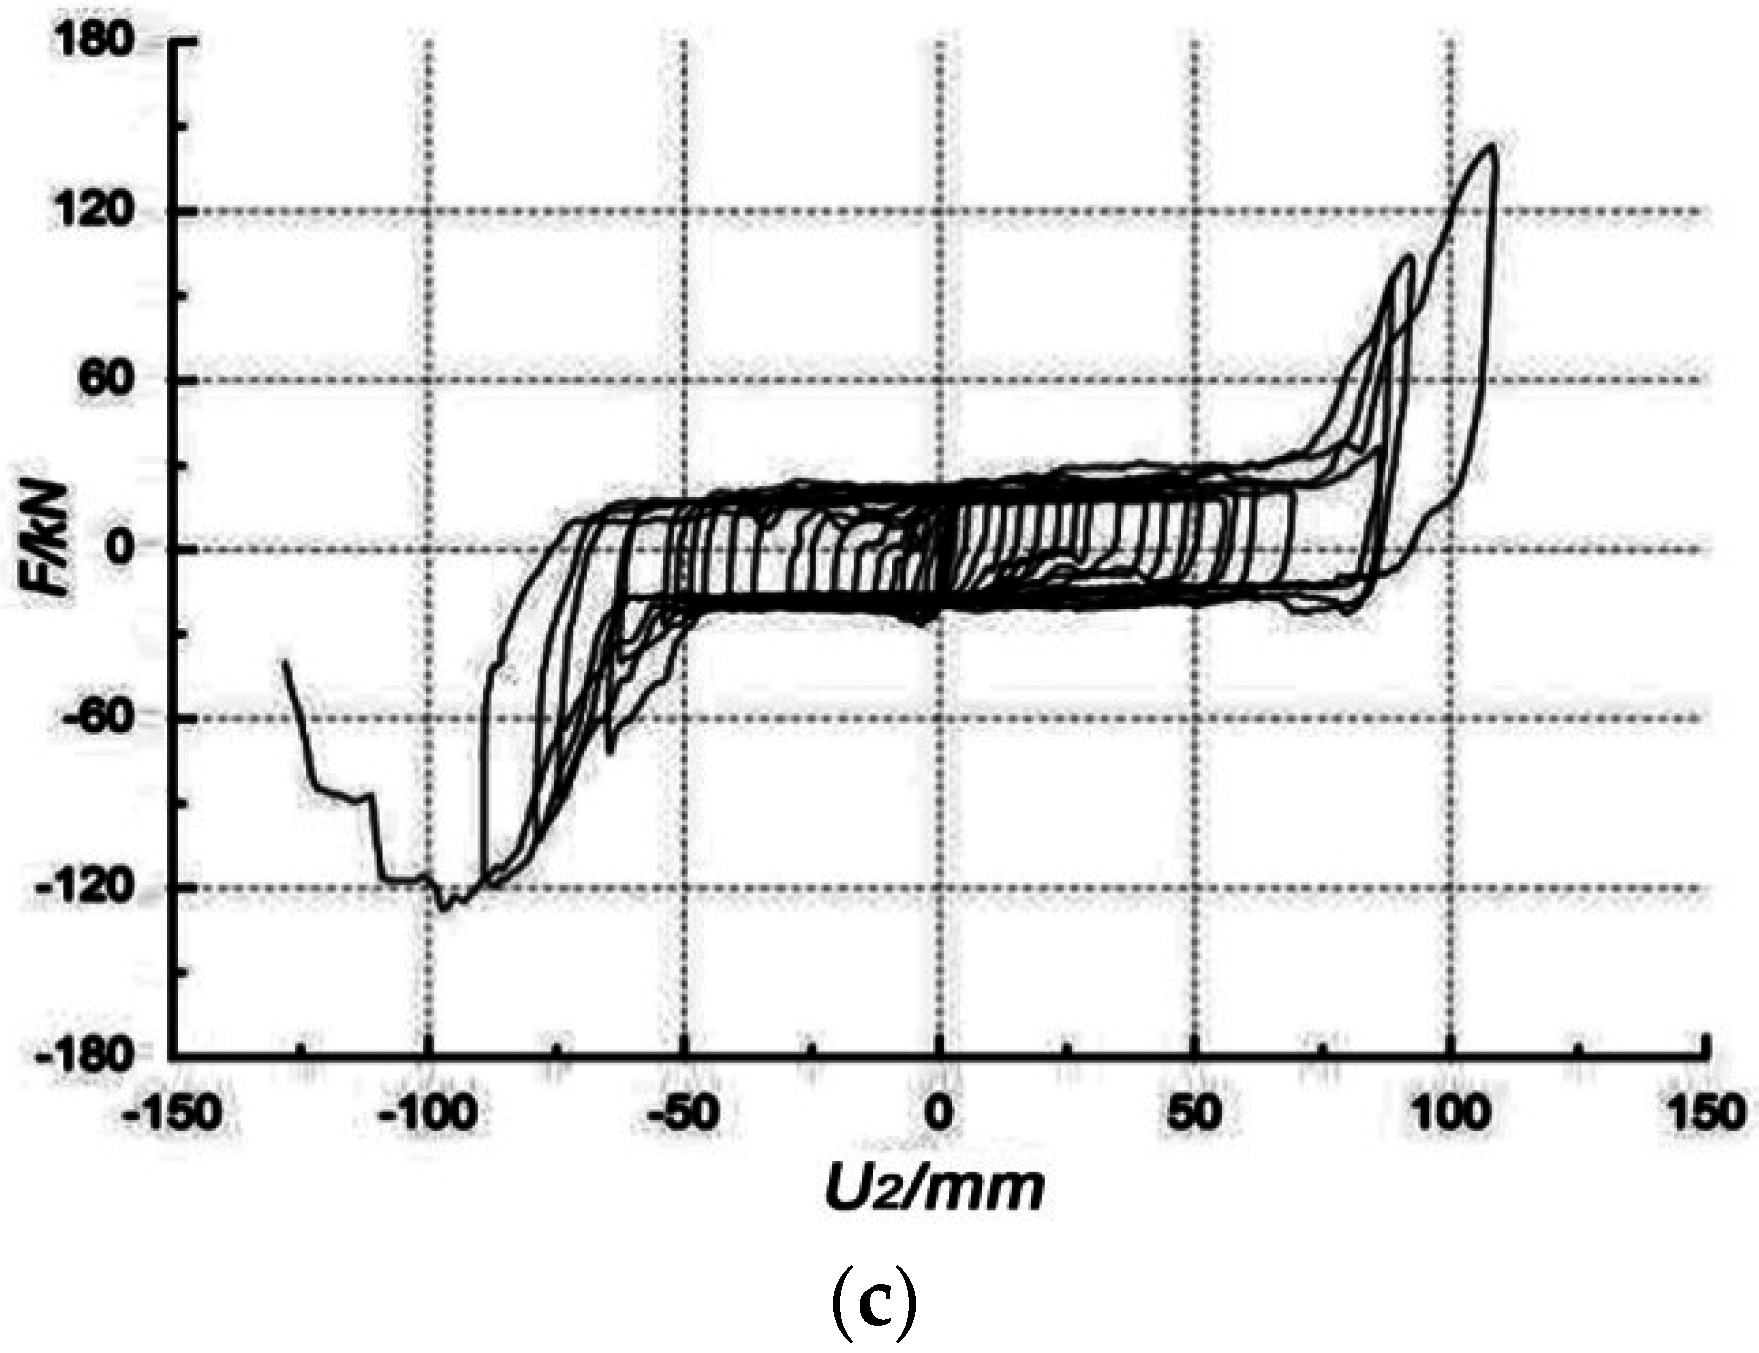
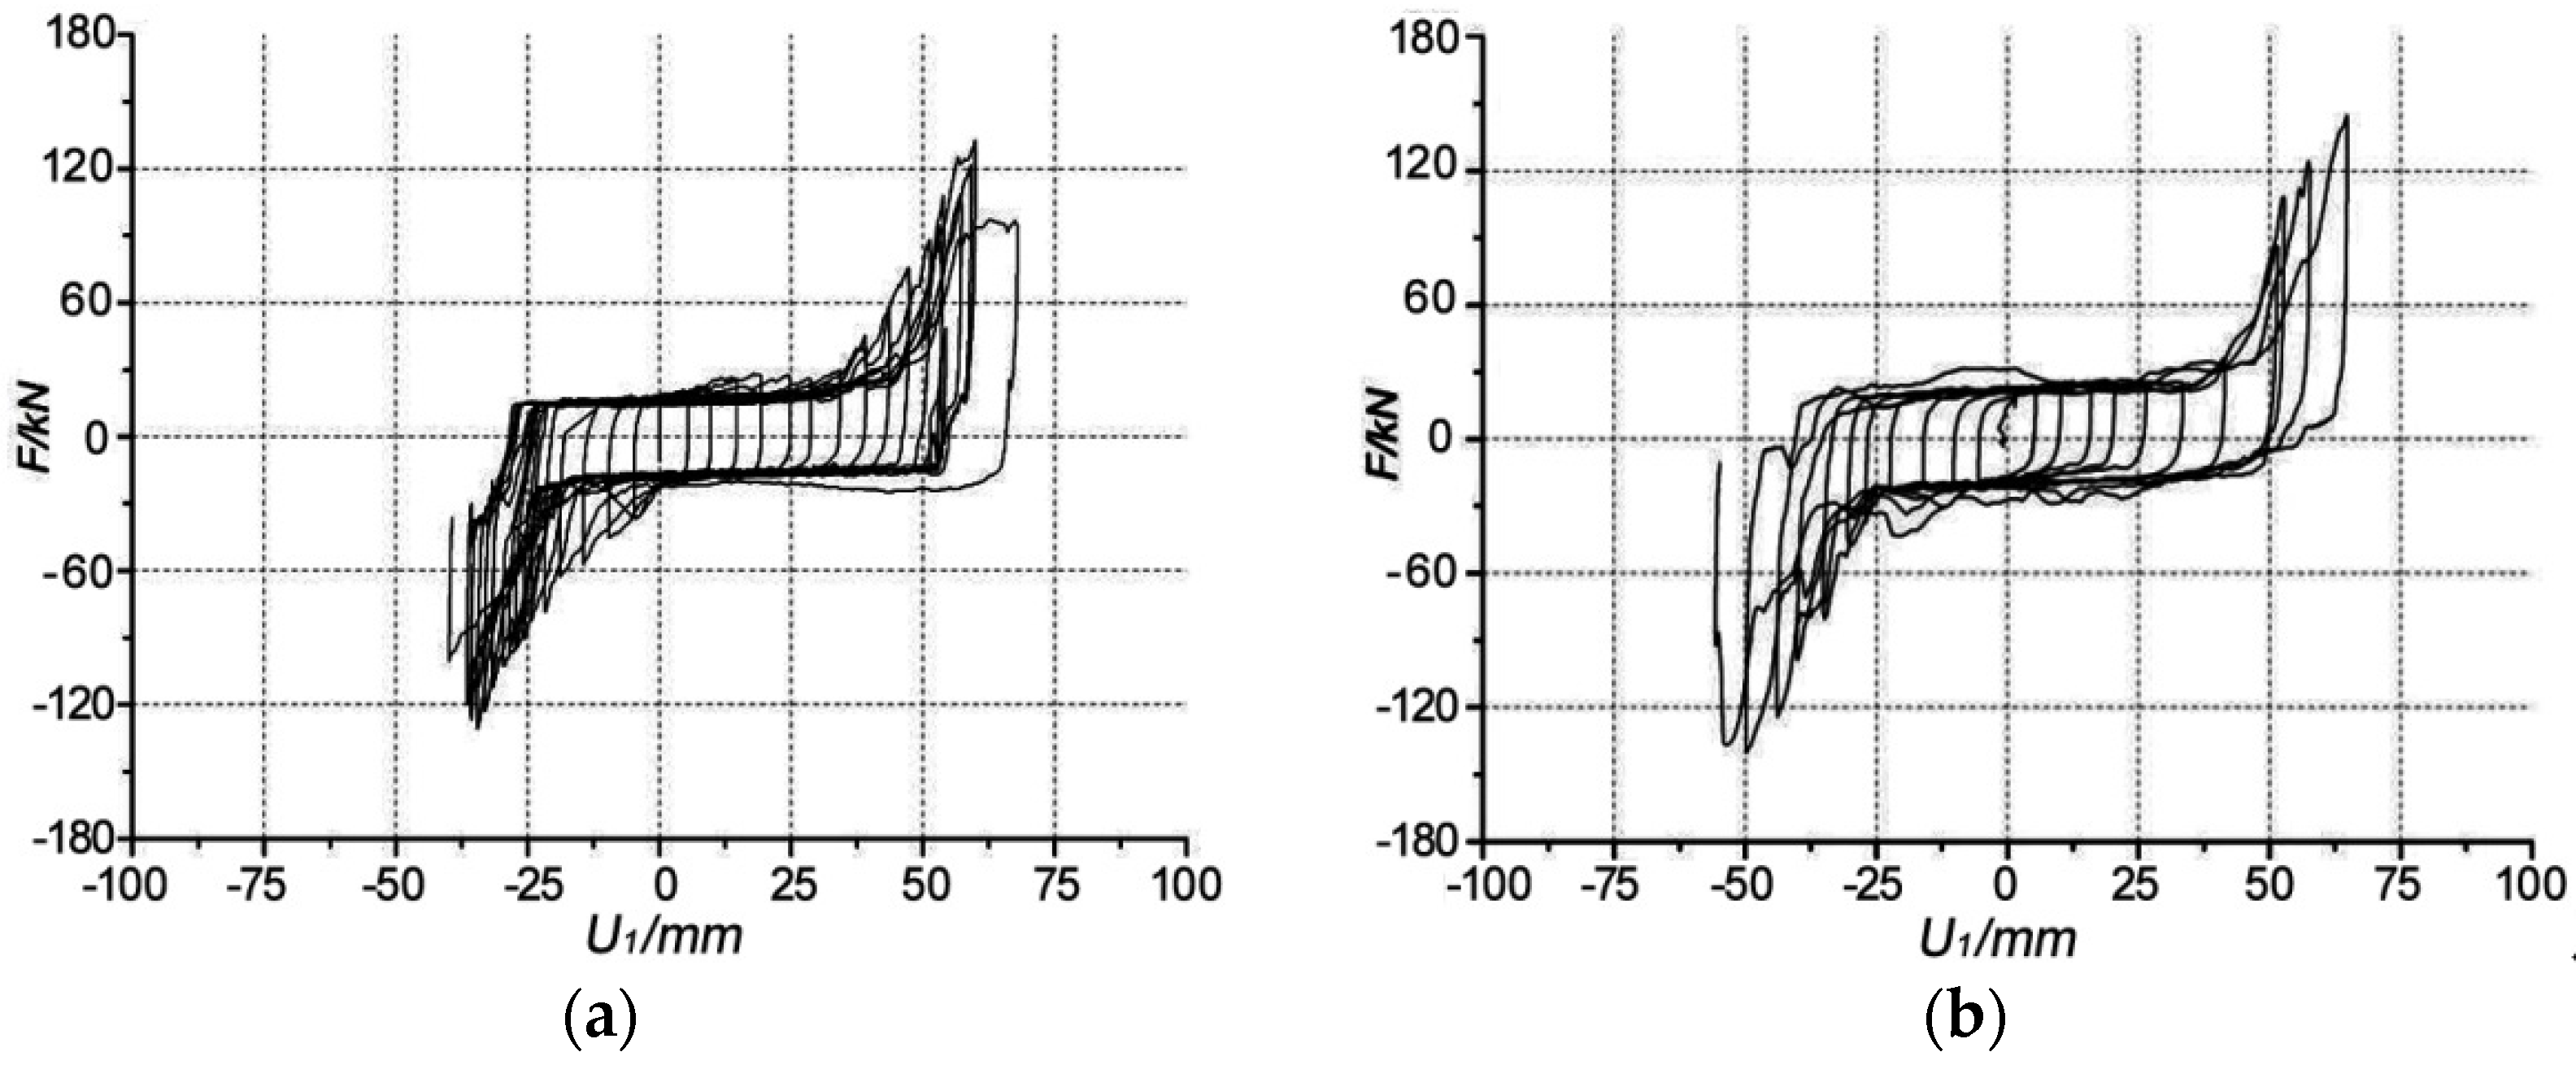
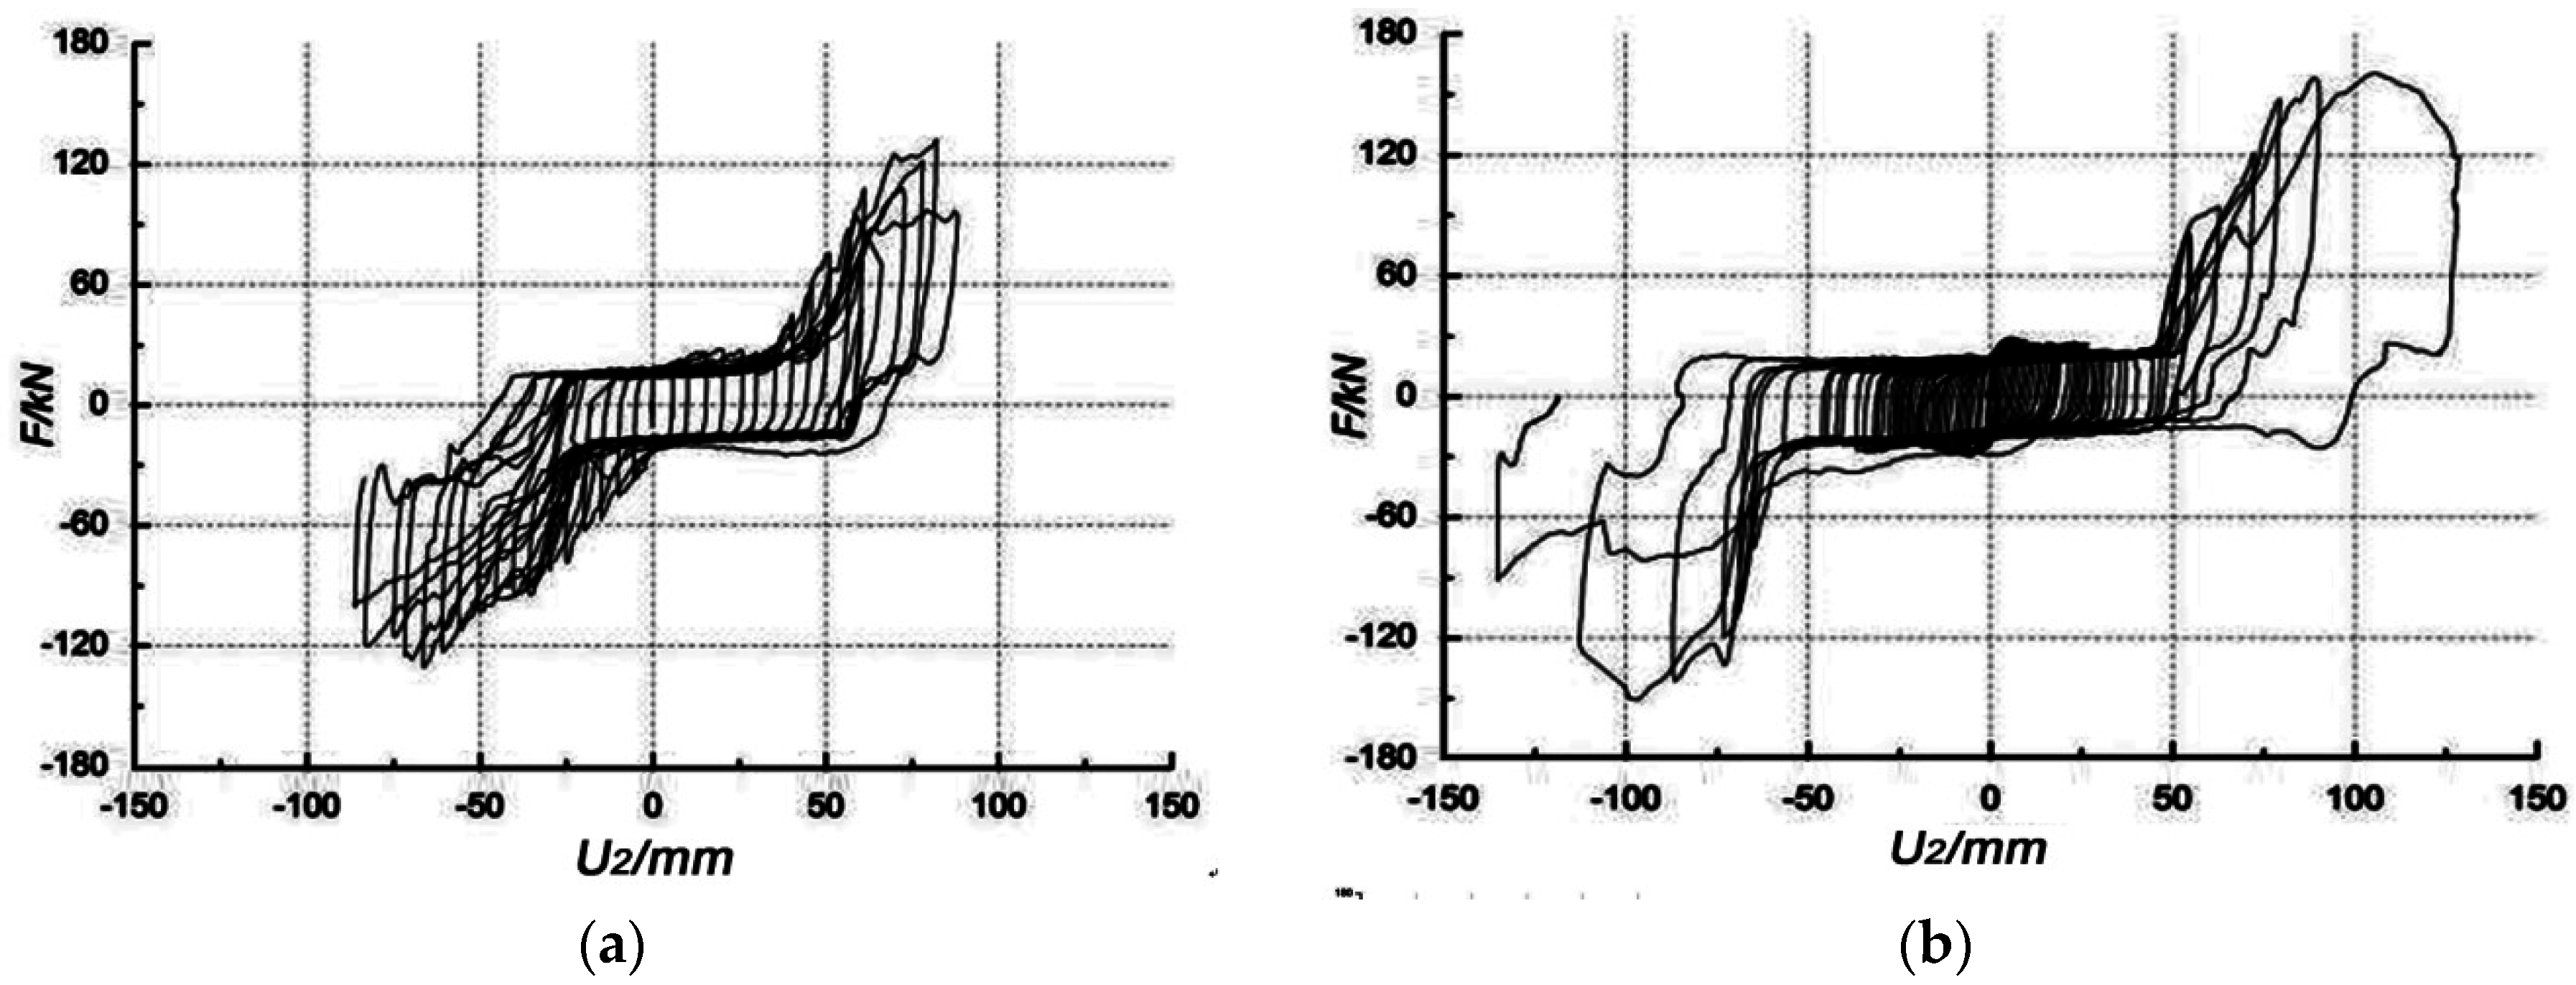
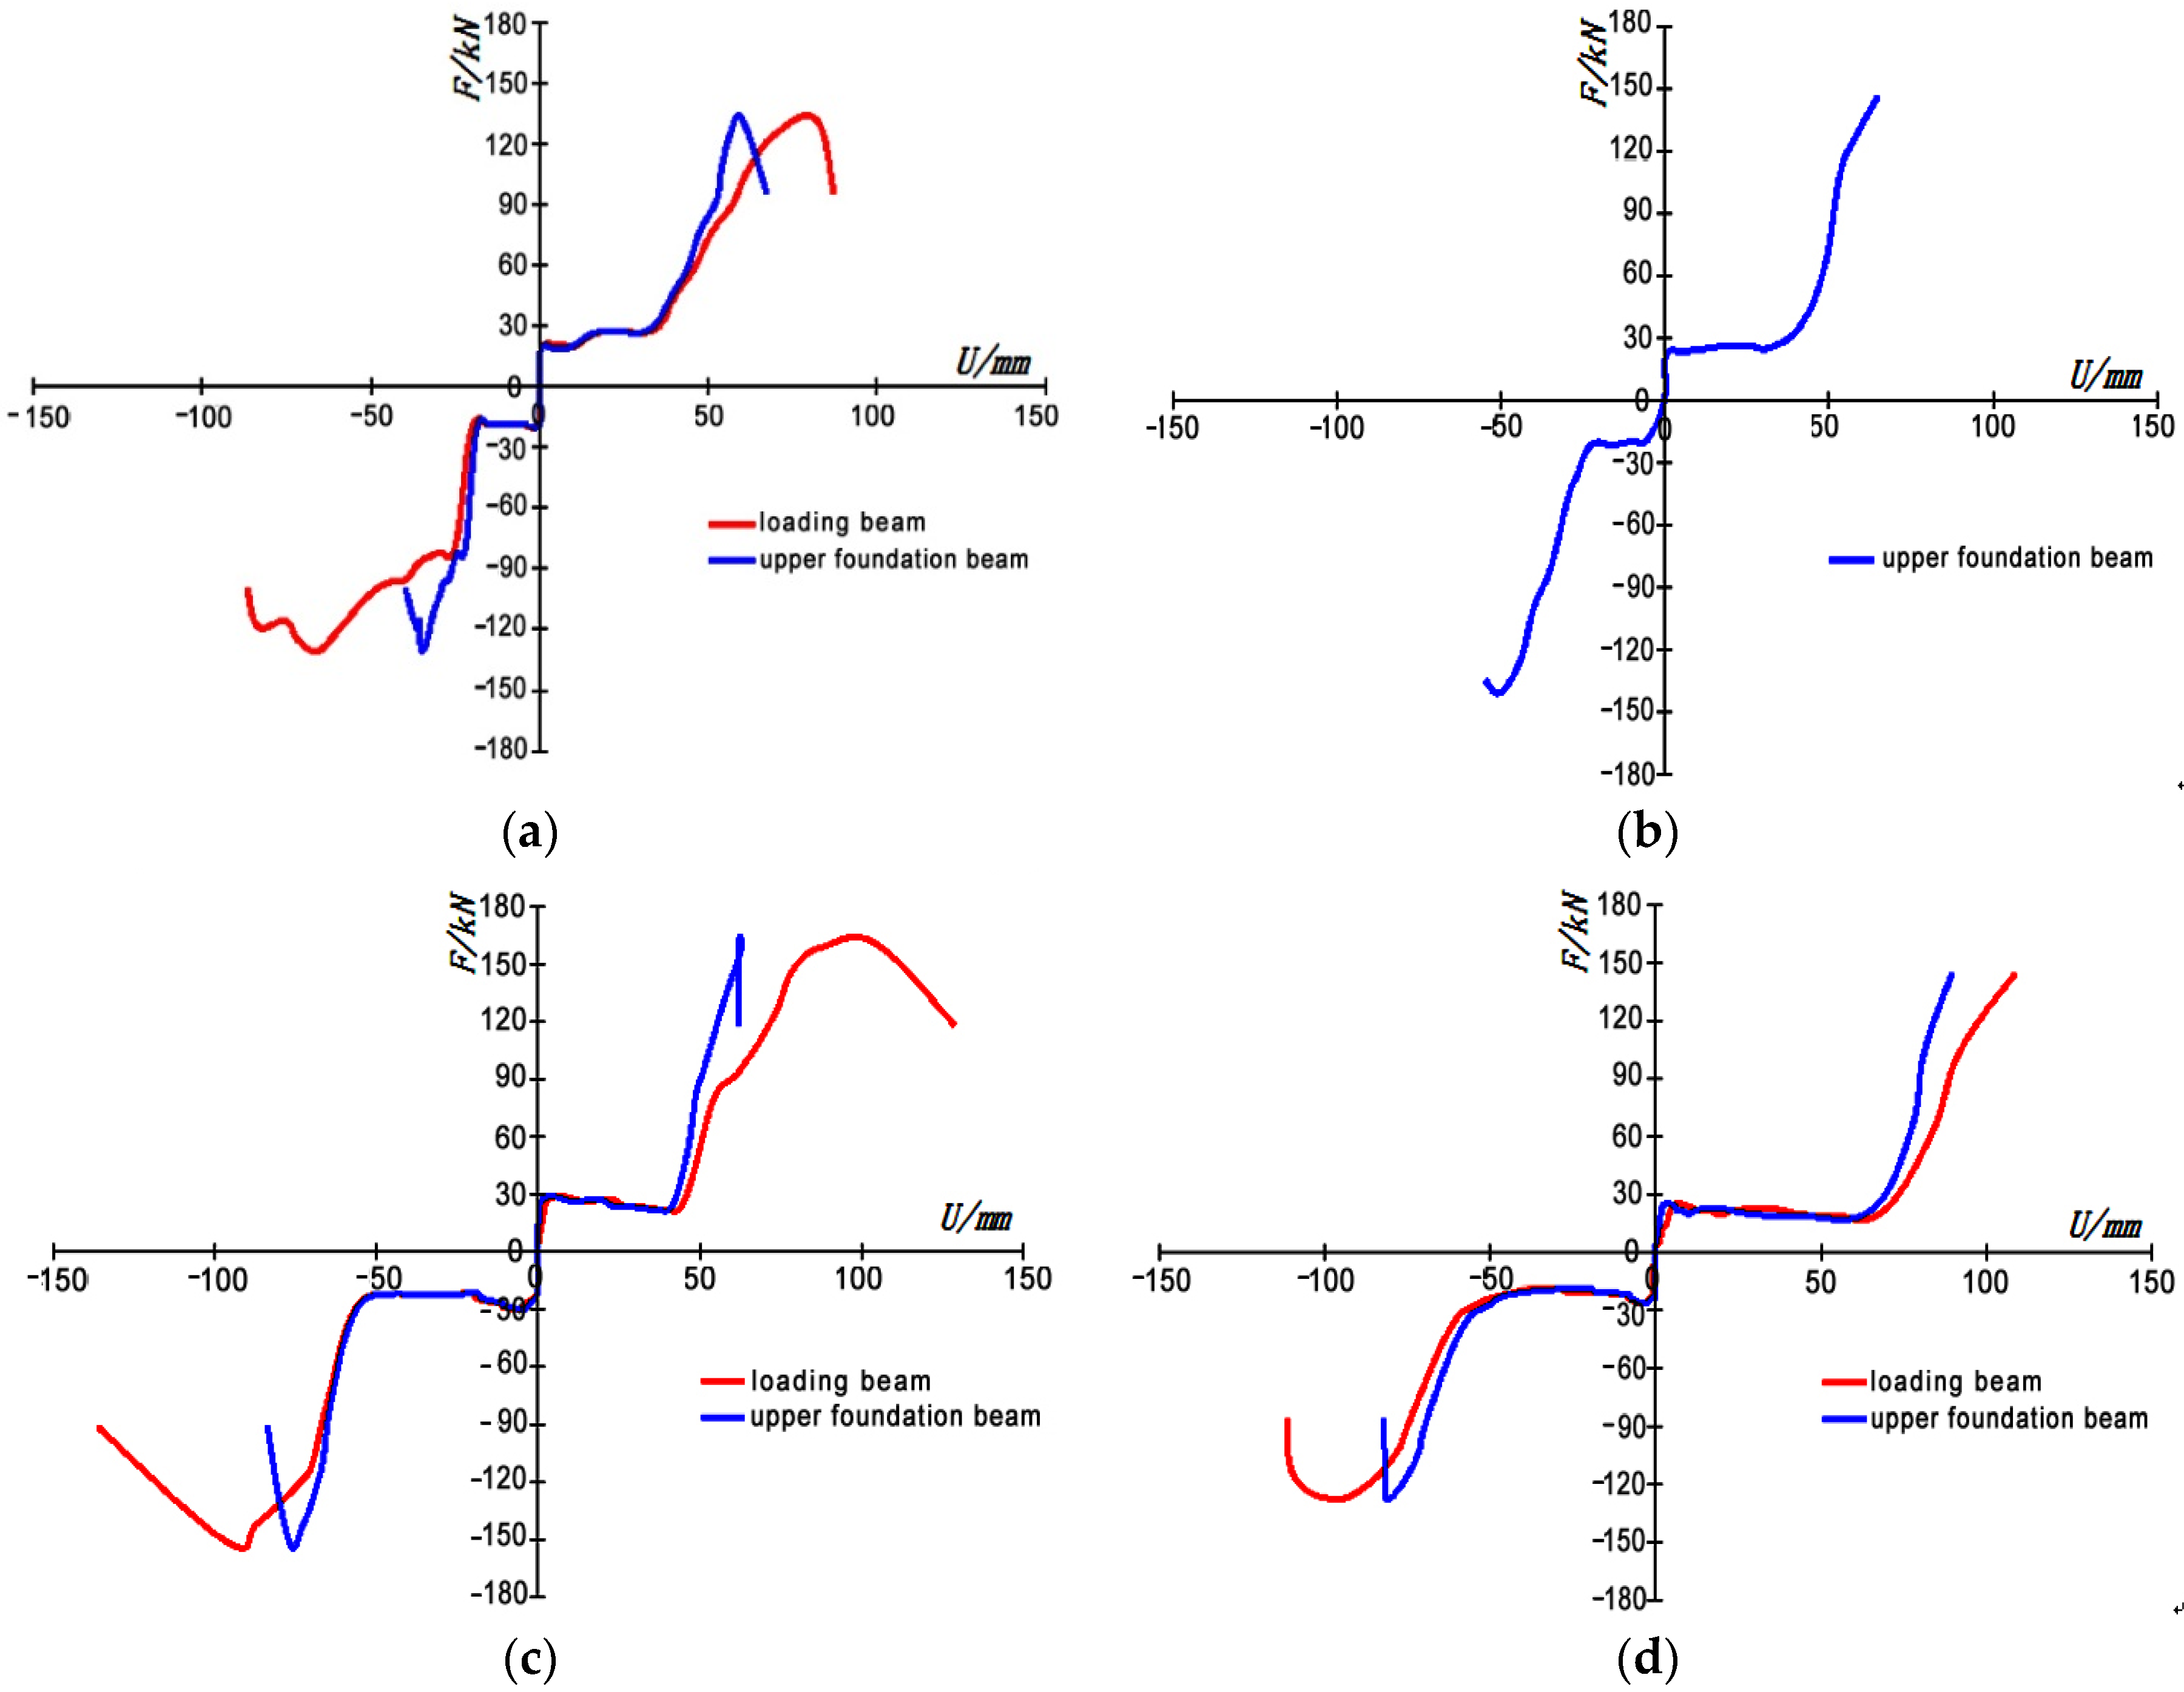
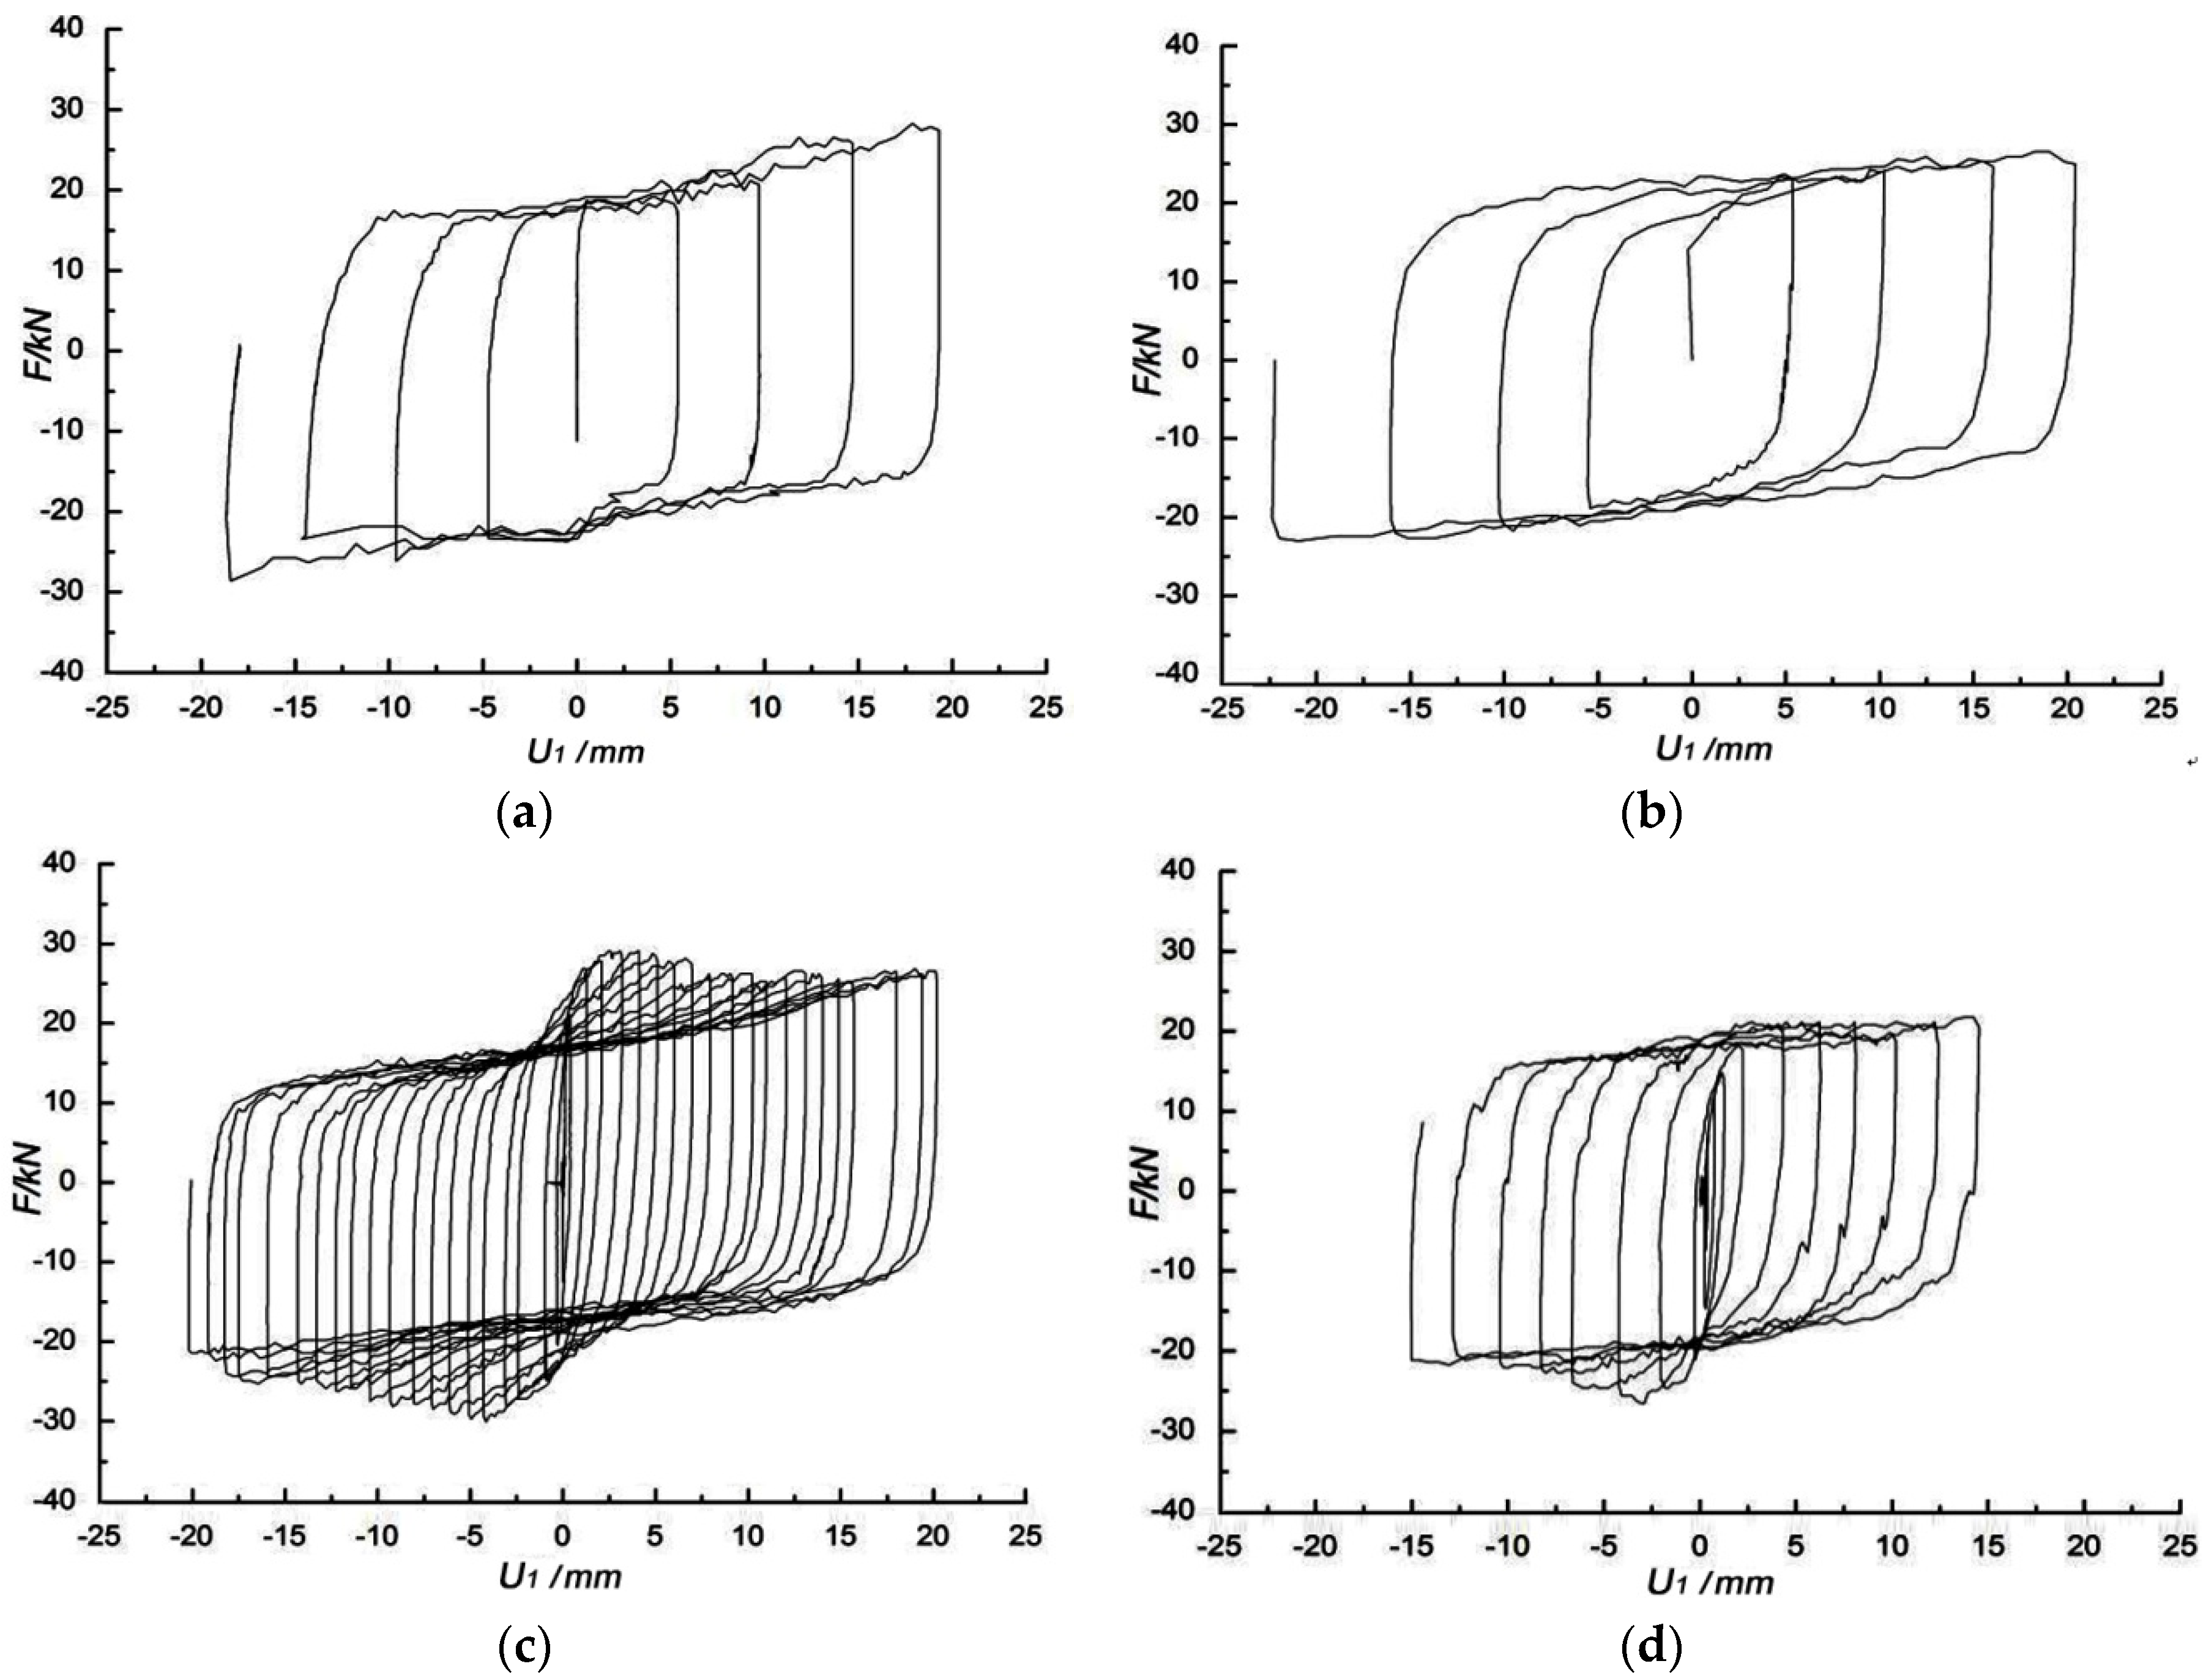
(1) The MG slide seismic isolator offers stable force-bearing performance, and the isolation system in general delivers outstanding hysteresis performance. As the imposed horizontal loading reaches 1/7 to 1/5 of the loading limit, slippage isolation comes into play.
(2) Mortar bars embedded in the upper-lower-beam interface help control the initiating loads for the foundation slippage; the quantity and the design parameters of the bars serve as governing factors. The design aims to ensure that the isolation slippage is initiated only by moderate vibrations. The isolation system remains intact under minor vibrations or wind loads, whereas during a major seismic event, the isolation system largely prevents the transfer of seismic energy to the superstructure and thereby prevents damage or failure.
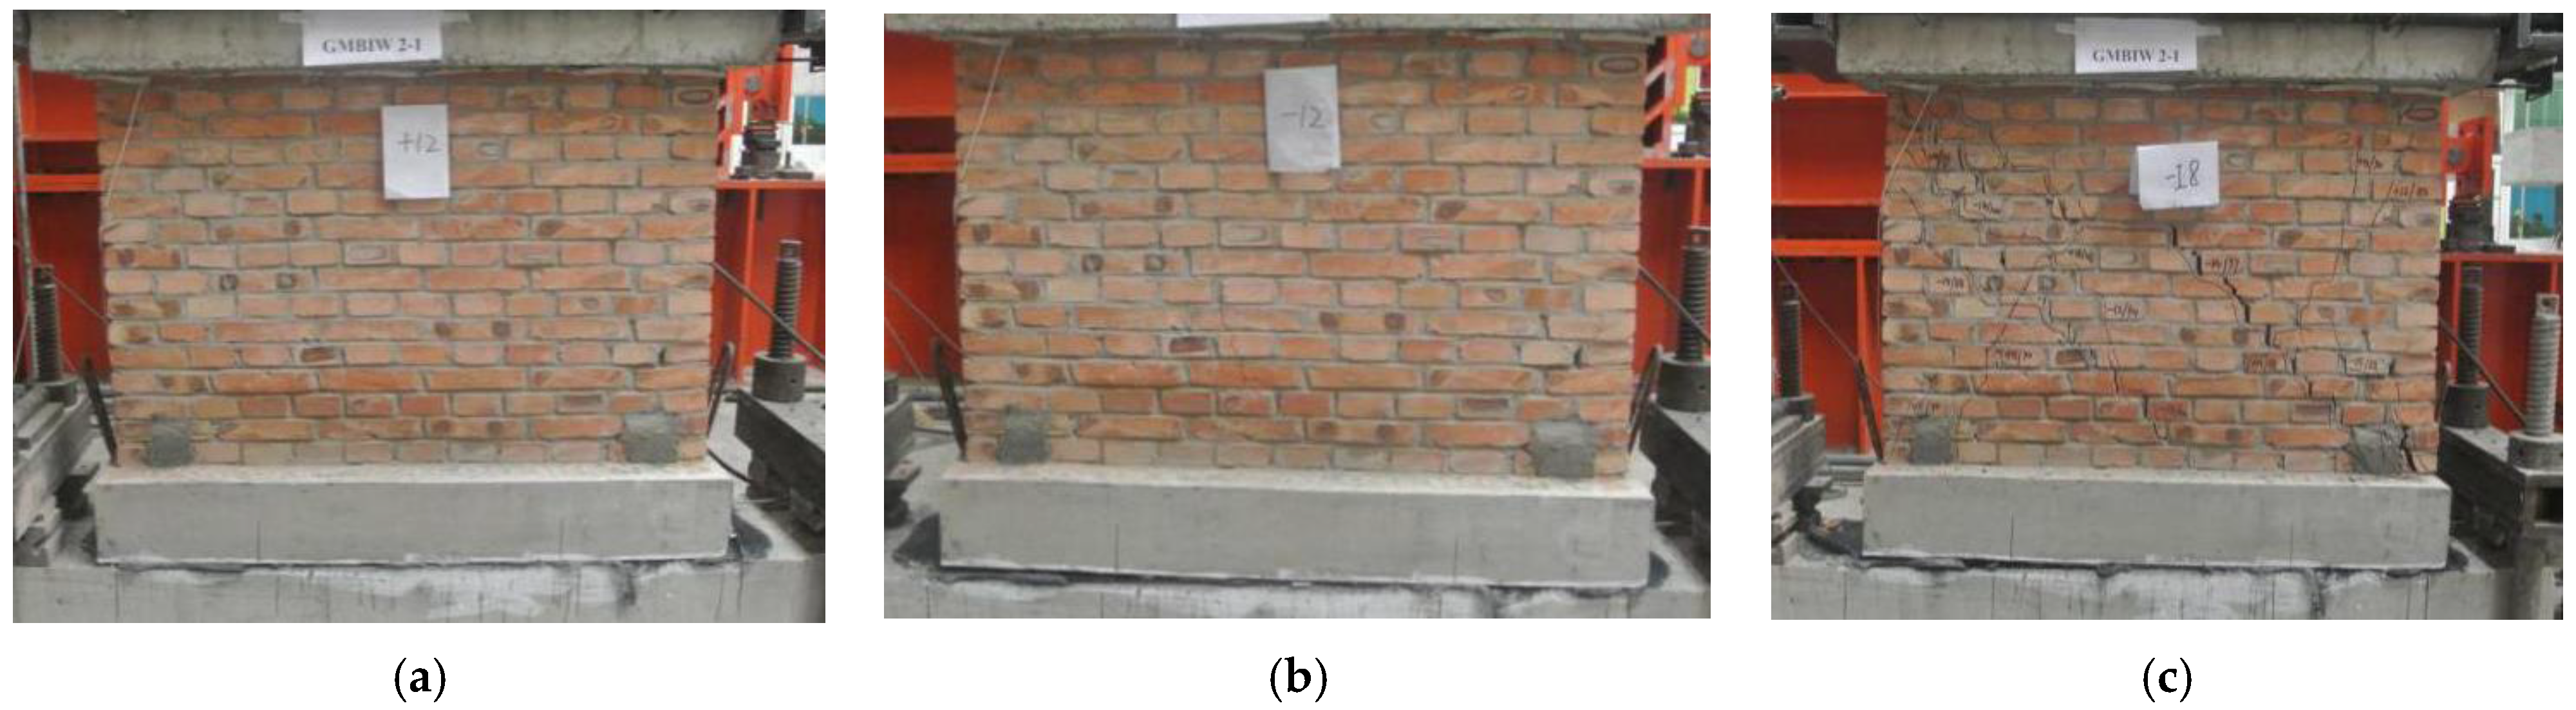
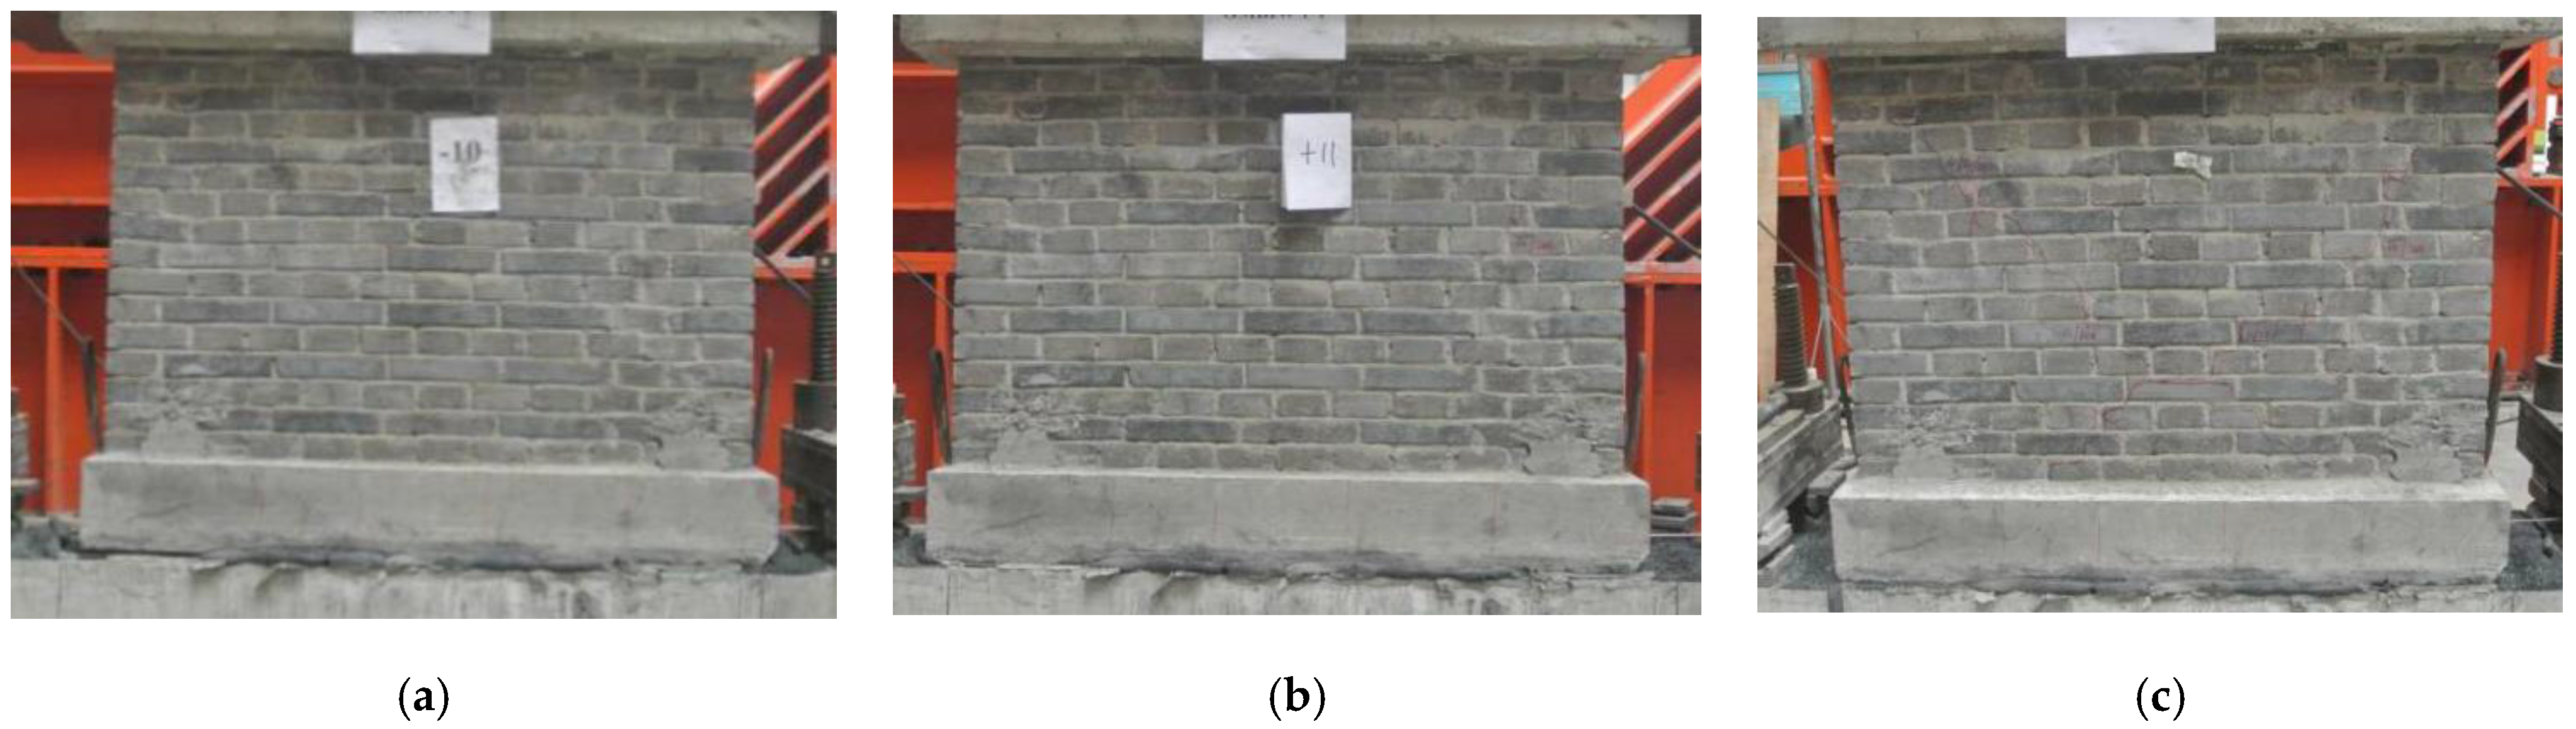
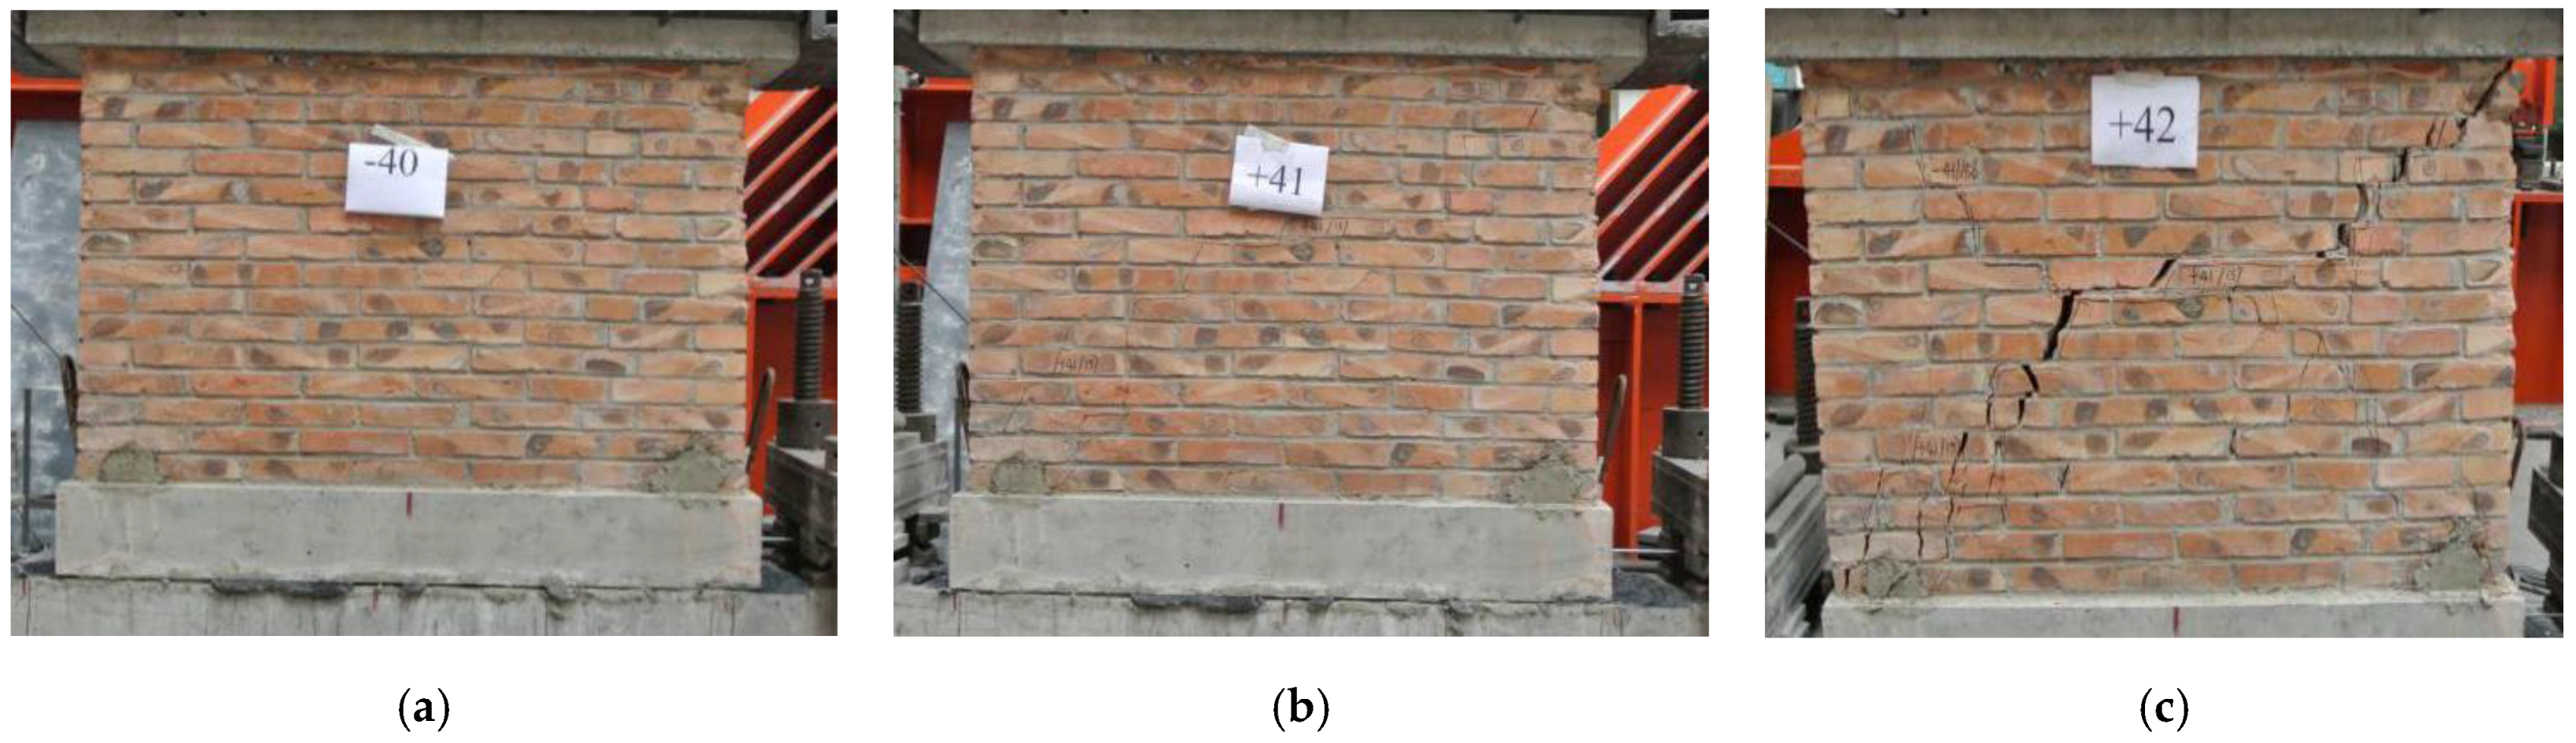
(3) The stop block developed for the MG isolation system is equipped with restrictive iron screws of good ductility. During a major seismic event, the stop block provides outstanding strength and quite good force-bearing performance. At the displacement limit, the specimens are damaged only when the imposed low-reversed cyclic loading exceeds the initiating load by a large margin. Therefore, in the case of a major seismic event, the isolation system can still restrain the maximum slippage displacement.
(4) The steel bars of the stop blocks (the force imposed upon which at the preliminary deformation and isolator slippage stage is insignificant) consumes only limited energy in elastic deformation, mainly due to the rolling of the marbles. At the seismic resistance of the wall stage, the steel bars yield and deform only upon the cracking of the wall. Therefore, in this destructive experiment, the seismic energy is consumed in the rolling of the marbles and in the deformation of the steel bars embedded in the stop blocks. However, as it is stipulated in relevant specifications, engineering design shall avoid the occurrence of wall cracking and the yield of the steel bars of stop blocks, thus the phenomenon of the experiment shall not appear in practice.
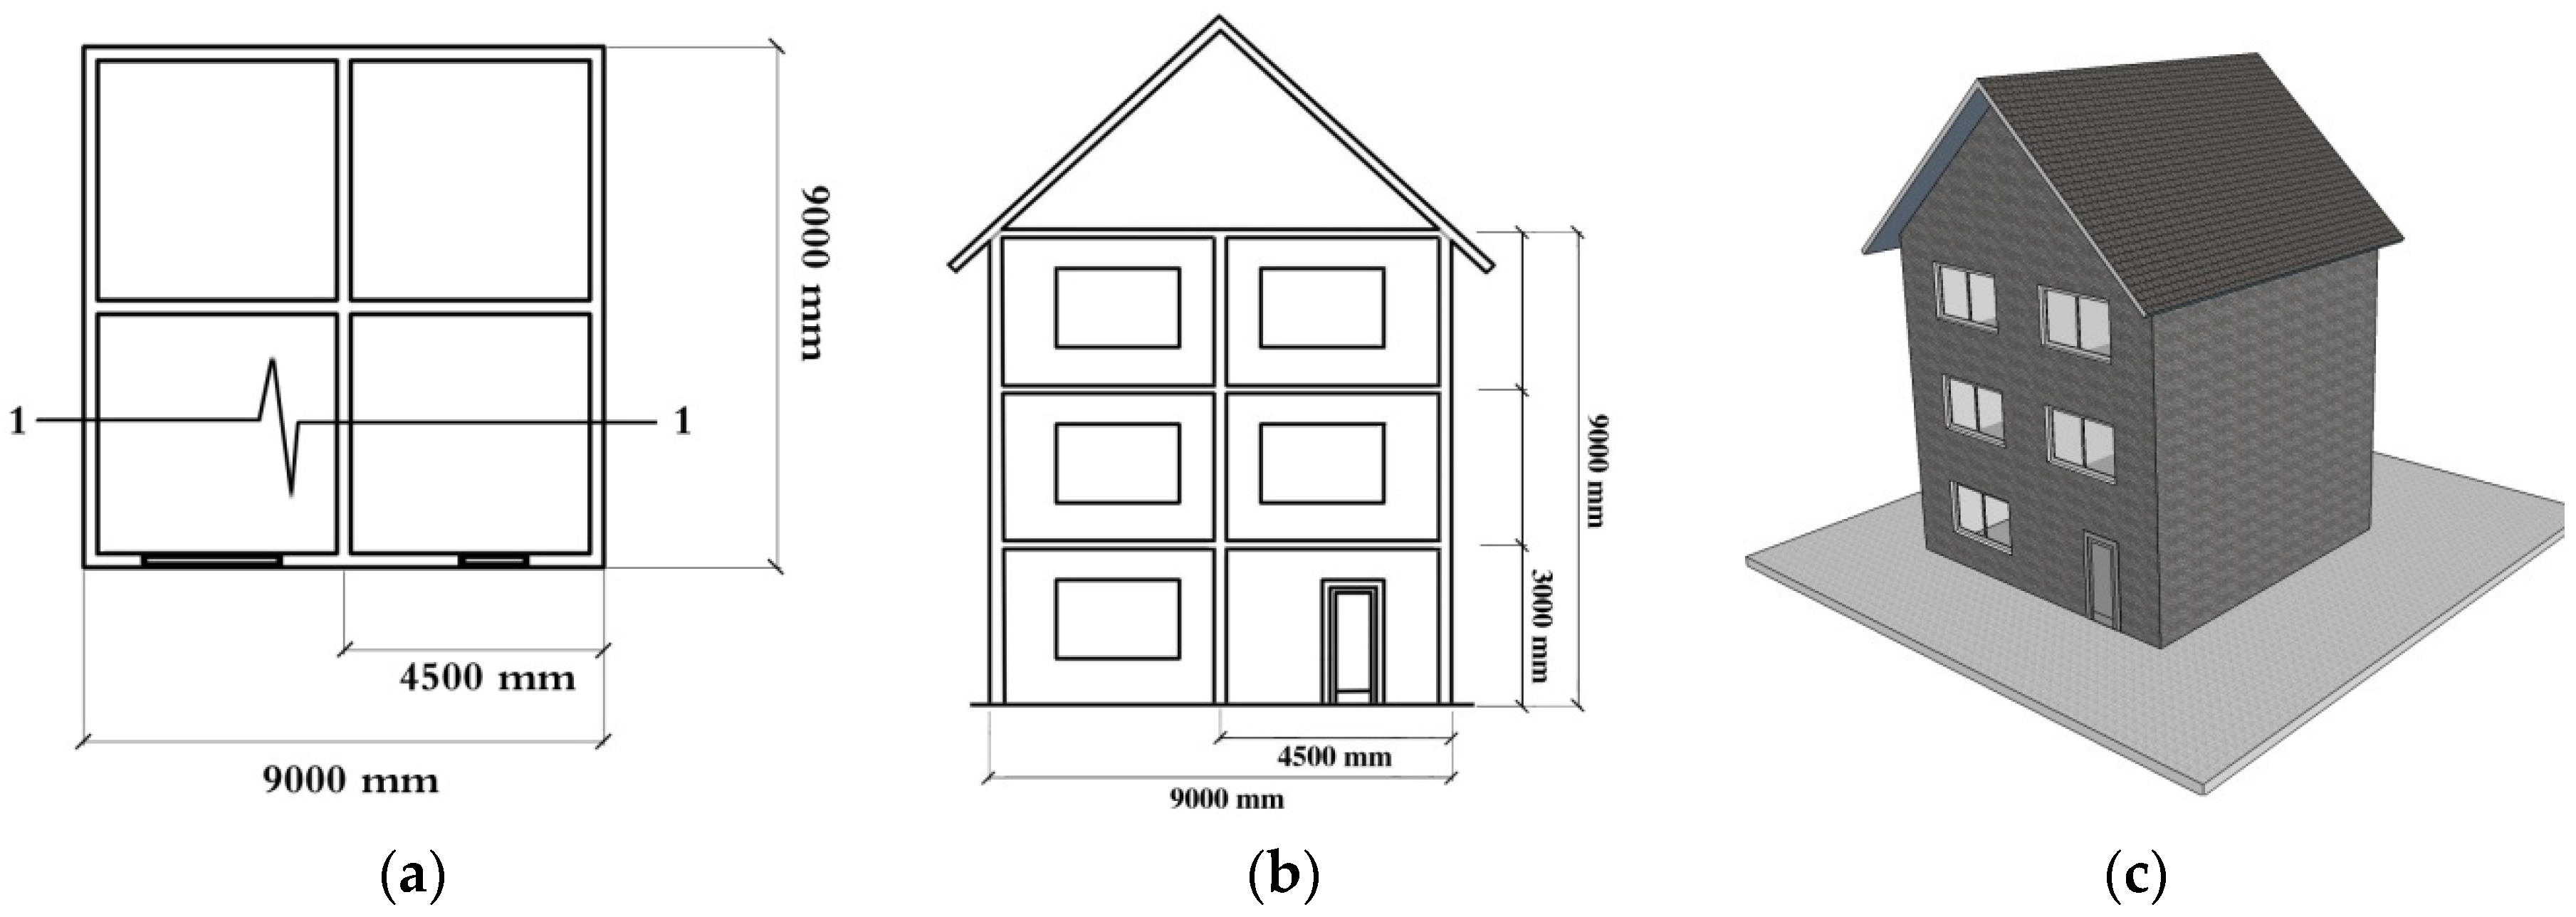
(5) The masonry structure designed with the MG slide isolator placed at its foundation is applicable to the seismic design of low-rise masonry houses. At the same time, the material used offers good cost efficiency, working stability and straightforward engineering. Using the embedded flay ash blocks, the specimens—both clay bricks and recycled concrete bricks—provide good force bearing and thermal insulation. The blocks boost the thermal performance and the seismic resistance of the structure in general.
(6) The manufacture of such structures can increase the recycling of waste materials in that recycled glass, industrial waste, and scraped bricks and concrete can be used to manufacture the marbles, flay ash blocks and recycled bricks, respectively.
We carried out low-reversed cyclic loading tests on four differently structured masonry specimens. These tests—together with what the research team has achieved in the vibration tests conducted earlier on the integrated masonry structure of recycled bricks and adobe—constitute the theoretical system of seismic resistance for the MG slide, which is of reference to the seismic design of low-rise masonry houses.

Acknowledgments

This research was conducted with the financial support of the National Science and technology support program of China (No. 2015BAL03B01).

Author Contributions

Suizi Jia wrote the manuscript; Suizi Jia, Yan Liu, Wanlin Cao, Wei Ye designed the experiments; Suizi Jia, Wanlin Cao and Yuchen Zhang modified the final paper.

Conflicts of Interest

The authors declare no conflict of interest.

Abbreviations

The following abbreviations are used in this manuscript:
MDPIMultidisciplinary Digital Publishing Institute
DOAJDirectory of open access journals
TLAThree letter acronym
LDlinear dichroism

References

  1. Zimmermann, T.; Strauss, A.; Bergmeister, K. Structural behavior of low- and normal-strength interface mortar of masonry. Mater. Struct. 2012, 45, 829–839. [Google Scholar] [CrossRef]
  2. Zimmermann, T.; Strauss, A. Numerical investigation of historic masonry walls under normal and shear load. Constr. Build. Mater. 2010, 24, 1385–1391. [Google Scholar] [CrossRef]
  3. Zimmermann, T.; Strauss, A. Capacity of old brick masonry with regard to cyclic stress. Bauing. 2010, 85, S2–S9. [Google Scholar]
  4. Salmanpour, A.H.; Mojsilovic, N.; Schwartz, J. Experimental study of the deformation capacity of structural masonry. In Proceedings of the 12th Canadian Masonry Symposium Vancouver, Vancouver, BC, Canada, 2–5 June 2013.
  5. Nanda, R.; Shrikhande, M.; Agarwal, P. Low-cost base-isolation system for seismic protection of rural building. Period. Struct. Des. Constr. 2015, 21, 04015001. [Google Scholar] [CrossRef]
  6. Nanda, R.P.; Agarwal, P.; Shrikhande, M. Suitable friction sliding materials for base isolation of masonry buildings. Shock Vib. 2012, 19, 1327–1339. [Google Scholar] [CrossRef]
  7. Cao, W.L.; Zhang, S.; Zhou, Z.Y.; Hao, T.Y. Shake table test study on composite adobe masonry structure with sliding base isolation. J. Nat. Disasters 2015, 24, 131–138. [Google Scholar]
  8. Roussis, P.C. Study on the effect of uplift-restraint on the seismic response of base-isolated structures. J. Struct. Eng. 2009, 135, 1462–1471. [Google Scholar] [CrossRef]
  9. Roussis, P.C.; Constantinou, M.C. Experimental and analytical studies of structures seismically isolated with an uplift-restraining friction pendulum system. Earthq. Eng. Struct. Dyn. 2006, 35, 595–611. [Google Scholar] [CrossRef]
  10. Koo, G.H.; Lee, J.H.; Lee, H.Y.; Yoo, B. Stability of laminated rubber bearing and its applicationg to seismic isolation. J. Mech. Sci. Technol. 1999, 13, 595–604. [Google Scholar]
  11. Griffith, M.C.; Aiken, I.D.; Kelly, J.M. Displacement control and uplift restraint for base-isolated structures. J. Struct. Eng. 1990, 116, 1135–1148. [Google Scholar] [CrossRef]
  12. Jangid, R.S.; Kelly, J.M. Base isolation for near-fault motions. Earthq. Eng. Struct. Dyn. 2001, 30, 691–707. [Google Scholar] [CrossRef]
  13. Shang, S.P.; Zhou, H.; Zhu, B.W.; Lu, H.W. Application and promotion of reinforced-asphalt seismic isolation layer. China Civ. Eng. J. 2013, S2, 7–12. (In Chinese) [Google Scholar]
  14. Tsompanakis, Y.; Psarropoulos, P.N.; Drosos, V. Low-Cost Seismic Base Isolation Using Recycled Tire Cushions; Civil-Comp Press: Chania, Greece, 2011. [Google Scholar]
  15. Turer, A.; Ozden, B. Seismic base isolation using low-cost Scrap Tire Pads (STP). Mater. Struct./Mater. Constr. 2008, 41, 891–908. [Google Scholar] [CrossRef]
  16. Tsang, H. Seismic isolation by rubber-soil mixtures for developing countries. Earthq. Eng. Struct. Dyn. 2008, 37, 283–303. [Google Scholar] [CrossRef]
  17. Nanda, R.P.; Agarwal, P.; Shrikhande, M. Friction base isolation by geotextiles for brick. Geosynth. Int. 2010, 17, 48–55. [Google Scholar] [CrossRef]
  18. Jayalekshmi, B.R.; Shivashankar, R.; Venkataramana, K.; Ramesh Babu, R.; Reddy, G.R.; Parulekar, Y.M.; Patil, S.J.; Gundlapalli, P. Shake Table Tests to Investigate the Efficacy of Geomembranes for Soil Isolation in a Space Frame with Isolated Footing; Centre for Infrastructure Engineering and Safety: Melbourne, Australia, 2011. [Google Scholar]
  19. Wang, H.G. Experimental Research on Frictional Sliding Properties of Rural Isolated Structure of Sand Cushion. Master’s Thesis, Xi’an University of Architecture and Technology, Xi’an, China, 2013. [Google Scholar]
  20. Yang, H.R. The Study of Rubber and Ceramsite Mixture’s Isolation Performance. Master’s Dissertation, Huazhong University of Science and Technology, Wuhan, China, 2013. [Google Scholar]
  21. Toopchi-Nezhad, H.; Tait, M.J.; Drysdale, R.G. Base Isolation of Small Low-Rise Buildings Using Fiber Reinforced Elastomeric Bearings; Canadian Society for Civil Engineering: Yellowknife, NT, USA, 2007. [Google Scholar]
  22. Ahmad, S.; Ghani, F.; Raghib Adil, M. Seismic friction base isolation performance using demolished waste in masonry housing. Constr. Build. Mater. 2009, 23, 146–152. [Google Scholar] [CrossRef]
  23. Ahmad, S.; Masood, A.; Husain, A. Seismic pure friction base isolation performance using demolished waste in two-storey masonry building. J. Inst. Eng. Civ. Eng. Div. 2011, 91, 10–17. [Google Scholar]
  24. Panchal, V.R.; Jangid, R.S. Variable friction pendulum system for near-fault ground motions. Struct. Control Health Monit. 2008, 15, 568–584. [Google Scholar] [CrossRef]
  25. National Standard for People’s Republic of China Code for Seismic Design of Building (GB50011-2010); China Architecture and Building Press: Beijing, China, 2010. (In Chinese)
Figure 1. The prototype structure (a) a plan view; (b) an elevation view; (c) a 3D prototype structure.
Applsci 06 00345 g001
Figure 2. Specimen Design, RC: reinforced concrete; MG: marble-graphite.
Applsci 06 00345 g002
Figure 3. Configuration of the Stop Block.
Applsci 06 00345 g003
Figure 4. Example specimen diagrams (a) Glass-Graphite –Base-Wall-1 (GGBW-1); (b) GGBW-4; (①- clay bricks; ②- concrete stem; ③- recycled bricks; ④- flay ash blocks).
Applsci 06 00345 g004
Figure 5. The making of the specimens: (a) stem making; (b) wall making; (c) completed specimen and its maintenance.
Applsci 06 00345 g005
Figure 6. Equipment and measurement: (a) loading devices and indicator arrangement; (b) test scene; (①- reaction wall; ②- loading frame; ③- 50t jack; ④- 50t sensor; ⑤- loading beam; ⑥- displacement sensor for loading beam; ⑦- wall; ⑧- marble-graphite isolator; ⑨- anchor block; ⑩- upper foundation beam; ⑪ - lower foundation beam; ⑫ - displacement sensor for upper foundation beam; ⑬ - dial indicator).
Applsci 06 00345 g006
Figure 7. The loading approach: (a) preliminary deformation stage; (b) isolator slippage stage; (c) seismic resistance of the wall stage.
Applsci 06 00345 g007
Figure 8. MG isolator: (a) MG mixture; (b) MG isolator in place.
Applsci 06 00345 g008
Figure 9. Mortar bar(s).
Applsci 06 00345 g009
Figure 10. Failure process of GGBW-1: (a) slide isolator; (b) preliminary cracking; (c) specimen failure.
Applsci 06 00345 g010
Figure 11. Failure process of GGBW-2: (a) slide isolator; (b) preliminary cracking; (c) specimen failure.
Applsci 06 00345 g011
Figure 12. Failure process of GGBW-3: (a) slide isolator; (b) preliminary cracking; (c) specimen failure.
Applsci 06 00345 g012
Figure 13. Failure process of GGBW-4: (a) slide isolator; (b) preliminary cracking; (c) specimen failure.
Applsci 06 00345 g013
Figure 14. MG slide and restrictive rebars upon failure of wall (a) buckled restrictive rebars; (b) MG slide upon failure of wall.
Applsci 06 00345 g014
Figure 15. F-U1 hysteretic curves. (a) GGBW-1; (b) GGBW-2; (c) GGBW-3; (d) GGBW-4.
Applsci 06 00345 g015aApplsci 06 00345 g015b
Figure 16. F-U2 hysteretic Curves: (a) GGBW-1; (b) GGBW-3; (c) GGBW-4.
Applsci 06 00345 g016aApplsci 06 00345 g016b
Figure 17. Comparison of F-U1 and F-U2 Skeleton Curves: (a) GGBW-1; (b) GGBW-2; (c) GGBW-3; (d) GGBW-4.
Applsci 06 00345 g017
Figure 18. Force-bearing performance of mortar bars. (a) GGBW-1; (b) GGBW-2; (c) GGBW-3; (d) GGBW-4.
Applsci 06 00345 g018
Table 1. Characteristics of the marbles.
DiameterRatioWater Absorption RateHardnessAcid ResistanceAlkali ResistancePressure at ClosureDesigned Compressive Strength
5 mm2.81.0%–1.5%799.04%97.6%5% Breakage Ratio at 40 N/mm220 N/mm2
Table 2. Characteristics of the graphite.
Particle SizeCarbon ContentAsh Content
200 in Mesh Number99%1%
Table 3. Performance Index of Materials Applied.
NamePosition of ApplicationPerformance Indicator
ConcreteUpper and lower foundation beams, stemsDesigned compressive strength-C35, measured strength-36.1 MPa
Flay ash Masonry BlocksWall(s)Standard for compressive strength-2.58 MPa, axial compressive strength-2.32 MPa
MortarWall(s)Designed compressive strength-M10, measured strength-10.03 MPa
Clay BricksWall(s)Designed compressive strength-MU10, measured strength-10.39 MPa
Recycled concrete bricksWall(s)Designed compressive strength-C10, measured strength-10.95 MPa
Steel barReinforced stems Strength-HRB400, yield strength measured-461.00 MPa
Steel barRestrictive screws (with screw thread at both ends)Strength-HRB335, yield strength measured-387.00 MPa
Table 4. The inter-story drift, IDI: the index of inter-storey drift with respect to the storey height.
Specimen No.GGBW-1GGBW-2GGBW-3GGBW-4
IDI
IDImax1.86%-2.14%1.21%
IDIfinal2.29%-4.06%1.67%
IDIfinal/IDImax1.23-1.901.38
Table 5. Comparison of initiating load and corresponding seismic force (minor).
Specimen No.Initiating Load for Slippage F0 (kN)Geq (kN)0.16 Geq (kN)Premise(s) Required for No Damage under Minor Seismic Force F0 > 0.16 Geq
GGBW-118.72114.4618.31Positive
GGBW-223.35115.1218.42Positive
GGBW-329.11117.3318.77Positive
GGBW-426.54117.9918.88Positive
Average24.43116.2318.60-
Table 6. Specified Loads and Major Seismic Forces of All Specimens.
Specimen No.Initiating Load for Slippage F0 (kN)Split Limit during Preliminary Stage Fc (kN)F0/FcLoading Limit, Fmax (kN)F0/Fmax0.90 Geq (kN)Premise for No Collapse during Major Earthquake Fmax > 0.90 Geq
GGBW-118.7294.000.199132.670.141103.01Positive
GGBW-223.35120.000.195142.660.164103.61Positive
GGBW-329.11151.000.193160.280.182105.60Positive
GGBW-426.54140.000.190151.650.175106.19Positive
Average24.43126.250.194146.820.166104.60-
Table 7. Average slippage loading.
Specimen No.Average Slippage Loading in Positive Direction (kN)Average Slippage Loading in Negative Direction (kN)Average Slippage Loading (kN)0.90 Geq (kN) F ¯ /0.90 Geq
GGBW-118.9019.5819.24103.010.187
GGBW-221.7021.1121.41103.610.207
GGBW-317.8718.8018.34105.600.174
GGBW-421.0018.1019.55106.190.184
Average19.8919.4019.64104.600.188

