1. Introduction
Desulfurization is very important in the petroleum refining process because oxysulfides from the petroleum refining process are one of the major sources of air pollution. The most frequently used desulfurization process is the Claus process, which converts the H
2S in natural gas or crude oil into sulfur elements, which reduces the formation of oxysulfides. A sulfur recovery unit (SRU) thermal reactor is the most important equipment in a sulfur plant. It converts the NH
3, H
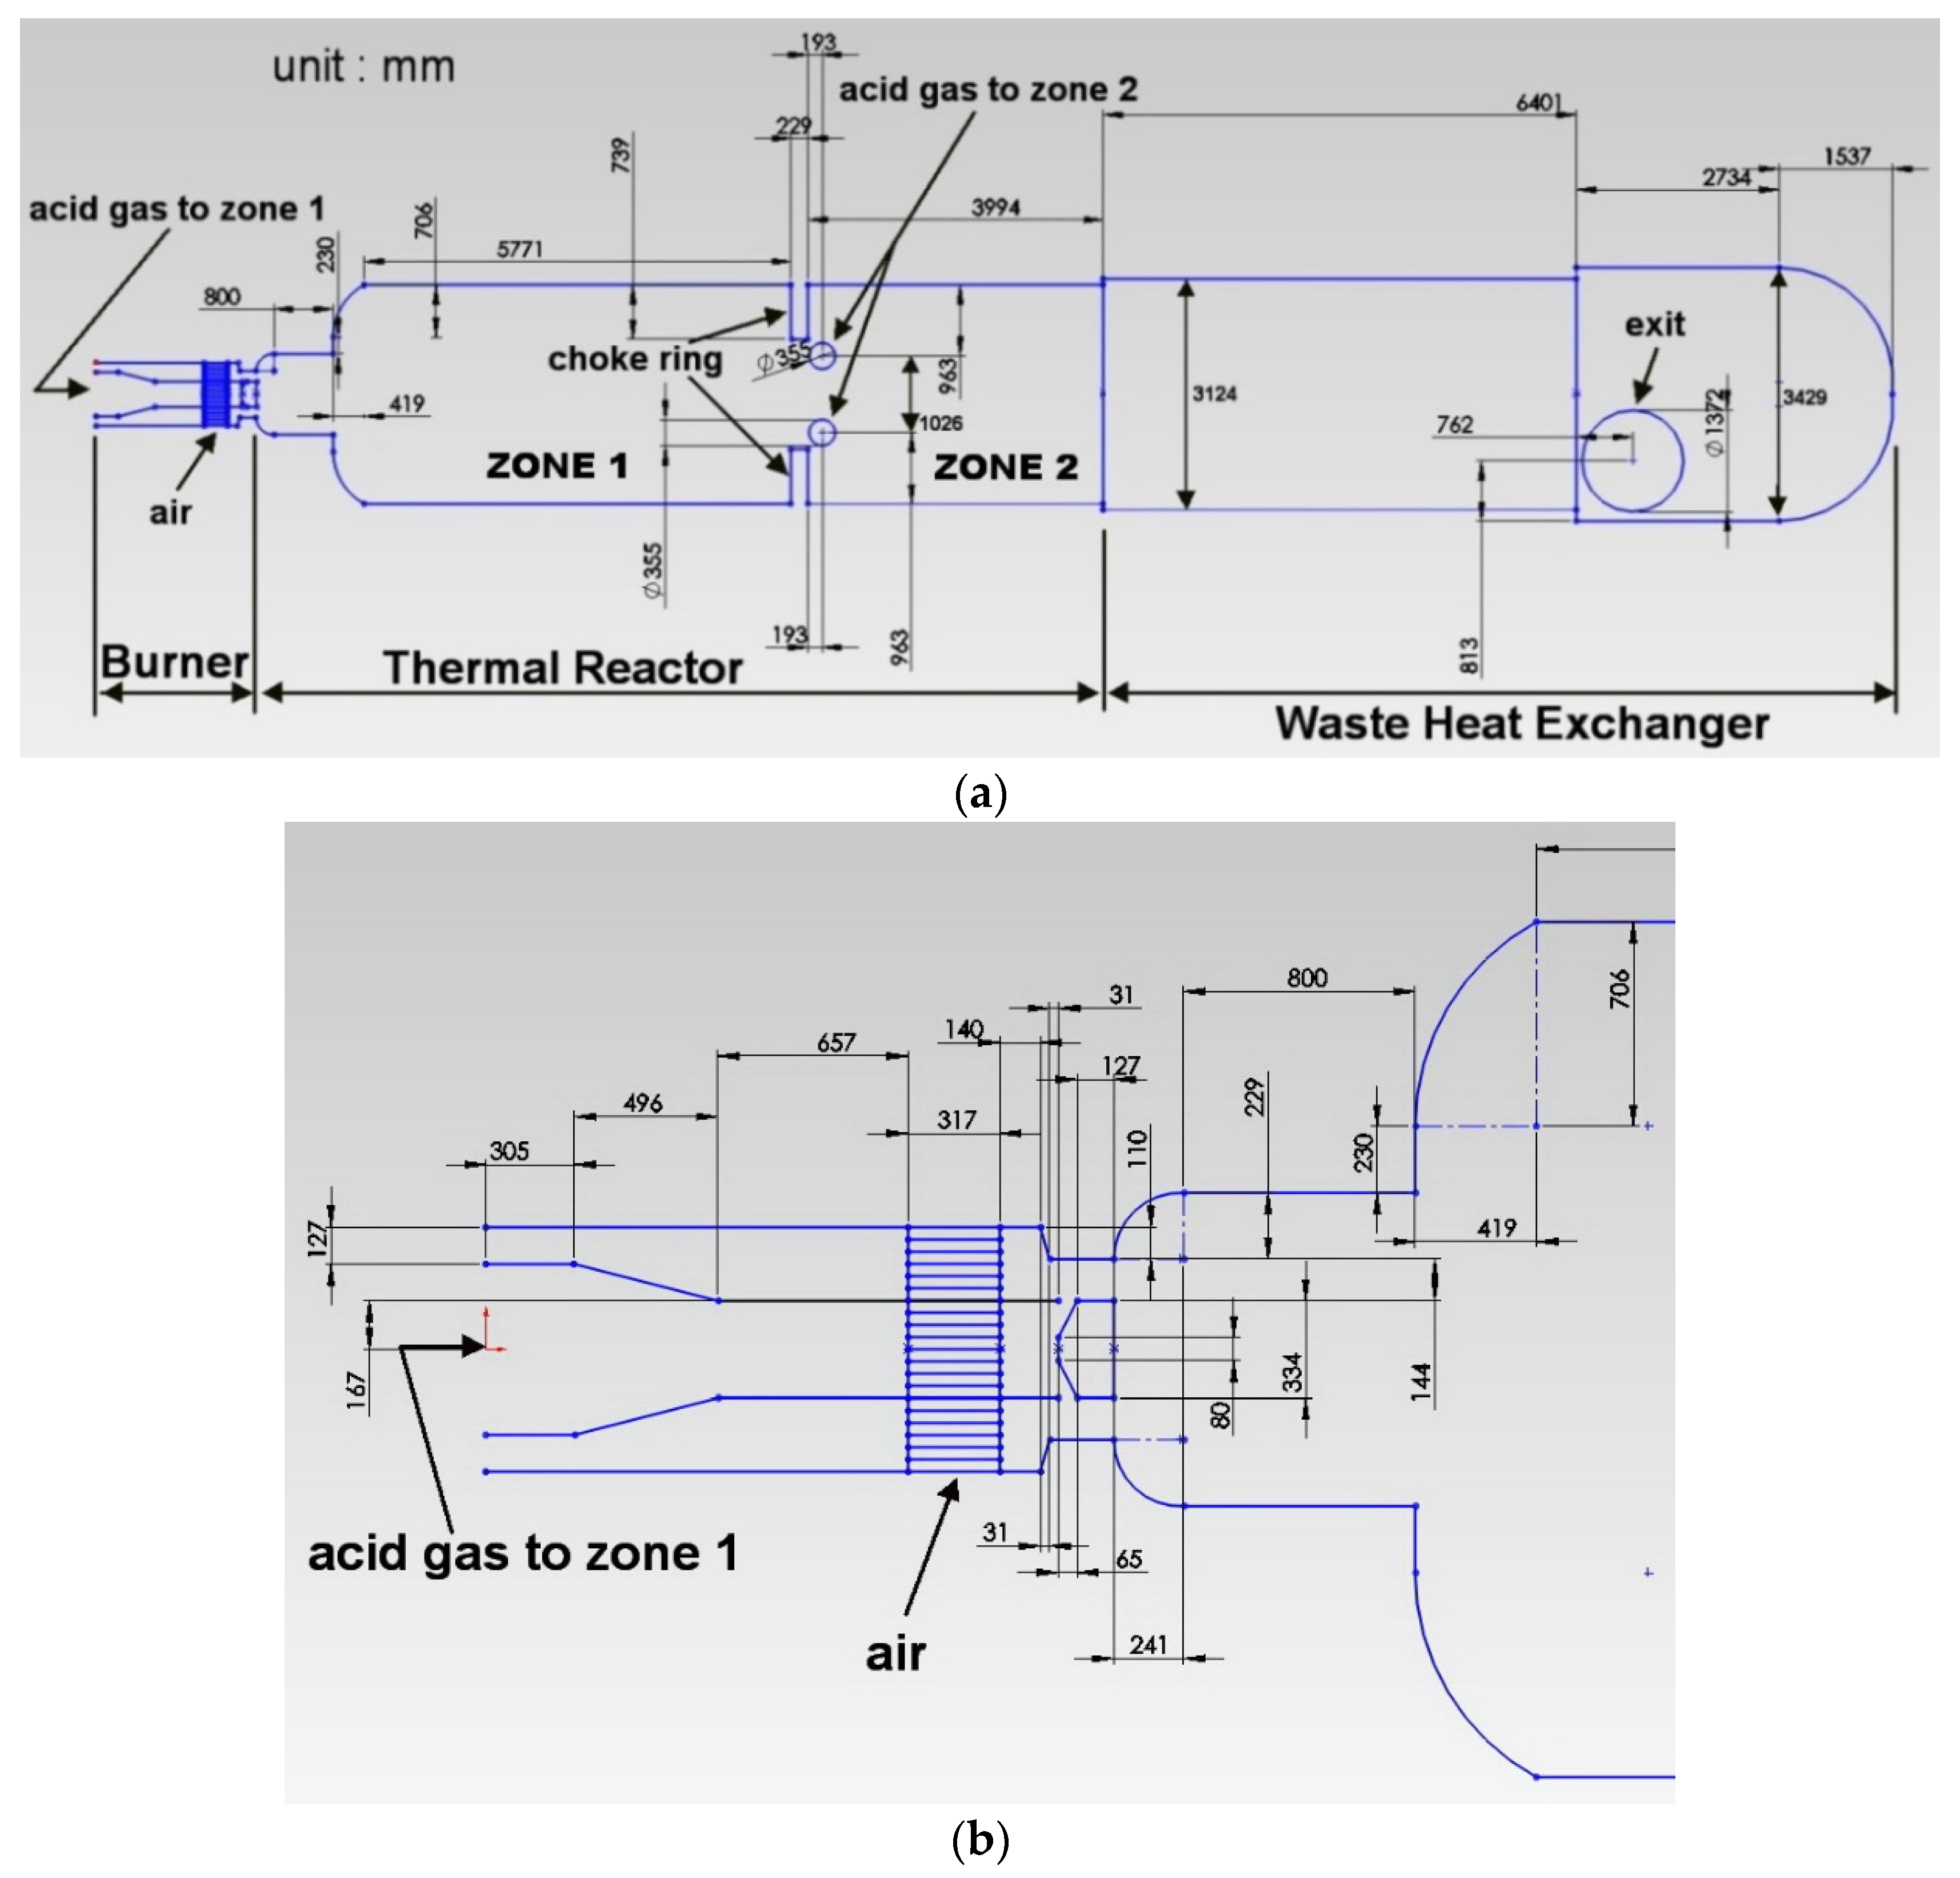
2S and hydrocarbons in the reactants into sulfur. Most of the sulfur elements are recovered from the SRU thermal reactor. The first section of a SRU that uses the Claus process is composed of a burner, a thermal reactor and a waste heat exchanger. The configuration and dimensions of the first section of a SRU for a typical petroleum refinery are shown in
Figure 1.
The main chemical reactions in a SRU thermal reactor include a thermal step and a catalytic step.
In addition to the above reactions and the combustion of hydrocarbon fuels, other chemical reactions taking place in a SRU thermal reactor are
The interior of a SRU thermal reactor is divided into two zones by a choke ring, in order to increase the residence time and enhance the chemical reaction. The zone ahead of the choke ring is called zone 1 and the zone behind the choke ring is called zone 2. The inner surface of a SRU thermal reactor is fabricated using a refractory to protect its walls because a SRU thermal reactor operates at very high temperatures. SRU thermal reactors are negatively affected by high temperature operations because high temperature can damage the refractory and the heat exchanger tubes. Therefore, the operating temperature range that is suggested by the manufacturers for the operation of a SRU thermal reactor must be strictly adhered to.
There have been theoretical and experimental studies of SRU thermal reactors. Adewale et al. [
1] studied the thermal decomposition of H
2S into hydrogen and sulfur using a process simulator. Using the net fraction of the acid gas feed to the cracking coils as the controlling parameter, its effect on hydrogen production, the thermal reactor’s energy requirement, the stability of the burner flame, steam production, the temperature of a Claus reactor and sulfur recovery of the primary SRU was studied. Chardonneaua et al. [
2] presented experimental and simulation results for the addition of various amounts of toluene or carbon dioxide/toluene mixtures into the H
2S gas stream. The results show that there is a decrease in the conversion efficiency when the amount of toluene or carbon dioxide/toluene added to the H
2S gas stream increases. The role of the reactor’s operating temperature was also studied. The addition of toluene increases the optimum reactor temperature for enhanced sulfur recovery, but the presence of CO
2 reduces the optimum operating temperature. Selim et al. [
3] examined the quality of sulfur deposits that were collected from H
2S combustion. Sulfur deposits from H
2S combustion under various conditions were captured and analyzed using X-ray powder diffraction and laser-induced breakdown spectroscopy diagnostics. Monnery et al. [
4] experimentally studied the reaction between H
2S and SO
2 using practical Claus thermal reactor temperatures between 850 and 1150 °C and residence times between 0.05 and 1.2 s. The kinetic data obtained were used to develop a new reaction rate expression.
Our experience of operating a practical SRU thermal reactor in Taiwan shows that the refractories at the zone 1 corner and the choke ring are the parts of the thermal reactor that experience the greatest deterioration. The zone 1 corner has a suddenly expanded geometry and a recirculation zone forms behind it. The temperature at the zone 1 corner can exceed the maximum service temperature of the refractory and cause collapse or deformation. The choke ring is subjected to a bending moment from the rapid combustion gas stream and can collapse or deform. Several methods to alleviate this problem have been assessed, including (1) changing the choke ring dimensions [
5]; (2) changing the choke ring position [
6]; (3) modifying the geometry of the zone 1 corner to a streamlined geometry [
7,
8]; and (4) replacing the choke ring by a vector wall [
9]. However, these methods are either expensive or require an overhaul of the SRU thermal reactor. This paper presents a new, easier and more economical method. The effect of the fuel mass fraction on the combustion and fluid flow in a SRU thermal reactor is investigated numerically. This paper provides a guideline for adjusting the fuel mass fraction to reduce the high temperature inside a thermal reactor and to ensure an acceptable sulfur recovery. Practical operating conditions from a petrochemical corporation in Taiwan were used as the design conditions for the discussion.
2. Numerical Methods and Physical Models
In this study, the FLUENT commercial code is used to simulate the reaction and fluid flow in a SRU thermal reactor. The SIMPLE algorithm by Patankar [
10] is used to solve the governing equations. The discretizations of convection terms and diffusion terms are respectively performed using the power-law scheme and the central difference scheme. In terms of physical models, considering the accuracy and stability of the models and the evaluations of other researchers, the standard
k-ε model [
11], the P-1 radiation model [
12] and the non-premixed combustion model with a β-type probability density function [
13] are respectively used for the turbulence, radiation and combustion simulations. The standard wall functions [
14] are used to resolve the flow quantities (velocity, the temperature, and the turbulence quantities) at the near-wall regions.
For the steady-state three-dimensional flow field with the chemical reaction in this study, the governing equations for the continuity equation, momentum equation and turbulence equation (
k-ε model) are described below. The governing equations for the energy equation, radiation equation, combustion equation and convergence criterion are described in a previous study by the author [
15].
Momentum equation:
In an inertial reference frame, the momentum equation [
16] may be expressed as
where
is the possible source term of the momentum equation which may include the body force caused by the interaction with dispersed phases or the extra force terms caused by physical models or numerical schemes. In Equation (2), the stress tensor
may be expressed as
where
I is the unit tensor, the superscript T represents the transpose operator, and the third term on the right-hand side of the equal sign represents the volume dilation effect. By the long-time averaged method, Equation (2) may be converted to Reynolds-averaged Navier-Stokes (RANS) equations as follows:
In Equation (4), the turbulent stresses (Reynolds stresses) may be related to the mean velocity gradient by the Boussinesq hypothesis as follows:
In Equation (5), the turbulent (or eddy) viscosity may be expressed in terms of the turbulence kinetic energy (
k) and turbulence dissipation rate (ε) as:
As mentioned above, k and ε are modeled by the k-ε model, as described below.
k-ε model equation:
The turbulence kinetic energy (
k) and turbulence dissipation rate (ε) may be solved from their transport equations [
11] as follows:
In Equations (7) and (8),
Gk represents the turbulence kinetic energy production and may be expressed as:
where
S is the modulus of the mean rate-of-strain tensor defined as
In Equation (10), .
Gb is the generation of turbulence kinetic energy due to buoyancy, calculated as
where Pr
t = 0.85 is the turbulent Prandtl number for energy and
gi is the component of the gravitational vector in the
ith direction. The coefficient of thermal expansion,
β, is defined as
YM represents the contribution of the fluctuating dilatation in compressible turbulence to the overall dissipation rate and can be calculated as follows:
where
Mt is the turbulent Mach number, defined as
In Equation (14), a (= ) is the speed of sound.
The values of turbulence model constants
C1ε,
C2ε,
Cμ, σ
k and σ
ε are as follows:
The value of turbulence model constant C
3ε is calculated from the following equation
where
v is the component of the flow velocity parallel to the gravitational vector and
u is the component of the flow velocity perpendicular to the gravitational vector.
3. Results and Discussion
In this study, the numerical model of a SRU thermal reactor is constructed using an unstructured grid. Five cell densities—10,826 cells, 187,354 cells, 342,856 cells, 683,672 cells and 1,124,627 cells—are tested to ensure a grid-independent solution. The computational results show that the sizes of the corner recirculation zone in zone 1 and zone 2 and the cross-sectional average temperature profiles obtained using the last two meshes almost coincide, with a deviation of less than 0.5%. Therefore, the mesh of 683,672 cells is used for the subsequent discussion.
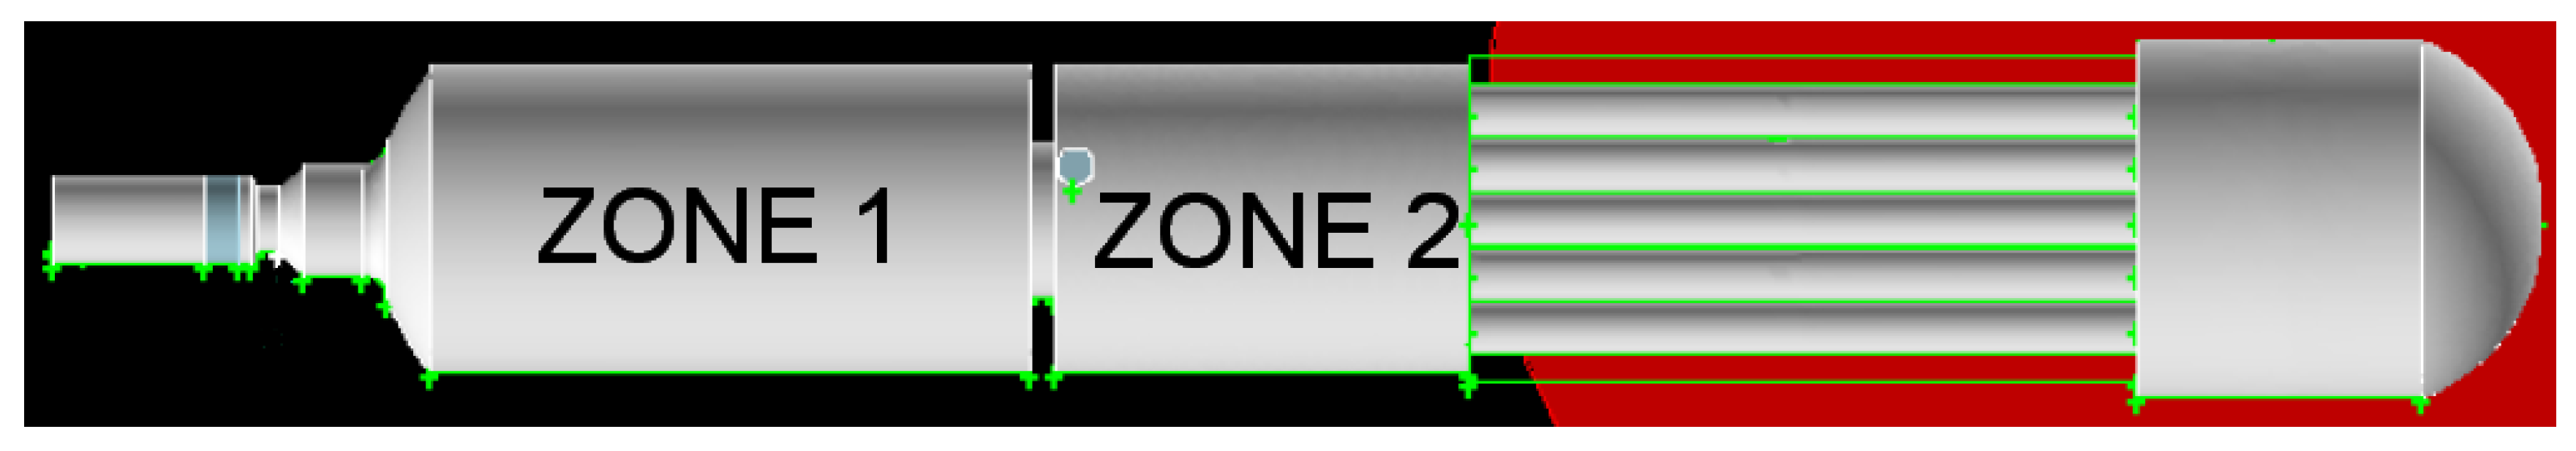
Figure 2 shows the numerical model of the SRU thermal reactor investigated. In
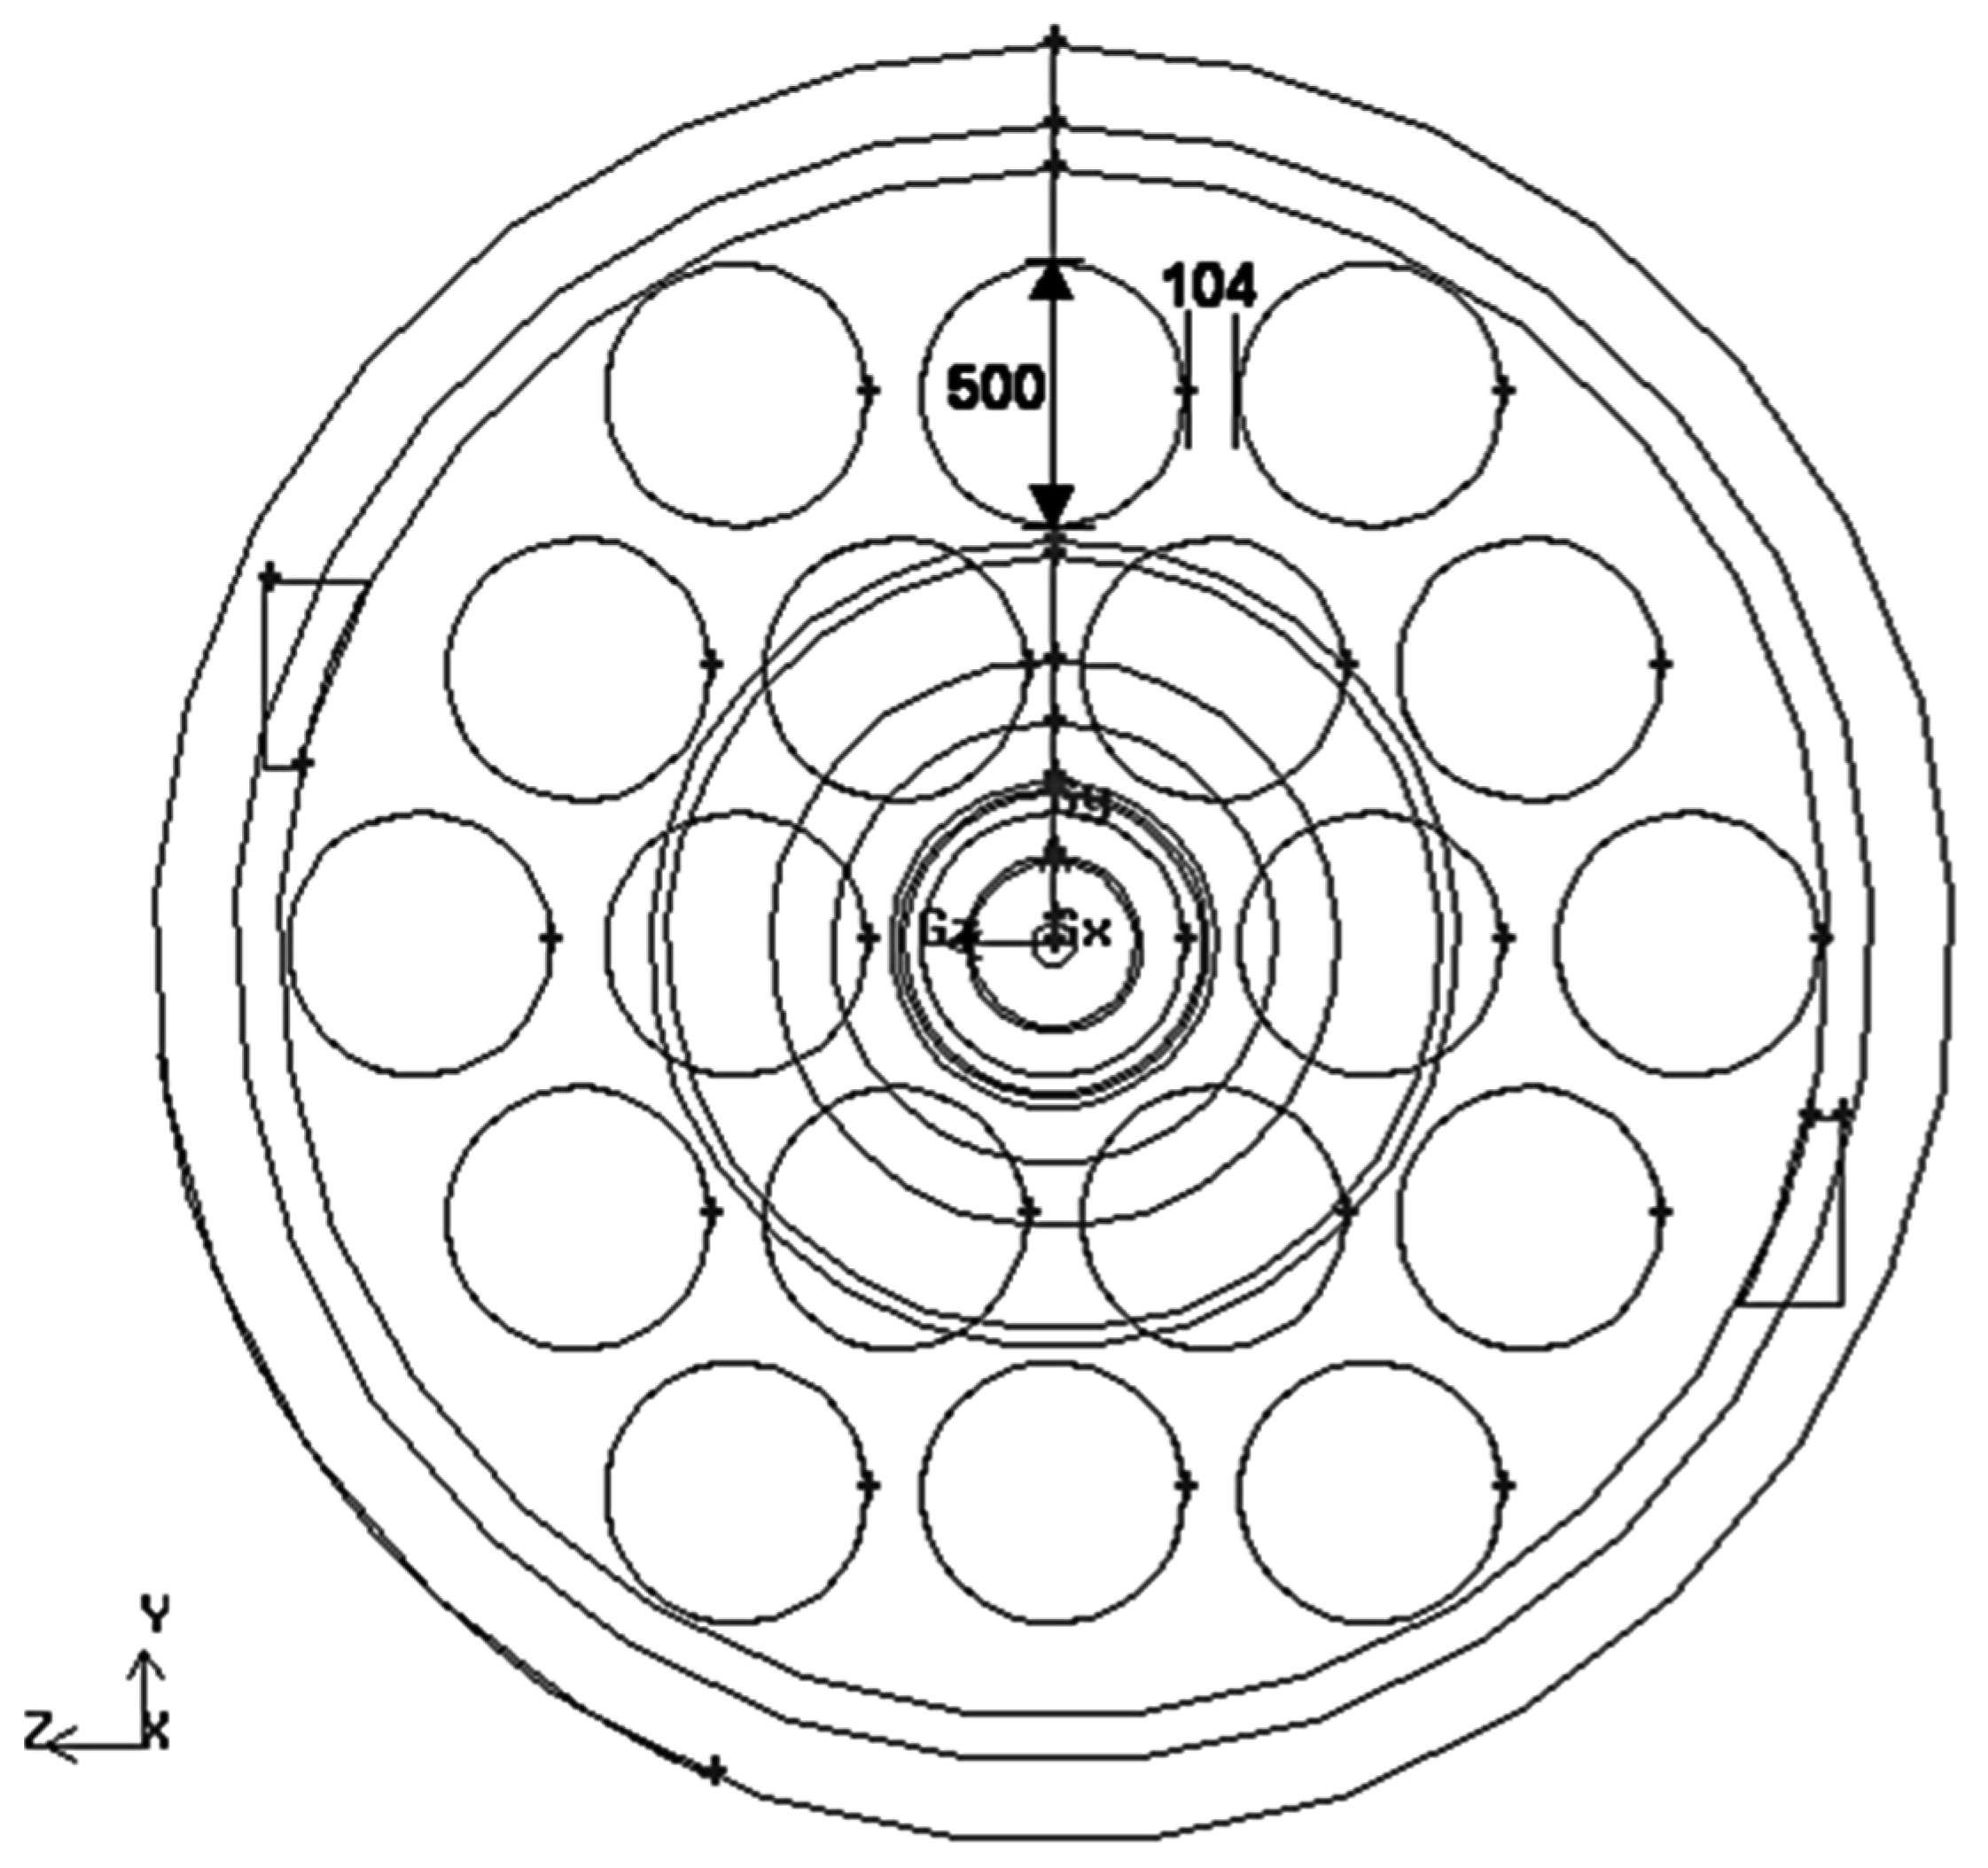
Figure 2, the heat exchanger section consists of 19 cooling tubes, which have a diameter of 0.5 m, as shown schematically in
Figure 3. The heat absorption rate for each heat exchanger tube is 40,000 W/m
2 and the other walls are adiabatic. No slip condition is applied on all solid walls. The exit of the heat exchanger section is connected to other equipment at 300 K and 1 atm by a pipe that is 1.372 m in diameter and 11.5 m in length.
In this study, two types of oxygen supplies are investigated: an oxygen-normal supply and an oxygen-rich supply. An oxygen-rich supply increases sulfur recovery. The design conditions (including the species compositions, the temperature, the pressure and the velocity) at the acid gas inlet holes of zone 1 and zone 2 and at the air inlet hole are listed in
Table 1. These conditions are practical operating conditions that are used by a petrochemical corporation in Taiwan. The turbulence kinetic energy is 10% of the inlet mean flow kinetic energy and the turbulence dissipation rate is computed using Equation (16).
where
l = 0.07
L and
L is the hydraulic diameter.
To validate the numerical methods used in this study, the simulation results were compared with available practical data. The exit sulfur mole fractions from the SRU thermal reactor of a petrochemical corporation in Taiwan were measured with the design conditions listed in
Table 1. The results are shown in
Table 2. It can be seen that the respective deviations are 1.3% for an oxygen-normal supply and 8.3% for an oxygen-rich supply, which are acceptable from a viewpoint of engineering applications.
To determine the effect of the fuel mass fraction, the zone 1 fuel mass fraction is defined as the mass ratio of the zone 1 acid gas to the total acid gas (acid gas to zone 1 plus acid gas to zone 2). The design zone 1 fuel mass fractions, calculated from
Table 1, are 0.875 for an oxygen-normal supply and 0.895 for an oxygen-rich supply.
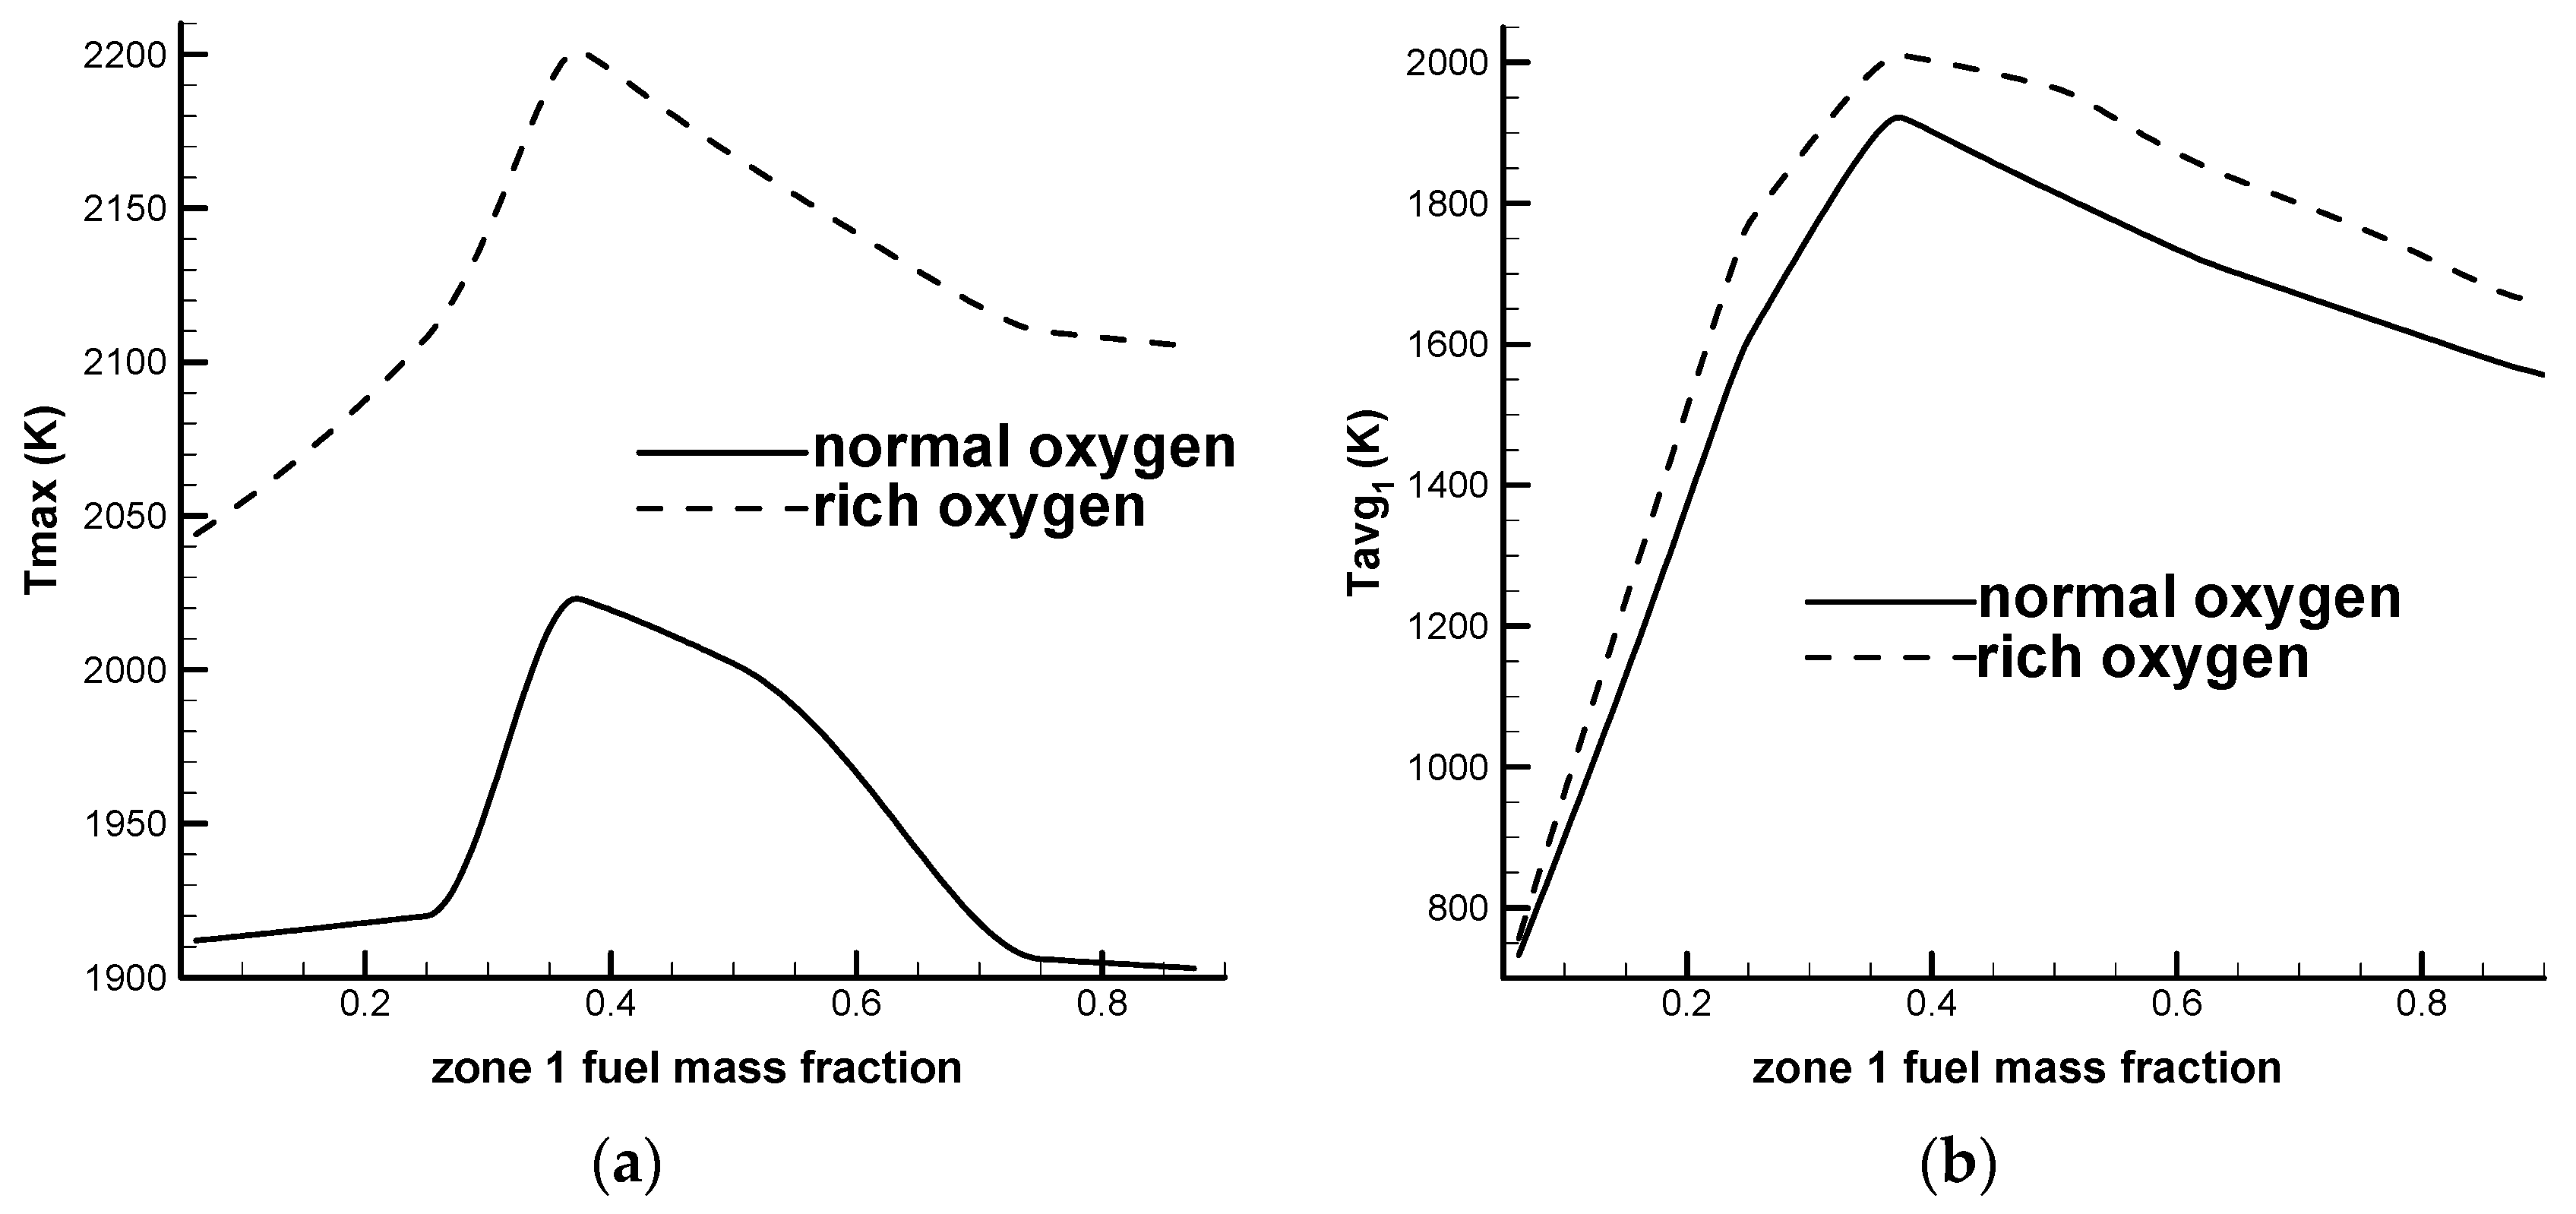
Figure 4 shows a comparison of the maximum and the average temperatures for a SRU thermal reactor with different zone 1 fuel mass fractions. The air is kept at the design condition. Eight zone 1 fuel mass fractions are used, including 0.0625, 0.125, 0.25, 0.375, 0.5, 0.625, 0.75 and 0.875 (for an oxygen-normal case) or 0.895 (for an oxygen-rich case). The zone 1 fuel mass fractions ranging from 0.0625 to 0.895 are calculated to determine the stoichiometric fuel mass fraction which produces the most complete combustion and the highest temperature.
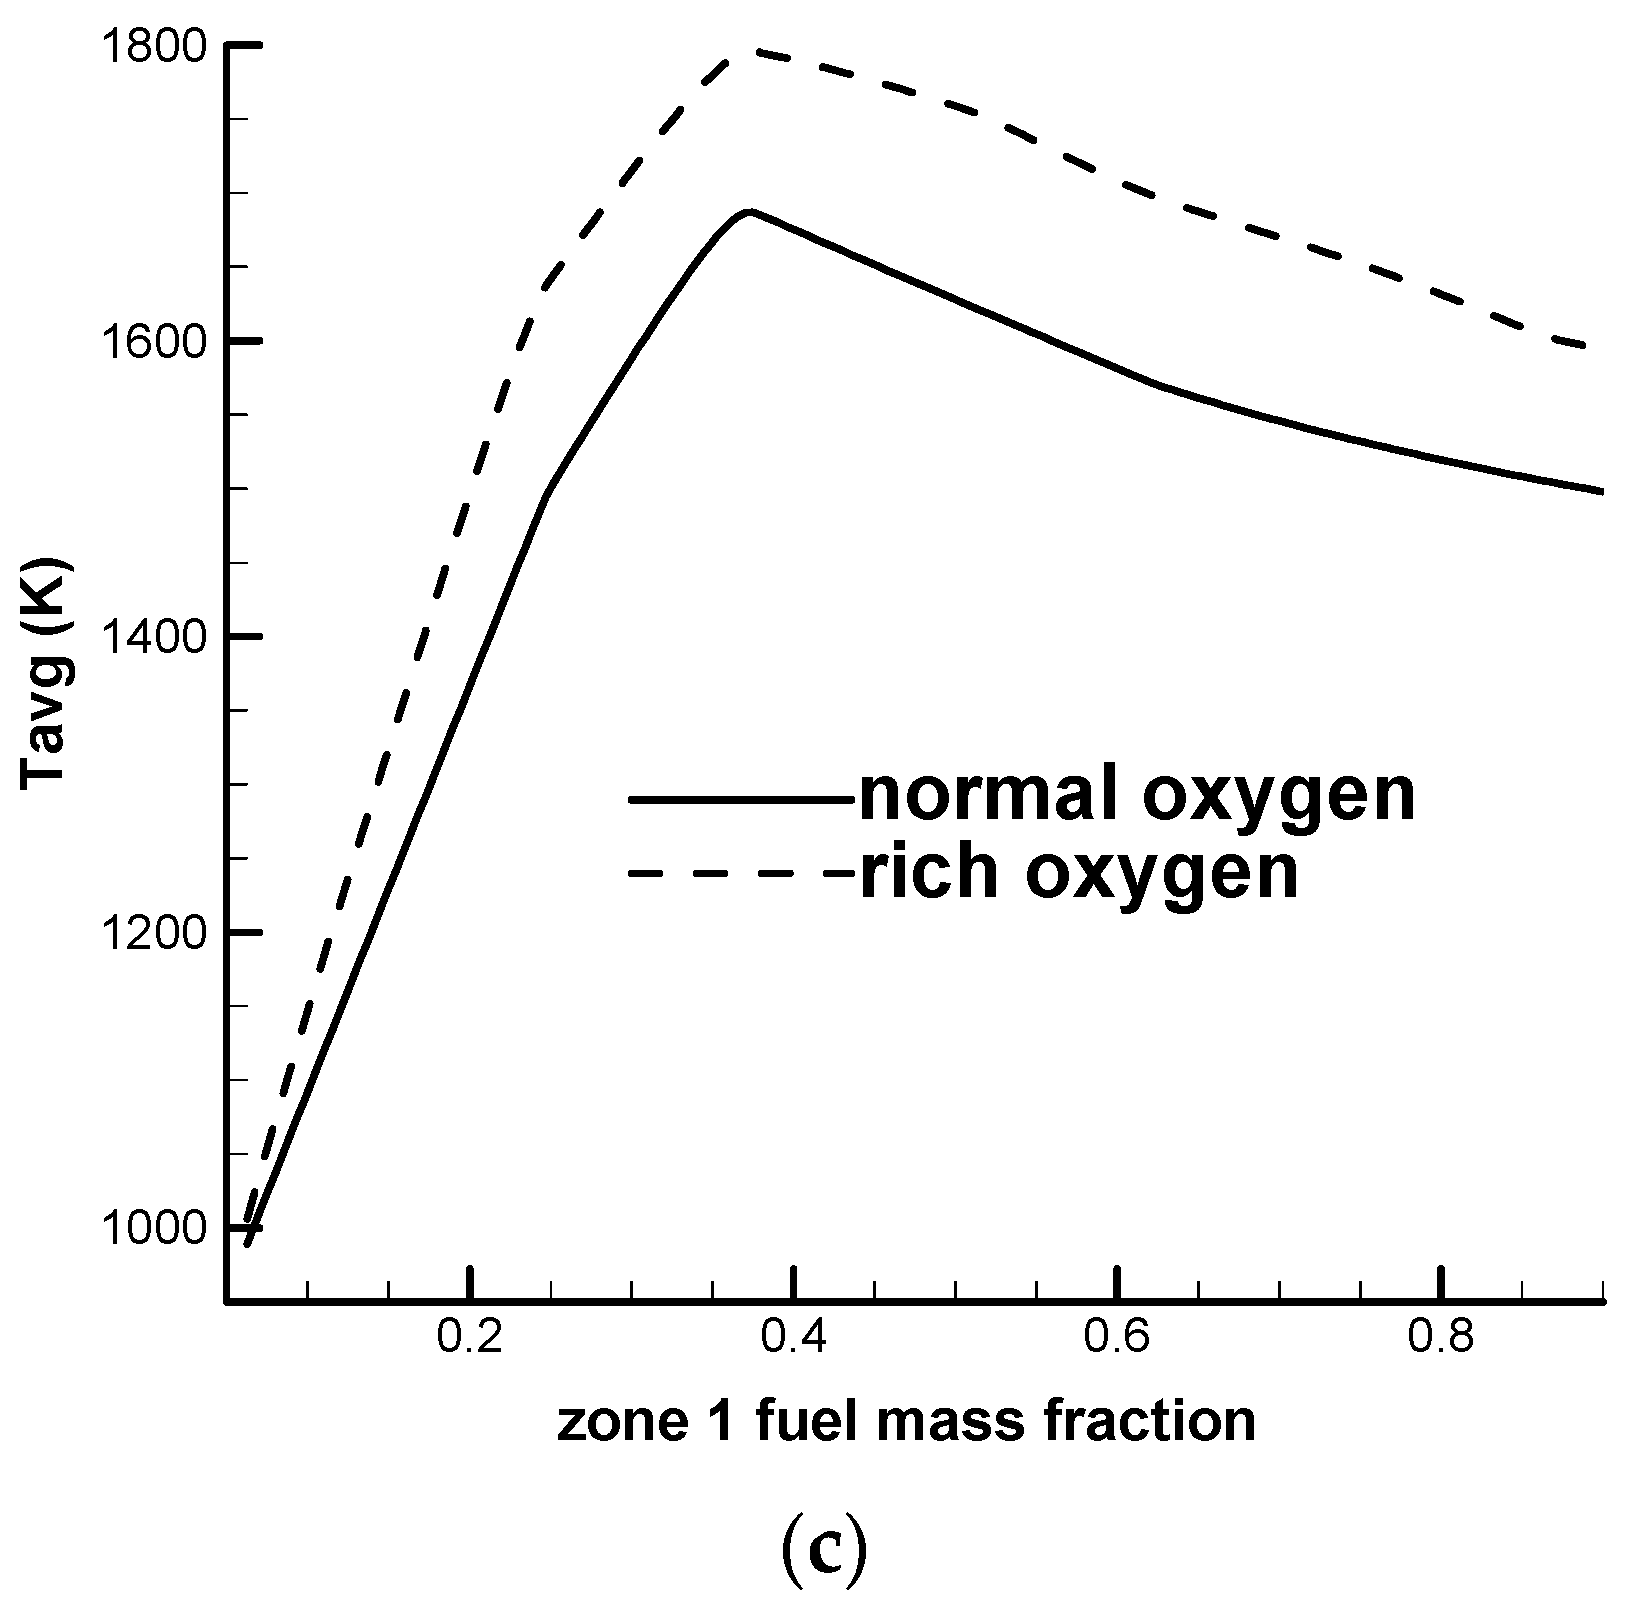
Figure 4a–c show that the maximum temperature and the average temperature reach maximum values at a zone 1 fuel mass fraction of about 0.375, which implies that the stoichiometric fuel mass fraction is around 0.375. The temperature decreases when the zone 1 fuel mass fraction deviates from the stoichiometric fuel mass fraction. In
Figure 4c, the average temperature of the thermal reactor represents the average temperature for both zone 1 and zone 2. In a practical SRU thermal reactor, high temperature can damage the refractory. For example, the zone 1 corner has a suddenly expanded geometry and a recirculation zone forms in this region. The temperature in this region can exceed the maximum service temperature for the refractory and cause collapse or deformation of the zone 1 corner. The suggested maximum service temperature for the refractory varies for different manufacturers. A typical value is 1700 °C (≈1973 K).
Figure 4a shows that the maximum temperatures for all oxygen-rich cases exceed the suggested maximum service temperature. However, for oxygen-normal cases, when the zone 1 fuel mass fraction is less than 0.3 or greater than 0.6, the maximum temperature is lower than the suggested maximum service temperature. The current design condition for an oxygen-normal operation (zone 1 fuel mass fraction of 0.875), listed in
Table 1, allows an acceptable temperature field.
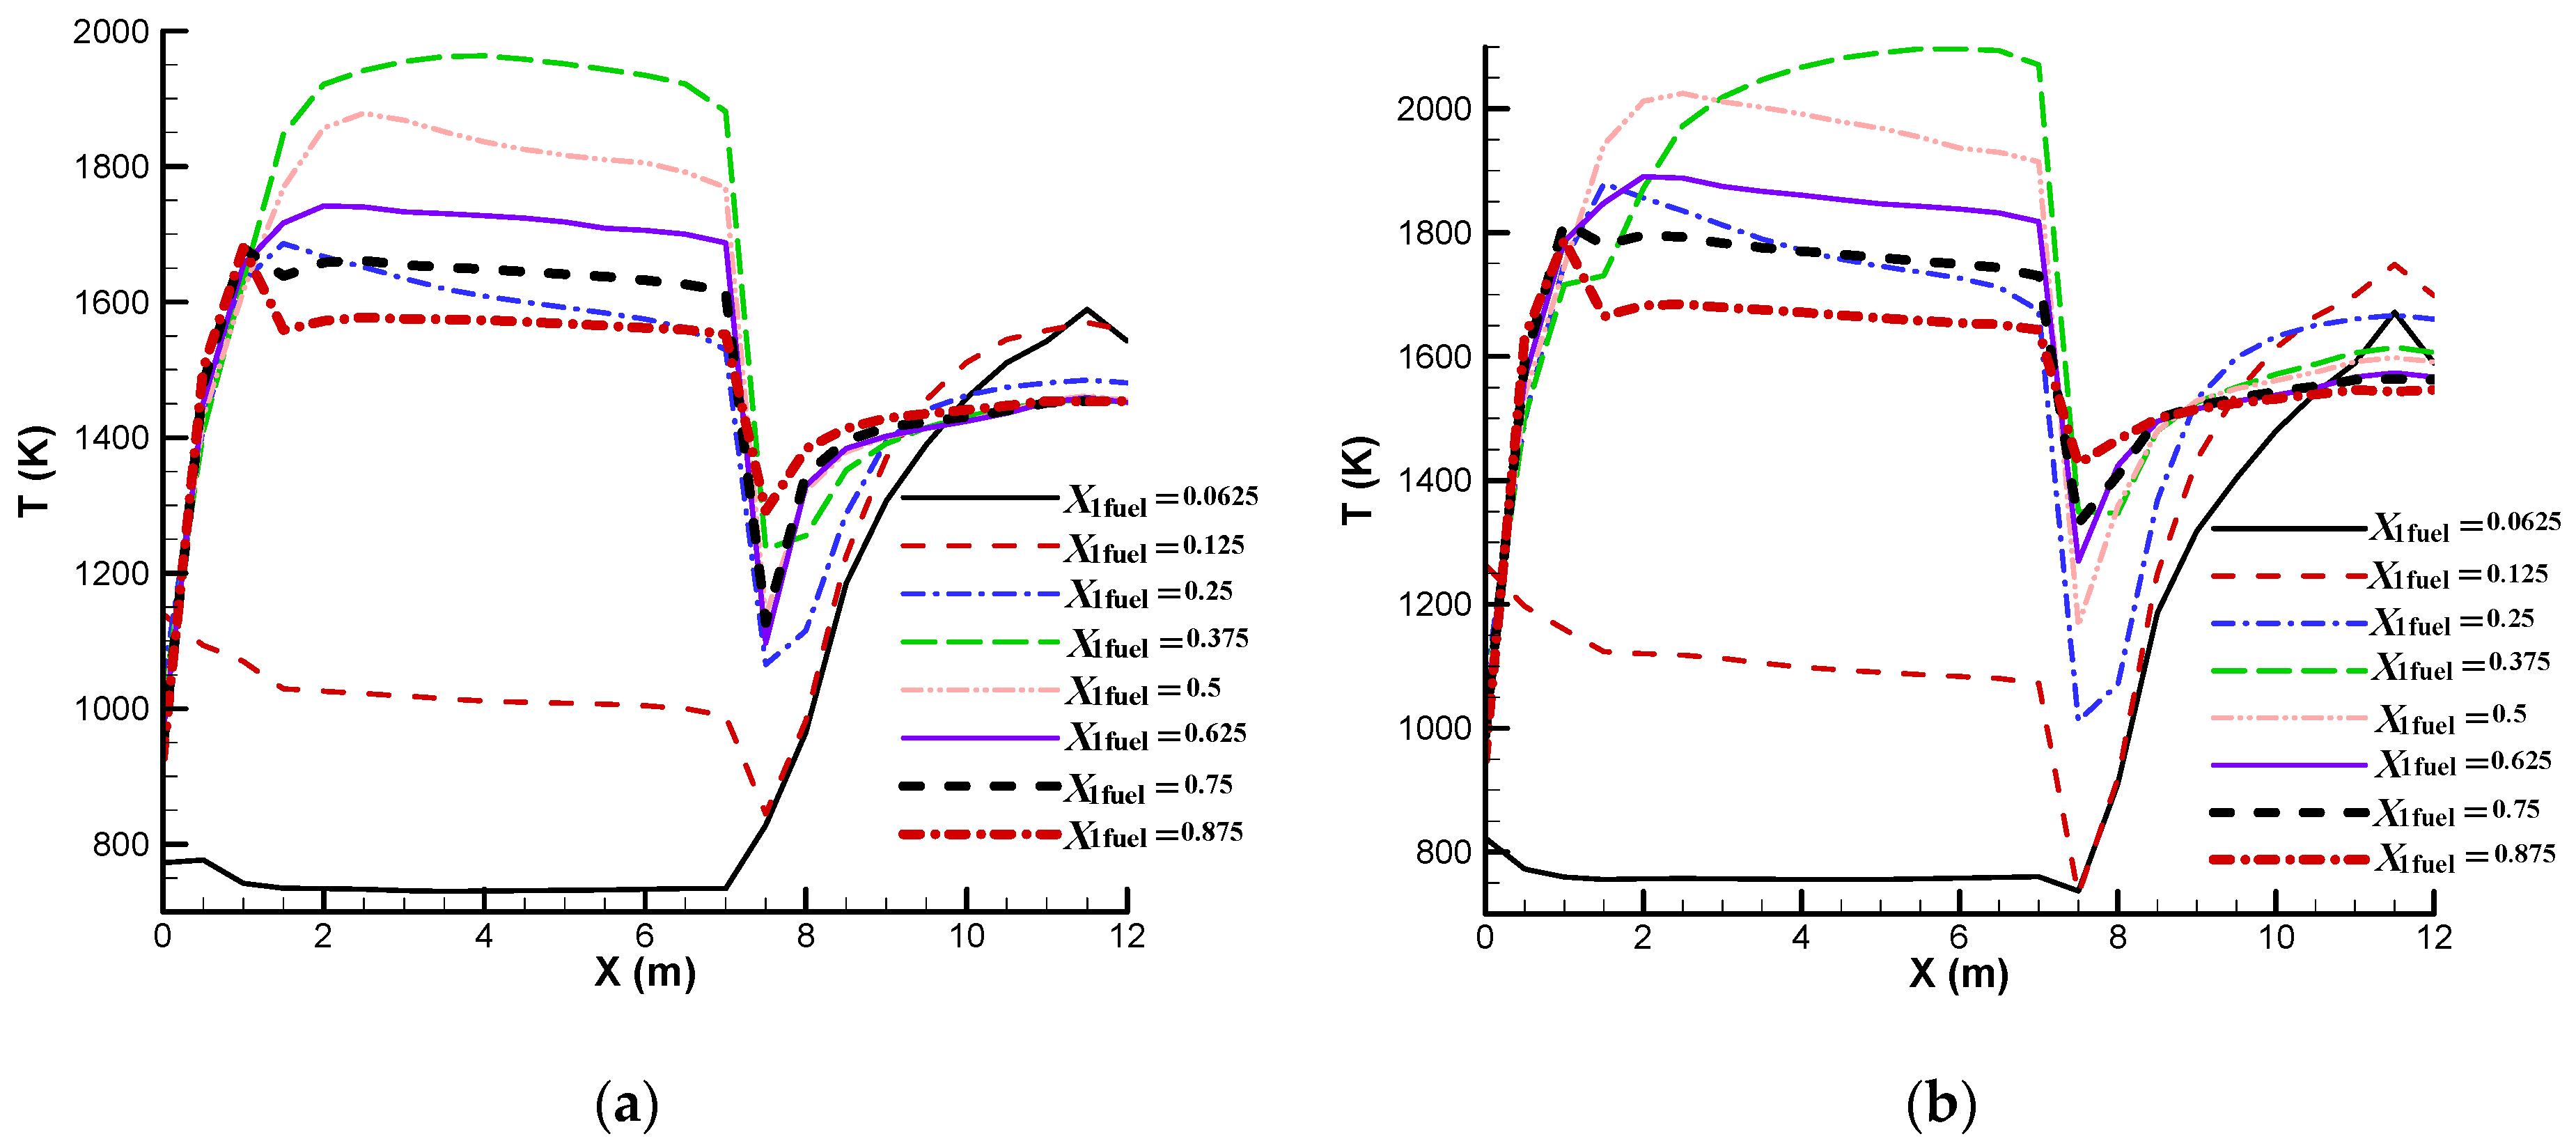
Figure 5 shows a comparison of the cross-sectional average temperature for a SRU thermal reactor with different zone 1 fuel mass fractions. It is seen that the average temperature in zone 2 is higher than the average temperature in zone 1 for zone 1 fuel mass fractions of 0.0625 and 0.125. A zone 1 fuel mass fraction lower than the stoichiometric fuel mass fraction (e.g., 0.0625 or 0.125) produces a lower zone 1 temperature and this helps protect zone 1; however, the zone 2 temperature is increased because a lower zone 1 fuel mass fraction represents a lower zone 1 fuel supply and a higher zone 2 fuel supply. It is worth noting that a high zone 2 average temperature can damage the heat exchanger tubes. For larger zone 1 fuel mass fractions, the average temperature in zone 1 is higher. An oxygen-rich supply also enhances the chemical reaction and produces a higher temperature. The temperature decreases abruptly across the choke ring because thermal energy is converted into kinetic energy when the flow is accelerated. It is also seen that the temperature is more uniform for the design zone 1 fuel mass fractions (0.875 for the oxygen-normal case and 0.895 for the oxygen-rich case). This can also be observed from
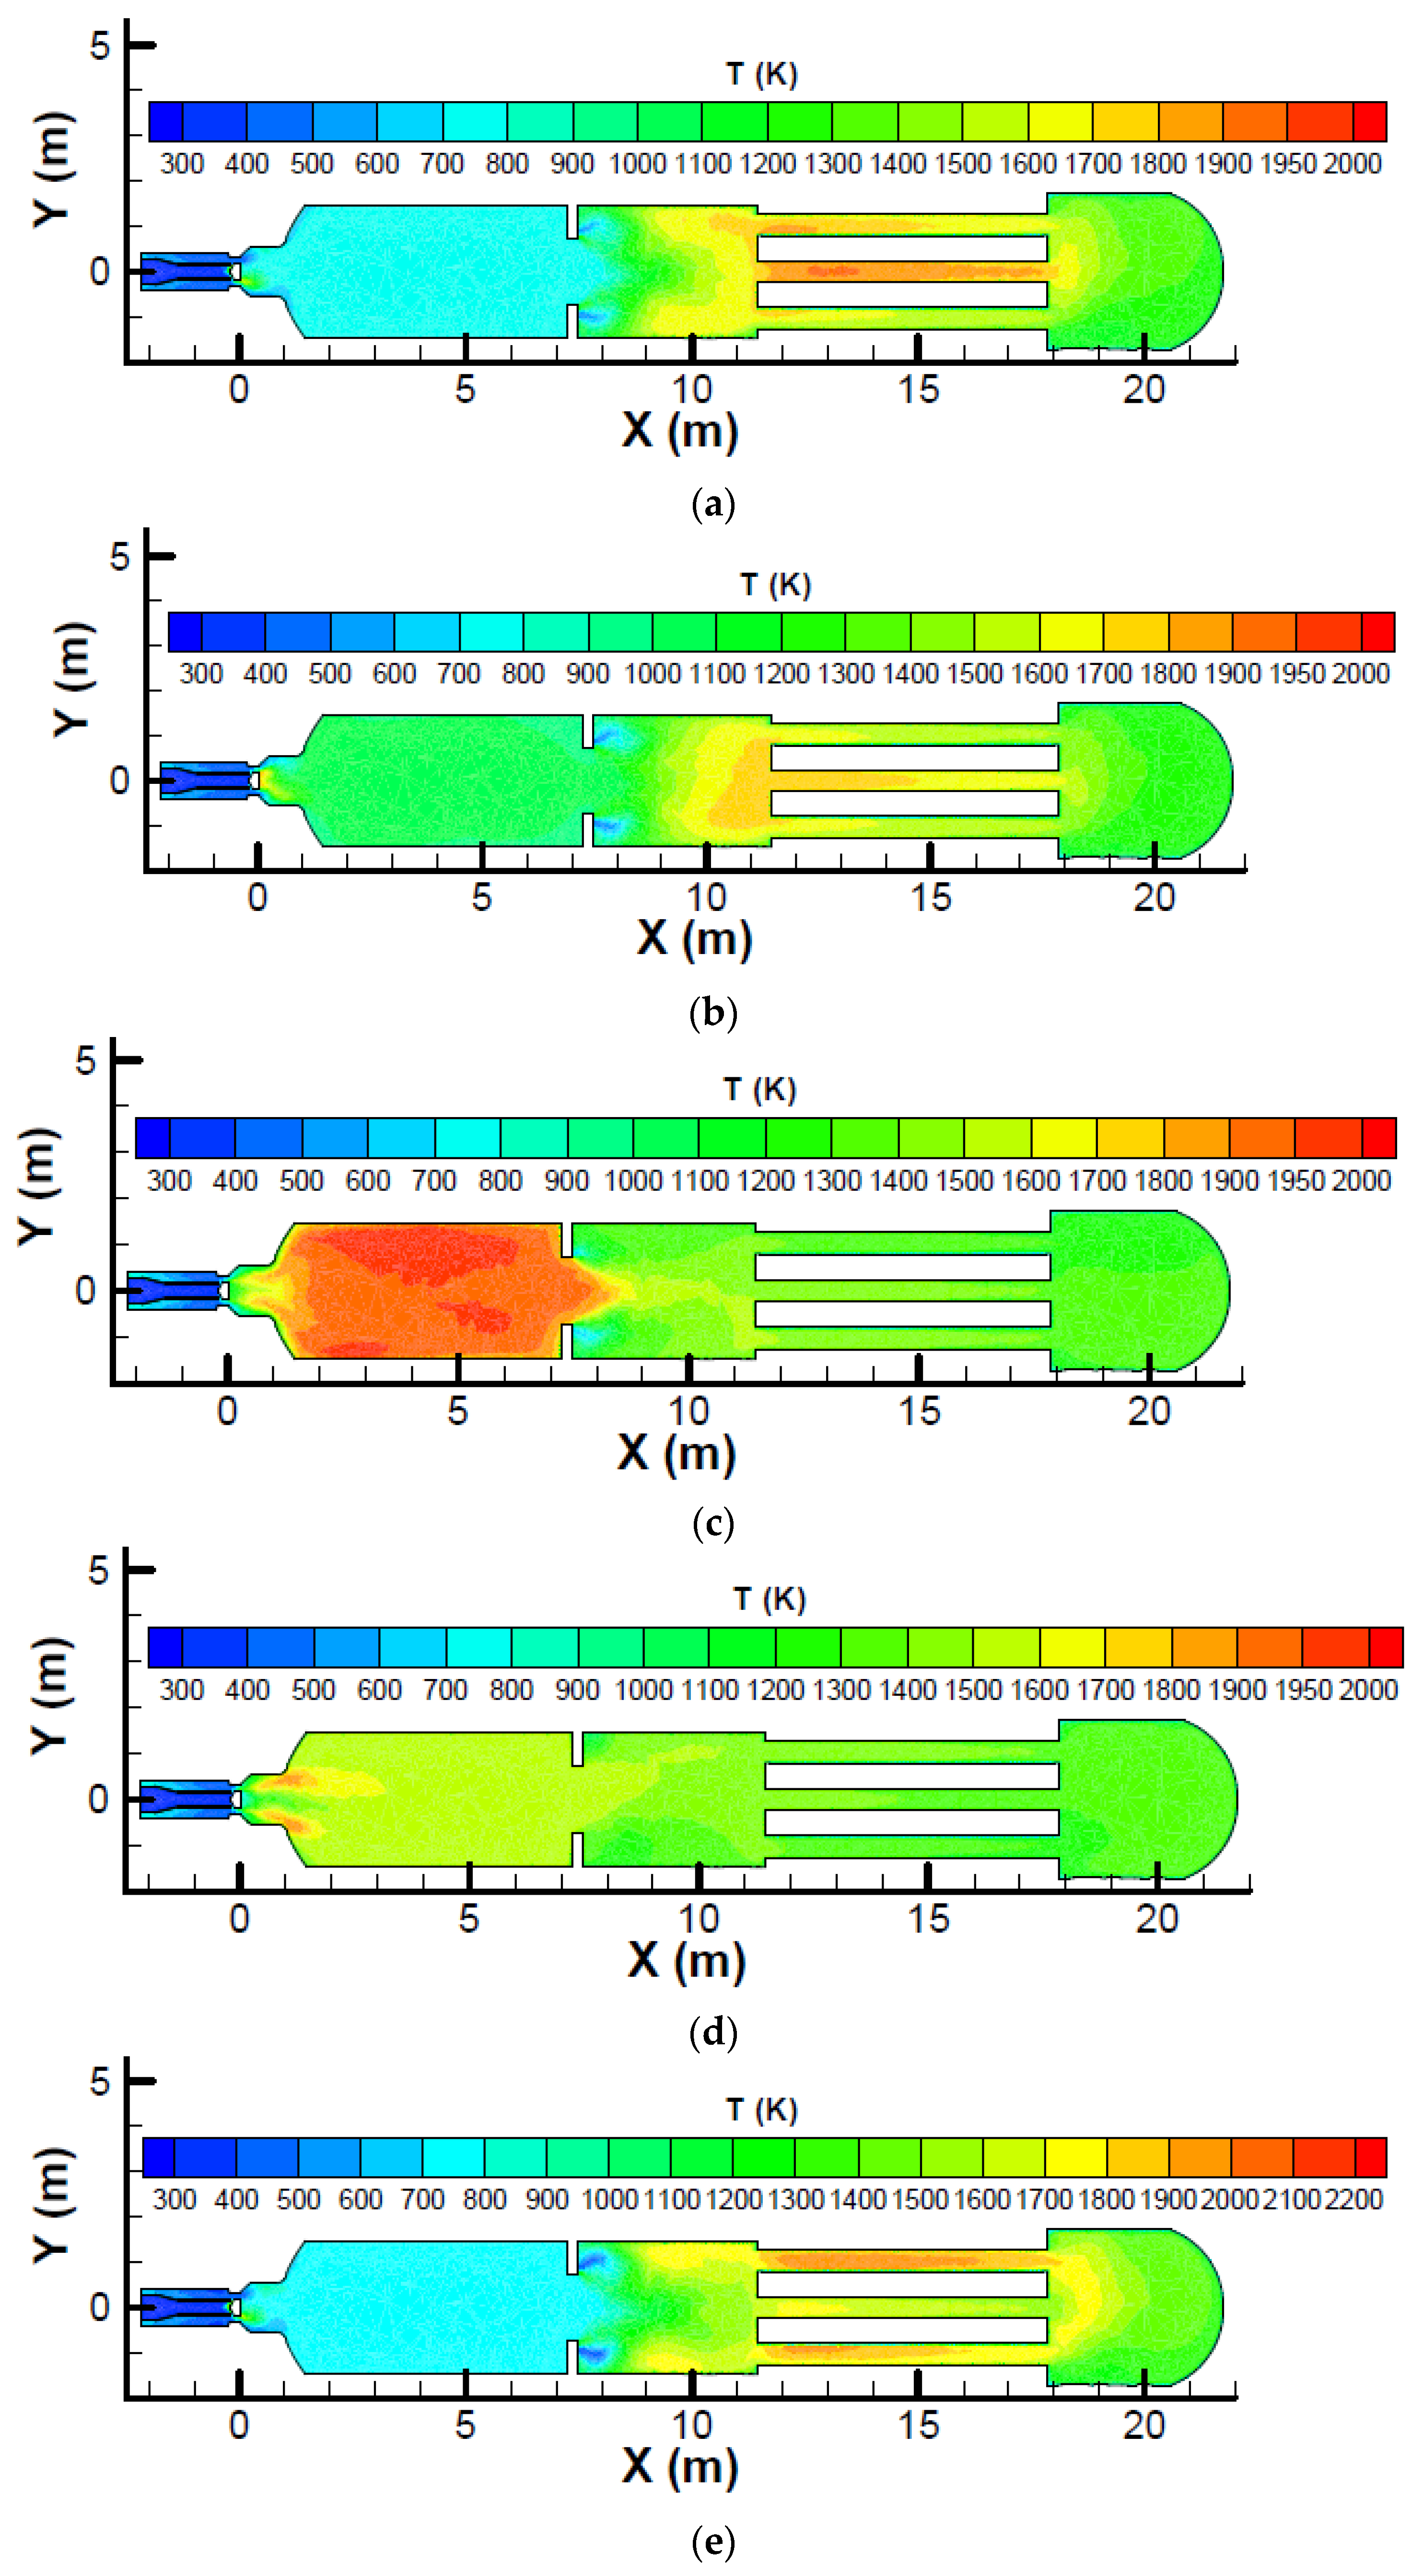
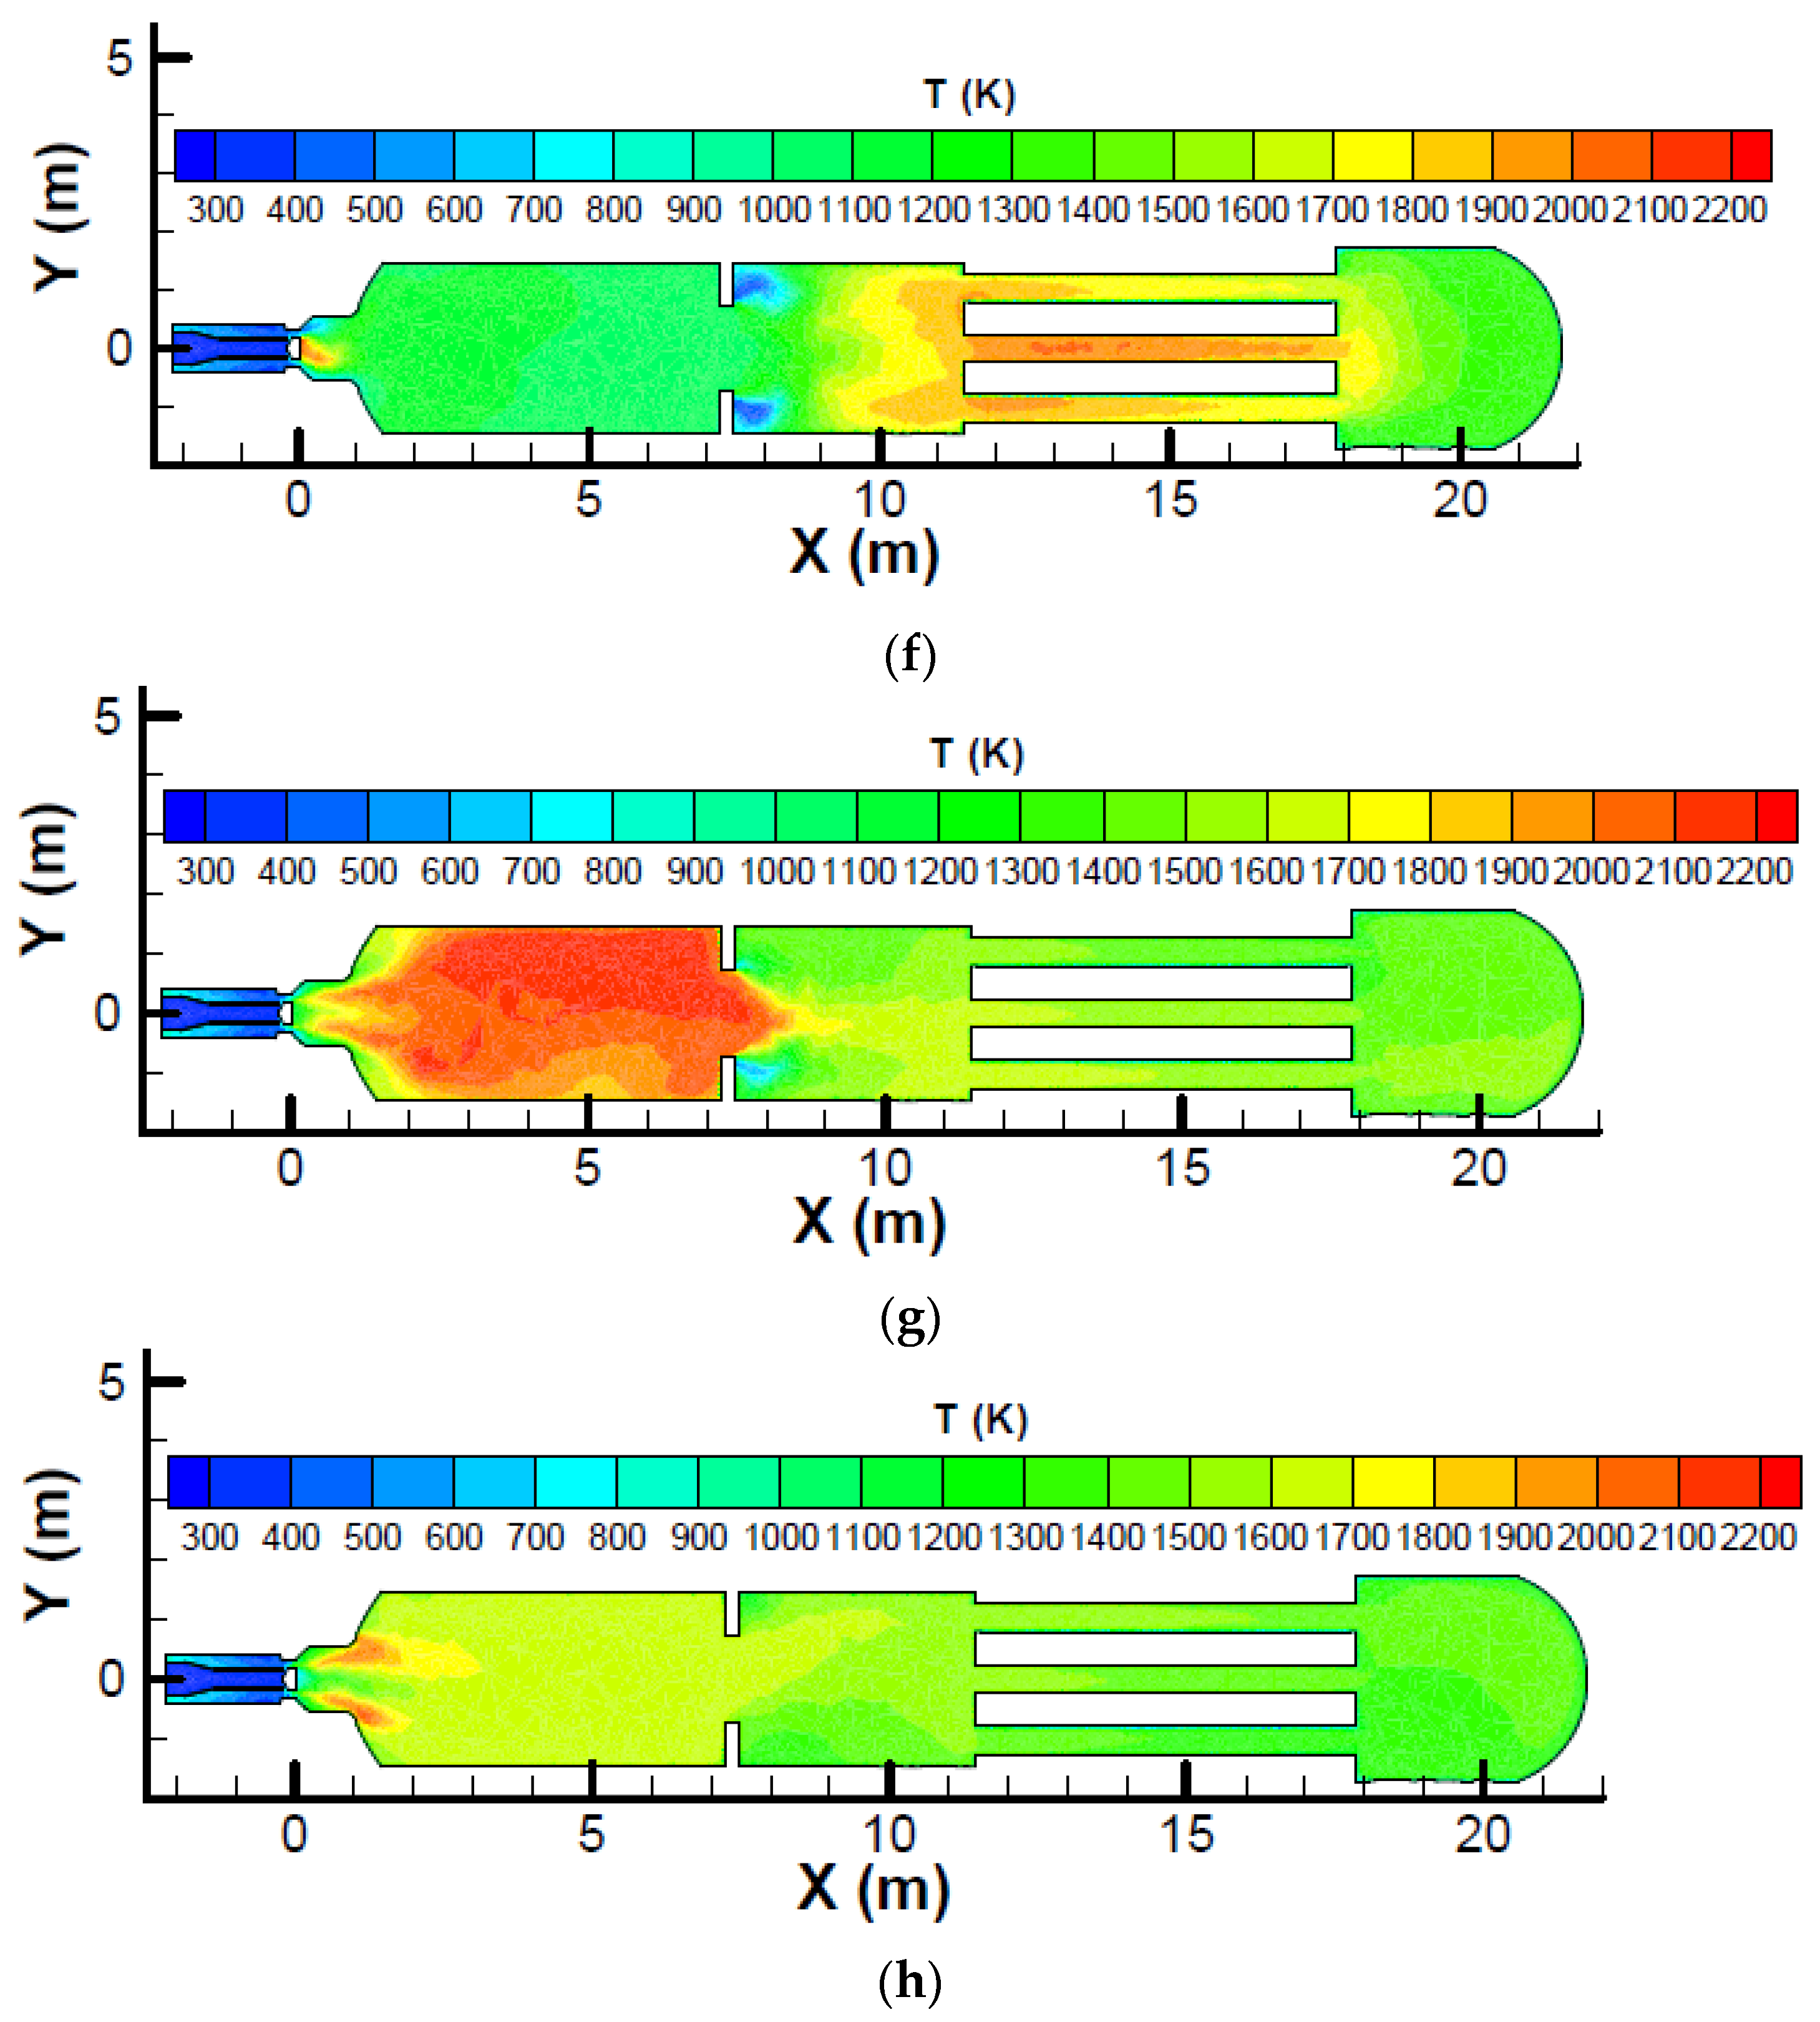
Figure 6 which shows the temperature profile on the symmetric plane for a SRU thermal reactor with different zone 1 fuel mass fractions.
Figure 6 shows that the maximum temperature occurs at the heat exchanger tubes for zone 1 fuel mass fractions of 0.0625 and 0.125. Because the heat exchanger tubes are made of carbon steel, which has a maximum service temperature that is lower than that for the refractory of the thermal reactor, the tubes can be damaged and care must be taken when a low zone 1 fuel mass fraction is used.
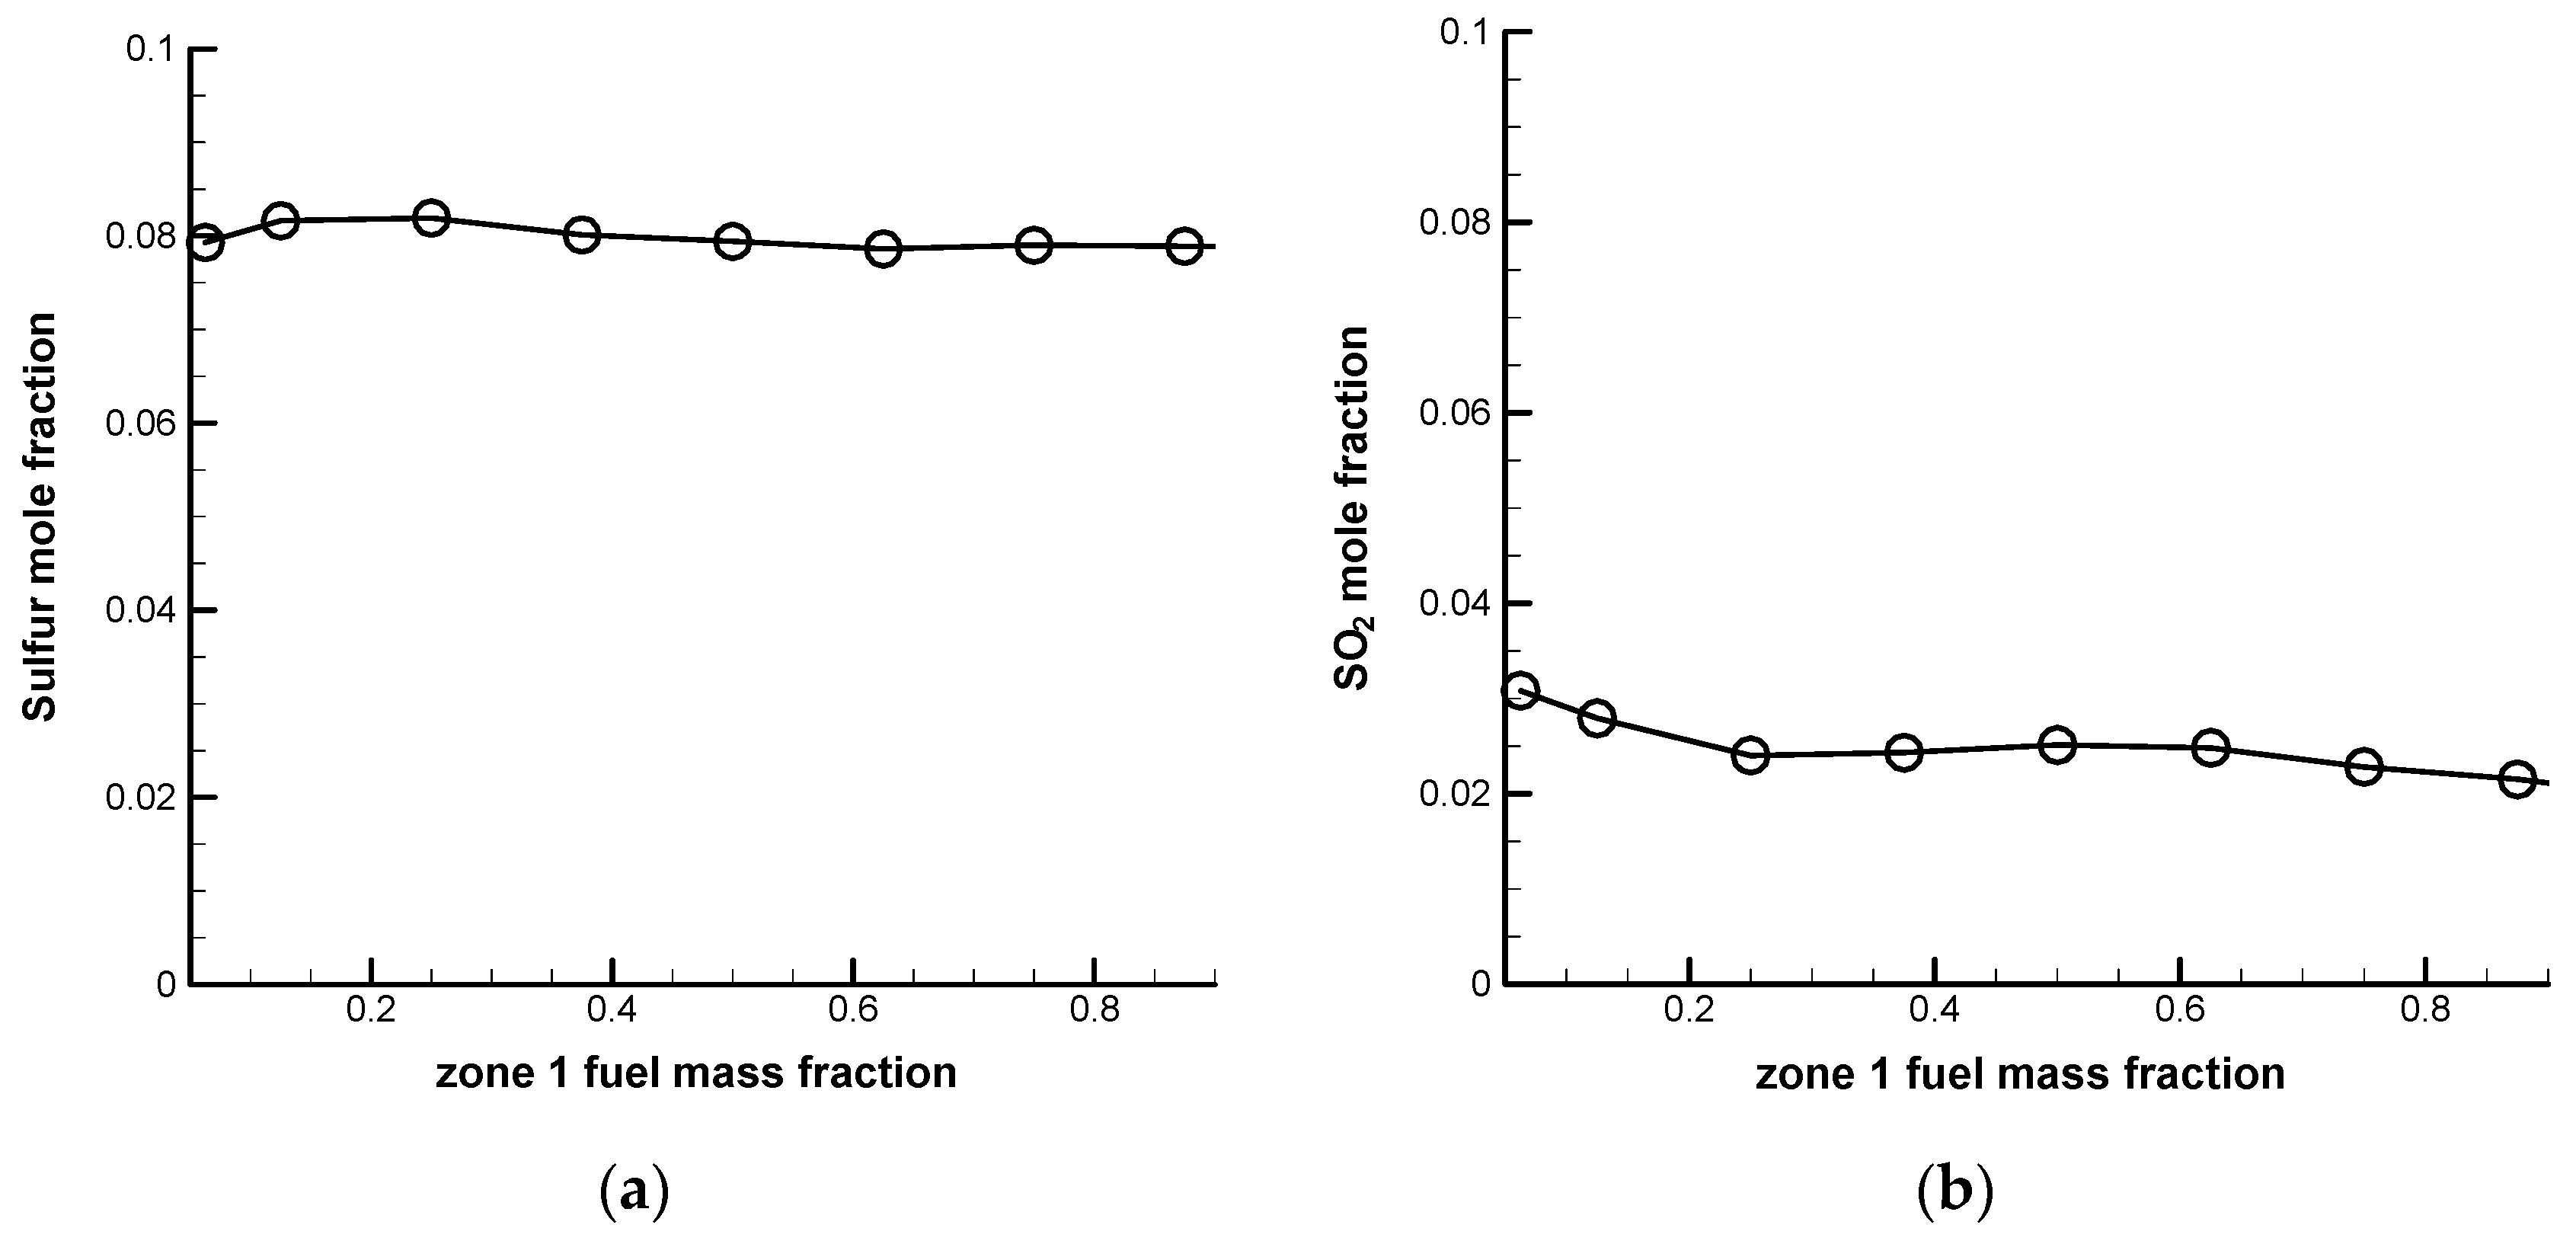
Figure 7 shows a comparison of the sulfur and sulfur dioxide concentrations at the exit for a SRU thermal reactor with different zone 1 fuel mass fractions for an oxygen-normal operation. It is seen that the zone 1 fuel mass fraction has a minor influence on the sulfur and sulfur dioxide concentrations at the exit. The sulfur concentration at the exit is about 0.08. An oxygen-rich operation shows a similar tendency with the sulfur concentration at the exit being around 0.09.
From the above discussion, it is seen that the major influence of the zone 1 fuel mass fraction is on the temperature. The current design conditions listed in
Table 1 allow an acceptable temperature field for an oxygen-normal operation. However, for an oxygen-rich operation, the local maximum temperature exceeds the suggested maximum service temperature, although the average temperature is acceptable. Therefore, the high temperature regions, such as the zone 1 corner, must be inspected very carefully during the annual maintenance period if there are oxygen-rich operations.
4. Conclusions
This paper numerically investigates the effect of the fuel mass fraction on the combustion and fluid flow in a SRU thermal reactor to provide a guideline for adjusting the fuel mass fraction to reduce the temperature inside the thermal reactor and to allow an acceptable sulfur recovery. Practical operating conditions for a petrochemical corporation in Taiwan are used as the design conditions. To determine a suitable fuel mass fraction for operation, a detailed numerical simulation should be performed first to find the stoichiometric fuel mass fraction which produces the most complete combustion and the highest temperature. This stoichiometric fuel mass fraction should be avoided because the high temperature could damage the zone 1 corner or the choke ring. A higher fuel mass fraction (i.e., fuel-rich or air-lean condition) is more suitable because it can avoid deteriorations of both zone 1 and the heat exchanger tubes. Although a lower fuel mass fraction (i.e., fuel-lean or air-rich condition) can avoid deterioration of zone 1, the heat exchanger tubes may be damaged. The present simulation results show that the current design condition is a fuel-rich (or air-lean) condition and allows an acceptable thermal reactor temperature for an oxygen-normal operation. However, for an oxygen-rich operation, the local maximum temperature exceeds the suggested maximum service temperature, although the average temperature is acceptable. The high temperature regions, such as the zone 1 corner, must be inspected very carefully during the annual maintenance period if there are oxygen-rich operations. For lower zone 1 fuel mass fractions such as 0.0625 and 0.125, the average temperature in zone 2 is higher than the average temperature in zone 1, which could cause damage to the downstream heat exchanger tubes. If a low zone 1 fuel mass fraction is used to produce a lower zone 1 temperature, the temperatures in zone 2 and the heat exchanger section must be monitored closely and the zone 2 wall and heat exchanger tubes must be inspected very carefully during the annual maintenance period.


