Article

Temporal Shaping of High Peak Power Pulse Trains from a Burst-Mode Laser System

1
Institute of Optics and Quantum Electronics, Friedrich-Schiller-University Jena, Max-Wien-Platz 1, Jena 07743, Germany
2
Helmholtz Institute Jena, Fröbelstieg 3, Jena 07743, Germany
*
Author to whom correspondence should be addressed.
These authors contributed equally to this work.
Appl. Sci. 2015, 5(4), 1790-1802; https://doi.org/10.3390/app5041790
Submission received: 25 September 2015 / Revised: 21 November 2015 / Accepted: 8 December 2015 / Published: 15 December 2015
(This article belongs to the Special Issue Diode-Pumped, Ultra-Short Pulse Lasers)

Abstract

:
It has been shown in the past that pulsed laser systems operating in the so-called “burst mode” are a beneficial approach to generate high peak power laser pulses at high repetition rates suitable for various applications. So far, most high-energy burst-mode laser systems put great effort into generating a homogeneous energy distribution across the burst duration, e.g., by shaping the pump pulse. In this work, we present a new shaping technique, which is able to produce arbitrary energy distributions within the burst by pre-shaping the seed pulse burst with a Pockels cell. Furthermore, this technique allows for the precompensation of any static modulations across the burst, which may be introduced during the subsequent amplification process. Therefore, a pulse burst with a uniform energy distribution can also be generated. The method is tested with an ultra-short pulse burst mode laser amplifier system producing bursts of a 1 ms duration with a pulse repetition rate of 1 MHz and a maximum output power of 800 W during the burst. Furthermore, a method to predict the influence of the amplifier on a non-uniformly shaped burst is presented and successfully tested to produce a pre-defined pulse shape after amplification.

1. Introduction

The so-called “burst mode” is a special operation scheme for a pulsed laser system. In this mode, the system produces pulses at a relatively high energy and repetition rate, for a short period in time, ranging from some microseconds to several tens of milliseconds. After this so-called “burst”, a time period without laser operation allows for thermal relaxation of the system. During the burst, the laser system approaches the efficiency of a continuously-pumped system, while due to the limited time of operation, the cooling requirements for the components are vastly reduced in comparison to continuously-operated systems with a similar output power. This finally allows one to realize comparably small systems with outstanding performance parameters.
In addition to these advantages, several applications have been developed that specifically use the unique parameters offered by a burst-mode laser. Among these are, for example, the detection of fast processes in combustion diagnostics with methods like particle image velocimetry (PIV), planar laser-induced fluorescence (PLIF) analysis, planar Rayleigh scattering or planar Doppler velocimetry (PDV) [1,2,3,4]. Furthermore, such pulse bursts may be applied in laser ablation [5,6] or in photoinjectors, which are used to create electron pulses in conventional particle accelerators [7].
A crucial point for the usability of such a laser as a tool in science and industry is a well-defined energy distribution between the different pulses within the burst. So far, in most cases, a uniform distribution is desired. Due to the characteristics of the subsequent amplifiers, the generation of such an energy distribution throughout the amplified pulse burst is a demanding task already. There are, e.g., changes in the gain due to various reasons, like unbalanced extraction and excitation or heating of the material. These effects lead to specific burst shapes after amplification, similar to those observed in Ti:sapphire systems [8]. Such an unbalanced extraction can be precompensated by adjusting the initial inversion at the beginning of the burst. An equilibrium value can be obtained, e.g., by fine-tuning the start time of the pump with respect to the arrival of the pulse burst [7,9,10]. Other effects with sufficiently long time constants, like the heating of the active medium, can be partly counteracted by, e.g., a temporal modulation of the excitation.
Though the application of these techniques has already allowed for the generation of very stable bursts, they do not allow for the generation of bursts with an arbitrary energy distribution. Such a possibility could further broaden the range of applications. For example, it has been demonstrated in materials processing that the diameters and deformations of laser-drilled holes could be reduced by applying temporally-modulated pulse bursts [11].
Here, we present a method using a Pockels cell with fixed peak voltage and rise time for shaping the bursts. Since the laser pulse duration can be considered to be very short as compared to the Pockels cell’s switching time, temporally shifting the laser pulse across the rising edge modulates its polarization. Hence, in combination with a polarizing optic, the transmitted pulse energy can be varied arbitrarily. This allows one to generate bursts with a freely adjustable energy distribution and, additionally, to pre-compensate any amplitude modulations introduced by the following amplifiers.
A similar technique to shape femtosecond laser pulse bursts after amplification, but within a passive cavity, has recently been published [12]. There, the disadvantage is that the splitting of the pulses occurs only after amplification. Shaping at this point of the amplifier chain implies that a single short pulse is to be amplified in advance. As the acceptable fluence within the amplifier is significantly lower for a single pulse than for a burst, this reduces the amplifier efficiency, particularly for materials with a high saturation fluence, such as Yb:CaF 2 . Therefore, in our case, the shaping of the bursts is realized just after the seed laser system at the lowest accessible pulse energy (see Figure 1).
Figure 1. Basic layout of the laser system.
Applsci 05 01790 g001
The modulated bursts are then amplified by a cryogenically-cooled Yb:CaF 2 -based laser amplifier (see [9,13] for the details of the system) to an average output power of up to 800 W during the burst. The changes of the burst envelope introduced due to the amplification characteristics, especially for bursts with a non-uniform envelope, will be analyzed. Finally, a theoretical approach to estimate the appropriate initial burst envelope for a targeted output envelope is developed and tested with the amplifier system.

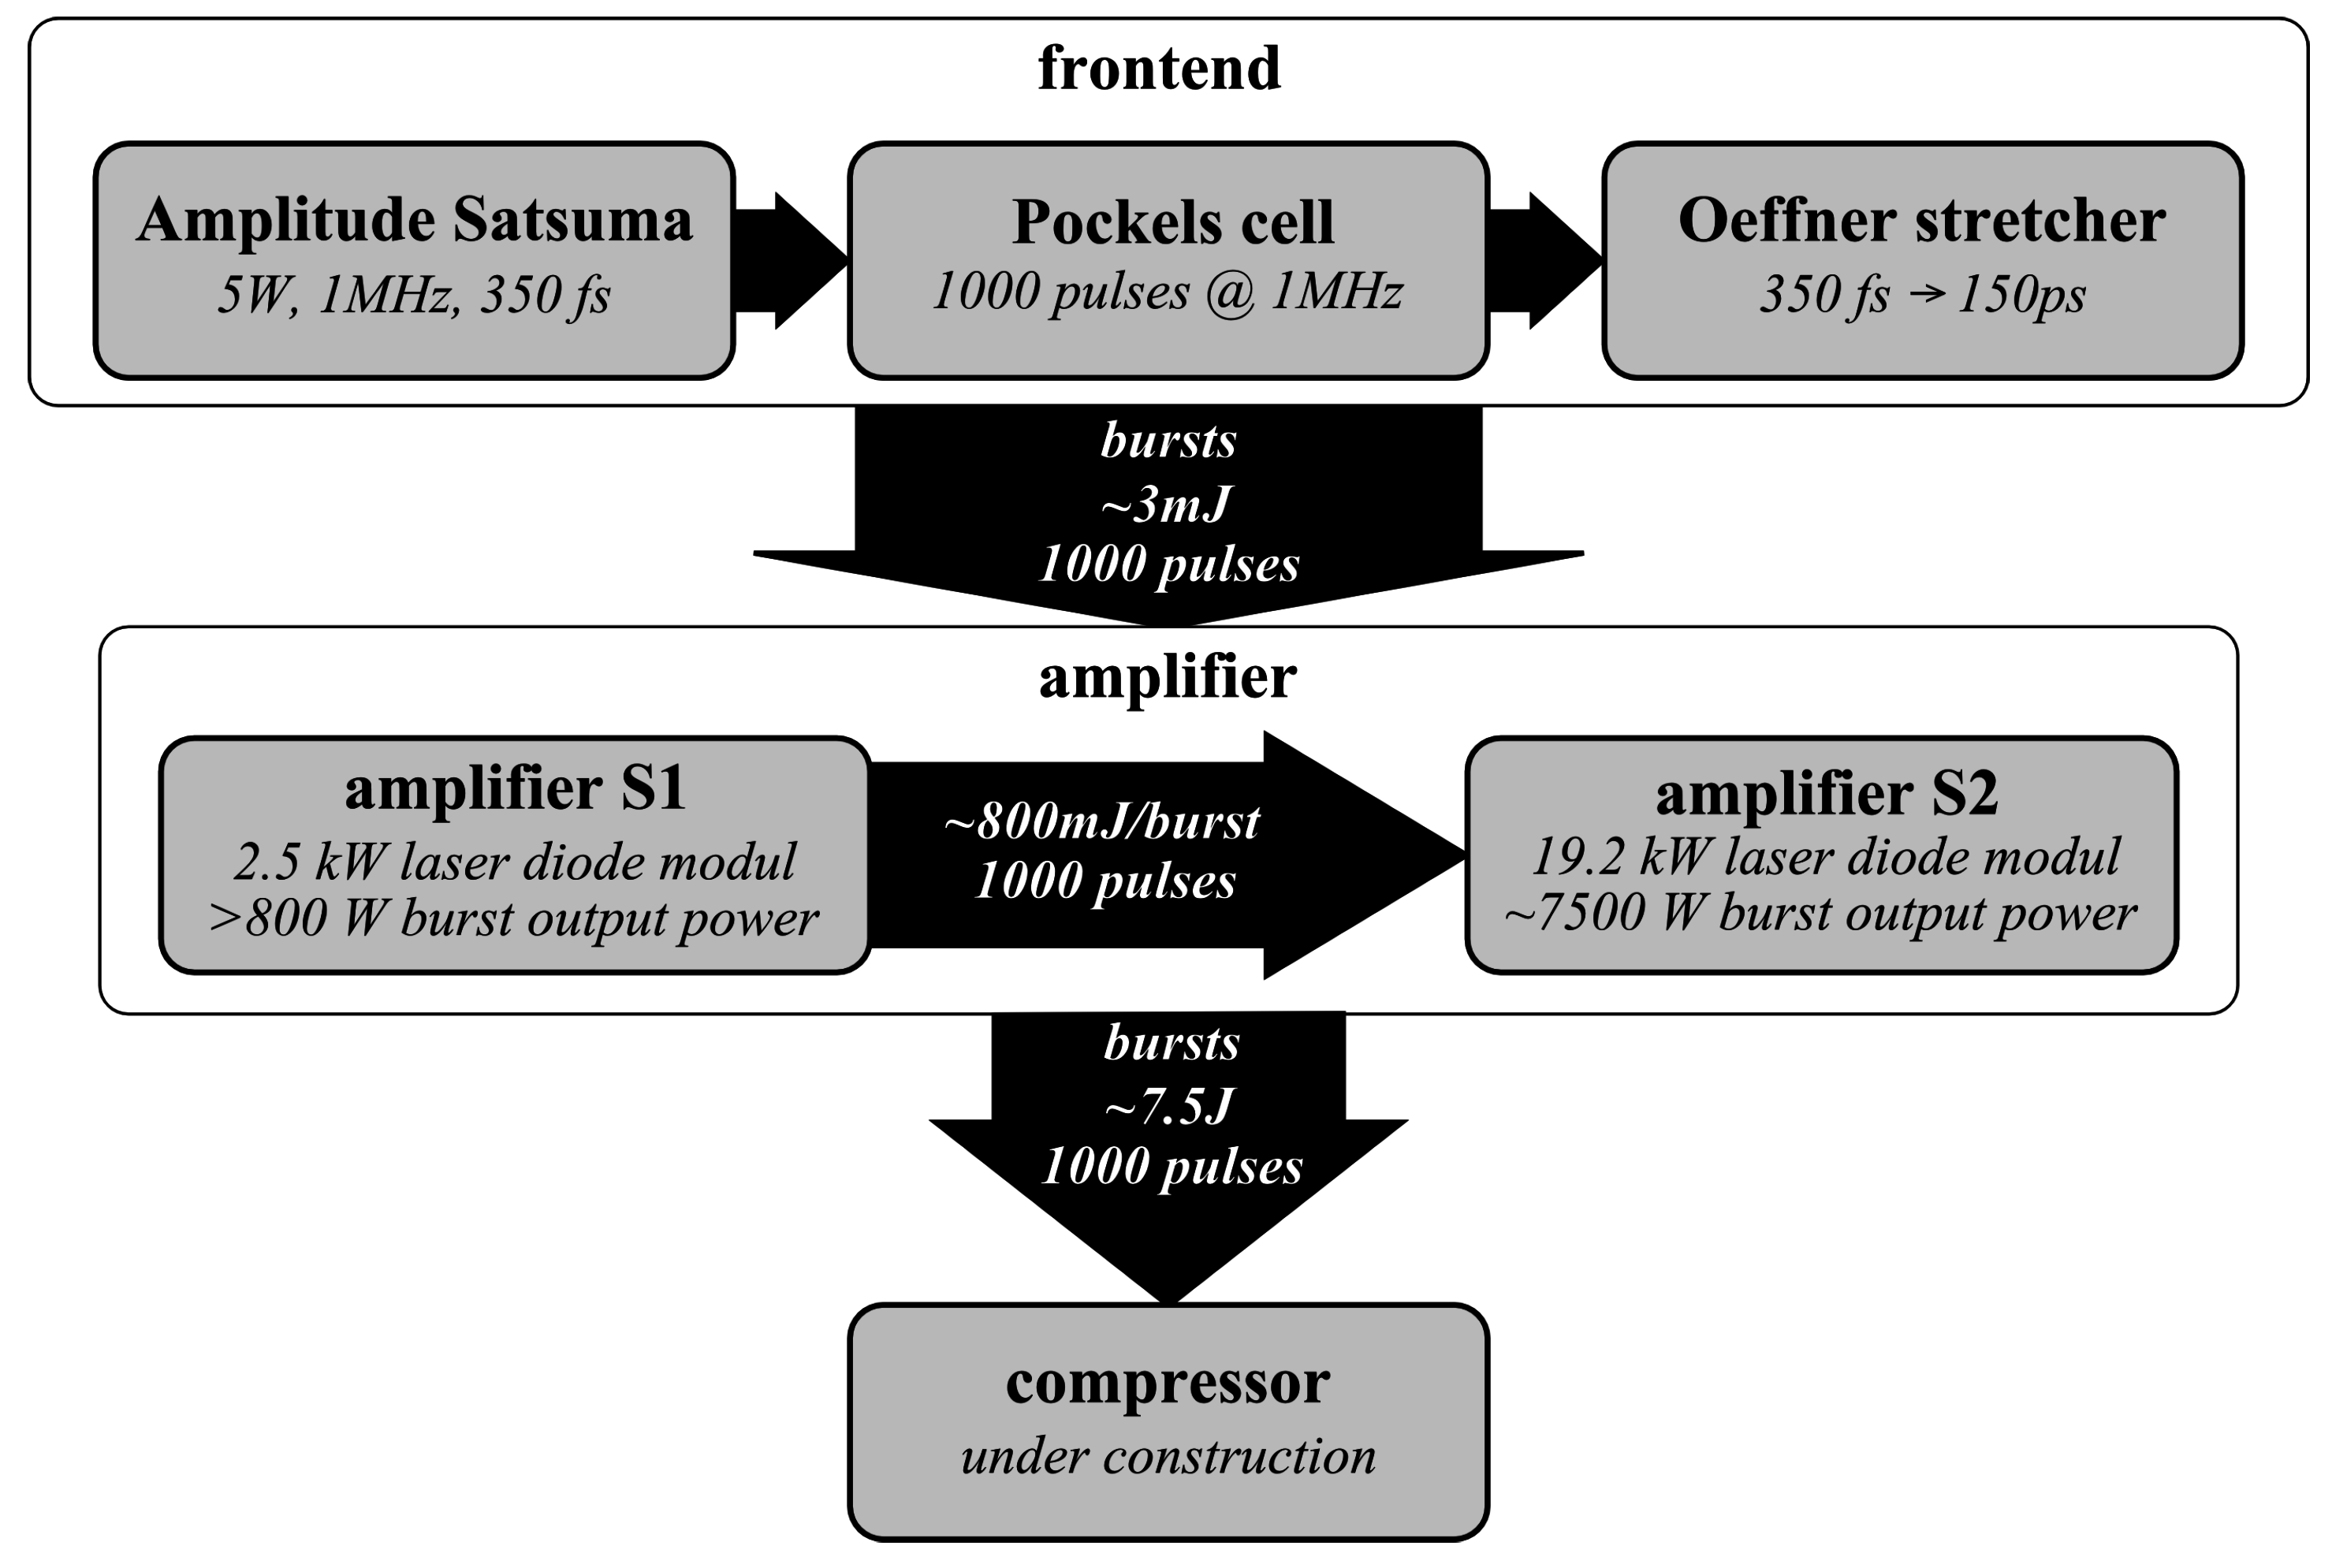
2. Experimental Setup

The shaping technique presented in this work is based on the fact that a Pockels cell cannot be switched on instantaneously. In contrast, during the switching time t, the voltage U ( t ) at the cell increases exponentially, following the charging curve of a capacitor:
U ( t ) = U 0 · 1 - e - t τ
Here, τ is the time constant defined by the capacity and Ohmic resistivity of the Pockels cell and its driver. As the phase shift between orthogonally-polarized waves Δ Φ introduced by the Pockels cell is proportional to U, it follows the same behavior. If we further assume that the total phase shift shall be λ 2 after the Pockels cell is fully switched on, the temporally-dependent transmission T ( t ) of the Pockels cell located between crossed polarizers can be written as:
T ( t ) = sin 2 C 0 · 1 - e - t τ
where C 0 is a constant. This holds accordingly for the falling edge of the Pockels cell switch.
Such a rising edge of a KD*P Pockels cell switch (cell: Leysop Ltd., Basildon, UK; driver electronics: Bergmann Messgeräte Entwicklung KG, Murnau, Germany) as it is used in our laser is displayed in Figure 2. The temporal resolution was achieved by sampling with pulses of our Satsuma laser system (Amplitude Systèmes, Pessac, France) in delay steps of 100 ps, while the transmission at each point was determined as an average value. The curve was fitted using Equation (2). The 10%–90% rise time was determined to be 7.4 ns. The falling edge, despite not displayed here, was characterized accordingly, resulting in a fall time of 6.1 ns. Using the inverse fitting function, we can directly calculate the necessary delay to achieve a particular transmission of the switch.
In the following, we will use the rising edge of the Pockels cell to shape bursts from a continuous pulse train coming from our front-end. Adjusting the time for the individual triggers allows one to achieve a predefined energy of a single pulse as indicated by the green spikes in Figure 2. Here, the rising edge was chosen over the falling edge, since the slower rise ensures a better resolution.
The measurements described below were carried out using the high peak power burst laser system, which is described in detail in [9,13,14,15]. An overview of the system is shown in Figure 1. For the sake of simplicity, the system was only used up to the amplifier stage S1 (see Figure 1) in this work, producing a spatially rectangular flat-top beam with up to 800 W average power during the burst.
Figure 2. Transmission versus time for the rising edge of the Pockels cell.
Applsci 05 01790 g002
The chirped pulse amplification (CPA) system was designed for the generation and amplification of bursts consisting of up to 1000 pulses, each having a duration of sub-500 fs. The temporal spacing between the pulses is 1 μs, given by the repetition rate of the seed laser used. The pump laser diodes of the amplifiers are driven at constant current during the burst. An additional pre-pump time before the burst is set to establish the appropriate initial inversion in the laser medium. The burst to burst repetition rate of the amplifier is limited to 10 Hz due to thermal issues.
The modulation of the pulse amplitudes was achieved using a Pockels cell following the patent pending technique described in [16]. In the meantime, this scheme was also used by another group for shaping femtosecond laser pulse bursts using a BBO Pockels cell inside a passive cavity [12]. In our case, the application of the so-called alternating voltage mode, as described in the following, allowed us to use a simple KD*P cell at a repetition rate of 1 MHz. KD*P Pockels cells exhibit a larger piezo-optic effect than BBO, which otherwise limits their use at high repetition rates.
The Pockels cell assembly for the generation of the shaped bursts is implemented directly behind the Satsuma seed laser system, just before the stretcher. At this point, the single-pulse duration is about 350 fs. This ensures that there is no significant impact on the single pulse duration by the Pockels cell switch, even if it is operated at the rising edge, as described before.
The shaping assembly consists of a double KD*P Pockels cell (Leysop Ltd., Basildon, UK) followed by a polarizer. The input polarization is aligned, such that initial transmission is low and pulses can pass only if the voltage is applied. During the burst duration, every single pulse is switched separately.
The Pockels cell driver (Bergmann Messgeräte Entwicklung KG, Murnau, Germany) uses a push-pull configuration to allow for short opening times, which minimizes the energy dissipation at the 1 MHz repetition rate phase.
Temporal control of the Pockels cell is realized with a delay generator card (BME_SG08p, Bergmann Messgeräte Entwicklung KG, Murnau, Germany) synchronized to the internal fs-oscillator of the seed laser using the signal of an internal photo diode. The on-board memory of this delay generator allows one to store 251 delay settings for each channel. For every trigger event, the next delay is applied, allowing one to use different delays for the individual pulses. To achieve a total of one thousand different delays, according to the number of pulses within a single pulse, four of the six output channels are bundled via a trigger combination circuitry, which also ensures a constant delay of 30 ns between the on and off switch of the cell. These on/off trigger events are finally distributed to the trigger inputs of the two push-pull high voltage switches of the Pockels cell driver to achieve an alternating polarity of the voltage at the Pockels cell for consecutive pulses. This is achieved by a so-called splitter box (Bergmann Messgeräte Entwicklung KG, Murnau, Germany). This alternating voltage polarity mode is an essential measure to avoid piezoelectric ringing of the cell, which could otherwise disturb the precise control of the laser pulse amplitude, due to fluctuations in the polarization of the laser pulse after passing the cell.
All measurements presented in the following were carried out using two photo diodes DET100A (Thorlabs GmbH, Munich, Germany), one measuring light leaking through a plane mirror before the Pockels cell and one after the shaping section. The results are based on the relative height of both signals with respect to each other to compensate for pulse-to-pulse variations of the energy of the seed laser. A direct measurement was not possible, since the pulse-to-pulse energy fluctuations were comparably large (about ± 30 % ). Despite this measure, not all instabilities could be removed, as the energy instability of our front-end laser had also some influence on the temporal synchronization, which can be seen as a high frequency oscillation of the measured amplitudes. The reason for this is the voltage level of the photo diode used for synchronization. A fluctuation in the pulse energy in the oscillator therefore transfers into a jitter, since the level is reached at different times. For a better visibility of the shaping effect, this noise was removed in the following by applying a band stop filter to the data. The unfiltered data points are also displayed as light grey curves in the background.

3. Results and Discussion

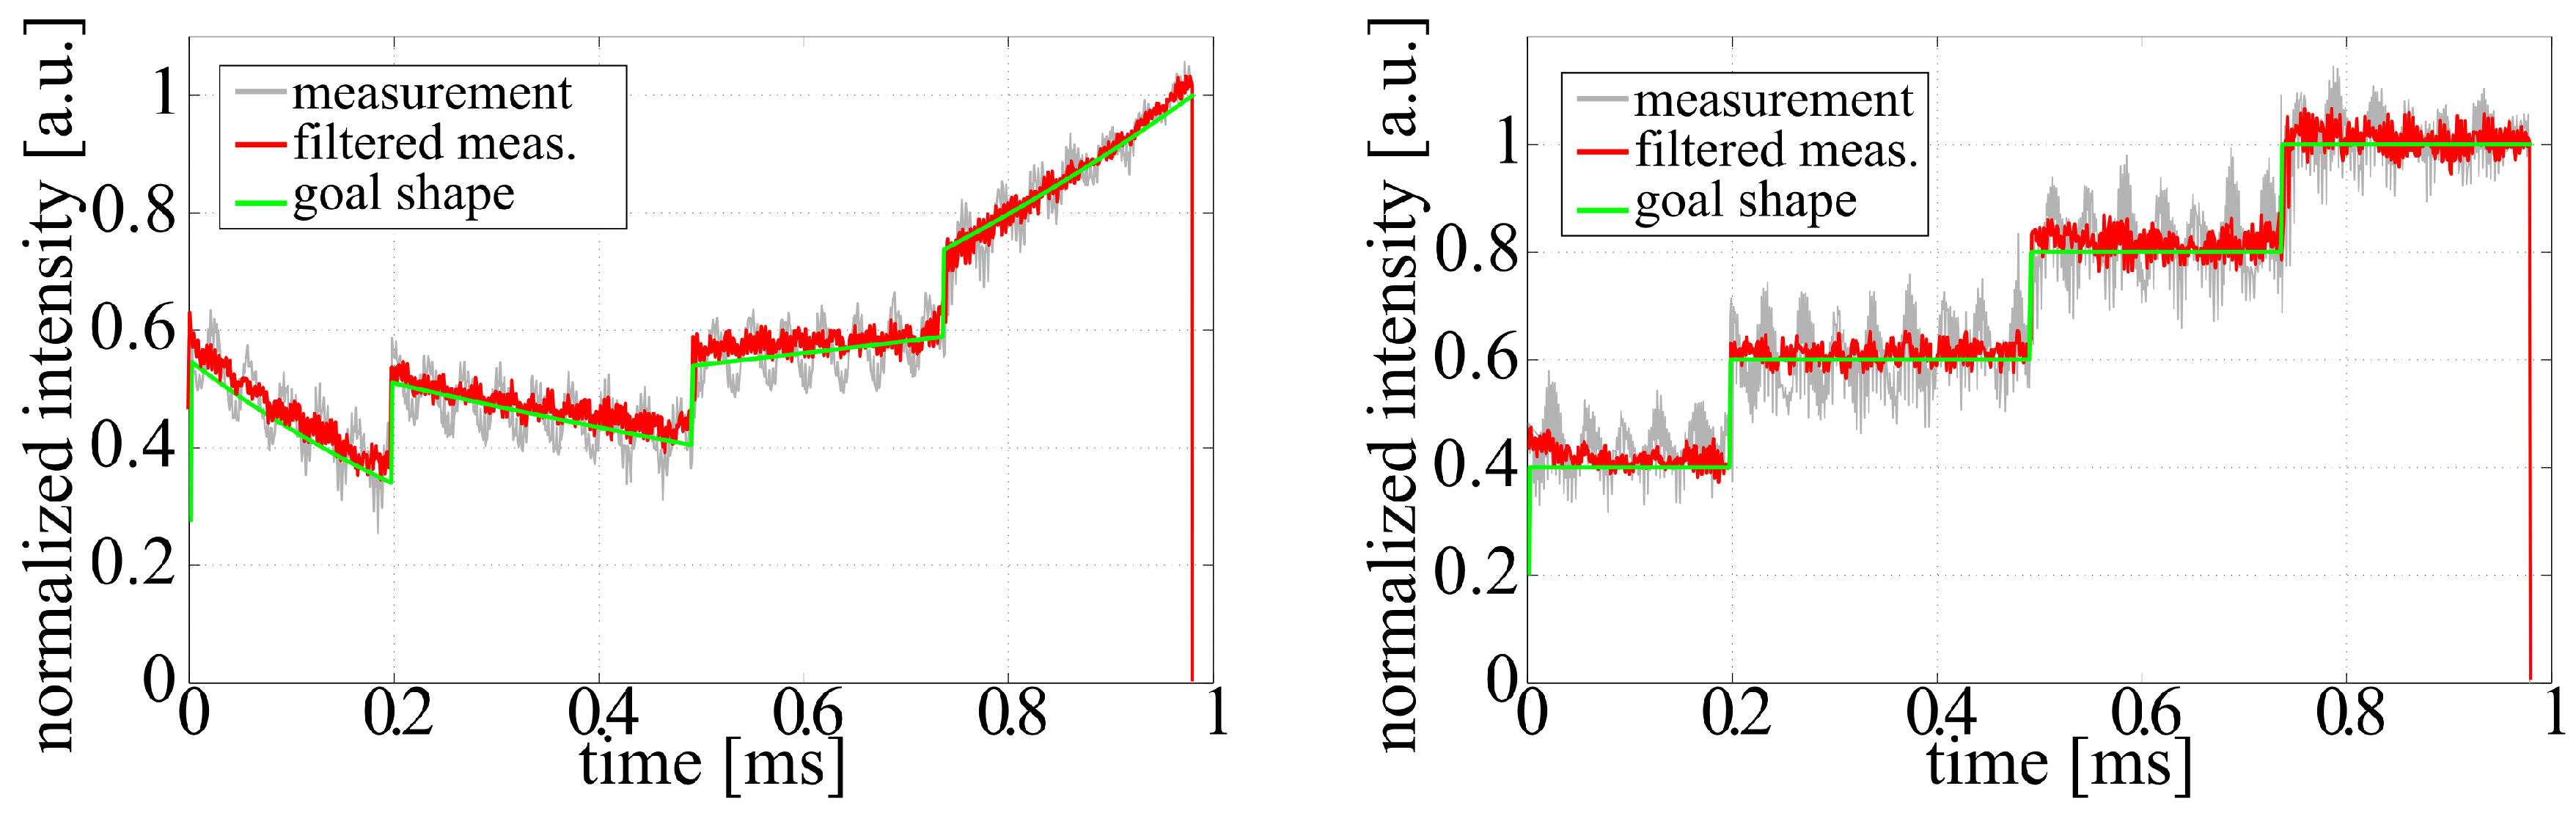
3.1. Shaping of Bursts

Based on the technique described above, we have shaped several temporal envelopes of bursts containing 1000 individual pulses at a repetition rate of about 1 MHz. Two examples are shown in Figure 3. Essentially, we achieved a good agreement between the targeted shape and the measurement. Only for pulse energies of less than 5% of the maximum amplitude, the accuracy has dropped. This can partly be attributed to the accuracy of our cross-referenced measurement scheme, when pulses are hidden in the noise originating from the photo diodes used for measurement.
Figure 3. (Left) Gaussian-shaped burst envelope; (right) house-shaped burst envelope.
Applsci 05 01790 g003
Besides the oscillatory noise, which was discussed before, the residual high frequency noise deviating from the goal function originates from a random jitter in the triggering system. The standard deviation of this random jitter is around 100 ps. This can in principle be improved by using a better synchronization and a Pockels cell driver with a longer rise time.

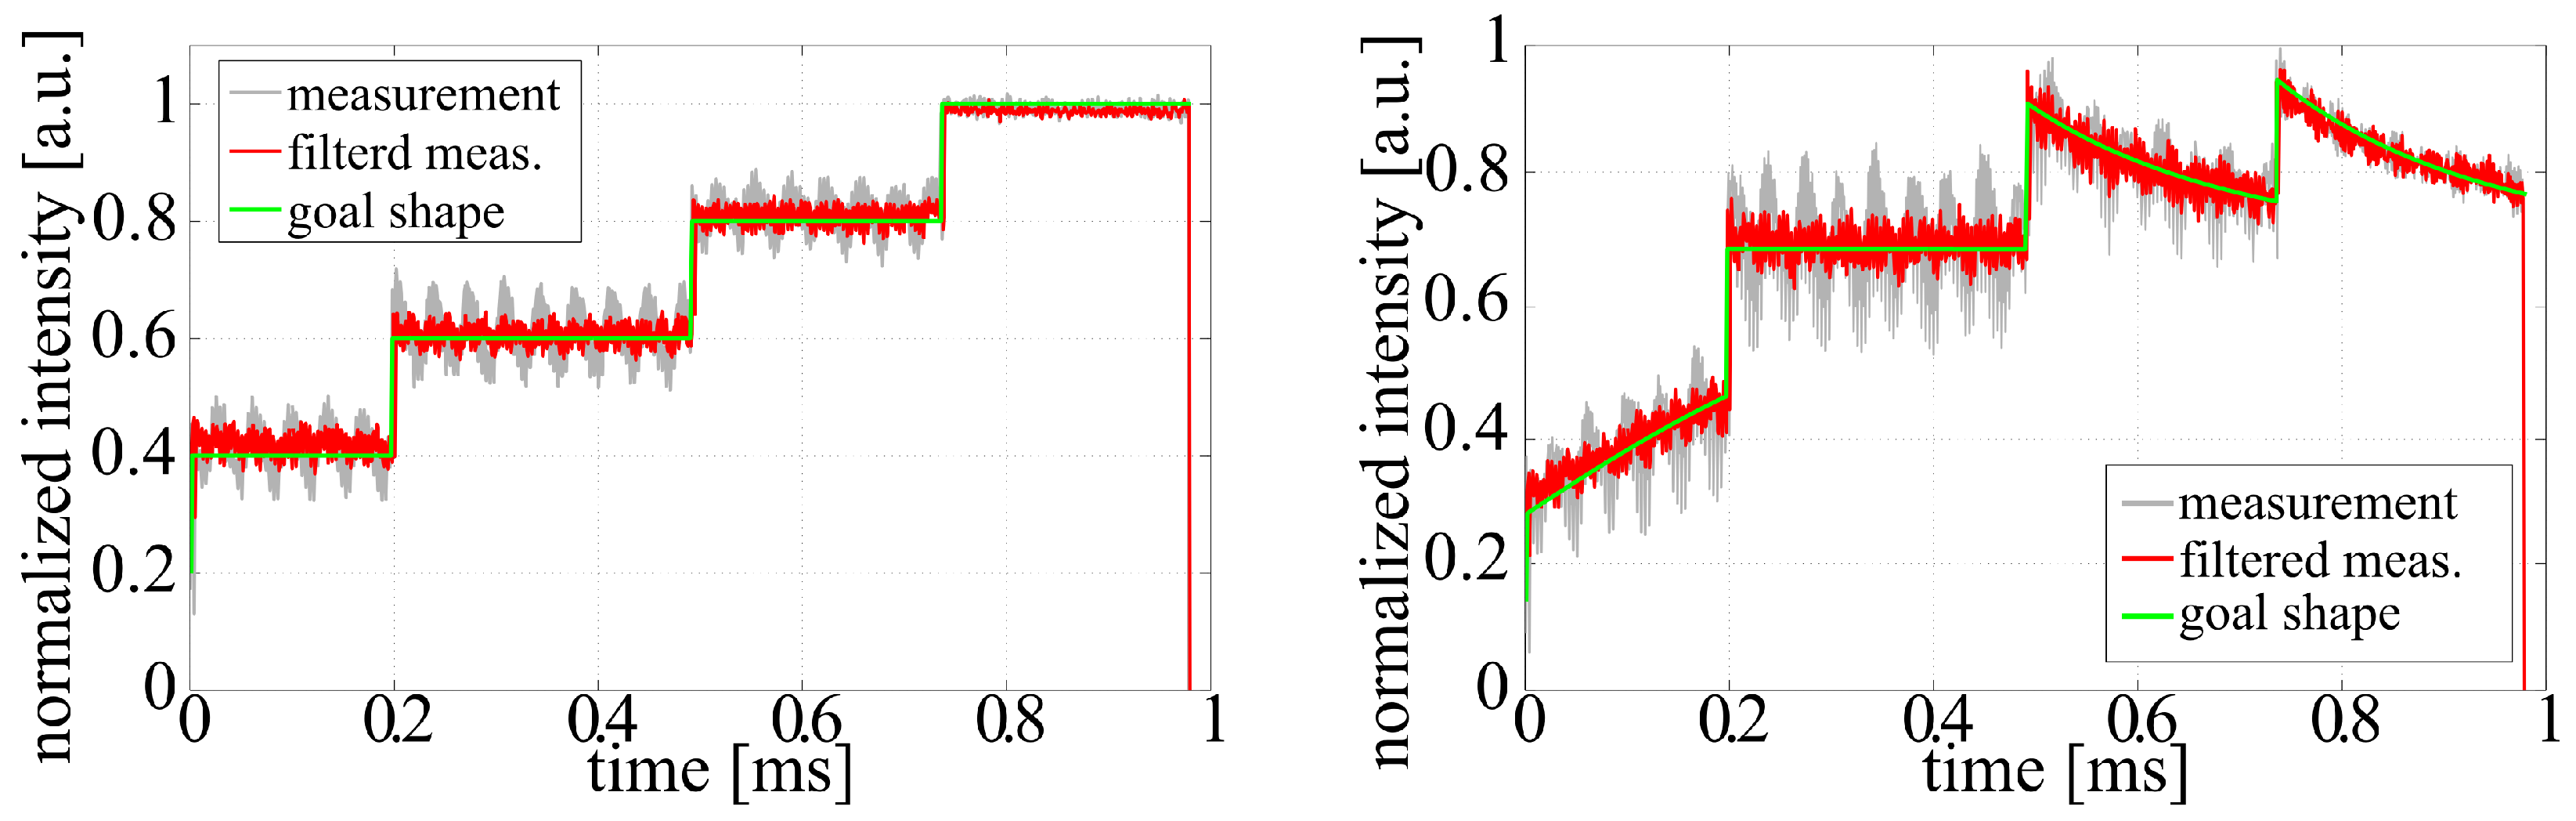
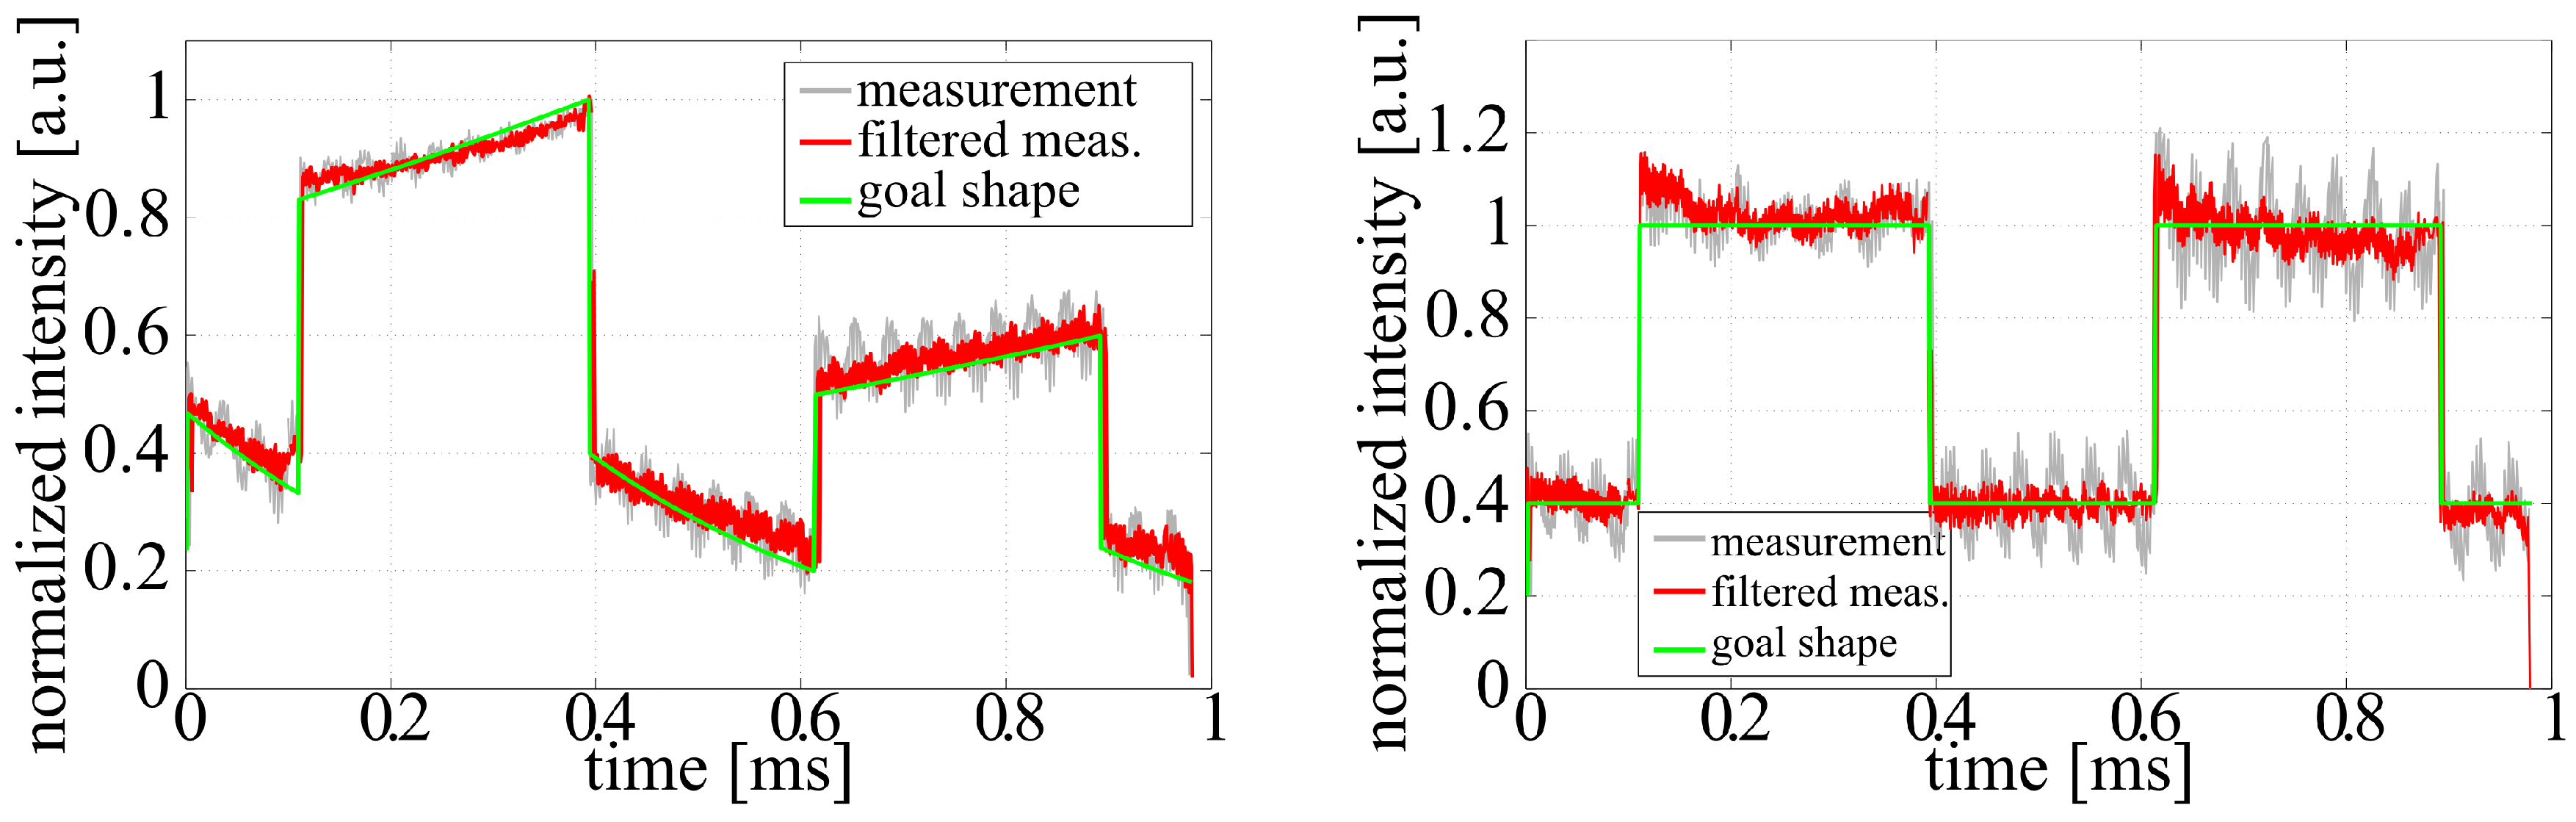
3.2. Amplification of Shaped Bursts

To generate shaped pulse bursts at a high power, the influence of the amplification process has to be taken into account. In an idealized burst amplifier, which produces bursts with a uniform temporal energy distribution, an equilibrium excitation has to be maintained by balancing the excitation of the active medium by the optical pump and the de-excitation by the laser extraction and spontaneous emission during the full duration of the burst. Taking into account a longitudinally-pumped amplifier, this balance can be expressed following the considerations given in [10]:
d n ( t ) d t = P pump - n ( t ) τ f - I out ( t ) - I in h ν
Here, n ( t ) is the volume density of the excited ions integrated over the crystal length, P pump is the excitation rate density integrated over the crystal length, τ f is the fluorescence lifetime and I out and I in are the output and input intensities of the amplifier, respectively. ν is the frequency of the extracted laser radiation, and h is Planck’s constant.
In the following, we will assume that the change of n in the amplification medium is small. This implies that P pump can be considered to be constant (for a constant pump power), as the pump absorption does not undergo significant changes. As the extracted laser intensity I out increases with increasing n, a particular n allows one to balance Equation (3) according to P pump to give d n d t = 0 . The quantities required for this equilibrium case will be noted as n eq and I out/eq . If the initial density of the excited ions n 0 is equal to n eq , the temporal energy distribution of the amplified burst will be homogeneous, as long as the input has a homogeneous energy distribution. In this case, Equation (3) becomes:
0 = P pump - n eq τ f - I out/eq - I in h ν
This mode of operation can be achieved in practice, e.g., by adjusting the pump duration prior to the arrival of the burst or by a temporal modulation of the pump pulse, as demonstrated in [9,10].
Using a pre-shaped burst as the seed for the amplifier, the input shape will no longer be constant. According to Equation (3), this means that the inversion and, hereby, the gain will no longer be constant throughout the burst. A lower I in at the beginning of the burst will lead to lower I out , increasing n and, finally, increasing the gain over time. In contrast, a higher I in will lead to a higher I out , decreasing n and decreasing the gain.
In Figure 4 and Figure 5, the input and output energy distributions for a step-shaped burst and a burst with an alternating level are shown, demonstrating this effect. For these measurements, the amplifier’s initial inversion was adjusted to produce a uniform energy distribution at an input seed level of 100% by adjusting the pump duration prior to the burst.
Figure 4. (Left) Stair-shaped input pulse train; (right) resulting output pulse train after amplification.
Applsci 05 01790 g004
Figure 5. (Left) Input pulse train with alternating amplitude; (right) resulting output pulse train after amplification.
Applsci 05 01790 g005
It can be seen from Figure 4 that at the beginning of the pulse, I in is too low, resulting in an increase of the gain and n over time, accordingly. Reaching the second step of the input signal, n has increased sufficiently to balance the output for about 60% of the maximum I in . In the final steps, however, the input is too high, leading to an extraction that is too high, which reduces the gain and n over time in the following. A similar behavior is seen in Figure 5. Here, one observes an oscillation between too much and too little extraction.
To compensate for the disturbances of the temporal burst shape, a mathematical model is required that describes the observed changes. For this purpose, we followed the calculation by Will et al. [10] and adapted it for our system.
To obtain a linear differential equation, we introduce the deviation of the actual excitation density from the equilibrium value using Δ n ( t ) = n ( t ) - n eq . Combining Equations (3) and (4) and using the small signal gain for a multi-pass amplifier leads to:
I out = I in · e m σ n .
Here, m is the number of passes through the active medium and σ is the emission cross-section of the laser medium. Furthermore, one finds:
d Δ n ( t ) d t = - Δ n ( t ) τ f - I in h ν · e m σ n eq · e m σ Δ n ( t ) - 1 .
Using the approximation e m σ Δ n ( t ) 1 + m σ Δ n ( t ) for small deviations of n ( t ) from n eq , the resulting differential equation:
d Δ n ( t ) d t = - Δ n ( t ) · 1 τ f + m I in σ h ν · e m σ n eq
can be solved by an exponential approach:
Δ n ( t ) = Δ n ( t = 0 ) · e - t τ eff
Here, τ eff is the characteristic time constant, defining the exponential approach of n ( t ) towards n eq . Defining the steady-state output intensity I out/eq = I in · exp ( m σ n eq ) and the saturation intensity I sat = h ν / ( σ τ f ) , τ eff can be calculated by:
τ eff = τ f 1 + m · I out/eq I sat
For our system operating in a 20-pass configuration, I out/eq was found to approximately vary between 7.5 kW/cm 2 and 9 kW/cm 2 for an input ranging from 20% to 100% of the available seed power. The values for I out/eq were retrieved from measurements of the the output power for bursts with a uniform energy distribution at different seed levels in combination with the beam area (for details, see [15]). The comparably small variation of I out/eq can be explained by the fact that the equilibrium output power in a burst mode amplifier is mainly influenced by the available pump power, while the gain can be widely tuned by only minor variations of n. I sat is calculated to be 21.6 kW/cm 2 (based on spectroscopic data from [17] at 100 K). This results in a range from 239 μs to 204 μs for τ eff depending on I in , as shown in Figure 6.
Using Equations (5) and (8), the gain coefficient g = log I out / I in can be calculated as:
g ( t ) = m σ n eq + m σ Δ n ( t = 0 ) · e - t τ eff
Therefore, an initial mismatch between I in and the initial excitation density will decay exponentially with the time constant τ eff .
Figure 6. Theoretical change of τ eff and m σ Δ n .
Applsci 05 01790 g006
A second important parameter required to determine the output burst shape is m σ Δ n ( t = 0 ) as a function of I in . We use Equation (5) for calculating the gain factor g 1 under equilibrium conditions for a matched parameter set of I in1 , I out/eq1 and n eq1 :
g 1 = m σ n eq1 = log I out/eq1 I in1 = log I out/eq1 I in2 + log I in2 I in1
Here, I in2 is an input intensity differing from I in1 . For reasonable changes of I in in the range between 20% and 100%, the according change of I out/eq is in the range of ±10% of the amplifier output. In combination with a gain of more than 100, we can approximate log ( I out/eq1 / I in2 ) log ( I out/eq2 / I in2 ) with an error of less than 0.1%. This leads to:
m σ n eq1 = log I out/eq2 I in2 + log I in2 I in1 = m σ n eq/2 + log I in/2 I in/1
If we now consider that our amplifier has a certain starting excitation density matching, e.g., I in/max , this allows us to calculate the gain difference m σ ( n eq - n eq/max ) = m σ Δ n to any other I in by:
m σ Δ n = log I in/max I in
This means that as long as it is known, which I in in the beginning of a burst will fulfill Equation (4), the gain coefficient required to satisfy the equilibrium condition of any other I in can be directly calculated, as shown in Figure 6. In our case, this is solved by adjusting the delay between pump diodes to obtain a burst with a homogeneous energy distribution at maximum seed.
Using I out = I in · exp ( g ) together with Equation (11), we are now able to predict the output shape of any input burst starting with a uniform input shape. For the final step towards arbitrarily-shaped bursts, we now subdivide the burst into subsections with uniform input energy distributions. Each subsection may be as small as one single pulse. Starting at the beginning of the burst, where we know our initial target I in , we can now calculate the change of the excitation versus time using Equation (8). The new excitation density at the end of each subsection will be used as the initial one for the next subsection. Knowing this allows for the calculation of the gain, the output energy distribution and the change of excitation density in the next subsection, and so on.
Hence, the final output burst shape of any input burst shape can be calculated with this iterative technique. The predicted forms from this theoretical modeling for the amplified bursts in Figure 4 and Figure 5 are plotted together with the amplified shape. For the numerical calculation of the output pulse shapes, a value of 240 μs for τ eff was found empirically. This is close to the predicted range from the theoretical calculation. The calculated curves are in good agreement with the measured output.
The inversion of this recursive approach is more elaborate than the inversion of the Frantz-Nodvik equation, which was described in [18] for pulse shapes and extended in [19] for bursts in amplifier chains, because pumping and spontaneous fluorescence during the amplification process cannot be neglected. Therefore, we used the method of successive approximation, i.e., varying the input burst shape until an acceptable agreement with the calculated output shape was reached. This front-upcalculation renders a feedback loop in the amplifier system unnecessary if only predictable saturation effects have to be compensated.
Results of the algorithm are shown in Figure 7 and Figure 8. Here, we used the same energy distributions as before for the final target shapes. From them, we calculated the required shapes of seed pulse bursts that have to be further amplified. In the experiments, seed bursts were shaped accordingly, amplified afterwards and finally recorded. Figure 7 and Figure 8 reveal the good agreement of the measurement with the initial target function of output burst shapes for these examples. This proves the practicability of the used methods to produce quasi-arbitrarily-shaped pulse bursts, within the given range of I in .
Figure 7. (Left): input pulse train shaped to obtain a stair-shaped output; (right): resulting output pulse train after amplification.
Applsci 05 01790 g007
Figure 8. (Left): input pulse train to achieve an output with alternating amplitude; (right): resulting output pulse train after amplification.
Applsci 05 01790 g008

4. Conclusions

We have demonstrated a method for the temporal shaping of ultra short pulse bursts by loss modulation using a Pockels cell. The obtained output burst shapes showed a very good agreement with the targeted shapes.
Furthermore, the amplification of shaped bursts within a diode-pumped amplifier based on cryogenically-cooled Yb:CaF 2 was investigated. It was shown that the amplification will disturb the predefined shape, as the amplification within the amplifier will change due to a change of n. The latter one will exponentially approach an equilibrium value, which is different for different input intensities. The characteristic decay time for this process was theoretically determined to be in the range from 204 μs to 239 μs for our test amplifier. This is in good agreement with the empirically found value of 240 μs. Based on this result, we employed a simplified model to predict the required input pulse shape for a desired output pulse shape. Applying this method to sample bursts in the real amplifier gave a very good agreement between calculation and measurement.
From the obtained results, the employed shaping method has proven to be a promising approach, both for the generation of application-specific temporal burst shapes and for the compensation of any temporal modulations within the burst shape introduced by an amplifier system.
The extension of the presented shaping method to more than one amplifier is straight forward and mainly requires iterating the calculation of the burst shape. The main work will be a careful characterization of each amplifier stage. This is used to determine its specific parameters, in particular τ e f f . An increased accuracy for the final burst shape could be achieved by combining the presented method with a closed loop system, slightly varying the input into the system depending on the output burst shape.

Acknowledgments

This work was partly supported by the European Social Fund (ESF) through the Thuringian Ministry of Economy, Employment and Technology (Project Number 2011 FGR 0122). Furthermore, the authors are grateful for the support by the German Federal Ministry of Education and Research (BMBF) (Contract 03Z1H531). The authors gratefully acknowledge the support given by Bergmann Messgeräte Entwicklung KG, Murnau, Germany in the person of Thorald Bergmann.

Author Contributions

The experiment, the analysis, and the theoretical modeling of the data were carried out by Jürgen Reiter and Jörg Körner. Joachim Hein and Malte C. Kaluza contributed by substantial discussion and guided the project. All authors wrote and proof-read the manuscript.

Conflicts of Interest

The authors declare no conflict of interest.

References

  1. Thurow, B.; Jiang, N.; Samimy, M.; Lempert, W. Narrow-linewidth Megahertz-rate pulse-burst laser for high-speed flow diagnostics. Appl. Opt. 2004, 43, 5064–5073. [Google Scholar] [CrossRef] [PubMed]
  2. Thurow, B.S.; Satija, A.; Lynch, K. Third-generation Megahertz-rate pulse burst laser system. Appl. Opt. 2009, 48, 2086–2093. [Google Scholar] [CrossRef] [PubMed]
  3. Wu, P.; Lempert, W.L.; Miles, R.B. Megahertz pulse-burst laser and visualization of shock-wave/boundary-layer interaction. AIAA J. 2000, 38, 672–679. [Google Scholar] [CrossRef]
  4. Patton, R.; Gabet, K.; Jiang, N.; Lempert, W.; Sutton, J. Multi-kHz mixture fraction imaging in turbulent jets using planar Rayleigh scattering. Appl. Phys. B 2012, 106, 457–471. [Google Scholar] [CrossRef]
  5. Lapczyna, M.; Chen, K.; Herman, P.; Tan, H.; Marjoribanks, R. Ultra high repetition rate (133 MHz) laser ablation of aluminum with 1.2-ps pulses. Appl. Phys. A 1999, 69, S883–S886. [Google Scholar] [CrossRef]
  6. Hu, W.; Shin, Y.C.; King, G. Modeling of multi-burst mode pico-second laser ablation for an improved material removal rate. Appl. Phys. A 2010, 98, 407–415. [Google Scholar] [CrossRef]
  7. Will, I.; Templin, H.I.; Schreiber, S.; Sandner, W. Photoinjector drive laser of the FLASH FEL. Opt. Express 2011, 19, 23770–23781. [Google Scholar] [CrossRef] [PubMed]
  8. Ge, X.-L.; Ma, J.-L.; Zheng, Y.; Lu, X.; Jiang, G.; Li, Y.-Y.; Wei, Z.-Y.; Zhang, J. Chirped pulse amplification of femtosecond pulse sequences in a Ti:Sapphire laser. Acta Phys. Sin. 2012. [Google Scholar] [CrossRef]
  9. Körner, J.; Hein, J.; Liebetrau, H.; Kahle, M.; Seifert, R.; Klöpfel, D.; Kaluza, M.C. Diode-pumped, cryogenically cooled, femtosecond burst mode laser. In Proceedings of SPIE 8780, High-Power, High-Energy, and High-Intensity Laser Technology; and Research Using Extreme Light: Entering New Frontiers with Petawatt-Class Lasers, Prague, Czech Republic, 15 April 2013.
  10. Will, I.; Liero, A.; Mertins, D.; Sandner, W. Feedback-stabilized Nd:YLF amplifier system for generation of picosecond pulse trains of an exactly rectangular envelope. IEEE J. Quantum Electron. 1998, 34, 2020–2028. [Google Scholar] [CrossRef]
  11. Tan, B. Deep micro hole drilling in a silicon substrate using multi-bursts of nanosecond UV laser pulses. J. Micromech. Microeng. 2006, 16, 1–8. [Google Scholar] [CrossRef]
  12. Rezaei, S.; Li, J.; Herman, P.R. Burst train generator of high energy femtosecond laser pulses for driving heat accumulation effect during micromachining. Opt. Lett. 2015, 40, 2064–2067. [Google Scholar] [CrossRef] [PubMed]
  13. Körner, J.; Hein, J.; Liebetrau, H.; Seifert, R.; Klöpfel, D.; Kahle, M.; Loeser, M.; Siebold, M.; Schramm, U.; Kaluza, M.C. Efficient burst mode amplifier for ultra-short pulses based on cryogenically cooled Yb3+:CaF2. Opt. Exp. 2013, 21, 29006–29012. [Google Scholar] [CrossRef] [PubMed]
  14. Körner, J.; Hein, J.; Liebetrau, H.; Seifert, R.; Klöpfel, D.; Kahle, M.; Loeser, M.; Siebold, M.; Schramm, U.; Kaluza, M.C. Highly efficient all diode pumped burst mode laser system for ultra-short pulses. In Proceedings of Advanced Solid-State Lasers Congress, Paris, France, 27 October–1 November 2013.
  15. Körner, J. Effizienzsteigerung Yb3+-basierter Kurzpuls-Laserverstärker; Sierke Verlag: Göttingen, Germany, 2014. [Google Scholar]
  16. Bergmann, T.; Flaig, R.; Sutter, D. Pockelszellen-Ansteuerschaltung zur schnellen Variation der Pulsamplitude von kurzen oder ultrakurzen Laserpulsen. DE102005061716, 5 July 2007. [Google Scholar]
  17. Körner, J.; Jambunathan, V.; Hein, J.; Seifert, R.; Loeser, M.; Siebold, M.; Schramm, U.; Sikocinski, P.; Lucianetti, A.; Mocek, T.; et al. Spectroscopic characterization of Yb3+-doped laser materials at cryogenic temperatures. Appl. Phys. B 2014, 116, 75–81. [Google Scholar] [CrossRef]
  18. Schimpf, D.N.; Ruchert, C.; Nodop, D.; Limpert, J.; Tuennermann, A.; Salin, F. Compensation of pulse-distortion in saturated laser amplifiers. Opt. Express 2008, 16, 17637–17646. [Google Scholar] [CrossRef] [PubMed]
  19. Petelin, J.; Podobnik, B.; Petkovsek, R. Burst shaping in a fiber-amplifier chain seeded by a gain-switched laser diode. Appl. Opt. 2015, 54, 4629–4634. [Google Scholar] [CrossRef] [PubMed]

