
Electromagnetic Acoustic Transducers Applied to High Temperature Plates for Potential Use in the Solar Thermal Industry †

Abstract
:1. Introduction
2. EMAT Technology
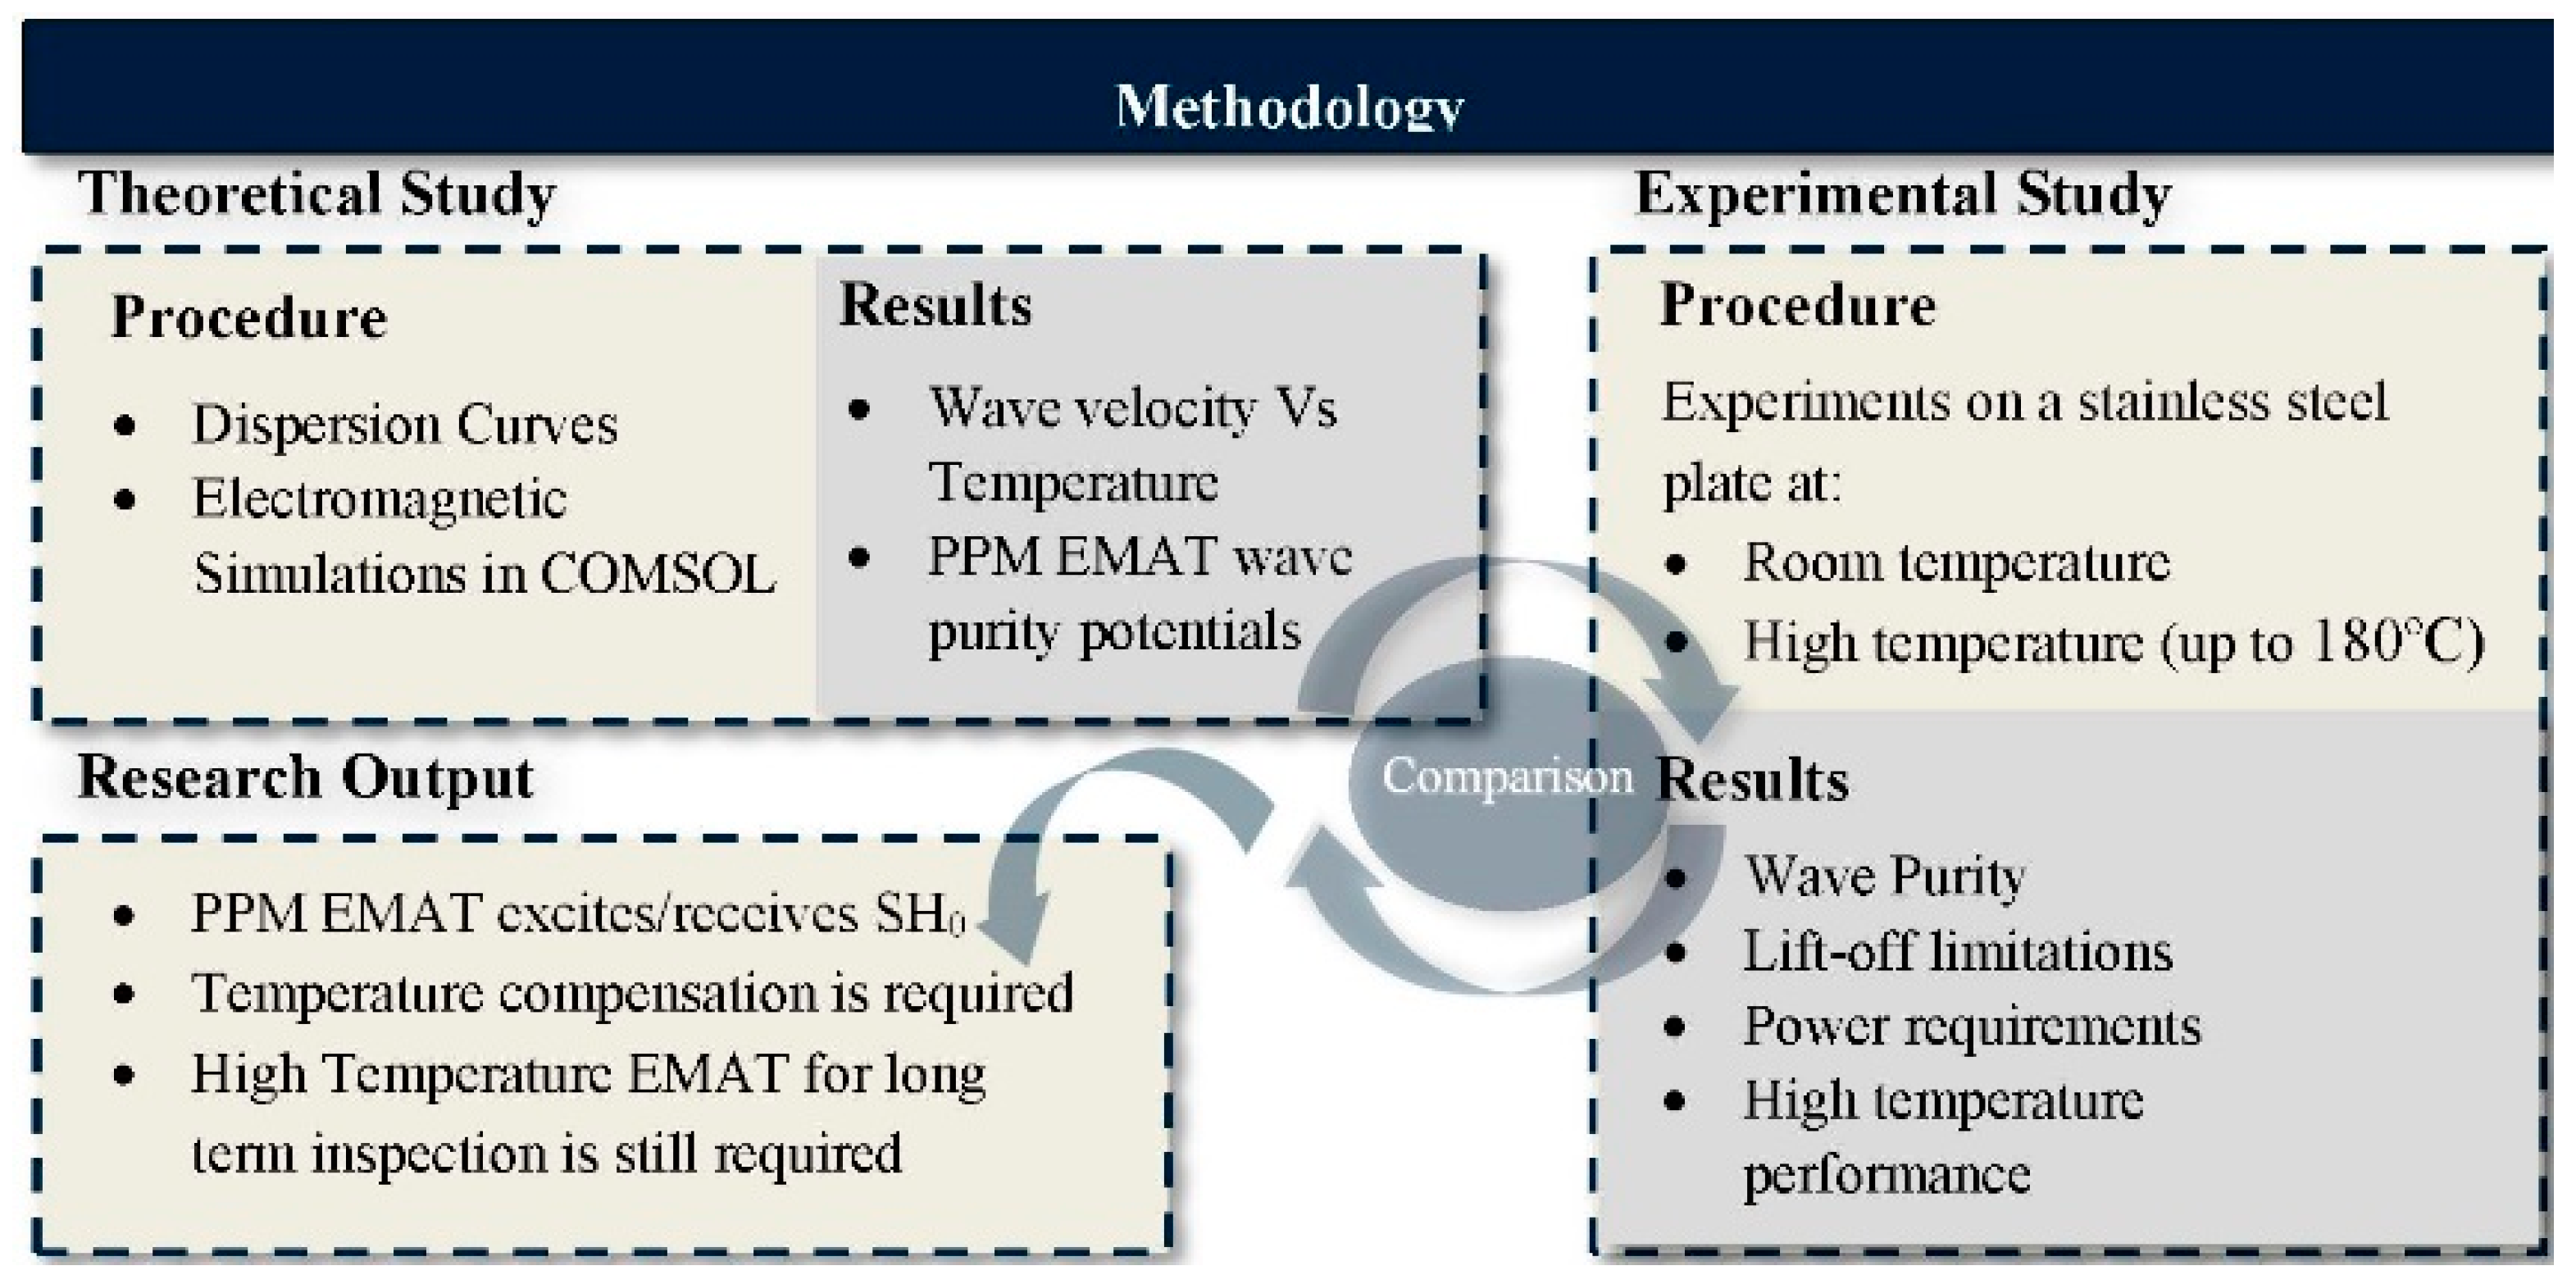
3. Our Methodology

4. Theoretical Study
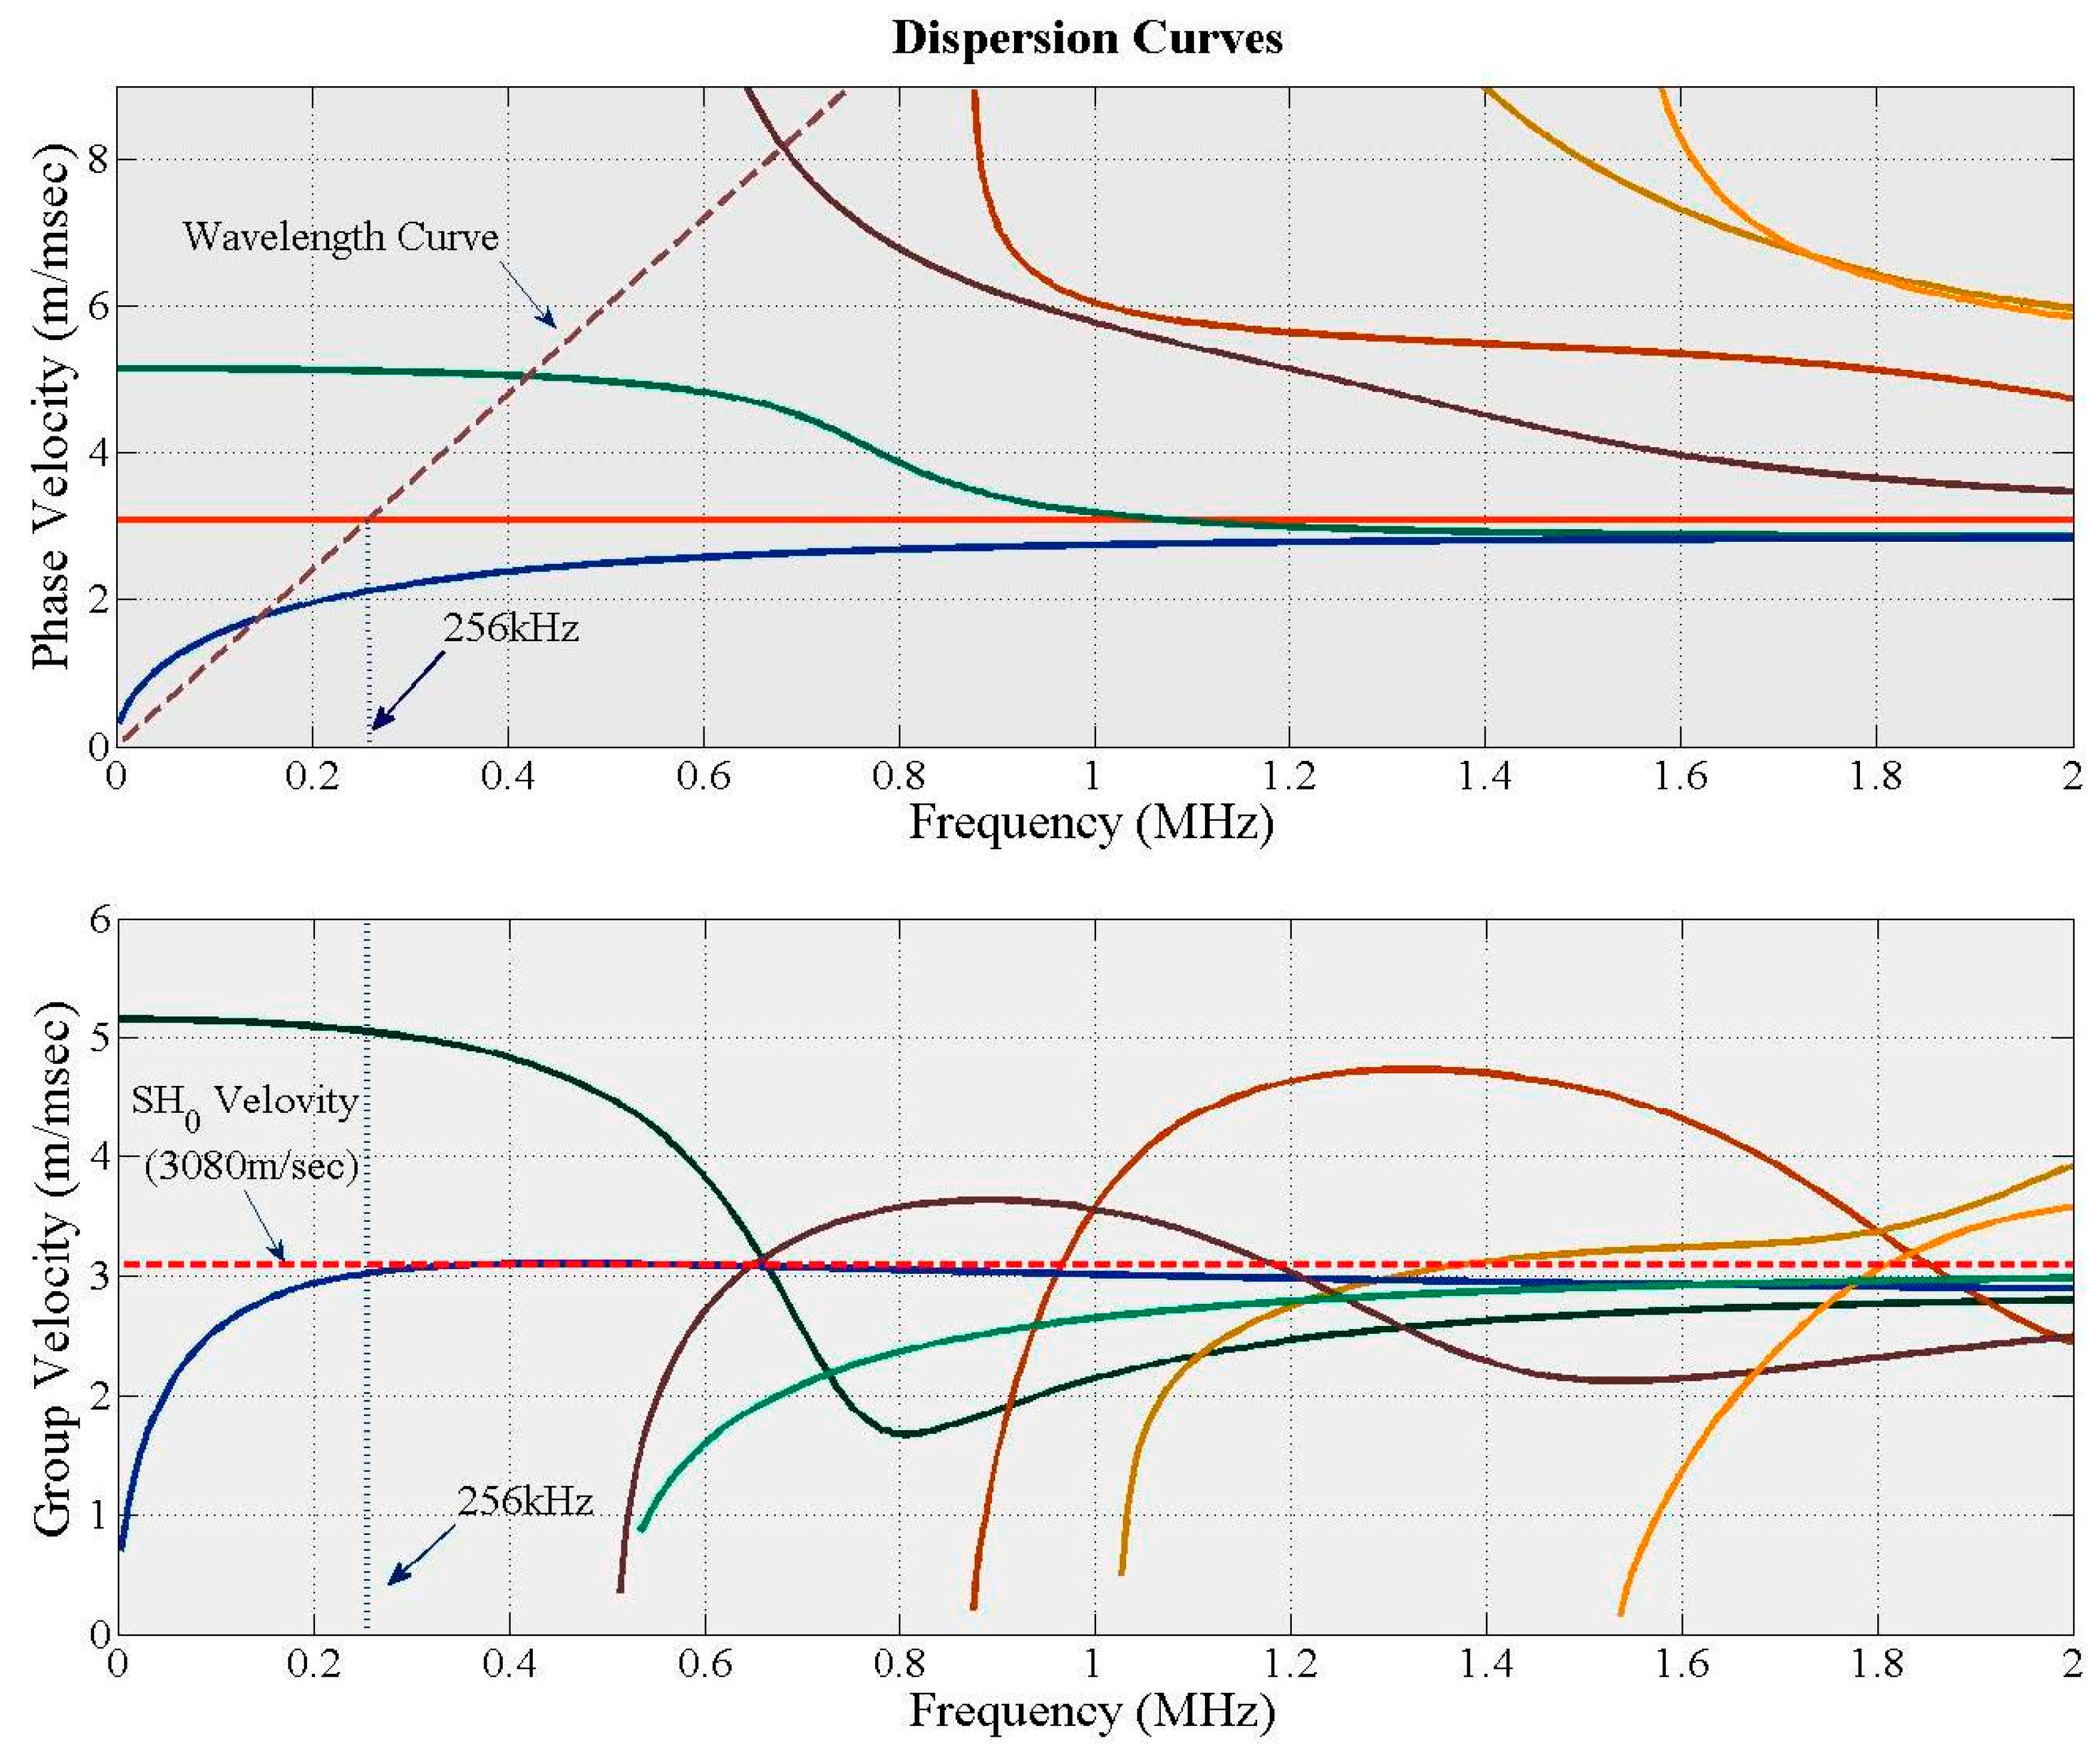
4.1. Dispersion Curves

| Dispersion Curves—SH0/S0/A0/A1 Frequency & Wave Velocity | ||||||||
|---|---|---|---|---|---|---|---|---|
| Value | Frequency (kHz) | Velocity (m/s) | ||||||
| Temperature (°C) | 22 | 60 | 100 | 180 | 22 | 60 | 100 | 180 |
| SH0 | 256 | 255 | 254.2 | 250.6 | 3080 | 3067 | 3051 | 3008 |
| S0 | 420 | 419 | 415.5 | 405 | 5044 | 5022 | 5003 | 4944 |
| A0 | 143 | 140 | 139 | 136 | 1736 | 1720 | 1711 | 1685 |
| A1 | 676 | 673 | 668 | 657 | 8243 | 8217 | 8203 | 8129 |
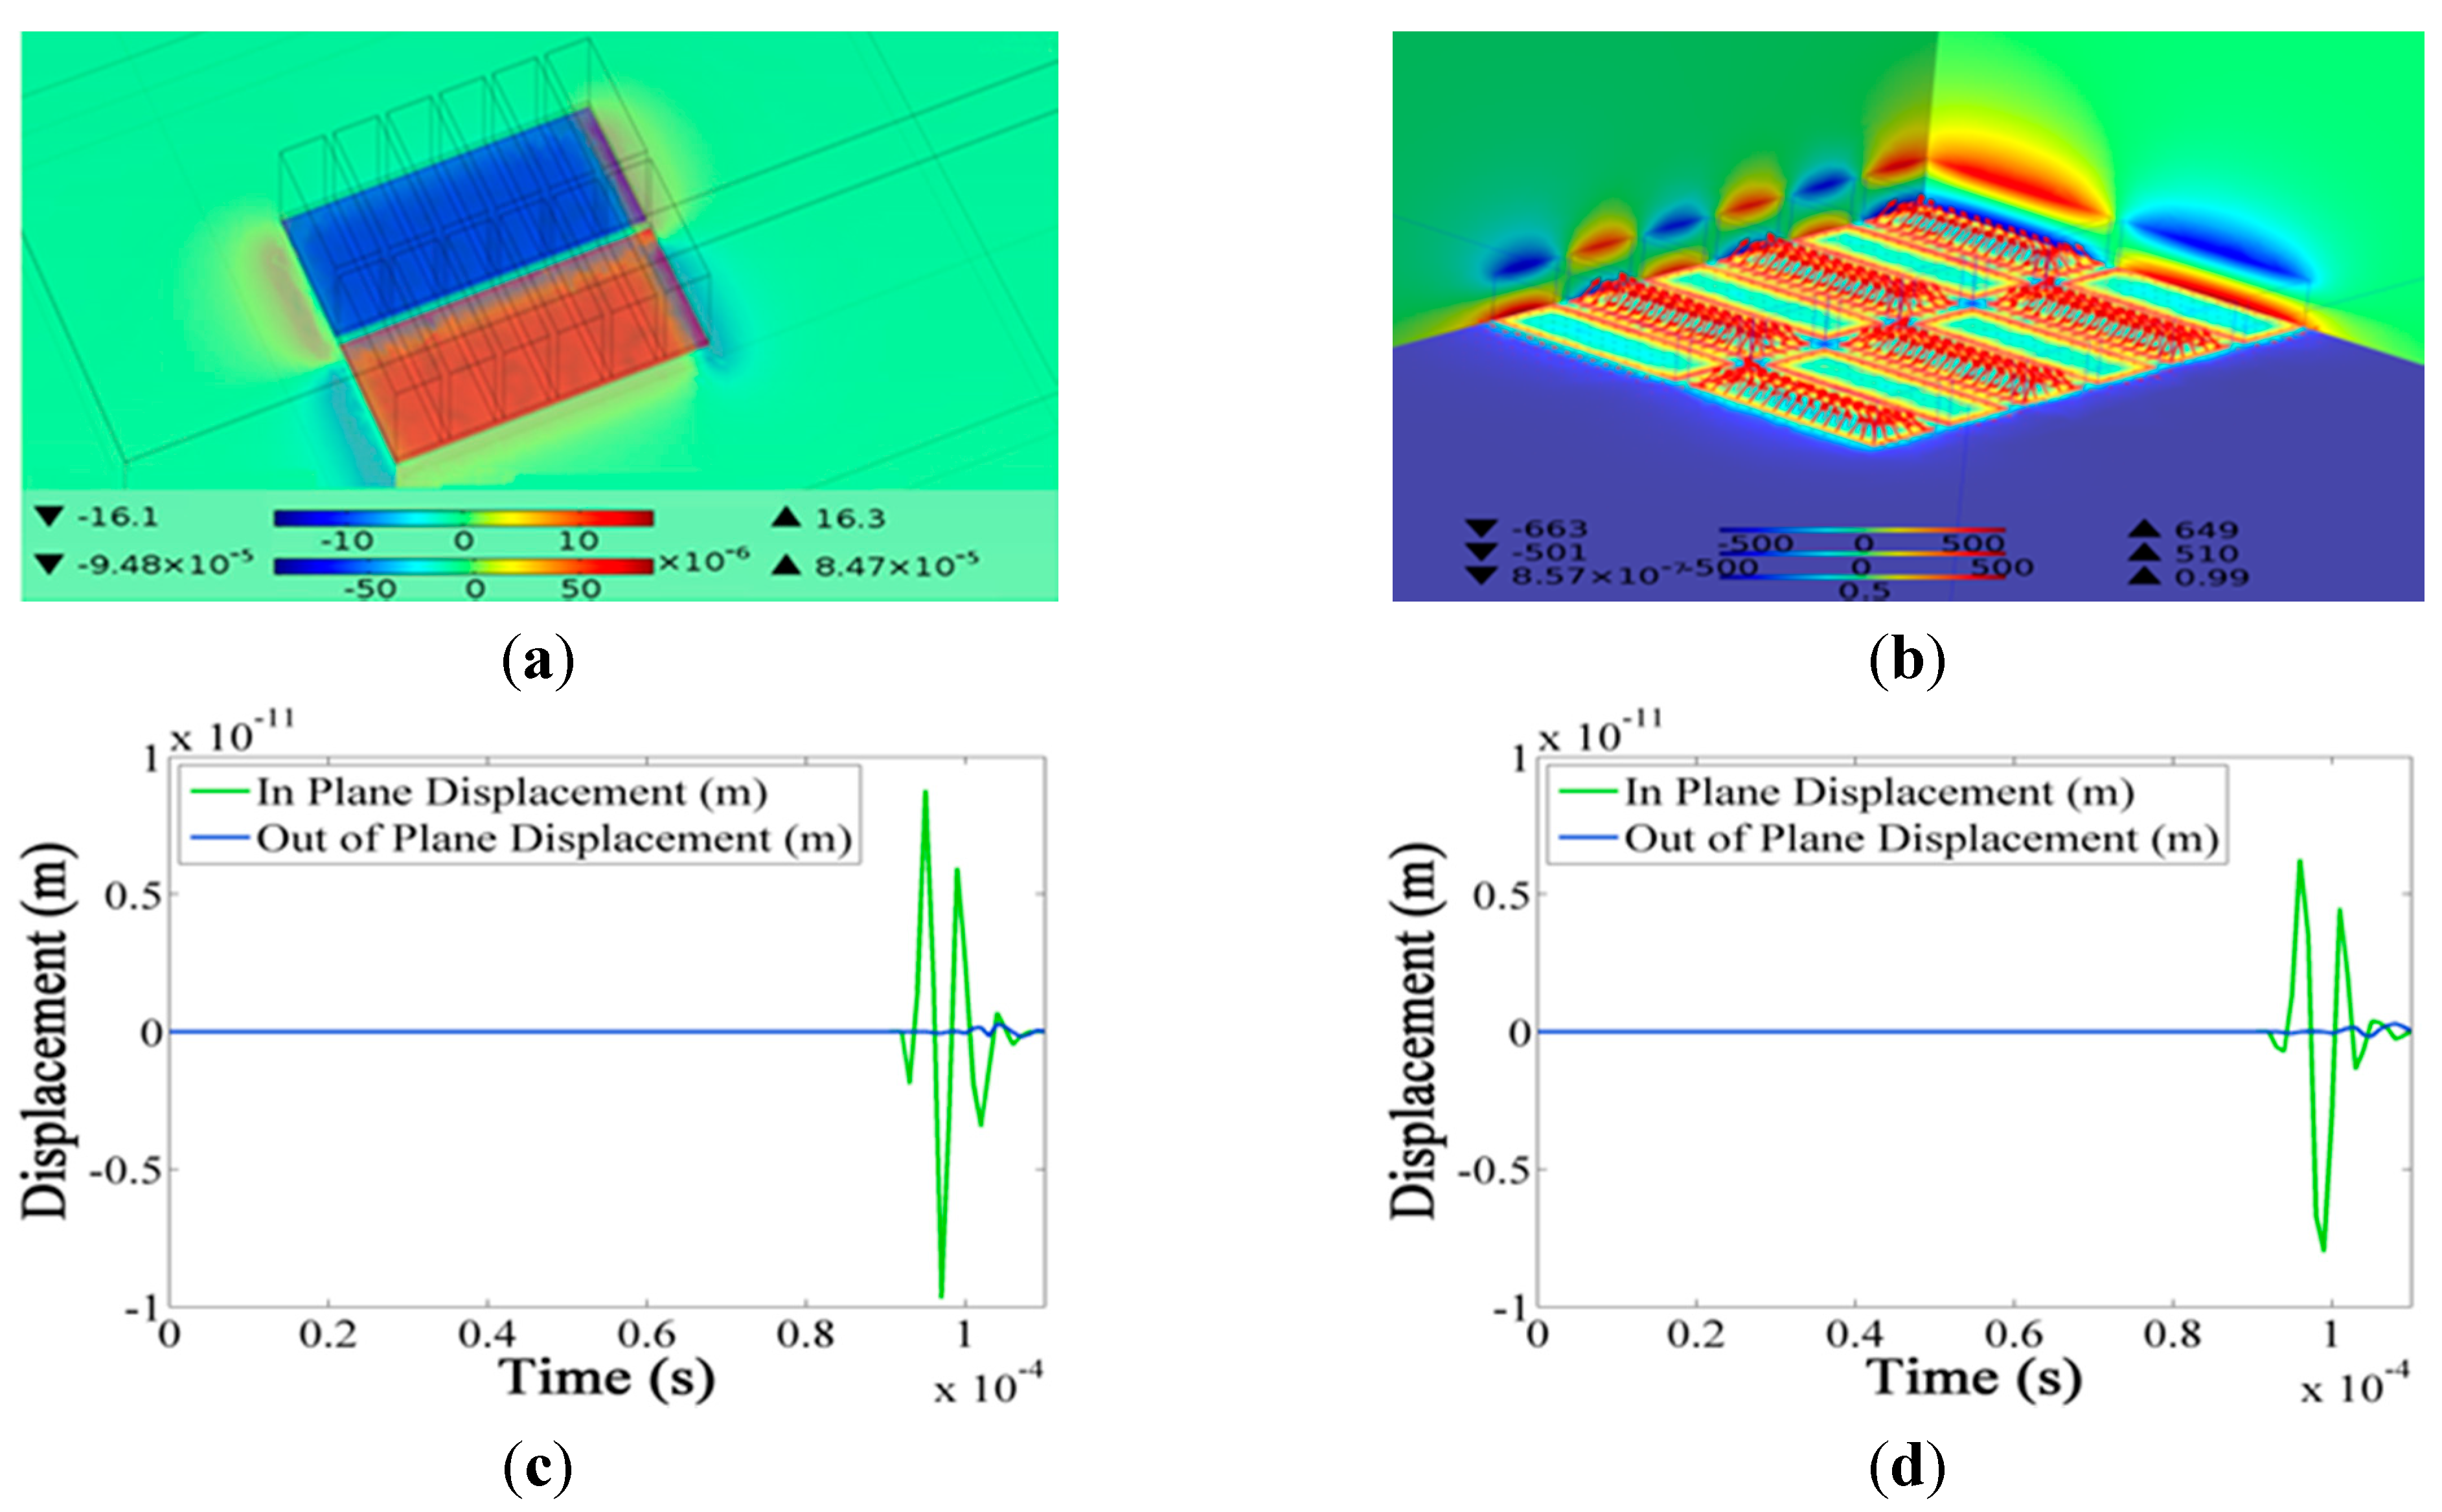
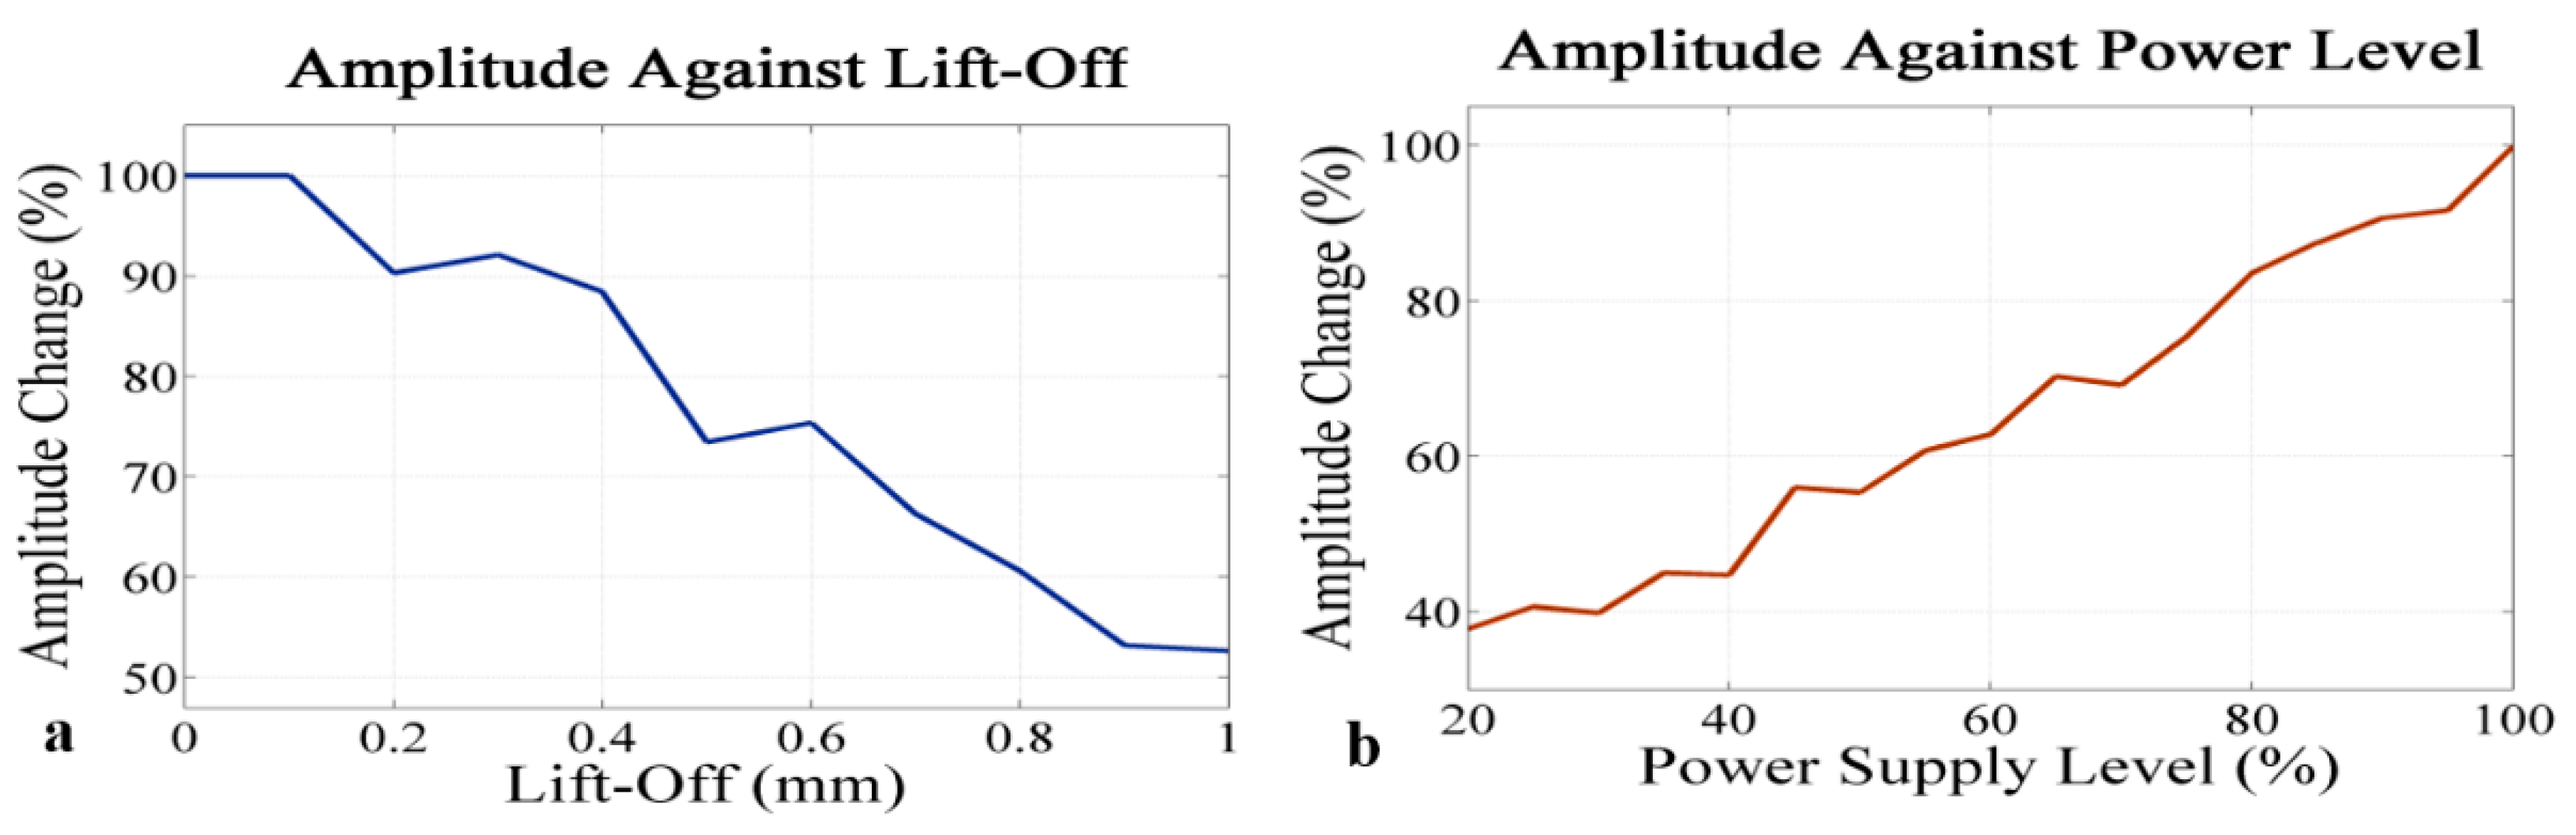
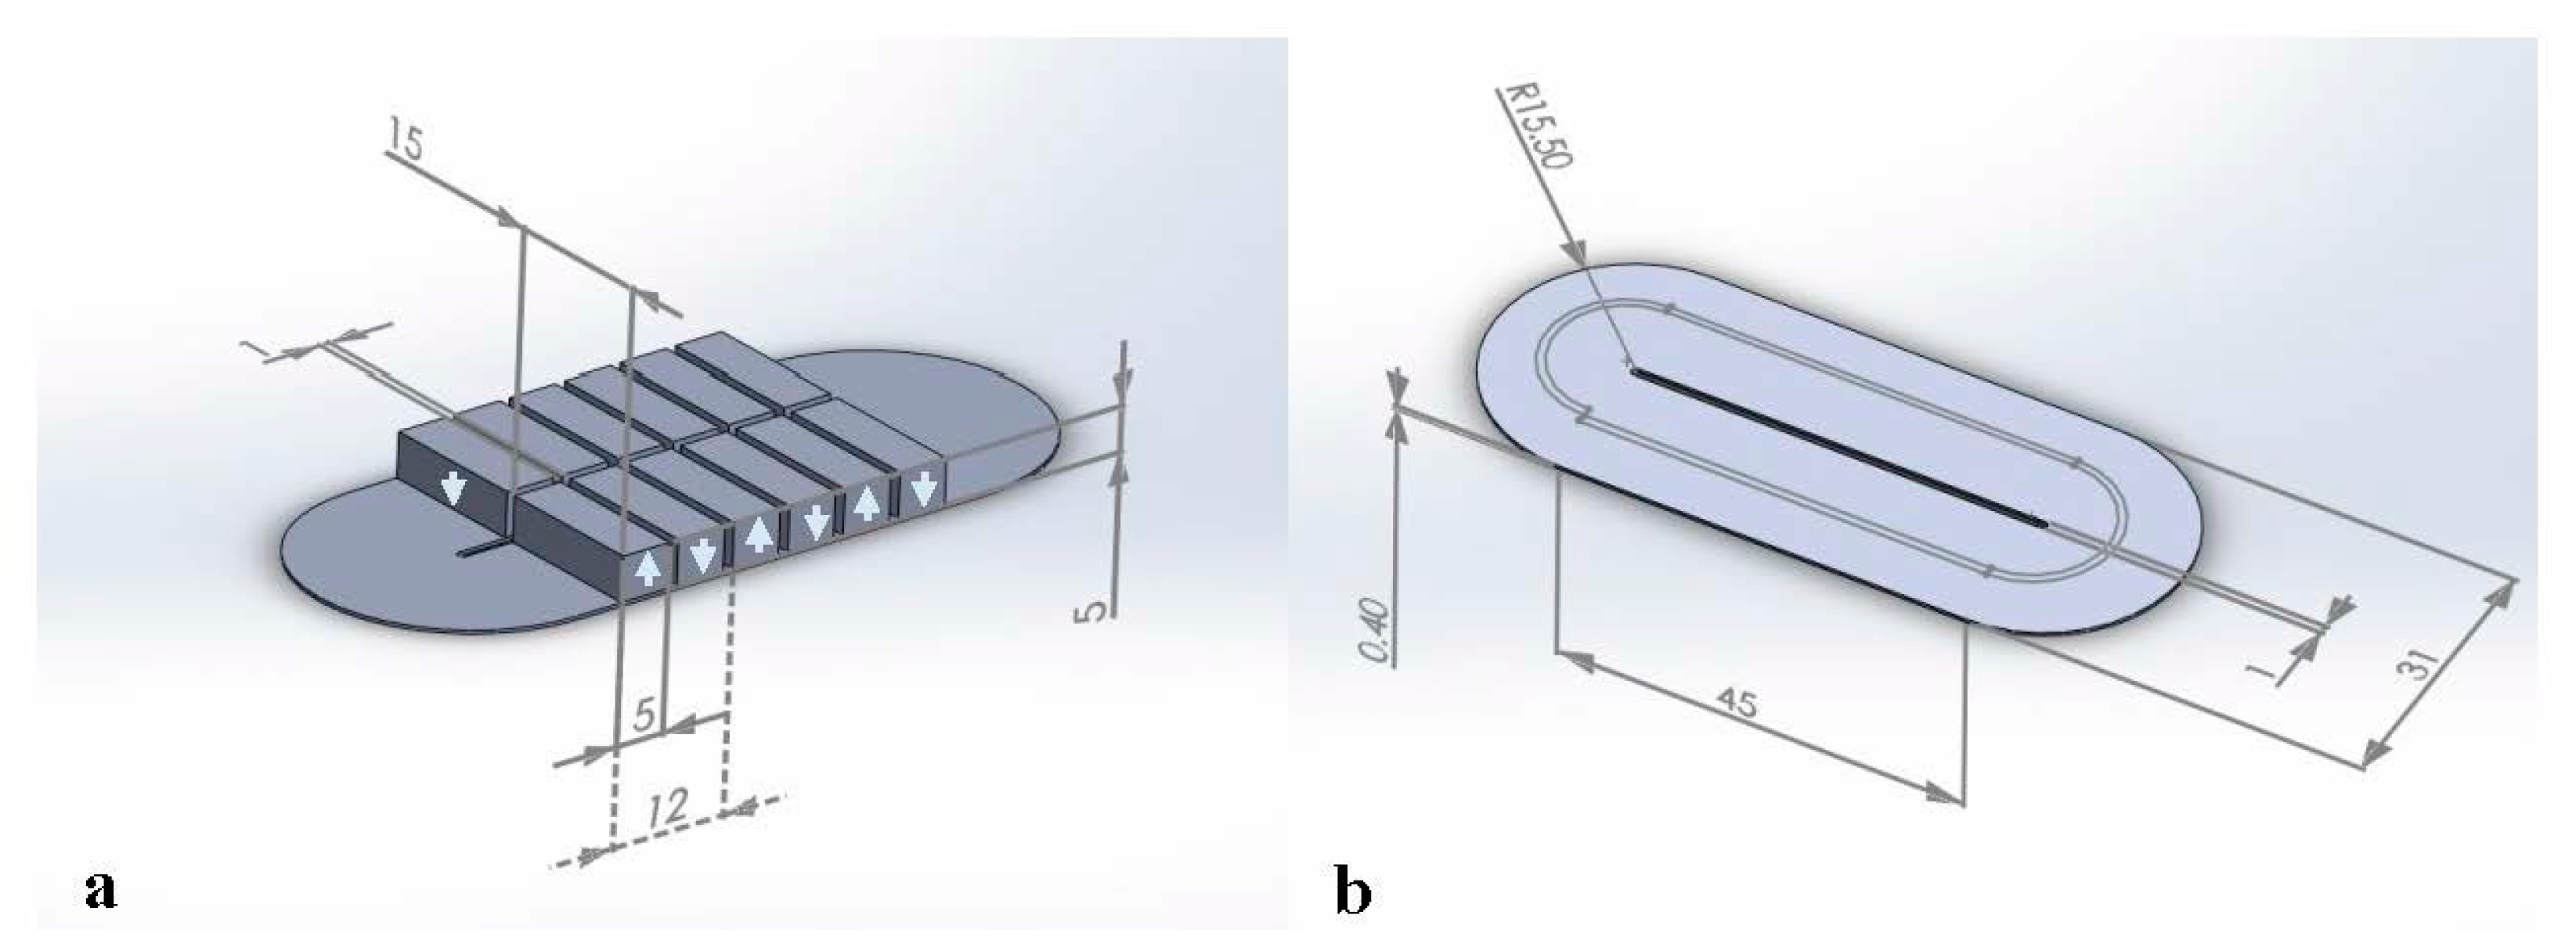
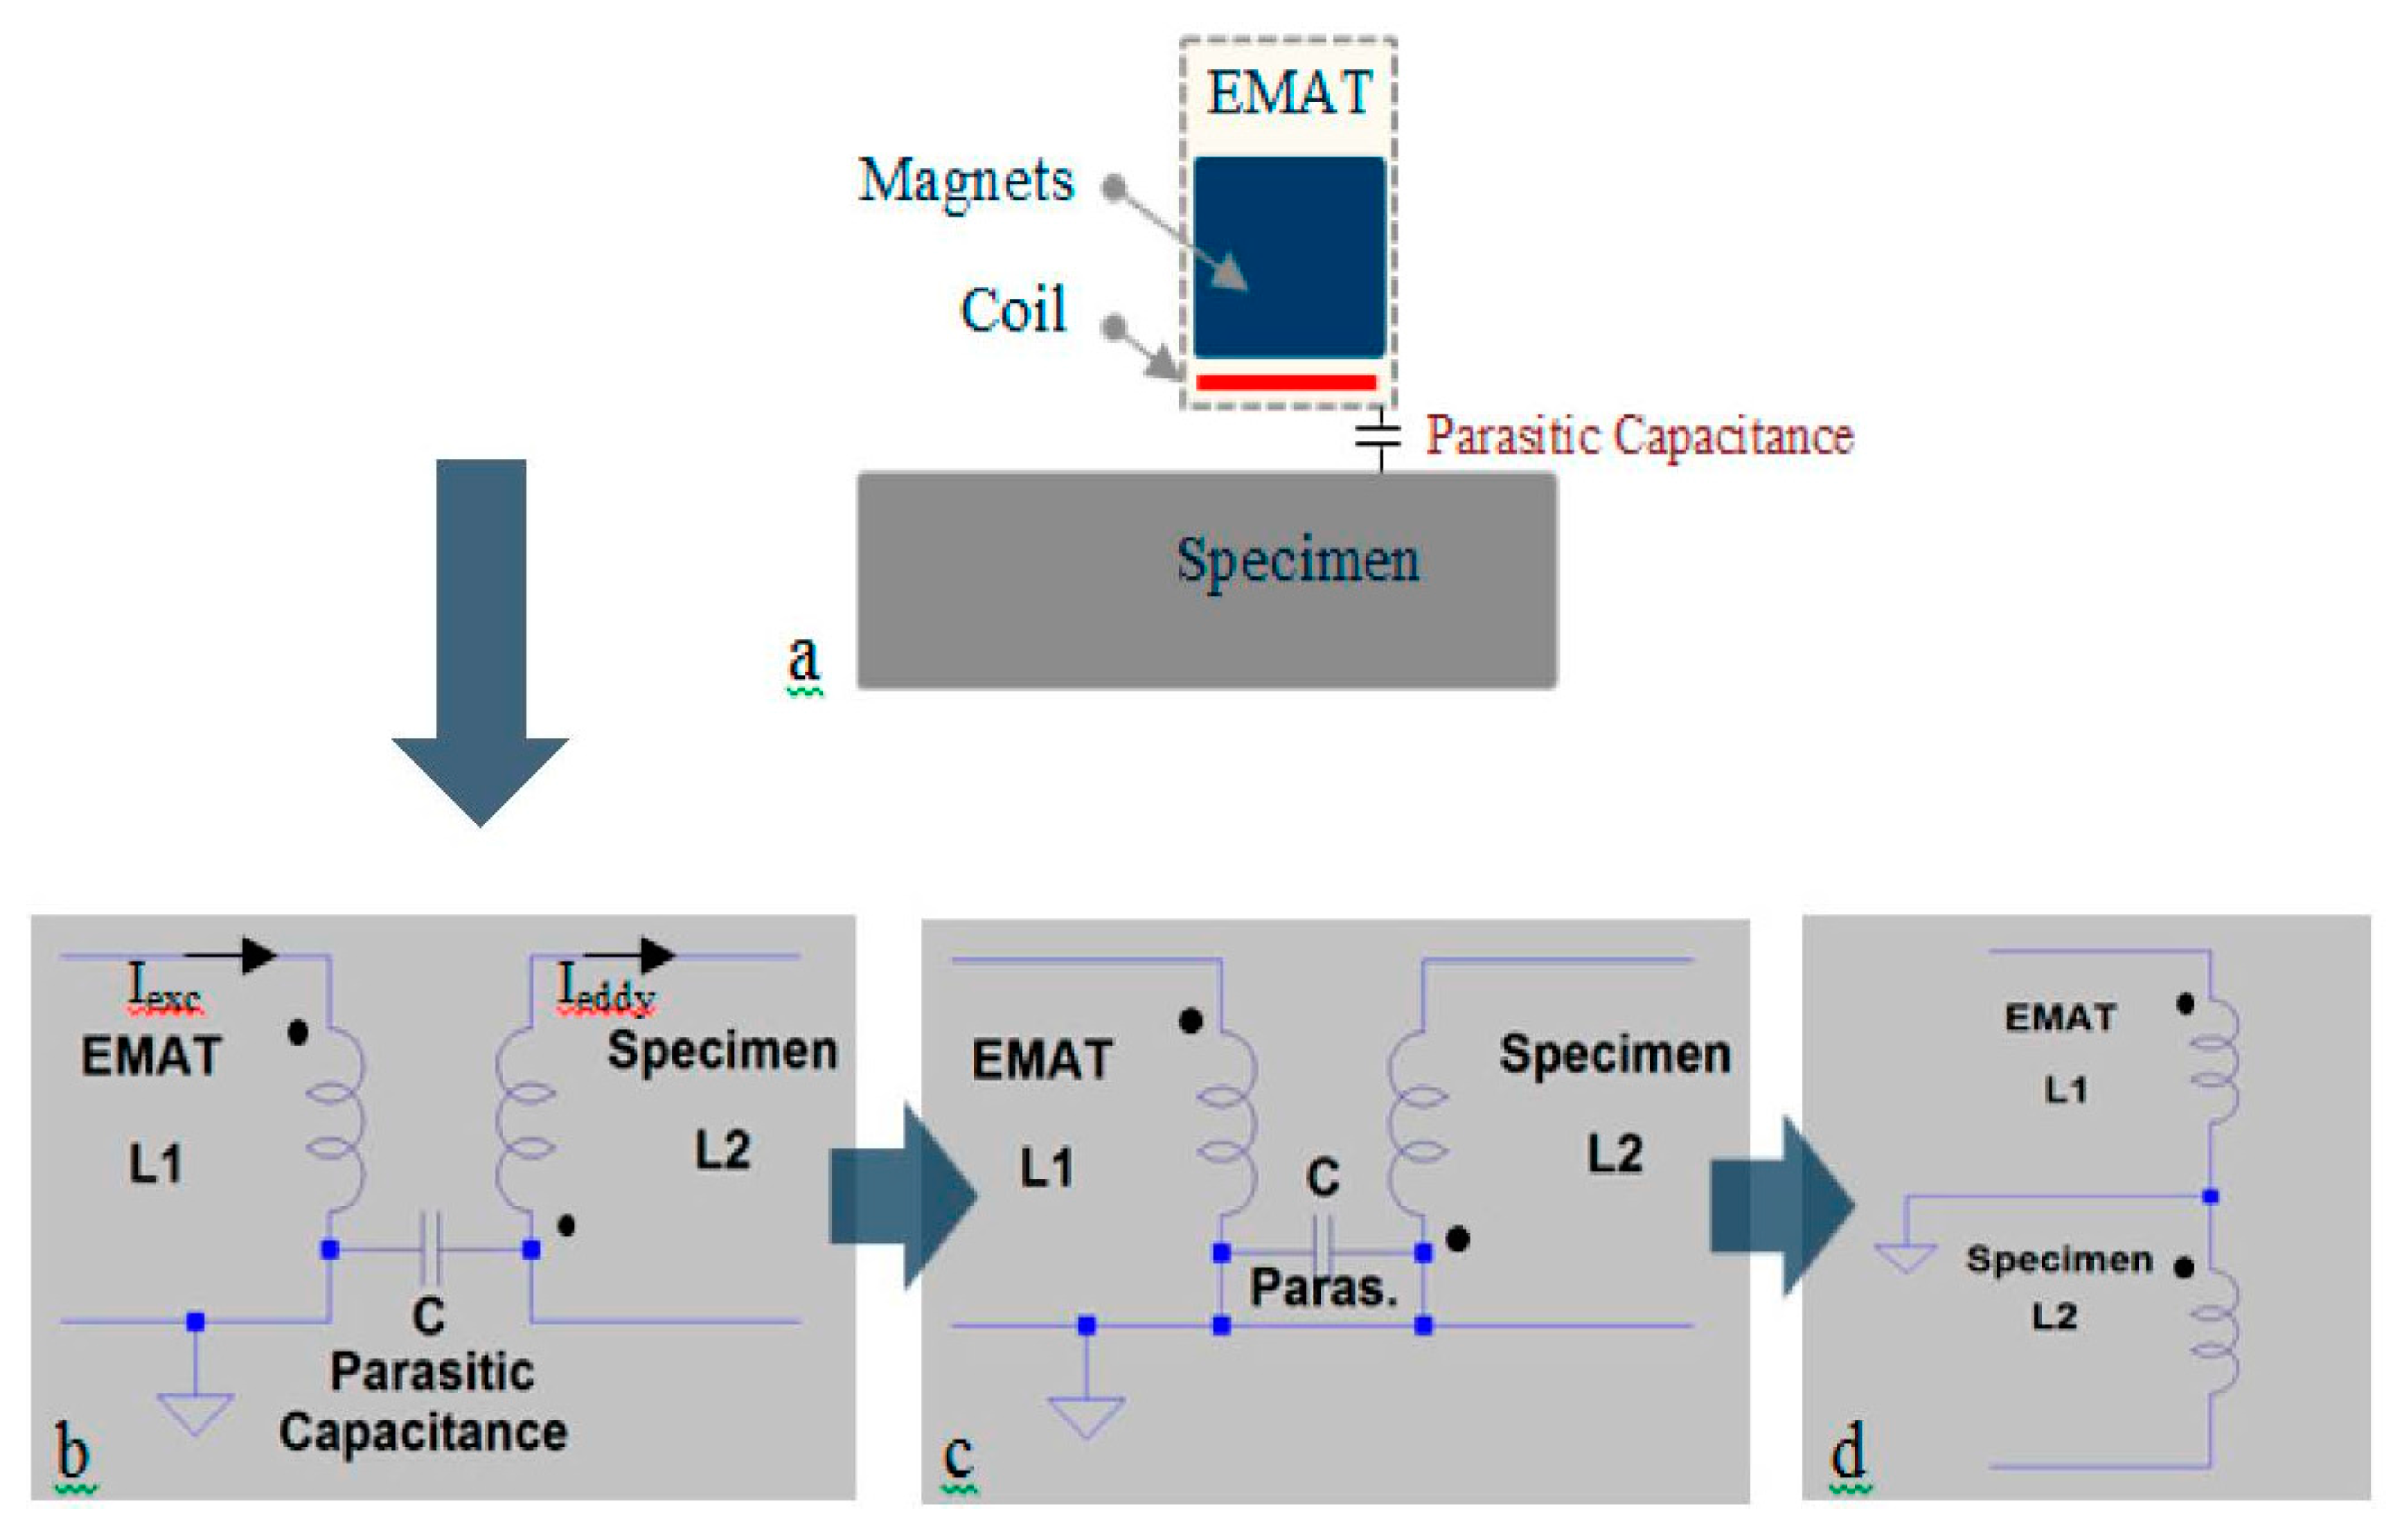
4.2. Electromagnetic Simulations

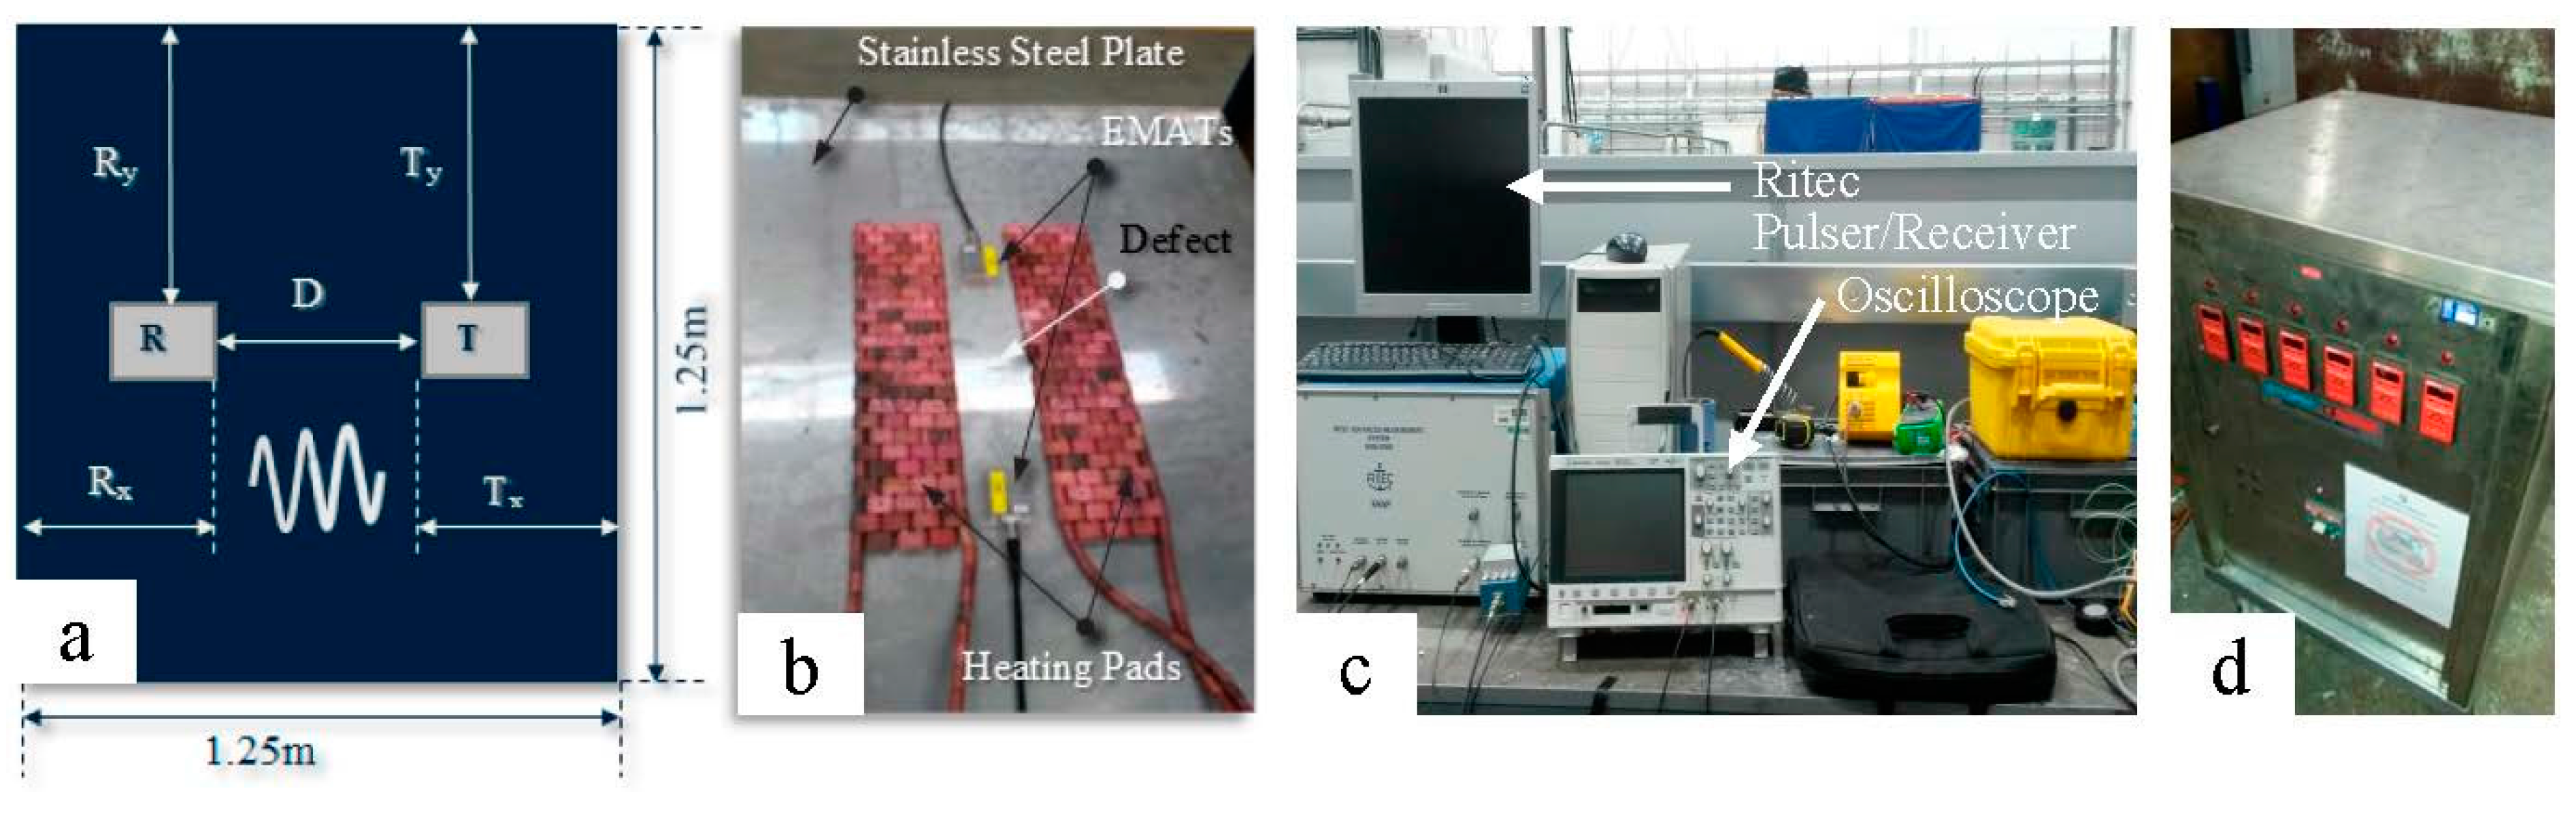
5. Experimental Setup

6. Experimental Results and Discussion
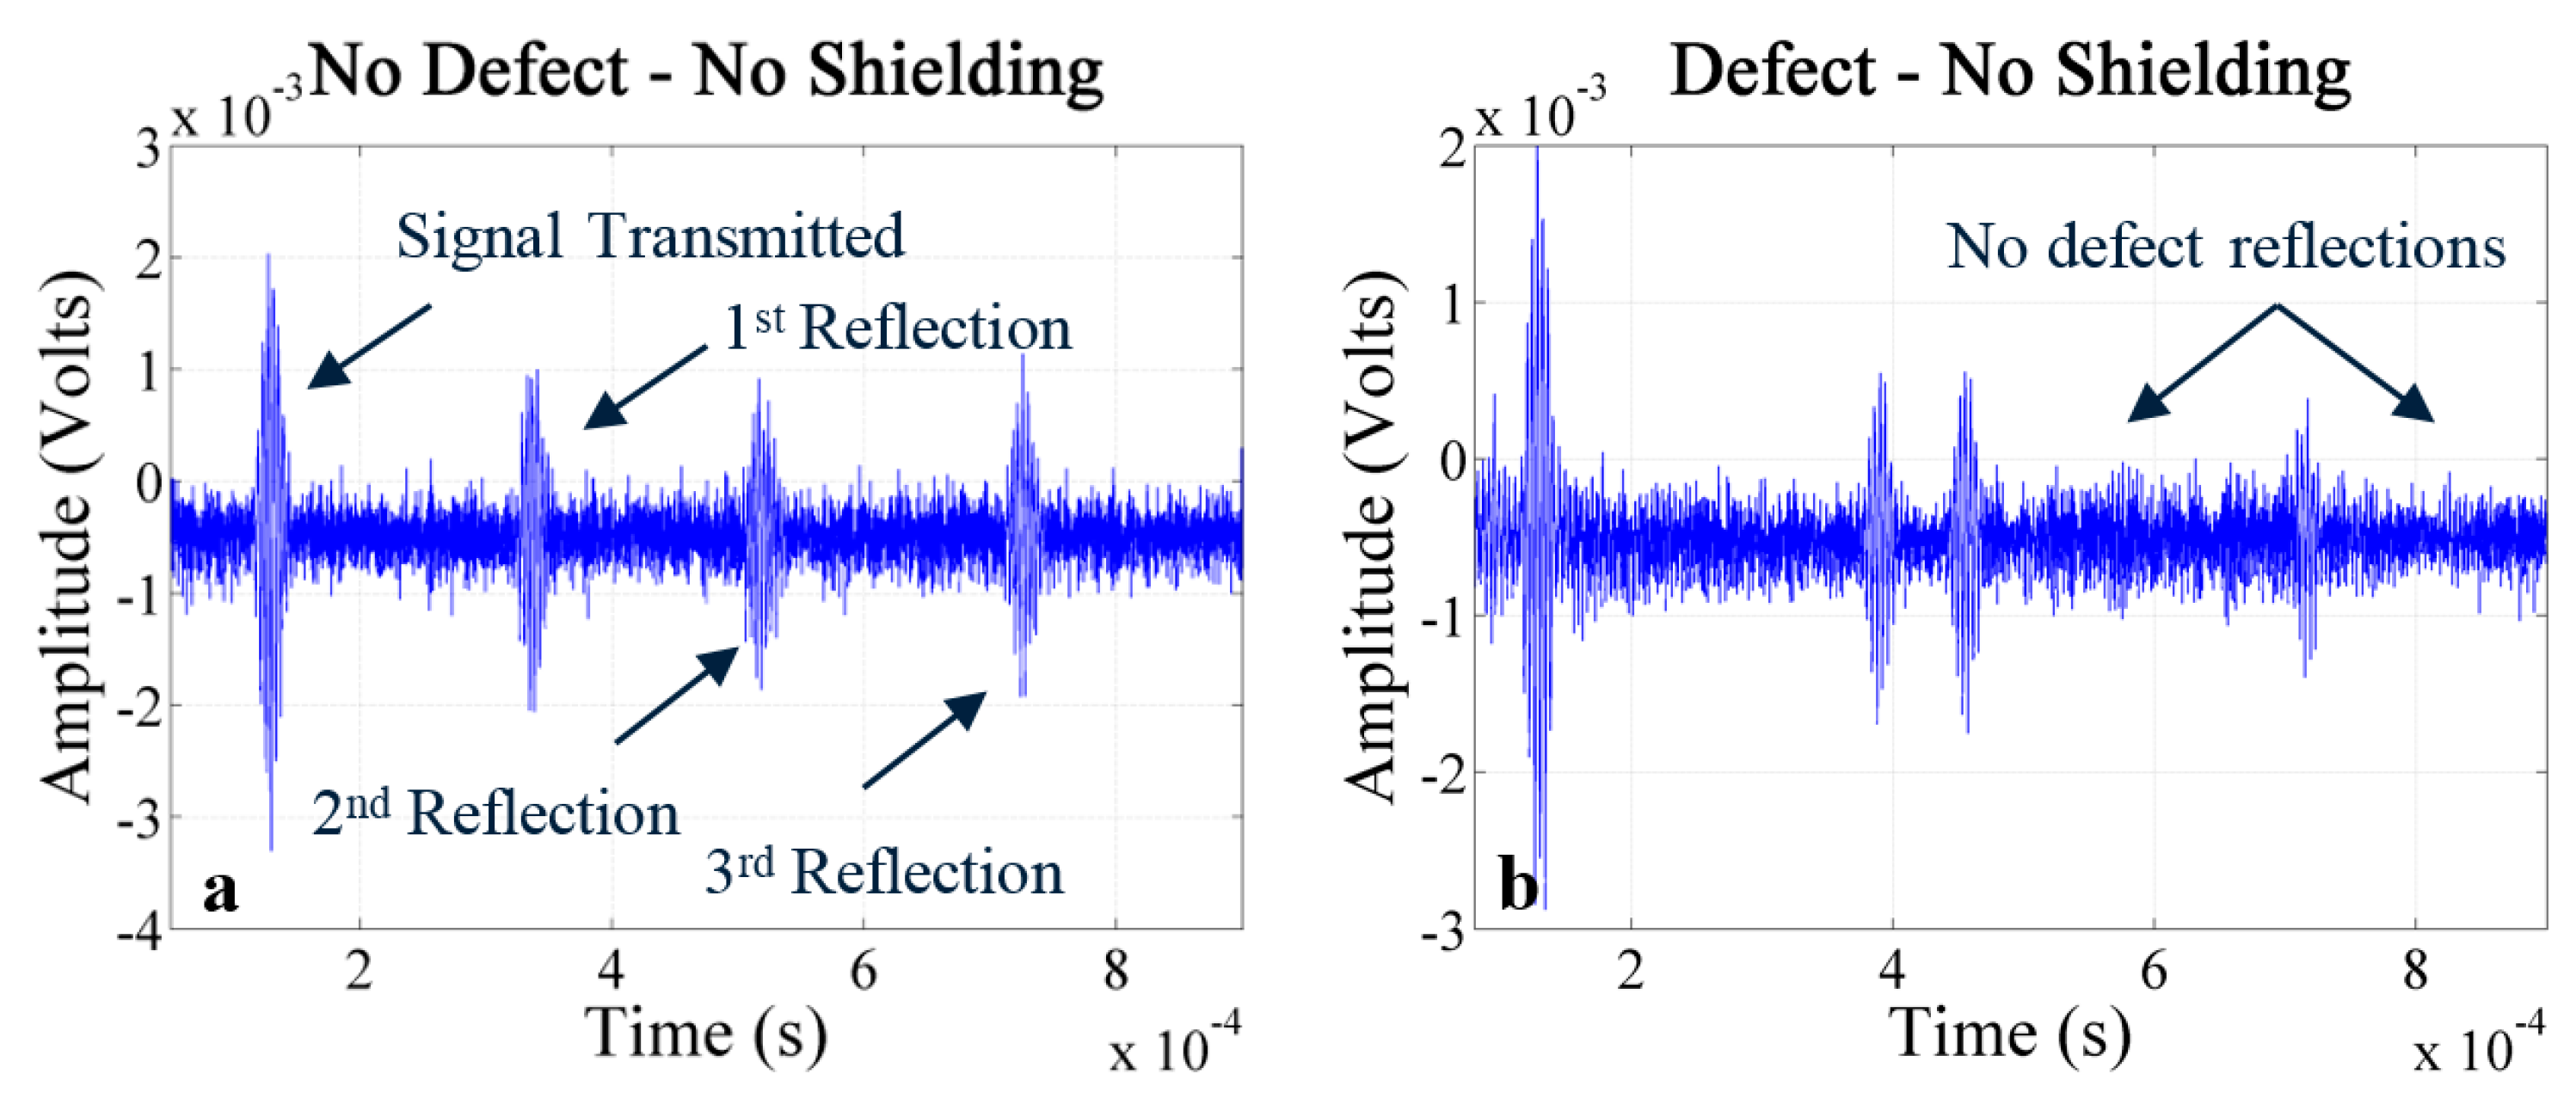
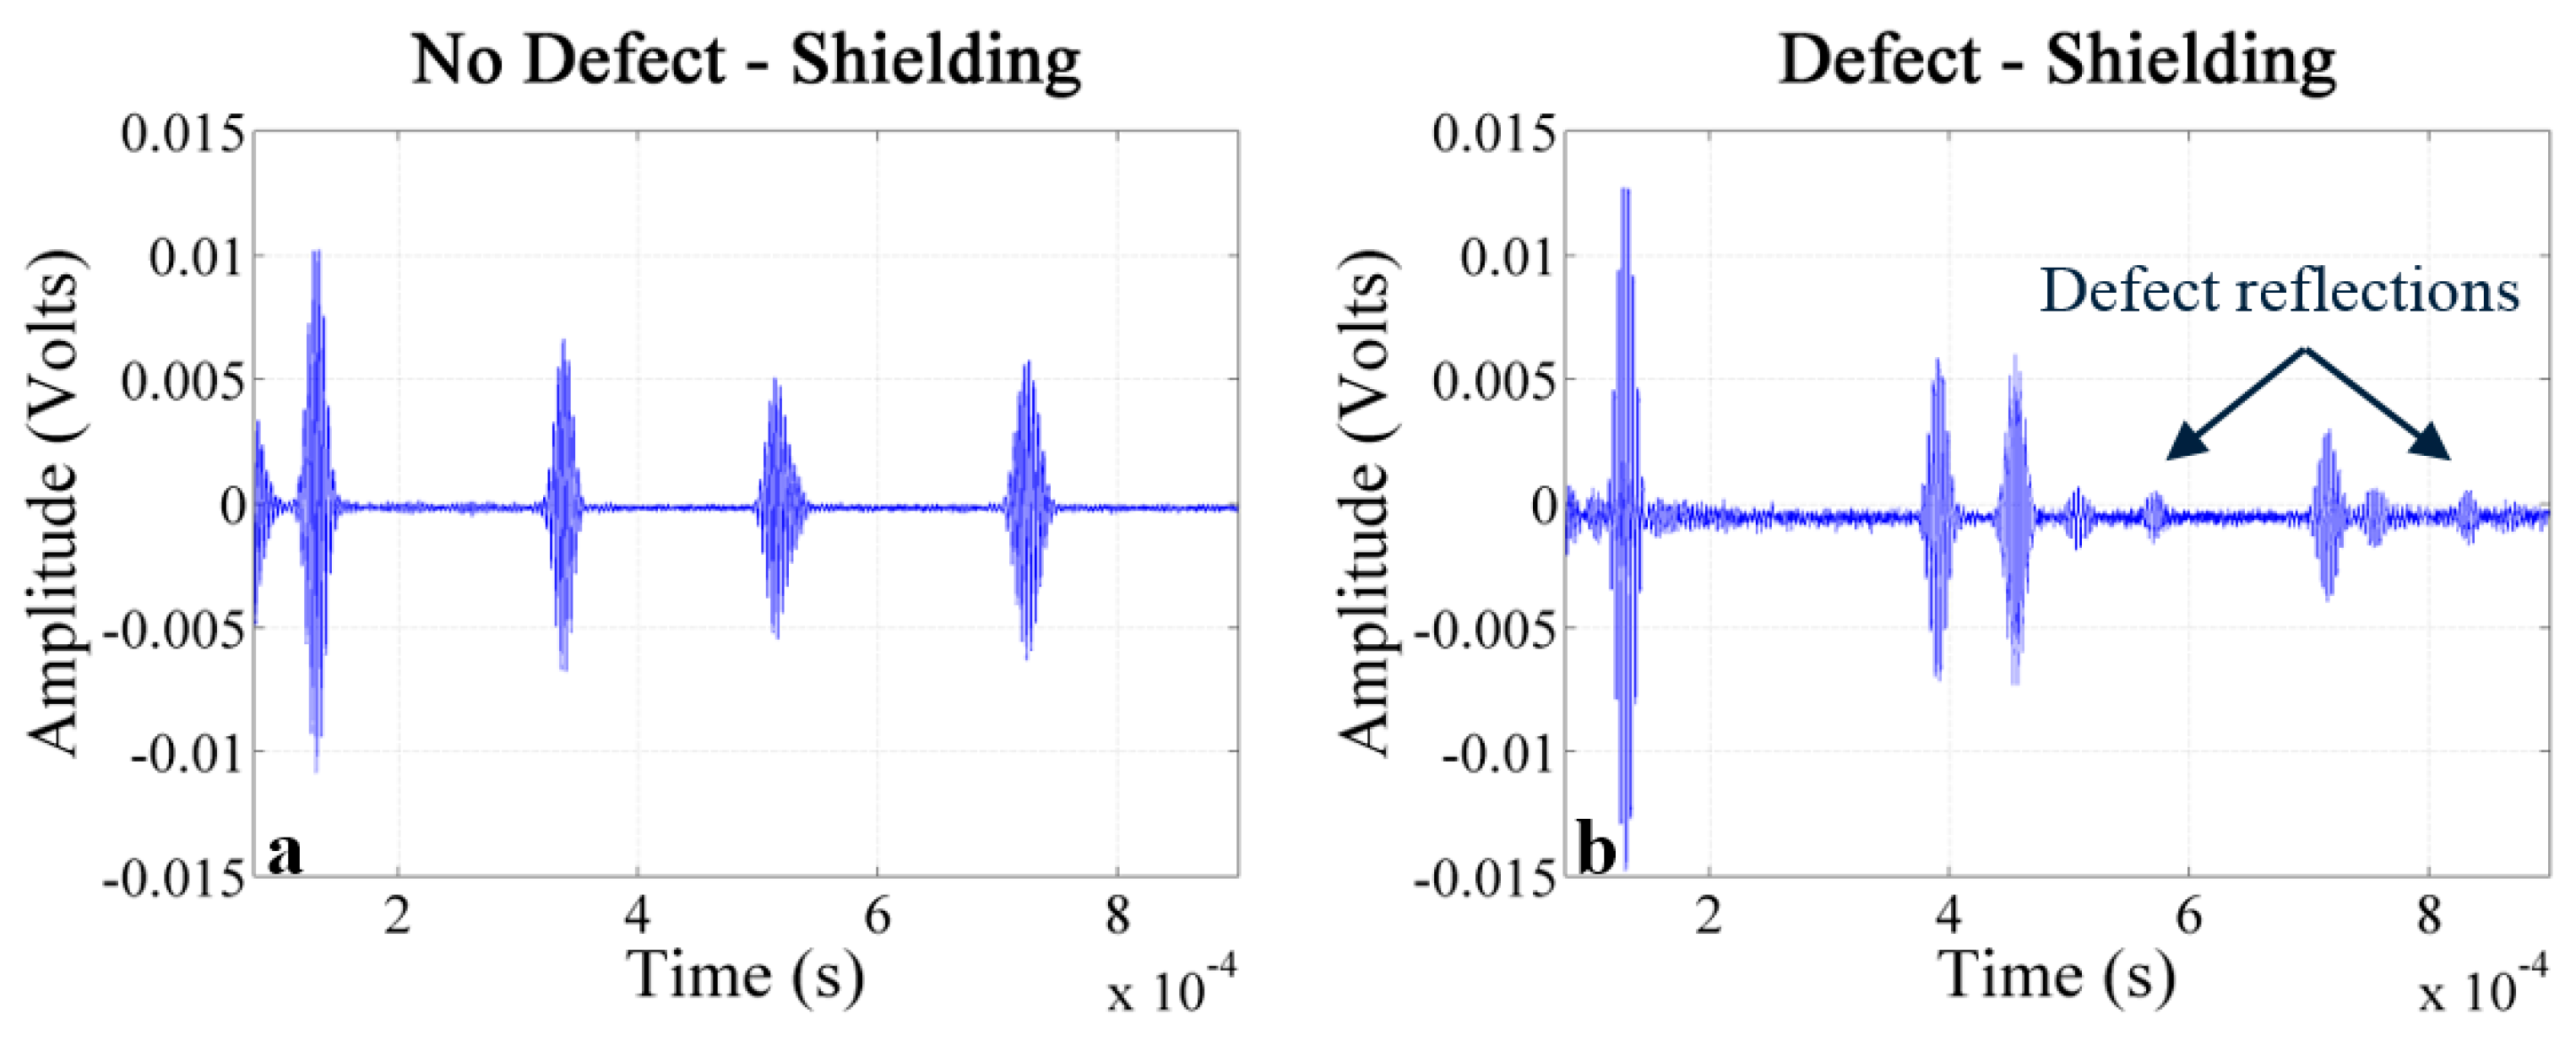
6.1. Room Temperature Experiments

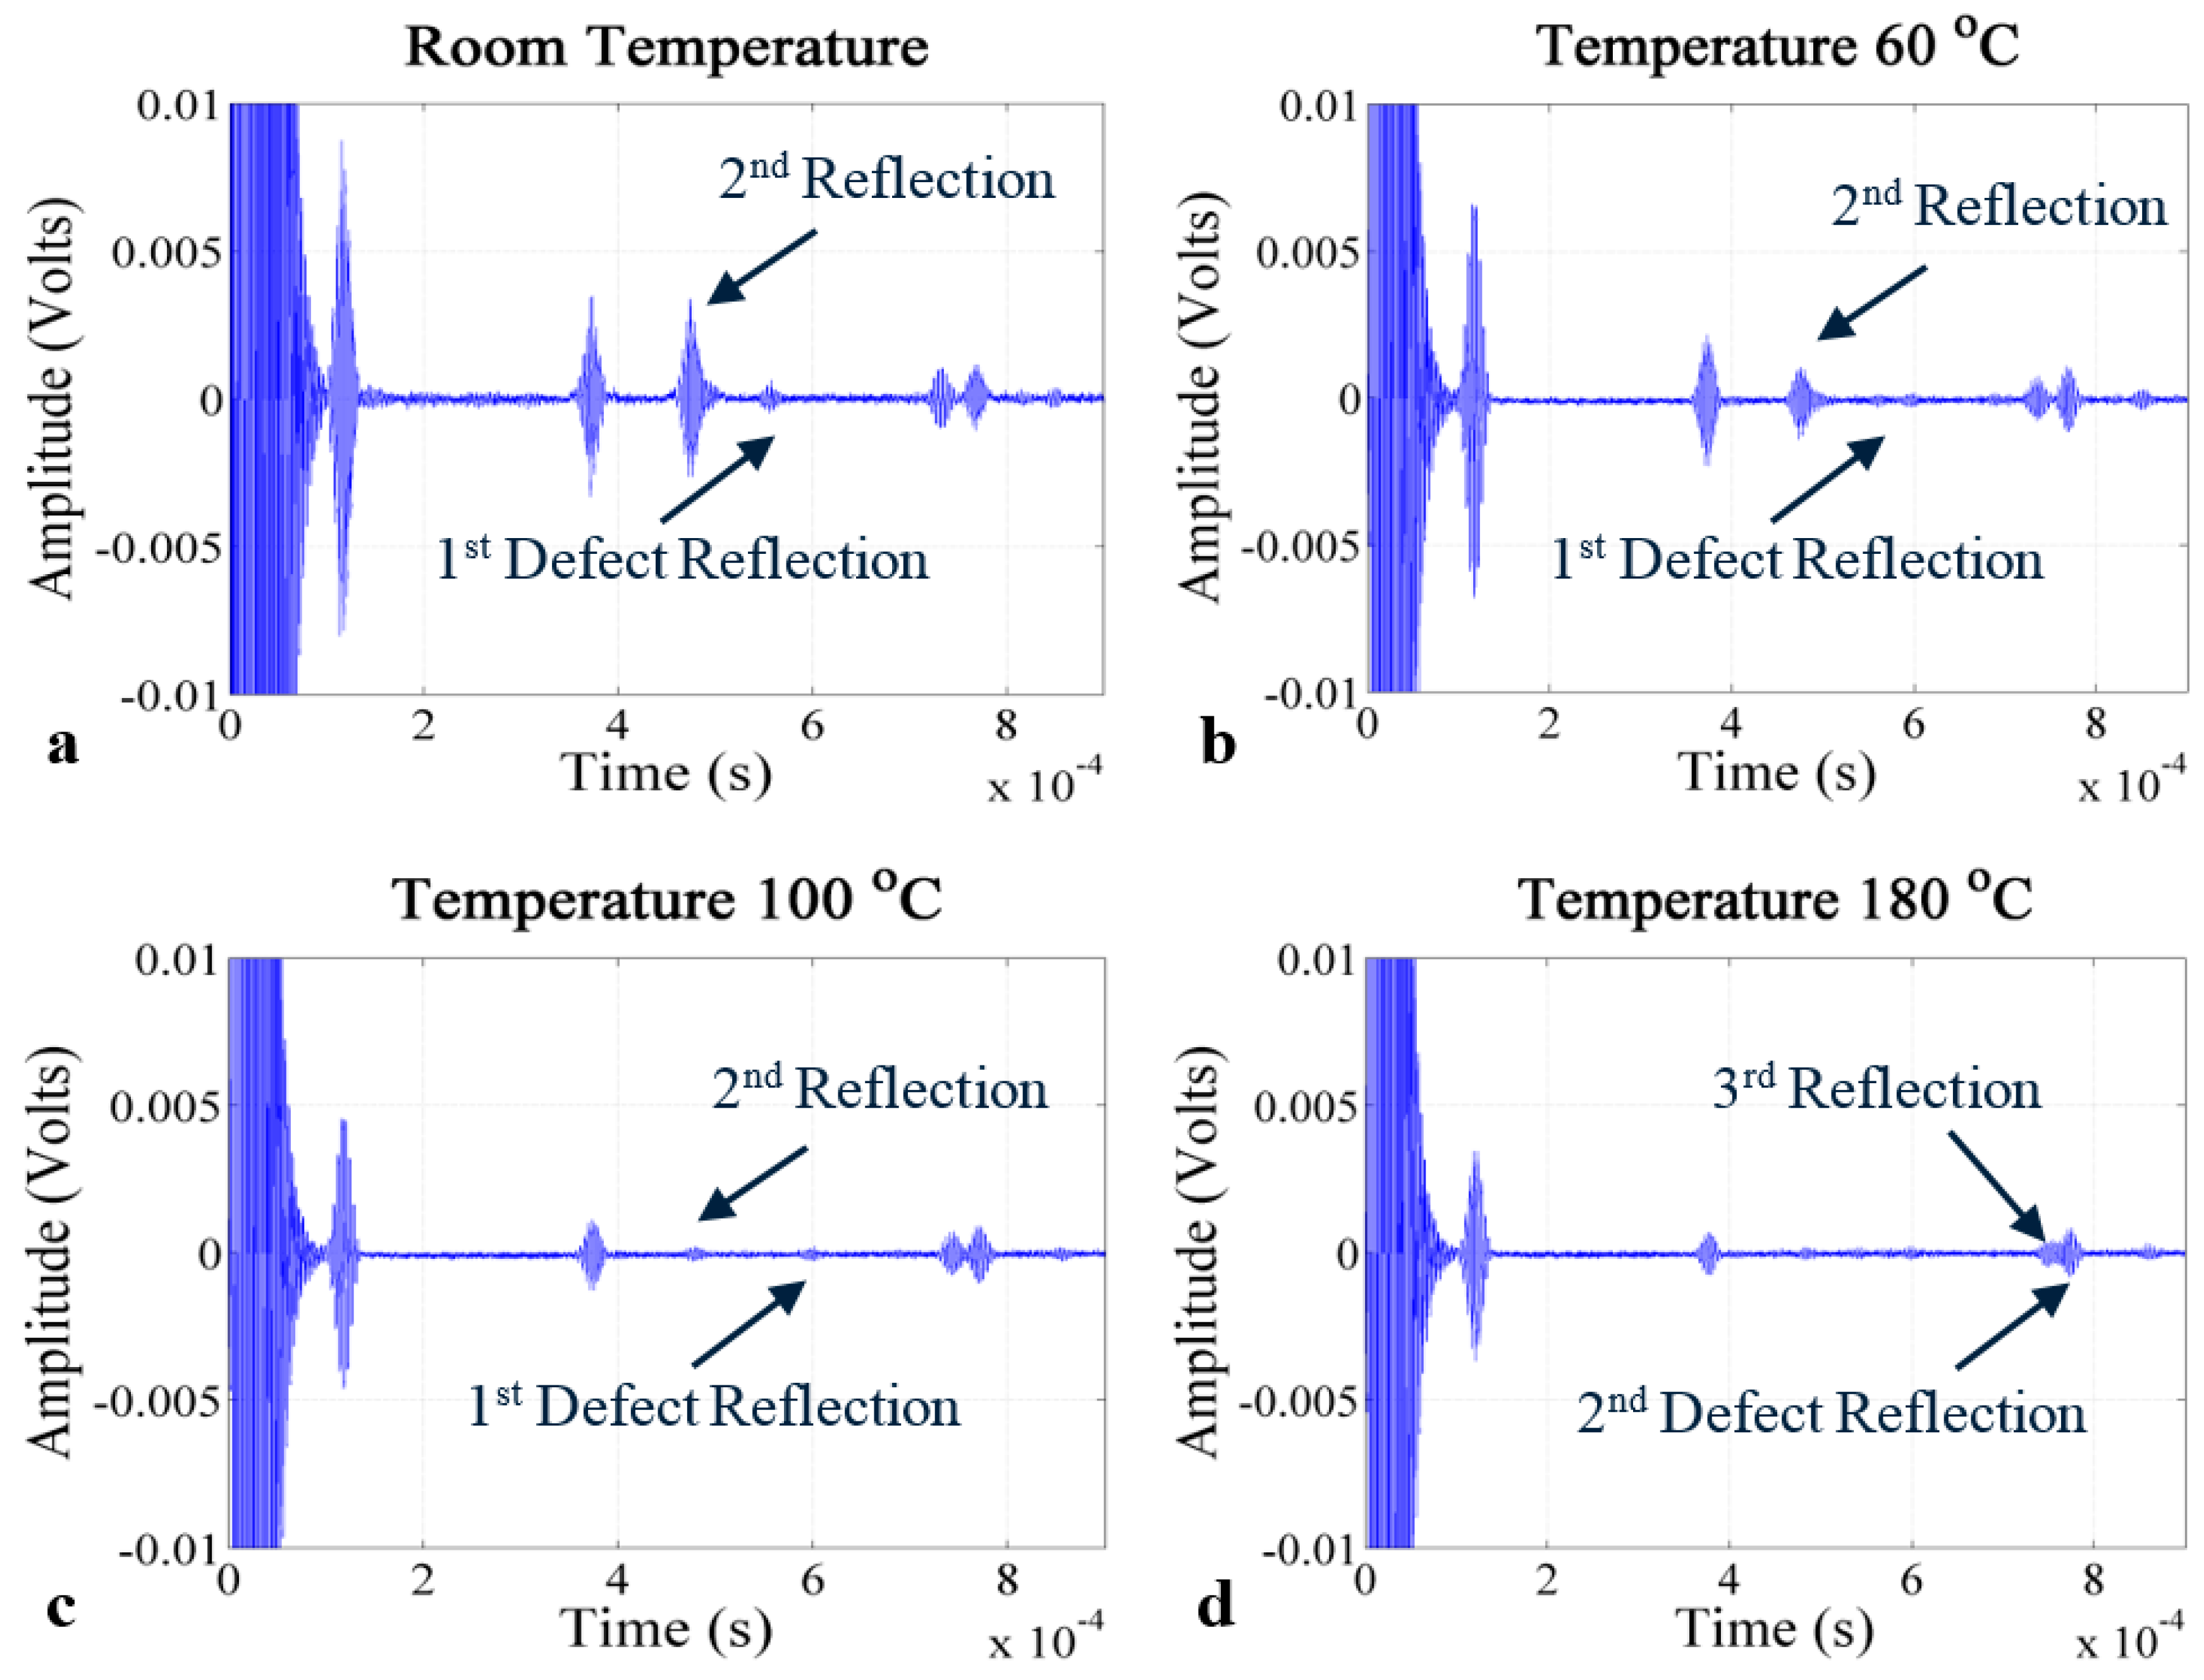
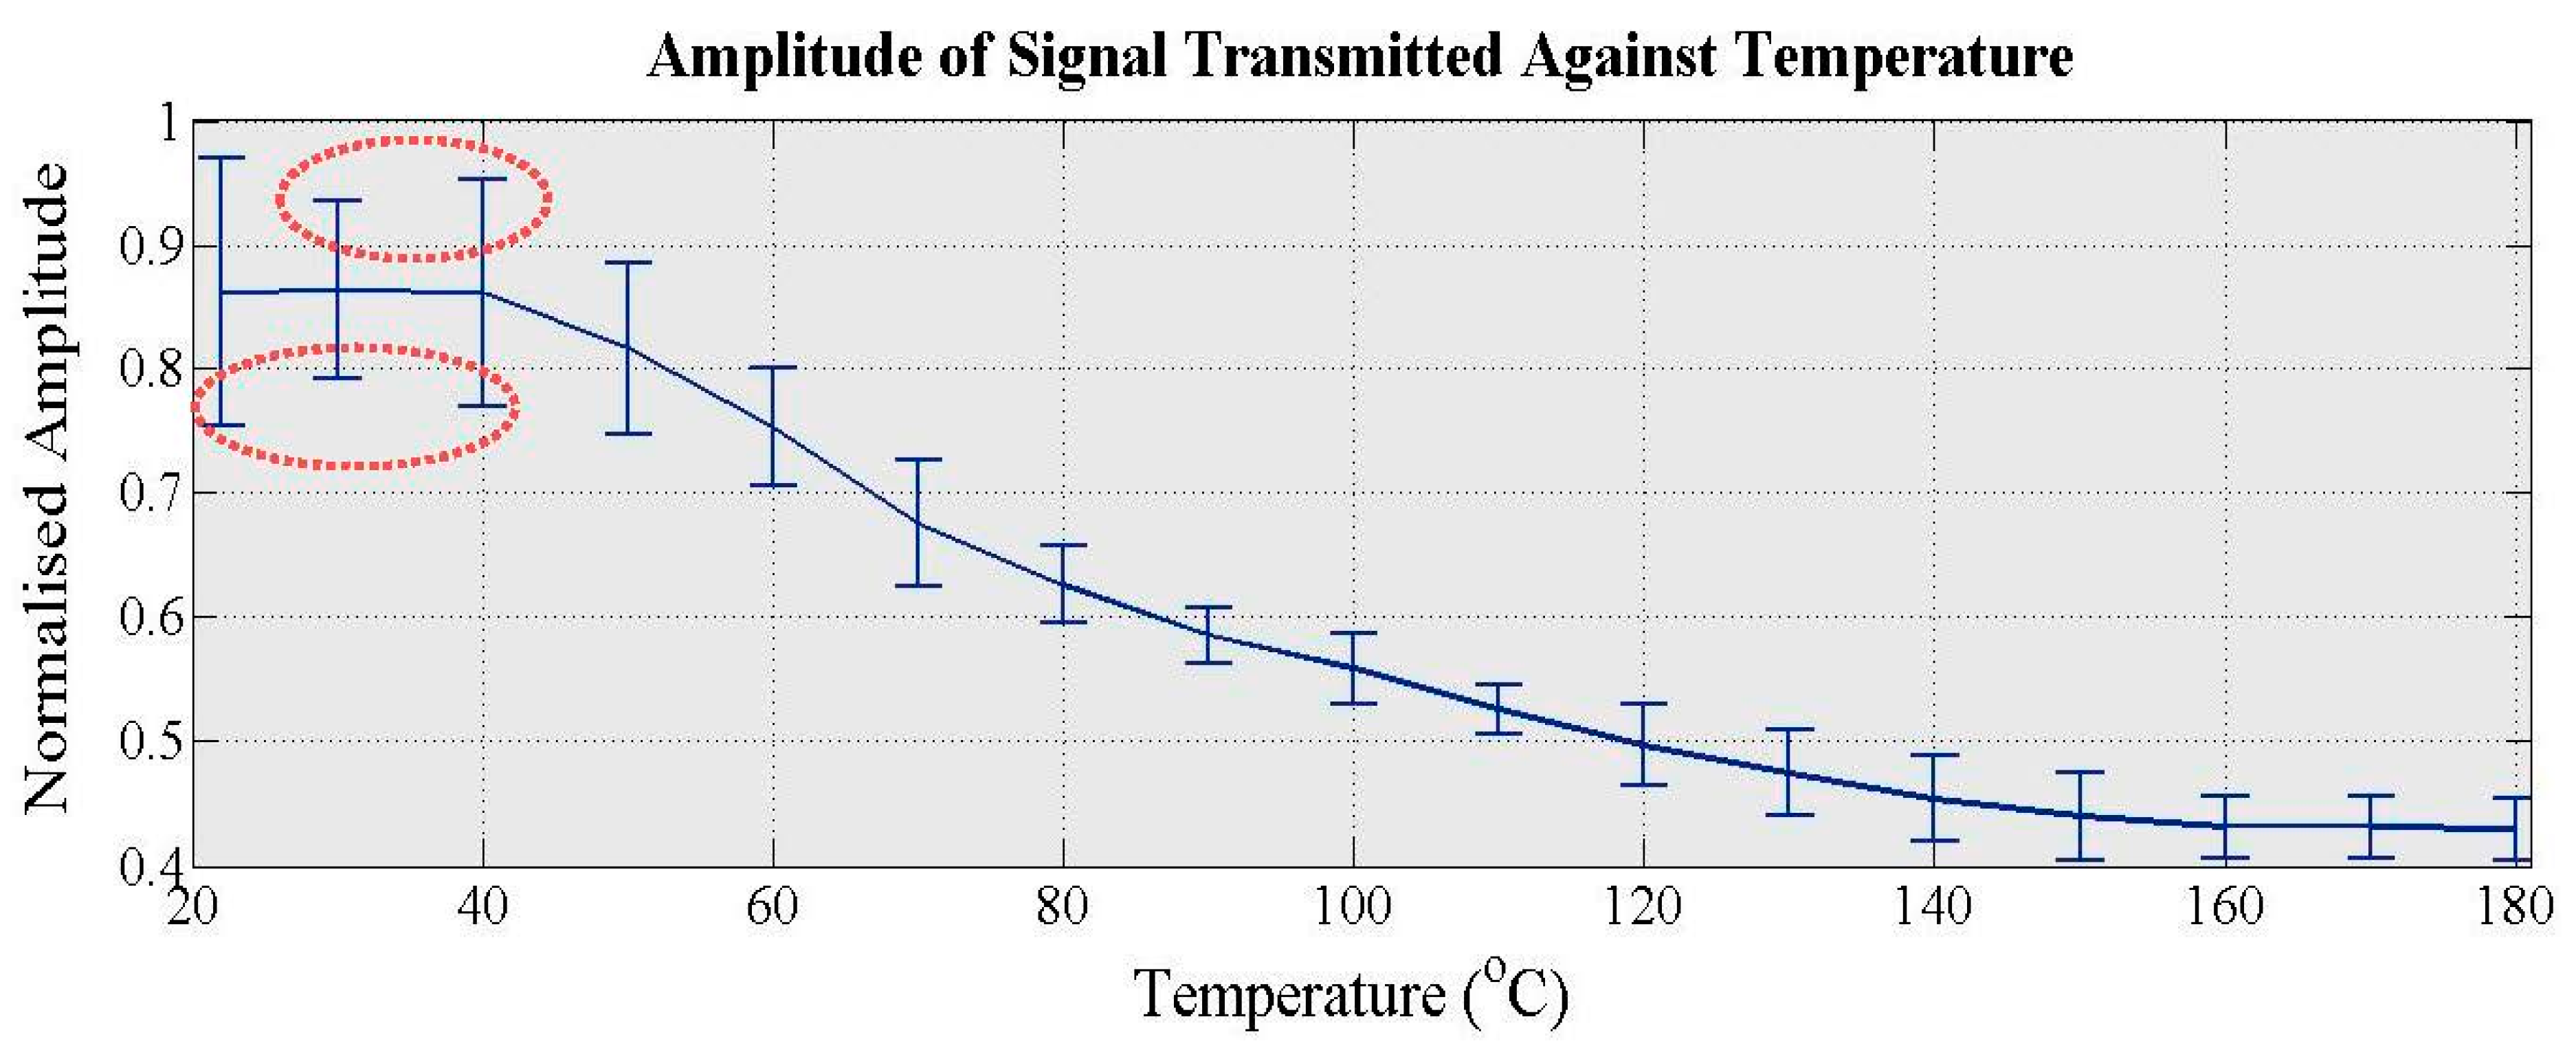
6.2. High-Temperature Experiments

7. Conclusions and Future Work
Acknowledgments
Author Contributions
Conflicts of Interest
References
- Poullikkas, A. Economic analysis of power generation from parabolic trough solar thermal plants for the Mediterranean region—A case study for the island of Cyprus. Renew. Sustain. Energy Rev. 2009, 13, 2474–2484. [Google Scholar] [CrossRef]
- Staff, C.W. Industry Experts Trumpet Untold Solar Potential. 2013. Available online: http://www.constructionweekonline.com/article-23701-industry-experts-trumpet-untold-solar-potential/ (accessed on 12 March 2015).
- Taggart, S. Parabolic troughs: Concentrating Solar Power (CSP)’s Quiet Achiever. 2008. Available online: http://www.renewableenergyfocus.com/view/3390/parabolic-troughs-concentrating-solar-power-csp-s-quiet-achiever (accessed on 12 March 2015).
- Steinfeld, A. Topics for Master/Bachelor Thesis and Semester Projects: Spectral Optical Properties of Glass Envelopes of Parabolic trough Concentrators. Available online: http://www.pre.ethz.ch/teaching/topics/?id=87 (accessed on 18 August 2015).
- Guillot, S.; Faika, A.; Rakhmatullina, A.; Lambert, V.; Verona, E.; Echegut, P.; Bessadaa, C.; Calvet, N.; Py, X. Corrosion effects between molten salts and thermal storage material for concentrated solar power plants. Appl. Energy 2012, 94, 174–181. [Google Scholar] [CrossRef]
- Herrmann, U.; Kearney, D.W. Survey of Thermal Energy Storage for Parabolic Trough Power Plants. J. Sol. Energy Eng. 2002, 124, 145–152. [Google Scholar] [CrossRef]
- Papaelias, M.; Cheng, L.; Kogia, M.; Mohimi, A.; Kappatos, V.; Selcuk, C.; Constantinou, L.; Muñoz, C.Q.G.; Marquez, F.P.G.; Gan, T.H. Inspection and structural health monitoring techniques for concentrated solar power plants. Renew. Energy 2015, 85, 1178–1191. [Google Scholar] [CrossRef]
- Lee, J.L.; Hu, L.W.; Saha, P.; Kazimi, M.S. Numerical analysis of thermal striping induced high cycle thermal fatigue in a mixing tee. Nucl. Eng. Des. 2009, 239, 833–839. [Google Scholar] [CrossRef]
- Noguchi, Y.; Okada, H.; Semba, H.; Yoshizawa, M. Isothermal, thermo-mechanical and bithermal fatigue life of Ni base alloy HR6W for piping in 700 °C USC power plants. Procedia Eng. 2011, 11, 1127–1132. [Google Scholar] [CrossRef]
- Jinu, G.R.; Sathiya, P.; Ravichandran, G.; Rathinam, A. Comparison of thermal fatigue behaviour of ASTM A 213 grade T-92 base and weld tubes. J. Mech. Sci. Technol. 2010, 24, 1067–1076. [Google Scholar] [CrossRef]
- Sunny, S.; Patil, R.; Singh, K. Assessment of thermal fatigue failure for BS 3059 boiler tube experimental procedure using smithy furnace. Int. J. Emerg. Technol. Adv. Eng. 2012, 2, 391–398. [Google Scholar]
- Posteraro, K. Thwart Corrosion under Industrial Insulation. Chem. Eng. Prog. 1999, 95, 43–47. [Google Scholar]
- Halliday, M. Preventing corrosion under insulation-new generation solutions for an age old problem. J. Prot. Coat. Linings 2007, 24, 24–36. [Google Scholar]
- De Vogelaere, F. Corrosion under insulation. Process. Saf. Prog. 2009, 28, 30–35. [Google Scholar] [CrossRef]
- Kumar, M.S.; Sujata, M.; Venkataswamy, M.A.; Bhaumik, S.K. Failure analysis of a stainless steel pipeline. Eng. Fail. Anal. 2008, 15, 497–504. [Google Scholar] [CrossRef]
- Stine, W.B.; Harrigan, R.W. Solar Energy Systems Design; John Wiley and Sons, Inc.: New York, NY, USA, 1986. [Google Scholar]
- Hutchins, D.A.; Saleh, C.; Moles, M.; Farahbahkhsh, B. Ultrasonic NDE Using a Concentric Laser/EMAT System. J. Nondestruct. Eval. 1990, 9, 247–261. [Google Scholar] [CrossRef]
- Kirk, K.J.; Lee, C.K.; Cochran, S. Ultrasonic thin film transducers for high-temperature NDT. Insight 2005, 47, 85–87. [Google Scholar] [CrossRef]
- Momona, S.; Moevus, M.; Godina, N.; R’Mili, M.; Reynauda, P.; Fayolle, G. Acoustic emission and lifetime prediction during static fatigue tests onceramic-matrix-composite at high temperature under air. Compos. A Appl. Sci. Manuf. 2010, 41, 913–918. [Google Scholar] [CrossRef]
- Shen, G.; Li, T. Infrared thermography for high temperature pipe. Insight 2007, 49, 151–153. [Google Scholar] [CrossRef]
- Beattie, G. Acoustic emission principles and instrumentation. J. Acoust. Emiss. 1983, 2, 95–128. [Google Scholar]
- Hagemaier, D.J. Fundamentals of Eddy Current Testing; American Society for Nondestructive, Testing: Columbus, OH, USA, 1990. [Google Scholar]
- Malmo, J.T.; Jøkberg, O.J.; Slettemoen, G.A. Interferometric testing at very high temperatures by TV holography (ESPI). Exp. Mech. 1998, 28, 315–321. [Google Scholar] [CrossRef]
- Silk, M.G.; Bainton, K.F. The propagation in metal tubing of ultrasonic wave modes equivalent to Lamb waves. Ultrasonics 1979, 17, 11–19. [Google Scholar] [CrossRef]
- Pfander, M.; Lupfert, E.; Pistor, P. Infrared temperature measurements on solar trough absorber tubes. Sol. Energy 2007, 81, 629–635. [Google Scholar] [CrossRef]
- Cawley, P.; Alleyne, D. The use of Lamb waves for the long range inspection of large structures. Ultrasonics 1996, 34, 287–290. [Google Scholar] [CrossRef]
- Hirao, M.; Ogi, H. A SH-wave EMAT technique for gas pipeline inspection. NDT E Int. 1999, 32, 127–132. [Google Scholar] [CrossRef]
- Bottger, W.; Schneider, H.; Weingarten, W. Prototype EMAT system for tube inspection with guided ultrasonic waves. Nucl. Eng. Des. 1986, 102, 369–376. [Google Scholar] [CrossRef]
- Wilcox, P.; Lowe, M.; Cawley, P. Omnidirectional guided wave inspection of large metallic plate structures using an EMAT array. IEEE Trans. Ultrason. Ferroelectr. Freq. Control 2005, 52, 653–665. [Google Scholar] [CrossRef] [PubMed]
- Andruschak, N.; Saletes, I.; Filleter, T.; Sinclair, A. An NDT guided wave technique for the identification of corrosion defects at support locations. NDT E Int. 2015, 75, 72–79. [Google Scholar] [CrossRef]
- Burrows, S.E.; Fan, Y.; Dixon, S. High temperature thickness measurements of stainless steel and low carbon steel using electromagnetic acoustic transducers. NDT E Int. 2014, 68, 73–77. [Google Scholar] [CrossRef]
- Hernandez, V.F. Pulsed-Electromagnet EMAT for High Temperature Applications. Ph.D. Thesis, University of Warwick, Warwick, UK, 2011. [Google Scholar]
- Idris, A.; Edwards, C.; Palmer, S.B. Acoustic wave measurement at elevated temperature using a pulsed laser generator and an Electromagnetic Acoustic Transducer detector. Nondestruct. Test. Eval. 1994, 11, 195–213. [Google Scholar] [CrossRef]
- Dixon, S.; Edwards, C.; Palmer, S.B. High-accuracy non-contact ultrasonic thickness gauging of aluminium sheet using electromagnetic acoustic transducer. Ultrasonics 2001, 39, 445–453. [Google Scholar] [CrossRef]
- Jian, X.; Dixon, S.; Edwards, R.S.; Morrison, J. Coupling mechanism of an EMAT. Ultrasonics 2006, 44, 653–656. [Google Scholar] [CrossRef] [PubMed]
- Ribichini, R.; Cegla, F.; Nagy, P.B.; Cawley, P. Study and Comparison of Different EMAT Configurations for SH Wave Inspection. IEEE Trans. Ultrason. Ferroelectr. Freq. Control 2011, 58, 2571–2581. [Google Scholar] [CrossRef] [PubMed]
- Gaultier, J.; Mustafa, V.; Chahbaz, A. EMAT Generation of Polarized Shear Waves for Pipe Inspection. In Proceeding of the 4th PACNDT, Toronto, ON, Canada, 14–18 September 1998.
- Rose, J.L.; Lee, C.M.; Hay, T.R.; Cho, Y.; Park, I.K. Rail Inspection with Guided Waves. In Processing of the 12th A-PCNDT—Asia-Pacific Conference on NDT, Auckland, New Zealand, 5–10 November 2006.
- Jackel, P.; Niese, F. EMAT Application: Corrosion Detection with Guided Waves in Rod, Pipes and Plates. In Proceedings of the 11th European Conference on Non-Destructive Testing (ECNDT 2014), Prague, Czech, 6–10 October 2014.
- Hübschen, G. Generation of Horizontally Polarized Shear Waves with EMAT Transducers. e-J. Nondestruct. Test. 1998, 3, 1–7. [Google Scholar]
- Kogia, M.; Mohimi, A.; Liang, C.; Kappatos, V.; Selcuk, C.; Gan, T.H. High temperature Electromagnetic Acoustic Transducer for the inspections of jointed solar thermal tubes. In Proceedings of the First Young Professionals International Conference, Budapest, Hungary, 17–20 September 2014.
- Pulse Electronics, Understanding Common Mode Noise. Available online: www.pulseelectronics.com/download/3124/g204/pdf (accessed on 10 November 2015).
- Winders, J. Autotransformers and Three-Winding Transformers. In Power Transformers: Principles and Applications, 1st ed.; Marcel Dekker: New York, NY, USA, 2002. [Google Scholar]
© 2015 by the authors; licensee MDPI, Basel, Switzerland. This article is an open access article distributed under the terms and conditions of the Creative Commons Attribution license (http://creativecommons.org/licenses/by/4.0/).
Share and Cite
Kogia, M.; Cheng, L.; Mohimi, A.; Kappatos, V.; Gan, T.-H.; Balachandran, W.; Selcuk, C. Electromagnetic Acoustic Transducers Applied to High Temperature Plates for Potential Use in the Solar Thermal Industry. Appl. Sci. 2015, 5, 1715-1734. https://doi.org/10.3390/app5041715
Kogia M, Cheng L, Mohimi A, Kappatos V, Gan T-H, Balachandran W, Selcuk C. Electromagnetic Acoustic Transducers Applied to High Temperature Plates for Potential Use in the Solar Thermal Industry. Applied Sciences. 2015; 5(4):1715-1734. https://doi.org/10.3390/app5041715
Chicago/Turabian StyleKogia, Maria, Liang Cheng, Abbas Mohimi, Vassilios Kappatos, Tat-Hean Gan, Wamadeva Balachandran, and Cem Selcuk. 2015. "Electromagnetic Acoustic Transducers Applied to High Temperature Plates for Potential Use in the Solar Thermal Industry" Applied Sciences 5, no. 4: 1715-1734. https://doi.org/10.3390/app5041715