
Spatially Resolved Analysis of Bragg Selectivity


Department of Chemistry, Technische Universität Berlin, Strasse des 17. Juni 135, Berlin 10623, Germany
Appl. Sci. 2015, 5(4), 1064-1075; https://doi.org/10.3390/app5041064
Submission received: 13 October 2015
/
Revised: 28 October 2015
/
Accepted: 2 November 2015
/
Published: 5 November 2015
(This article belongs to the Section Optics and Lasers)
Abstract
:This paper targets an inherent control of optical shrinkage in photosensitive polymers, contributing by means of spatially resolved analysis of volume holographic phase gratings. Point by point scanning of the local material response to the Gaussian intensity distribution of the recording beams is accomplished. Derived information on the local grating period and grating slant is evaluated by mapping of optical shrinkage in the lateral plane as well as through the depth of the layer. The influence of recording intensity, exposure duration and the material viscosity on the Bragg selectivity is investigated.
1. Introduction
The interest in development, characterisation and optimization of novel, functionally-tailored photosensitive materials is omnipresent. This is mainly due to the wide-ranging possibilities for future applications, from volume holographic memory over 3D imaging and waveguides [1,2,3,4], up to optical sensing, photonic circuits and integrated optics [5,6,7]. Photosensitive polymers are of particular interest. The underlying mechanism of hologram formation is attributed to a photo-induced change of the refractive index [8,9].
Research efforts are concentrated on material composition, processing and sample fabrication on the one hand [7,8,9,10], and on techniques and methods applied for recording and subsequent analysis on the other hand [7,9,11,12,13,14,15,16]. In each case, there is a particular need to meet the high demands on precision and repetitive accuracy, accompanying volume holographic operations. Beyond mechanical stability of the holographic setup, inherent stability of the photosensitive material constitutes an underestimated influential factor for hologram formation and performance [16,17]. Long-term stability depends on intrinsic material features, significantly influencing the course of the grating formation, as well as on temperature and thermal history [18]. The UV curing and baking processes are known to significantly affect the film shrinkage and swelling behaviour [13,19]. The layer thickness represents a crucial factor for the selectivity of optical elements and for storage capacity of memories [18]. However, with thick films, it is more difficult to comply with the stability requirements [7]. As a consequence, viable shrinkage control is needed [16].
Optical shrinkage, comprising of mechanical deformations of the volume on the one hand and a change of the average refractive index on the other hand [14], proceeds inevitably parallel to the grating formation [13]. Low optical shrinkage during holographic recording is desired, since this is linked to a constant functionality of the final optical element. Optical shrinkage is accompanied by Bragg angle detuning as a result of altered grating constants or modified refractive index. The Bragg selectivity, however, determines the optical functionality [13,20]. Preliminary results suggest, that a constant functionality beyond high volume stability can be realized by means of an increase of the average refractive index, compensating the impact of mechanical shrinkage associated with photo-induced crosslinking [13].
In general, there are three different approaches to reduce optical shrinkage. The first deals with advanced material compositions [16,21,22,23], including the incorporation of inorganic substances [10,24]. The second possibility is to apply special material processing, such as pre-imaging, incoherent-light exposure [25,26]. The third approach concentrates on the influence of accessible parameters, namely recording intensity, exposure duration and the material’s viscosity to control and adjust the optical shrinkage [13].
The present paper follows such an inherent shrinkage control and contributes by means of spatially resolved analysis of the grating. Specifically, this is accomplished by means of scanning the lateral plane of transmission type gratings to obtain local values of the grating period Λ and the grating slant Φ. For this purpose, a lateral scan method is introduced, keeping track of the hologram shape, which is determined by the material response to the Gaussian intensity distribution of the recording beams. This is exploited to gain detailed information on the Bragg selectivity.
2. Experimental Section
2.1. Hologram Generation
All investigations are based on one-dimensional, plane-wave, transmission type gratings. The free-surface epoxy-based polymer samples, prepared by micro resist technology GmbH, feature a layer thickness of 200 μm. The corresponding mechanism of polymerization is a cationic ring-opening polymerization (CROP). Symmetric recording geometry results in unslanted gratings with periodicity of Λ ≈ 2μm. Holographic exposure is performed by two freely propagating, s-polarized recording beams (λ = 405nm), 2 mm in diameter. The volumetric shrinkage of this material system is 2% in average [7]. For more details on sample preparation, hologram recording and specific material characteristics, see [7,9,11,13].
The material’s viscosity depends on the duration of the pre-exposure bake, carried out on a hotplate (80 °C), subsequent to the spincoating. Low and high viscosity are accomplished by means of short (30 min) and long (180 min) prebake duration, respectively.
2.2. Lateral Scanning
Analysis of the final holograms is accomplished in a rotation-scan setup with collimated probe beam. The transmitted signal of a 543 nm HeNe laser is detected while the hologram under test is rotated. From the angular resolved transmission information, the grating constant Λ by use of Equation (1) is derived, while the grating slant Φ is determined by the bisecting line of the angular positions of the first diffraction orders.
The probe beam features a diameter of 0.2 mm. Probing only a tenth of the exposed area is primarily for the purpose of measuring precision [7,27]. However, it also enables the scanning of the grating by moving the sample perpendicular to the optical axis. A sequence of rotation scans through the grating diameter constitutes a lateral scan. This analytical method allows the determination of the hologram characteristics along the sample surface. Thereupon, it is possible to compare and track respective properties from the centre of the grating to the edges, corresponding to the areas of highest and lowest recording intensity. As a consequence, spatial sequences of the grating parameters are derived, providing insight into the local material characteristics.
In order to approach spatially resolved information on the Bragg selectivity, the location-related output of the individual rotation scans must be correlated and compared with respect to the lateral position. Analysing the grating constant Λ and the grating slant Φ to such an extent, yields lateral progressions, i.e., Λ(x) and Φ(x) curves, respectively, to be interpreted in terms of material response and optical shrinkage effects.
Furthermore, every single lateral position is assigned to a certain local exposure dose, determined by the Gaussian intensity distribution of the recording beams. As a consequence, a lateral scan contains energetically resolved information as well. The respective allocation of the abscissa to the local energy density allows one to draw conclusions on the influence of the recording dose.
3. Results and Discussion
3.1. The Grating Constant Λ
The most straightforward method for spatially resolved analysis of the Bragg selectivity is to visualize the course of the local periodicity in the lateral plane. This aims to evaluate the information derived from lateral scans with respect to the grating constant Λ. Information about optical shrinkage can subsequently be obtained by comparison of the final structure, i.e., the measured value Λ, with the initial interference pattern, defined by the recording geometry:
where n is the average refractive index of the medium, λ the wavelength of exposure and Θ the angle, enclosed by the two recording beams in air.
As a first result from lateral analysis (see Figure 1), it can be demonstrated that the period is almost constant along the lateral position, or rather independent on the recording intensity, in case of short exposure duration:
This is consistent with previous results, obtained with regard the temporal development of the relative optical shrinkage (defined as ratio of optical shrinkage to diffraction efficiency), which has proven to be time invariant in the case of short exposure duration as well [13]. However, in cases of long exposure duration a certain dependency on the lateral position and on the duration of the exposure arises, i.e., Λ(I, texp) ≠ const., respectively.
Figure 1.
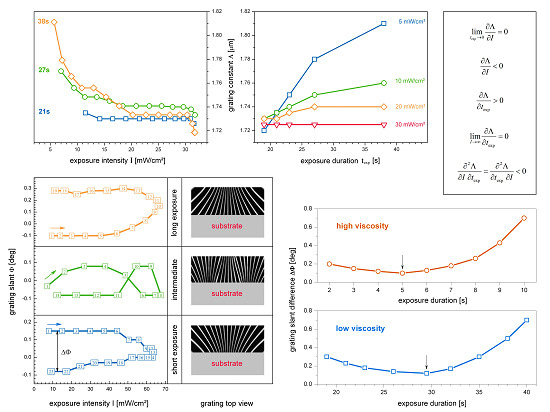
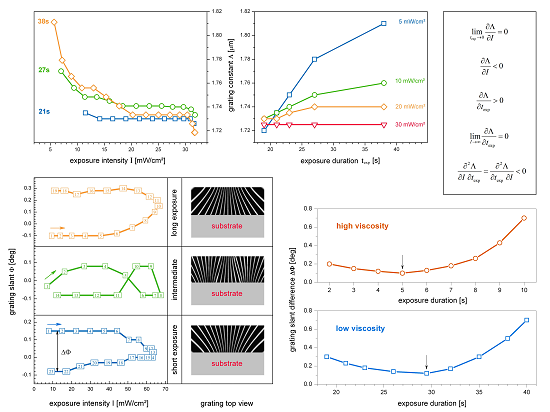
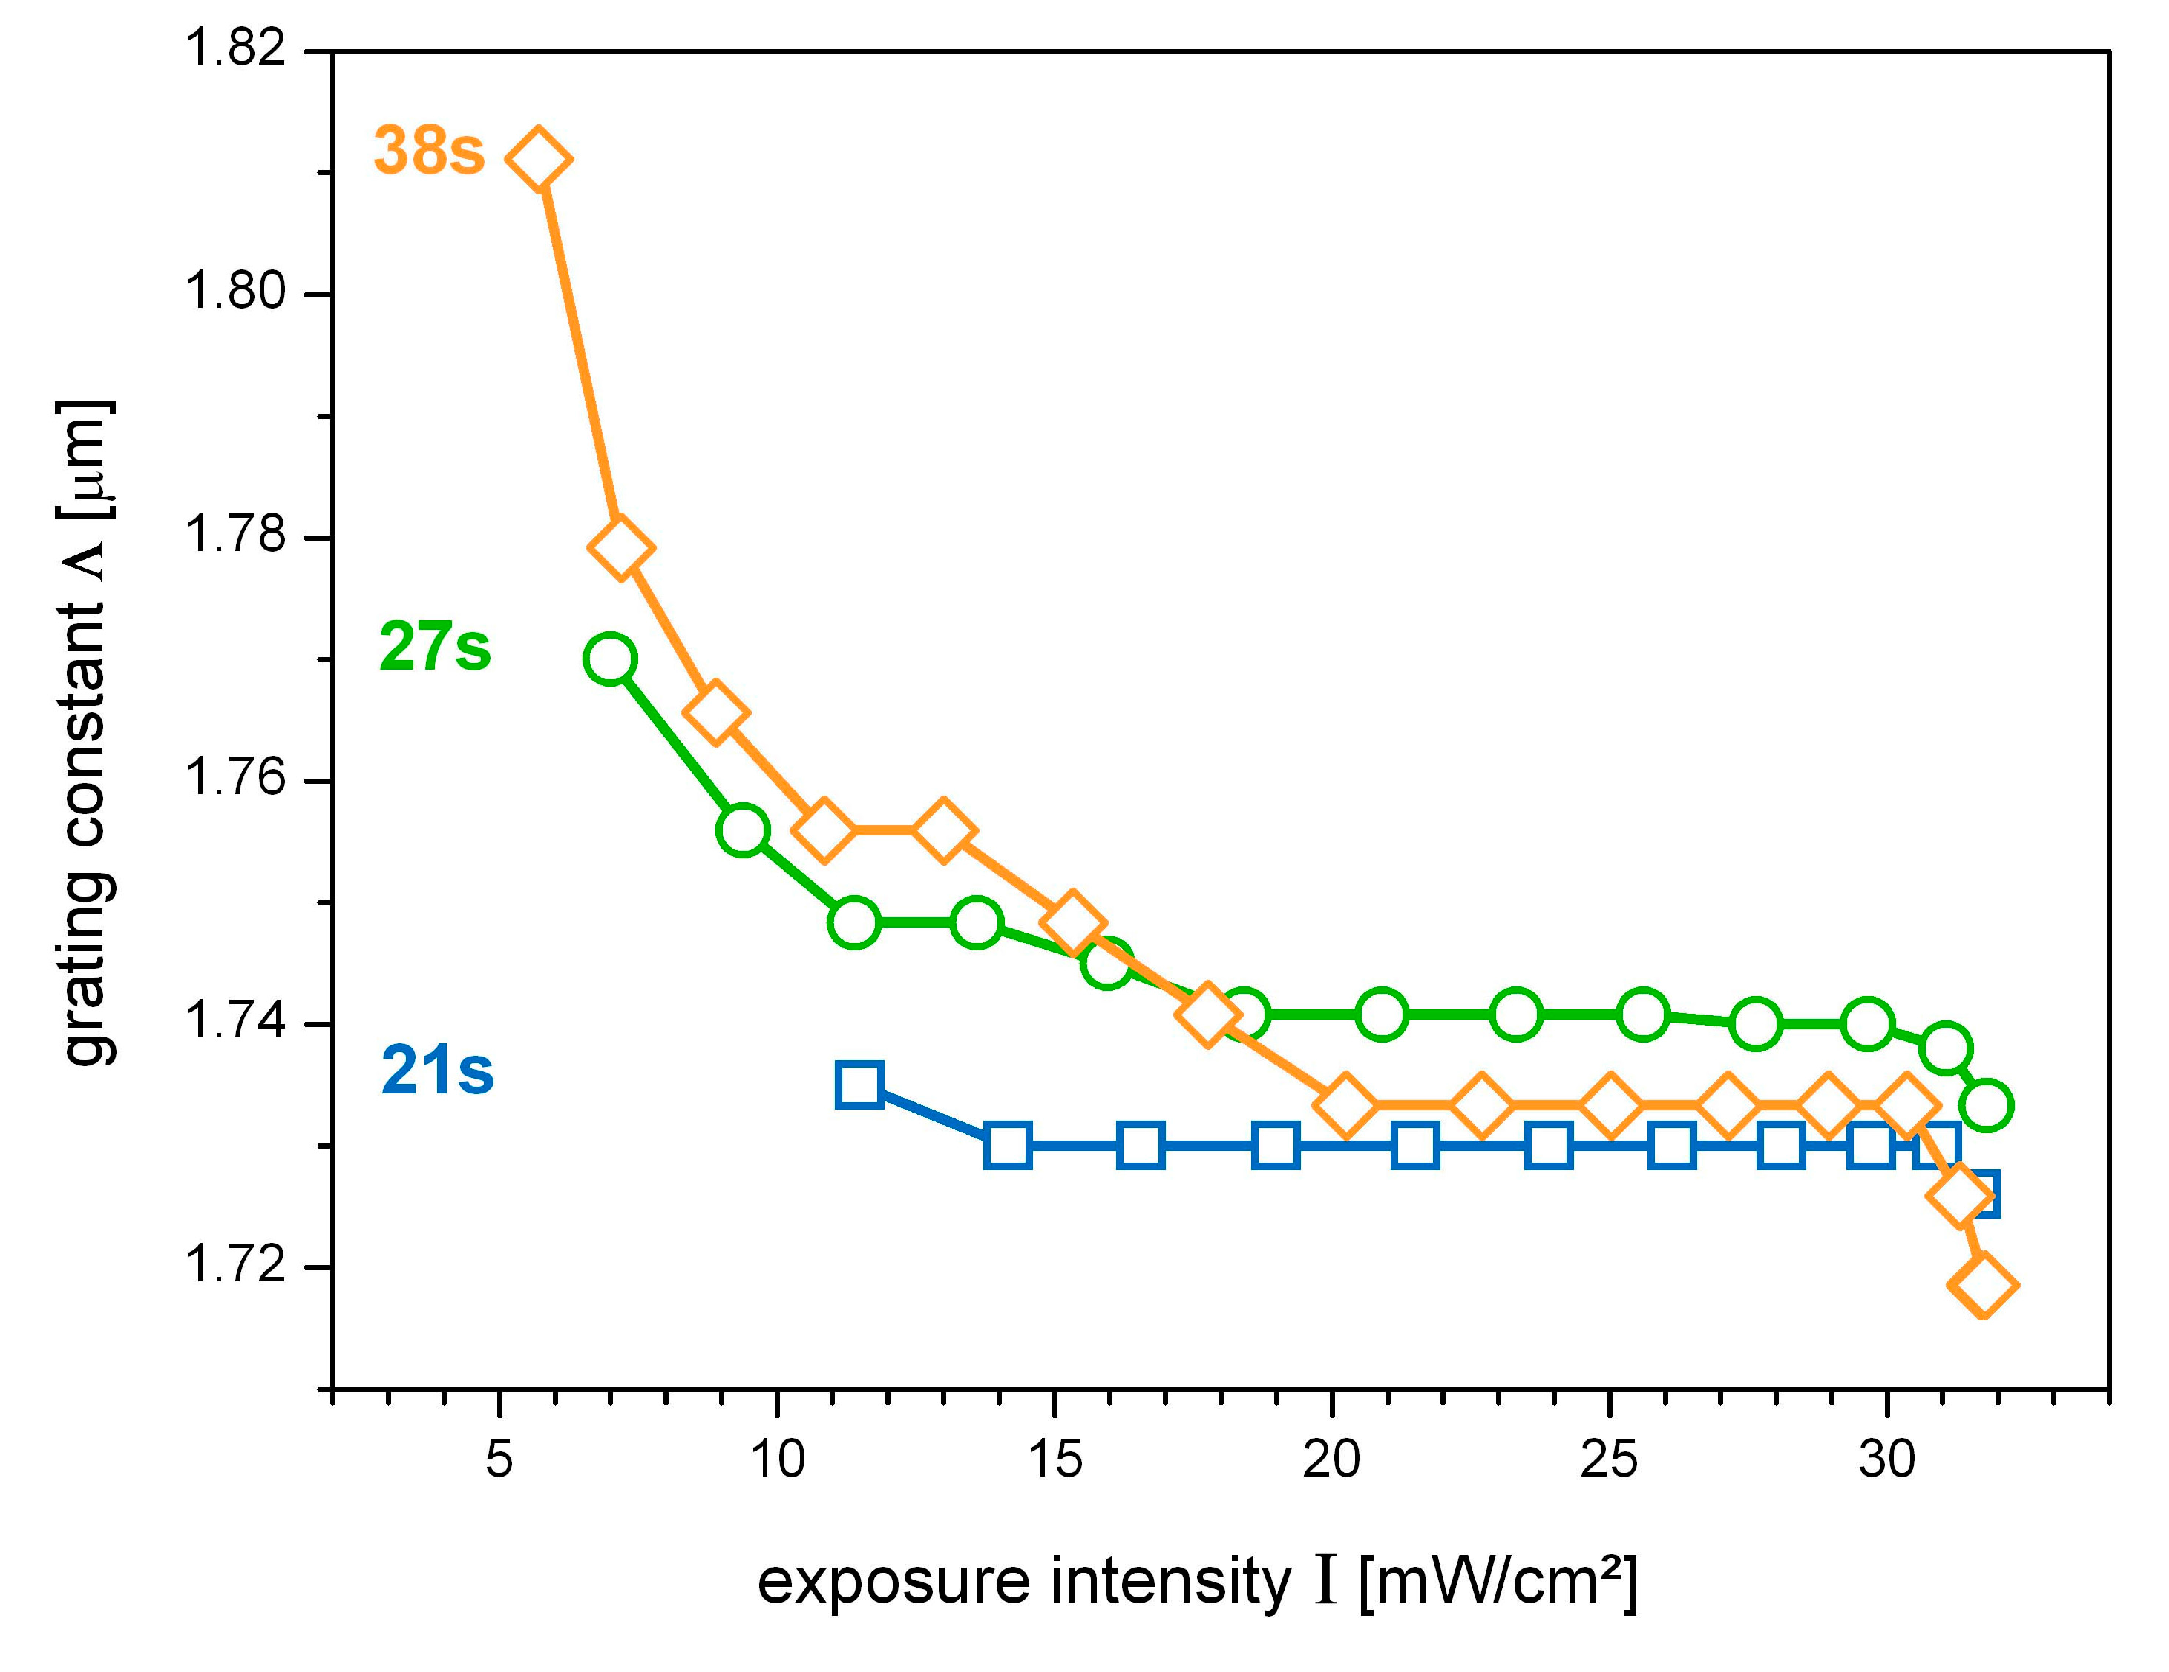
Lateral progressions of the grating constant Λ(I), derived from lateral scans. The longer the exposure duration, the more Λ decreases towards the centre of the grating. The period is almost constant for texp = 21 s (blue squares), while in case of texp = 27 s (green circles) and texp = 38 s (orange diamonds) a more and more intensity-dependent behavior arises.
Figure 1.
Lateral progressions of the grating constant Λ(I), derived from lateral scans. The longer the exposure duration, the more Λ decreases towards the centre of the grating. The period is almost constant for texp = 21 s (blue squares), while in case of texp = 27 s (green circles) and texp = 38 s (orange diamonds) a more and more intensity-dependent behavior arises.
3.1.1. Impact of the Recording Intensity: Λ(I)
Figure 1 shows lateral progressions of the grating constant, plotted against the recording intensity, for three different exposure durations. Measuring errors (not depicted in the figures) are below 0.3%.
In regards to Figure 1, the influence of the recording intensity becomes apparent in terms of quality as well as quantity. On the one hand, the grating period always shows a decrease towards the centre of the grating, i.e., Λ(I) exhibits a negative slope:
On the other hand, the impact of the exposure duration is demonstrated by the fact that the effect of a laterally decreasing periodicity is enhanced with increasing duration of exposure:
In the case of shorter exposure (21 s, blue curve in Figure 1), the grating constant decreases laterally by only 0.6%, which is only slightly above the error limits. In contrast to this, a long exposure duration (38 s, orange curve in Figure 1) results in a significant lateral decrease of 5%. This correlation finds expression in Equation (4) and is in line with results from studies of the shrinkage caused by holographic grating formation in acrylamide based photopolymer film, where higher shrinkage was measured for recording with lower intensity and longer time of exposure [28]. Furthermore, the dependency of the material response on the recording intensity is in compliance with results from time resolved investigations [9].
3.1.2. Impact of the Exposure Duration: Λ(texp)
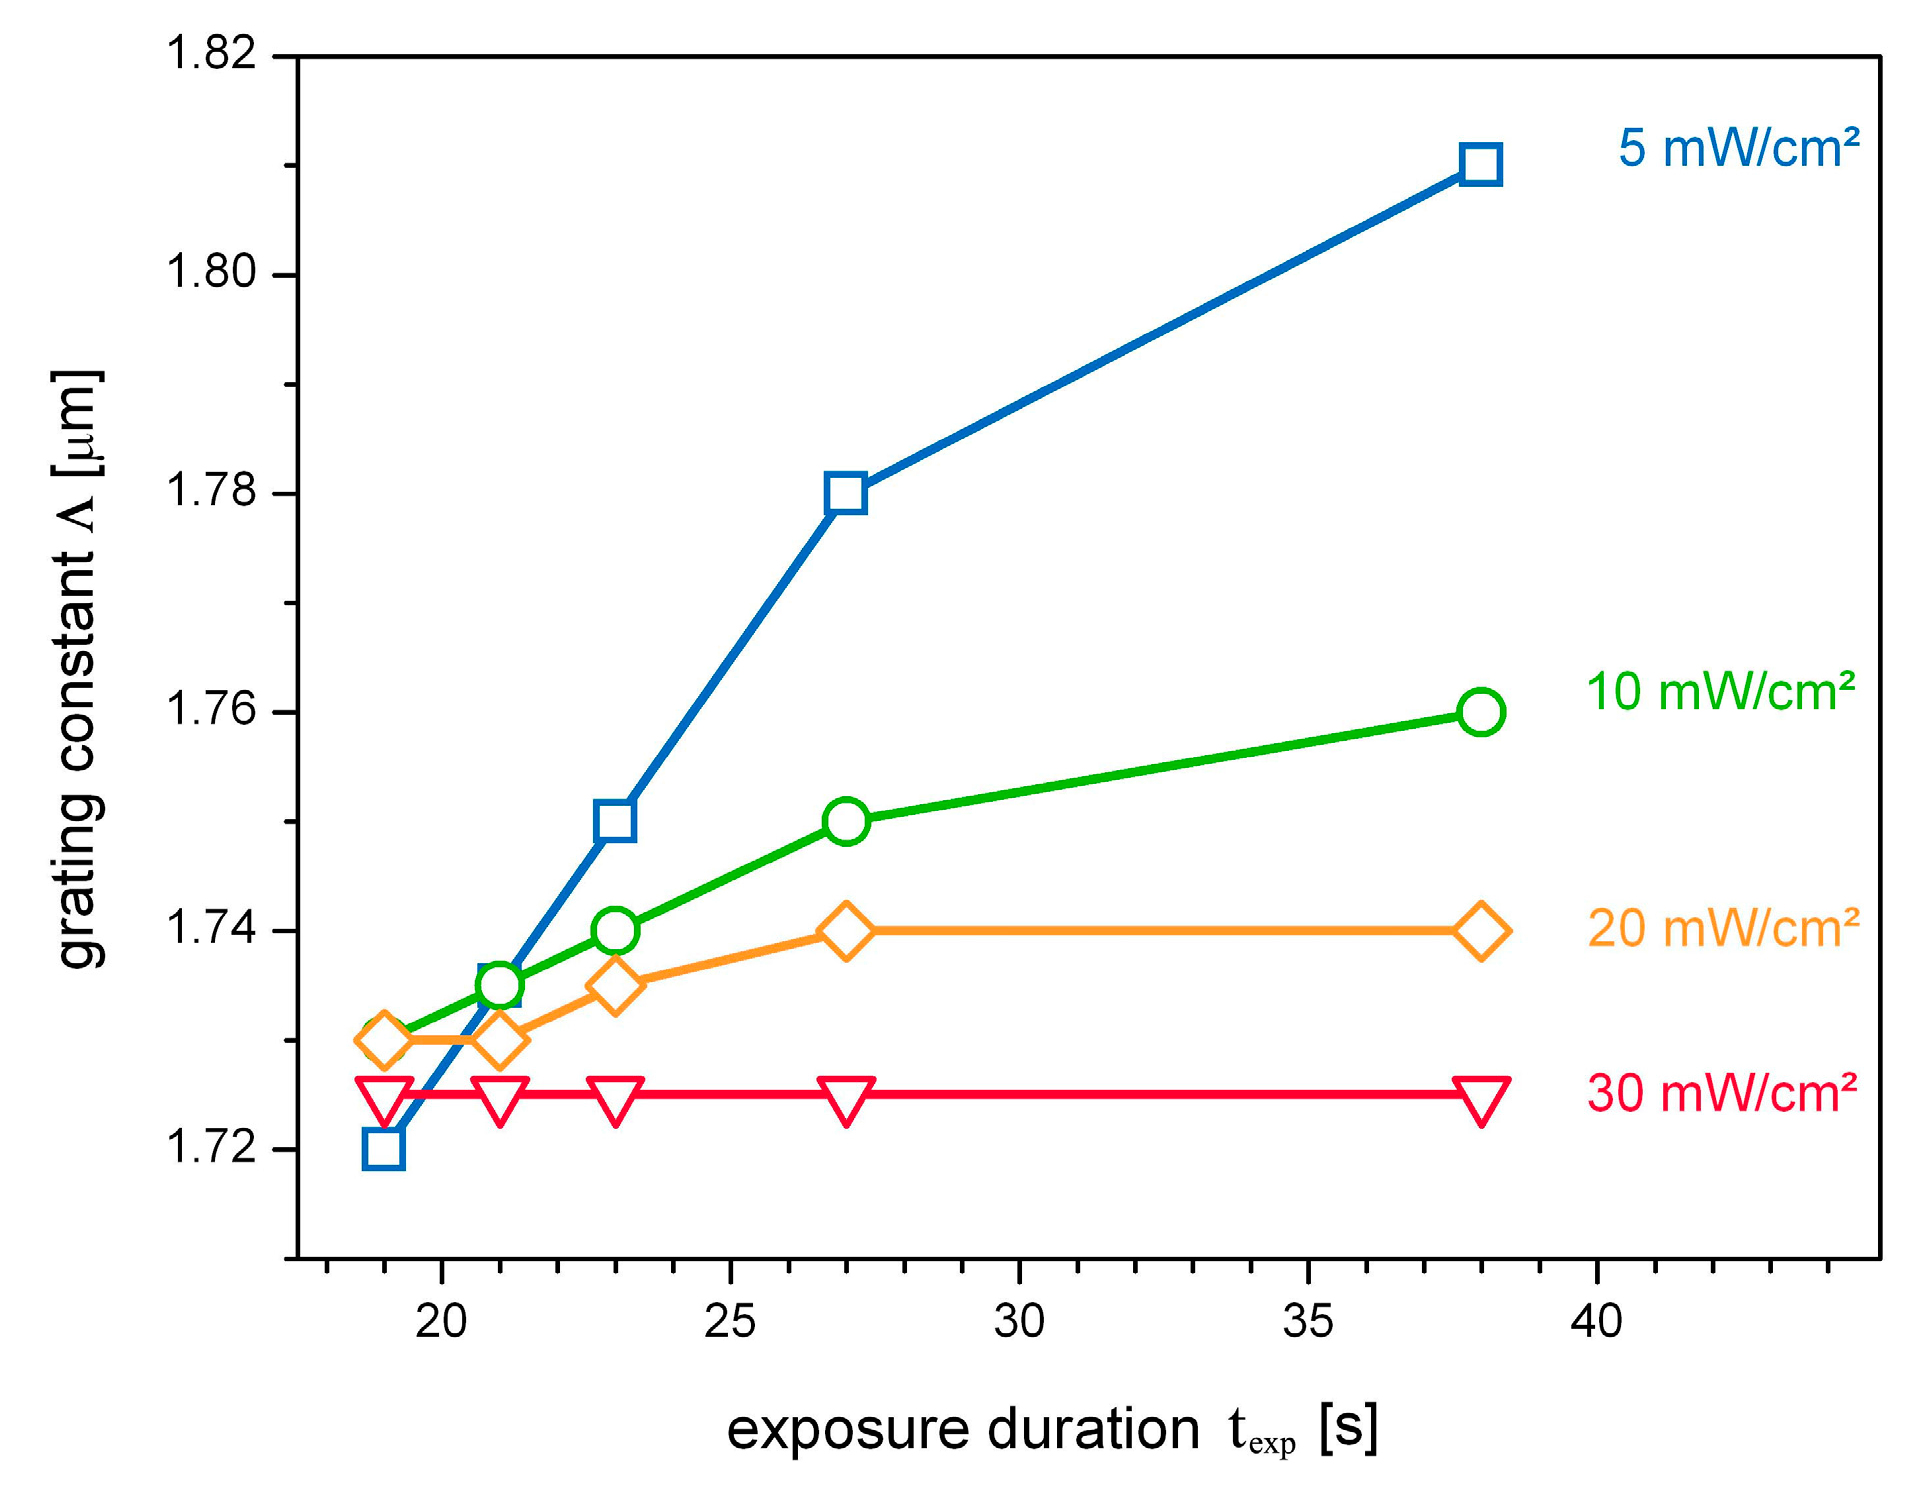
As indicated from looking at Figure 1, the influence of the exposure duration becomes particularly apparent in the case of low recording intensity. Further confirmation of this effect is provided by Figure 2, clearly demonstrating the impact of the exposure duration on the grating constant.
Figure 2.
(a) Impact of the exposure duration on the grating period: Λ(texp) for various recording intensities, derived from lateral scans. The strongest dependency is obtained in case of low recording intensity (I = 5 mW/cm², blue squares). An increase of the recording intensity progressively reduces the impact of the exposure duration: from (I = 10 mW/cm², green circles) to (I = 20 mW/cm², orange diamonds) up to (I = 30 mW/cm², red triangles).

Second, this gradient is decreasing with increasing recording intensity:
i.e., in the case of low recording intensity (I = 5 mW/cm²), an increase of the exposure duration of 50% increases the grating constant by 5%. In addition, as observed before, the higher the intensity of exposure, the less pronounced is the influence of the exposure duration. Until finally, in the case of high recording intensity (I = 30 mW/cm²), the grating period remains constant, or rather:
Moreover, the results presented here are in line with results from holographic interferometry, performed during holographic recording of acrylamide photopolymer layers, where higher shrinkage was observed with recordings at lower intensities [29].
3.1.3. Mutual Consistency: Λ(I, texp)
Although the recording dose, i.e., the product of recording intensity and exposure duration, represents the decisive value, determining the grating formation, an independent investigation of Λ(I) and Λ(texp) provides a descriptive characterization of the material response. Nevertheless, results from Section 3.1.1 and Section 3.1.2, which are not contingent on each other, merge into a consistent picture of the material performance. Moreover, the independent results can be unified as follows.
According to the symmetry of second derivatives (Clairaut’s theorem), the partial derivations of a function with continuous second partial derivatives are commutative. This takes shape in the equivalence of Equations (4) and (6):
Specifically, Equation (8) manifests in the following results. On the one hand, the effect of a laterally decreasing periodicity is enhanced with increasing duration of exposure (Equation (4)). On the other hand, the increase of the periodicity with the exposure duration is diminished with increasing intensity of exposure (Equation (6)).
3.2. The Grating Slant Φ
Investigation of the grating constant enables two-dimensional mapping of optical shrinkage in the lateral plane. However, no information on optical shrinkage in the perpendicular direction is provided, although the lateral scan data contains corresponding information in the form of the grating slant parameter Φ.
In the case of one-dimensional, plane-wave, transmission type gratings the lattice planes are aligned parallel to each other, perpendicular to the sample surface. Any deviations from this configuration must be linked to local differences in optical shrinkage. As a consequence, lateral mapping of the slant parameter allows for the deduction of the depth relevant information by means of the lattice plane orientation.
Here, the results from lateral scans show a causal connection between local grating slant and recording intensity as well as exposure duration, respectively, i.e., Φ(I, texp). With respect to the recording intensity, three different behaviors can be classified, presented in Figure 3.
3.2.1. Impact of the Recording Intensity: Φ(I)
Once again, the behaviour Φ(I) strongly depends on the duration of the exposure. The three emerging cases are shown in Figure 3. The respective schemes to the right illustrate corresponding consequences with regard to the lattice plane orientation.
Figure 3.
Lateral progressions of the grating slant Φ(I), derived from lateral scans from the left to the right (left side), numbers indicate the individual, sequentially performed rotation scans; plus corresponding schemes with respect to the orientation of the lattice planes (right side). In the case of short exposure duration (lowermost, blue curve) the slant angle changes from positive to negative values, with the result of decreasing grating pitch towards the substrate. Conversely, in the case of long exposure duration (uppermost, orange curve) the slant angle changes from minus to plus, with the result of increasing grating pitch towards the substrate. In between an intermediate behavior arises (central, green curve).
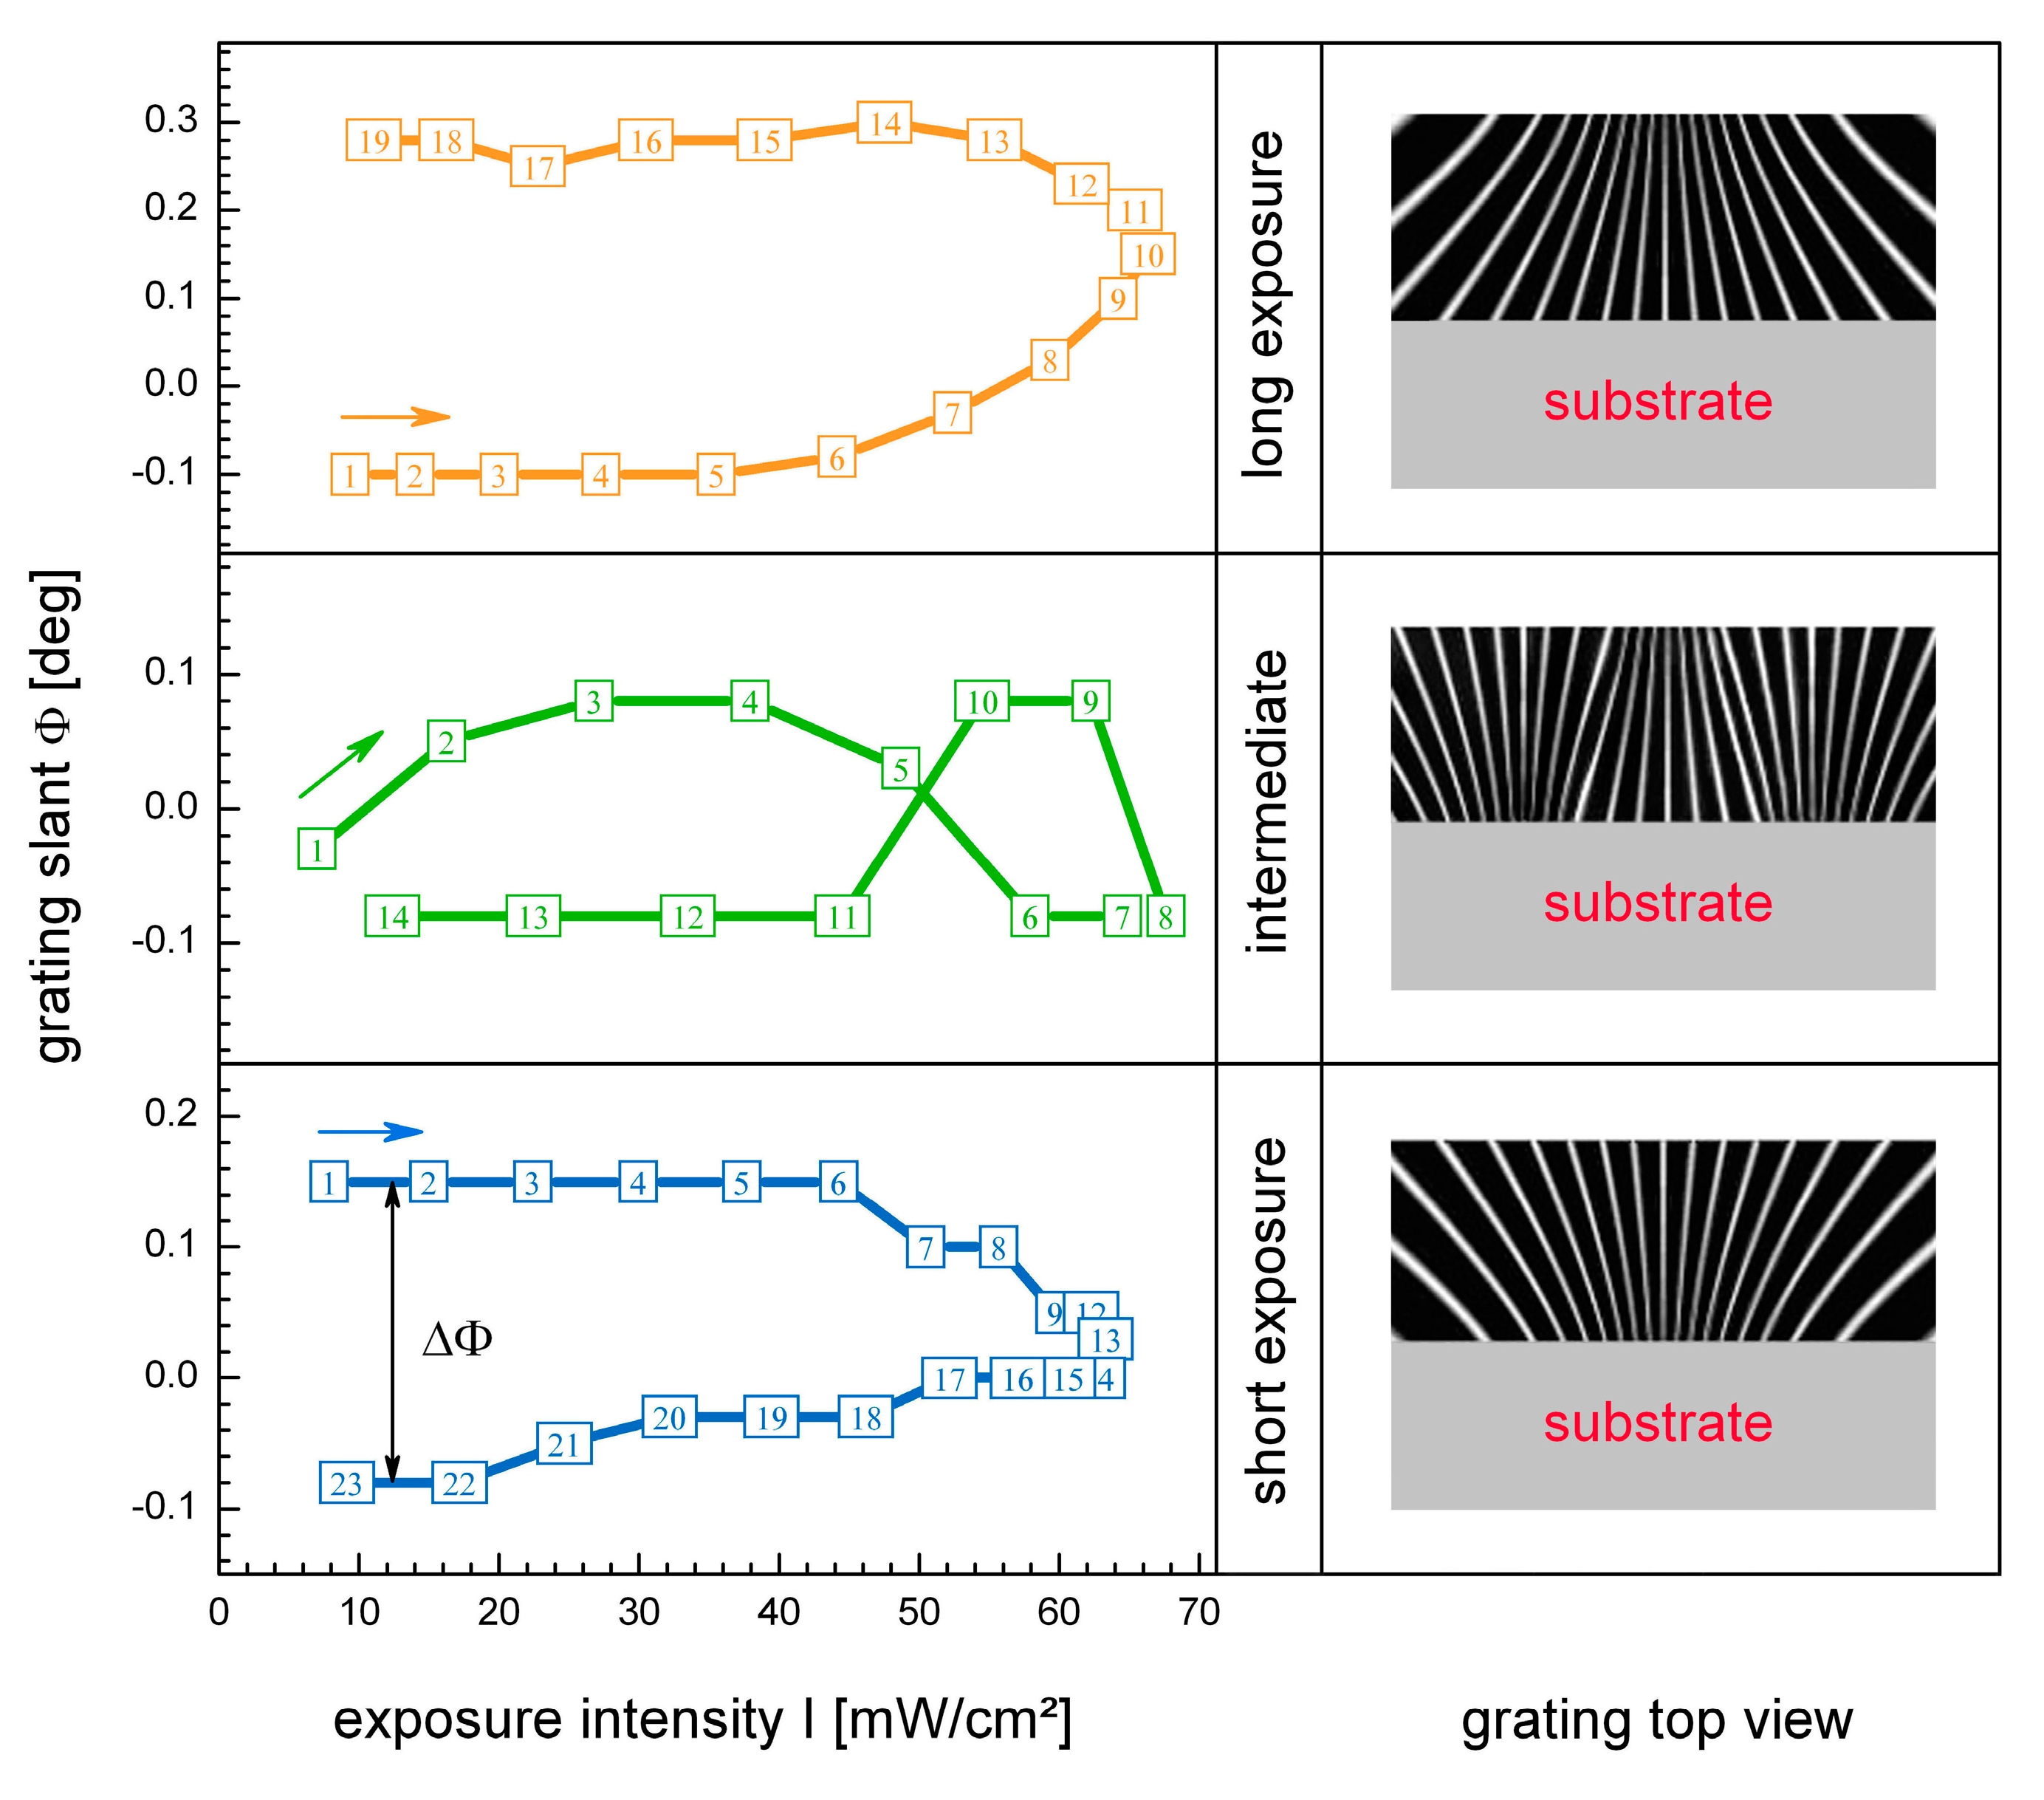
In the evaluation of these results, it must be considered that the lateral scans are performed horizontally from the left to the right side of the grating (from the top-view perspective, i.e., polymer on top of the substrate). As a consequence, a positive slant Φ > 0 corresponds to a tilt of the lattice planes to the left (again from top view perspective), while a negative value Φ < 0 means a slant to the right.
In the case of short exposure, it was found that Φ is positive on the left side of the grating and negative on the right side. As a consequence, the grating period decreases from the surface towards the substrate (see lowermost right-hand scheme in Figure 3). In the case of long exposure duration, the situation is vice versa, i.e., Φ < 0 on the left side and Φ > 0 on the right side. In addition, an intermediate case is observed in between (see middle row in Figure 3).
Interpretation of the findings with respect to the grating slant appears more complicated than in case of the grating constant. This is due to the fact that the information, provided with regard to Λ, is assigned to the lateral plane, while in the case of Φ the depth of the layer is involved. Accordingly, local variations of optical shrinkage in the lateral plane can be assigned to recording-intensity-distribution-related effects, whereas several potential causes must be considered for the explanation of modifications trough the depth of the layer. On the one hand, adhesion between polymer layer and glass substrate appears reasonable in view of specific epoxy characteristics [30]. On the other hand, the thick, uncovered surface of the polymer layer may tend to the formation of a superficial film. Additionally, non-uniform chemical composition may be obtained as a consequence of sample dark storage. Finally, a possible decrease of the recording intensity might result from absorption of the recording beams.
Depending on the respective interpretation, the results suggest more expansion at the substrate or rather more shrinkage at the surface in case of long exposure (uppermost case in Figure 3), while in the case of short exposure, the situation is vice versa (lowermost case in Figure 3). In the intersection, forces cancel each other out (central case in Figure 3). This is also illustrated in view of the strength of the tilting effects, i.e., the value of ΔΦ in Figure 3.
In view of results presented in Section 3.1.2 as well as in [13,28], namely the decrease of optical shrinkage or rather the refractive index increase, observed with increasing exposure duration, interpretation of the results in terms of a superficial film formation is suggested. However, starting from the assumption of recording beam absorption would be preferable as well, inasmuch as it is in compliance with results from Section 3.1.1, where a decrease of Λ(I) was found.
3.2.2. Impact of the Exposure Duration: Φ(texp)
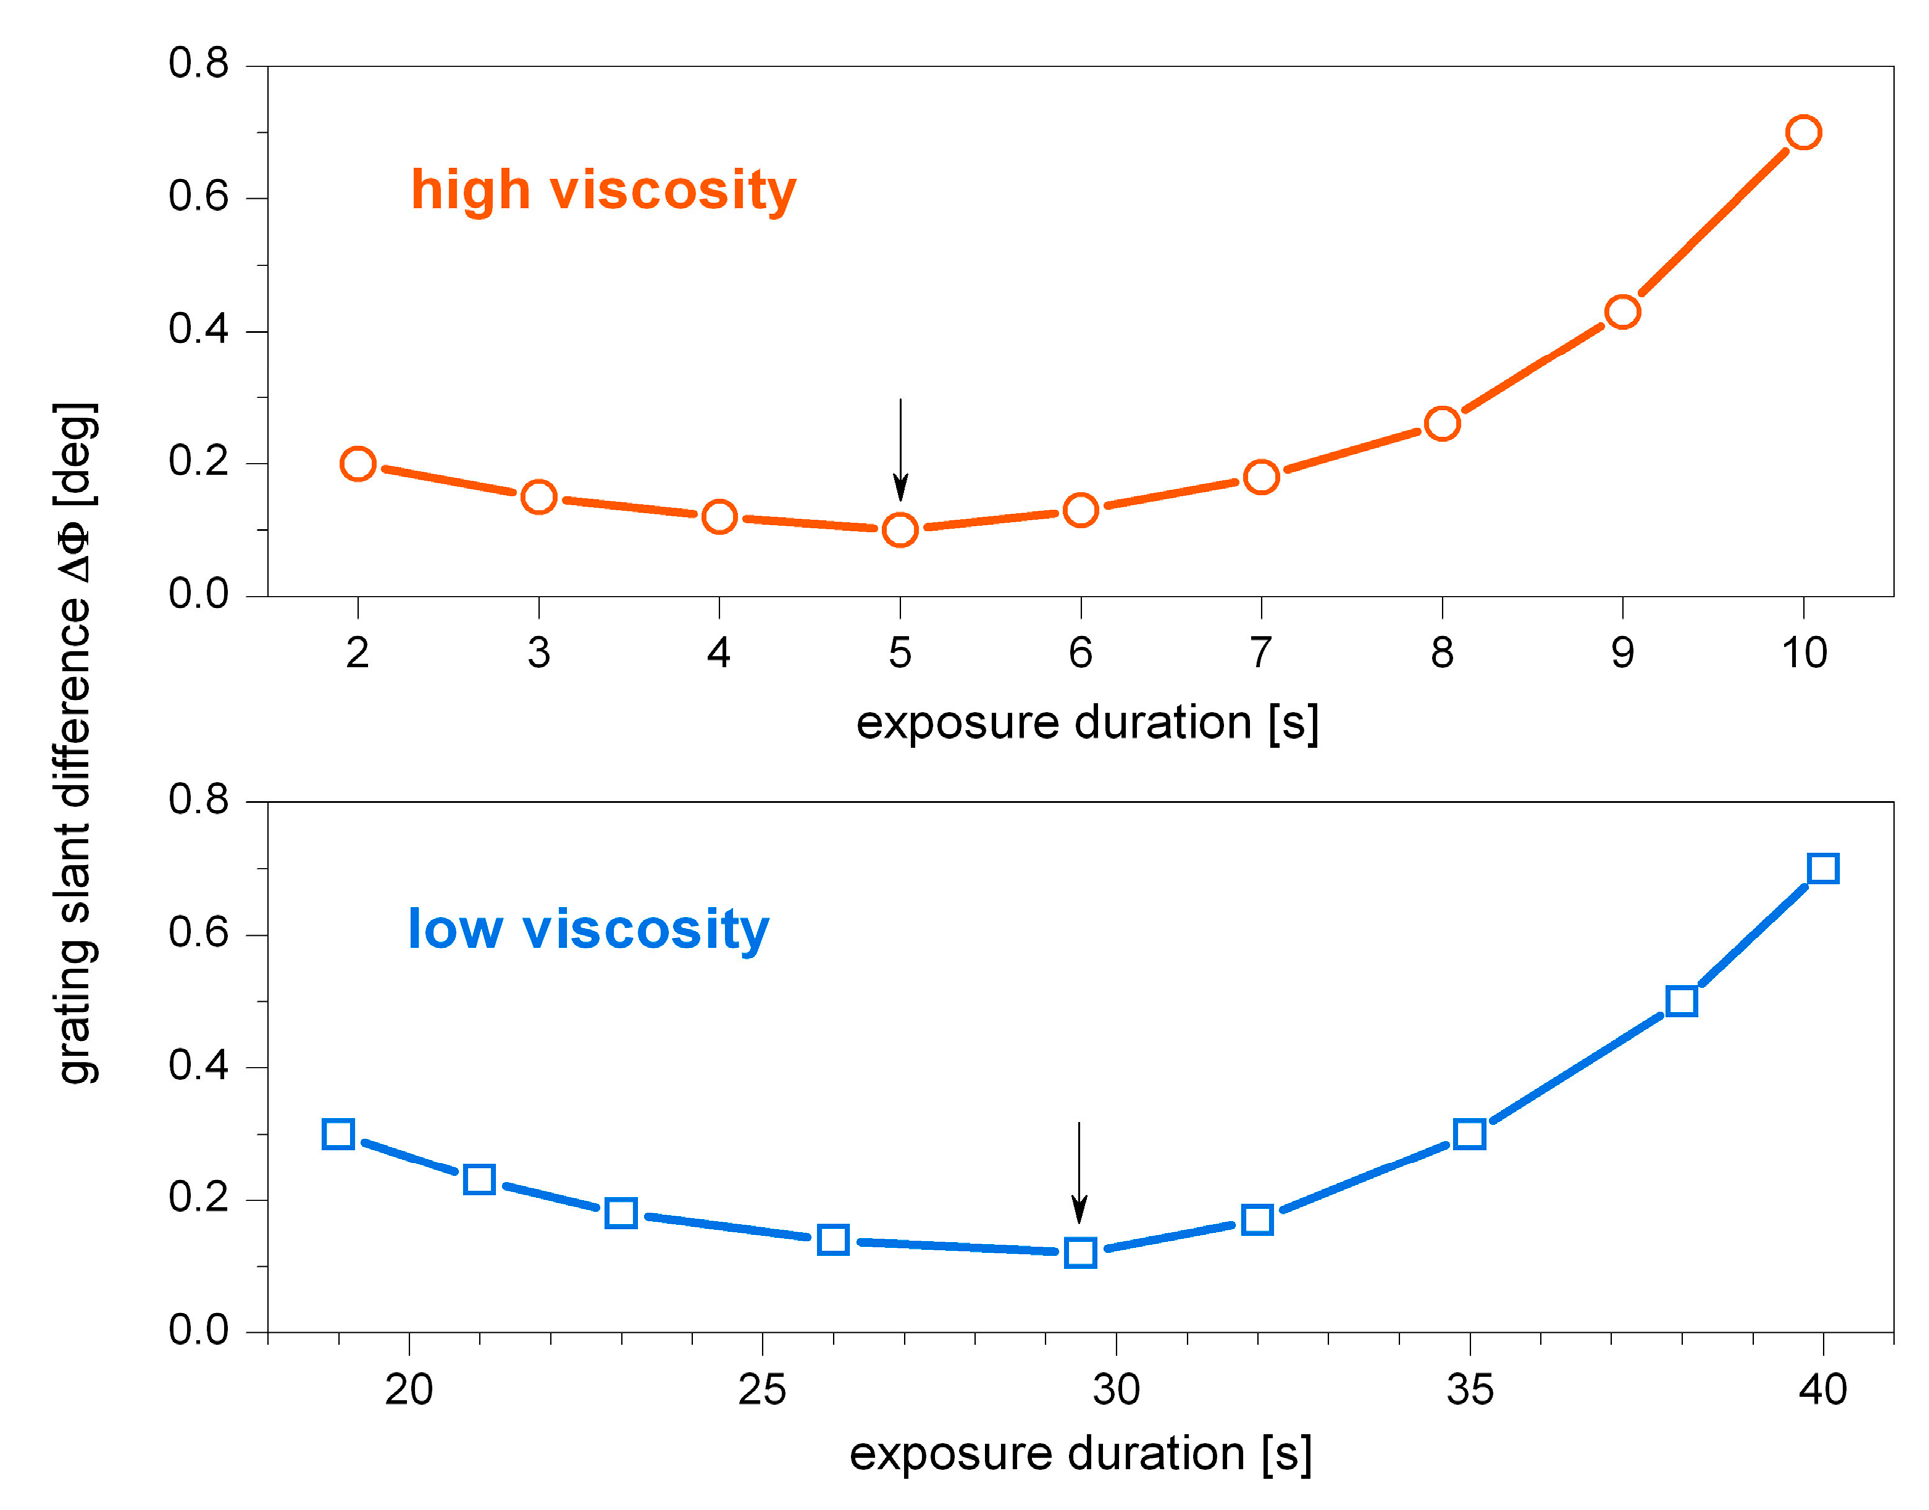
To measure the strength of the deformation effects perpendicular to the sample surface, the parameter ΔΦ is introduced. ΔΦ is defined as the difference of the left side and right side slant angles, as depicted at the lower left of Figure 3. With the help of this quantity, a comparison of the individual performances is facilitated. Figure 4 demonstrates the impact of the exposure duration on the observed grating slant difference ΔΦ with reference to the material viscosity.
Notwithstanding the different viscosity, the grating slant difference shows qualitatively the same curve progression. In fact, ΔΦ(texp) describes an initial decrease up to a minimum and a subsequent increase with increasing exposure duration. Thereby ΔΦ reaches higher values in case of long exposure duration. Once again, these results are in compliance with findings from preliminary sections. As already observed in view of Λ(texp), an increase of the exposure duration enhances the effect of optical shrinkage.
3.2.3. Impact of the Material’s Viscosity
A variation of the material’s viscosity affects the optical shrinkage, as became clear in view of Figure 4. Here, the influence of the viscosity on the grating slant difference is evident by means of scaling of the abscissa. In case of low viscosity the ΔΦ(texp)–minimum is allocated around 30 s. In contrast to this, high viscosity results in a minimum around texp = 5 s. Such a shift is in line with the expectations, since a high viscous material is less flexible, whereas in case of low viscosity a higher amount of curing is required with the result of longer exposure duration necessary to achieve the same result with respect to the optical shrinkage.
It must be stressed that the viscosity, in the case of this study aligned by means of prebake, is also effected by pre-exposure as well as dark storage of the samples. However, the purpose of the present study is a qualitative analysis of optical shrinkage effects. Further investigations are required to elucidate the relationship and influence of external factors for an estimation in terms of quantity.
Figure 4.
Influence of the exposure duration on the grating slant difference: ΔΦ(texp) for low viscosity (below, blue squares) and high viscosity (on top, orange circles). The different material’s viscosity notwithstanding, the curve progressions are highly similar in terms of quality. Quantitatively they differ with regard to the scaling of the abscissa. In the case of high viscosity, the ΔΦ(texp)–minimum is observed for shorter exposure durations.

4. Conclusions
Based on the methods introduced here, lateral scanning of the grating parameters was demonstrated.
Results from spatially resolved investigations of the grating constant reveal a distinct influence of the recording intensity and exposure duration on the Bragg selectivity:
First, it was shown that the grating period is independent of the recording intensity in the case of short exposure duration (Equation (2)) and independent of the exposure duration in the case of high recording intensity (Equation (7)). Second, the grating period shows a decrease with increasing recording intensity (Equation (3)). This effect is enhanced with increasing exposure duration (Equation (4)). Third, an increase of the grating constant with increasing exposure duration was found (Equation (5)). This effect is, in turn, increasingly pronounced with decreasing recording intensity (Equation (6)). Such countervailing effects of positive and negative optical shrinkage have already been reported with respect to time resolved investigations [13].
Results are in accordance with those obtained with other methods [9,13,29] and with other photopolymer systems [28,29]. Thus, it appears a general characteristic that lower shrinkage is observed with recordings at high intensities and short exposure duration. In view of the recently demonstrated correlation between photo-induced crosslinking and mechanical shrinkage [13], this can be interpreted in terms of advantageous conditions for monomer diffusion in case of short exposure.
Investigations, based on the periodicity of transmission type gratings, are intrinsically limited, yielding only two-dimensional information on optical shrinkage in the direction of the grating vector. Therefore, to complete the picture on spatially resolved analysis of the Bragg selectivity, the modification of optical shrinkage perpendicular to the sample surface was also accomplished.
Results from lateral scanning of the volume holographic grating slant angle are consistent with spatially resolved investigations of the periodicity. A distinct influence of recording intensity, exposure duration and material viscosity on the 3D Bragg selectivity was found. Furthermore, the presence of countervailing effects of positive and negative optical shrinkage is confirmed [13].
It was demonstrated that optical shrinkage occurs not only in the direction perpendicular to the sample surface. Moreover, the optical shrinkage shows characteristic changes through the depth of the layer. Accordingly, lateral progressions of the grating slant revealed a decreasing grating period towards the substrate in case of short exposure duration and an increase in the case of long exposure duration, while an intermediate behavior arises in between.
The overall strength of the modification of optical shrinkage through the layer was investigated and a characteristic influence of the exposure duration was found, while the material’s viscosity affects the influence of the exposure duration not in terms of quality, but in terms of quantity.
The newly introduced method of lateral scanning and the corresponding results presented here contribute by means of a deeper understanding and feasible control of optical shrinkage in photosensitive polymers, targeting a highly stable functionality of volume holographic devices.
Acknowledgments
This work was supported by the co:bios foundation. The author thanks Karl Pfeiffer and microresist technology GmbH for providing the photopolymer material and samples. Special thanks to Michael Zschocher for fundamental discussions and assistance with respect to the graphical representation of the results.
Conflicts of Interest
The author declares no conflict of interest.
References
- Trout, T.J.; Schmieg, J.J.; Gambogi, W.J.; Weber, A.M. Optical photopolymers: Design and applications. Adv. Mater. 1998, 10, 1219–1224. [Google Scholar] [CrossRef]
- Trentler, T.J.; Boyd, J.E.; Colvin, V.L. Epoxy resin-photopolymer composites for volume holography. Chem. Mater. 2000, 12, 1431–1438. [Google Scholar] [CrossRef]
- Hagen, R.; Bieringer, T. Photoaddressable polymers for optical data storage. Adv. Mater. 2001, 13, 1805–1810. [Google Scholar] [CrossRef]
- Ma, H.; Jen, A.K.Y.; Dalton, L.R. Polymer-based optical waveguides: Materials, processing, and devices. Adv. Mater. 2002, 14, 1339–1365. [Google Scholar] [CrossRef]
- Baylor, M.; Cerjan, B.; Pfiefer, C.; Boyne, R.; Couch, C.; Cramer, N.; Bowman, C.; McLeod, R. Monolithic integration of optical waveguide and fluidic channel structures in a thiol-ene/methacrylate photopolymer. Opt. Mater. Express 2012, 2, 1548–1555. [Google Scholar] [CrossRef]
- De Sio, L.; Ferjani, S.; Strangi, G.; Umeton, C.; Bartolino, R. Universal soft matter template for photonic applications. Soft Matter 2011, 7, 3739–3743. [Google Scholar] [CrossRef]
- Sabel, T.; Orlic, S.; Pfeiffer, K.; Ostrzinski, U.; Grützner, G. Free-surface photopolymerizable recording material for volume holography. Opt. Mater. Express 2012, 3, 329–338. [Google Scholar] [CrossRef]
- Guo, J.; Gleeson, M.R.; Sheridan, J.T. A review of the optimisation of photopolymer materials for holographic data storage. Phys. Res. Int. 2012. [Google Scholar] [CrossRef]
- Sabel, T.; Zschocher, M. Transition of refractive index contrast in course of grating growth. Sci. Rep. 2013, 3, 2552. [Google Scholar] [CrossRef] [PubMed]
- Sakhno, O.V.; Goldenberg, L.M.; Smirnova, T.N.; Stumpe, J. Holographic patterning of organic-inorganic photopolymerizable nanocomposites. In Proceedings of SPIE—The International Society for Optical Engineering, Berlin, Germany, 31 August–1 September 2009.
- Sabel, T.; Zschocher, M. Imaging of volume phase gratings in a photosensitive polymer, recorded in transmission and reflection geometry. Appl. Sci. 2014, 4, 19–27. [Google Scholar] [CrossRef]
- Castagna, R.; Milner, A.; Zyss, J.; Prior, Y. Nanoscale Poling of Polymer Films. Adv. Mater. 2013, 25, 2234–2238. [Google Scholar] [CrossRef] [PubMed]
- Sabel, T.; Zschocher, M. Dynamic Bragg angle shift in the course of volume hologram formation. Mater. Res. Lett. 2013. [Google Scholar] [CrossRef]
- Criante, L.; Castagna, R.; Vita, F.; Lucchetta, D.E.; Simoni, F. Nanocomposite polymeric materials for high density optical storage. J. Opt. A Pure Appl. Opt. 2009, 11, 024011. [Google Scholar] [CrossRef]
- Gallego, S.; Márquez, A.; Méndez, D.; Neipp, C.; Ortuño, M.; Alvarez, M.; Fernandez, E.; Beléndez, A. Real-time interferometric characterization of a polyvinyl alcohol based photopolymer at the zero spatial frequency limit. Appl. Opt. 2007, 46, 7506–7512. [Google Scholar] [CrossRef] [PubMed] [Green Version]
- Kawana, M.; Takahashi, J.; Guo, J.; Tomita, Y. Measurement of polymerization-shrinkage evolution during curing in photopolymer with a white-light Fabry-Perot interferometer. Opt. Express 2015, 23, 15356–15364. [Google Scholar] [CrossRef] [PubMed]
- Semenova, I.; Popov, A.; Bartsch, E.; Veniaminov, A. Rigid polymer materials with hologram enhancement by molecular diffusion. In Proceedings of SPIE, Practical Holography XVII and Holographic Materials IX, Santa Clara, CA, USA, 20 January 2003.
- Veniaminov, A.; Bartsch, E.; Semenova, I.; Popov, A. Hologram development by diffusion in a polymer glass. In Proceedings of SPIE, Organic Holographic Materials and Applications, San Diego, CA, USA, 3 August 2003.
- Zhao, C.; Liu, J.; Fu, Z.; Chen, R.T. Shrinkage-corrected volume holograms based on photopolymeric phase media for surface-normal optical interconnects. Appl. Phys. Lett. 1997, 71, 1464–1466. [Google Scholar] [CrossRef]
- Hata, E.; Mitsube, K.; Momose, K.; Tomita, Y. Holographic nanoparticle-polymer composites based on step-growth thiol-ene photopolymerization. Opt. Mater. Express 2011, 1, 207–222. [Google Scholar] [CrossRef]
- Ingwall, R.T.; Waldmann, D. Photopolymer systems. In Holographic Data Storage; Coufal, H.J., Psaltis, D., Sincerbox, G.T., Eds.; Springer: Berlin, Germany, 2007; pp. 171–197. [Google Scholar]
- Ramos, G.; Álvarez-Herrero, A.; Belenguer, T.; del Monte, F.; Levy, D. Shrinkage control in a photopolymerizable hybrid solgel material for holographic recording. Appl. Opt. 2004, 43, 4018–4024. [Google Scholar] [CrossRef] [PubMed]
- Květoň, M.; Ledl, V.; Havranek, A.; Fiala, P. Photopolymer for optical holography and holographic interferometry. Macromol. Symp. 2010, 295, 107–113. [Google Scholar] [CrossRef]
- Hata, E.; Tomita, Y. Stoichiometric thiol-to-ene ratio dependences of refractive index modulation and shrinkage of volume gratings recorded in photopolymerizable nanoparticle-polymer composites based onstep-growth polymerization. Opt. Mater. Express 2011, 1, 1113–1120. [Google Scholar] [CrossRef]
- Hayek, A.; Xu, Y.; Okada, T.; Barlow, S.; Zhu, X.; Moon, J.H.; Marder, S.R.; Yang, S. Poly(glycidyl methacrylate)s with controlled molecular weights as low-shrinkage resins for 3D multibeam interference lithography. J. Mater. Chem. 2008, 18, 3316–3318. [Google Scholar] [CrossRef]
- Waldman, D.A.; Li, H.Y.S.; Horner, M.G. Volume shrinkage in slant fringe gratings of a cationic ring-opening volume hologram recording material. J. Imaging Sci. Technol. 1997, 41, 497–514. [Google Scholar]
- Steckman, G.J.; Havermeyer, F. High spatial resolution measurement of volume holographic gratings. In Proceedings of SPIE, Practical Holography XX: Materials and Applications, San Jose, CA, USA, 27 February 2006.
- Moothanchery, M.; Naydenova, I.; Toal, V. Study of the shrinkage caused by holographic grating formation in acrylamide based photopolymer film. Opt. Express 2011, 19, 13395–13404. [Google Scholar] [CrossRef] [PubMed]
- Moothanchery, M.; Bavigadda, V.; Toal, V.; Naydenova, I. Shrinkage during holographic recording in photopolymer films determined by holographic interferometry. Appl. Opt. 2013, 52, 8519–8527. [Google Scholar] [CrossRef] [PubMed]
- Yang, R.; Soper, S.A.; Wang, W. A new UV lithography photoresist based on composite of EPON resins 165 and 154 for fabrication of high-aspect-ratio microstructures. Sens. Actuators A Phys. 2007, 135, 625–636. [Google Scholar] [CrossRef]
© 2015 by the authors; licensee MDPI, Basel, Switzerland. This article is an open access article distributed under the terms and conditions of the Creative Commons Attribution license (http://creativecommons.org/licenses/by/4.0/).
Share and Cite
MDPI and ACS Style
Sabel, T. Spatially Resolved Analysis of Bragg Selectivity. Appl. Sci. 2015, 5, 1064-1075. https://doi.org/10.3390/app5041064
AMA Style
Sabel T. Spatially Resolved Analysis of Bragg Selectivity. Applied Sciences. 2015; 5(4):1064-1075. https://doi.org/10.3390/app5041064
Chicago/Turabian StyleSabel, Tina. 2015. "Spatially Resolved Analysis of Bragg Selectivity" Applied Sciences 5, no. 4: 1064-1075. https://doi.org/10.3390/app5041064