
Fundamentals of Highly Non-Degenerate Cascaded Four-Wave Mixing

1
Departamento de Óptica, Facultad de Ciencias Físicas, Universidad Complutense de Madrid, Avda. Complutense s/n, Madrid 28040, Spain
2
Departamento de Física e Astronomia e IFIMUP-IN, Faculdade de Ciências, Universidade do Porto, R. do Campo Alegre 687, Porto 4169-007, Portugal
*
Author to whom correspondence should be addressed.
Appl. Sci. 2015, 5(3), 485-515; https://doi.org/10.3390/app5030485
Submission received: 16 July 2015
/
Revised: 13 August 2015
/
Accepted: 20 August 2015
/
Published: 7 September 2015
(This article belongs to the Special Issue Multi-Color Laser Emission for the Generation of Ultrashort Optical Pulse)
Abstract
:By crossing two intense ultrashort laser pulses with different colors in a transparent medium, like a simple piece of glass, a fan of multicolored broadband light pulses can be simultaneously generated. These newly generated pulses are emitted in several well-defined directions and can cover a broad spectral range, from the infrared to the ultraviolet and beyond. This beautiful phenomenon, first observed and described 15 years ago, is due to highly-nondegenerate cascaded four-wave mixing (cascaded FWM, or CFWM). Here, we present a review of our work on the generation and measurement of multicolored light pulses based on third-order nonlinearities in transparent solids, from the discovery and first demonstration of highly-nondegenerate CFWM, to the coherent synthesis of single-cycle pulses by superposition of the multicolored light pulses produced by CFWM. We will also present the development and main results of a dedicated 2.5-D nonlinear propagation model, i.e., with propagation occurring along a two-dimensional plane while assuming cylindrically symmetric pump beam profiles, capable of adequately describing noncollinear FWM and CFWM processes. A new method for the generation of femtosecond pulses in the deep-ultraviolet (DUV) based on FWM and CFWM will also be described. These experimental and theoretical results show that highly-nondegenerate third-order nonlinear optical processes are formally well understood and provide broader bandwidths than other nonlinear optical processes for the generation of ultrashort light pulses with wavelengths extending from the near-infrared to the deep-ultraviolet, which have many applications in science and technology.

1. Introduction
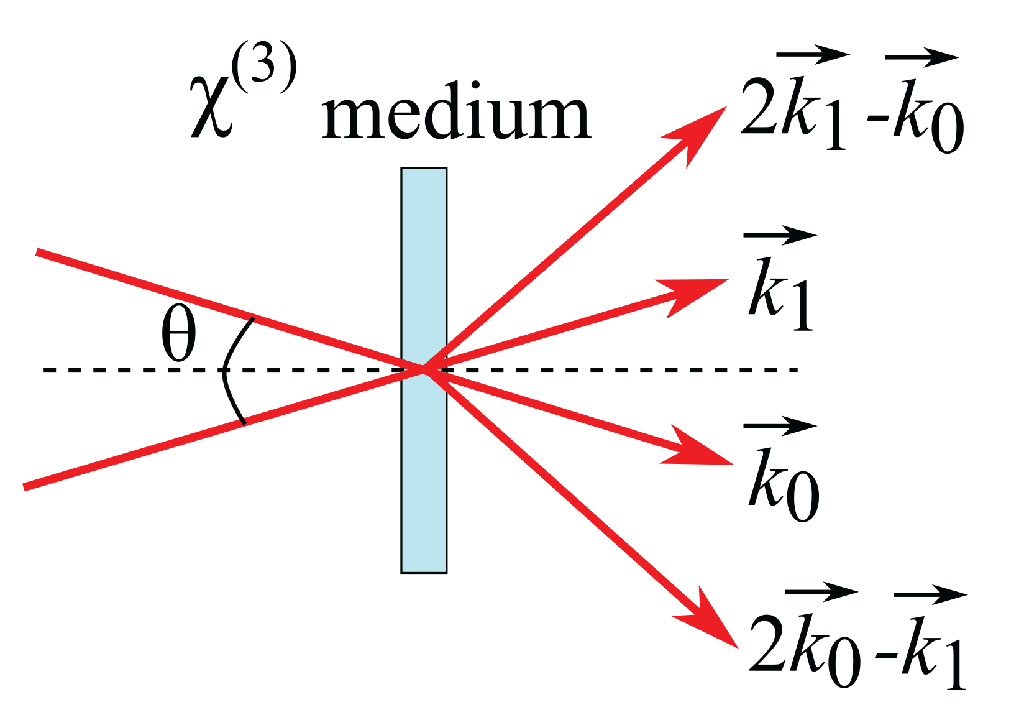
Four-wave mixing (FWM) processes result from the interplay between four electromagnetic waves coupled through the optical Kerr nonlinearity of a medium, given by the third-order susceptibility χ(3) [1]. Since all media, either isotropic or anisotropic (with any kind of crystal symmetry), have a non-zero third order susceptibility, FWM processes have a universal character. The four interacting waves can all have the same frequency, in which case the process is degenerate and the corresponding susceptibility is given by χ(3)(ω;ω,ω,‒ω). In this case, three fields with frequency ω are mixed in the medium to produce another field also with frequency ω. The energy conservation law that determines the frequency of the newly generated field is given in this case by: ω = ω + ω − ω ≡ 2 ω − ω. In practice, this process can be observed by crossing two intense pulses in a nonlinear medium at a small angle. For incident wavevectors k0 and k1, momentum conservation dictates that the newly generated beams will be emitted in the directions given by k2 = 2k1 − k0 and k′2 = 2k0 − k1, as shown in Figure 1. This process can be seen as the diffraction of the incident beams by the nonlinear index grating (laser induced grating) produced by the same beams [2]. In bulk dispersive media this process is intrinsically phase mismatched (see, e.g., [3]), with a mismatch given approximately by δk = 2k(1 − cosθ) ≃ kθ2, where k = |k0| = |k1|. This means that the efficiency of the process drops for increasing interaction (and hence emission) angles.
Figure 1.
Basic geometry of nonlinear self-diffraction.
The waves can also have different frequencies, so a new field with frequency ω2 can be generated departing from two fields with frequencies ω0 and ω1 (ω1 > ω0). In this case, the nonlinear polarization terms which describe diffraction from a moving laser-induced grating give rise to frequency upshifted and downshifted pulses with frequencies ω2 = 2ω1 − ω0 and ω′2 = 2ω0 − ω1, respectively, so the output consists of four beams with different colors emitted in different directions. Penzkofer and Lehmeier [4] analized theoretically the noncollinear phase-matched amplification of ultrashort light pulses via four-wave mixing in isotropic media, having derived explicit expressions for the phase-matching angles and gain.
If the fields are intense enough, the third order susceptibility χ(3) can continue mixing the fields, as long as the energy and momentum conservation laws are fulfilled for the new processes. This way, new fields are generated via cascaded four-wave mixing (CFWM). For noncollinear interactions, this gives rise to additional beams that can be seen as higher orders of diffraction of the moving grating (note that the moving grating corresponds to the spatially and temporally varying nonlinear refractive index change inside the medium, since the medium itself is stationary in the laboratory frame). For the degenerate case, the larger the interaction angle, the smaller the observed number of diffracted orders (due to increasing phase-mismatch), but for the nondegenerate case we will see that the phase-mismatch in cascaded processes can be reduced by proper choice of the interaction angle between the two initial beams.
Collinear fifth-harmonic generation in a crystal as a result of cascaded processes of a cubic nonlinearity was reported in an early work [5]. Extensive work has been done in this field by mixing near-degenerate nanosecond laser pulses in optical fibers and obtaining several pairs of sidebands [6,7,8]. Cascaded processes can also occur with second order processes and have been observed in BBO crystals [9] or in an hybrid form with third order processes in picosecond optical parametric amplifiers [10].
Further progress was made when highly nondegenerate CFWM was demonstrated by mixing femtosecond visible laser pulses with different colors. The first demonstration was done in bulk isotropic media (thin glass slide) [11], and resulted in the generation of multiple broadband light pulses extending from the infrared to the ultraviolet starting from two femtosecond laser pulses in the visible range. Nonresonant nondegenerate CFWM in the femtosecond regime was subsequently observed and demonstrated in other nonlinear media and spectral regions, from semiconductors pumped with mid-IR pulses [12] to gases and plasmas pumped in the NIR to uv. In particular, Misoguti et al. [13] successfully extended CFWM to the vacuum-uv range (down to 160 nm) using a gas-filled hollow waveguide pumped with ω and 2ω pulses from a Ti:Sapphire laser. Raman-assisted noncollinear CFWM has also been obtained in Raman-active media, such as diamond, using dual color laser pulses and chirped broadband pulses (see, e.g., [14] and references therein).
This paper gives a review of the work done by the authors in this field and includes the experimental procedures and a complete theoretical model explaining not only the spectral characteristics of the generated beams, but also their intensity, spectral phases, emission angles and energies. Important examples of the application of the generated pulses namely for the synthesis of single cycle pulses, will be discussed, as well as the possibility of using CFWM for generating broadband light pulses in the deep ultraviolet spectral region.
2. Basic Experiment and Interpretation
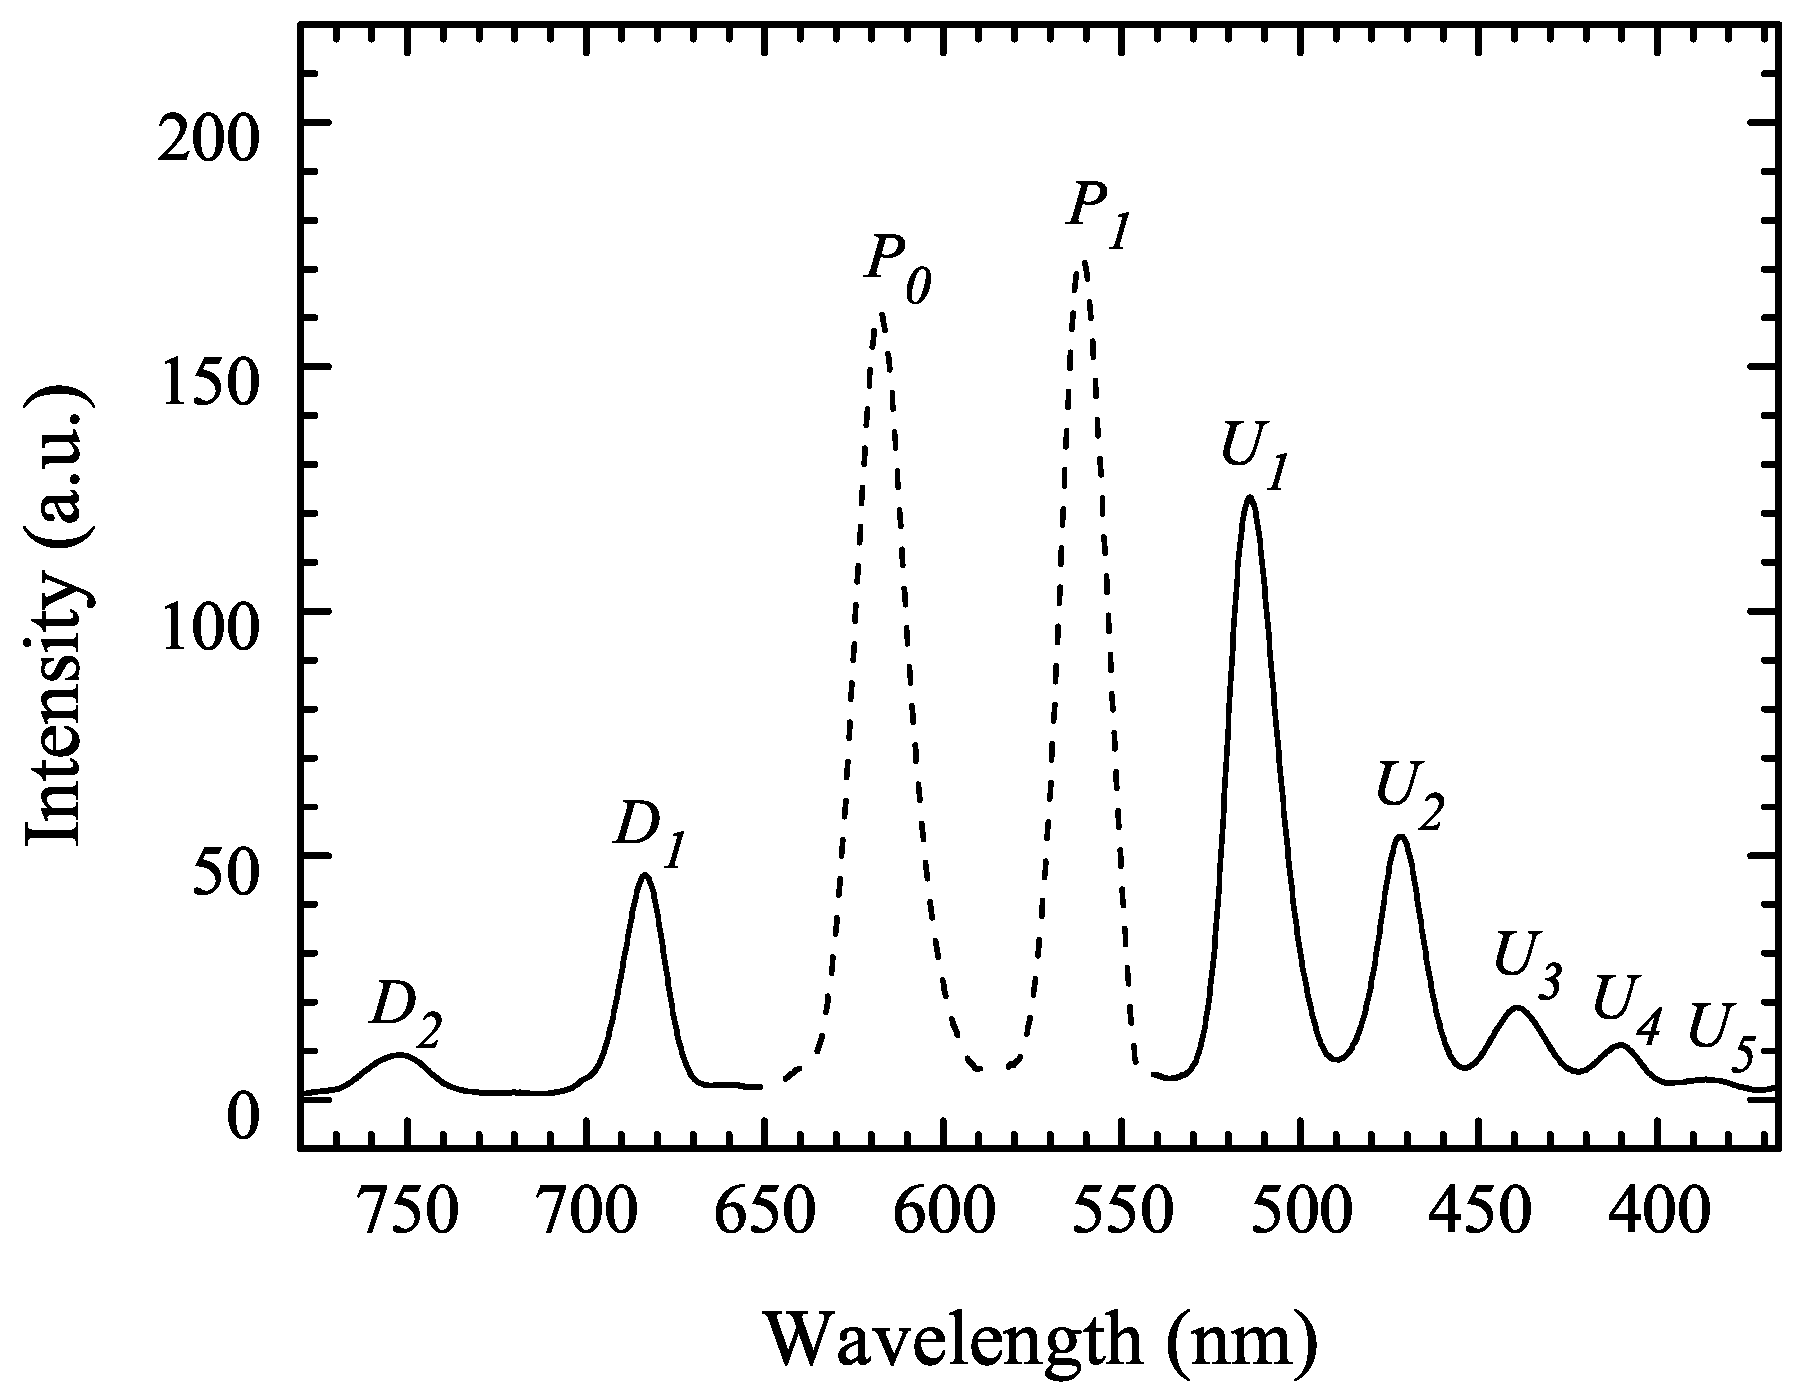
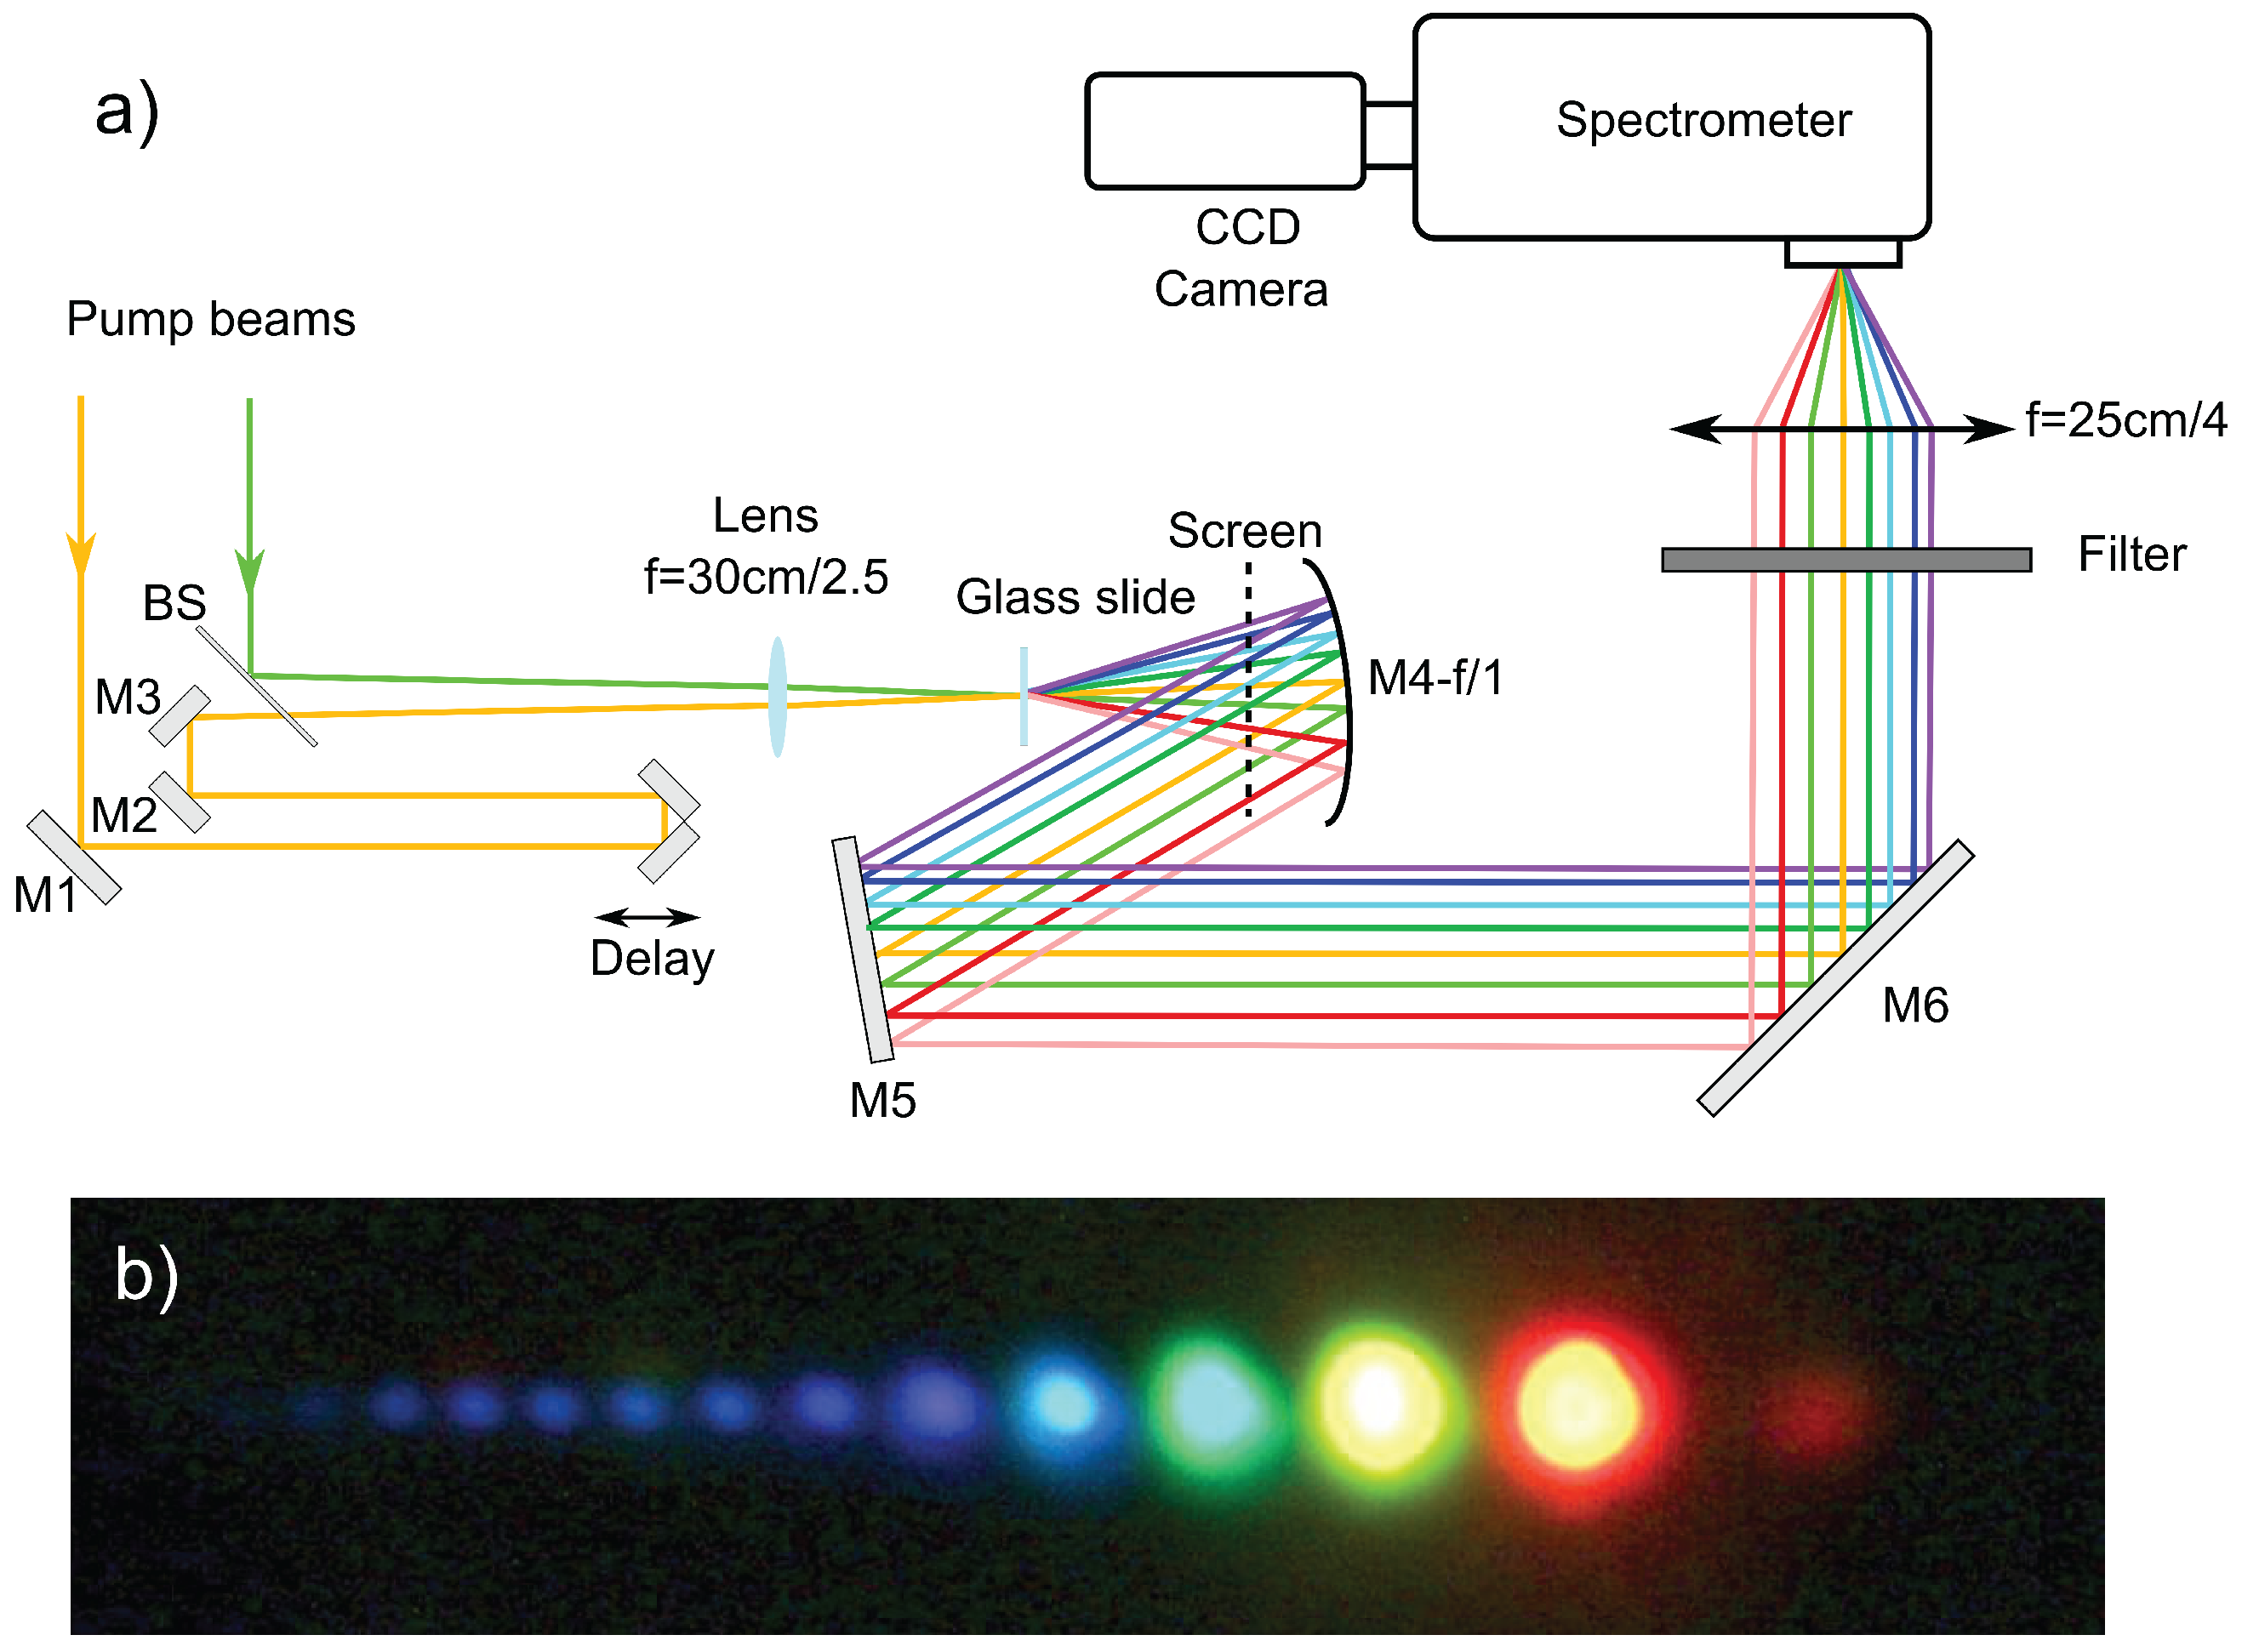
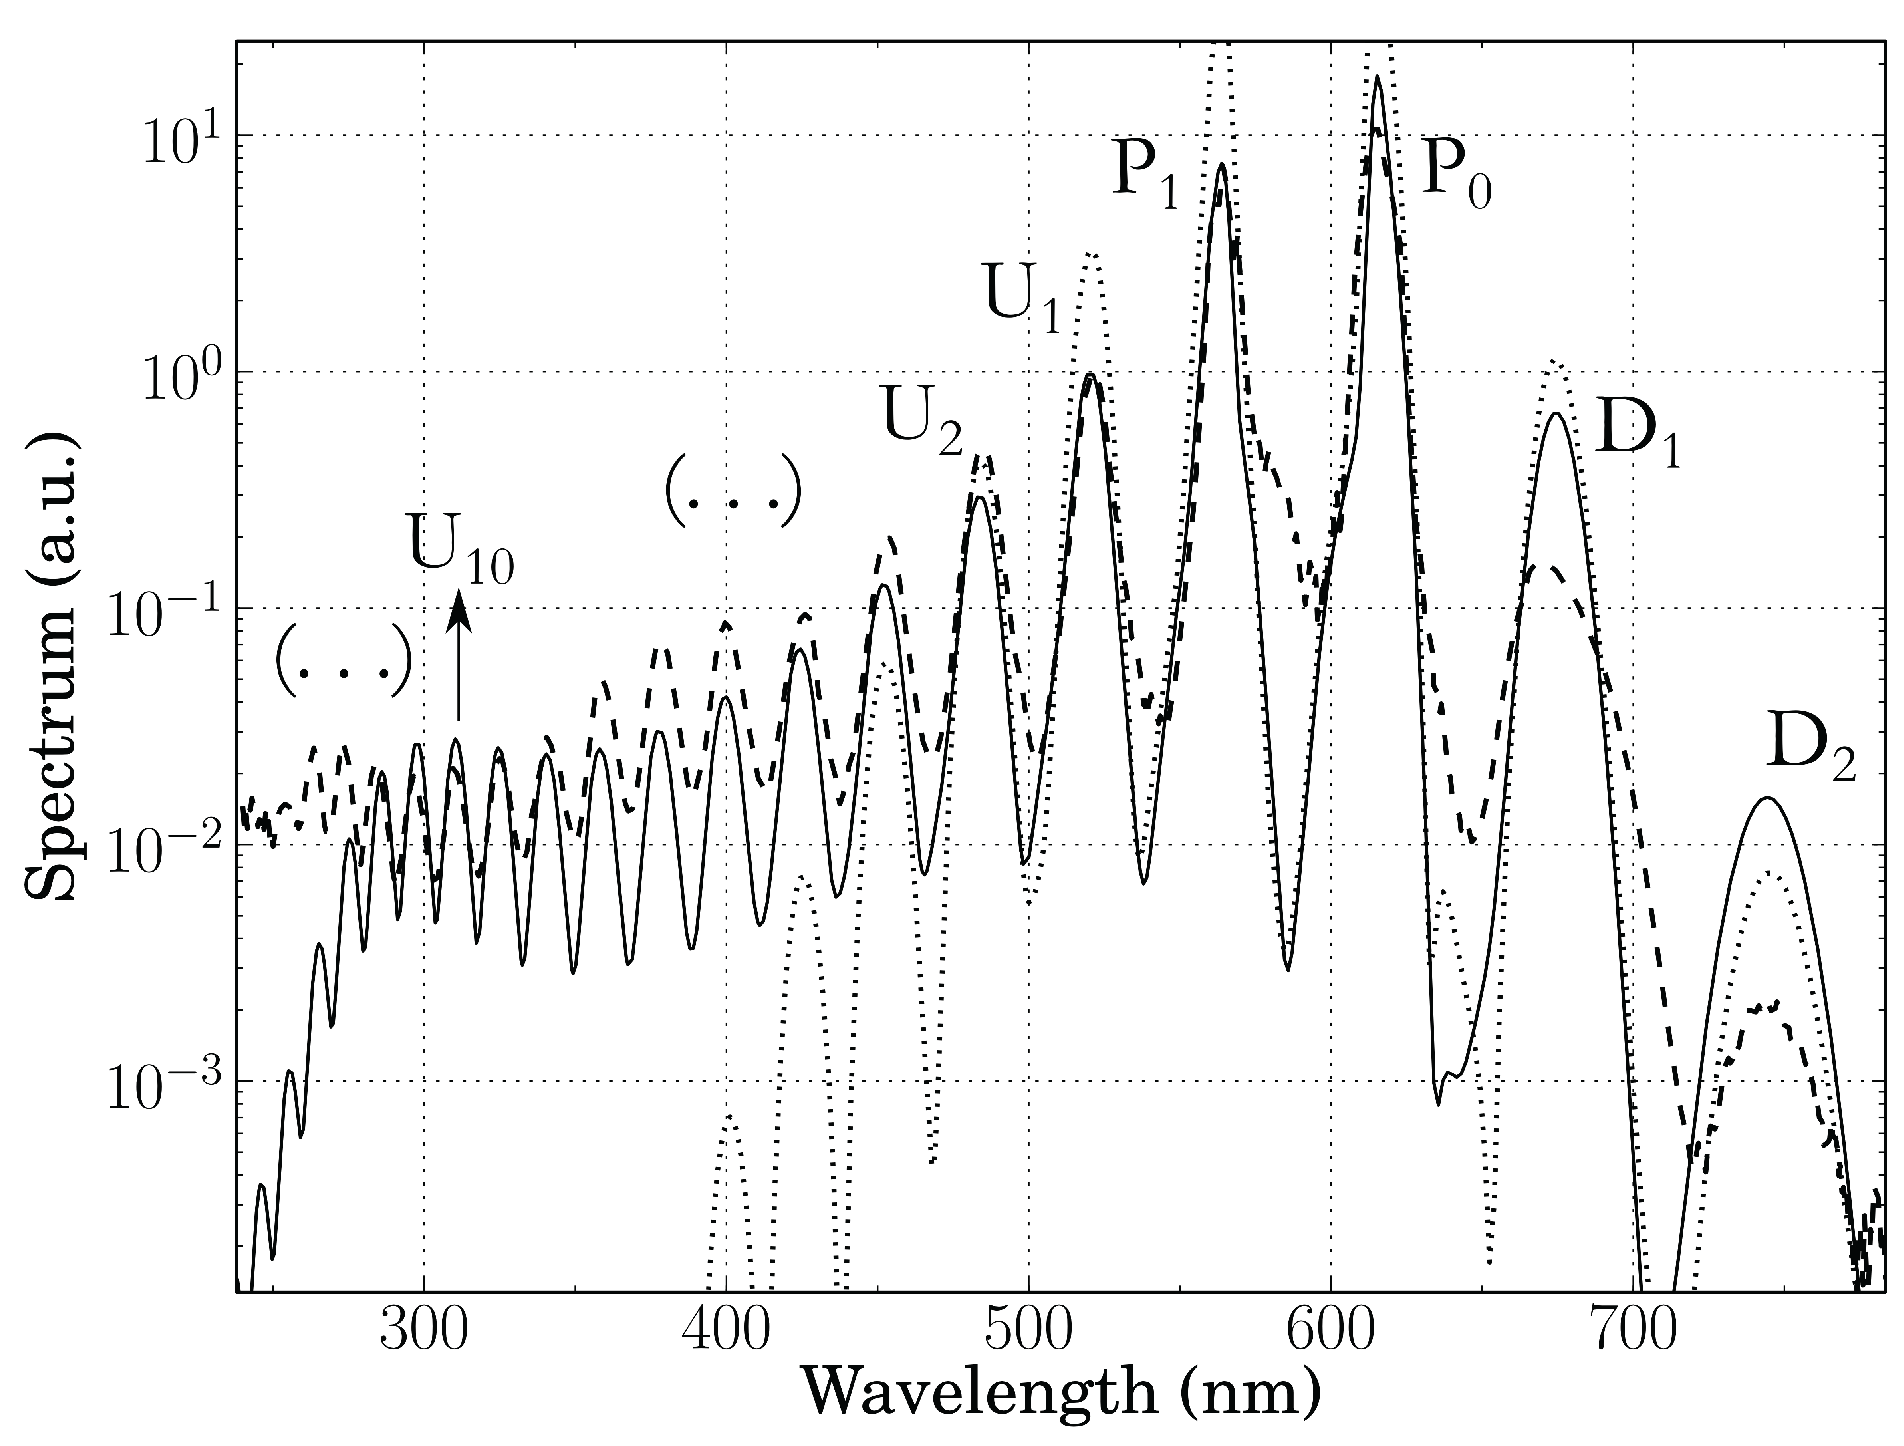
The first experiment on highly nondegenerate noncollinear CFWM was done by H. Crespo et al. at LOA (Laboratoire d’Optique Appliquée in Palaiseau, France) [11] and the experimental setup can be seen in Figure 2a. The laser source is a dye laser-amplifier system delivering an orange beam (frequency ω0, λ0 = 618 nm, 80 fs) and a green beam (frequency ω1, λ1 = 561 nm, 40 fs). Both beams are horizontally polarized and with near-Gaussian spatial profiles (approximately 5 mm diameter). The green beam was sent through a delay-line and both beams were coupled through a 50/50 beam splitter to impinge on a large section plane-convex lens (f = 30 cm) at an adjustable small angle. The lens focuses both beams in a thin slide of BK7 glass with 150 μm thickness at an external angle θ = 2.9°. A thin glass slide was chosen to minimize self-phase modulation processes and it was also placed 1 cm before the focus of the lens to avoid laser-induced damage. At the plane of the slide both beams had 20 μJ energy, corresponding to intensities of 1.0 TW cm−2 for the orange and 2.1 TW cm−2 for the green beam. When both beams were temporally synchronized at the plane of the slide, a large set of multicolored beams (Figure 2b) was produced at both sides of the incident beams, consisting of two frequency-downshifted beams (we will call Dn the downconverted beam of order n) in the red and near infrared, as well as 11 frequency-upshifted beams (we will call Un the upconverted beams of order n) extending into the blue and ultraviolet regions of the spectrum. The ultraviolet beams are seen as blue in the picture because the screen used was fluorescent, whereas the second downconverted beam could be observed with the help of a NIR viewer. The spectrum of the generated beams was registered by collecting the generated fan of beams with a large aperture aluminum-coated parabolic mirror M4 to minimize chromatic aberration and UV absorption and by sending the collimated beams to a spectrograph equipped with a CCD camera where the resulting spectrum is given in Figure 3. Two downconverted bands (D1 and D2) can be seen to the left of the pump beams, while only 5 upconverted bands (U1 to U5) are seen to the right, due to sensitivity limitations of the CCD in the blue and UV spectral ranges. All generated orders are broadband, with bandwidths of the order of those of the pump and signal beams (16 nm approximately) which are larger than the original laser bandwidths (5–6 mm) due to some self- and cross-phase modulation taking place within the slide. Energy measurements were done with a calibrated photodetector and the whole set of newly generated beams carried about 5%–10% of the total energy of the orange and green pulses.
Figure 2.
(a) Experimental arrangement: BS, beam splitter; M1–M3, silver mirrors; M4, parabolic mirror; M5, M6, aluminum mirrors. Spacing between colors not at scale; (b) Picture of output beams as taken on a white card. Adapted from [11].
Figure 2.
(a) Experimental arrangement: BS, beam splitter; M1–M3, silver mirrors; M4, parabolic mirror; M5, M6, aluminum mirrors. Spacing between colors not at scale; (b) Picture of output beams as taken on a white card. Adapted from [11].

The spectrum of Figure 3 can be explained, to a very good approximation, by assuming a cascaded FWM process in the central frequency approximation. The two pump pulses drive the χ(3) medium at the modulation frequency ωm = ω1 − ω0, giving rise to multiple pulses with frequencies ωn = ω0 + nωm, where n is the integer beam order and n > 1 (n < 0) denotes frequency upconverted (downconverted) pulses. This can also be written as ωn = ωn−1 + ωm or ωn = nω1 − (n − 1)ω0. Note that even though the total number of photons involved in a given process is 2n, this does not correspond to the order of the corresponding nonlinearities (2n − 1), but to that of an effective nonlinearity obtained via cascaded χ(3), i.e., third-order, processes. Table 1 shows, in an equivalent way, how the frequencies of the different orders are generated from the previous order plus or minus the modulation frequency.
Figure 3.
Spectra of the beams in the cascade: dashed curve, original spectra of the orange (P0) and green (P1) pump beams after crossing the glass slide but without temporal overlap (scaled for comparison); solid curve, spectra of the simultaneously generated beams. Adapted from [11].
Figure 3.
Spectra of the beams in the cascade: dashed curve, original spectra of the orange (P0) and green (P1) pump beams after crossing the glass slide but without temporal overlap (scaled for comparison); solid curve, spectra of the simultaneously generated beams. Adapted from [11].

| Order n | Frequency ωn = ω0 − nωm | Equivalence |
|---|---|---|
| − n | ω− n = ω0 − nωm = (n + 1)ω0 − nω1 | ω− n = ω−n+1 − ωm |
| · | · | · |
| · | · | · |
| · | · | · |
| −2 | ω−2 = ω0 − 2ωm = 3ω0 − 2ω1 | ω−2 = ω−1 − ωm |
| −1 | ω−1 = ω0 − ωm = 2ω0 − ω1 | ω−1 = ω0 − ωm |
| 0 | ω0 = ω0 | ω0 |
| 1 | ω1 = ω0 + ωm = ω1 | ω1 |
| 2 | ω2 = ω0 + 2ωm = 2ω1 − ω0 | ω2 = ω1 + ωm |
| 3 | ω3 = ω0 + 3ωm = 3ω1 − 2ω0 | ω3 = ω2 + ωm |
| · | · | · |
| · | · | · |
| · | · | · |
| n | ωn = ω0 + nωm = nω1 − (n − 1)ω0 | ωn = ωn−1 + ωm |
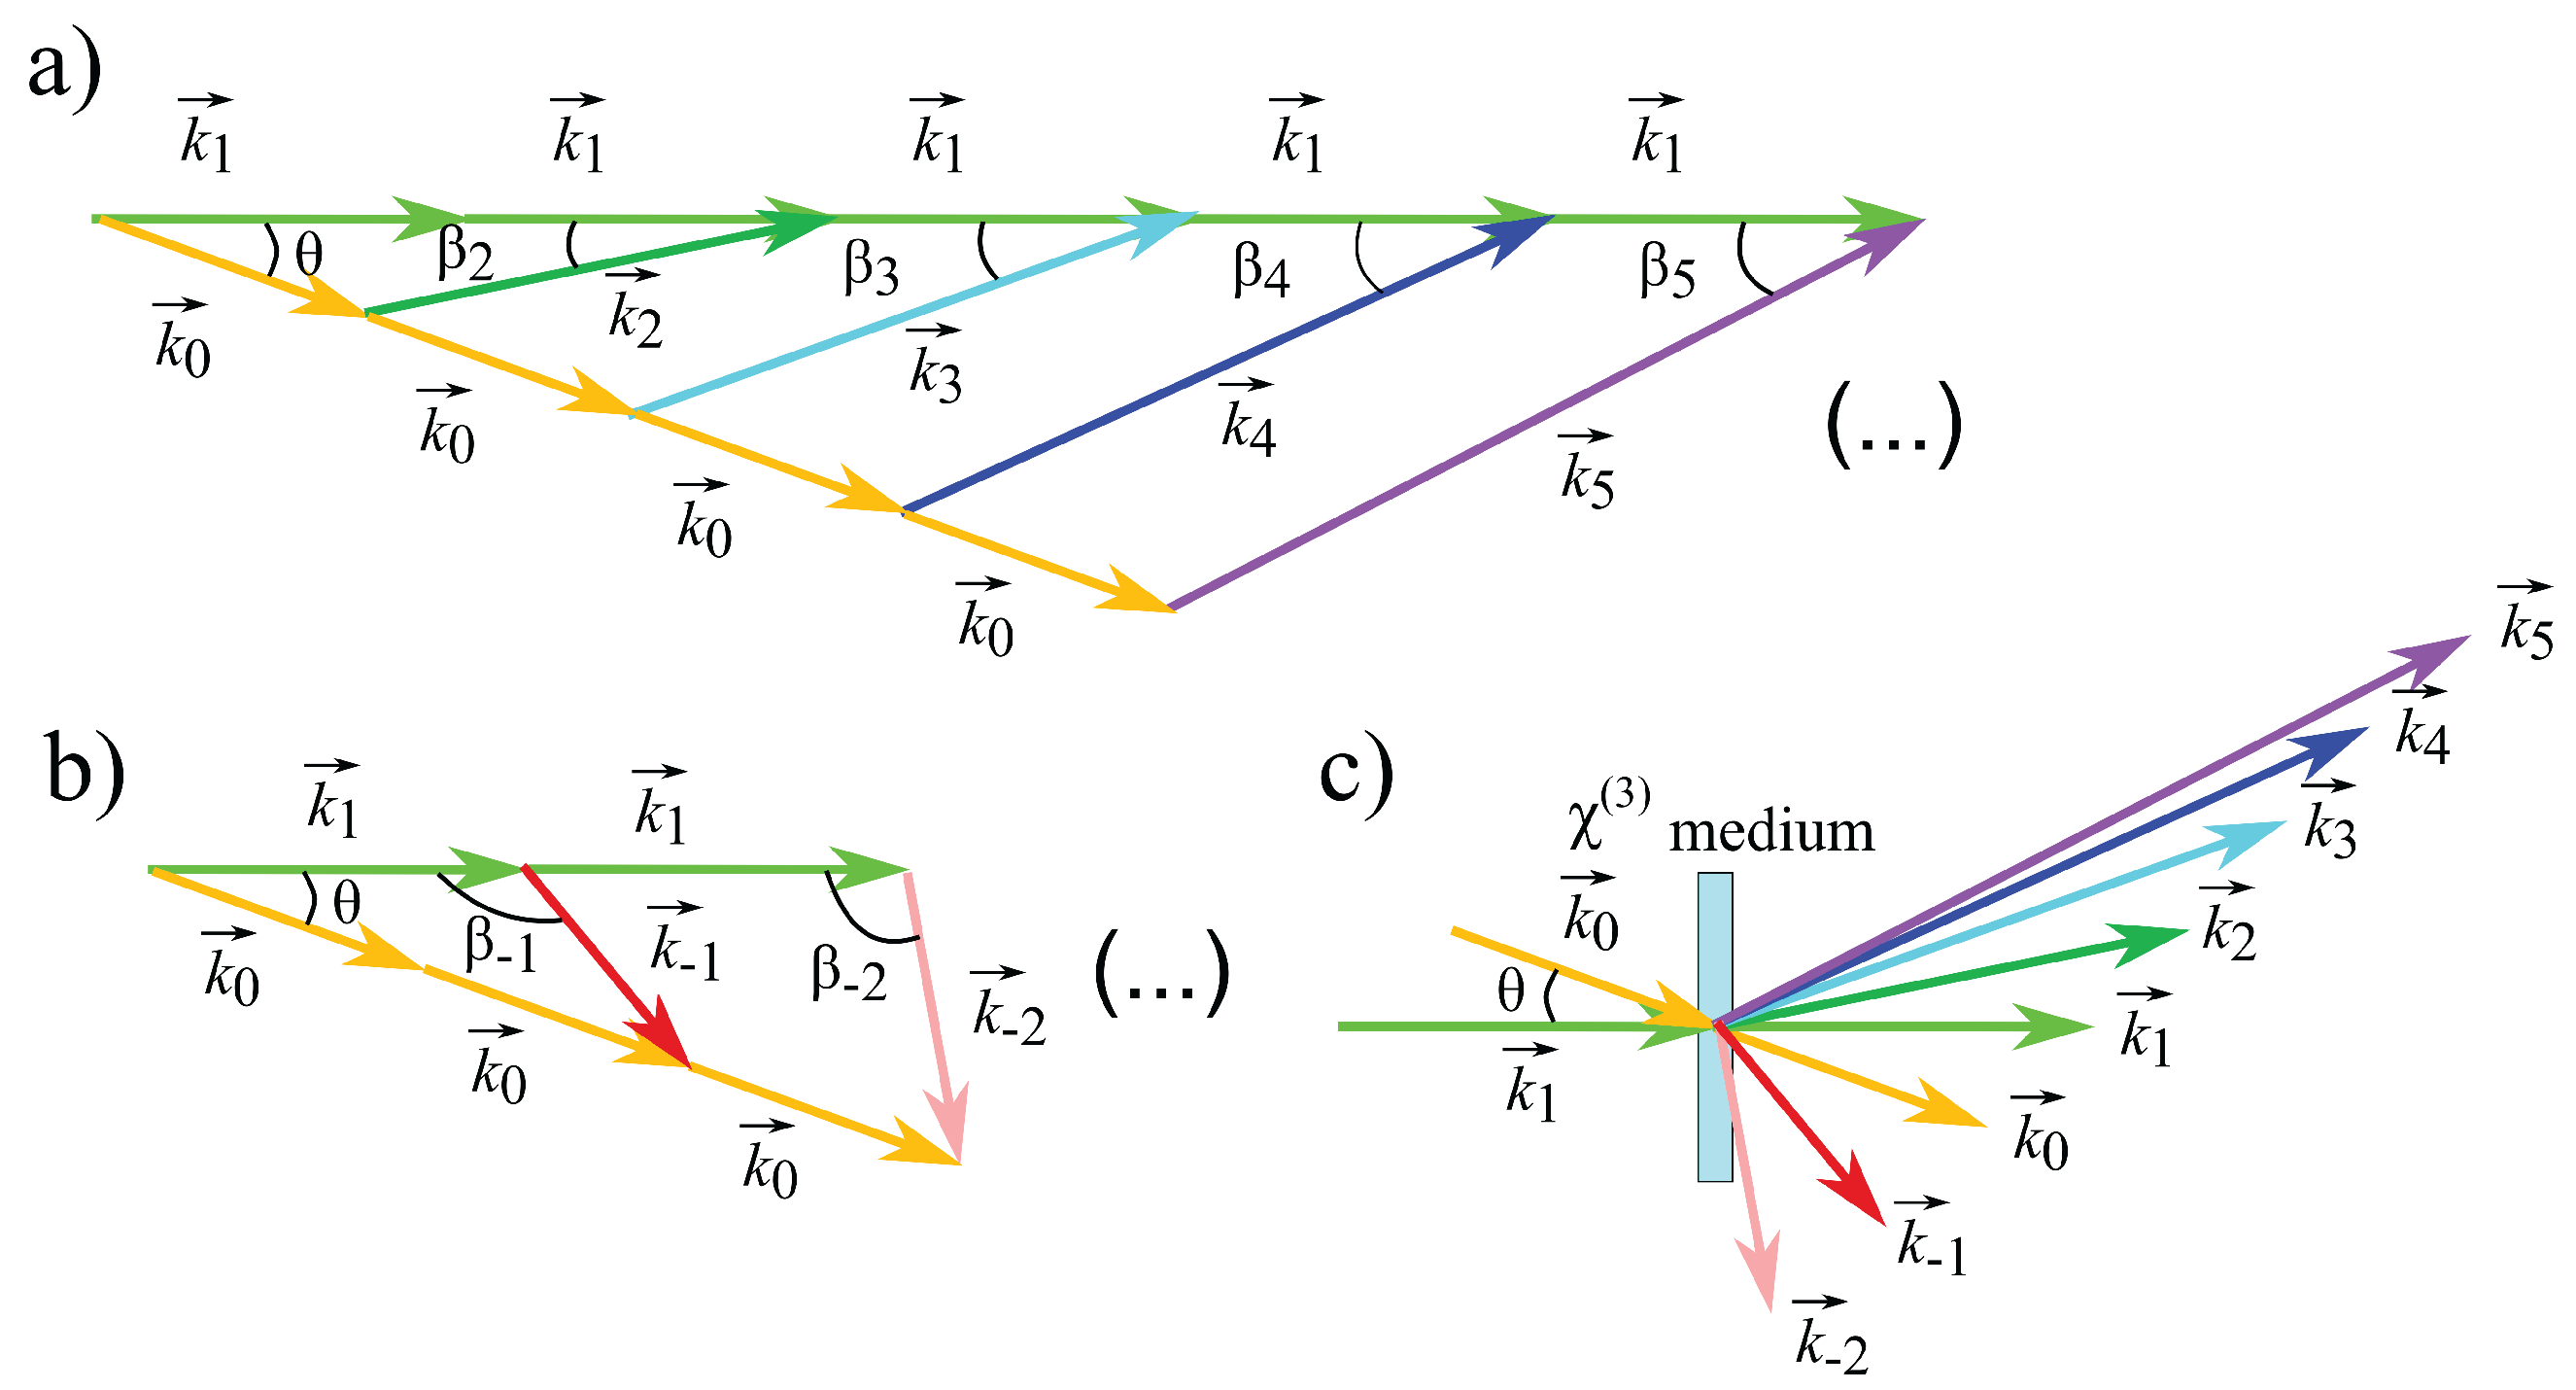
An approximate description of the cascaded FWM process is completed by considering the phase-matching condition for the wave vectors of the upconverted and downconverted beams. Let us call k0 and k1 the wave vectors of the lower frequency (orange) and higher frequency (green) pump, whereas k−n and kn denote the wave vector of a downconverted beam or an upconverted beam of order n respectively. With km = k1 − k0 the modulation (or grating) wave vector, the newly generated wave vectors are approximately given by kn = k0 + nkm, or equivalently by kn = kn−1 + km or kn = nk1 − (n − 1)k0. We will see that approximate phase matching can be achieved for a large number of frequency upconversion processes in a medium with normal dispersion, whereas frequency downconversion processes are intrinsically phase-mismatched, which explains the observed asymmetry between the two processes. For the same reason, the contribution of backwards processes such as kn = kn+1 − km is small and therefore can be neglected.
Table 2 shows how the wave vectors of the different orders are generated from the previous one plus or minus the modulation wave vector.
| Order n | Wave Vector kn = k0+nkm | Equivalence |
|---|---|---|
| − n | k−n = k0 − nkm = (n + 1)k0 − nk1 | k−n = k−n+1 − km |
| · | · | · |
| · | · | · |
| · | · | · |
| −2 | k−2 = k0 − 2km = 3k0 − 2k1 | k−2 = k−1 − km |
| −1 | k−1 = k0 − km = 2k0 − k1 | k−1 = k0 − km |
| 0 | k0 | k0 |
| 1 | k1 = k0 + km = k1 | k1 |
| 2 | k2 = k0 + 2km = 2k1 − k0 | k2 = k1 + km |
| 3 | k3 = k0 + 3km = 3k1 − 2k0 | k3 = k2 + km |
| · | · | · |
| · | · | · |
| · | · | · |
| n | kn = nk1 − (n − 1)k0 | kn = kn−1 + km |
Figure 4 shows the diagrams for the vector additions in the cascaded FWM processes for both the upconverted and downconverted beams, along with their exiting angles βn.
Moreover it is possible to calculate the interaction angle θn that the main beams should have inside the medium for phase matching to occur for a particular process of order n, under the assumed approximation. Let us choose a coordinate frame in which . In this frame would be given by ) and let us have in mind that any wave vector is related with the refractive index of the medium through . Thus for the upconverted beams the equation is written in this coordinate system as
Figure 4.
Wave vectors of the upconverted and downconverted beams generated by cascaded four-wave mixing (CFWM). (a) upconversion processes; (b) downconversion processes; (c) schematic of the wave vector distribution obtained by CFWM in real space.
Figure 4.
Wave vectors of the upconverted and downconverted beams generated by cascaded four-wave mixing (CFWM). (a) upconversion processes; (b) downconversion processes; (c) schematic of the wave vector distribution obtained by CFWM in real space.

Its square modulus is given by
and solving for we obtain
which is valid for the upshifts () and downshifts (). With reference to Figure 4a,b, the emission angles of the newly generated orders can be obtained by calculating the corresponding wave vectors (e.g., for the first frequency-upshifted beam), with the ideal phase-matching angle given by Equation (3), and determining their angle with respect to the horizontal axis, which results in
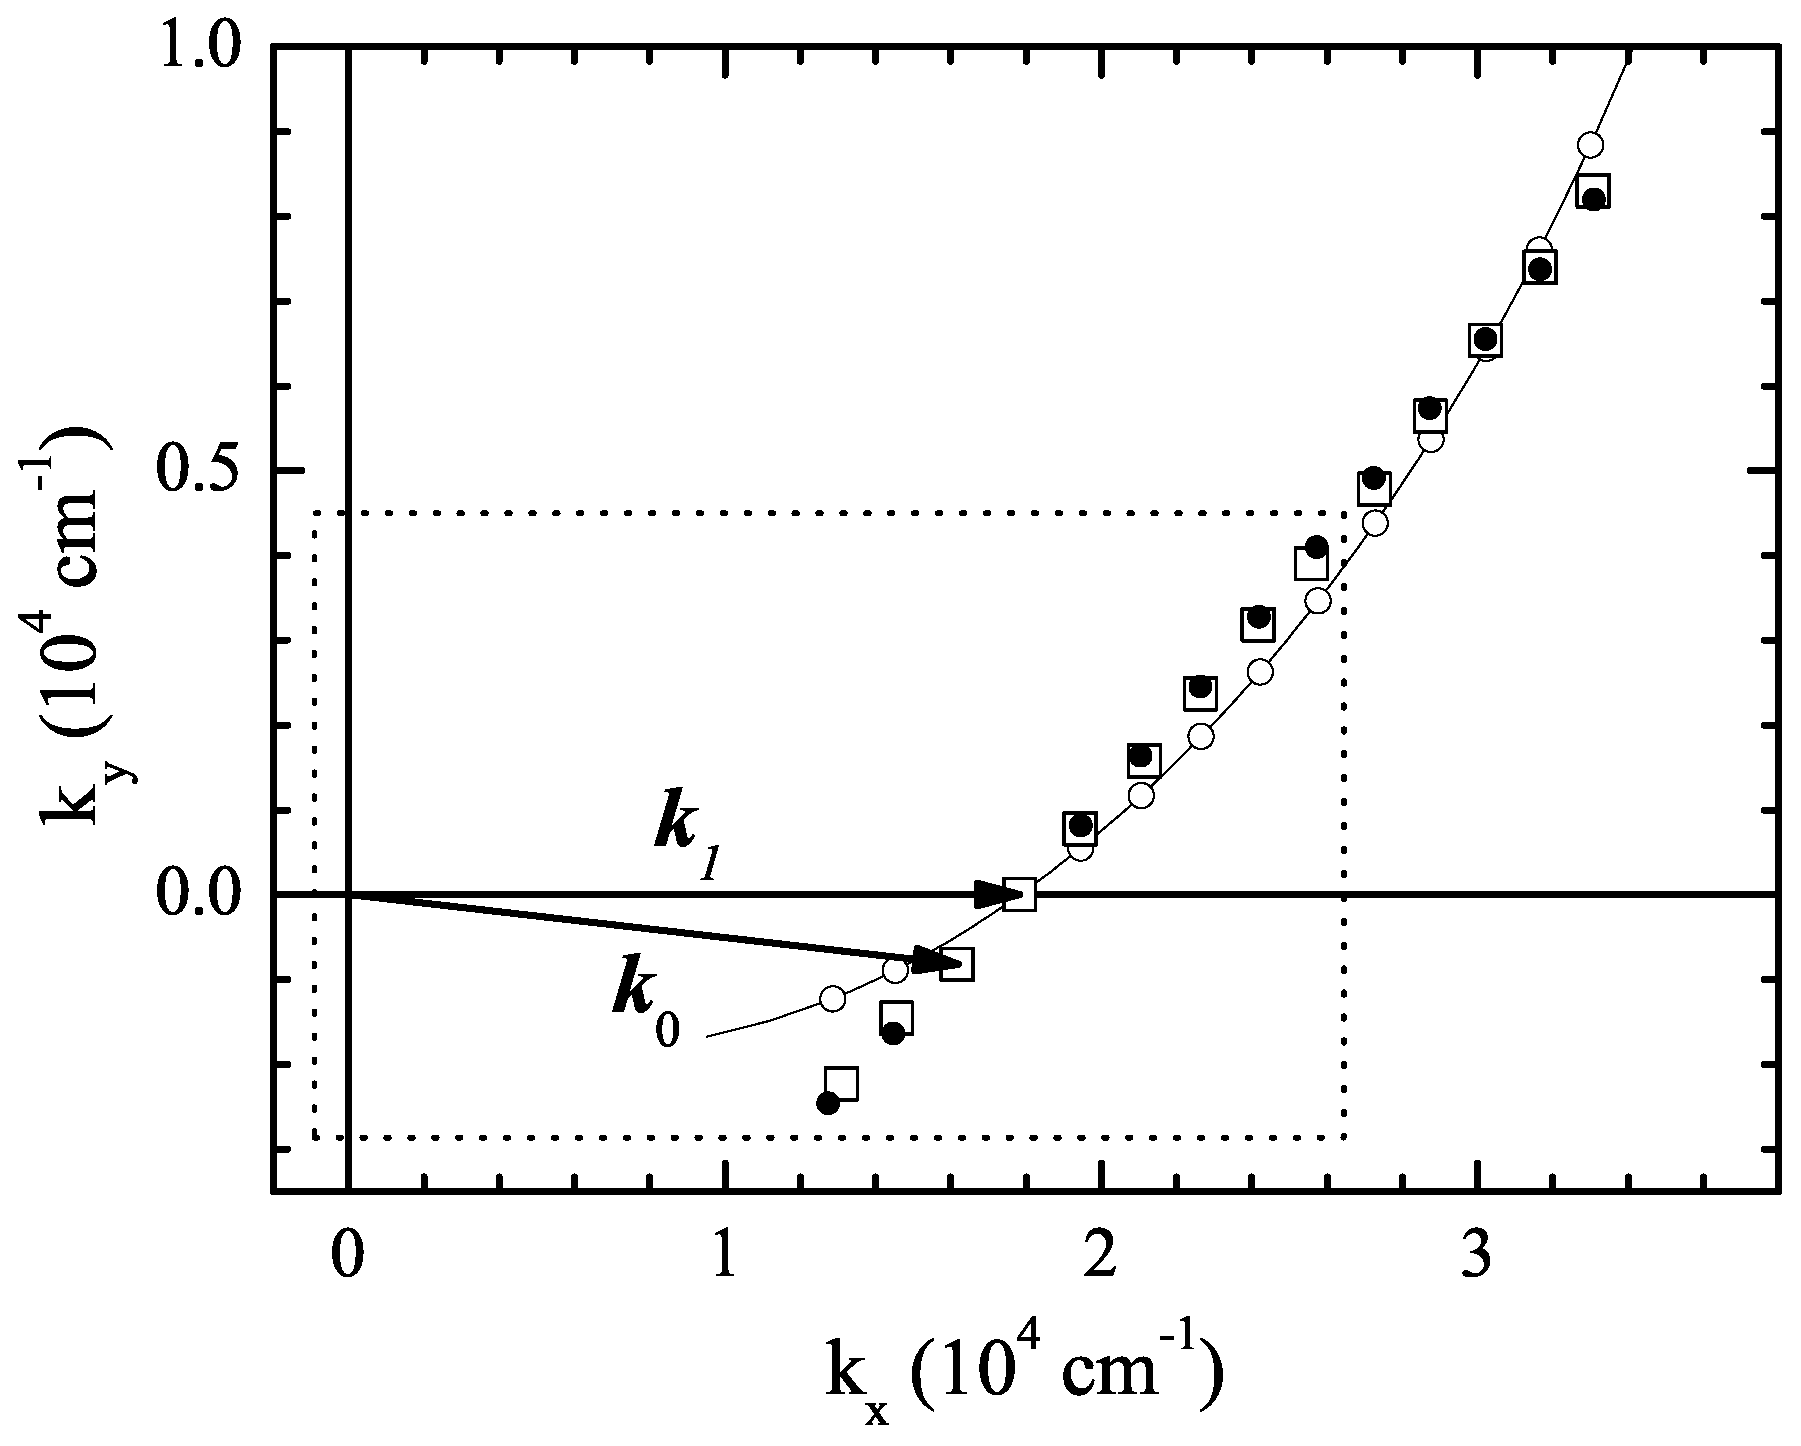
Hence it is possible to calculate the interaction angle between the beams inside the medium for the different orders to appear. Thus one can chose for example the phase matching angle which optimizes the first upconverted order. This order will be generated in optimum energy conditions and the remaining orders will be generated less efficiently, since perfect phase-matching is not set for them. Also, it is not possible to exactly phase-match frequency down conversion processes in media with normal dispersion, as Equation (4) does not have a real solution, which results in the observed asymmetry between frequency upconverted and downconverted beams. The fact that the interaction angle affects the generation of the cascade of colors was experimentally observed [11] and the fact that angle phase-matching was achieved thanks to the material dispersion was settled, as detailed below. Figure 5 shows the measured and calculated wave vectors generated in the first nondegenerate CFWM experiment, where the two-color pump beams cross in the medium at an external angle of 2.9°. The arrows denote the pump beam wave vectors; the ten consecutive upconverted beams appear above the horizontal axis, and the two downconverted beams are below this axis. The open squares falling outside the dotted box are the five upconverted beams for which only the wave vector direction was measured directly, and hence the amplitude was extrapolated from the phase-matching conditions. The filled circles are calculated with the phase-matching conditions, where and were obtained directly from spectral and angular measurements of the pump pulses. The open circles are the calculations for perfectly phase-matched beams and are shown for reference only, since a cascade of such ideal processes (which would required different angles for each process) cannot be obtained experimentally.
Figure 5.
Representation of the wavevectors of all the beams in the pattern: open squares, measured points; filled circles, calculation with the approximate cascaded processes; open circles, calculated exactly phase-matched beams, with the interaction angle given by Equation (3). The solid curve is a guide. Adapted from [11].

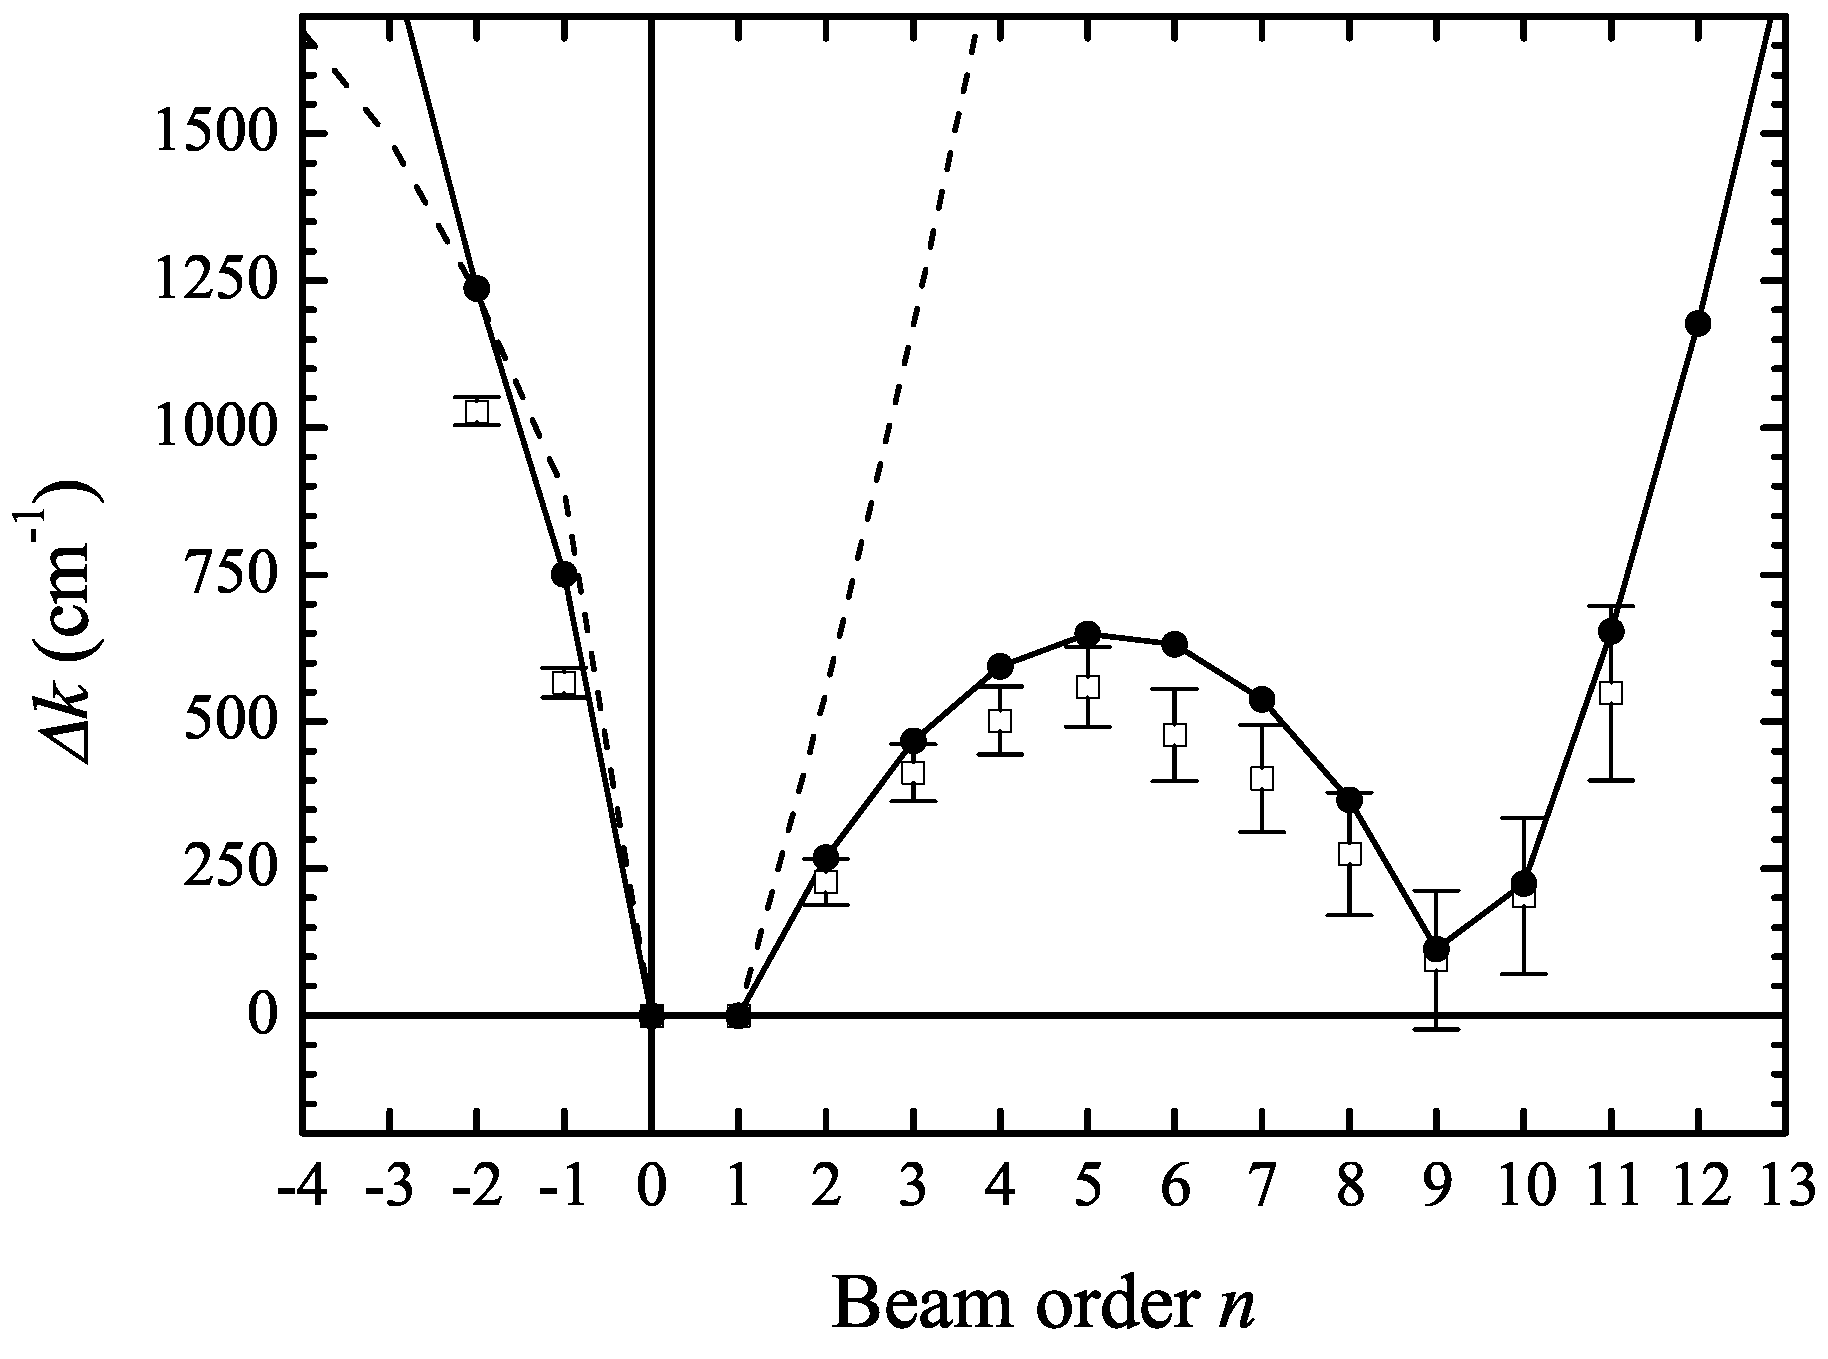
Figure 6 shows the phase mismatch for the optimized interaction angle of 2.9° as a function of beam order n, where n > 1 (n < 0) correspond to upconverted (downconverted) beams. The dashed curve is a calculation assuming collinear geometry (0°). As the interaction angle approaches 2.9°, the wave vector mismatch becomes clearly asymmetric, with the appearance of a region where the material dispersion is partially compensated for by the interaction angle. Since the self-phase modulated pump pulses have very large bandwidths, the geometry that results in phase-matching of the nth-order beam can give rise to multiple emission for all orders below n, provided that the maximum phase-mismatch for each order is less than approximately three times the bandwidth of the ultrafast pump pulses (∼1350 cm−1). We see that eleven upconverted beams and two downconverted beams all fall inside this region, and so the phase-matching conditions can be met in a quite relaxed way for several orders of the cascaded processes, within the frequency range allowed by the bandwidths, and in perfect agreement which the observed asymmetry between frequency upconversion and downconversion processes. Notice that, according to this criterion, a first frequency-upshifted beam should be generated even for a collinear interaction geometry (dashed curve of Figure 6). This is indeed the case, which has been confirmed by measuring the spectra of the resulting collinear and overlapping beams (with proper attenuation of the pump and signal pulses). Experimentally, the interaction angle is adjusted for maximum overall intensity and number of orders in the projected multicolored pattern. We expect the efficiency of a particular process to be determined by the magnitude of the nonlinear susceptibilities, the strength of the input fields, the phase-mismatch of any intermediate process, and ultimately absorption for any of the fields. Moreover, we see that the optimum yield does not necessarily occur under conditions that minimize the phase-mismatch for the final step in the process. Cascading will take place in the presence of some residual phase-mismatch in either the intermediate steps or the final step. The low degree of residual phase-mismatch also allows cascaded third-order processes to dominate over any high-order direct processes since cascaded processes will be favored if the phase-mismatch of the intermediate steps is sufficiently low. Storage of energy in the intermediate field then determines the conversion efficiency, similar to the case of an intermediate resonance. Although direct higher-order processes cannot be completely ruled out, they do not appear to take part in the observed phenomenon, as the detailed numerical simulations presented in the next section also demonstrate.
Figure 6.
Wave-vector mismatch of the beams in the pattern: open squares, measured points; filled circles, calculation for the cascaded processes; dashed curve, calculation assuming collinear geometry (θ = 0°). Adapted from [11].
Figure 6.
Wave-vector mismatch of the beams in the pattern: open squares, measured points; filled circles, calculation for the cascaded processes; dashed curve, calculation assuming collinear geometry (θ = 0°). Adapted from [11].

The experiment and the simple description based on momentum and energy conservation laws already show that the process is of universal character and will occur in any material with a third order susceptibility. Hence, all materials can show CFWM processes. Indeed CFWM processes was shortly thereafter shown to occur in gases [13] and later found to occur in other materials such as sapphire [15] and in crystals [16] or using two color beams from a fundamental laser and the output of a hollow fiber [17], which also demonstrated the intrinsic tunability of the process. Highly nondegenerate CFWM was also shown to occur in an optical parametric oscillator via cascaded χ(2) processes giving rise to an effective third-order nonlinearity [18]. Recently, almost octave-spanning spectra were produced by CFWM of two synchronized ps lasers in optical microfibers [19]. Tunable CFWM has also been obtained by crossing two chirped pulses with the same central wavelength and variable delay in glass [20].
3. Knowing the Fields: The Complete Theoretical Model
Although the previous reasonings based on energy and momentum conservation allow us to understand the generation of multicolored light pulses departing from two-color pumps by cascaded FWM processes, enabling the estimation of the frequencies and emission angles of the generated beams, no predictions can be made for example regarding the energy carried by each color, nor the emission bandwidth and phase of the generated fields (including the time at which each beam is generated). Hence, a more complete model was required, which was developed based on the Slowly Varying Envelope Approximation (SVEA) for the propagation of the fields in 2.5 D (propagation along a plane while assuming cylindrical symmetry in each beam) that accurately reproduces the experimental results. The use of two spatial dimensions is important to account for angular phase-matching and actual beam overlapping region.
The wave equation for an electric field propagating in a nonlinear medium with a polarization comprising a linear and a nonlinear term as given by , is
with c the velocity of light and μ0 the vacuum permeability, where we have written the electric field as a scalar quantity, which is correct for linearly polarized fields as is the case of our experiments. Considering that the electric field is well represented under the SVEA approximation, i.e., , changing the equation to the reference frame which moves with the group velocity of the pulse (, where is the group velocity of the pulse at frequency ω0), separating the polarization into its linear and nonlinear parts and Fourier transforming to the frequency domain, the wave equation becomes
This equation describes both linear and nonlinear propagation. It includes dispersion and diffraction, as well as a particular form of which includes the instantaneous non-resonant Kerr effect and self-steepening. Note that no expansion of the wave vector was performed and therefore higher order terms of the dispersion are intrinsically included. To solve the equation, it was separated in its linear and nonlinear parts. For , the linear part of Equation (6) in the paraxial approximation () is given by
This linear part carries information about dispersion and diffraction and can be solved in the frequency domain by using a (2,2) Padé approximant for wide angle propagation.
The nonlinear part in the paraxial approximation is given by
The nonlinear polarization can be written in terms of a slowly varying envelope p as , with and is better described in the time domain. By doing the inverse Fourier transform, we get
where the first term on the right hand side accounts for self-phase modulation effects and the second for self-steepening. The accurate evaluation of the self-steepening term is essential, because the spectral span of the generated CFWM pulses is of the same order as the central frequencies of the pumps, ω0 and ω1. It should be pointed out that no additional delayed response terms were required in order to faithfully reproduce the experimental results. This equation can be solved by a second-order Runge-Kutta method, which proved sufficiently accurate.
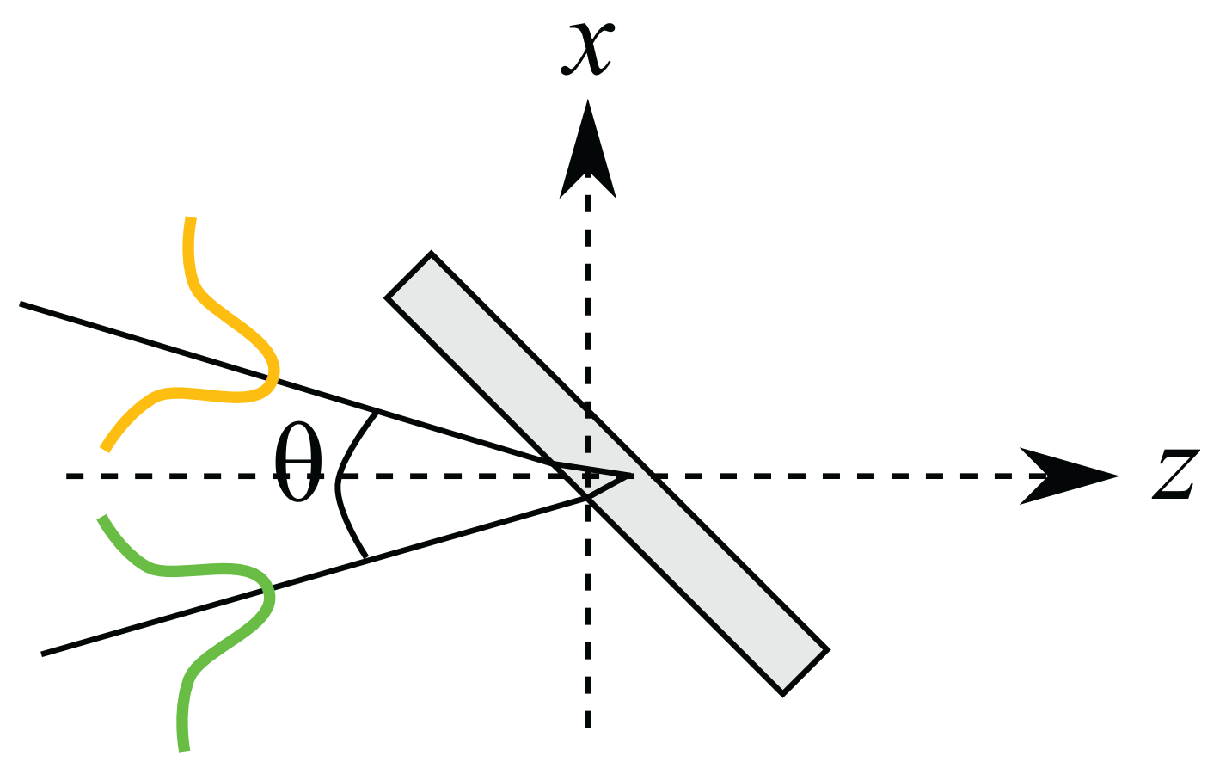
Equations (8) and (9) are very powerful in the context of the present work and can exhibit a very rich behavior, since they constitute a much better approach to the process than the simple algebraic description of the previous section. Let us consider the geometry of Figure 7 with spatial gaussian profiles or and transform limited pump pulses, for the two beams used in the first experiment: an orange beam (, = 618 nm, 80 fs) and a green beam (, = 561 nm, 40 fs), interacting at an internal angle of 1.93° (corresponding to an external angle of 2.9°) in a BK7 glass slide with a relative delay of 0 fs between them.
Figure 7.
Interaction geometry.
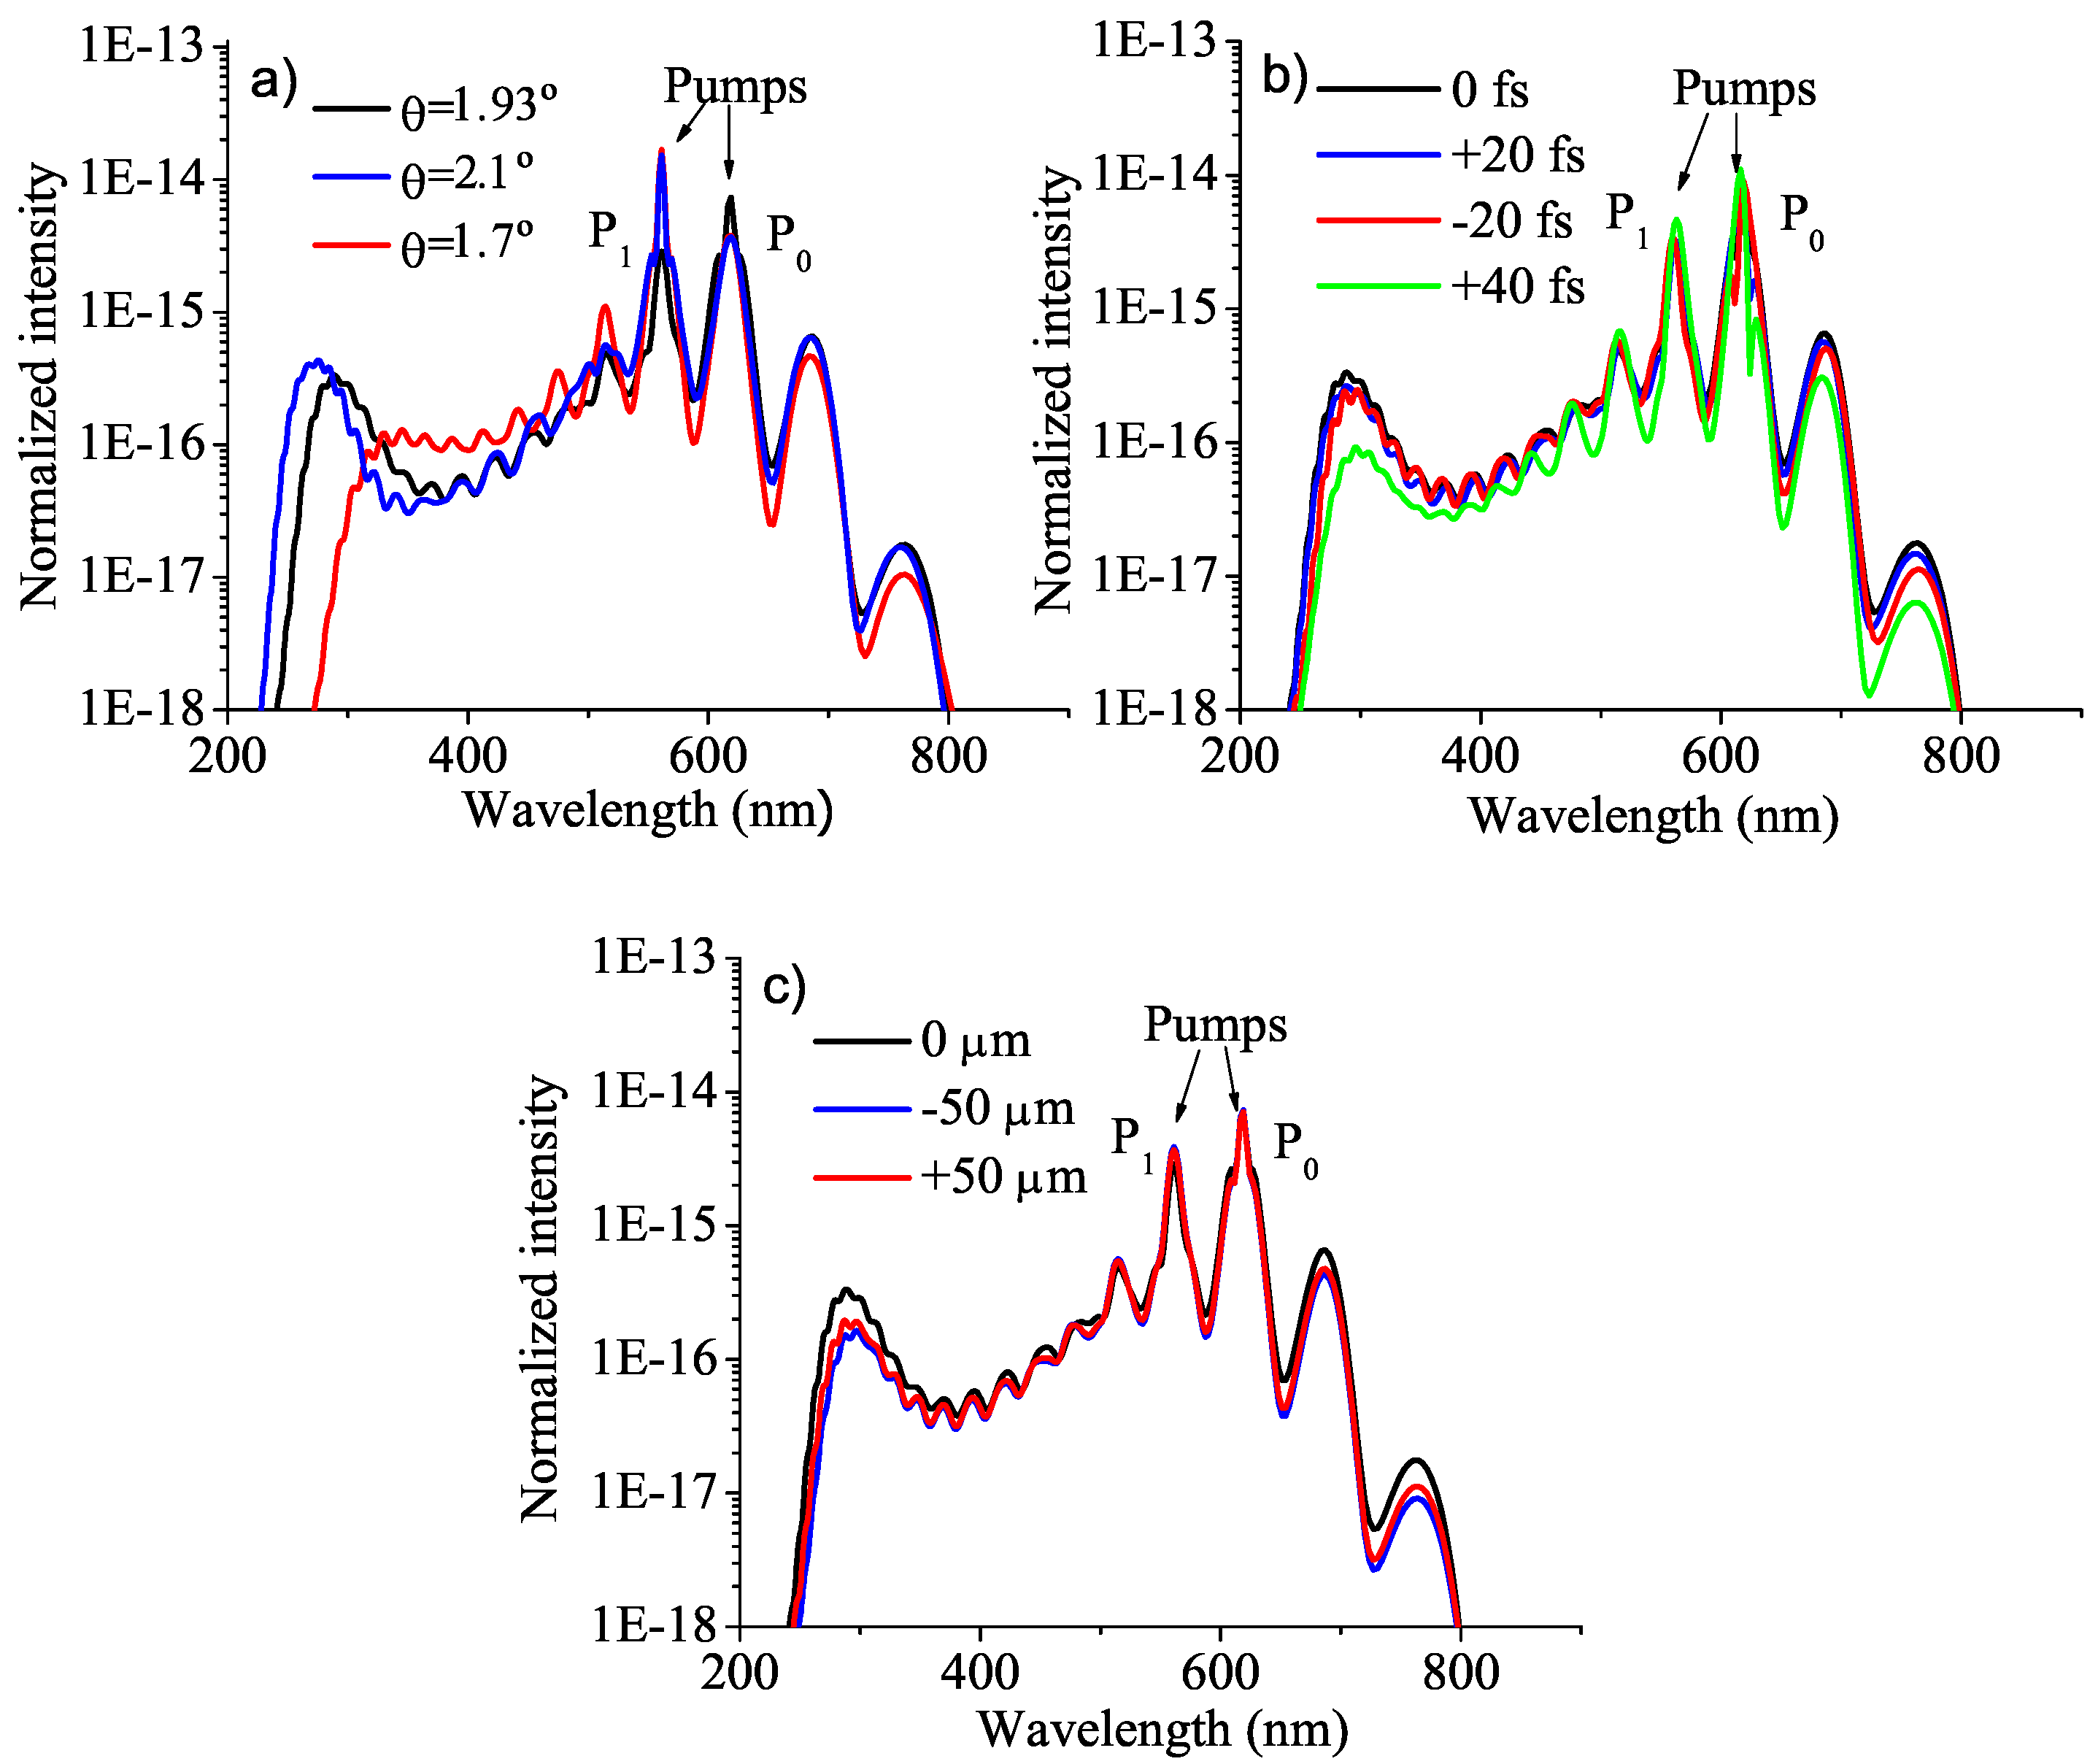
The resulting simulated CFWM spectrum is shown in Figure 8 (black curve). We see that several upshifted orders are generated, which are broadband and have well-defined central wavelengths. Also, the total spectral intensity has an envelope which decays at around 400 nm and then increases again, in agreement with the experimental observations shown in the next section. If the interaction occurs at a slightly different angle, which is a feasible situation in an experimental setup, the efficiency and the generated central wavelengths change, as shown in Figure 8 (collinear pumps don’t generate more than 1–2 CFWM orders since there is no phase-matching). For angles smaller than 1.93°, the generated orders don’t reach so far into the UV, while for angles larger than 2° the overall efficiency drops rapidly (Figure 8a). For a fixed interaction angle, different time delays between the pump and the signal can be set, which also influences the central wavelength of the generated orders due to additional shifts caused by cross-phase modulation and the varying amount of temporal and spatial overlap between the two pump beams (Figure 8b). We see that for delays of ± 20 fs (typical reading precision of a manual delay line) around the optimum zero delay point, the overall efficiency drops by only a small amount (more noticeable for higher orders) since such delays are still well within the 40 and 80 fs FWHM pump pulse durations. For delays larger than ± 40 fs the efficiency starts to drop significantly, as illustrated in Figure 8b for the +40 fs case. The model also offers the possibility of spatially shifting the pumps at the entrance of the slide. Figure 8c shows the dependence of the generated field intensity for different spatial overlaps of the pump beams. For ± 50 μm shifts in the overlap of the pump beams (each 100 μm in diameter) at the entrance plane of the medium, the overall efficiency decreases roughly by a factor of 2 with respect to the perfect overlap (0 μm) case. This is again more noticeable for the higher orders in the ultraviolet and near-infrared regions.
Figure 8.
(a) Generated spectra for different interaction angles; (b) Generated spectra for 1.93° and different relative time delays between pumps (positive delay P1 arrives before P0, negative delay P0 arrives before P1); (c) Generated spectra for θ = 1.93°, 0 fs relative time delay and different entrance x-positions at the slide.

Hence it is possible to tune the generated spectra by varying the interaction angle and/or the delay, in very good agreement with experimental observations. This means that the terms considered in the linear and nonlinear sub-equations are sufficient to faithfully reproduce the experimental results, as seen further below. The experiment was repeated in a 150 μm fused silica slide to obtain more upconverted orders in the UV and the internal interaction angle was 1.57°. In this situation, multiple CFWM orders were generated up to the 21st upshifted order at 209 nm (made visible with the help of a fluorescent card) and were registered with a broadband fiber-coupled spectrometer, but due to spectral limitations the measurement reached only down to 250 nm. The temporal characteristics of the beams were measured by polarization-gating FROG (PG-XFROG). More details about these experiments are given in the next section.
The simulations provide the time dependent field distribution at the end of the glass slide as a function of the transverse coordinate x and frequency ω. The corresponding total spectrum (obtained by integrating along the transverse direction) for an interaction angle of 1.57° is given in Figure 9 and clearly shows the asymmetric generation of up and downconverted orders. The efficiency of the generated frequency upshifted pulses follows the same pattern as the experiment, although it has a sharper cutoff after the 12th order that depends on the interaction angle and pulse energy. This discrepancy is possibly due to experimental intensity calibration errors, which are larger at the spectral edges.
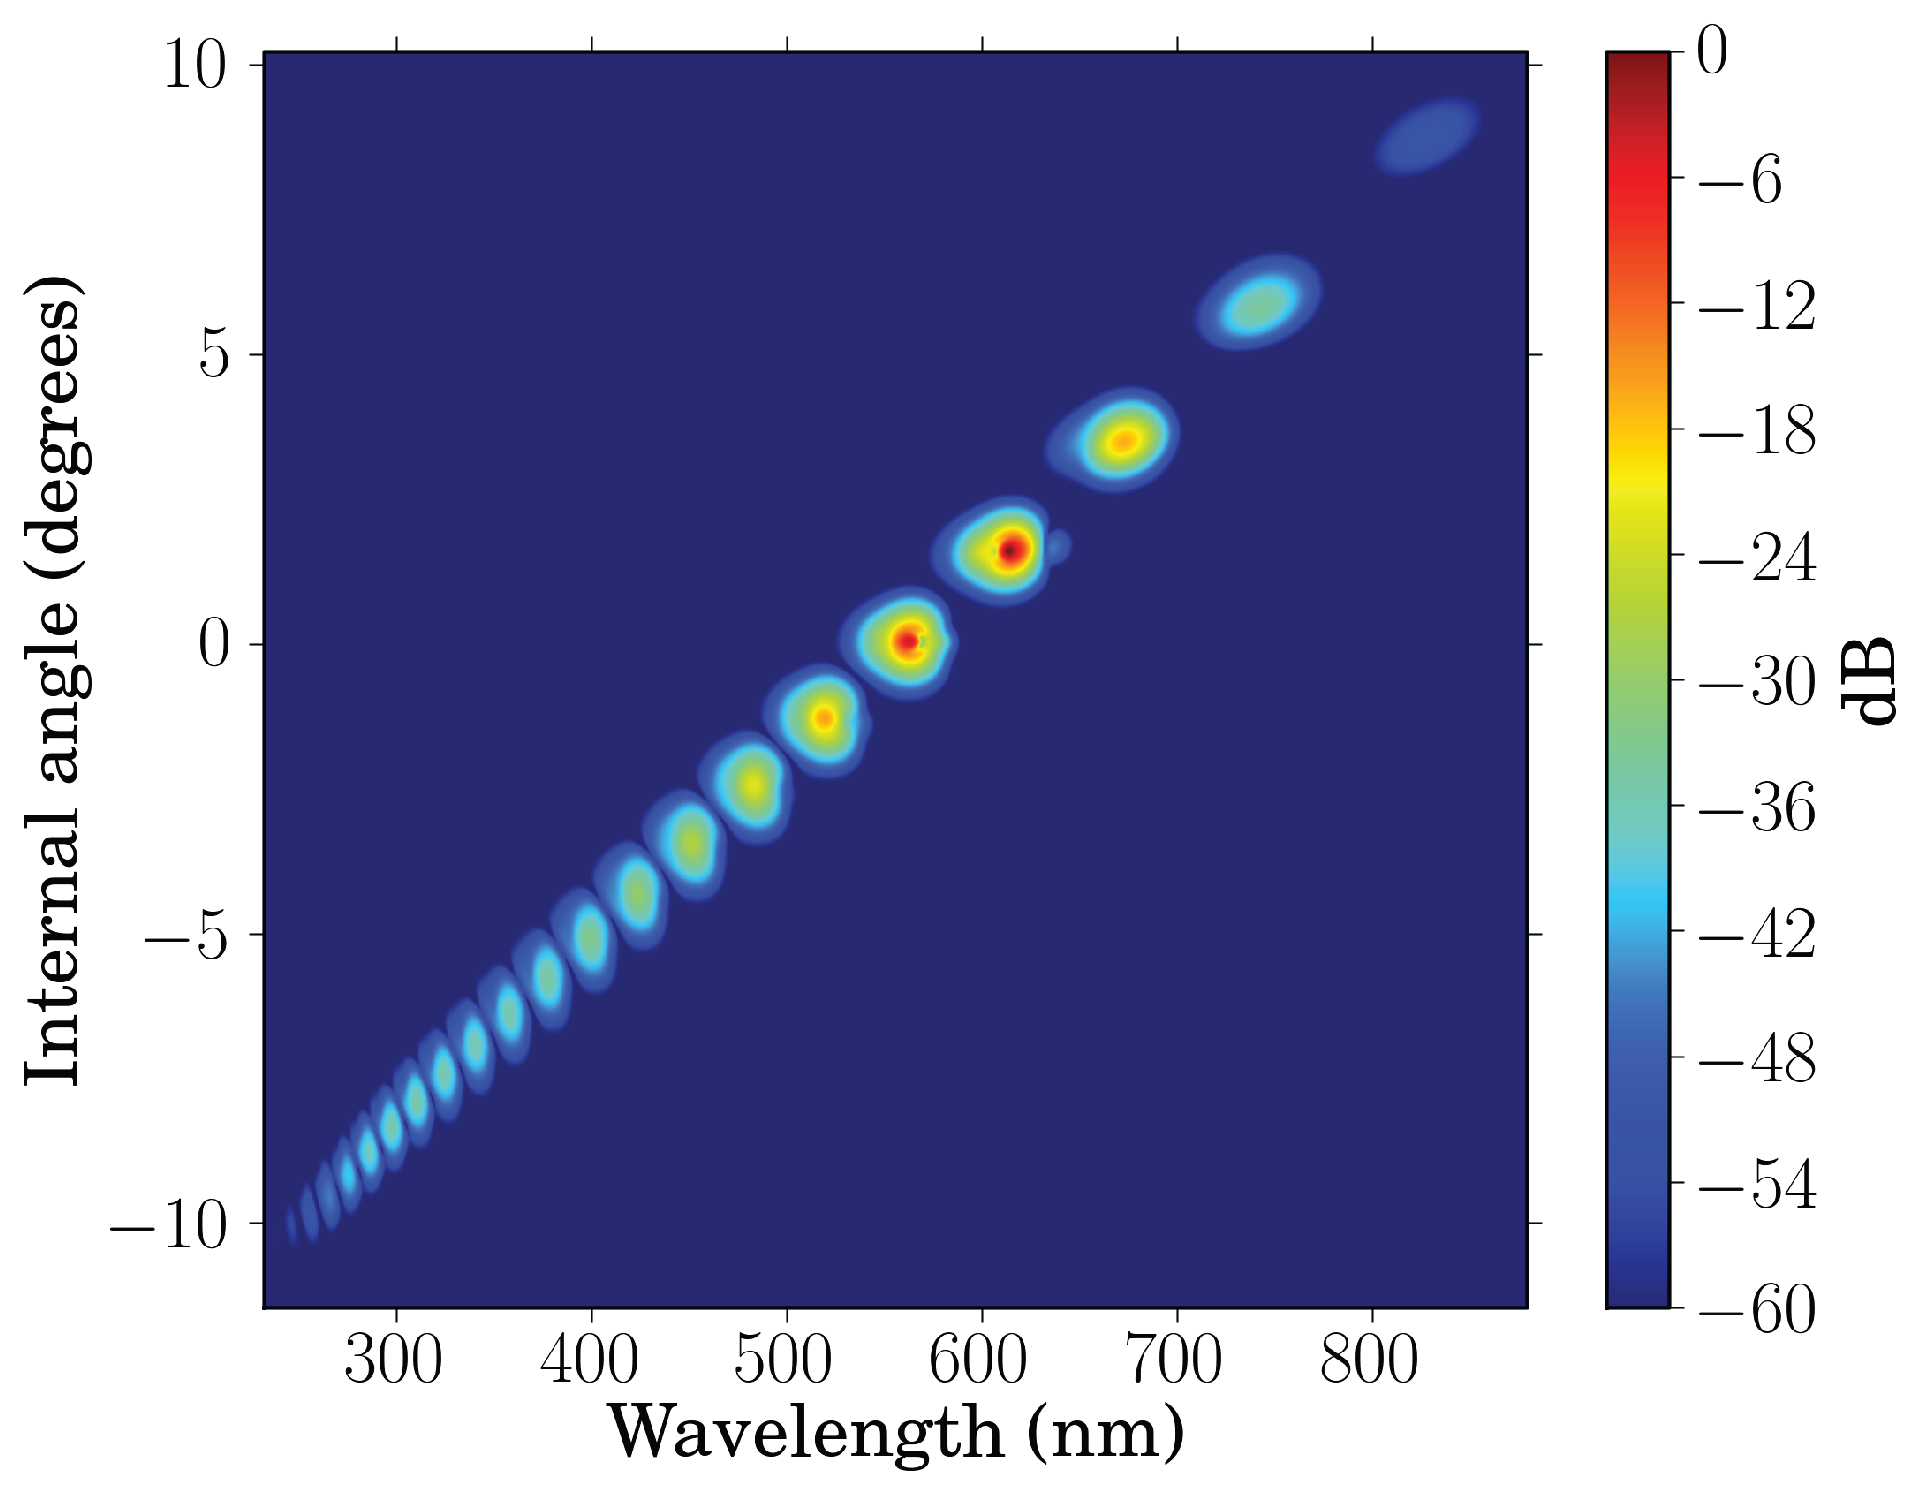
A look at the fields inside the slide shows that all orders are practically generated within the first 60 μm of material. The spatial resolution of the model allows determining at which angle each of the orders is generated. This can be seen in the θ − λ plot in Figure 10.
Figure 9.
Spectrum of the multiple CFWM orders generated in fused silica spanning over 1.5 octaves (the two pump frequencies correspond to the two larger peaks). Dashed line: Experimental results (see [21]), Solid line: Numerical simulation, Dotted line: Numerical simulation for collinear pumps [22].

Figure 10.
Simulated θ − λ spectrum of the CFWM beams, clipped at 10−6 of the maximum [22].
Figure 10.
Simulated θ − λ spectrum of the CFWM beams, clipped at 10−6 of the maximum [22].

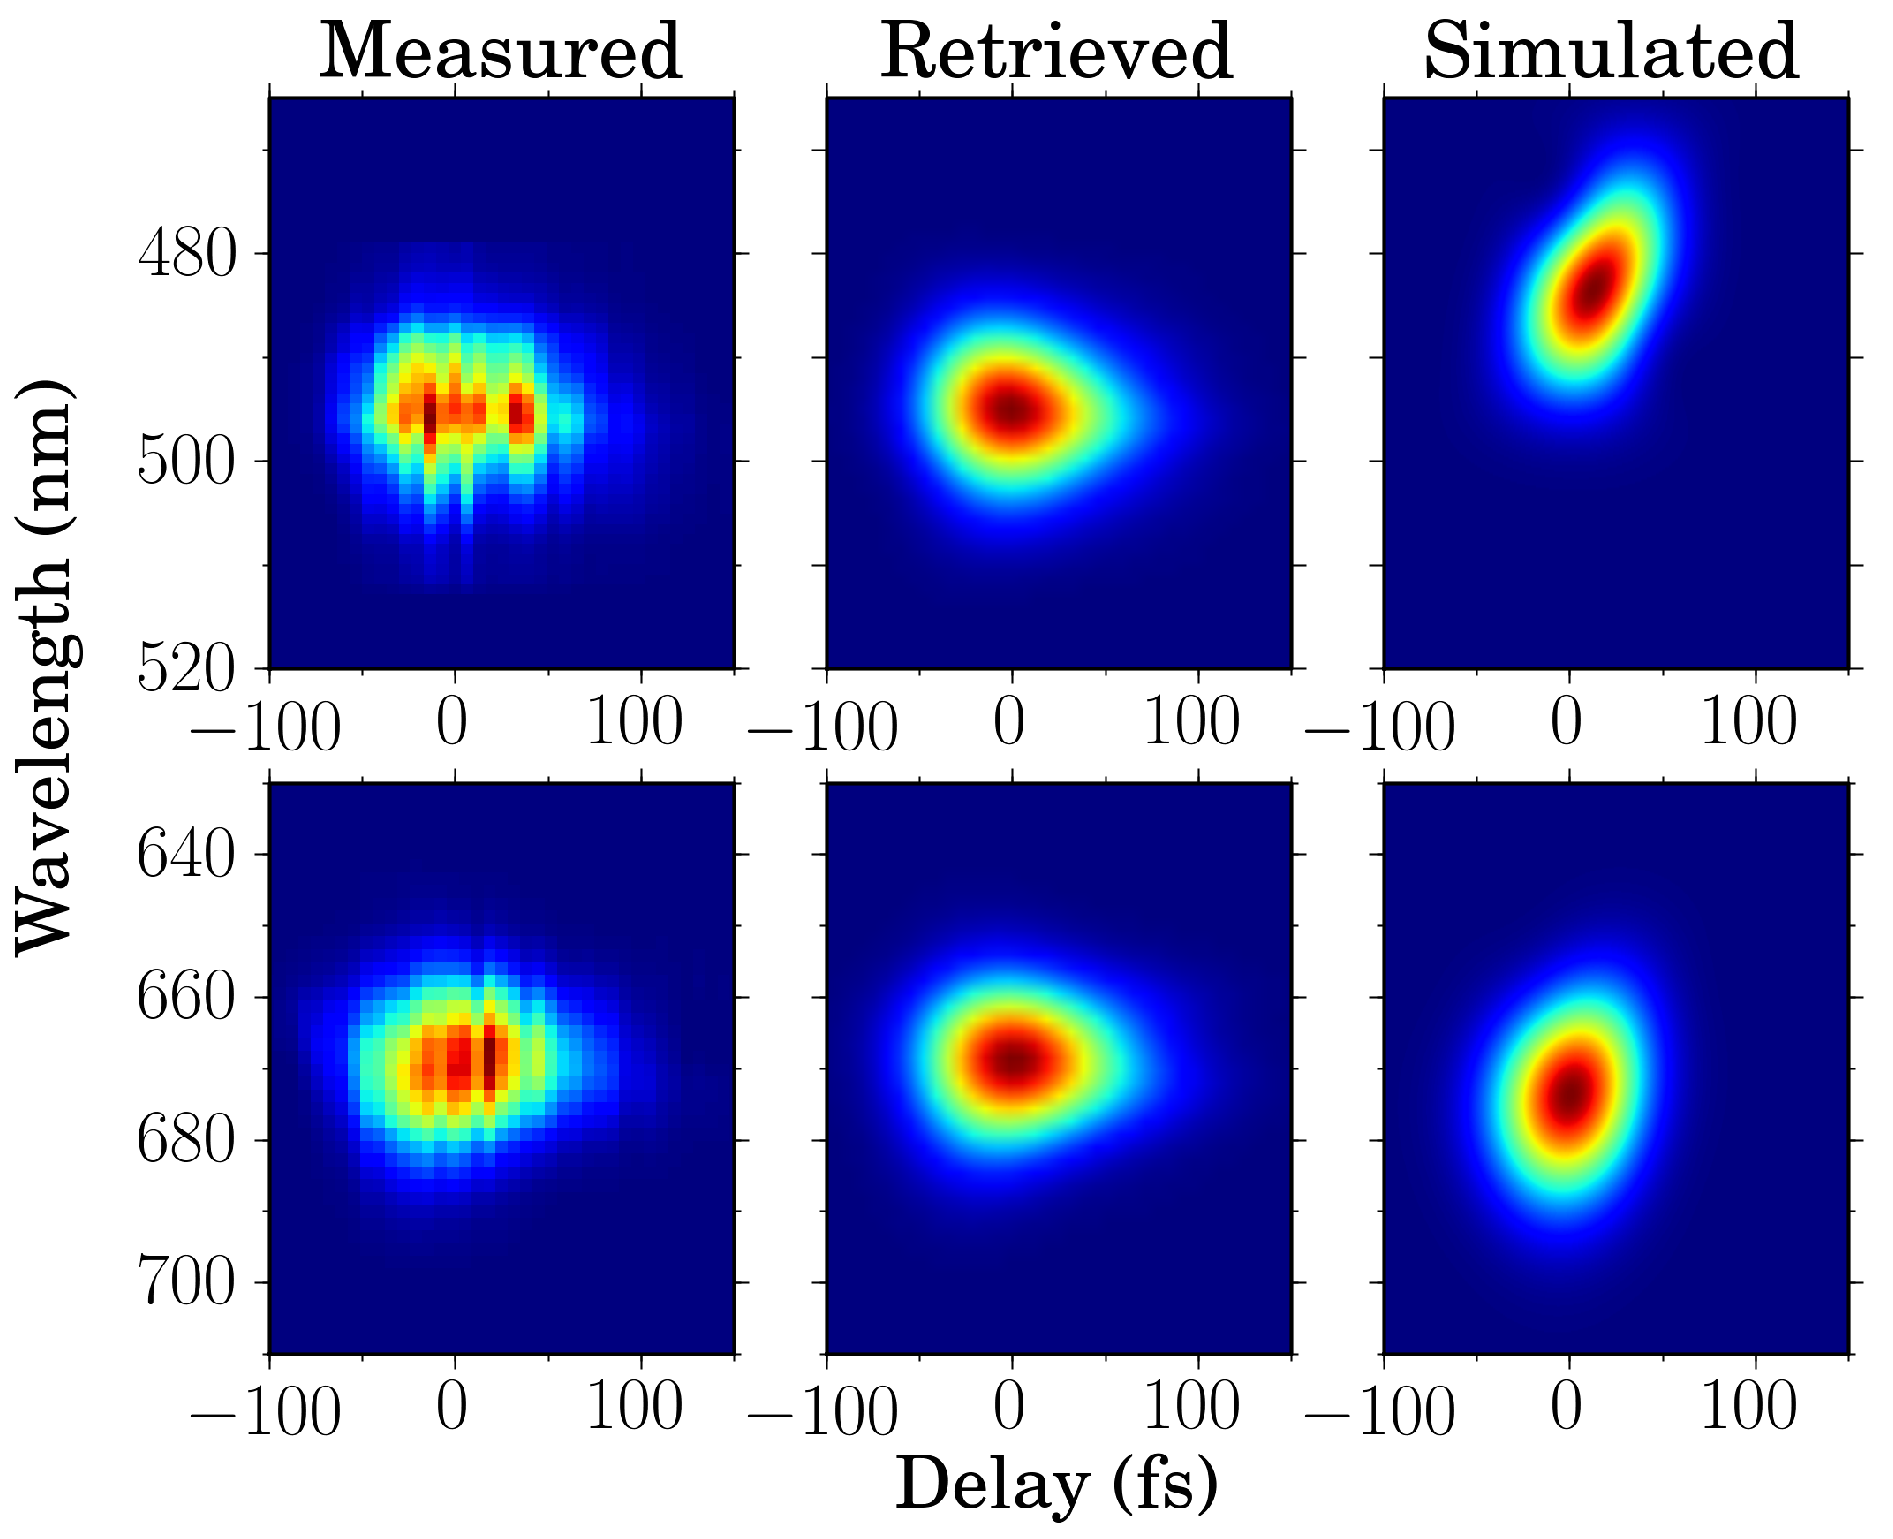
The temporal characteristics of the pulses can be also calculated, since the model gives us complete temporal and spectral information of the field. A given CFWM order can be spatially selected since they are emitted at different angles and we can simulate its interaction with another beam, as done in experiments for measuring the temporal duration. For instance, one can make a given generated order interact with the beam at ω0 on a second thin slide of fused silica for different relative temporal delays and hence numerically obtain polarization-gating cross-correlated frequency resolved optical gating (PG-XFROG) traces. Figure 11 shows the measured and simulated PG-XFROG traces for the second frequency upshifted beam with central frequency ω2 (top) and the first downshifted beam with central frequency ω−1 (bottom). I, the simulation results are in good agreement with the measurements regarding the broad bandwidth and short duration of the newly generated low-order pulses (which are shorter than the pumps). There are however differences in the central frequency and in the chirp of the pulses. The former can be due to several factors, from changes in the central frequency of the pumps that can occur between experiments, to differences in the interaction angle as well as in the relative pulse delay, all of which can result in frequency shifts, as described previously (see, e.g., Figure 8). Regarding the latter, the simulated pulses exhibit some positive chirp due to the nonlinear phase imposed by the pumps. This is clearer in the right plot of Figure 12, which shows the calculated PG-XFROG traces for the synthesized field of Figure 13. Another factor that directly contributes to the chirp of the newly generated pulses is the initial chirp of the pump pulses. In the simulations the pumps are assumed to be Fourier-limited, whereas in the experiments there can be slight deviations to this condition.
Figure 11.
Experimental (measured and retrieved) and simulated polarization-gating FROG (PG-XFROG) traces of the second frequency-upshifted pulse (top row) and first downshifted pulse (bottom row). The retrieved pulse durations are 30.7 and 40.2 fs for the second upshift and first downshift respectively (FROG error was 0.014 and 0.008 for a 128 × 128 grid) [22].

Figure 12.
Simulated PG-XFROG, clipped at 10−4 of the maximum, for the recombined and focused CFWM field, assuming 20 fs (left) and 80 fs (right) gate pulses [22].
Figure 12.
Simulated PG-XFROG, clipped at 10−4 of the maximum, for the recombined and focused CFWM field, assuming 20 fs (left) and 80 fs (right) gate pulses [22].
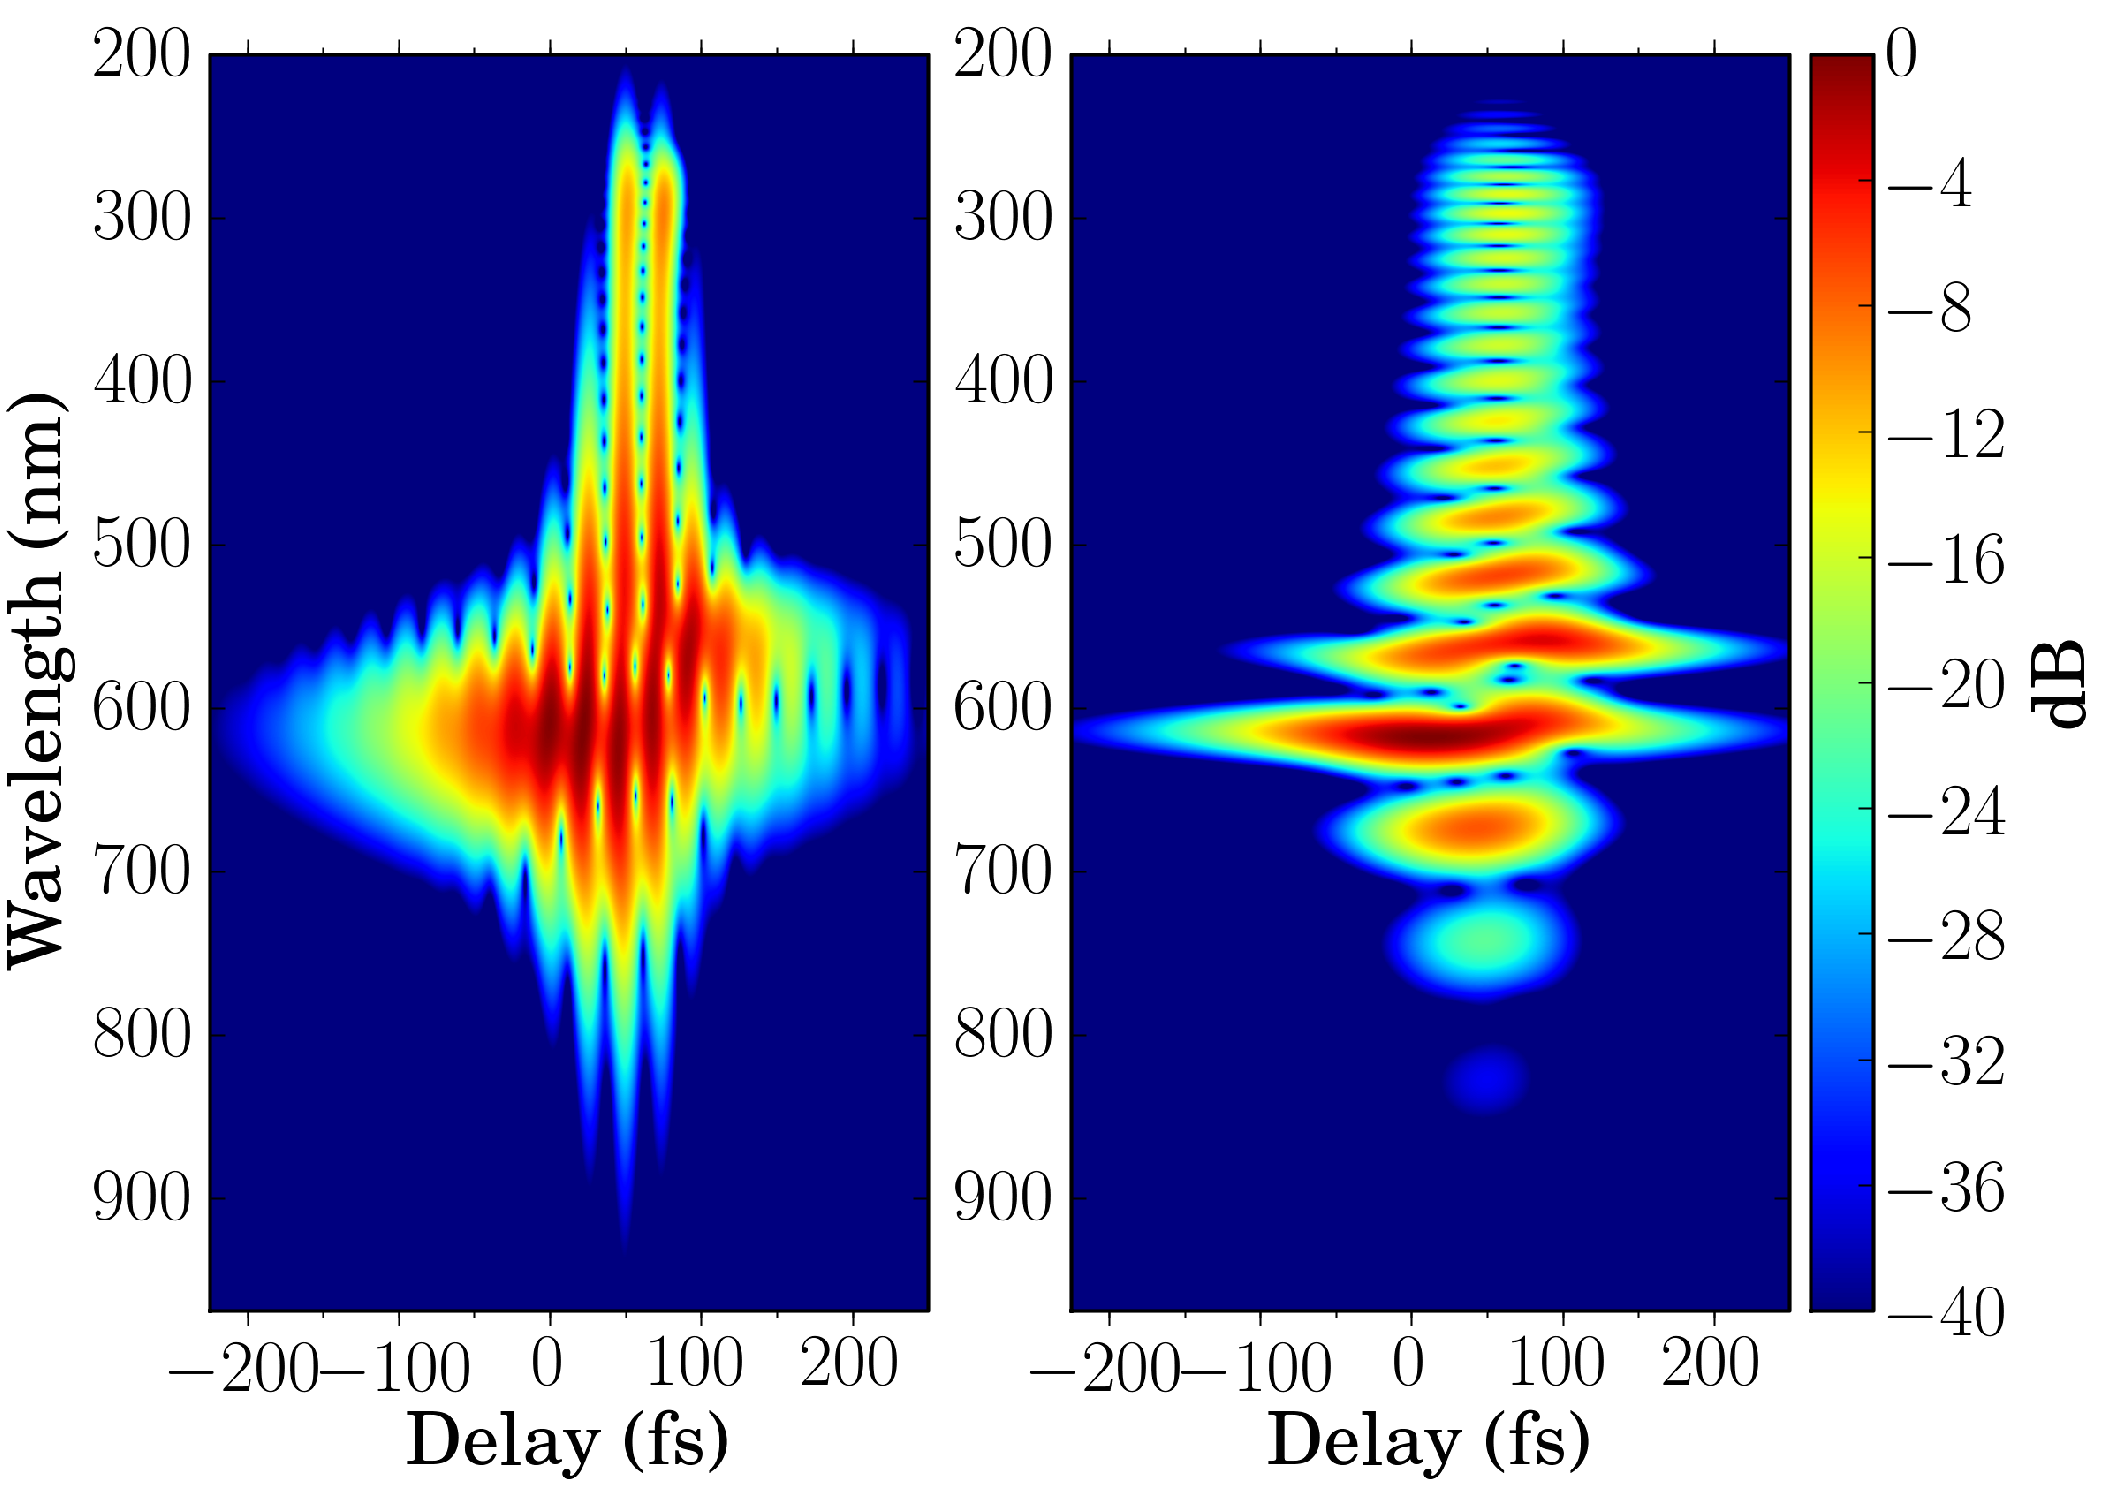
Figure 13.
Recombined and focused CFWM pulses. (a) Electric field as a function of the delay (in fs); (b) Intensity; (c) Power spectrum (logarithmic scale) [22].
Figure 13.
Recombined and focused CFWM pulses. (a) Electric field as a function of the delay (in fs); (b) Intensity; (c) Power spectrum (logarithmic scale) [22].
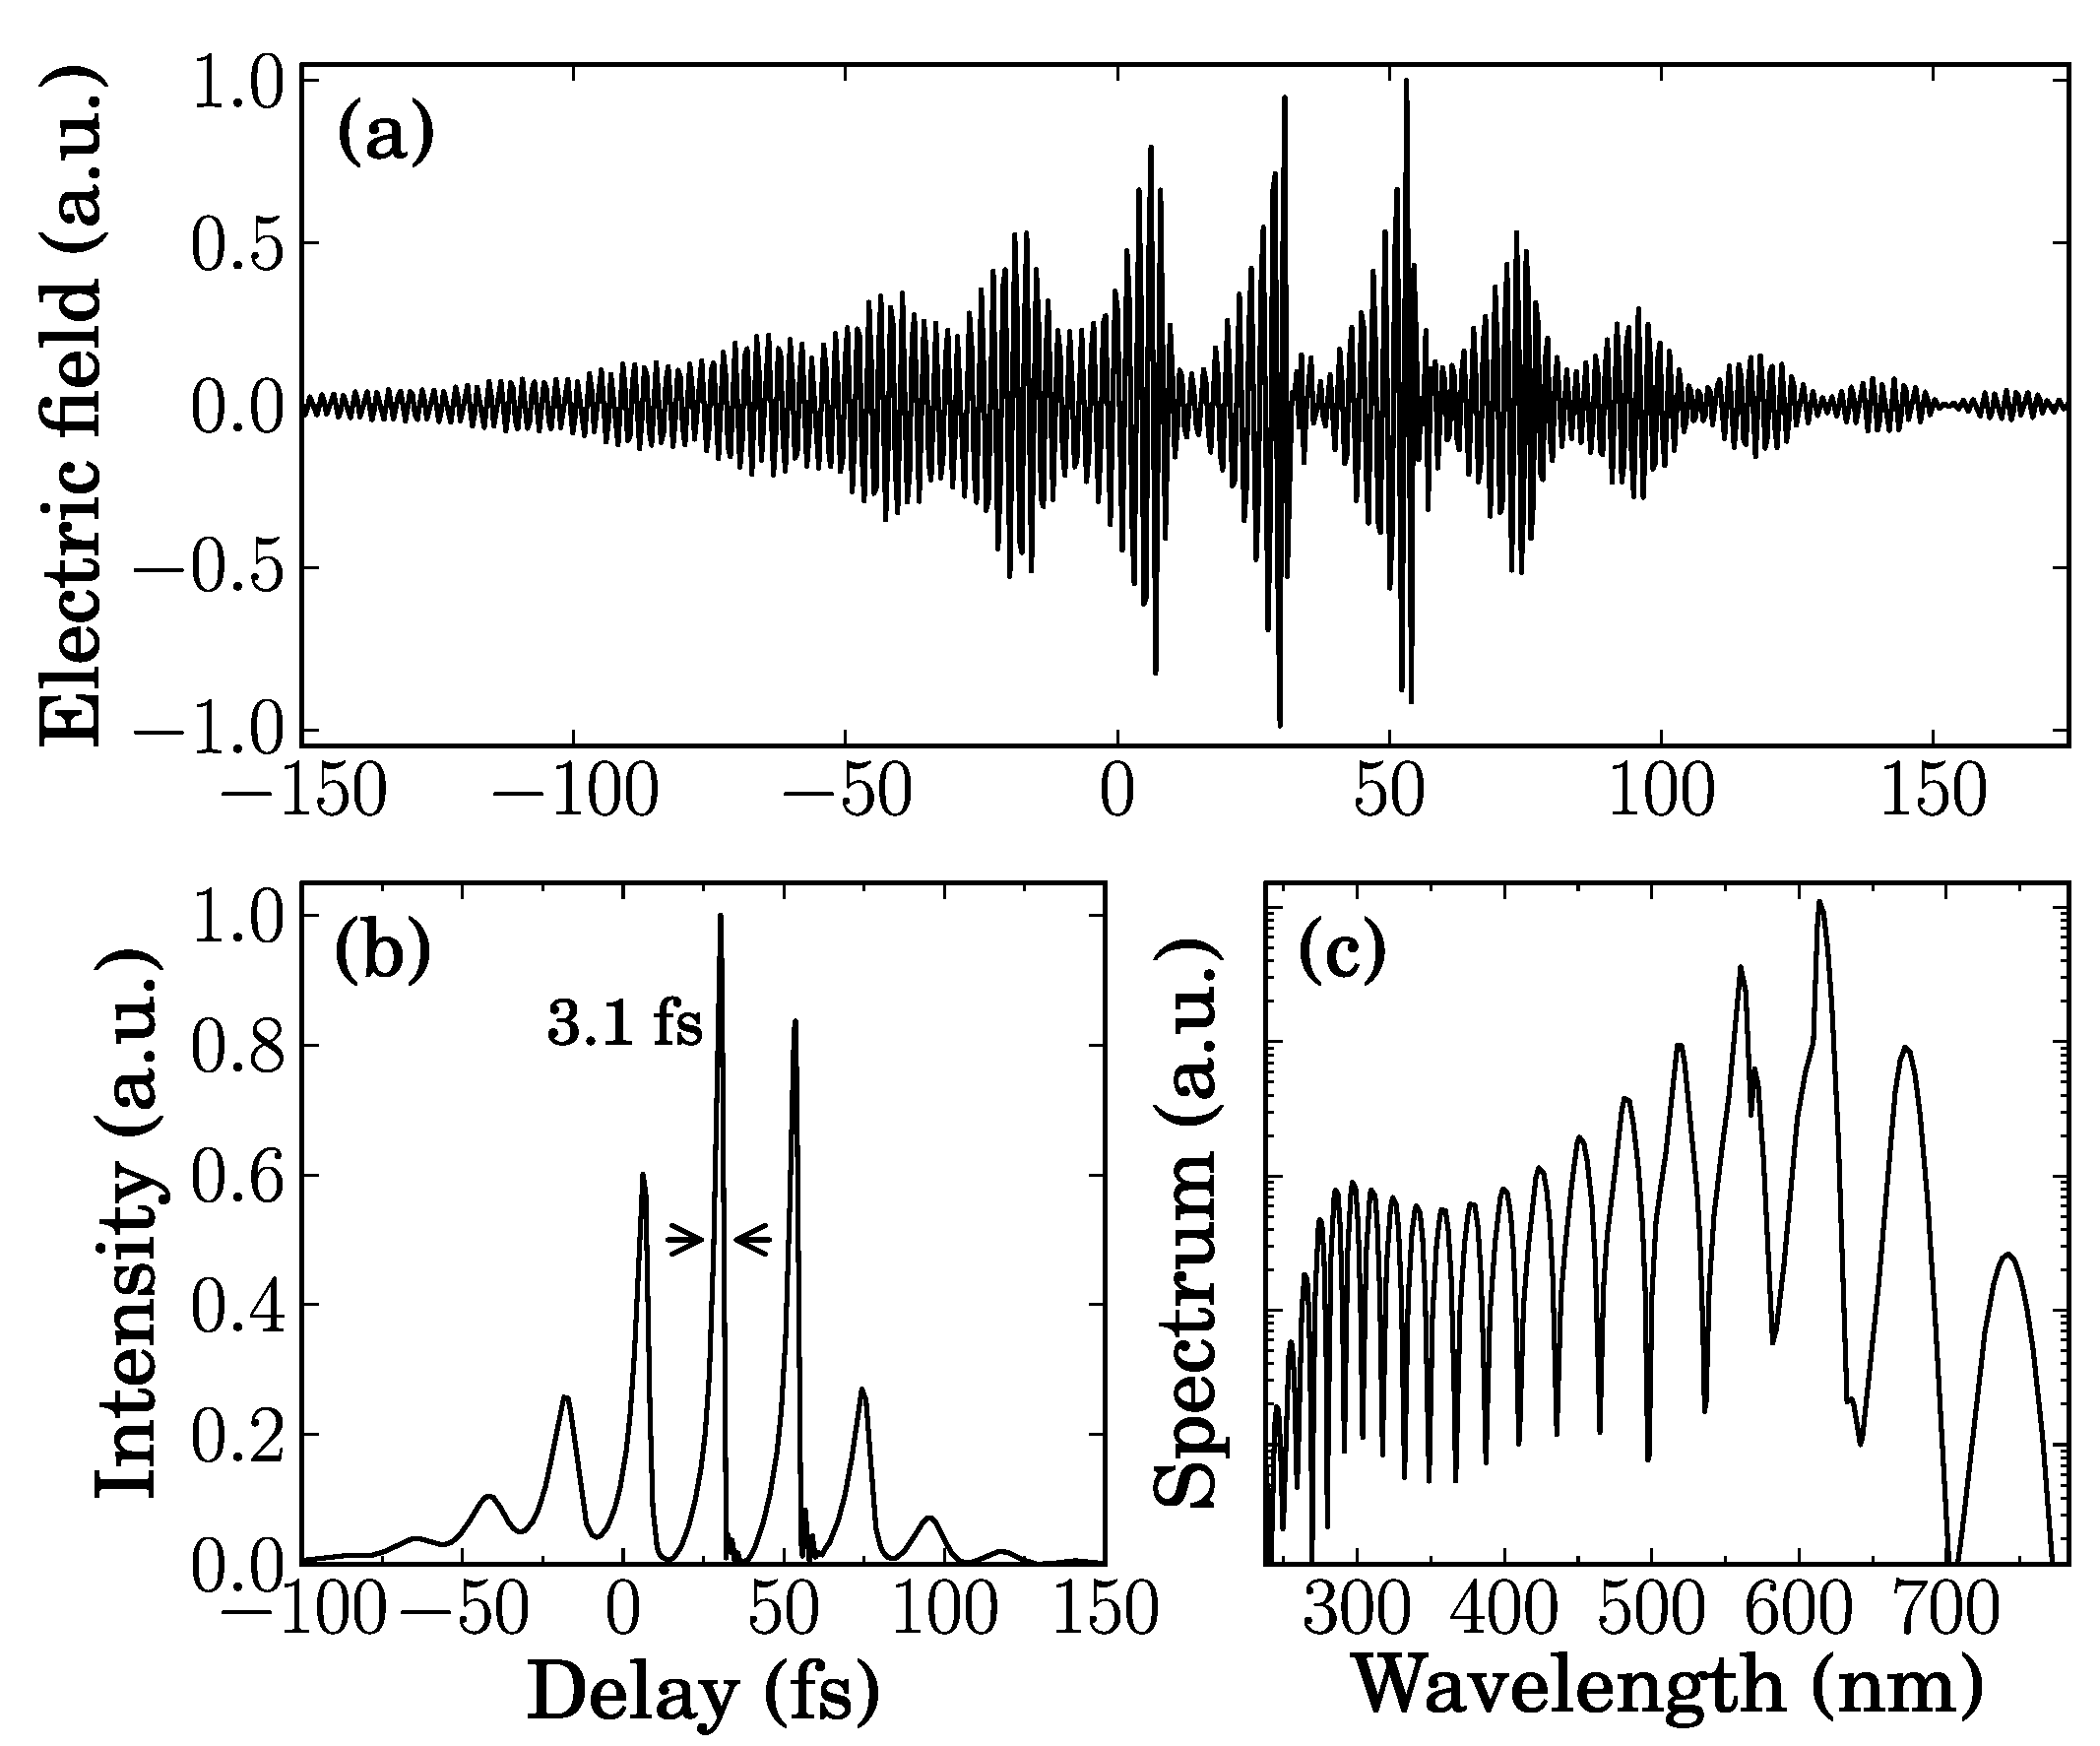
Other kinds of temporal processing are also possible. For example the total electric field can be calculated by synchronizing and spatially superimposing all the CFWM orders. Since after passing the slide the different orders have acquired a slightly different group delays, synchronization can be achieved by subtracting the linear phase. This is equivalent to focusing all the orders together in a point, which would be an experimental approach for having the total field in the same region. The total electric field obtained by this numerical procedure can be seen in Figure 12a, along with the field intensity in Figure 12b and its power spectrum in Figure 12c. We see that in the time domain we obtain a train of pulses separated by the pump beat period (23 fs) with the central peak having 3.1 fs in duration.
A PG-XFROG trace of this total field can also be simulated. The gate pulse can be of course arbitrarily chosen, but it looks reasonable and informative to use one of the pump pulses as gating pulse, as done in the experiments, namely the 80 fs pulse at ω0. The PG-XFROG trace for the complete focused set of CFWM orders is shown in Figure 13 where the different sub-traces for the individual orders can be distinguished (on the right). For shorter gate pulses spectral resolution is lost but temporal resolution is improved revealing the fine temporal structure (pulse train) obtained in this case (on the left).
4. Towards Single-Cycle Pulse Synthesis
The described set of cascaded FWM orders will be a coherent broadband source provided the different orders can be spatially and temporally overlapped. Coherent spectra that are sufficiently broad can be used for generating few- and single-cycle pulses if properly compressed. A well-known technique for generating high energy few-cycle pulses is the temporal compression of the broadband supercontinuum produced by self-phase modulation (SPM) in e.g., gas-filled hollow core fibers [23] (discrete spectra, composed of evenly spaced near-monochromatic waves can also lead to the synthesis of a train of single-cycle optical pulses, as demonstrated using molecular modulation in a gas driven by two independent nanosecond lasers [24]). Moreover, the central frequency of the total CFWM spectrum and the separation between sidebands can be freely adjusted by tuning the pump frequencies, so in principle it should always be possible to obtain the commensurate sidebands required to synthesize a train of identical pulses. Two frequencies are commesurate if mω0 = nω1, with m, n integers. This also means that each frequency is an exact multiple of the frequency spacing ωm = ω1 − ω0.
Let us take a deeper insight into pulse synthesis by addition of a finite number of pulses with different central wavelengths. The pulses must have fixed relative phases in order to produce a stable coherent superposition of fields giving rise to an ultrashort pulse or to a train of ultrashort pulses. We also found this result in the previous section (Figure 12), where the coherent sum and focusing of the CFWM orders generated by numerically solving the equations of our model, resulted in a train of ultrashort laser pulses. For the CFWM pulses this can be understood using a simplified model based on the coupled amplitude equations between the pumps and the generated sidebands.
Using the wave equation in the slowly-varying envelope approximation, for two pump fields with complex amplitudes and , frequencies ω0 and ω1, respectively, assuming a cubic nonlinearity, neglecting dispersion and pump depletion, and assuming perfect phase-matching and constant coupling coefficients, the solution for the complex amplitude of the field with frequency ωn at the exit of a medium with length L can be written as [21,25]
where is the nonlinear phase shift acquired in the medium, is the initial phase difference between pumps, Jn are the nth order Bessel functions of the first kind, and the nonlinear coefficient is given by , with n0 the linear refractive index at frequency ω0 and c the speed of light in vacuum. Equation (1) predicts well-defined phase relationships between the several CFWM orders, thus establishing mutual coherence between the beams. The total field in the time domain is then
From Equation (11) and using the Jacobi-Anger identity, , we obtain
This result is similar to the frequency-modulation (FM) solution by Harris [24] for coherent addition of Raman sidebands in the approximation of negligible dispersion and limited modulation bandwidth (on its hand similar to the solution previously obtained by Lichtman et al. [6] for nondegenerate FWM of 100 ns pulses - for which dispersion was practically negligible - propagating in 400 m long optical fibers), with the important difference that in CFWM the synthesized pulse envelope strongly depends on the initial phase difference δ. In molecular modulation, the detuning between the driving frequency and the Raman transition dictates the preparation of a phased or an anti-phased molecular state, the latter resulting in a negative effective nonlinear coefficient γ for which the synthesized pulses could have an approximately negative chirp and hence could be further compressed by simple propagation in a normally dispersive medium [24]. In the present case of CFWM, the sign of γ is independent of the pump field (and usually positive for most optically transparent χ(3) media), but the chirp of the synthesized pulses can nevertheless be controlled by adjusting δ alone. From Equation (12) we see that ϕ0 only affects the carrier envelope phase (CEP) for the pulse train, defined with respect to the two-color beat envelope, whereas δ is associated with net temporal shifts and also determines the pulse chirp, as given by the oscillating nonlinear phase term. In particular, when δ = ±π/2, the synthesized pulses can have a negative chirp. In practice, a given phase difference can be introduced by slightly adjusting the delay between the two (phase-locked) pump pulses without significantly affecting their temporal overlap. Also, if the pump frequencies are commensurate, this will result in the generation of identical pulses that are CEP-stabilized within each train (although their CEP may change from shot-to-shot), since even though each CFWM step is not self-CEP-stabilized, the total recombined field will be. The corresponding pulse envelopes will also be identical from shot-to-shot, provided that the relative phase difference δ remains constant, which is a far less stringent requirement than the need of CEP stabilized pump pulses.
To demonstrate the feasibility of this approach for the generation of single cycle pulses, the basic set-up of Figure 2 was improved by using fused-silica instead of BK7 to generate more orders in the UV, and complemented with additional optics for pulse synthesis and measurement. This set-up is reproduced in Figure 14-I. As in the previous case, two-horizontally polarized visible femtosecond pulses from a dye laser-amplifier at 10 Hz were used as pumps: an orange pump with λ0 = 615 nm, ∼80 fs duration, 2 mJ energy and a green pump with λ1 = 569 nm, ∼60 fs duration and 200 μJ energy. Special care was taken in using Glan-Taylor polarizers (GTPs, 100,000:1 extinction ratio) to have perfectly polarized beams, which is important not only for the generation, but for the subsequent temporal measurements. In this laser system, the green pump beam is directly (optically) derived from the orange pump beam: a small portion of the orange beam is first used to generate supercontinuum in a cell filled with deuterated water, and then the green portion of this supercontinuum is amplified using green laser dyes. Even though supercontinuum generation and laser action are coherent processes, the relative phase between the two pulses is not actively locked and can fluctuate due to normal thermal and mechanical perturbations and drifts in the system. The pulses are commensurate to within 0.2% (well within their ∼5 nm bandwidths), hence we can expect the resulting synthesized pulses to have the same CEP within the pulse train.
Figure 14.
Experimental setup: (I) generation of CFWM pulses; (II) pulse recombination and synthesis; (III) pulse characterization by PG-XFROG (see text for details) [21].
Figure 14.
Experimental setup: (I) generation of CFWM pulses; (II) pulse recombination and synthesis; (III) pulse characterization by PG-XFROG (see text for details) [21].
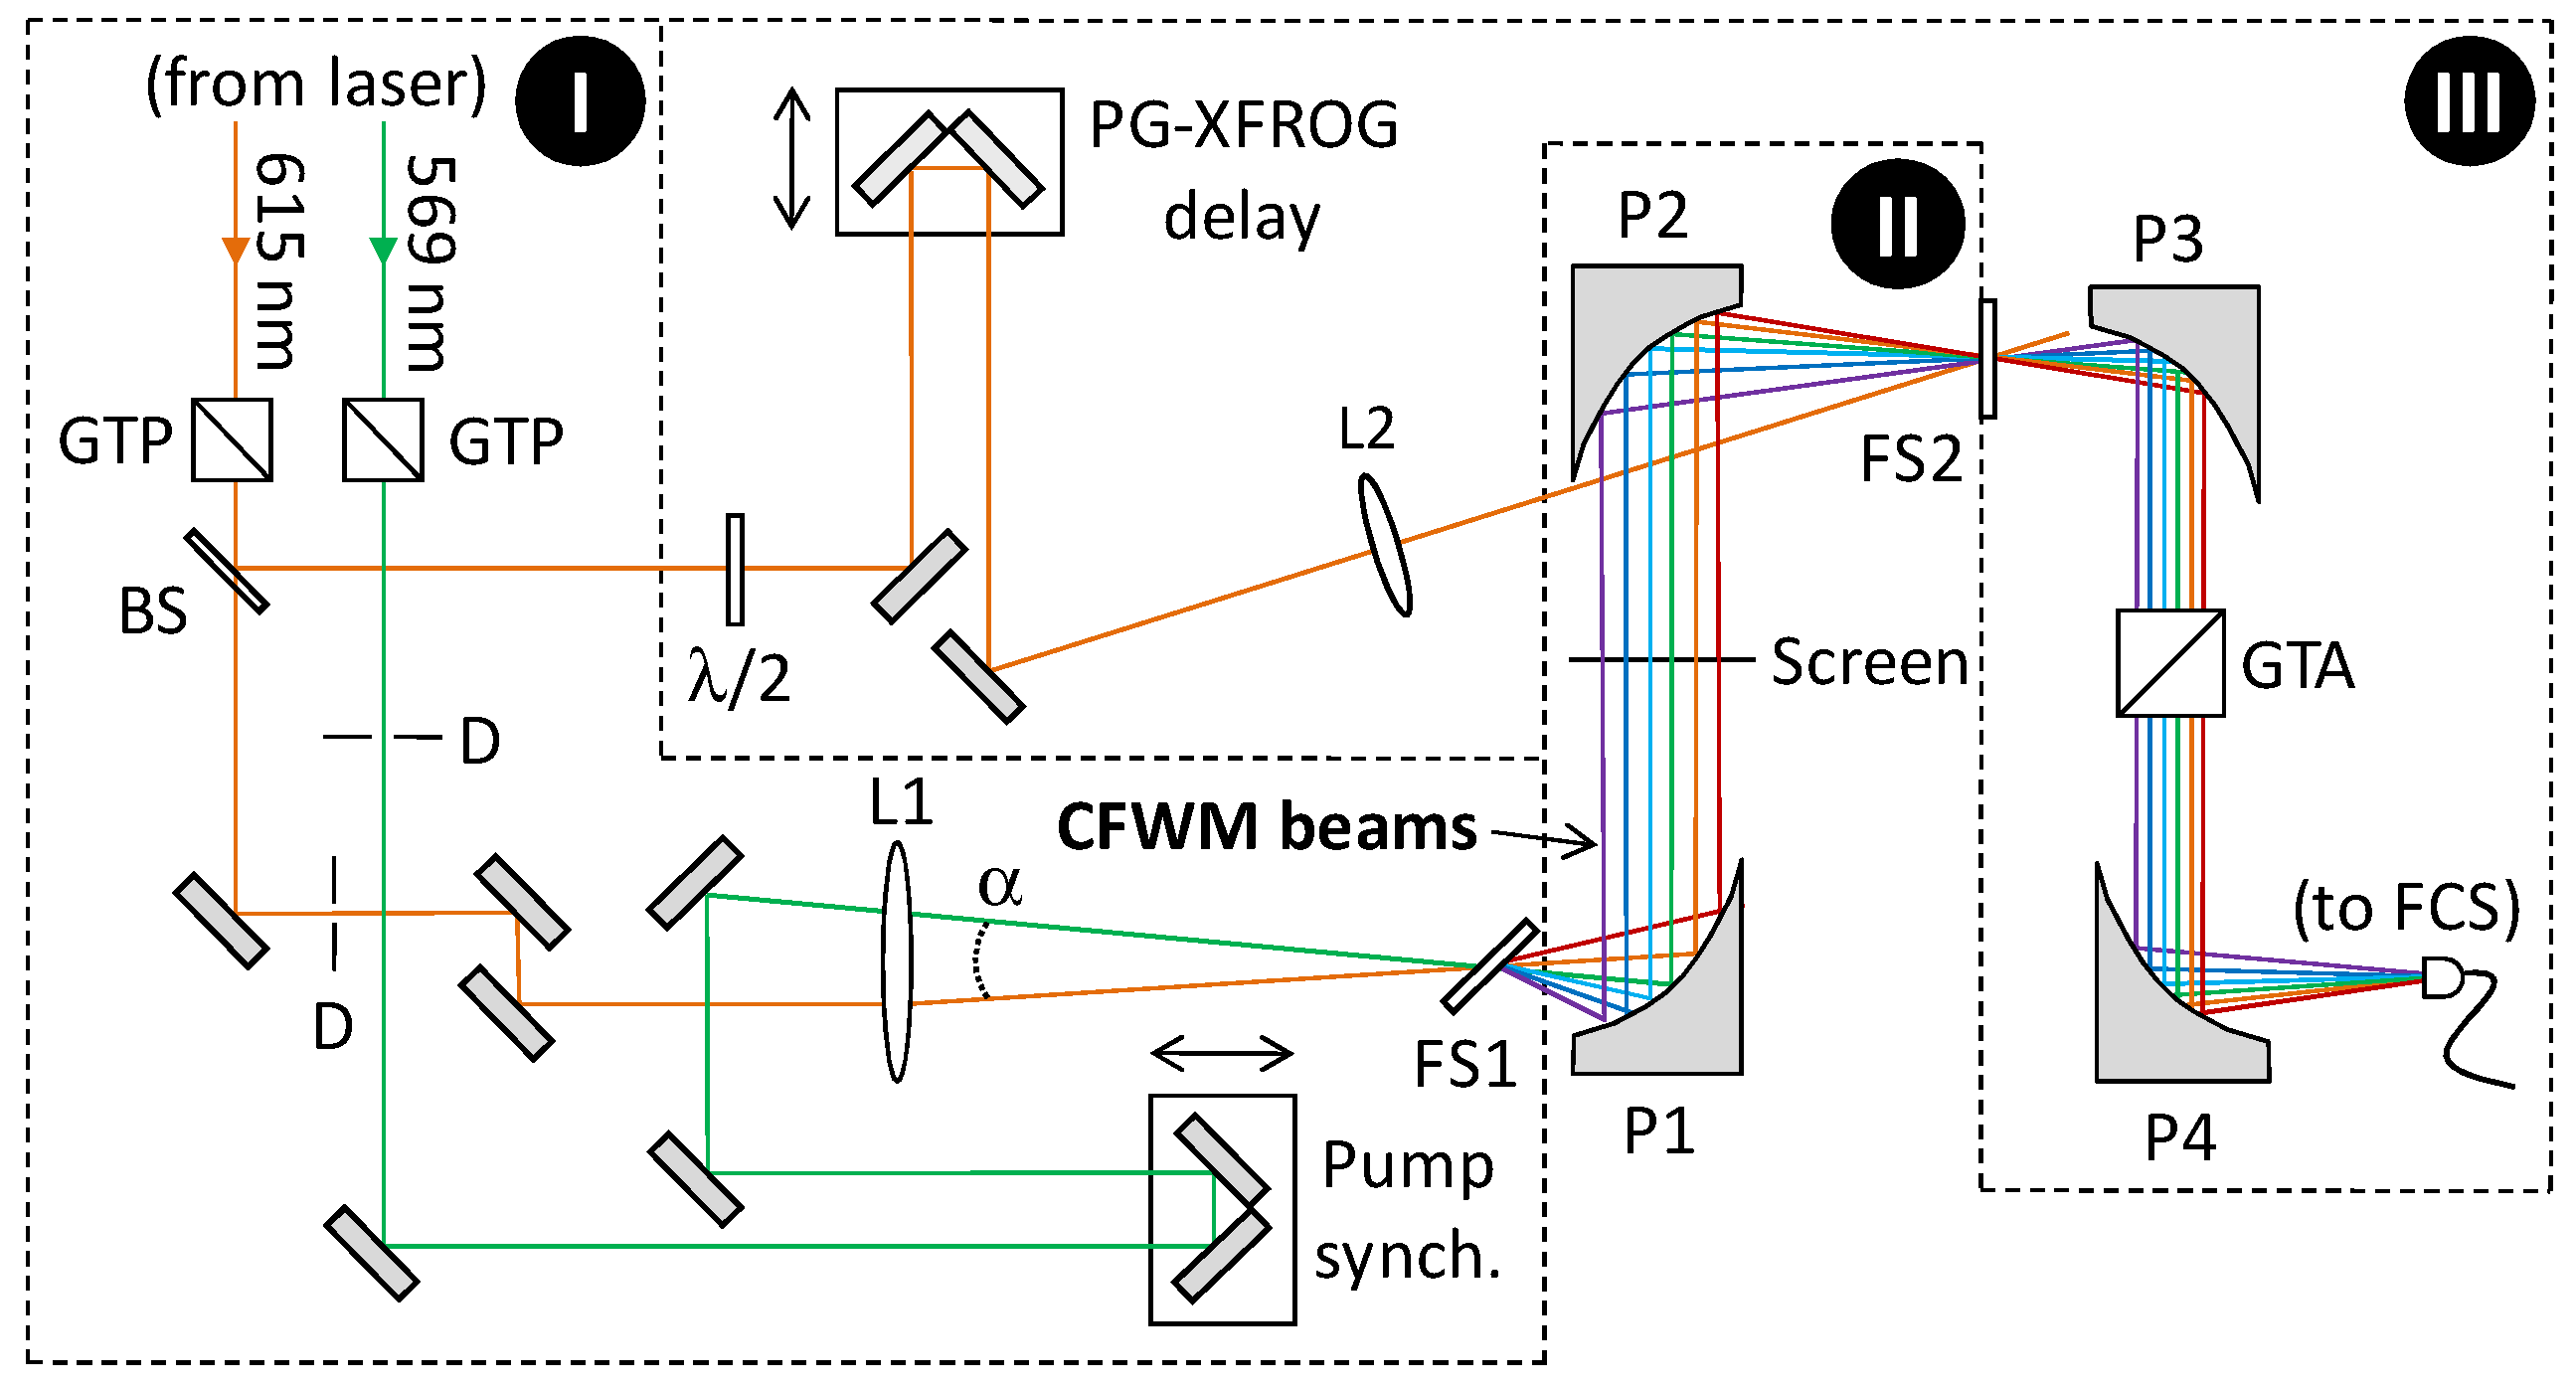
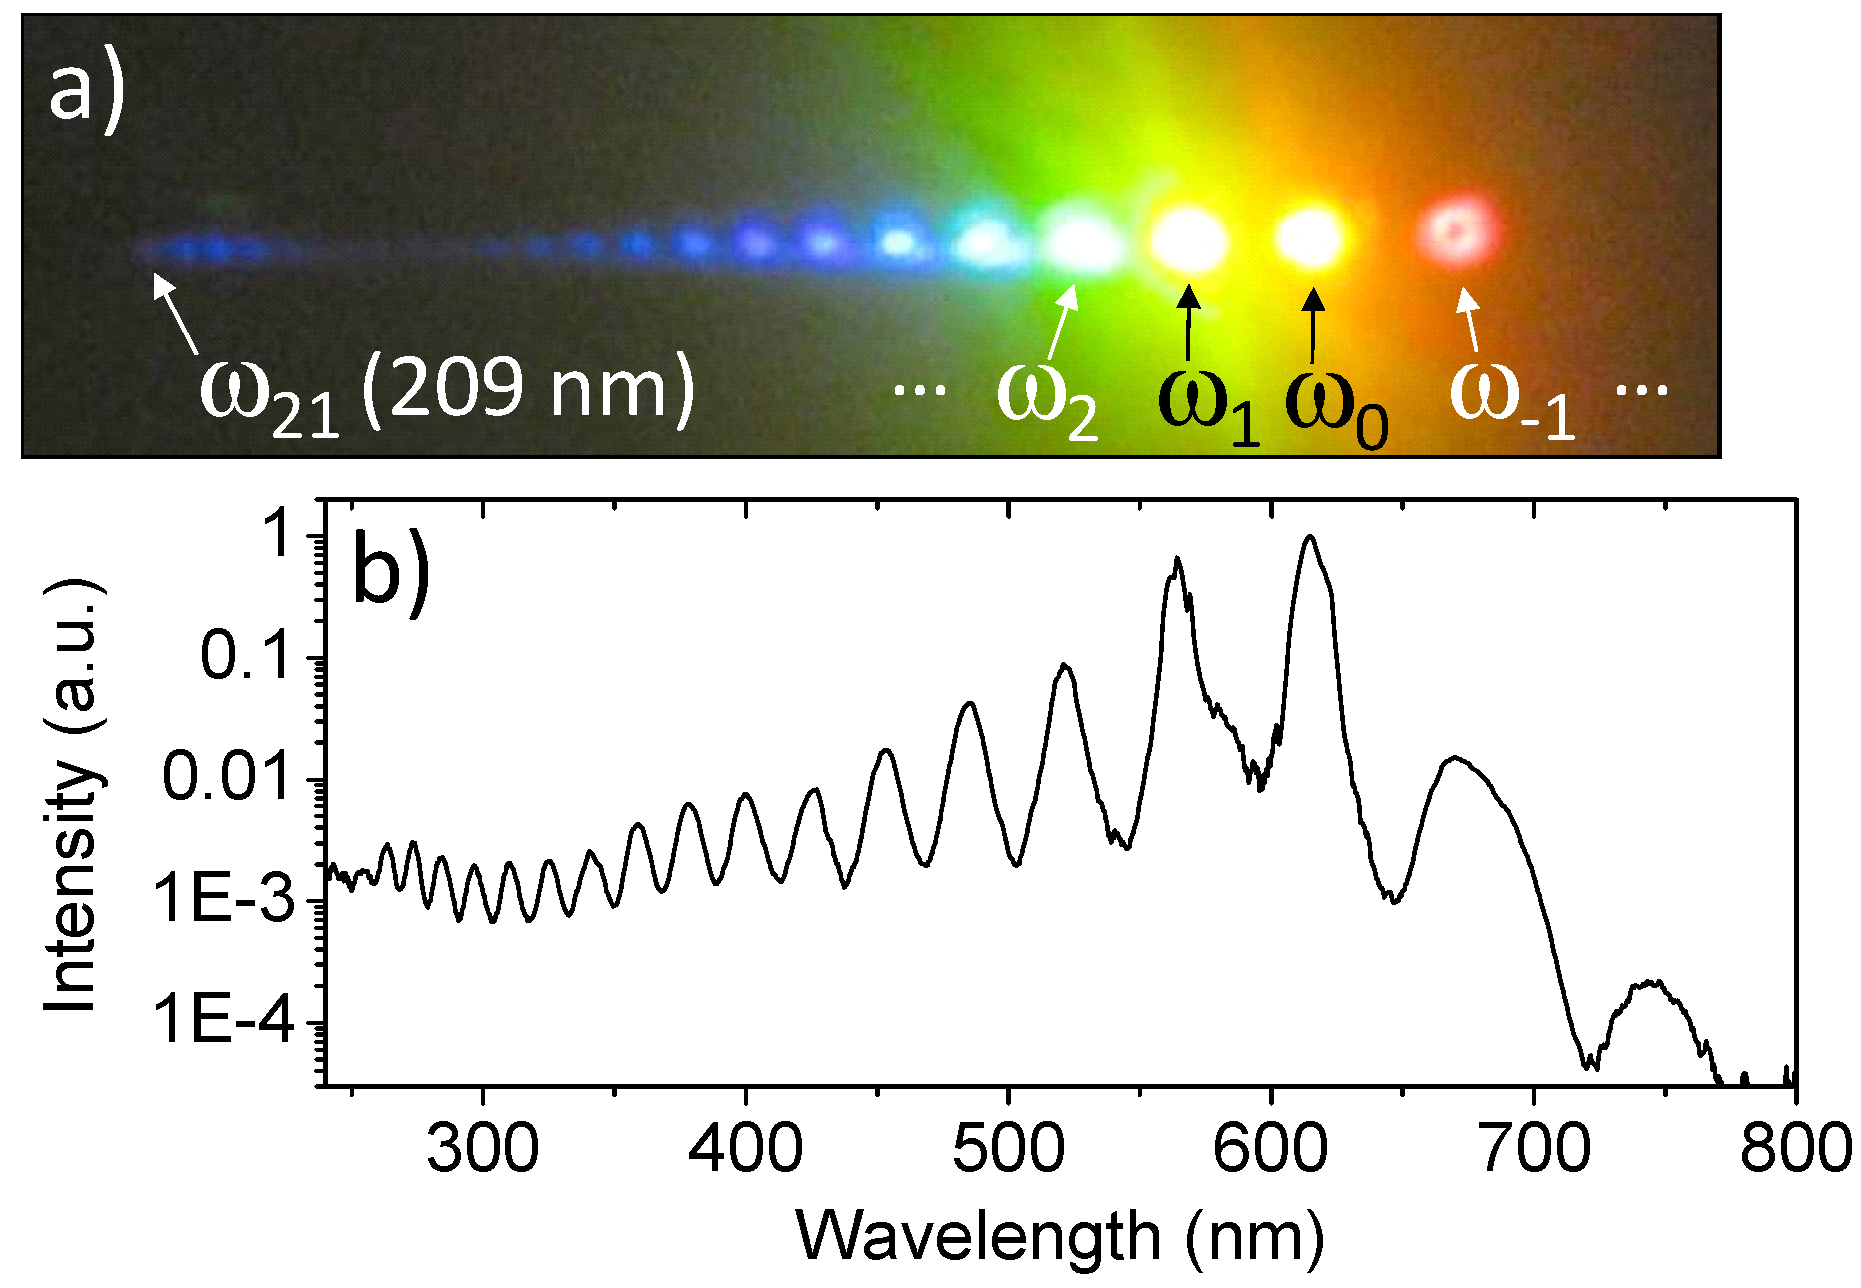
The orange and green pulses are synchronized at the entrance plane of the fused silica slide FS1, and have energies of 32 and 38 μJ, respectively, near-transform-limited durations (measured using SHG-FROG), beam radii of approximately 80 and 100 μm, respectively, and similar intensities on the order of 2 × 10¹² W/cm2 as they cross on the slide at an angle of ≈ 3°. Under these conditions, a fan of 20 upconverted CFWM orders was generated up to 209 nm, as shown in Figure 15a. The total measured energy in the cascaded beams (excluding the pumps, i.e., orders 0 and 1) is > 6 μJ, so approximately 10% of the incident energy is transferred to the newly generated frequencies.
Figure 15.
(a) Direct (no filtering) image of the fan of multicolored CFWM pulses as seen projected on a phosphor-coated paper screen (the dark arrows denote the pump beams); (b) Corresponding two-octave spectrum measured at the focal plane of mirror P2. [21].
Figure 15.
(a) Direct (no filtering) image of the fan of multicolored CFWM pulses as seen projected on a phosphor-coated paper screen (the dark arrows denote the pump beams); (b) Corresponding two-octave spectrum measured at the focal plane of mirror P2. [21].
To perform pulse synthesis all orders were collimated and recombined in a single 100 μm white light spot using two λ/8 Aluminum-coated off-axis parabolic mirrors P1 (f = 2.54 cm) and P2 (f = 5.08 cm) (Figure 14-II). A perforated screen was placed between these two mirrors to transmit only the central portions of the pumps and thus have a more balanced spectrum, but no additional amplitude filtering was performed. The total spectrum at the focal spot was measured with an intensity calibrated UV-NIR (200–1100 nm) spectrometer, but only 15 frequency upconverted orders could be detected due to the limited bandwidth of the mirrors, as shown in Figure 15b. All orders have been generated under simultaneous phase-matching conditions with a fast electronic nonlinearity, so they are phase-locked when exiting the first fused silica slide FS1. Additional propagation in air only adds negligible second-order dispersion and hence we expect a train of few-cycle pulses to be synthesized at the focus of P2.
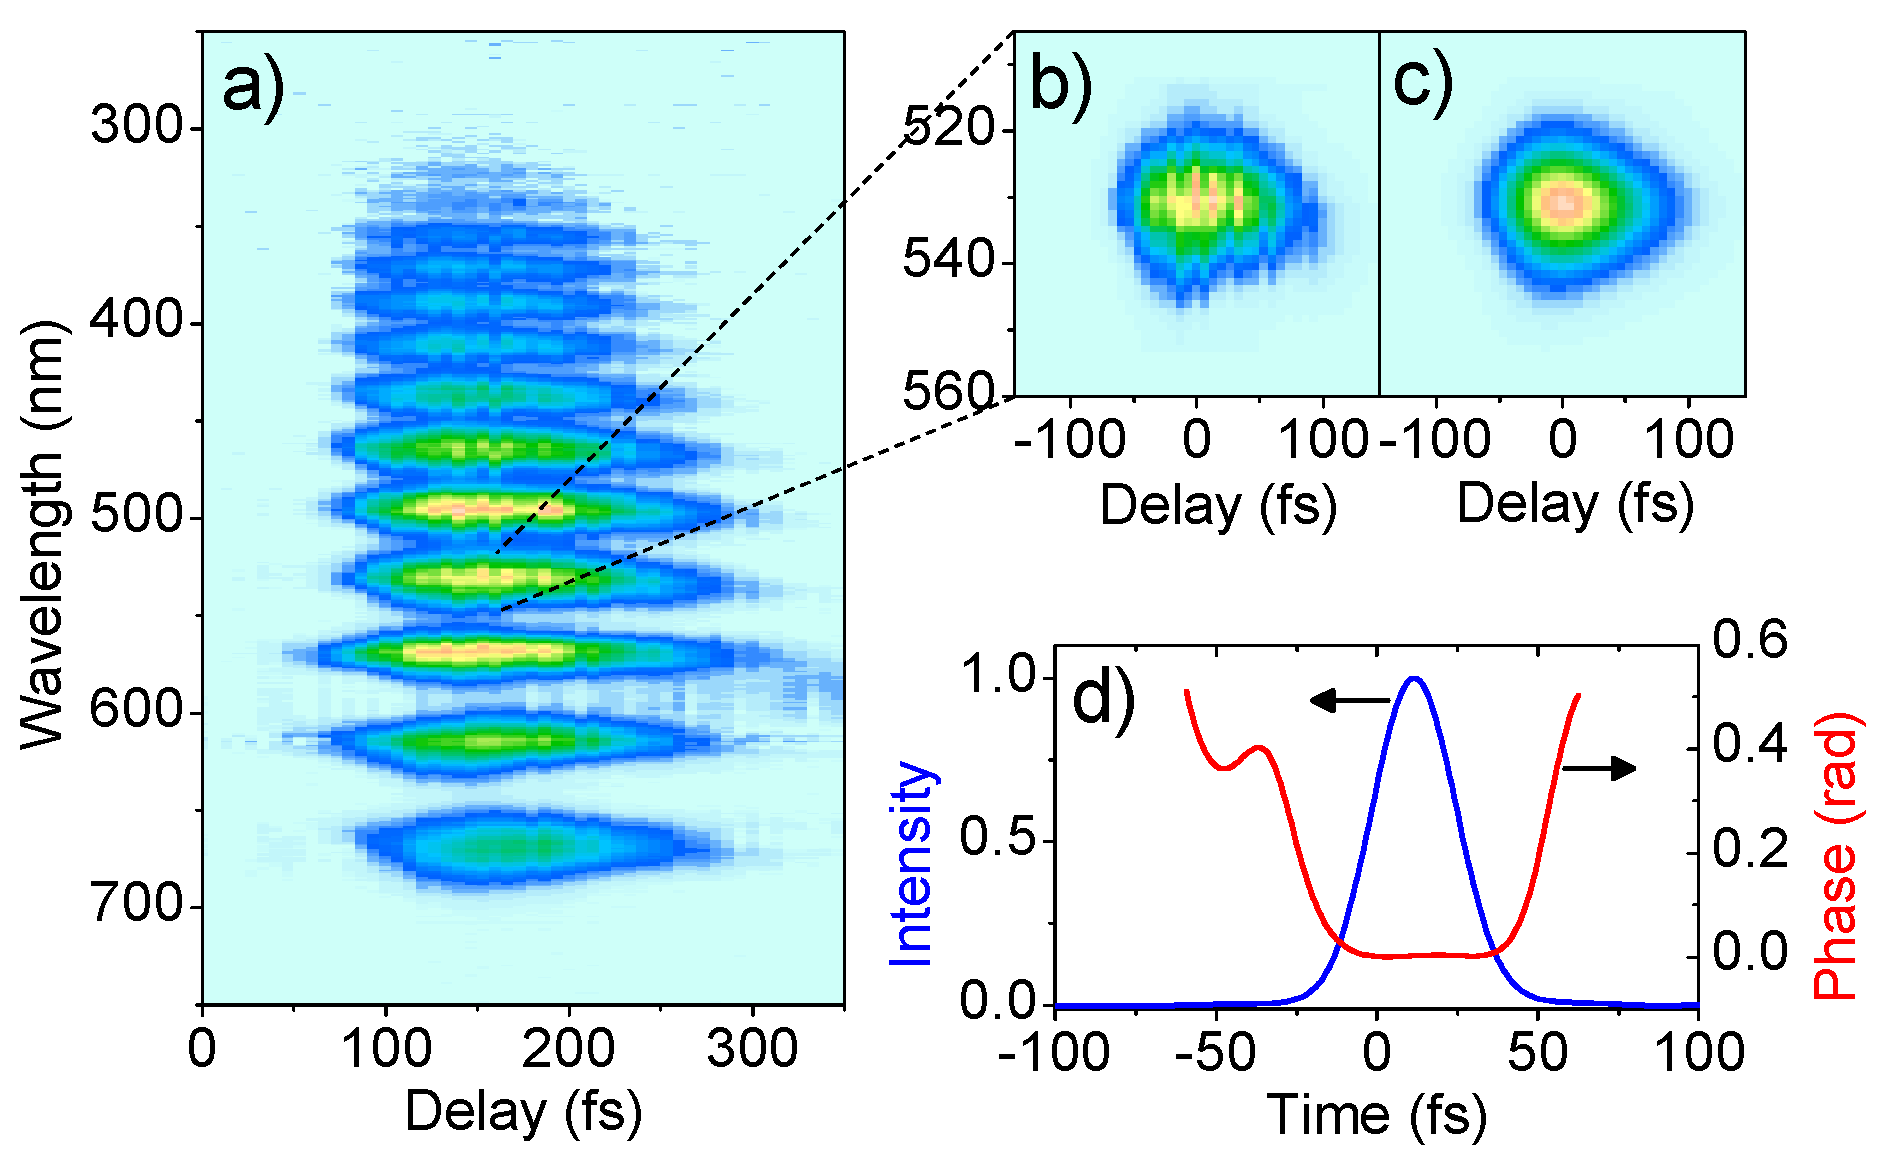
Temporal characterization was done with polarization gating XFROG (PG-XFROG) using an 80 fs pulse as the gate (Figure 14-III). This gating pulse was obtained from the main orange beam with a 50/50 beamsplitter (BS) and its polarization was rotated 45° with a half-wave plate. This pulse induces birefringence in another fused silica plate (FS2) placed at the focal plane of mirror P2, where the pulse synthesis using all CFWM orders is taking place. A second Glan-Thompson polarizer was used as analyzer (GTA) crossed with the original GTPs, which required collimating the beams with a third parabolic mirror P3 (f = 2.54 cm). Finally the total spectrum of the gated pulses was measured by focusing the output of the GTA with mirror P4 (f = 5.08 cm) onto an optical fiber with a large 400-μm core coupled to a spectrometer (FCS). The PG-XFROG trace obtained by registering the spectrum of the gated pulses as a function of the delay of the gating pulse can be seen in Figure 16a, where up to 13 orders could be simultaneously gated, so they were synchronized, and also practically have no chirp. Since the gate pulse was long compared to the expected pulse train structure, information about the temporal structure of the traces is lost and retrieval of the whole field with this trace is not reliable (see previous section where a simulated PG-XFROG trace using a 20 fs gate pulse showed the fine temporal structure). However, unambiguous retrieval of the individual orders is possible. Figure 16b,c show the measured and retrieved PG-XFROG traces of the first upconverted CFWM pulse and its associated temporal shape with 30.6 fs in duration. Pulse compression and synthesis of the generated CFWM beams have also been studied and reported by the T. Kobayashi (see, e.g., [26]) and A. H. Kung [14] research groups.
Figure 16.
(a) Measured PG-XFROG trace of the synthesized field; (b) Measured and (c) retrieved PG-XFROG traces of the first frequency upconverted CFWM pulse, and (d) corresponding intensity and phase in the time domain. [21].
Figure 16.
(a) Measured PG-XFROG trace of the synthesized field; (b) Measured and (c) retrieved PG-XFROG traces of the first frequency upconverted CFWM pulse, and (d) corresponding intensity and phase in the time domain. [21].

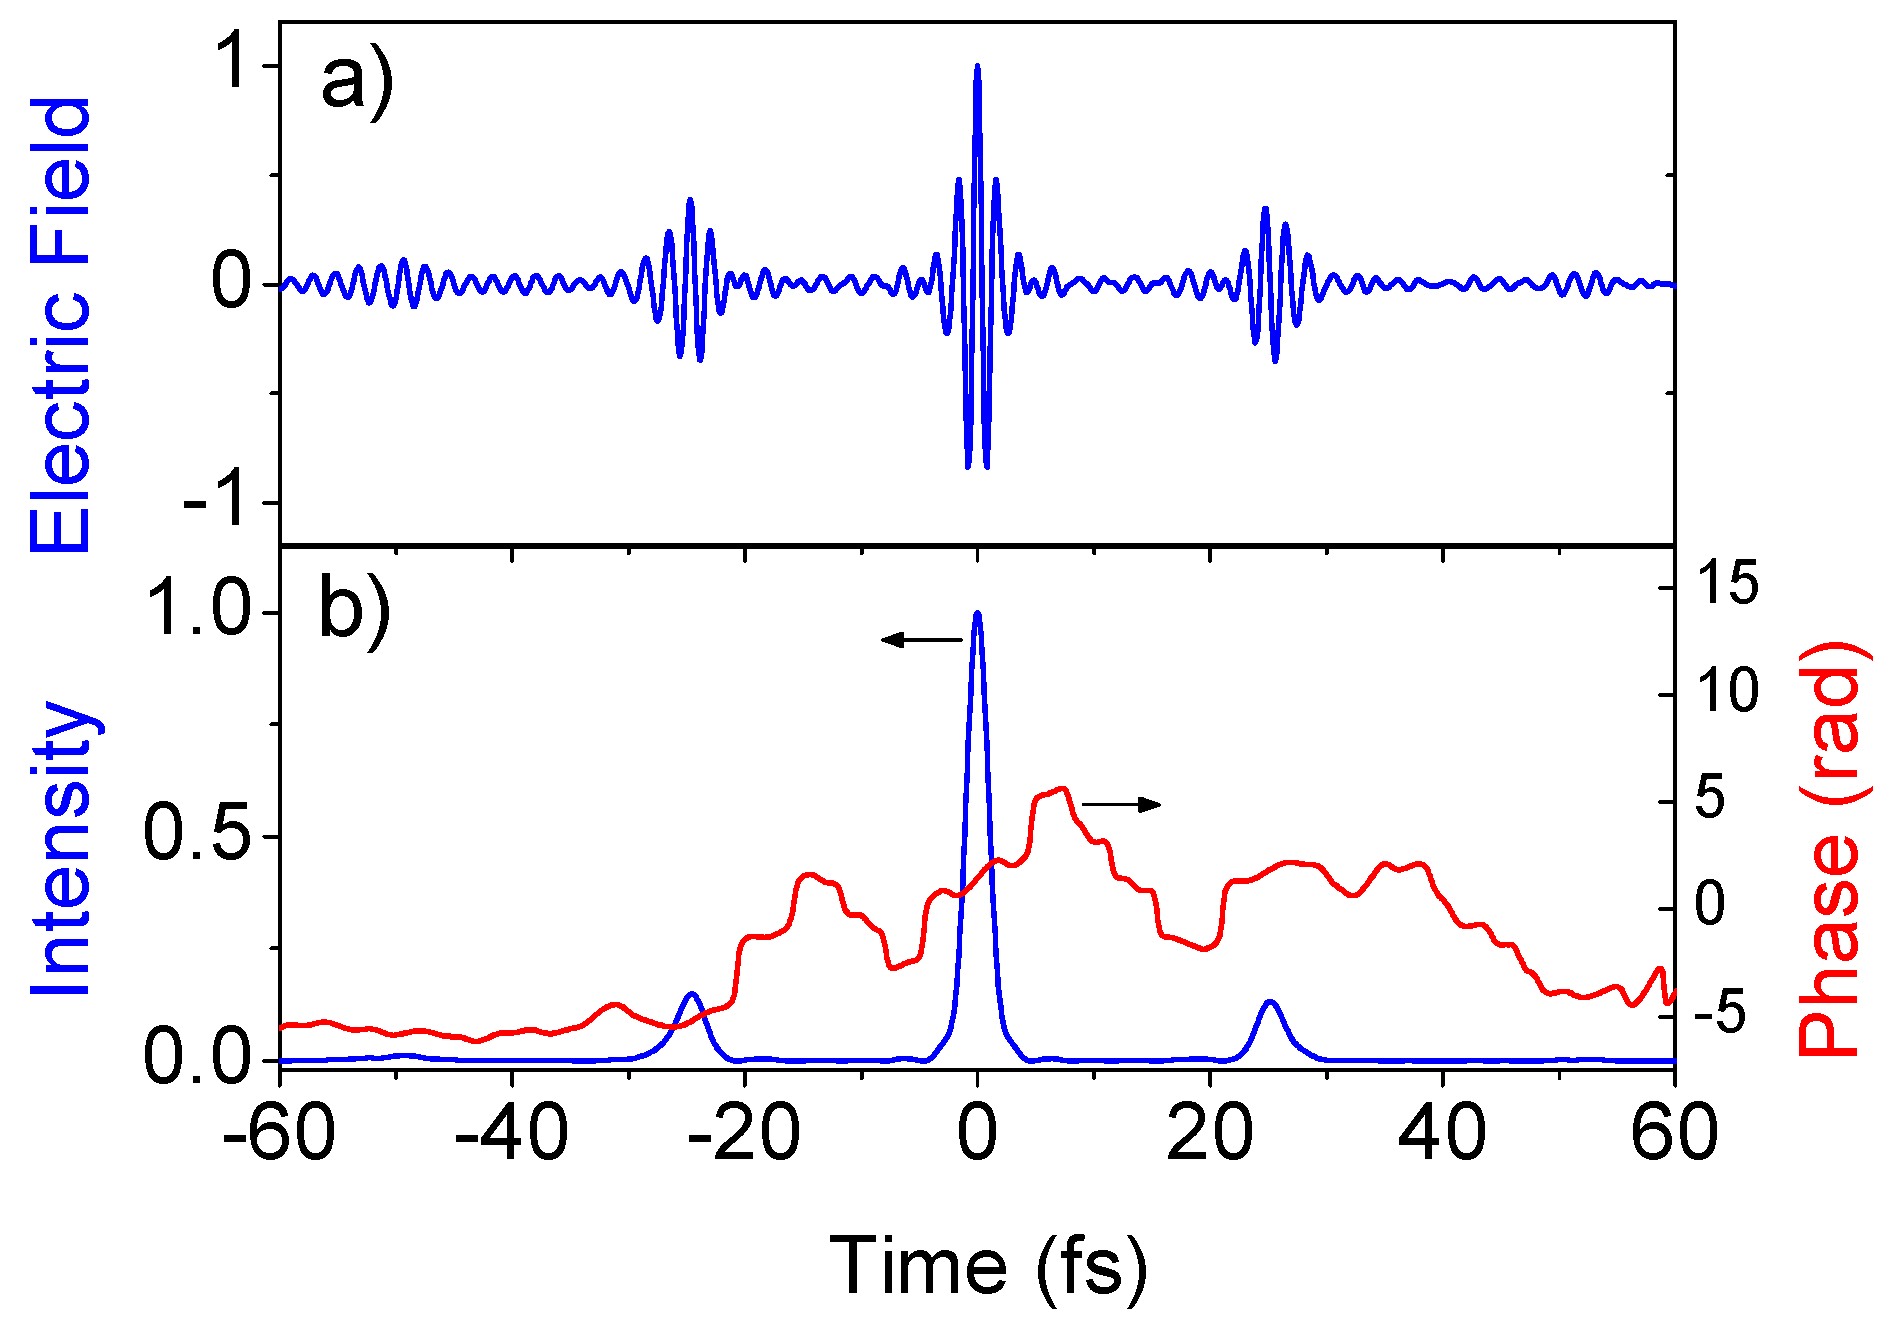
Adding the fields obtained for all measured orders while setting zero relative delay between each CFWM pulse, a synthesized field is obtained. This field has a main central transform-limited pulse with 2.2 fs duration and two smaller pulses, one at each side on the main pulse, separated 25 fs from the main pulse, which corresponds to the pump beat period. Figure 17 shows the synthesized field along with the pulse intensity and evidences the possibility of synthesizing single cycle pulses with this technique. The central pulse carries almost all the energy, which amounts to 5 μJ.
Figure 17.
Total field (a) Normalized electric field and (b) intensity and phase of the pulses obtained by coherent addition of the retrieved electric fields of the 13 gated CFWM pulses. The main peak is a 1.3-cycle, transform-limited 2.2 fs pulse. [21].
Figure 17.
Total field (a) Normalized electric field and (b) intensity and phase of the pulses obtained by coherent addition of the retrieved electric fields of the 13 gated CFWM pulses. The main peak is a 1.3-cycle, transform-limited 2.2 fs pulse. [21].

5. Generation of Ultraviolet (UV), Deep Ultraviolet (DUV), Vacuum Ultraviolet (VUV) and Higher-Order Harmonics by CFWM from a Standard Titanium:Sapphire Laser Amplifier
Since the materials have usually resonances in the UV, the use of pumps in the visible part of the spectrum means working on the normal dispersion region. Angle phase-matching of upconverted orders in CFWM processes is possible thanks to dispersion. The shorter the wavelength of the resonance in the material the higher the number of upconverted orders that can be obtained, provided that the form of the dispersion curve is adequate. In the previous results we showed how cascaded upconverted orders comfortably reached the UV and DUV up to 209 nm departing from orange and green pump pulses from a dye laser-amplifier. A natural extension of the research in CFWM is trying to reach the UV, DUV, VUV or to generate high order harmonics with more common pump colors, available in many labs, such as the fundamental and the second-harmonic of a Titanium:Sapphire laser.
5.1. Ultrashort Pulses from the UV to the VUV by CWFM
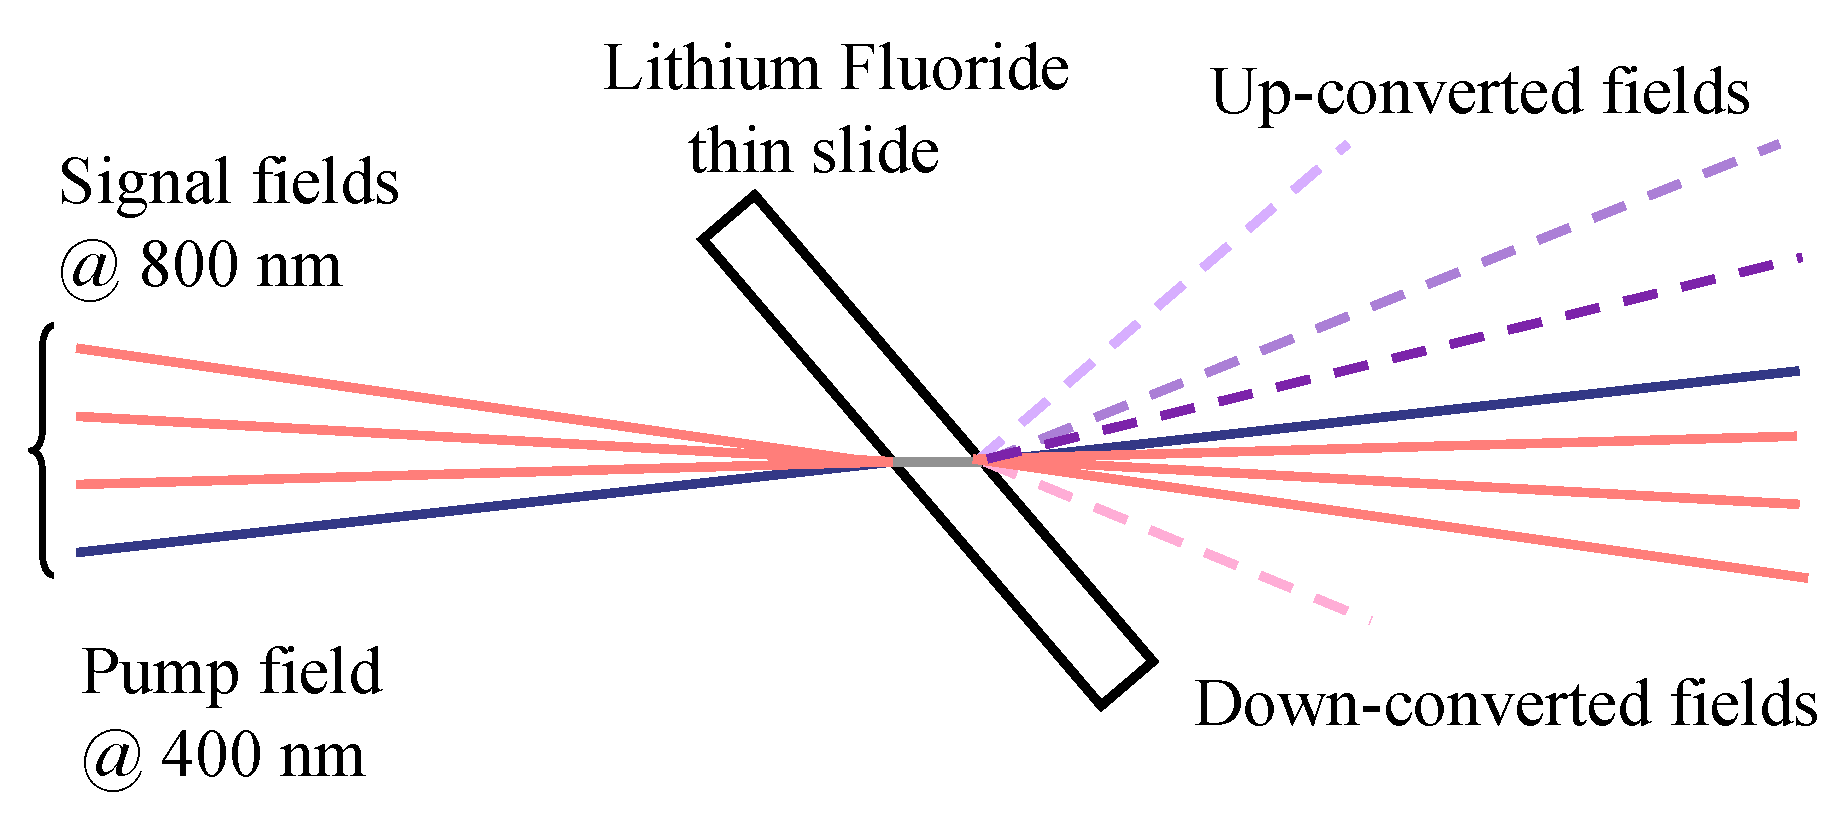
Materials with large band gap such as alkali metal halide crystals are transparent in the VUV, so they are candidates for generating a cascade of upconverted orders via FWM up to the VUV, and we have tested this numerically [27]. The model developed in Section 3 assumes isotropic materials, and some alkali metal halides have cubic symmetry, so they are equivalent to an isotropic material and we used our model to test the feasibility of obtaining VUV pulses via CFWM in LiF using a pump beam at 400 nm and a signal beam at 800 nm. Equation (3) gives the internal crossing angle with would result in perfect phase-matching of the nth order, but for pump and signal beams as separated as a fundamental wavelength and its second harmonic, the internal angles for successive upconverted orders is too different for a cascade to be generated departing from only two beams, so the geometry of Figure 18 was devised, with a pump field at 400 nm and 3 signal beams at 800 nm, the latter satisfying the phase-matching condition for different consecutive orders.
Figure 18.
Scheme for multiple-beam CFWM with strong angular separation between pump and signal frequencies. [27].
Figure 18.
Scheme for multiple-beam CFWM with strong angular separation between pump and signal frequencies. [27].

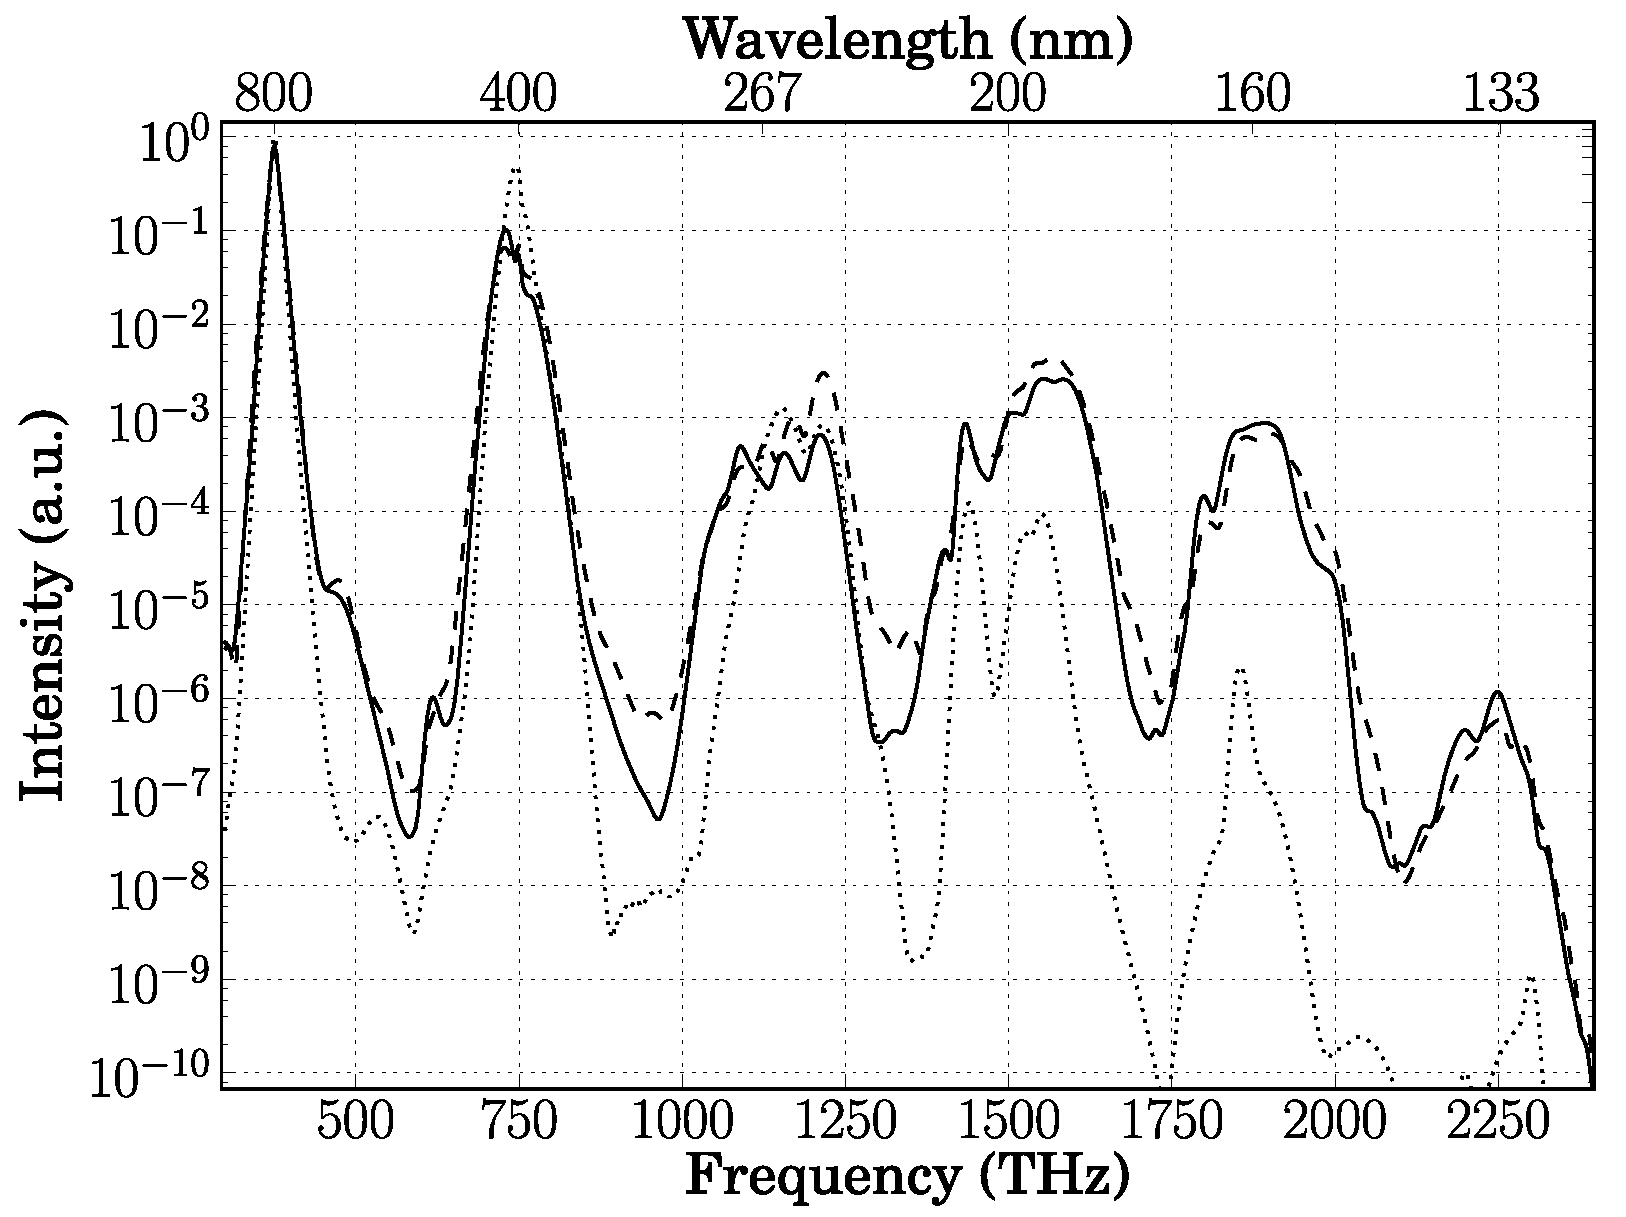
We consider a pump beam at 400 nm and three signal beams at 800 nm, all transform-limited with 25 fs duration and focused to a 40 μm radius spot. All pump and signal beams have an irradiance of 5 × 10¹² Wcm−2 (energy per pulse of ∼ 6 μJ). The pump and the three signal beams form internal angles of 11.98, 15.65 and 20.06 degrees in a 300 μm thick LiF slide. The signal beams can be individually delayed to optimize the VUV generation. Figure 19 shows the CFWM spectrum generated for a time delay of 0 fs or 7 fs (for all signal beams) along with the spectrum generated by adding the individual spectra obtained by using the pump pulse and one of the signal beams at a time, also with a time delay of 7 fs.
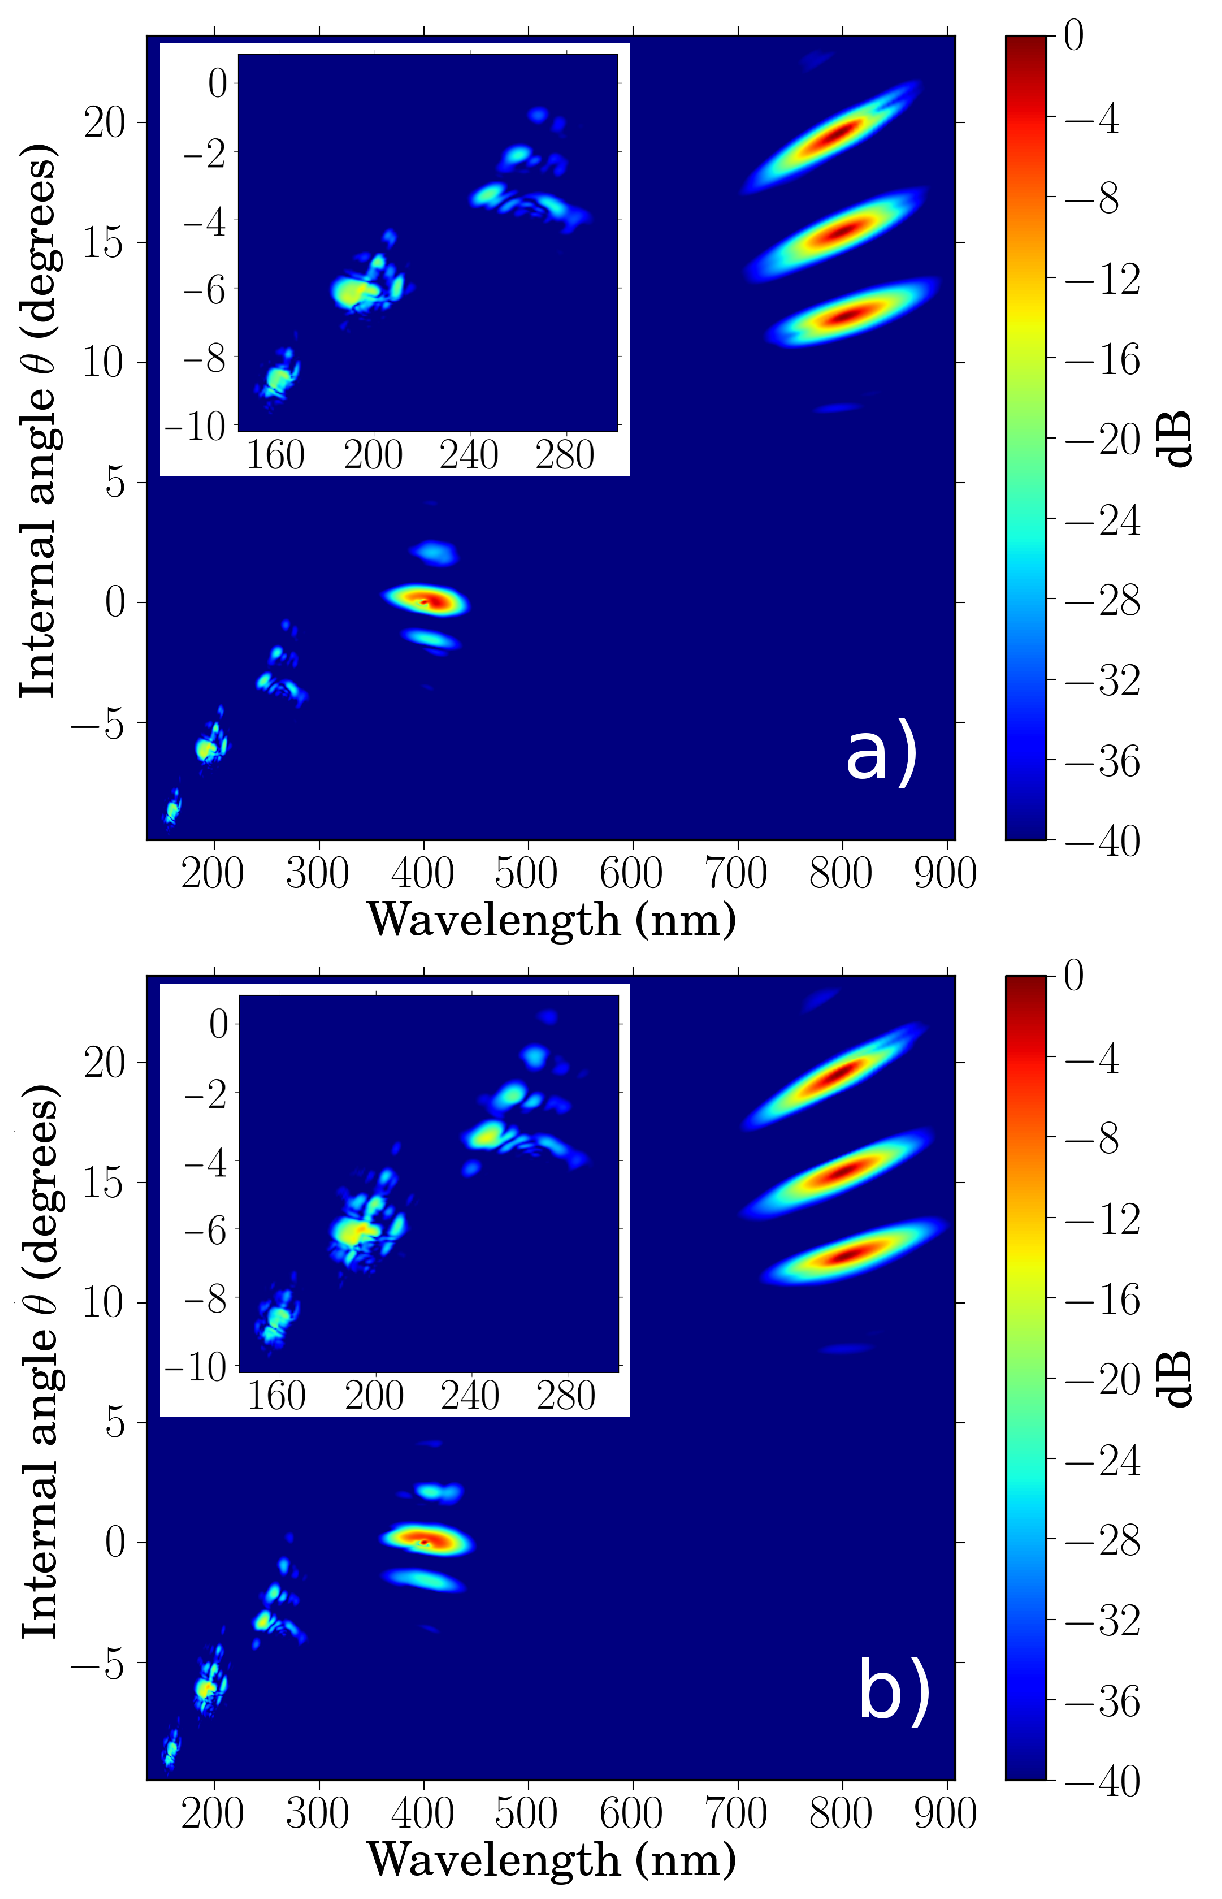
In these conditions, we observe generation of CFWM beams up to the 6th harmonic of 800 nm, with good efficiency up to the 5th harmonic. Only a slight dependence on the time delay is seen and there is full evidence of the existence of CFWM processes, since the VUV spectrum obtained by addition of the individual spectra from the different pairs of pump and signal pulses is much weaker. As already seen in section 3 the generated orders are angularly separated and due to the fact that all three pump beams at 800 nm contribute to generate a specific order at a slightly different interaction angle and wavelength, because of the different phase-matching conditions, the generated orders have a complex spatial structure, although angular selection of a specific order can always be performed. Figure 20 shows the simulated θ − λ spectrum for 7 fs and 0 fs delay. A cleaner structure and also a better efficiency in the 4th and 5th harmonic is observed in the case of 7 fs delay compared to perfect synchronization (0 fs delay).
Figure 19.
Simulated CFWM spectra in LiF. Solid (dashed) curve: spectrum generated by the interaction of all three signal pulses at 800 nm delayed by 7 fs (0 fs) with respect to the pump pulse at 400 nm – (see text); dotted curve: combined spectrum for three independent simulations, each optimizing an individual consecutive harmonic generated by each pair of noncollinear pump and 7 fs delayed signal pulses [27].

Figure 20.
θ − λ spectrum for 7 fs (a) and 0 fs (b) relative delays between signal and pump pulses. Insets: magnified θ − λ spectra for the first three upconverted orders [27].
Figure 20.
θ − λ spectrum for 7 fs (a) and 0 fs (b) relative delays between signal and pump pulses. Insets: magnified θ − λ spectra for the first three upconverted orders [27].

The temporal behavior is also as expected, with the generated orders having ultrashort durations of the order of the duration of the pump and signal pulses (31.9, 30.5, 30.1 and 20.4 fs for the third to the sixth harmonic respectively), due to the corresponding nonlinear spectral phases. This can be seen in Figure 21. The spectrum of all orders is broadband and assuming flat spectral phases the transform-limited durations are much shorter than those of the pump and signal pulses, namely 8.86, 8.1, 6.0 and 4.0 fs, respectively.
Figure 21.
Temporal characteristics of the generated harmonics. Solid curve: intensity; dashed curve: phase [27].
Figure 21.
Temporal characteristics of the generated harmonics. Solid curve: intensity; dashed curve: phase [27].

5.2. DUV Ultrashort Pulse Generation by Highly Nondegenerate FWM
The observed fact that the generated orders are broadband deserves more attention, since the availability of sub-300 nm DUV ultrashort pulses with energies in the range of microjoules is important to study processes in photophysics, photochemistry and photobiology. Hence, although not a cascaded process, we also concentrated on studying the generation of the third harmonic of 800 nm via highly nondegenerate FWM [28]. Several techniques based on FWM in gaseous media have been employed by other groups, from third-order difference-frequency generation (DFG) of Ti:Sapphire laser pulses and their second-harmonic in hollow waveguides [3,29] and in filaments [30,31], to DFG of pre-chirped pulses in dual hollow-fiber systems [32]. Direct harmonic upconversion of few-cycle femtosecond pulses in gases [33,34] has also been performed. This last method has enabled the generation of the shortest (sub-3-fs) DUV pulses to date [35].
The setup used for the generation of broadband pulses at 266 nm by mixing two ultrashort pulses at 800 nm and 400 nm respectively in an isotropic solid is shown in Figure 22, along with the part for the temporal measurement. A Titanium:Sapphire amplifier provides the fundamental signal (or idler) pulses at 800 nm (ω) with 27 fs pulse duration, 1 mJ energy, horizontally polarized and at 1 kHz repetition rate. The pump pulses at 400 nm (2ω) are generated in a type-I 200 μm thick BBO crystal. To maximize the SHG, the chirp of the fundamental pulse was optimized and a refractive telescope reduced its beam size to 5 mm. A dichroic mirror separated the pump and signal beams and a half wave plate HWP was used to rotate the polarization plane of the signal beam by 90° so as to have the polarization parallel to the pump beam, which emerges perpendicularly polarized from the BBO crystal. Both pump and signal beams were focused with lenses to interact on a fused silica slide FS at an internal angle of 15.75° as given by Equation (3) (external angle θ = 23.2°) for the FWM process 3ω = 2 × (2ω) − ω. The slide was placed 2 cm before the focus of the lenses to avoid damage. Synchronization is achieved with a delay line in the signal branch of the setup and in the plane of the slide the signal and pump beams had 314 μJ and 191 μJ with estimated intensities of 2.6 × 10¹² and 1.2 × 10¹² W/cm2, respectively. Under these conditions we obtained 5–6 μJ DUV pulses emitted at around 266 nm at an external angle of 7°.
Figure 22.
Experimental setup for ultrashort deep ultraviolet (DUV) pulse generation by highly nondegenerate four-wave mixing (FWM) and temporal characterization via SD-FROG. DM: Dichroic mirror, HWP: Half-wave plate; M1-M3: Aluminum mirrors; M4-M8: 45° dielectric mirrors. Inset: idler, pump and generated DUV beam, directly projected onto a white card [28].
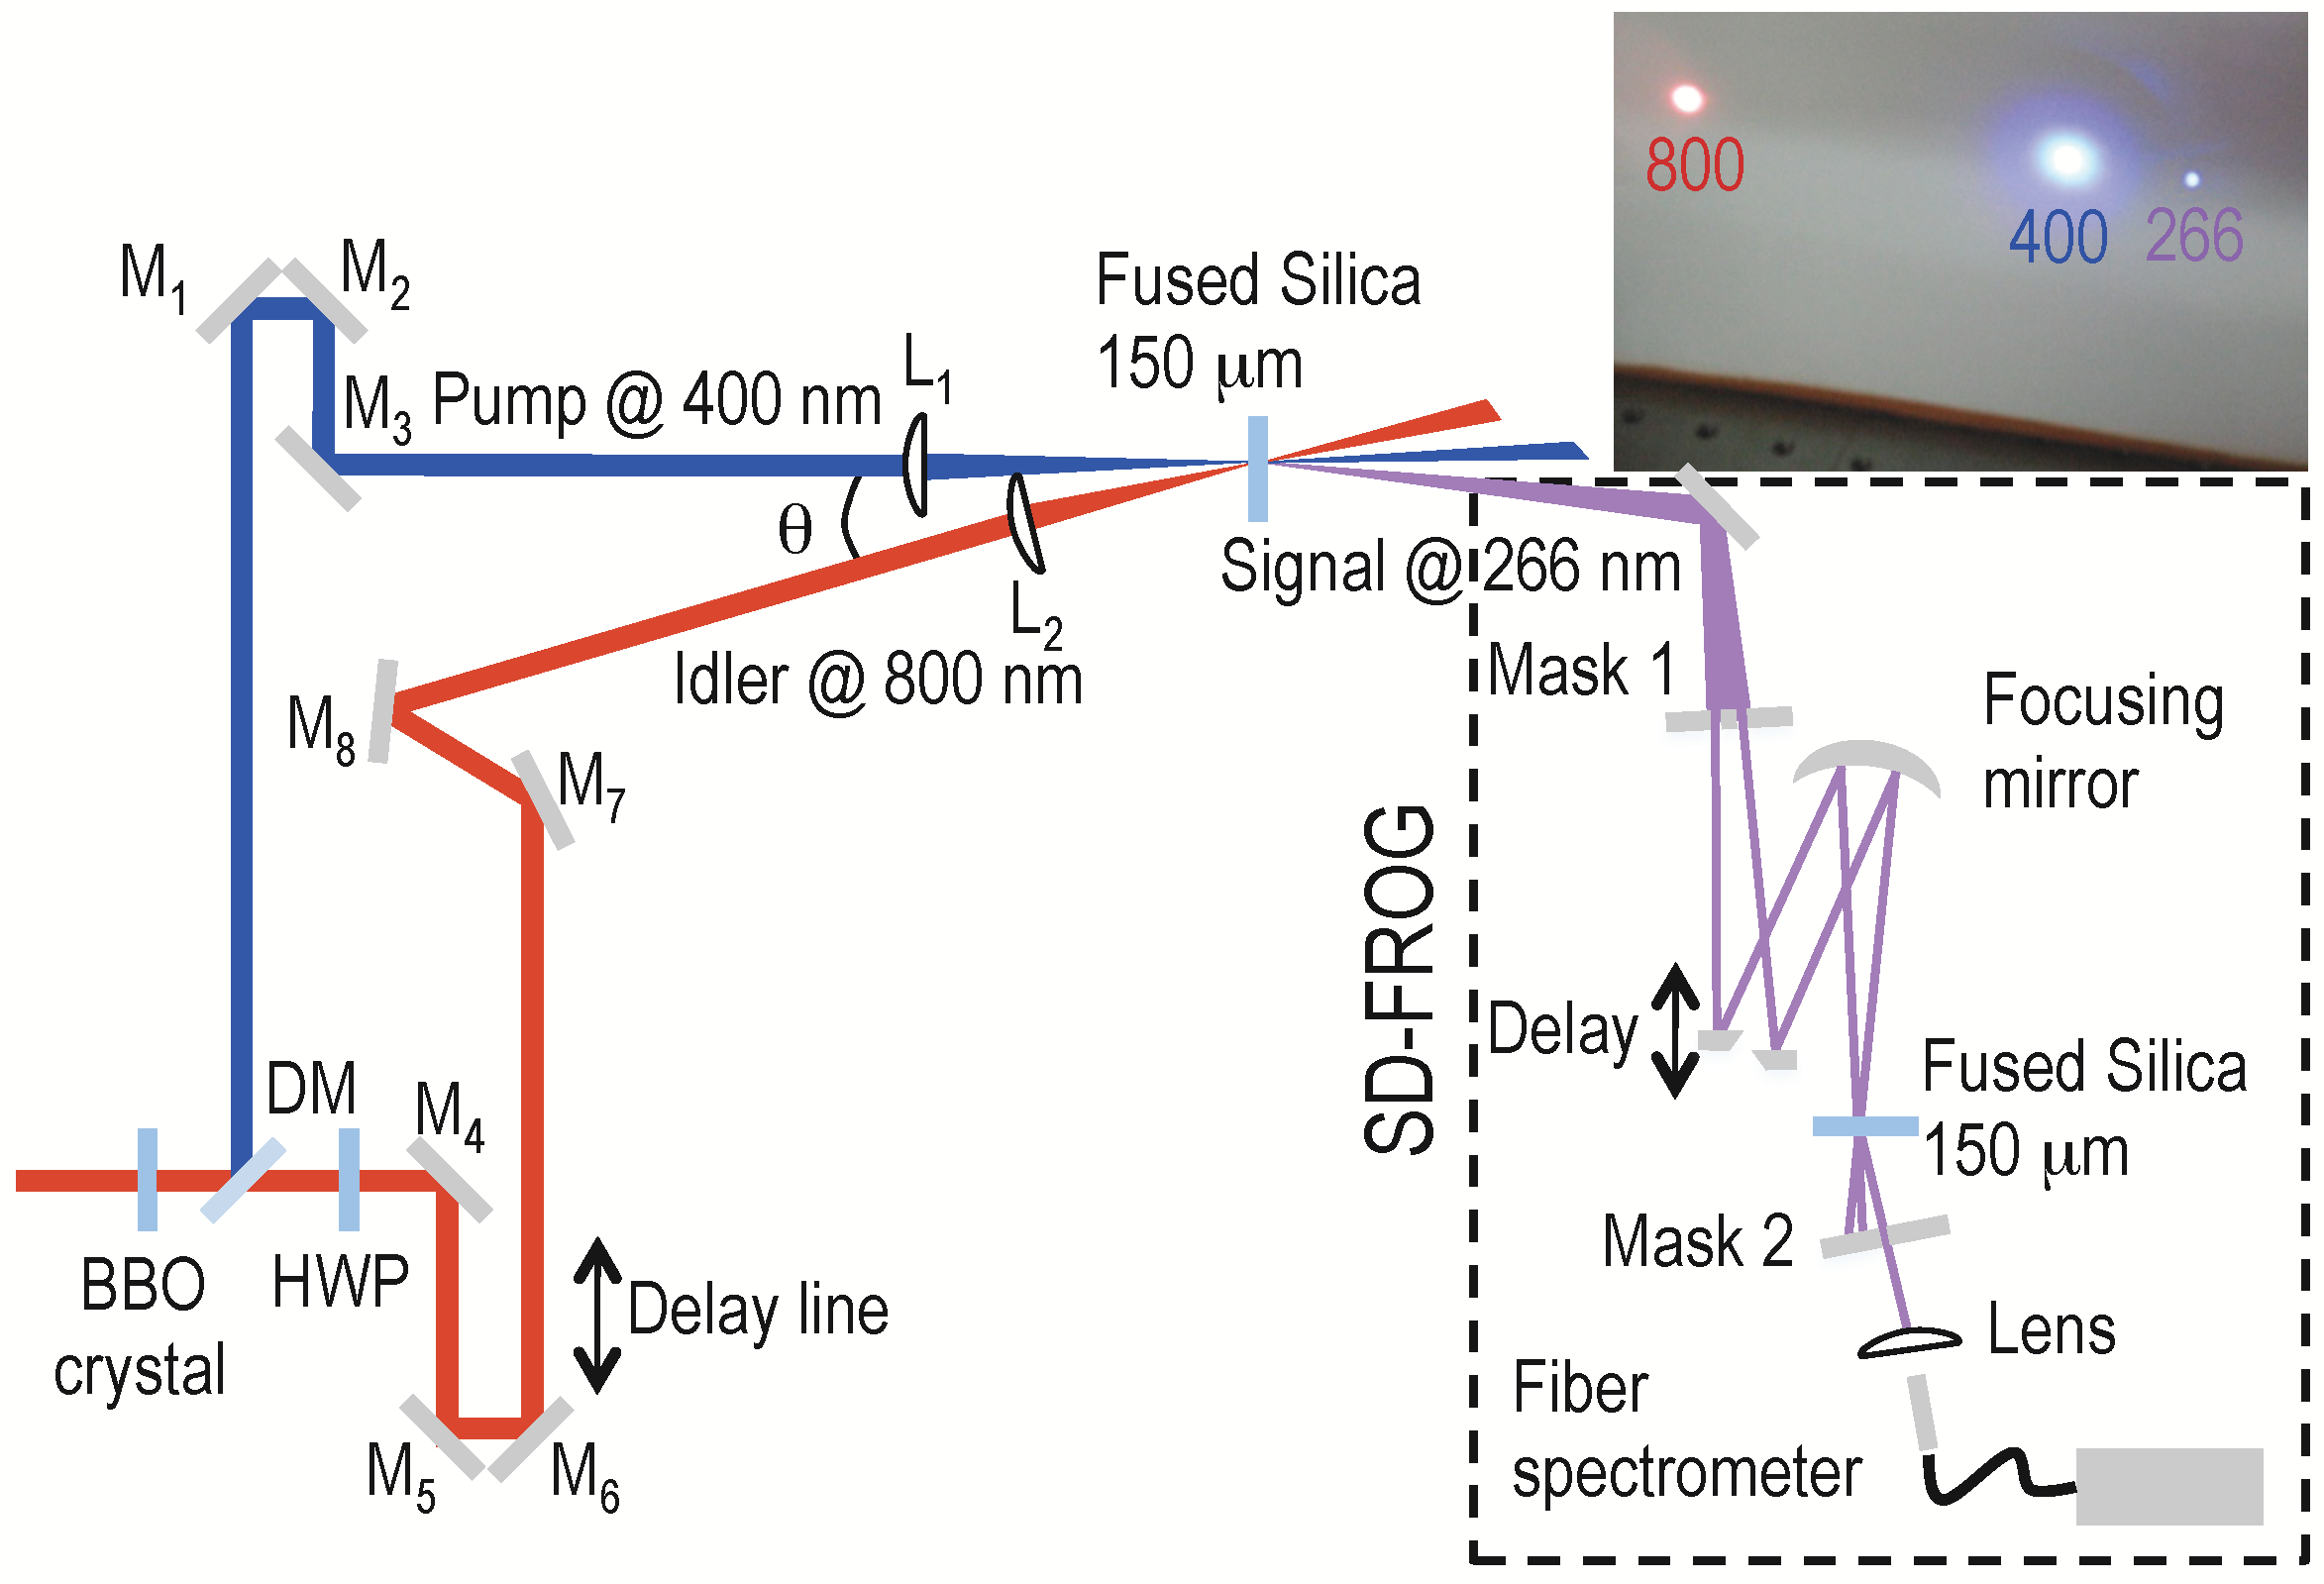
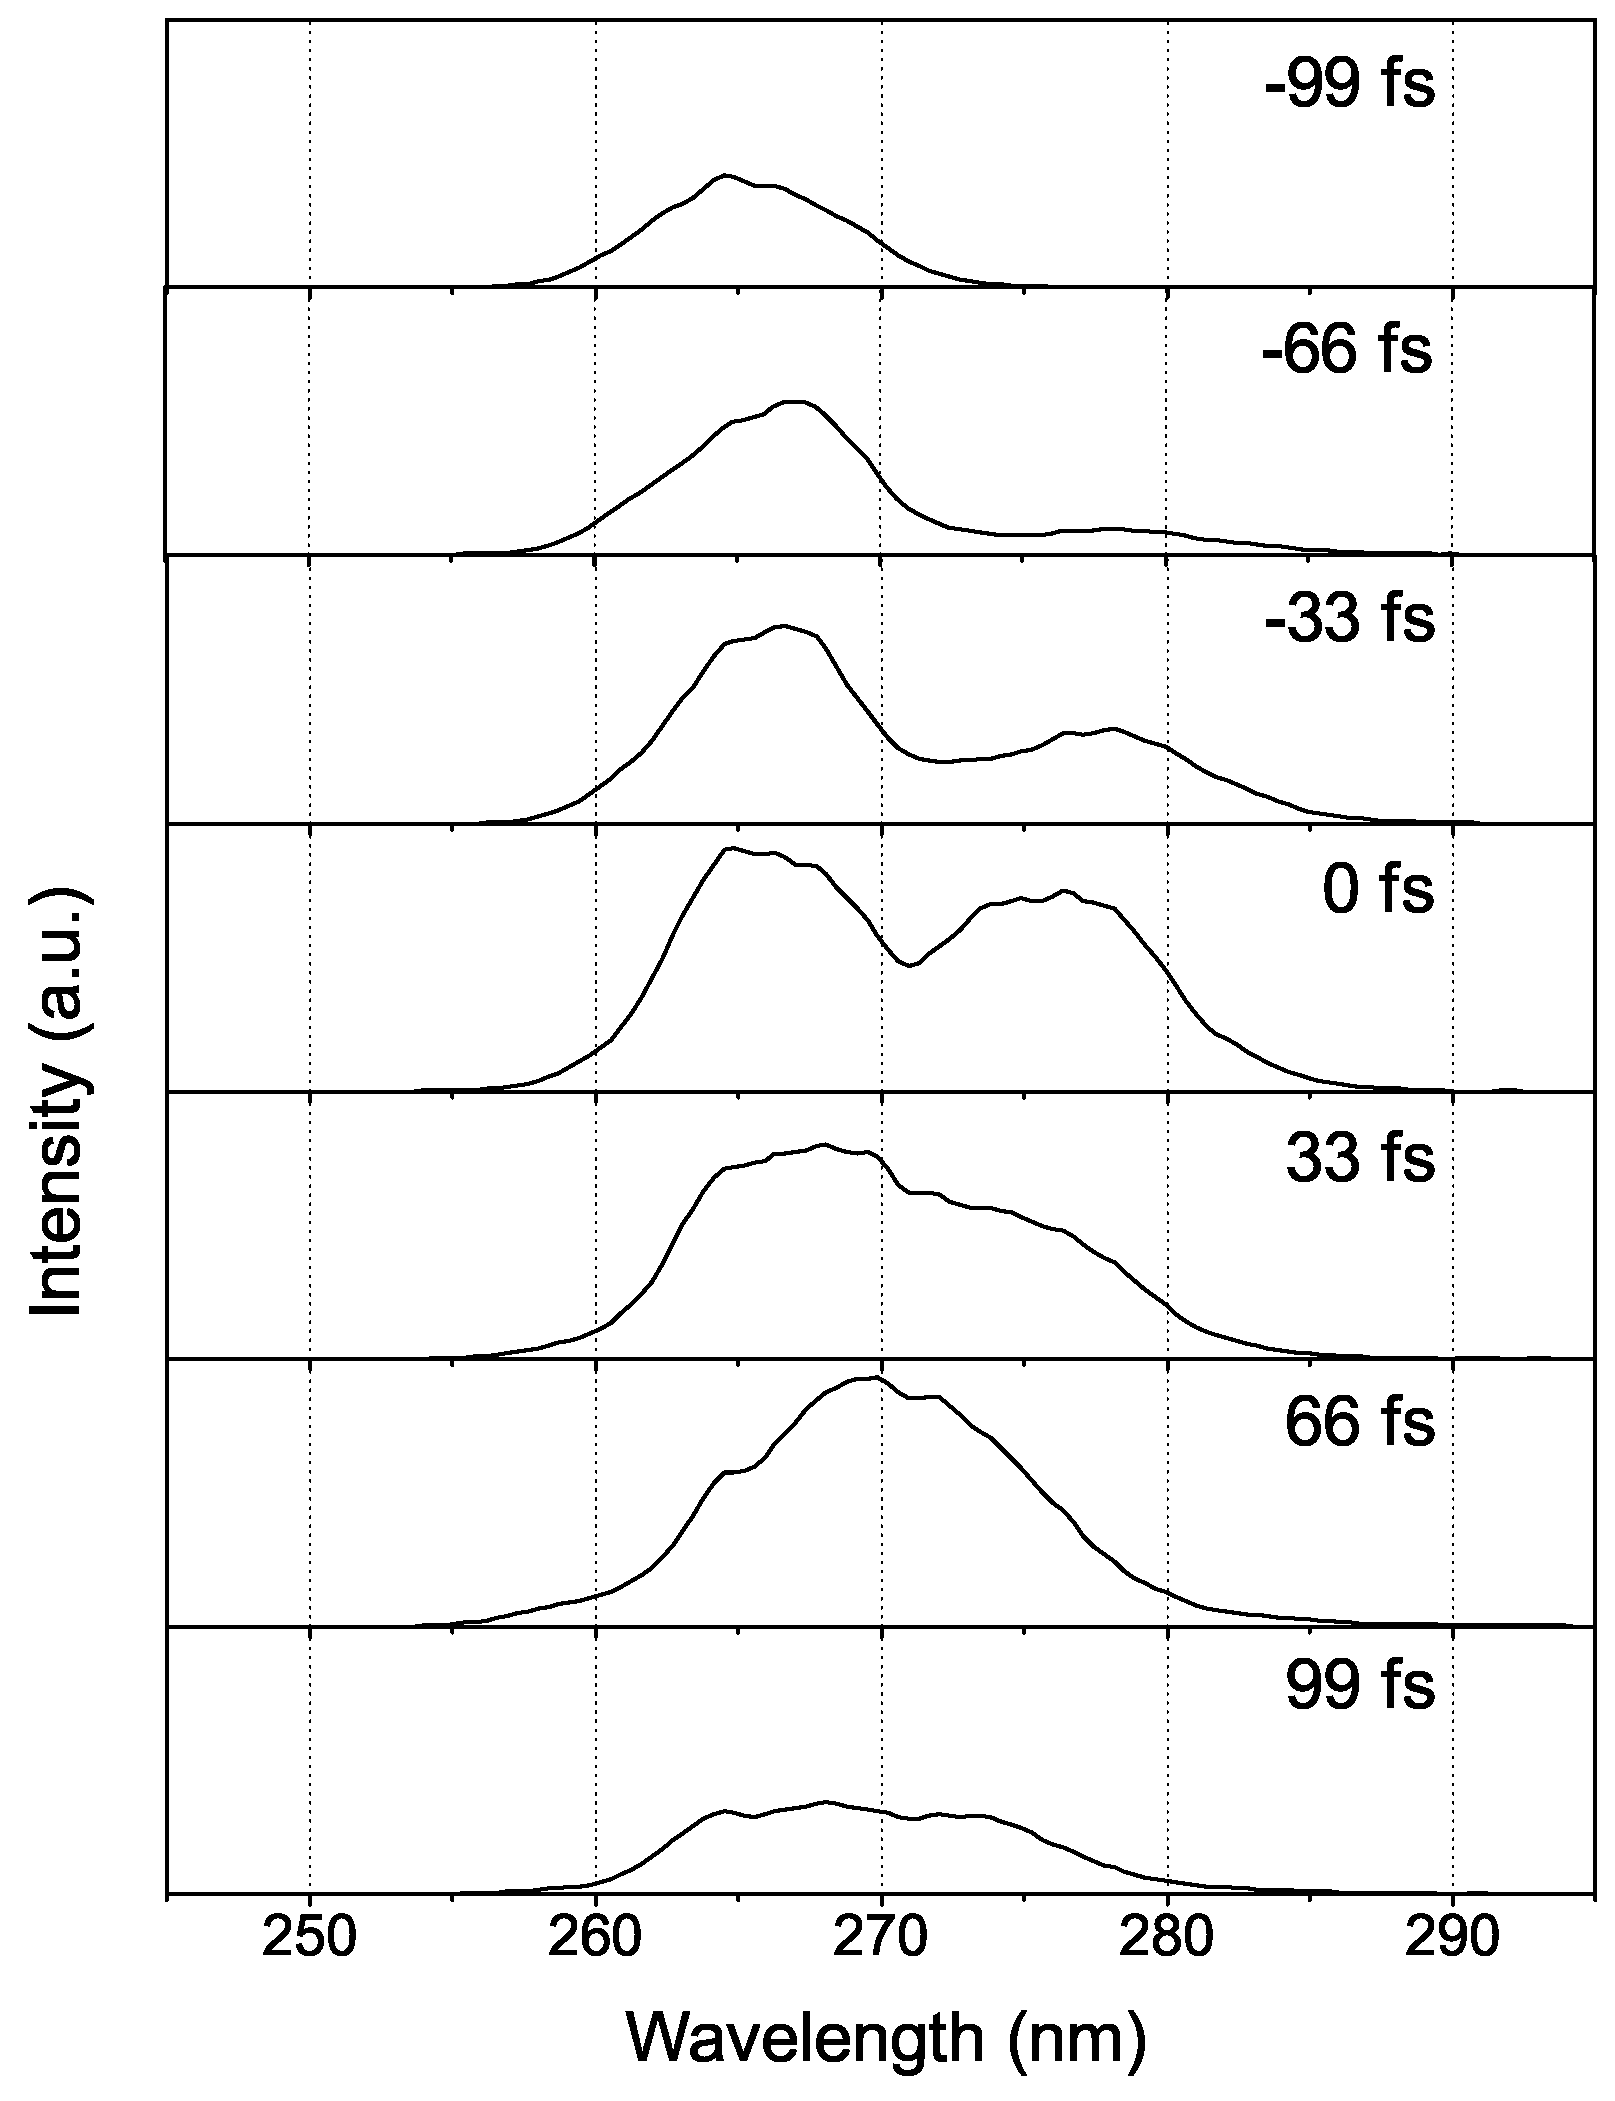
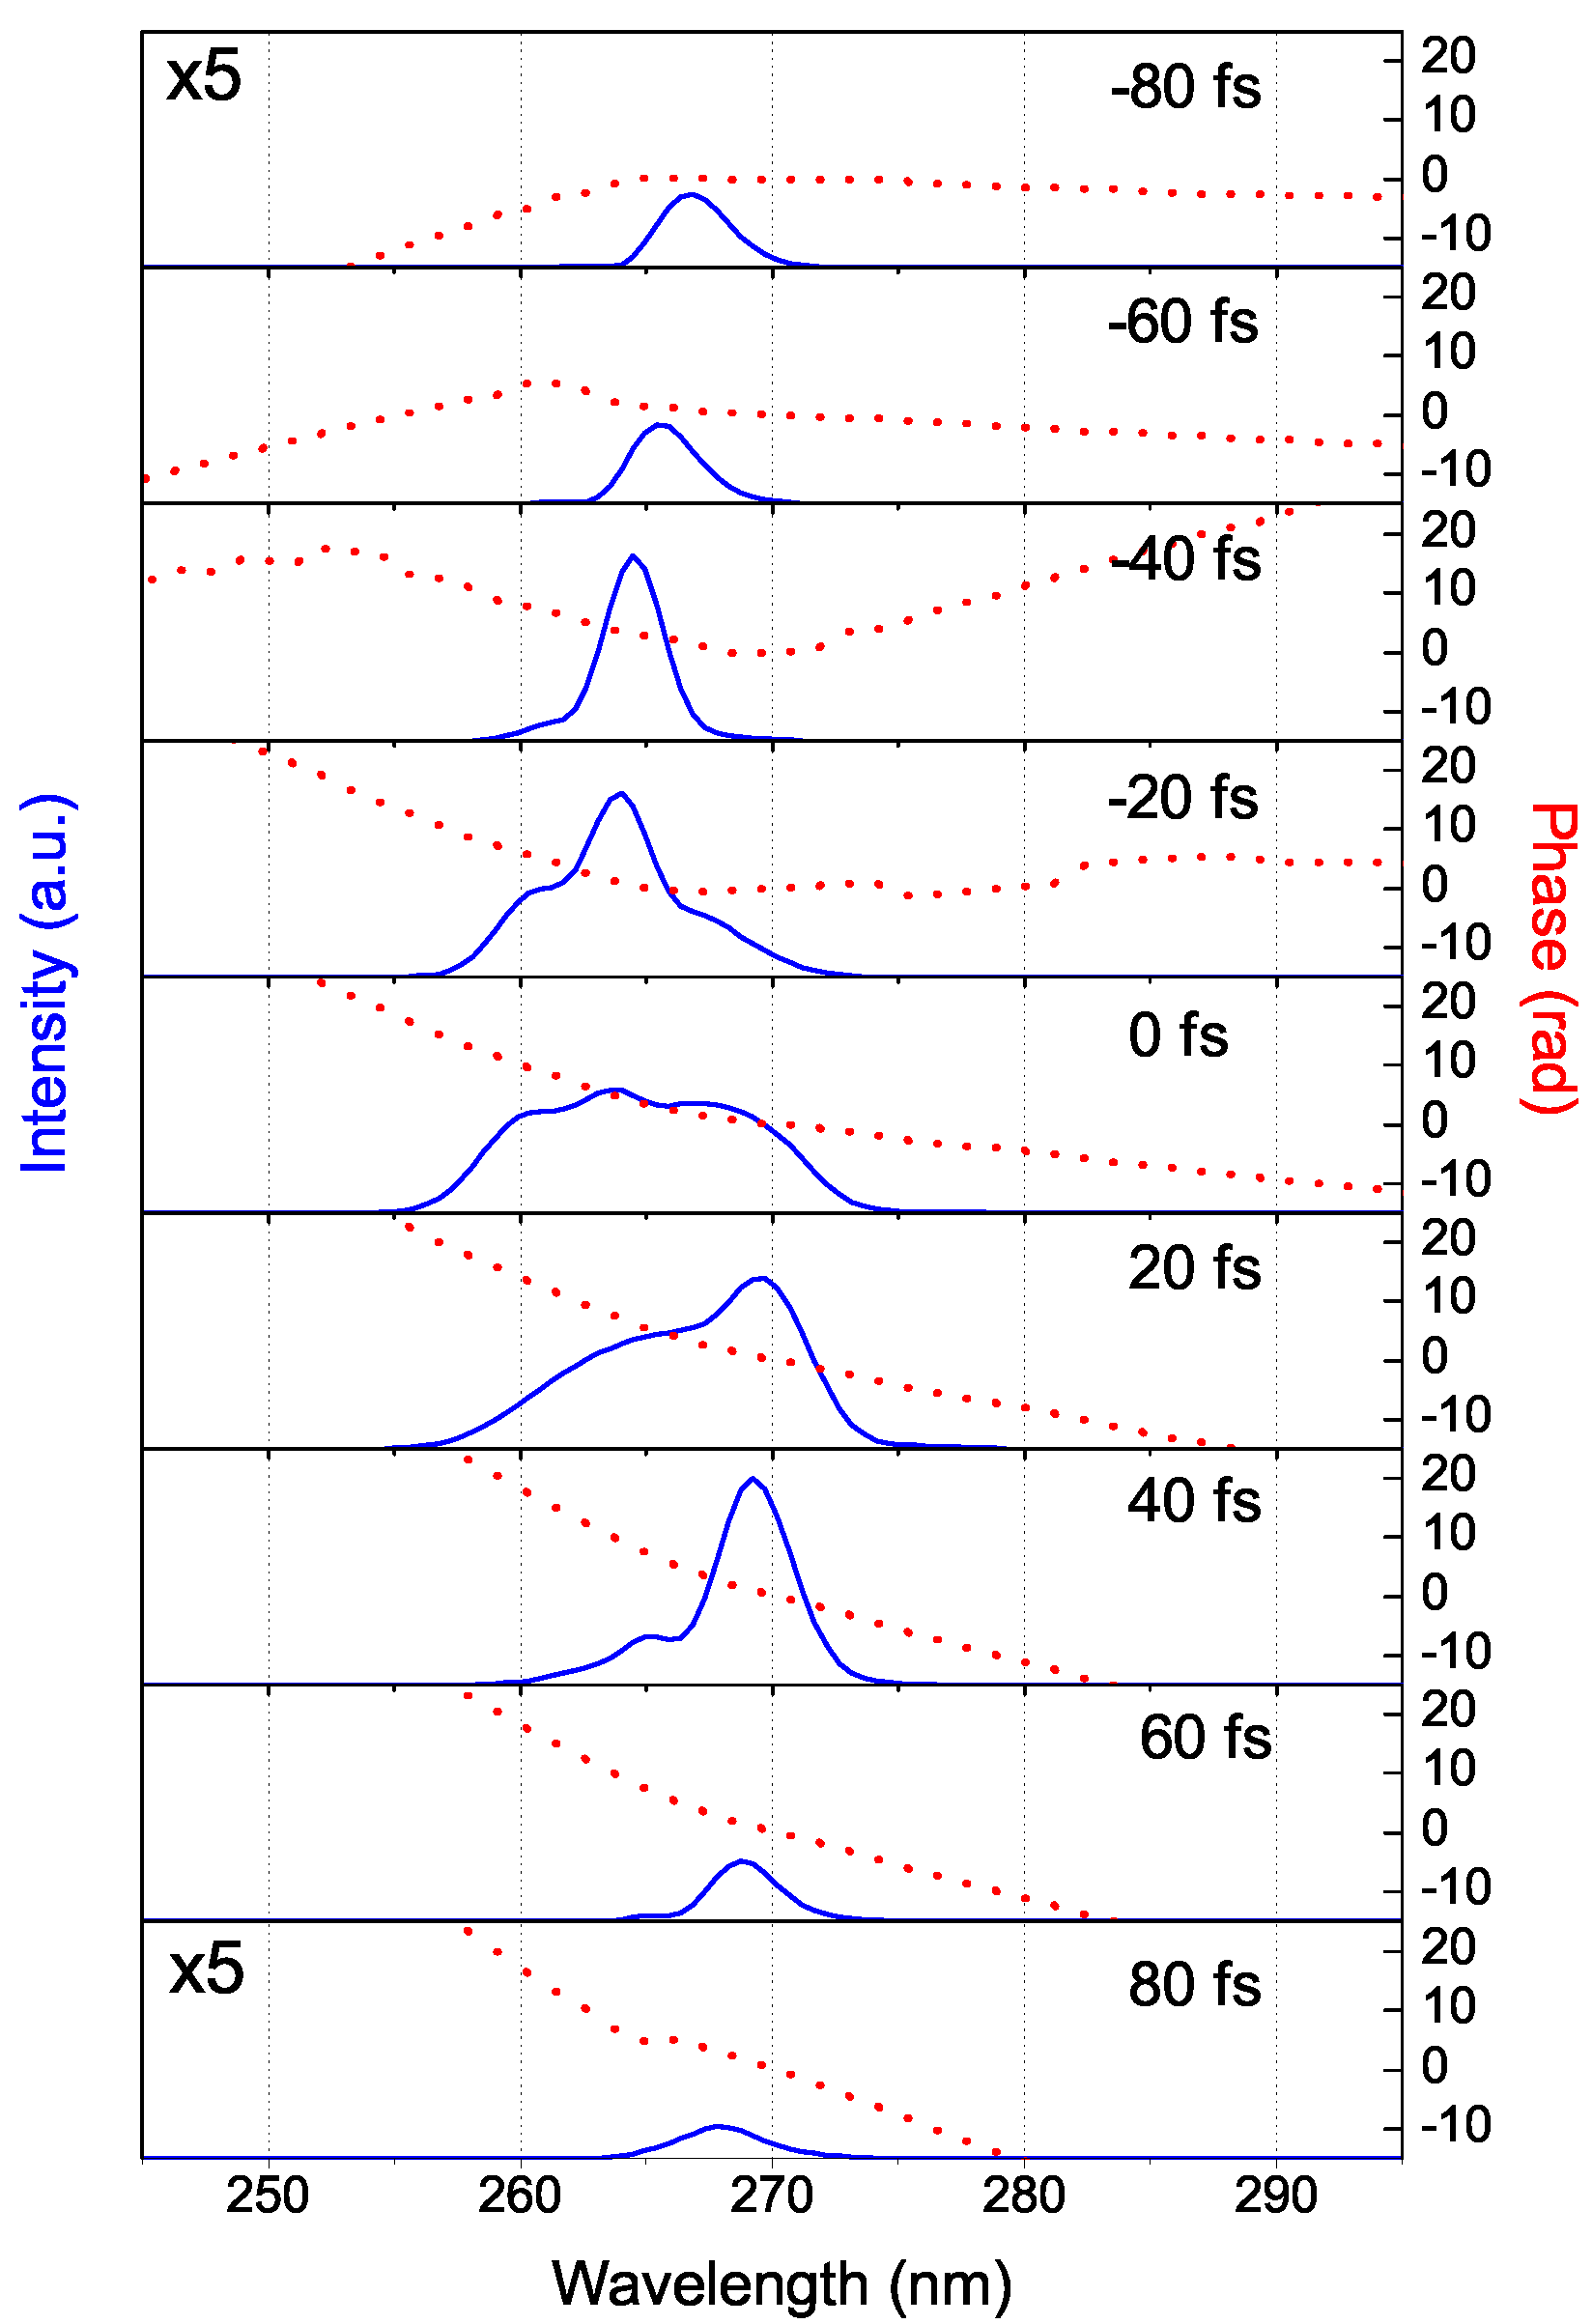
Figure 23 shows the spectra registered with a fiber coupled spectrometer for different delays, defining the 0 fs delay for the situation in which higher energy pulses were obtained (6 μJ). Different broadband spectra were obtained for delays ranging from −99 fs to 99 fs and the dependence of the shape and central frequency can be explained by the cross-phase modulation between the pump and idler pulses. Integration of these spectra with reference to the energy measured for the one with 6 μJ (Figure 20, delay 0 fs) gives 1.5, 2.4, 3.85, 6.0, 4.75, 4.9 and 1.4 μJ for this series.
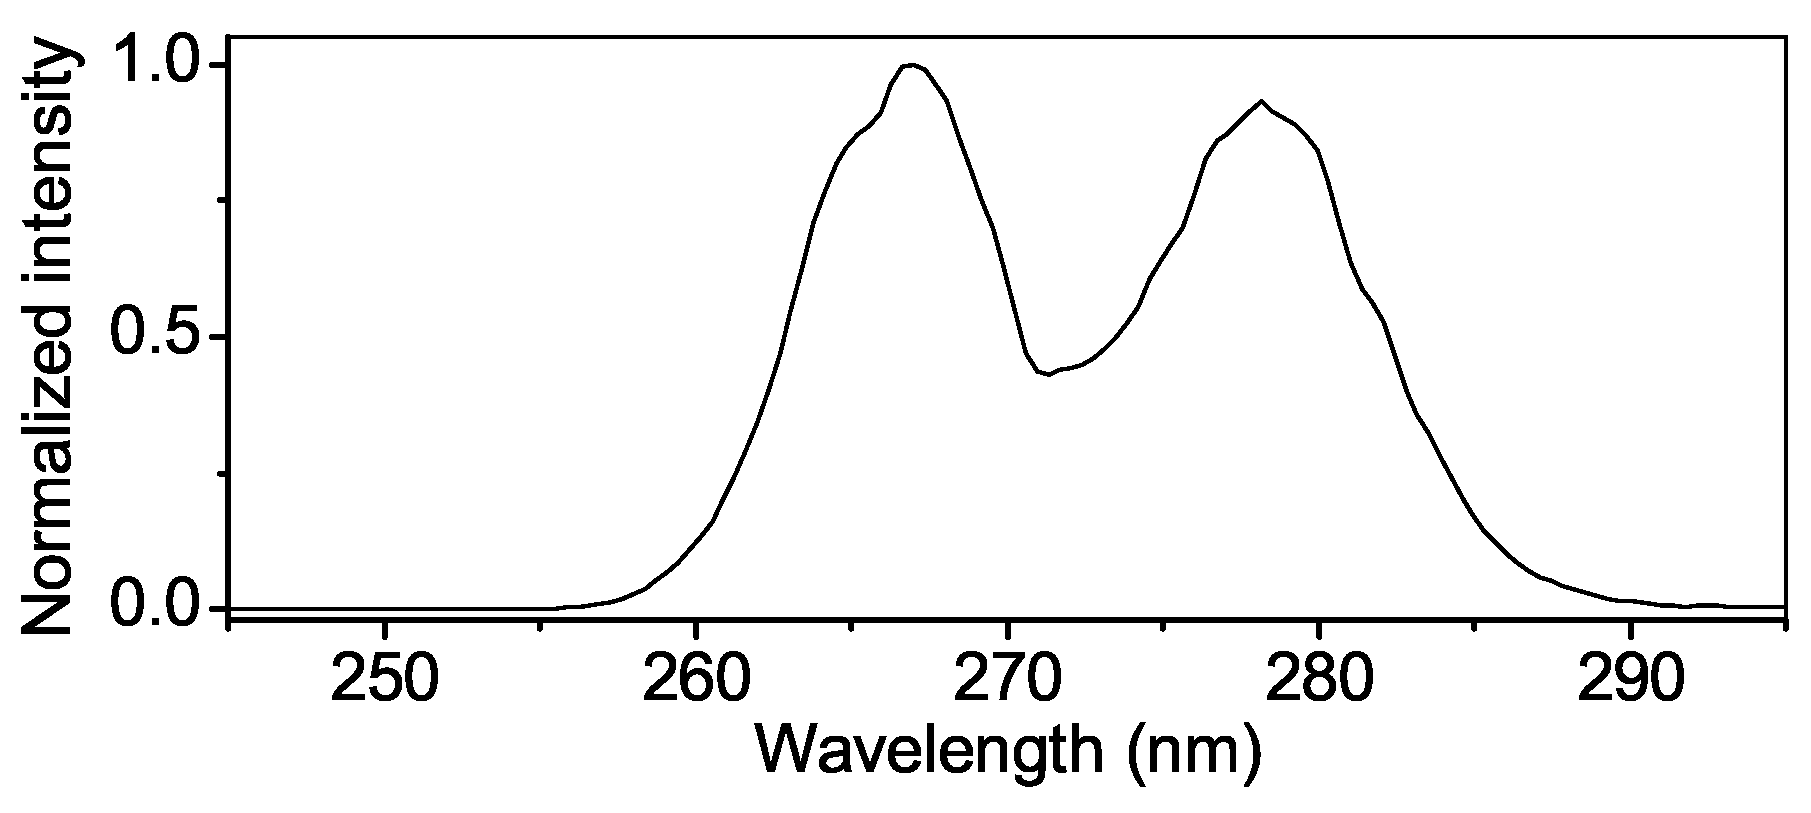
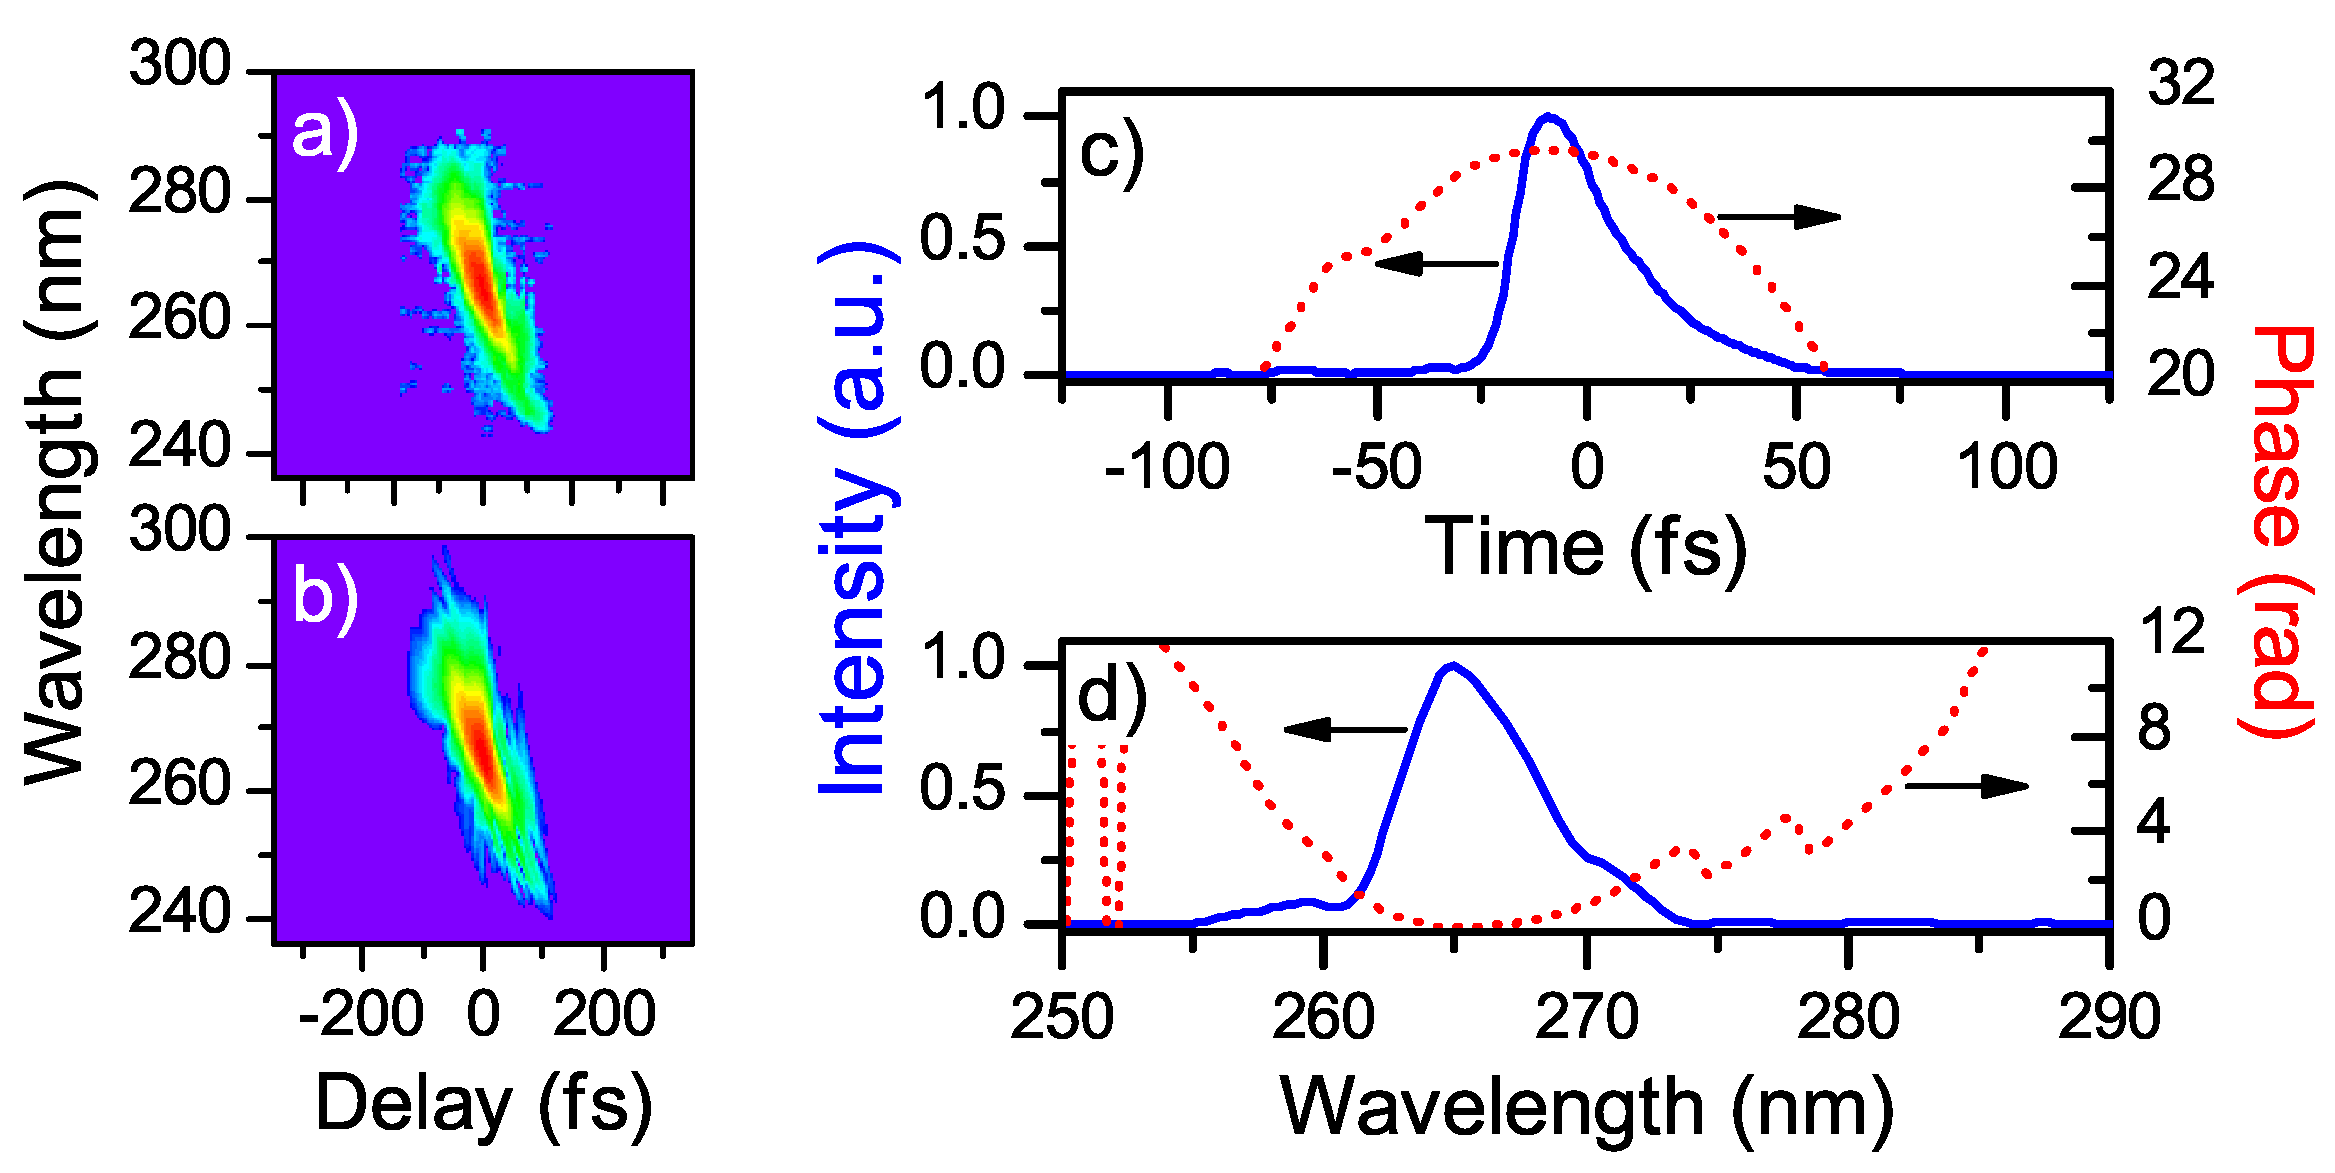
The spectra are broad enough (Figure 23 and Figure 24) to support ultrashort durations and the DUV (as well as the SHG pump pulses) were characterized by self-diffraction FROG (SD-FROG). The experimental details can be seen in Figure 22. Two holes with 1.6 mm diameter separated by 3.5 mm were drilled on a metallic mask and aligned so that both holes transmitted similar intensities from the central part of the DUV beam. A relative temporal delay was set between both pulses using d-shaped mirrors and a stepper motor stage (3.33 fs step). Both pulses were focused with an aluminum mirror (f = 200 mm) in a second fused silica slide were a self-diffraction beam was generated and later isolated to measure its spectrum in a fiber coupled spectrometer. Figure 25 shows the measured FROG traces and corresponding retrievals using standard Femtosoft FROG software, which gives 27.3 fs DUV pulses with a spectral width of 5.7 nm and a time-bandwidth-product of 0.67. The FROG measurement of the SHG pulses resulted in a duration of 48.6 fs.
Figure 23.
Experimental spectra of the generated DUV signal for different delays (separated by ∼ 33 fs) between idler and pump pulses. Negative delay: pump arrives after idler, positive delay: pump arrives before idler [28].
Figure 23.
Experimental spectra of the generated DUV signal for different delays (separated by ∼ 33 fs) between idler and pump pulses. Negative delay: pump arrives after idler, positive delay: pump arrives before idler [28].

Figure 24.
Broadest experimental spectrum obtained in our-set-up, capable of supporting sub-4-fs [28].
Figure 24.
Broadest experimental spectrum obtained in our-set-up, capable of supporting sub-4-fs [28].

Figure 25.
(a) Experimental and (b) retrieved SD-FROG traces of the DUV pulses (in log scale); (c) retrieved pulse in the time and (d) frequency domains [28].
Figure 25.
(a) Experimental and (b) retrieved SD-FROG traces of the DUV pulses (in log scale); (c) retrieved pulse in the time and (d) frequency domains [28].

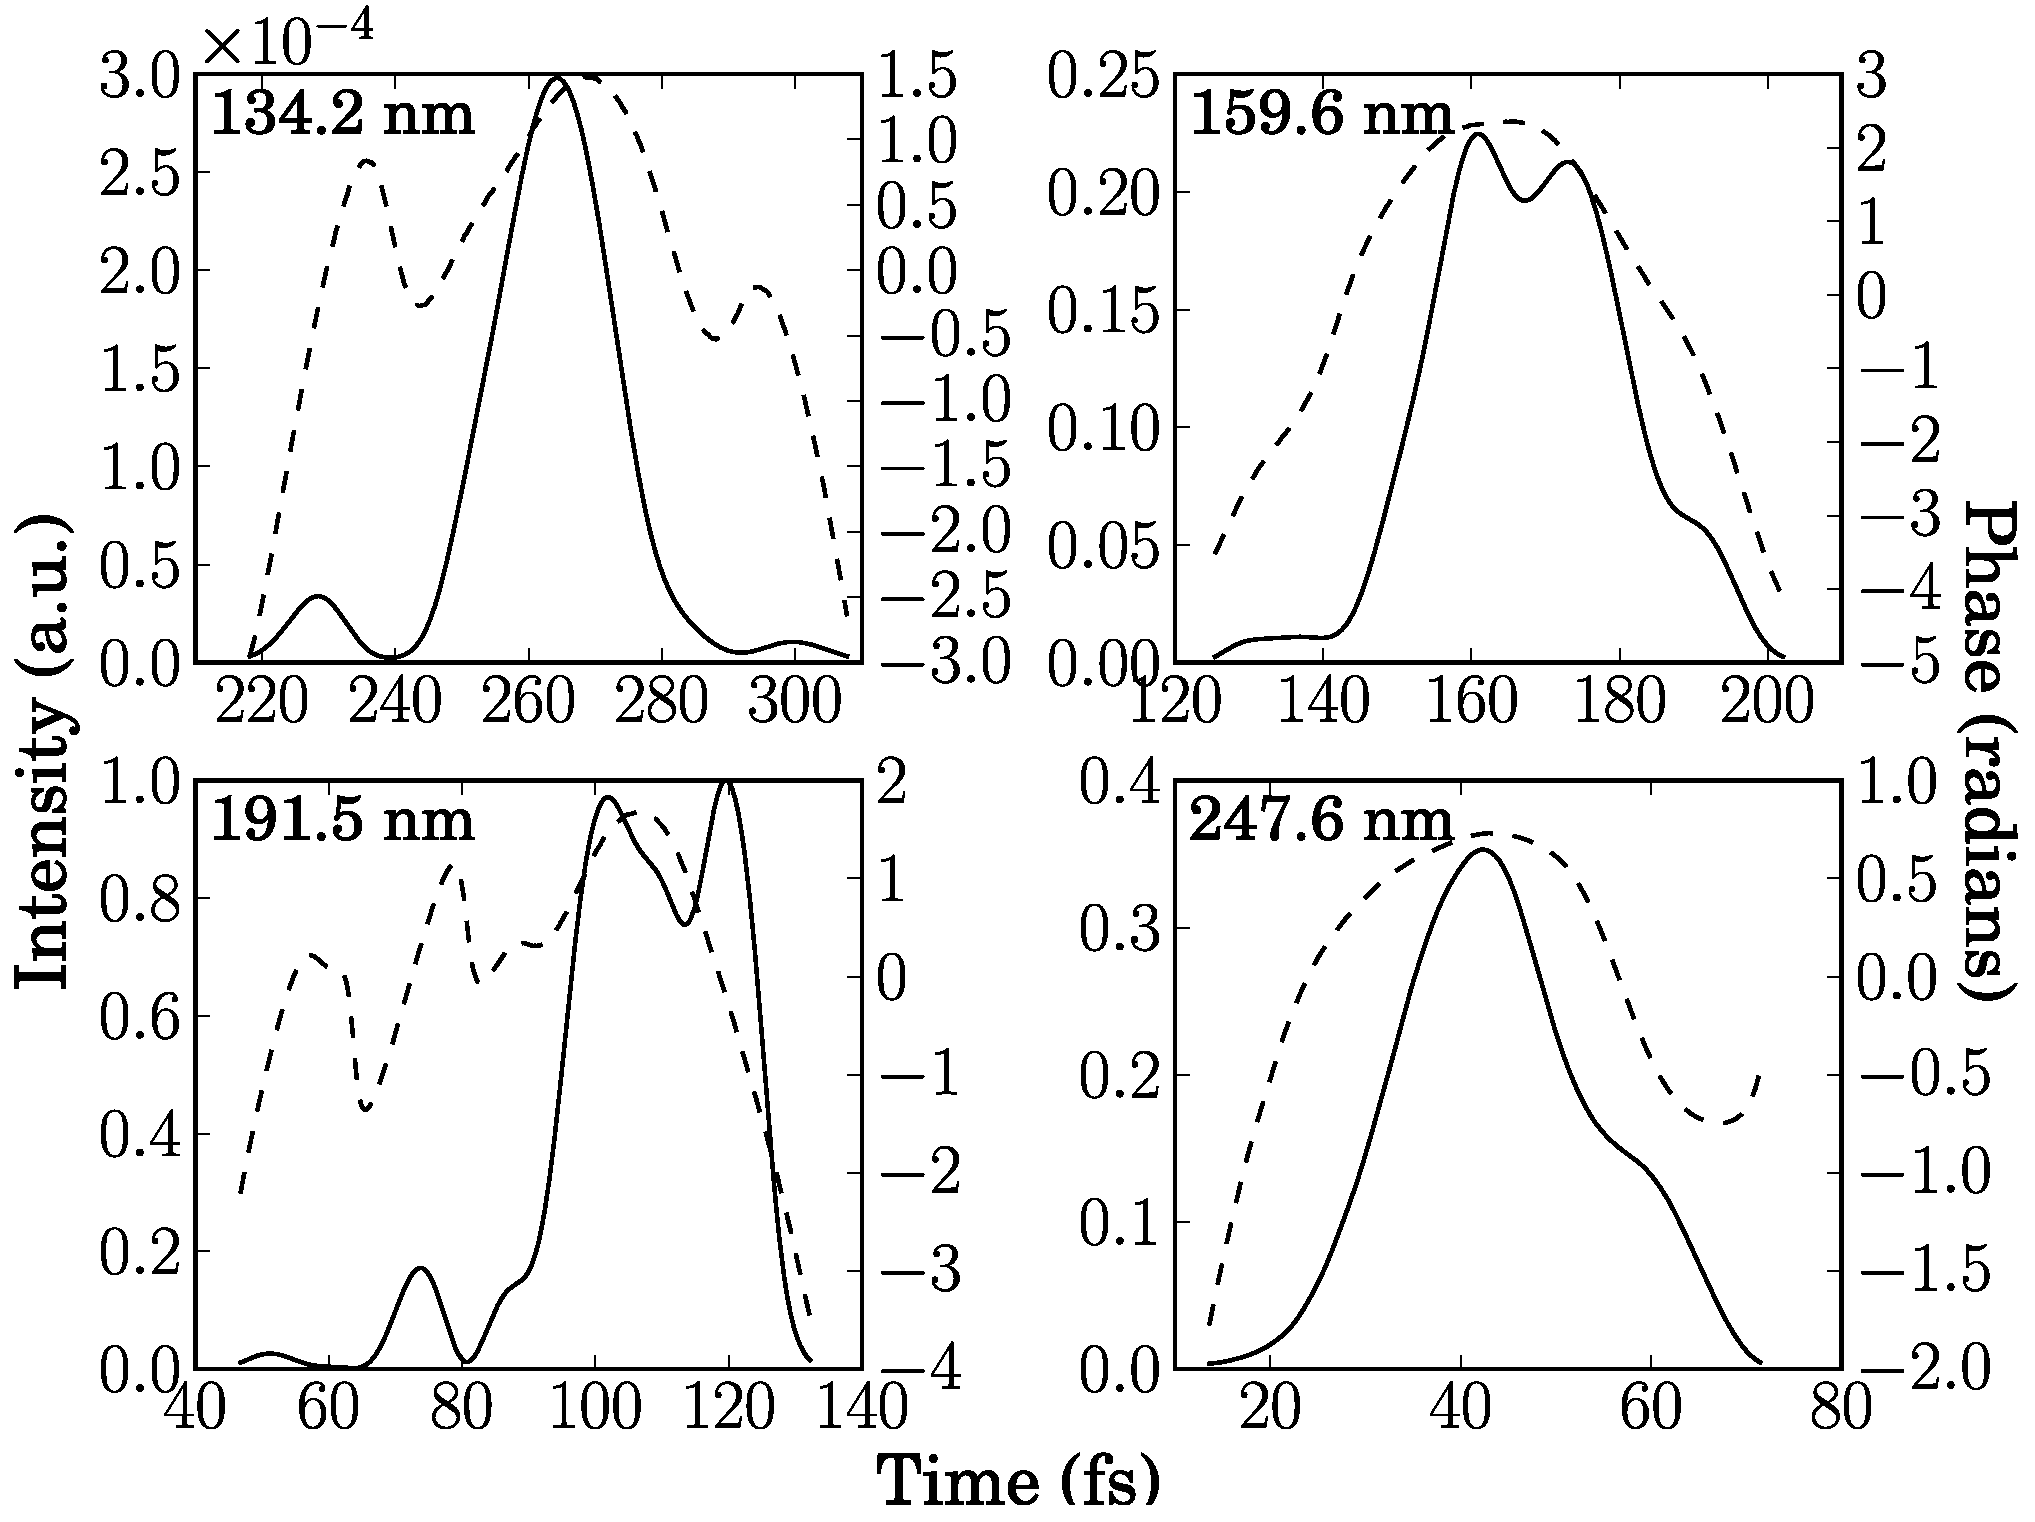
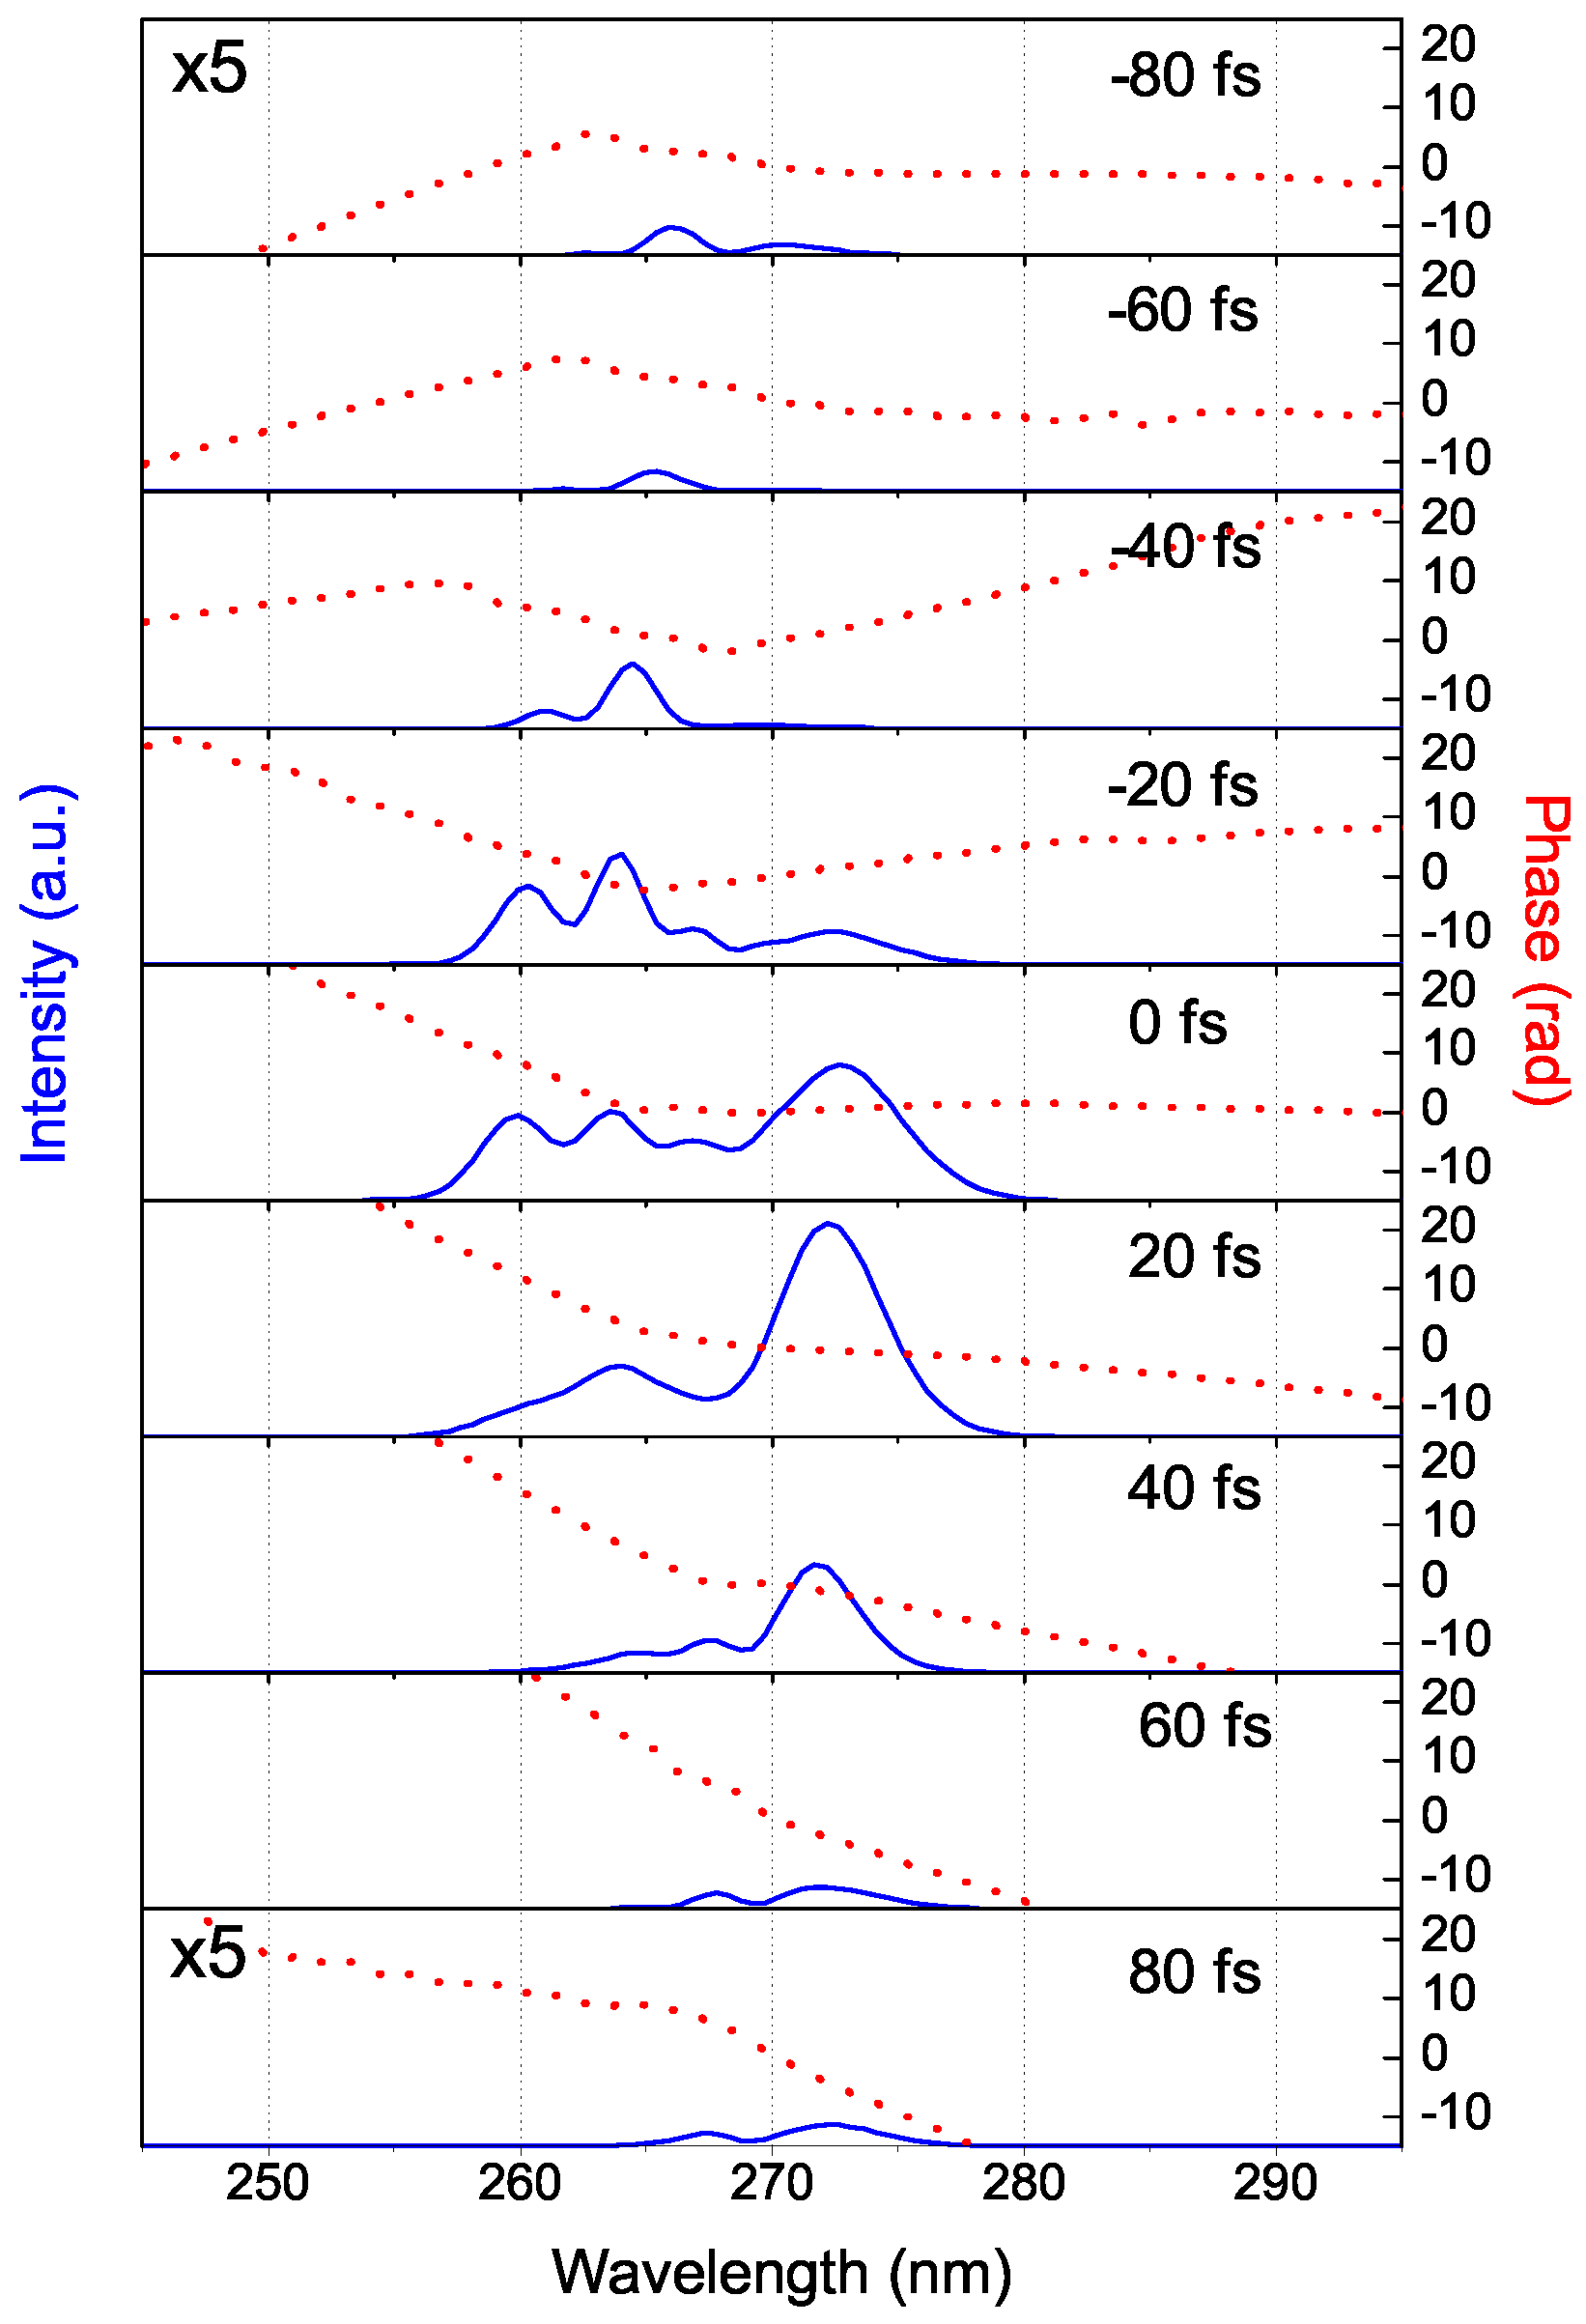
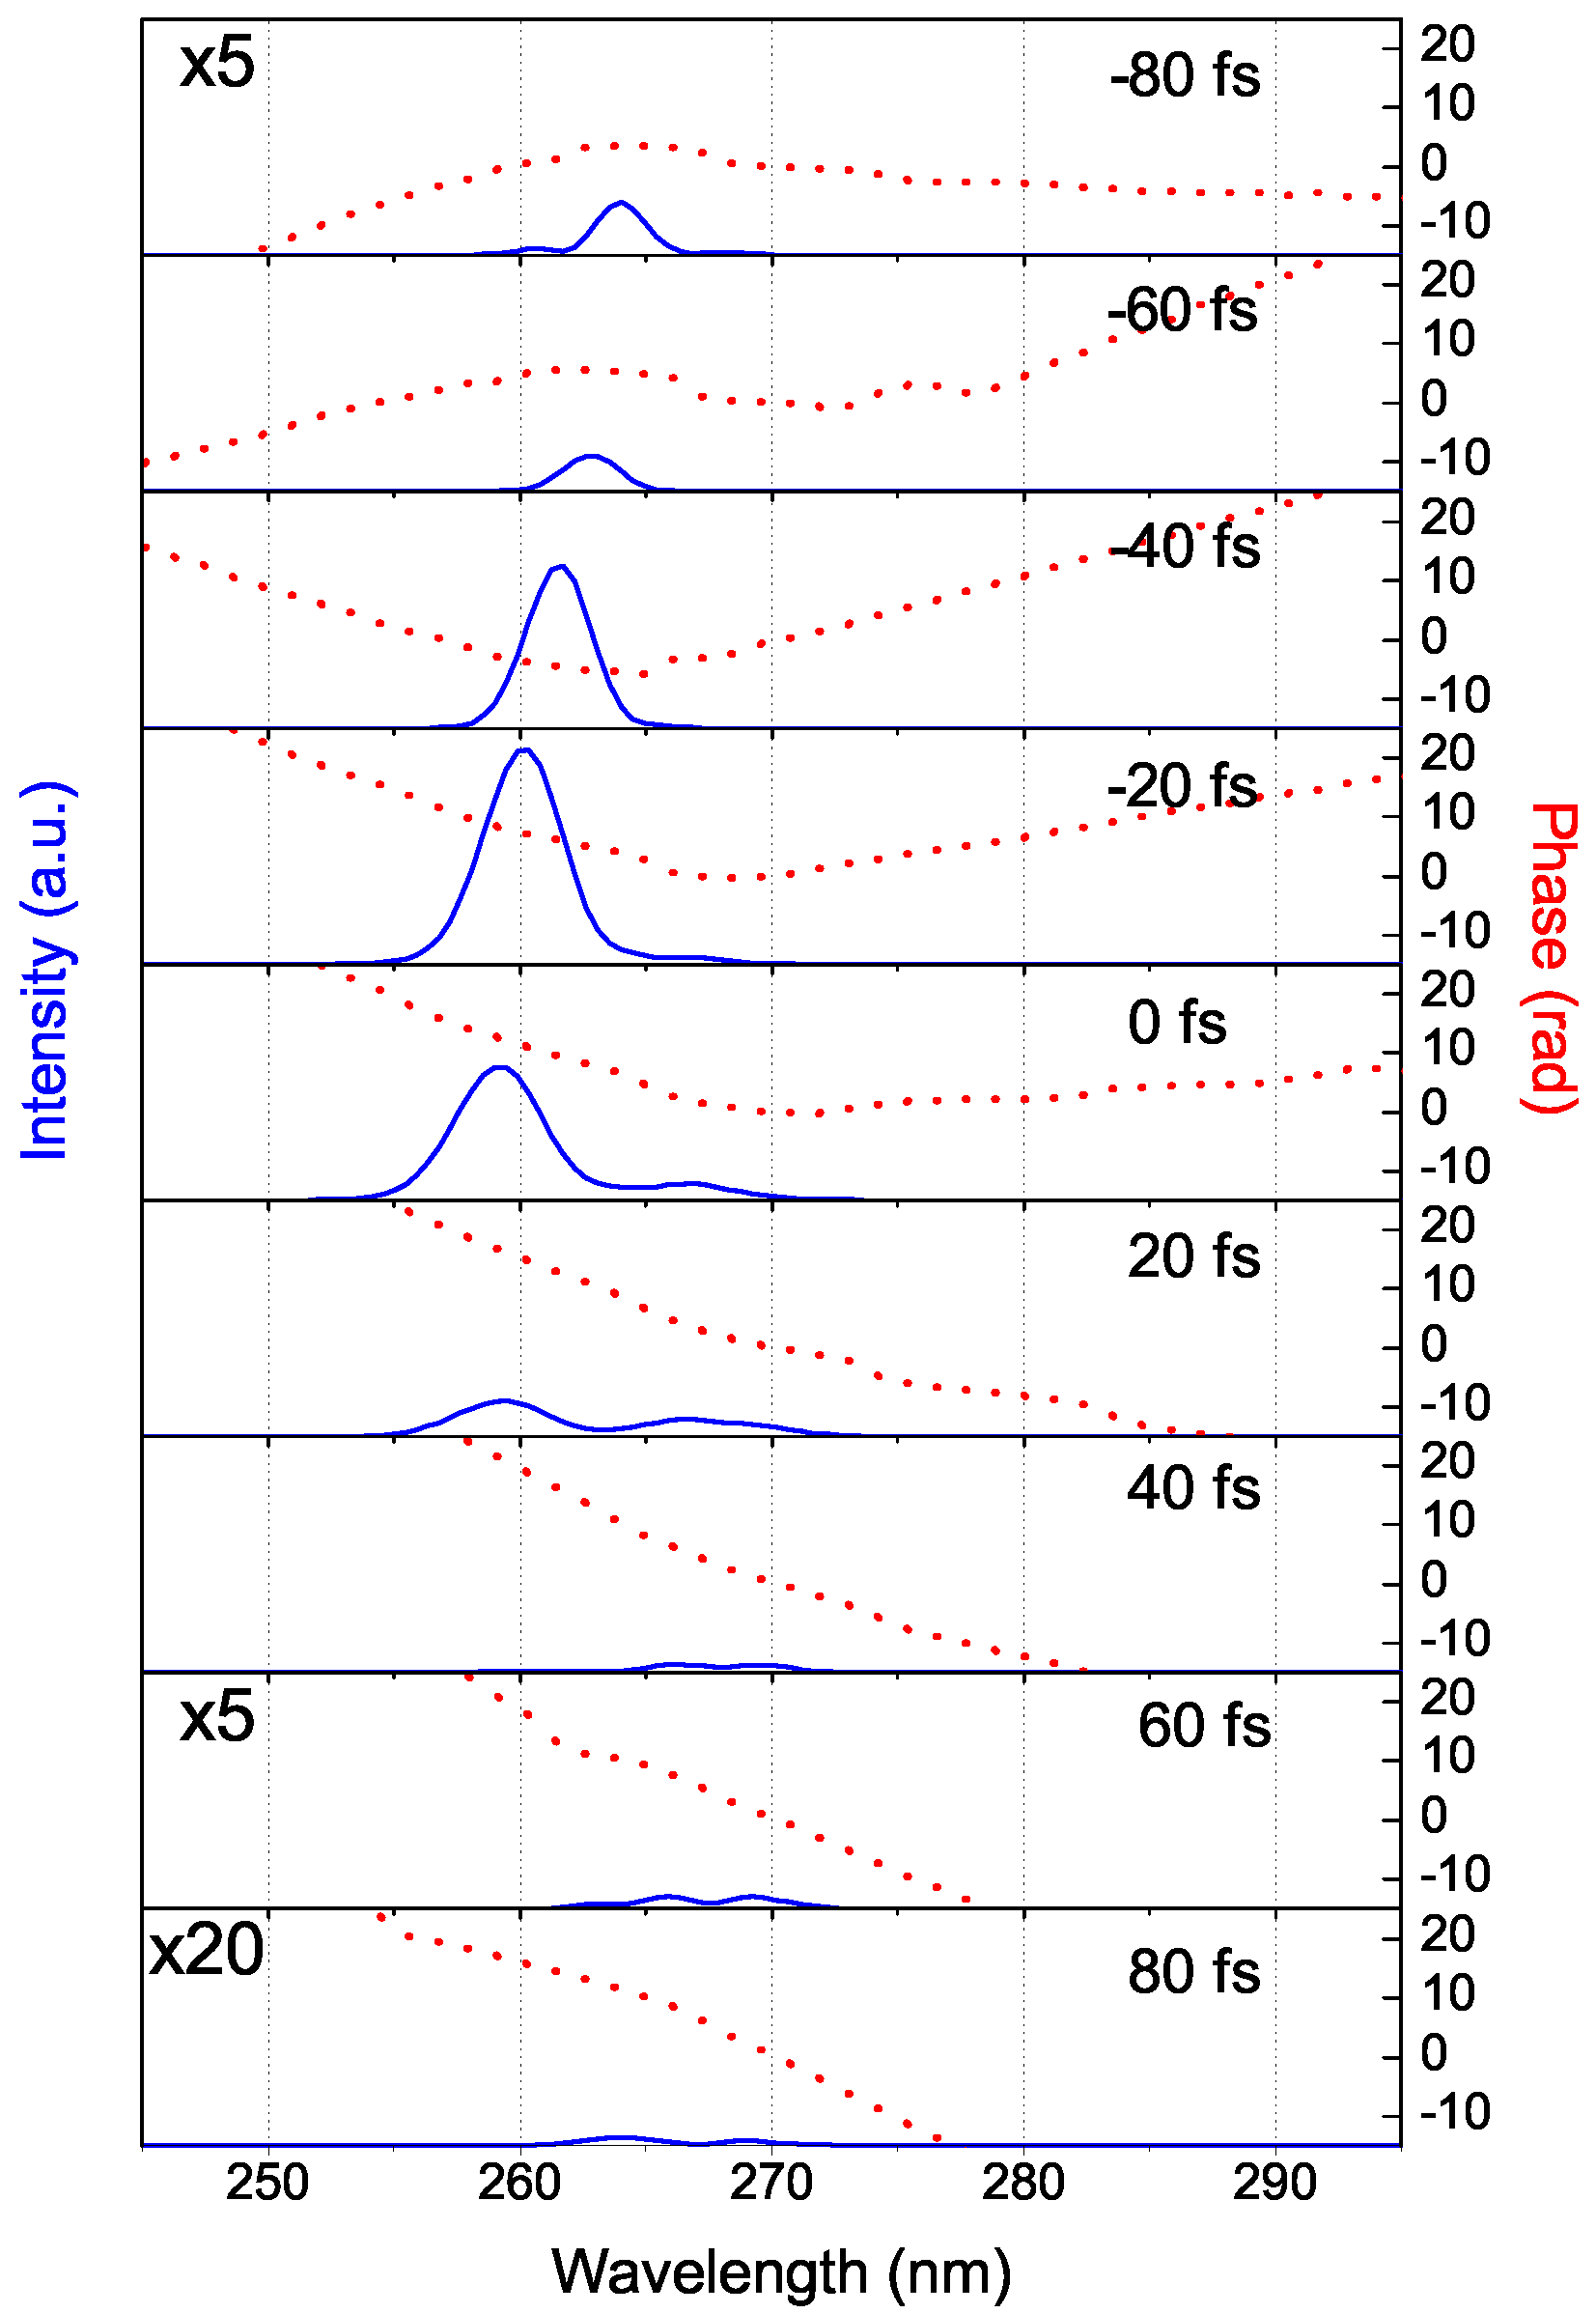
The model described in Section 3 also predicts broadband generation of the third-harmonic of 800 nm at a central wavelength of 266 nm. Using the experimental parameters given in this section and for different internal angles θ = 15.0°, 15.7° (the angle of perfect phase-matching) and 16.4° different broadband spectra were obtained for different delays between pump and signal pulses. In Figure 26 (θ = 15.0°) we can see double band spectral structures which are enhanced in its blue portion for negative delays and in its redder portion for positive delays. The two situations are of course not symmetrical because of the different group velocities of the pulses, where the idler can catch up with the pump in situations of positive delay but will always come before the pump for negative delays. We also see that the different pulses have chirp and the more intense ones, generated at delays of −20 fs, 0 fs and 20 fs, have a clear positive chirp, mainly due to self- and cross-phase modulation. This positive chirp is in agreement with the experimental results of Figure 23, where the retrieved pulse shows also positive chirp. The calculated emission angle for the 266 nm pulse obtained for 0 fs relative delay between pump and idler was 7.3°, with an output energy efficiency of 3.6% with respect to the pump pulse and a pulse width of 19.7 fs (9 fs TL duration), all in reasonable agreement with the experimental results.
Figure 26.
Simulated spectral intensity and phase of the generated DUV signal for θ =15.0° and different delays between idler and pump pulses (The intensities in the first and the last plots have been multiplied by a factor of 5). Negative delay: idler arrives before pump, positive delay: idler arrives after pump [28].
For other interaction angles (θ = 15.7° (Figure 27) and θ = 16.4° (Figure 28)) higher efficiencies are obtained (12.5% and 6.9% respectively) but with narrower bandwidths. The situation with θ = 15.0° seems to better represent the experimental one. We see that the change in interaction angle from 15 to 16.4 ° also produces a significant shift/tuning of the central frequency of the generated DUV pulses. This is due to the large angular sensitivity of the geometric phase matching condition for the highly nondegenerate FWM process involving ω and 2ω beams crossing at a very large angle.
Figure 27.
Simulated spectral intensity and phase of the generated DUV signal for θ = 15.7° and different delays between idler and pump pulses. (negative and positive delays as in Figure 23; note the scale factors for the first and last intensity plots) [28].

Figure 28.
Simulated spectral intensity and phase of the generated DUV signal for θ = 16.4° and different delays between idler and pump pulses. (negative and positive delays as in Figure 23; note the scale factors for the first and last two intensity plots) [28].
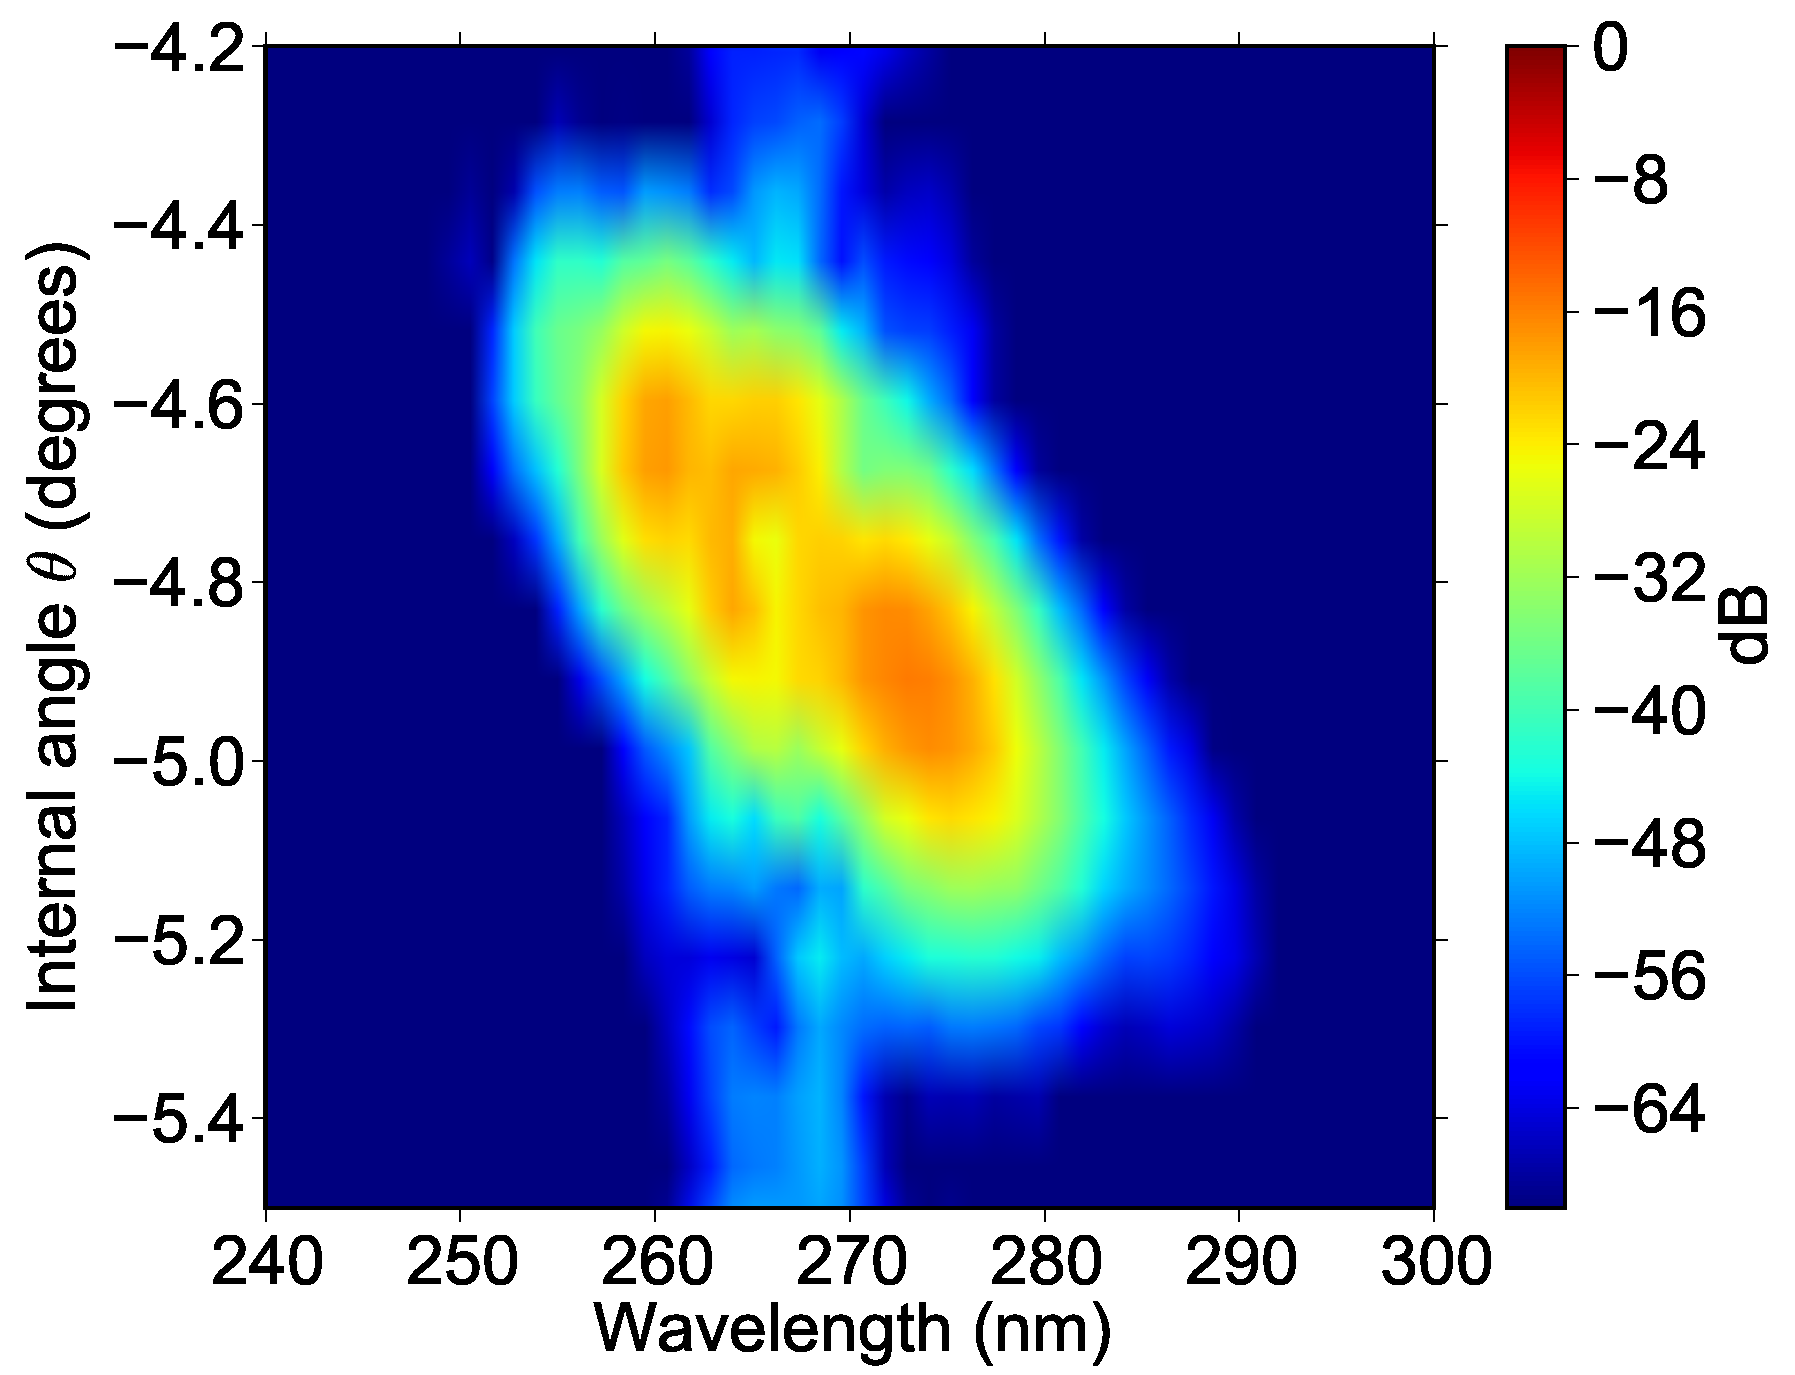
Given the rather large angles used between the interacting beams, the generated pulse has angular chirp. Figure 29 shows the angle at which each frequency is generated for the 0 fs delay of Figure 26. We see that the spectrum spans from 255 nm to 280 nm only within 0.5°, which is small enough for many applications, namely those requiring focused pulses.
Figure 29.
Angular chirp of the generated beam for the case of 0 fs delay in Figure 5. The intensity is given in dB with respect to the maximum intensity of the pump pulses) [28].
Many laboratories nowadays have Titanium:Sapphire amplifiers with pulses longer than those used here. Our model predicts that one can still obtain 42 fs DUV pulses when using 100 fs pump pulses interacting at 15°, with 0 fs relative delay and with the same intensities used in the experiment and the previous simulations, Iω = 2.6 × 10¹² and I2ω = 1.2 × 10¹² W/cm2 respectively. For Iω = 2.0 × 10¹² and I2ω = 2.0 × 10¹² W/cm2 29.5 fs DUV pulses were obtained. These results show that it is possible to obtain sub-30 fs pulses starting from 100 fs pump and idler pulses, which might be of great interest in many labs.
5.3. Generation of Higher-Order Harmonics by CFWM
The generation of even higher-order harmonics via CFWM, by using a fundamental beam at 800 nm at its second harmonic at 400 nm, was suggested and studied numerically shortly after the first experimental demonstration of highly-nondegenerate CFWM by the same authors [25], where the simplified analytical model further developed in [21] was also presented. Unlike usual non-perturbative high-harmonic generation in gases, which involves ionization and recombination of an electron wave-packet in the presence of an intense laser field, the proposal in [25] was based on a simple perturbative model of CFWM. More recently, Bertrand et al. demonstrated that noncollinear high-harmonic generation of fundamental and second-harmonic ultrashort laser pulses can be fully understood in terms of perturbative nonlinear optical wave mixing [36].
6. Conclusions
In this paper we presented an overview of our work in ultrafast highly-nondegenerate cascaded four-wave mixing in bulk media, with emphasis on key experimental results as well as on a detailed theoretical model of the phenomenon that can be solved numerically. We described how to perform an experiment where, thanks to the instantaneous third-order nonlinearity of a thin isotropic transparent medium, two noncollinear femtosecond pump pulses with different colors can give rise to a fan of broadband multicolored beams (both frequency upconverted and downconverted) via cascaded four-wave mixing, with macroscopic efficiencies in the range of 5%–10%. The newly generated beams have broad bandwidths, extending from the infrared to the ultraviolet, with each beam corresponding to a particular order within the cascade. A simple algebraic model based on energy and momentum conservation laws enables calculating the optimum interaction angle for generating a particular order n, as well as estimating the frequencies of the newly generated beams and their corresponding emission angles.
Other important characteristics such as pulse energy, bandwidth, duration or generation efficiency have been calculated and compared with the experimental results by using a unique 2.5-D nonlinear propagation model developed in our group, which takes into consideration the effects of dispersion, diffraction, self-phase modulation and self-steepening in the SVEA approximation. With this model we have been able to faithfully reproduce all the experiments performed so far. We then showed how the fan of beams produced by cascaded four-wave mixing in thin low-dispersion media, which are mutually coherent and can cover two octaves in bandwidth, can be appropriately manipulated in experimental arrangements and thus be used to synthesize extremely short pulses with durations in the single-cycle regime, which was also corroborated by our theoretical model.
A main characteristic of the generated beams is their broadband spectrum, which can result in pulses shorter than the pump beams. This characteristic has been deeply studied for the efficient generation and measurement of broadband pulses in the deep-ultraviolet region by highly nondegenerate four-wave mixing of fundamental and second-harmonic pulses from a Titanium:Sapphire laser amplifier. Our theoretical model also anticipates the generation of multiple broadband pulses extending into the vacuum ultraviolet by cascaded four-wave mixing in fluorides, using a novel multiple pump beam configuration. All these results help to establish the capability and potential of cascaded four-wave mixing for producing new sources consisting of a set of mutually coherent broadband pulses with different colors, whose characteristics are very difficult to obtain otherwise, based on simple nonlinear media, and which can have numerous applications in ultrafast spectroscopy and other fields of science and technology.
Acknowledgments
Helder M. Crespo gratefully acknowledges support from the Portuguese funding agency, Fundação para a Ciência e Tecnologia (FCT), through Project Grant PTDC/FIS/122511/2010 and Sabbatical Leave Grant SFRH/BSAB/105974/2015, co-funded by COMPETE and FEDER. Rosa Weigand acknowledges support from Grant GR3/14-910133 (Ayudas para los grupos de investigación UCM). The authors thank J. L. Silva for helpful comments.
Author Contributions
Helder M. Crespo performed pioneering work on this subject and both authors further developed it. The authors contributed equally to this paper.
Conflicts of Interest
The authors declare no conflict of interest.
References
- Shen, Y.R. The Principles of Nonlinear Optics; John Wiley & Sons: Hoboken, NJ, USA, 2003. [Google Scholar]
- Eichler, H.J.; Günter, P.; Pohl, D.W. Diffraction and Four-Wave Mixing Theory. In Laser-Induced Dynamic Gratings; Tamir, T., Ed.; Springer: Berlin, Germany, 1986; pp. 94–121. [Google Scholar]
- Durfee, C.G.; Backus, S.; Kapteyn, H.C.; Murnane, M.M. Intense 8-fs pulse generation in the deep ultraviolet. Opt. Lett. 1999, 24, 697–699. [Google Scholar] [CrossRef] [PubMed]
- Penzkofer, A.; Lehmeir, H.J. Theoretical investigation of noncollinear phase-matched parametric four-photon amplification of ultrashort light pulses in isotropic media. Opt. Quantum. Electron. 1993, 25, 815–844. [Google Scholar] [CrossRef]
- Akmahnov, S.A.; Martynov, V.A.; Saltiel, S.M.; Tunkin, V.G. Observation of nonresonant six-photon processes in a calcite crystal. JETP Lett. 1975, 22, 65–67. [Google Scholar]
- Lichtman, E.; Friesem, A.A.; Waarts, R.G.; Yaffe, H.H. Exact solution of four-wave mixing of copropagating light beams in a Kerr medium. J. Opt. Soc. Am. B 1987, 4, 1801–1805. [Google Scholar] [CrossRef]
- Hart, D.L.; Judy, A.; Brian Kennedy, T.A.; Roy, R.; Stoev, K. Conservation law for multiple four-wave-mixing processes in a nonlinear optical medium. Phys. Rev. A 1994, 50, 1807–1813. [Google Scholar] [CrossRef] [PubMed]
- Hart, D.L.; Judy, A.F.; Roy, R.; Beletic, J.W. Dynamical evolution of multiple four-wave-mixing processes in an optical fiber. Phys. Rev. E 1998, 57, 4757–4774. [Google Scholar] [CrossRef]
- Tan, H.; Banfi, G.P.; Tomaselli, A. Optical frequency mixing through cascaded second-order processes in β-barium borate. Appl. Phys. Lett. 1993, 63, 2472–2474. [Google Scholar] [CrossRef]
- Varanavicius, A.; Dubietis, A.; Berzanskis, A.; Danielius, R.; Piskarskas, A. Near-degenerate cascaded four-wave mixing in an optical parametric amplifier. Opt. Lett. 1997, 22, 1603–1605. [Google Scholar] [CrossRef]
- Crespo, H.; Mendonça, J.T.; Dos Santos, A. Cascaded highly nondegenerate four-wave-mixing phenomenon in transparent isotropic condensed media. Opt. Lett. 2000, 25, 829–831. [Google Scholar] [CrossRef] [PubMed]
- Chin, A.H.; Calderón, O.G.; Kono, J. Extreme Midinfrared Nonlinear Optics in Semiconductor. Phys. Rev. Lett. 2001, 86, 3292–3295. [Google Scholar] [CrossRef] [PubMed]
- Misoguti, L.; Backus, S.; Durfee, C.G.; Bartels, R.; Murnane, M.M.; Kapteyn, H.C. Generation of broadband VUV light using cascaded processes. Phys. Rev. Lett. 2001, 87, 013601. [Google Scholar] [CrossRef] [PubMed]
- Lu, C.; Yang, L.; Zhi, M.; Sokolov, A.; Yang, S.; Hsu, C.; Kung, A. Generation of octave-spanning supercontinuum by Raman-assisted four-wave mixing in single-crystal diamond. Opt. Express 2014, 22, 4075–4082. [Google Scholar] [CrossRef] [PubMed]
- Liu, J.; Kobayashi, T. Cascaded four-wave mixing and multicolored arrays generation in a sapphire plate by using two crossing beams of femtosecond laser. Opt. Express 2008, 16, 22119–22125. [Google Scholar] [CrossRef] [PubMed]
- Liu, W.; Zhu, L.; Wang, L.; Fang, C. Cascaded four-wave mixing for broadband tunable laser sideband generation. Opt. Lett. 2013, 38, 1772–1774. [Google Scholar] [CrossRef] [PubMed]
- Liu, J.; Kobayashi, T. Wavelength-tunable, multicolored femtosecond-laser pulse generation in fused-silica glass. Opt. Lett. 2009, 34, 1066–1068. [Google Scholar] [CrossRef] [PubMed]
- Zhang, X.; Giessen, H. Four-wave mixing based on cascaded second-order nonlinear processes in a femtosecond optical parametric oscillator operating near degeneracy. Appl. Phys. B 2004, 79, 441–447. [Google Scholar] [CrossRef]
- Li, Y.H.; Zhao, Y.Y.; Wang, L.J. Demonstration of almost octave-spanning cascaded four-wave mixing in optical microfibers. Opt. Lett. 2012, 37, 3441–3443. [Google Scholar] [CrossRef] [PubMed]
- Zhang, H.; Zhou, Z.; Lin, A.; Cheng, J.; Liu, H.; Si, J.; Chen, F.; Hou, X. Controllable cascaded four-wave mixing by two chirped femtosecond laser pulses. Appl. Phys. B 2012, 108, 487–491. [Google Scholar] [CrossRef]
- Weigand, R.; Mendonça, J.T.; Crespo, H.M. Cascaded nondegenerate four-wave-mixing technique for high-power single-cycle pulse synthesis in the visible and ultraviolet ranges. Phys. Rev. A 2009, 79, 063838. [Google Scholar] [CrossRef]
- Silva, J.L.; Weigand, R.; Crespo, H.M. Octave-spanning spectra and pulse synthesis by nondegenerate cascaded four-wave mixing. Opt. Lett. 2009, 34, 2489–2491. [Google Scholar] [CrossRef] [PubMed]
- Nisoli, M.; De Silvestri, S.; Svelto, O.; Szipöcs, R.; Ferencz, K.; Spielmann, Ch.; Sartania, S.; Krausz, F. Compression of high-energy laser pulses below 5 fs. Opt. Lett. 1997, 22, 522–524. [Google Scholar] [CrossRef] [PubMed]
- Harris, S.E.; Sokolov, A.V. Subfemtosecond Pulse Generation by Molecular Modulation. Phys. Rev. Lett. 1998, 81, 2894–2897. [Google Scholar] [CrossRef]
- Mendonça, J.T.; Crespo, H.; Guerreiro, A. A new method for high-harmonic generation by cascaded four-wave mixing. Opt. Commun. 2001, 188, 383–388. [Google Scholar] [CrossRef]
- Kobayashi, T.; Liu, J.; Okamura, K. Applications of parametric processes to high-quality multicolour ultrashort pulses, pulse cleaning and CEP stable sub-3fs pulse. J. Phys. B 2012, 45, 074005. [Google Scholar] [CrossRef]
- Silva, J.L.; Crespo, H.M.; Weigand, R. Generation of high-energy vacuum UV femtosecond pulses by multiple-beam cascaded four-wave mixing in a transparent solid. Appl. Opt. 2011, 50, 1968–1973. [Google Scholar] [CrossRef] [PubMed]
- Weigand, R.; Crespo, H.M. Generation of high-energy broadband femtosecond deep-ultraviolet pulses by highly nondegenerate noncollinear four-wave mixing in a thin transparent solid. Appl. Phys. B 2013, 111, 559–565. [Google Scholar] [CrossRef]
- Jailaubekov, E.A.; Bradforth, E.S. Tunable 30-femtosecond pulses across the deep ultraviolet. Appl. Phys. Lett. 2005, 87, 021107. [Google Scholar] [CrossRef]
- Fuji, T.; Horio, T.; Suzuki, T. Generation of 12fs deep-ultraviolet pulses by four-wave mixing through filamentation in neon gas. Opt. Lett. 2007, 32, 2481–2483. [Google Scholar] [CrossRef] [PubMed]
- Fuji, T.; Suzuki, T.; Serebryannikov, E.E.; Zheltikov, A. Experimental and theoretical investigation of a multicolor filament. Phys. Rev. A 2009, 80, 063822. [Google Scholar] [CrossRef]
- Kida, Y.J.; Liu, J.; Teramoto, T.; Kobayashi, T. Sub-10 fs deep-ultraviolet pulses generated by chirped-pulse four-wave mixing. Opt. Lett. 2010, 35, 1807–1809. [Google Scholar] [CrossRef] [PubMed]
- Backus, S.; Peatross, J.; Zeek, Z.; Rundquist, A.; Taft, G.; Murnane, M.M.; Kapteyn, H.C. 16-fs, 1-μJ ultraviolet pulses generated by third-harmonic conversion in air. Opt. Lett. 1996, 21, 665–667. [Google Scholar] [CrossRef] [PubMed]
- Graf, U.; Fiess, M.; Schultze, M.; Kienberger, R.; Krausz, F.; Goulielmakis, E. Intense few-cycle light pulses in the deep ultraviolet. Opt. Express 2008, 16, 18956–18963. [Google Scholar] [CrossRef] [PubMed]
- Reiter, F.; Graf, U.; Schultze, M.; Schweinberger, W.; Schröder, H.; Karpowicz, N.; Azzeer, A.; Kienberger, R.; Krausz, F.; Goulielmakis, E. Generation of sub-3 fs pulses in the deep ultraviolet. Opt. Lett. 2010, 35, 2248–2250. [Google Scholar] [CrossRef] [PubMed]
- Bertrand, J.B.; Wörner, H.J.; Bandulet, H.C.; Bisson, É.; Spanner, M.; Kieffer, J.C.; Villeneuve, D.M.; Corkum, P.B. Ultrahigh-Order Wave Mixing in Noncollinear High Harmonic Generation. Phys. Rev. Lett. 2011, 106, 023001. [Google Scholar] [CrossRef] [PubMed]
© 2015 by the authors; licensee MDPI, Basel, Switzerland. This article is an open access article distributed under the terms and conditions of the Creative Commons Attribution license (http://creativecommons.org/licenses/by/4.0/).
Share and Cite
MDPI and ACS Style
Weigand, R.; Crespo, H.M. Fundamentals of Highly Non-Degenerate Cascaded Four-Wave Mixing. Appl. Sci. 2015, 5, 485-515. https://doi.org/10.3390/app5030485
AMA Style
Weigand R, Crespo HM. Fundamentals of Highly Non-Degenerate Cascaded Four-Wave Mixing. Applied Sciences. 2015; 5(3):485-515. https://doi.org/10.3390/app5030485
Chicago/Turabian StyleWeigand, Rosa, and Helder M. Crespo. 2015. "Fundamentals of Highly Non-Degenerate Cascaded Four-Wave Mixing" Applied Sciences 5, no. 3: 485-515. https://doi.org/10.3390/app5030485