
Linear Dynamic Analysis of Free-Piston Stirling Engines on Operable Charge Pressure and Working Frequency along with Experimental Verifications


Department of Mechanical System Design Engineering, Seoul National University of Science and Technology, Seoul 01811, Korea
*
Author to whom correspondence should be addressed.
Appl. Sci. 2021, 11(11), 5205; https://doi.org/10.3390/app11115205
Submission received: 1 April 2021
/
Revised: 1 June 2021
/
Accepted: 2 June 2021
/
Published: 3 June 2021
(This article belongs to the Section Mechanical Engineering)
Abstract
:This paper presents a linear dynamic analysis on operable charge pressure and working frequency of free-piston Stirling engines (FPSE) along with experimental verifications. The equations of motion of the FPSE are formulated as a 2-degree-of-freedom (DOF) vibration system of the power piston (PP) and displacer piston (DP), based on the state equation of ideal gas and the isothermal Stirling cycle model. The dynamic models of FPSE we considered are the 1-DOF simple vibration model of each piston and the 2-DOF root locus model of coupled pistons. We developed a test FPSE for verification of the dynamic models and conducted a series of experiments to measure the dynamic behaviors of PP and DP under varying charge pressures for various masses and stiffnesses of the PP. As a result, both prediction models showed good agreements with experimental results. The 1-DOF vibration model was found to be simple and effective for predicting the operating frequency and charge pressure of FPSE. The root locus method showed reasonable predictions with an operation criterion of the PP–DP phase angle of 90°. In addition, the FPSE was confirmed to operate in resonant oscillations when the DP–PP phase angle is 90°, based on analysis of the force vector diagram of the two pistons.
1. Introduction
Since modern society is mostly based on fossil fuel energy, the depletion of fossil fuels and persistent environmental pollution pose a global problem. There is an increasing demand for the development of new and renewable energy and improving energy utilization efficiency for the use of fossil fuels. Researchers have been actively conducting research to increase energy utilization efficiency through the collection of waste heat energy. In particular, Stirling engines are drawing attention as a device that generates electricity using pure thermal energy [1].
The Stirling engine is a heat engine based on the Stirling cycle, which converts thermal energy into mechanical power by compressing and expanding the enclosed working gas through the reciprocating motions of two pistons at different hot and cold temperatures. The idealized Stirling cycle consists of four thermodynamic processes acting on the working fluid: (1) isothermal expansion, (2) isochoric cooling, (3) isothermal compression, and (4) isochoric heating [2]. Stirling engines are known to have low noise and vibration because they do not involve an explosion stroke. Further, they can utilize, not only existing fossil fuels and waste heats, but also renewable heat energies, such as solar heat, biomass, etc. In particular, the Stirling engine-based micro-CHP system has been successfully utilized as a residential and commercial power generation system and is being evaluated as a powerful alternative energy technology [3,4,5].
Structurally, conventional Stirling engines have a mechanical link consisting of a connecting rod, a crankshaft, and a flywheel. In such a kinematic engine, this link mechanically connects the two pistons and precisely adjusts the amplitude and phase angle. Not only are the mechanical links large and heavy, but the side loads on the cylinders cause mechanical friction [6]. To overcome these shortcomings, a free piston Stirling engine (FPSE) has been proposed [7]. In FPSEs, each piston is connected to a spring element instead of a mechanical link structure. Therefore, it has the advantages of having a compact structure, high durability, and high power density [8].
However, since FPSE forms a vibrating system due to spring elements, its dynamic behaviors, such as operating frequency, piston amplitude, and phase angle, change with the operating conditions. In addition, FPSE has the characteristics of operating in resonant conditions, so its operating range is narrow and its sensitivity to operating conditions is high [9]. Therefore, it is important to determine the operating conditions of the engine temperature, charge pressure, and external loads, and to predict the dynamic behavior of the engine under given operating conditions.
Recently, FPSEs have been developed with increasing working pressure and operating frequency to achieve higher power density [10]. The working pressure acts as a gas spring and connects the two pistons, which greatly affects the operability and performance of the FPSE. In general, FPSEs have an operable charge pressure range and cannot operate beyond this range. Therefore, the prediction and control of a FPSE’s dynamic behavior is an important issue in optimizing operation and performance.
Urieli and Berchowitz [11] developed a linear dynamics model that predicts the operating frequency, phase angle, and amplitude ratio of an engine using an isothermal model and pressure linearization. They compared the model with the experimental results for RE-1000 [12] and reported prediction errors of approximately 10–40%. This model is considered as a representative linear dynamic model of FPSEs.
Redlich [13] conducted root locus analysis with a linear dynamics model focusing on the issues of engine stability and operability of FPSEs. Redlich proposed that when the real part of the root is greater than zero in the root locus, the engine starts to operate; in addition, the higher values of the real part yield more power output. This model offers a simple method for preliminary engine design; however, the suggestion was not validated by experiments.
Hofarker et al. [14] developed a linear dynamic model considering actual limited heat transfer rate of FPSEs, instead of using the isothermal model, which assumes an infinite heat transfer rate, and compared the two models through experiments. The experimental parameters were changed by an external linear motor attached to the PP via transmitting forces through impedance control. Both linear dynamic models accurately predicted the frequency of the engine within an error of 3%.
Mou et al. [15] presented a linear dynamic model to predict the frequency and phase angle of FPSEs depending on charge pressure and spring stiffness, along with experimental verifications. They found that charge pressure had a significant effect on frequency and phase angle. In particular, working frequencies are more sensitive to DP spring stiffness than PP spring stiffness.
Recently, studies on the dynamic analysis of free-piston Stirling engines have mainly focused on nonlinear analysis models to which various theories, such as artificial neural network and genetic algorithm, are applied based on the same vibration equation [16,17,18].
In this paper, we developed a test FPSE and compared the experimental results with linear dynamic model predictions, aiming to provide a simple and direct analysis of the dynamic behavior of FPSE and specifically focus on the operable conditions of the charge pressure and the resonance phenomenon of the piston motion. The dynamic model of the FPSE we considered is (1) a 1-degree-of-freedom (DOF) simple vibration model for each piston and (2) a 2-DOF root trajectory model of two combined pistons.
2. Dynamic Model of FPSE
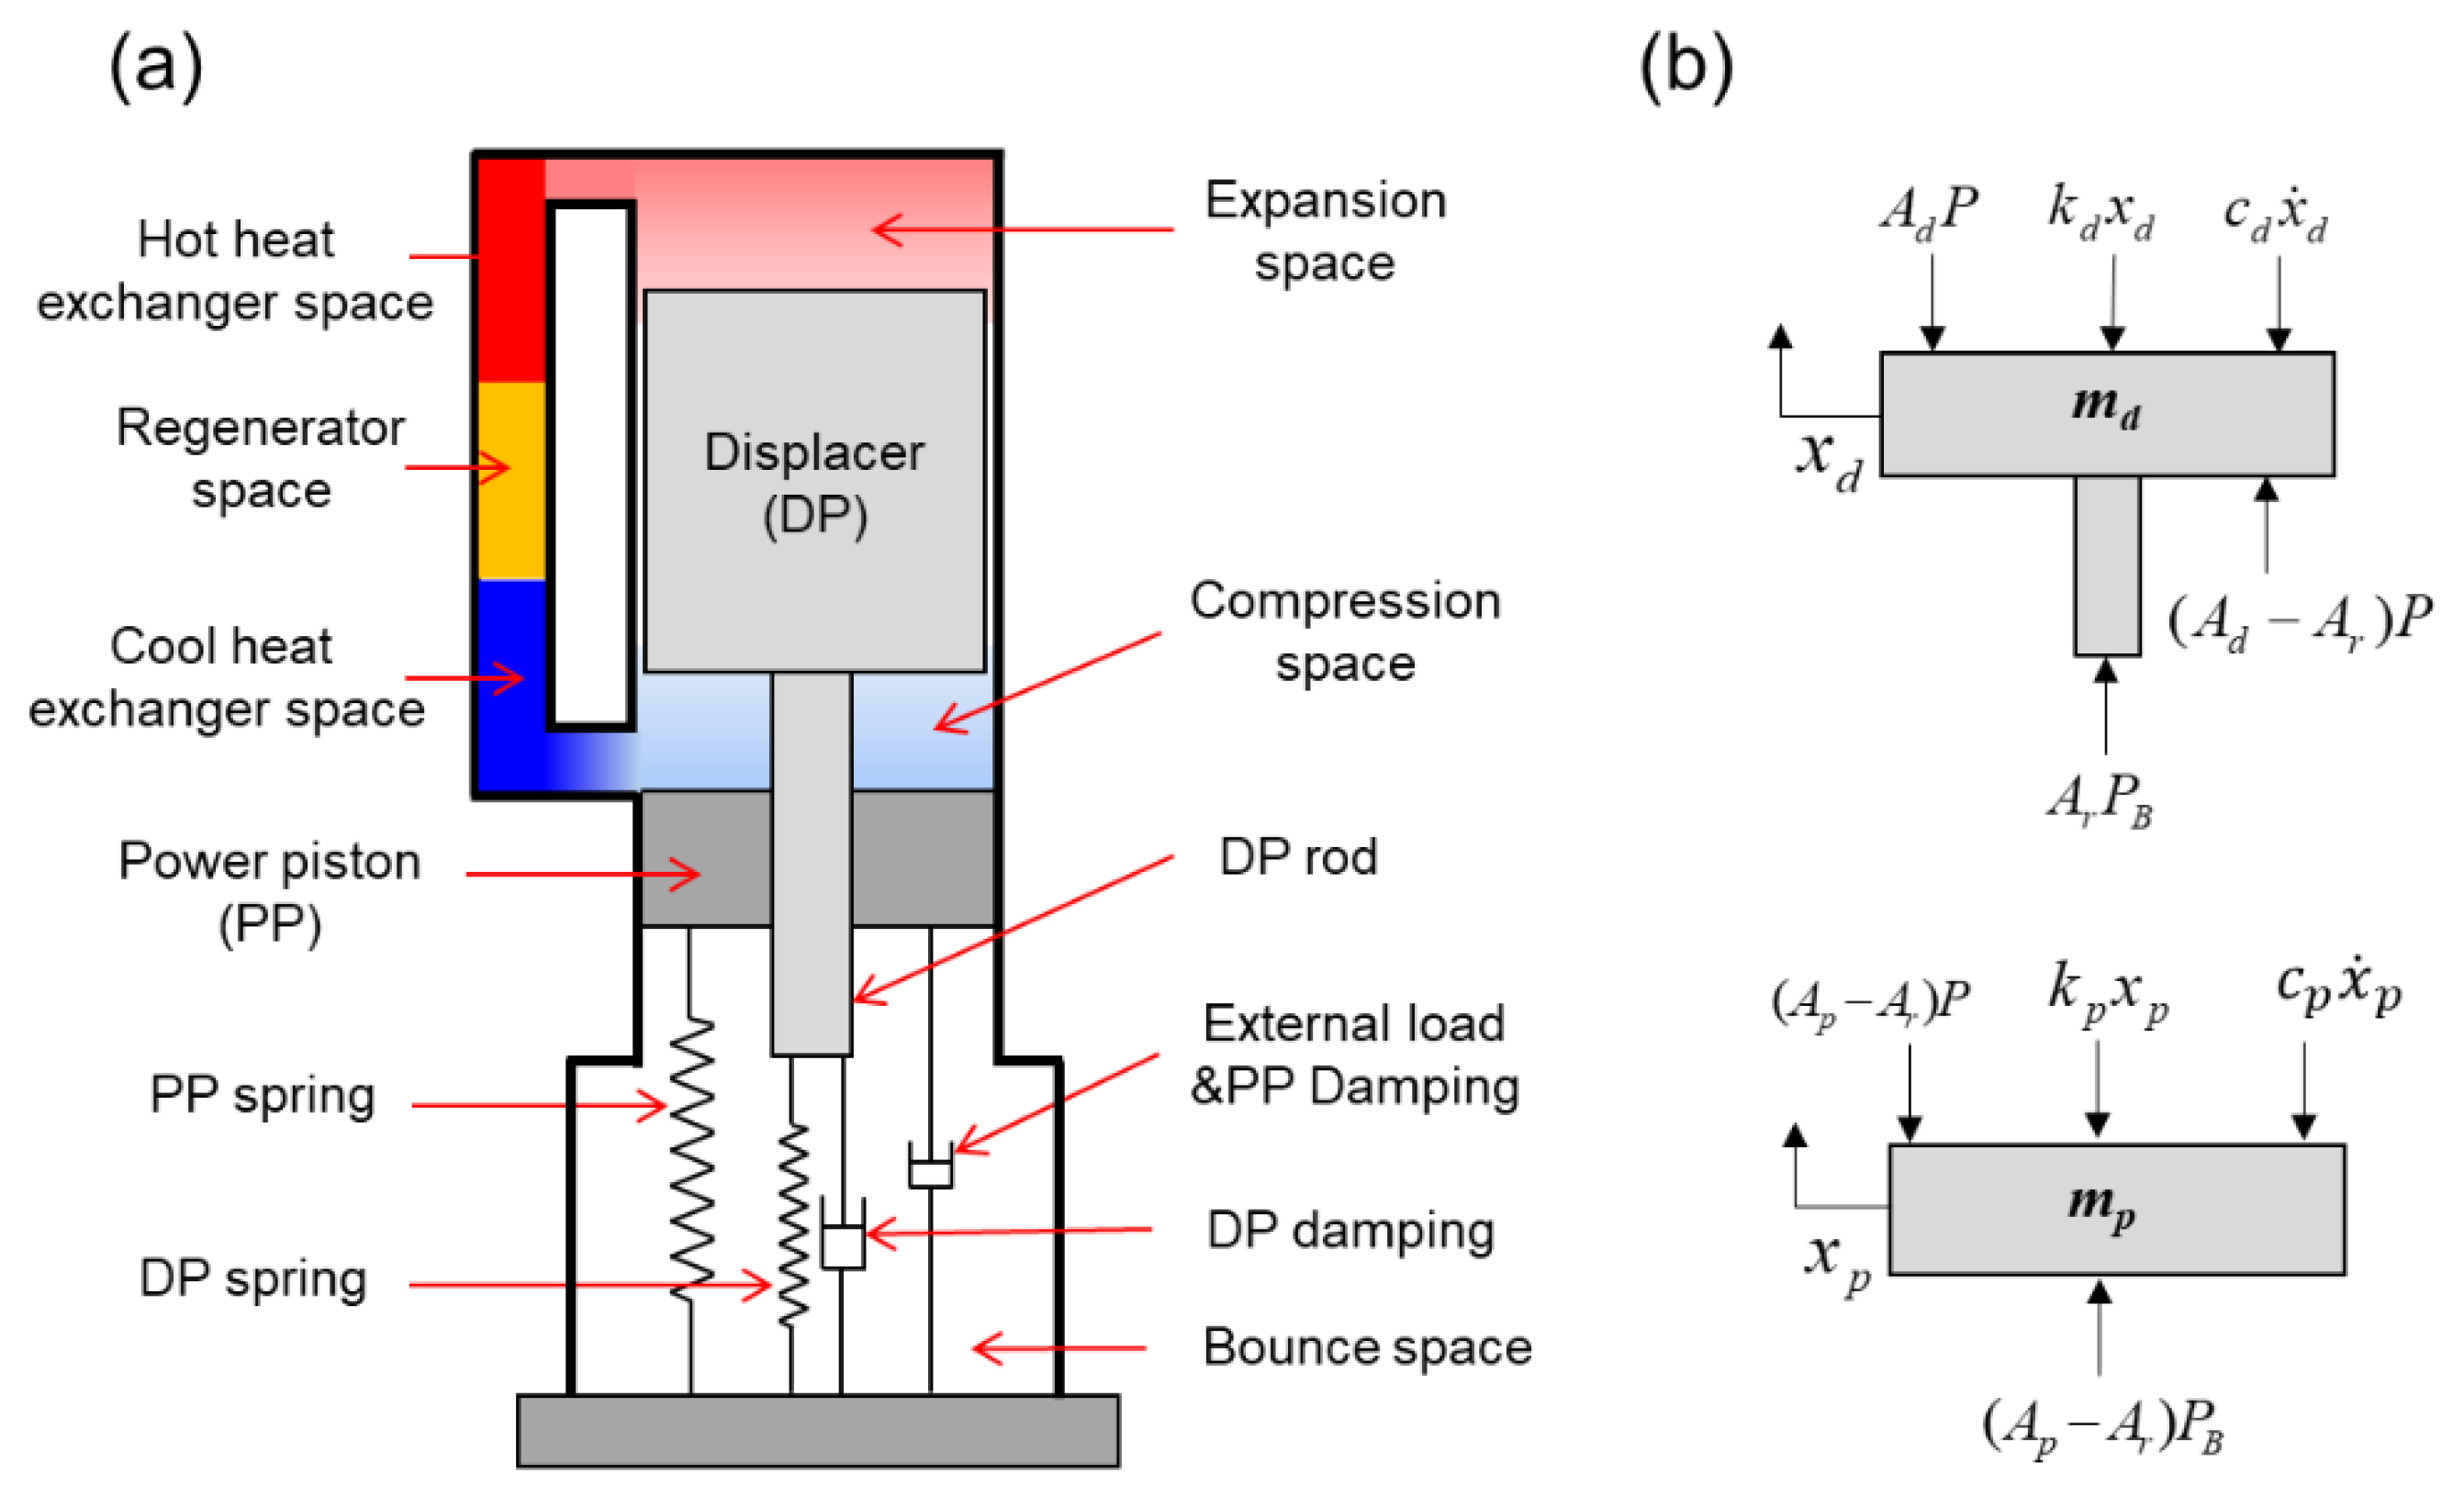
Figure 1 presents a conceptual diagram of a beta-type FPSE with an external load: (a) schematic layout of the engine and (b) free-body diagram of the pistons. The displacer piston (DP) and power piston (PP) are located on the same axis in one cylinder, and assembled, respectively, with a spring element—normally in the form of metal flexure spring. The heater and cooler supply and remove heat through their respective heat exchangers. The regenerator is positioned in between to improve thermal efficiency by preheating and precooling the working gas.
The DP divides the working space into expansion and compression spaces. The DP motion circulates the working gas through heat exchangers, yielding the thermodynamic heating and cooling processes. The PP divides the total sealed space into the working space and bounce space. The PP motion produces power output of an external load device via the thermodynamic expansion and compression processes.
The FPSE has two vibration systems of PP and DP. The two piston motions are coupled by the internal pressure, forming a two-DOF vibration system. Equations of motion (EOMs) are established from the free body diagram of the two pistons considering the internal pressure, spring force, and damping force, as shown in Figure 1b, and are given as follows:
where m, c, and k denote the piston mass, damping coefficient, and stiffness coefficient, respectively, and the subscripts p, d, and r denote the PP, DP, and DP rod, respectively. The mechanical friction damping coefficients are expressed as cp and cd, respectively. P and PB are the instantaneous pressure values in the working space and the bounce space, respectively. The working space is assumed to have a uniform pressure [19].
The heat exchangers and regenerator have a flow friction force acting on the DP motion directly, while the external loads have a resistance force acting on the PP motion. In this study, only major direct damping is considered, such as gas flow friction damping of the heat exchangers acting on the DP and the external load damping acting on the PP. The minor friction damping caused by flow resistance at a narrow gap between the piston and cylinder is ignored [20].
The EOMs show that the FPSE is a forced response system in which the internal pressure acts as an excitation force. To solve the EOMs, the pressure terms are defined as a function of piston displacements using the state equation of ideal gas. The pressure and temperature in each working space are determined based on the ideal isothermal model [21], where the heat exchangers and regenerator are assumed to be perfectly effective and the temperatures are constant in each space. In addition, the engine working space is separated from the bounce space without leakage of the working gas [21]. The following formulation of equations for the pressure definition and linearization is based on Reference [11].
The ideal gas equation associates the working pressure with the volume changes in each working space, as follows:
where T and V are the temperature and the volume of the working spaces, respectively. The subscripts H, K, E, C, and R denote the spaces of the hot heat exchanger, cold heat exchanger, expansion, compression, and regenerator, respectively. Further, mgas and Rgas are the mass and gas constant of the working gas, respectively.
From the isothermal model assumption, the hot and cold heat exchanger temperatures of TH and TK are equal to the expansion and compression space temperatures of TE and TC, respectively. The regenerator space temperature is assumed the logarithmic mean of TH and TK, given as TR = TH-TK/ln(TH/TK).
On the other hand, the bounce space pressure is defined considering the gas spring effect:
where Pc is the charge pressure of the engine, and γ is the specific heat ratio of the working gas.
The expansion, compression, and bounce space volumes are geometrically related with the PP and DP displacements. The expansion space is only a function of DP, while the compression space is related to both PP and DP. The bounce space volume is assumed to be only affected by the PP motion because the DP rod area is very small. The relations are given as follows:
where A is the cross-sectional area, and the subscript 0 denotes the static equilibrium state.
P and PB are the nonlinear functions of piston displacements when Equation (4) is inserted into Equations (2) and (3). The pressures are linearized using the binomial expansion, as follows:
where
Finally, the linearized equations of motion are formulated by combining Equations (1), (5), and (6) and given as follows:
where
Consequently, the EOMs change from a forced vibration system to a free vibration system owing to the elimination of the nonlinearity in the pressure terms, implying that the working frequency is the same as the system natural frequency.
In addition, the system stiffness matrix includes the effects of pressure variations, known as gas spring effect, as well as the metal spring element. The pressure-related stiffness changes depending on the values of charge pressure and operating temperatures. This implies that the system natural frequency, and thus the operating frequency as well, change under varying charge pressures and temperatures.
On the other hand, the system damping matrix is shown to be constant under varying pressure and temperature conditions. Note that this model does not consider changes in the damping coefficient due to thermodynamic properties of working gas itself.
2.1. Simple Vibration Model
This paper presents two analysis models using the linearized EOMs in Equation (7). First, a simple vibration analysis is presented based on the fact that the FPSE operates under resonant vibrations of two pistons [13].
The FPSE is a 2-DOF vibration system of the PP and DP, and each DOF has its own natural frequency. Based on the mechanical vibration theory, when the natural frequencies of each DOF coincide under a certain condition, the 2-DOF system operates at a common frequency.
The damped natural frequencies (DNFs) of each piston, considering the effect of pressure stiffness, are defined as follows:
where ωpp and ωdd are the natural frequencies of PP and DP, respectively. ωpp,d and ωdd,d are the damped natural frequencies, and ζpp and ζdd are the damping ratios.
The simple vibration analysis method predicts the operating pressure and frequency as follows: (1) the DNFs of the two pistons are drawn over charge pressures, and (2) when the two DNFs become equal, the engine operates at the frequency of the DNF and corresponding charge pressure. This model requires only the direct terms of the linearized EOMs, neglecting the cross-coupling terms, and thus is simple and direct in predictions and interpretations of the dynamic behavior.
2.2. Root Locus Model
Secondly, a root locus analysis model is considered, which solves the linearized EOMs as an eigenvalue problem. The root locus analysis is a well-known graphical method in control and stability theory for examining how the roots of a system change with the variation of a certain system parameter [6,22]. The roots are calculated by solving a fourth-order characteristic equation obtained from Equation (7) in the state space, given as:
where z1–4 are the state variables, defined as z1 = xp, z2 = xd, z3 = , and z4 =.
The real part of the root indicates whether the vibration responses are diverging or converging, while the imaginary part corresponds to the operating frequency. The divergence of piston motion implies an engine operation forming a limit cycle and producing a power output [23]. The root locus analysis considers all terms of the linearized EOMs including the cross-coupling terms. Therefore, this method is rather complex and requires more theoretical and mathematical backgrounds compared to the simple vibration model above.
3. Development of Test FPSE and Experimental Setup
Figure 2 shows the test FPSE, designed and developed by the institute, and its test rig: (a) cross-sectional drawing of the test FPSE with sensors, (b) manufactured FPSE inside casing, and (c) the test rig with an electric heater and an external electric load. Table 1 lists the dimensions and specifications of the test FPSE.
Moving parts: The PP and DP are manufactured to have masses of 3.6 kg and 1.64 kg, respectively, with an identical diameter of 84 mm. The DP is connected to the DP spring across the PP with the DP rod. The PP is directly connected to the PP spring. Designed piston amplitudes are 12 mm. The PP and DP have gap clearances of 50 μm and 150 μm with cylinders, respectively. The clearance is set larger for DP than for PP considering thermal expansion at high temperatures. For parameter-varying experiments, the PP can have additional masses attached to the bottom. The DP and PP spring parts have a form of stack with multiple springs for stiffness variation. Each spring has a planar shape with multiple spirals and a stiffness of 42 kN/m. Both the PP and DP spring assemblies have a reference stiffness of 84 kN/m.
Stationary parts: The heat exchangers and regenerator, which has an annular shape, are located between the casing and DP liner. The hot and cold heat exchangers are “fin” types, with identical dimensions. The regenerator is made of a laminated screen wire mesh with a wire diameter of 120 μm and porosity of 87%. The bounce space volume is set to be large enough to neglect the gas spring effect. The linear alternator of a single-phase permanent magnet type has a stator composed of inner and outer cores and a winding coil, along with a mover for the permanent magnets on the PP.
Test rig: A cartridge electric heater heats the upper engine head around the hot heat exchanger, while a cooling water jacket cools the lower engine head around the cold heat exchanger. An electric circuit with load resistances is formed outside the engine and connected to the linear alternator. The electric loads are applied to the engine by changing the load resistance of the external circuit, and also acts as an actuator during engine start using an AC power supply.
A high-pressure compressor charges the engine casing with a working gas, which, in this study, is air. Five thermocouples measure the temperatures of the heater, expansion and compression spaces, and the inlet and outlet of cooling water. Two pressure sensors measure the pressures in the compression space and bounce space. Two accelerometers are used for measurement of piston displacements by converting acceleration via a transmitter. A flow meter measures the cooling flow rate.
Experiments on dynamic behavior measurements were designed with experiment parameters of PP mass and PP spring stiffness were based on the factorial design. Each experiment parameter has three levels with ±10% for mass and ±50% for stiffness, and a total of five cases. Table 2 lists all the experimental cases with the reference of case 3 having a mass of 3.6 kg and stiffness of 84 kN/m.
4. Parameter Identification
4.1. Flexure Spring Stiffness
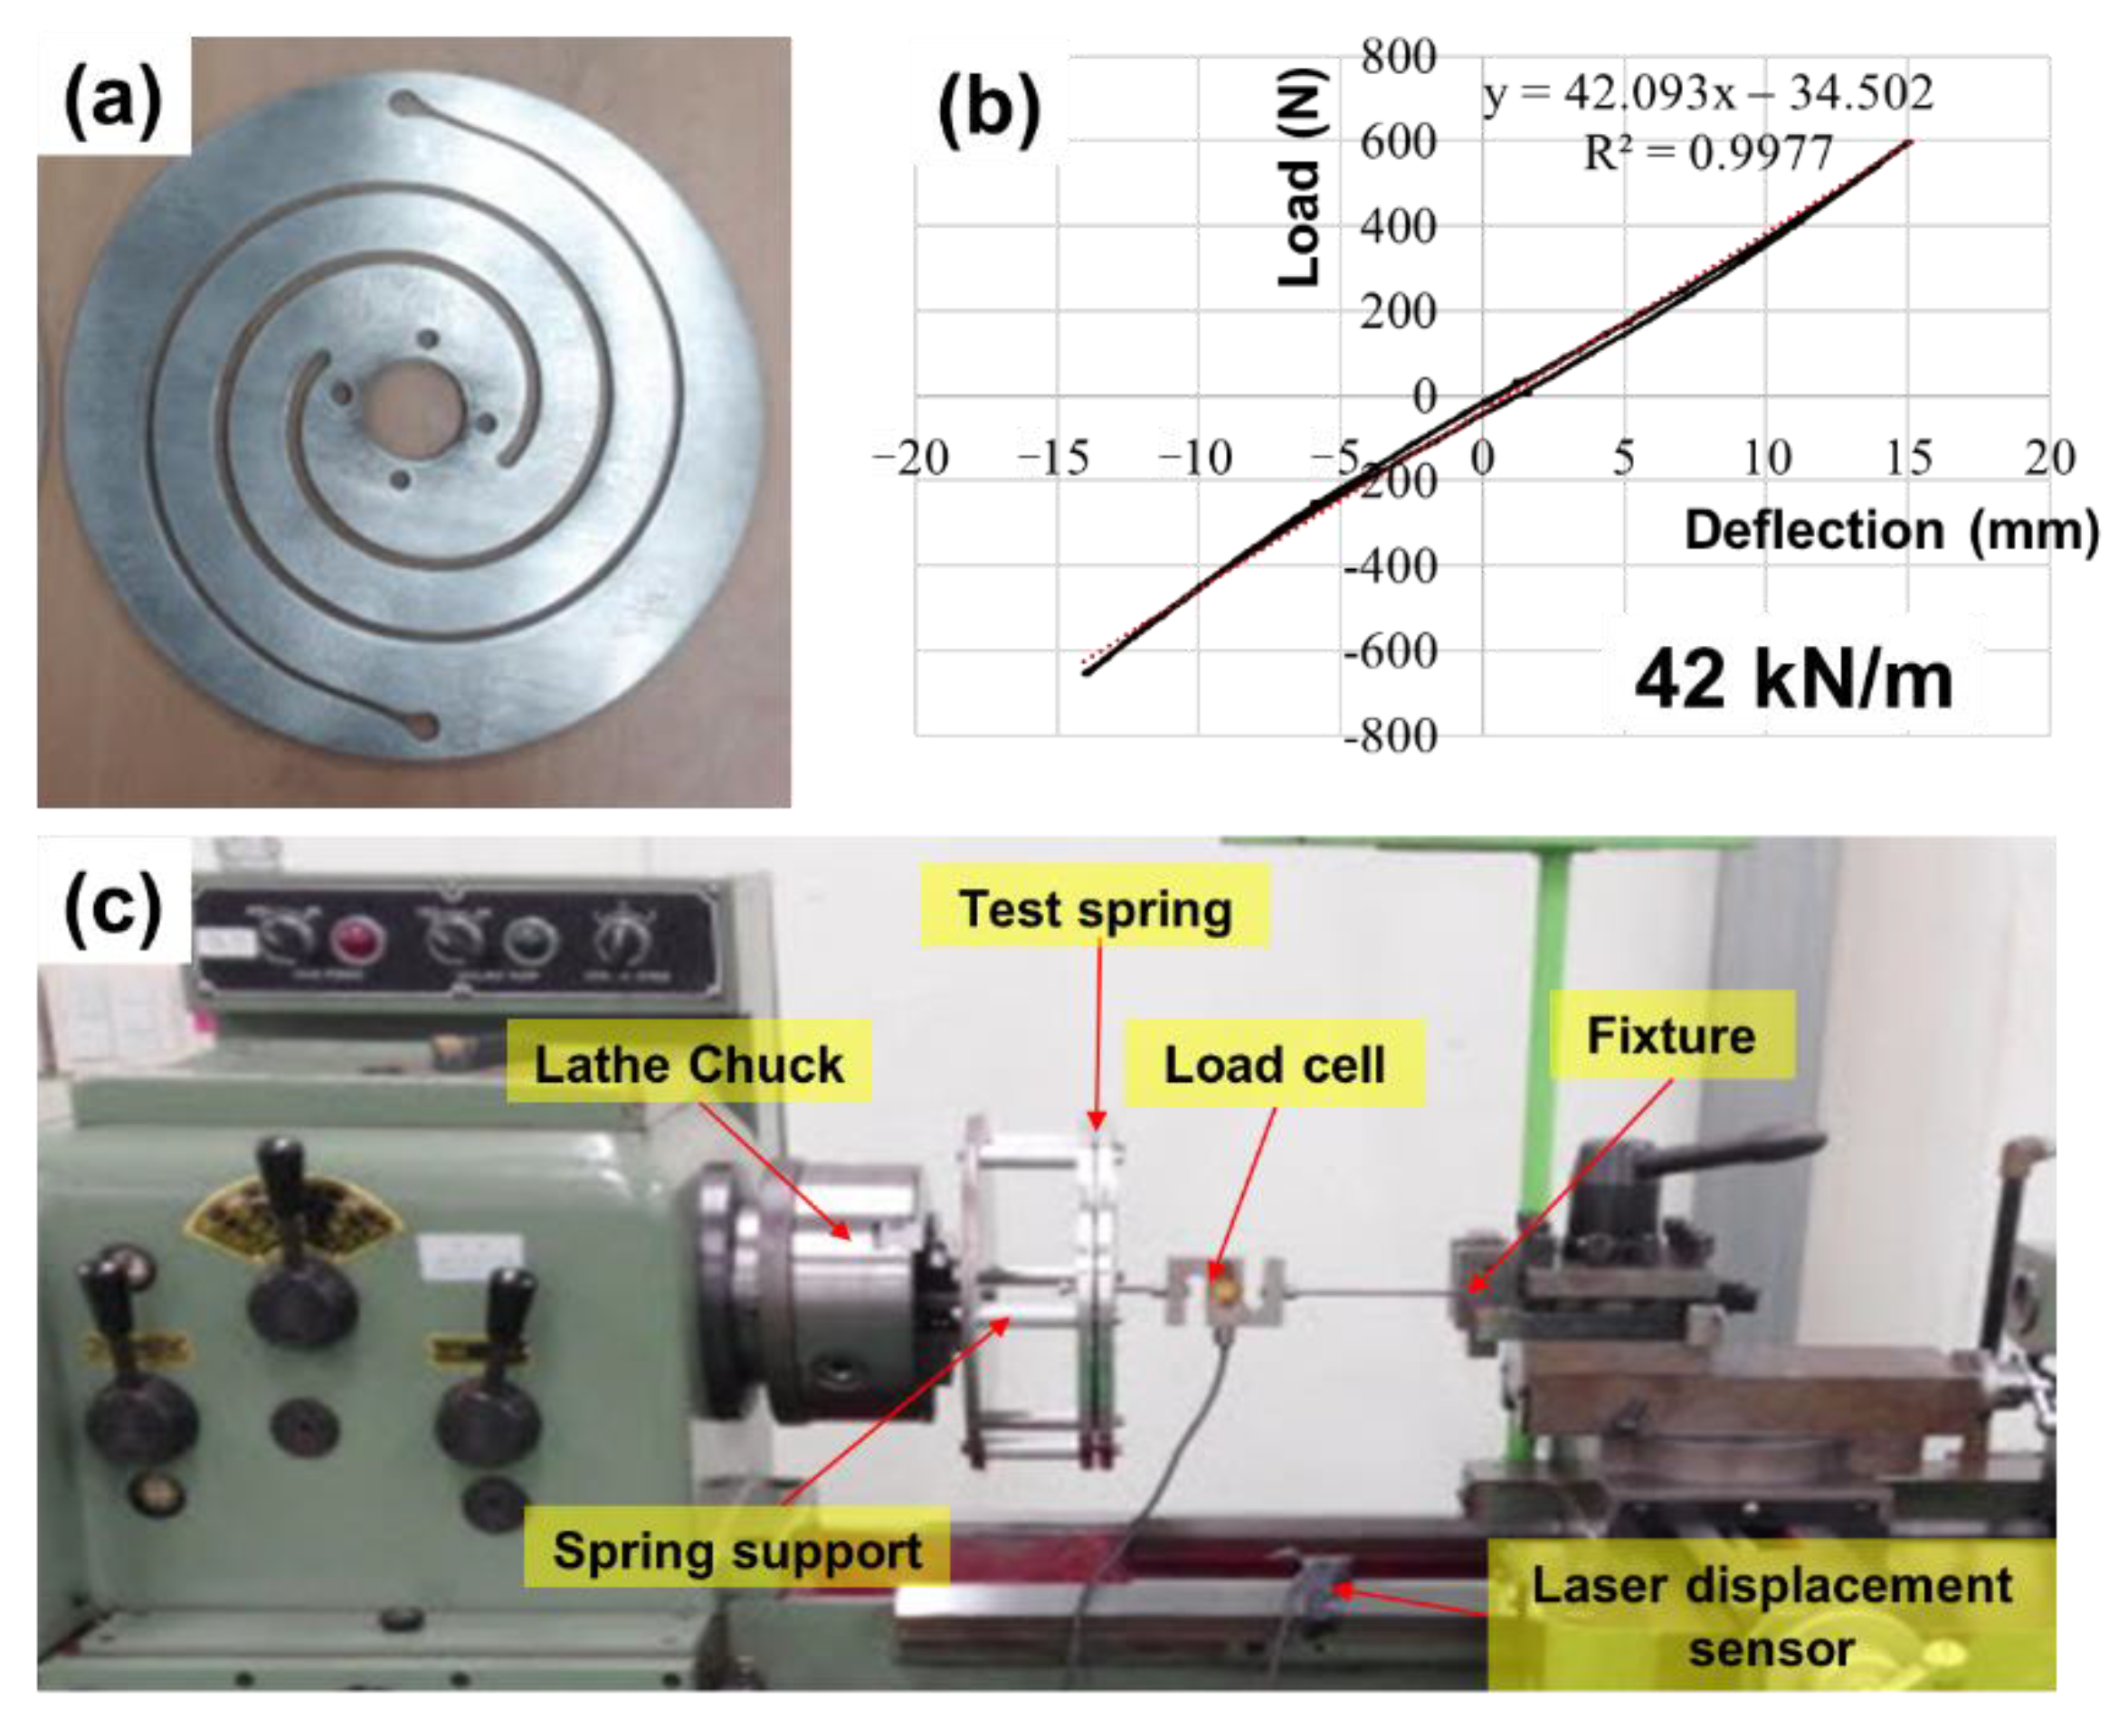
The flexure spring stiffness was measured from load-deflection tests for the calculation of stiffness coefficients in the EOM. Figure 3 shows the static load-deflection tests of the flexure spring for the PP and DP: (a) test spring manufactured from SK5, (b) measured force–displacement curves during consecutive pushes and pulls, and (c) a test rig using a lathe. A load cell measures the force applied to the spring, and a laser displacement sensor measures the displacement of the spring.
As a result, the test spring deflects with maximum bidirectional deformations of ±15 mm with proper linearity and negligible hysteresis, satisfying the piston’s design amplitude of 12 mm. The measured spring stiffness is 42 kN/m. Note that the spring was designed through finite element stress analyses, which are omitted for brevity.
4.2. Electrical Load Damping of Linear Alternator
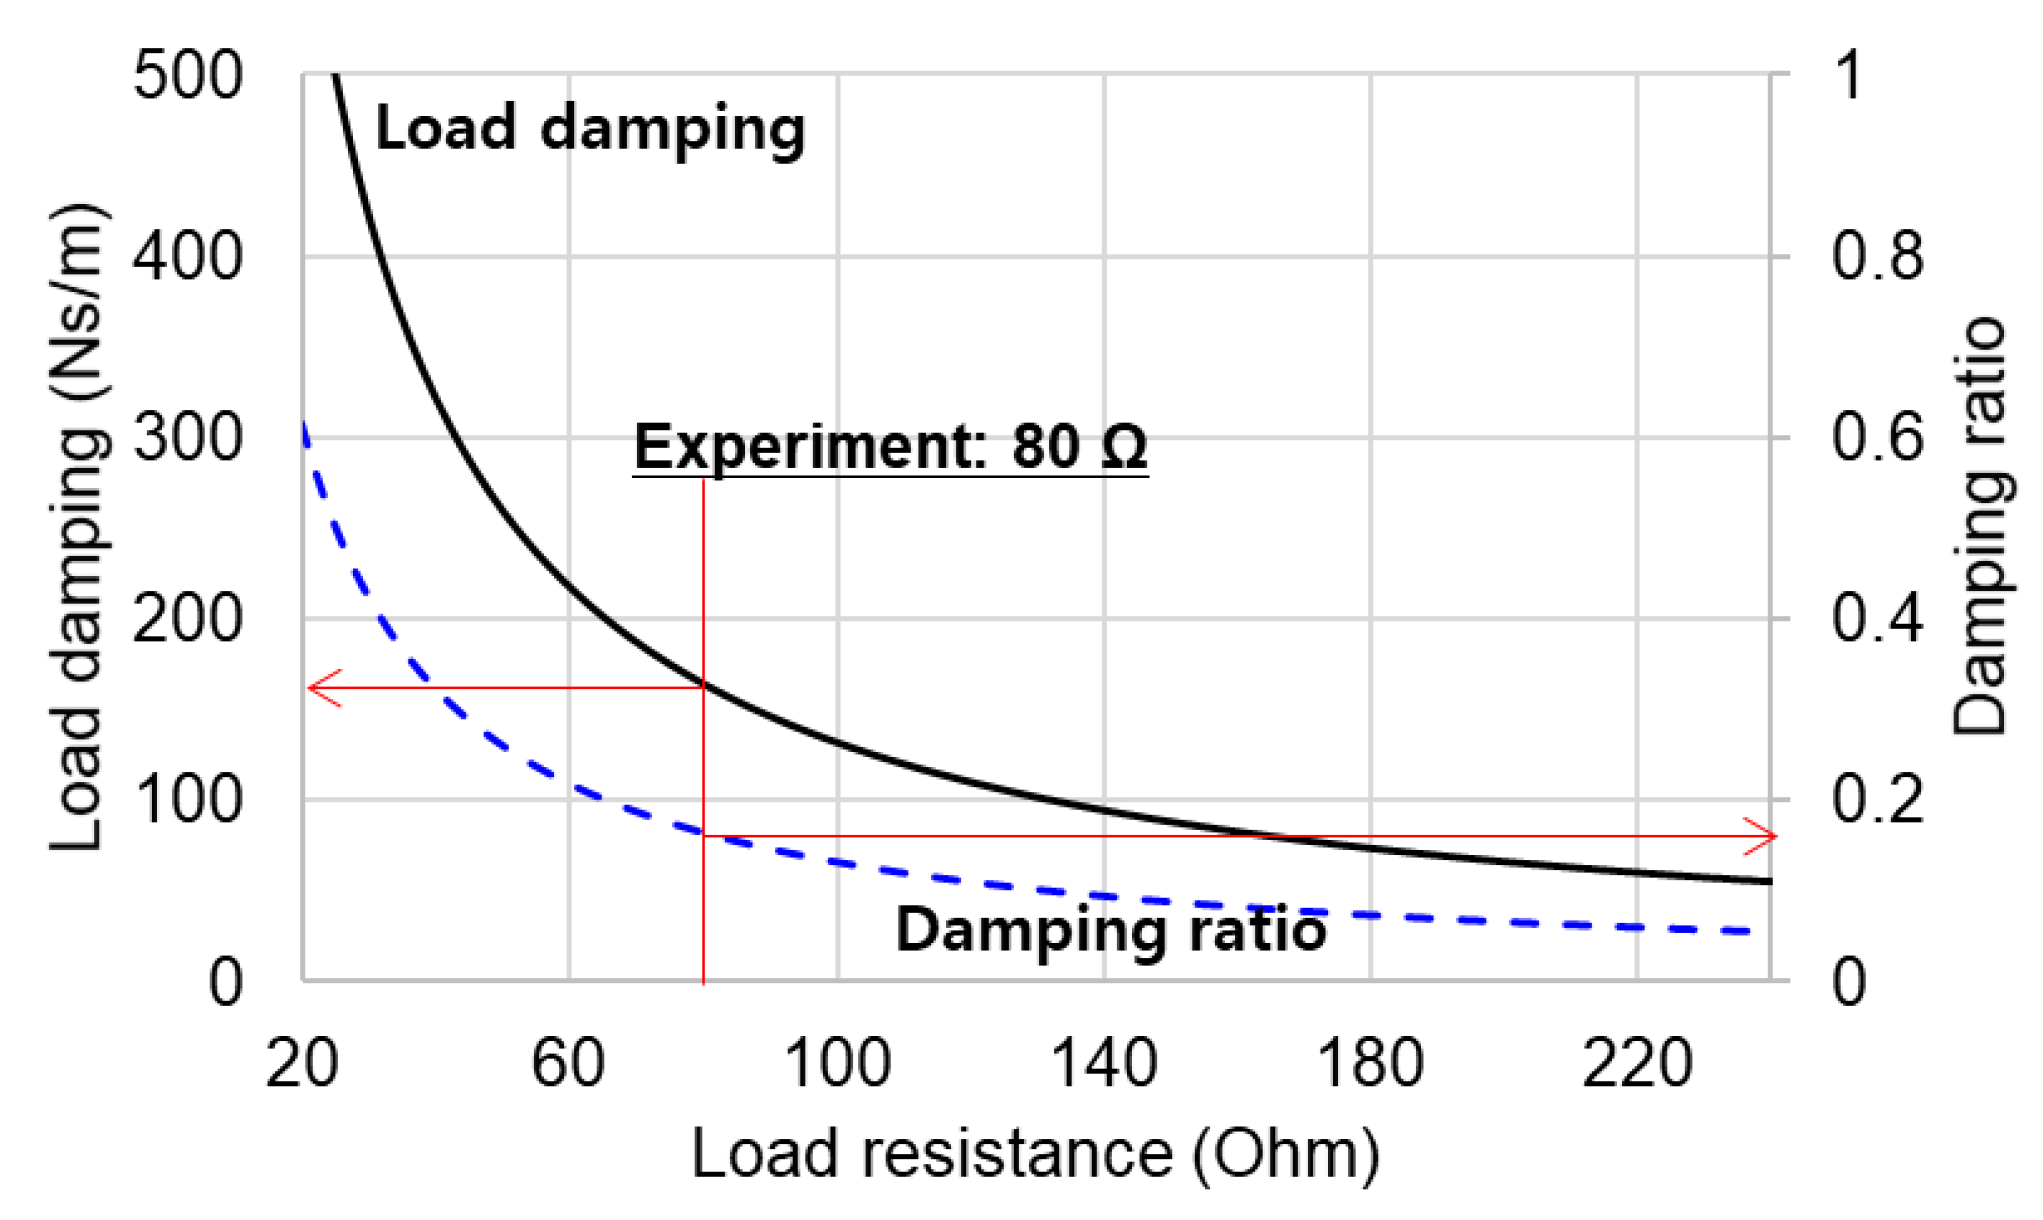
The electromagnetic force of the linear alternator is directly applied to the PP motion as a damping force, and is analytically calculated by using the theoretical electromagnetic damping equation in Reference [24], as follows:
where Kelec is the electromechanical coupling constant. Relec,alt and Relec,load represent the internal resistance of the linear alternator and load resistance, respectively. Lelec,alt and Celec,load represent the inductance of the linear alternator and the load capacitance for compensating electric power factor, respectively. Relec,load is variable to control the load damping of the engine and corresponds to the electric power output of the engine. Table 3 lists the design parameter values of the linear alternator.
Figure 4 shows the predicted load damping coefficients and damping ratios for various load resistances from 20 Ω to 240 Ω. The prediction reveals that lower electric load resistances yield increases in the electric current of the alternator and thus generate higher mechanical damping loads to the engine.
The applied load resistance of 80 Ω in the experiment cases corresponds to the damping coefficient of 160 N·s/m and the damping ratio is 0.17 from the definition of ζload = cp/2(mpkp)1/2 [25]. The damping coefficient is used for the direct damping coefficient of Cpp in Equation (7).
4.3. Gas Flow Damping in Heat Exchangers
Another major damping element is the gas flow friction damping in the heat exchangers and regenerator, and directly acts on the DP motion. In this study, the damping coefficient is calculated indirectly from a reasonably estimated pressure drop based on experiments; detailed data is given in the Section 6.1. Note that the gas flow damping in heat exchanger part is quite complicated and hard to calculate accurately due to complex flow regime in the narrow and porous structures.
The measured working pressure amplitude is ~1 bar at the compression space under the charge pressure of 15 bar for the reference case 3. We assume that the pressure drop in the heat exchanger part is 15% of the working pressure, i.e., 0.15 bar. Note that in general the pressure drop is less than 15% of the working pressure amplitude of FPSEs [11].
The damping force experienced by the DP motion with the PP fixed is defined as Fd = AdΔp = cdvd and becomes |Fd| = cdω|xd| [11]. As a result, the damping coefficient is calculated to be 34.1 N·s/m with the measured working frequency of 31.9 Hz and DP amplitude of 12.5 mm. The damping coefficient is used for the direct term of Cdd. Note that the pressure drop of FPSE with similar dimensions to that in Reference [11] and is 0.4 bar at a working frequency of 60 Hz and a DP amplitude of 12.7 mm.
5. Analyses on Dynamic Behavior of Test FPSE
5.1. Stiffness and Damping Coefficients of FPSE
The dynamics of FPSEs are highly associated with the nature of the pressure generation mechanism during the thermodynamic cycle generated by piston motions. In particular, the pressure stiffness relating the pressure generation with the piston motion, defined from Equation (7), has a high influence on the dynamic characteristics of FPSEs.
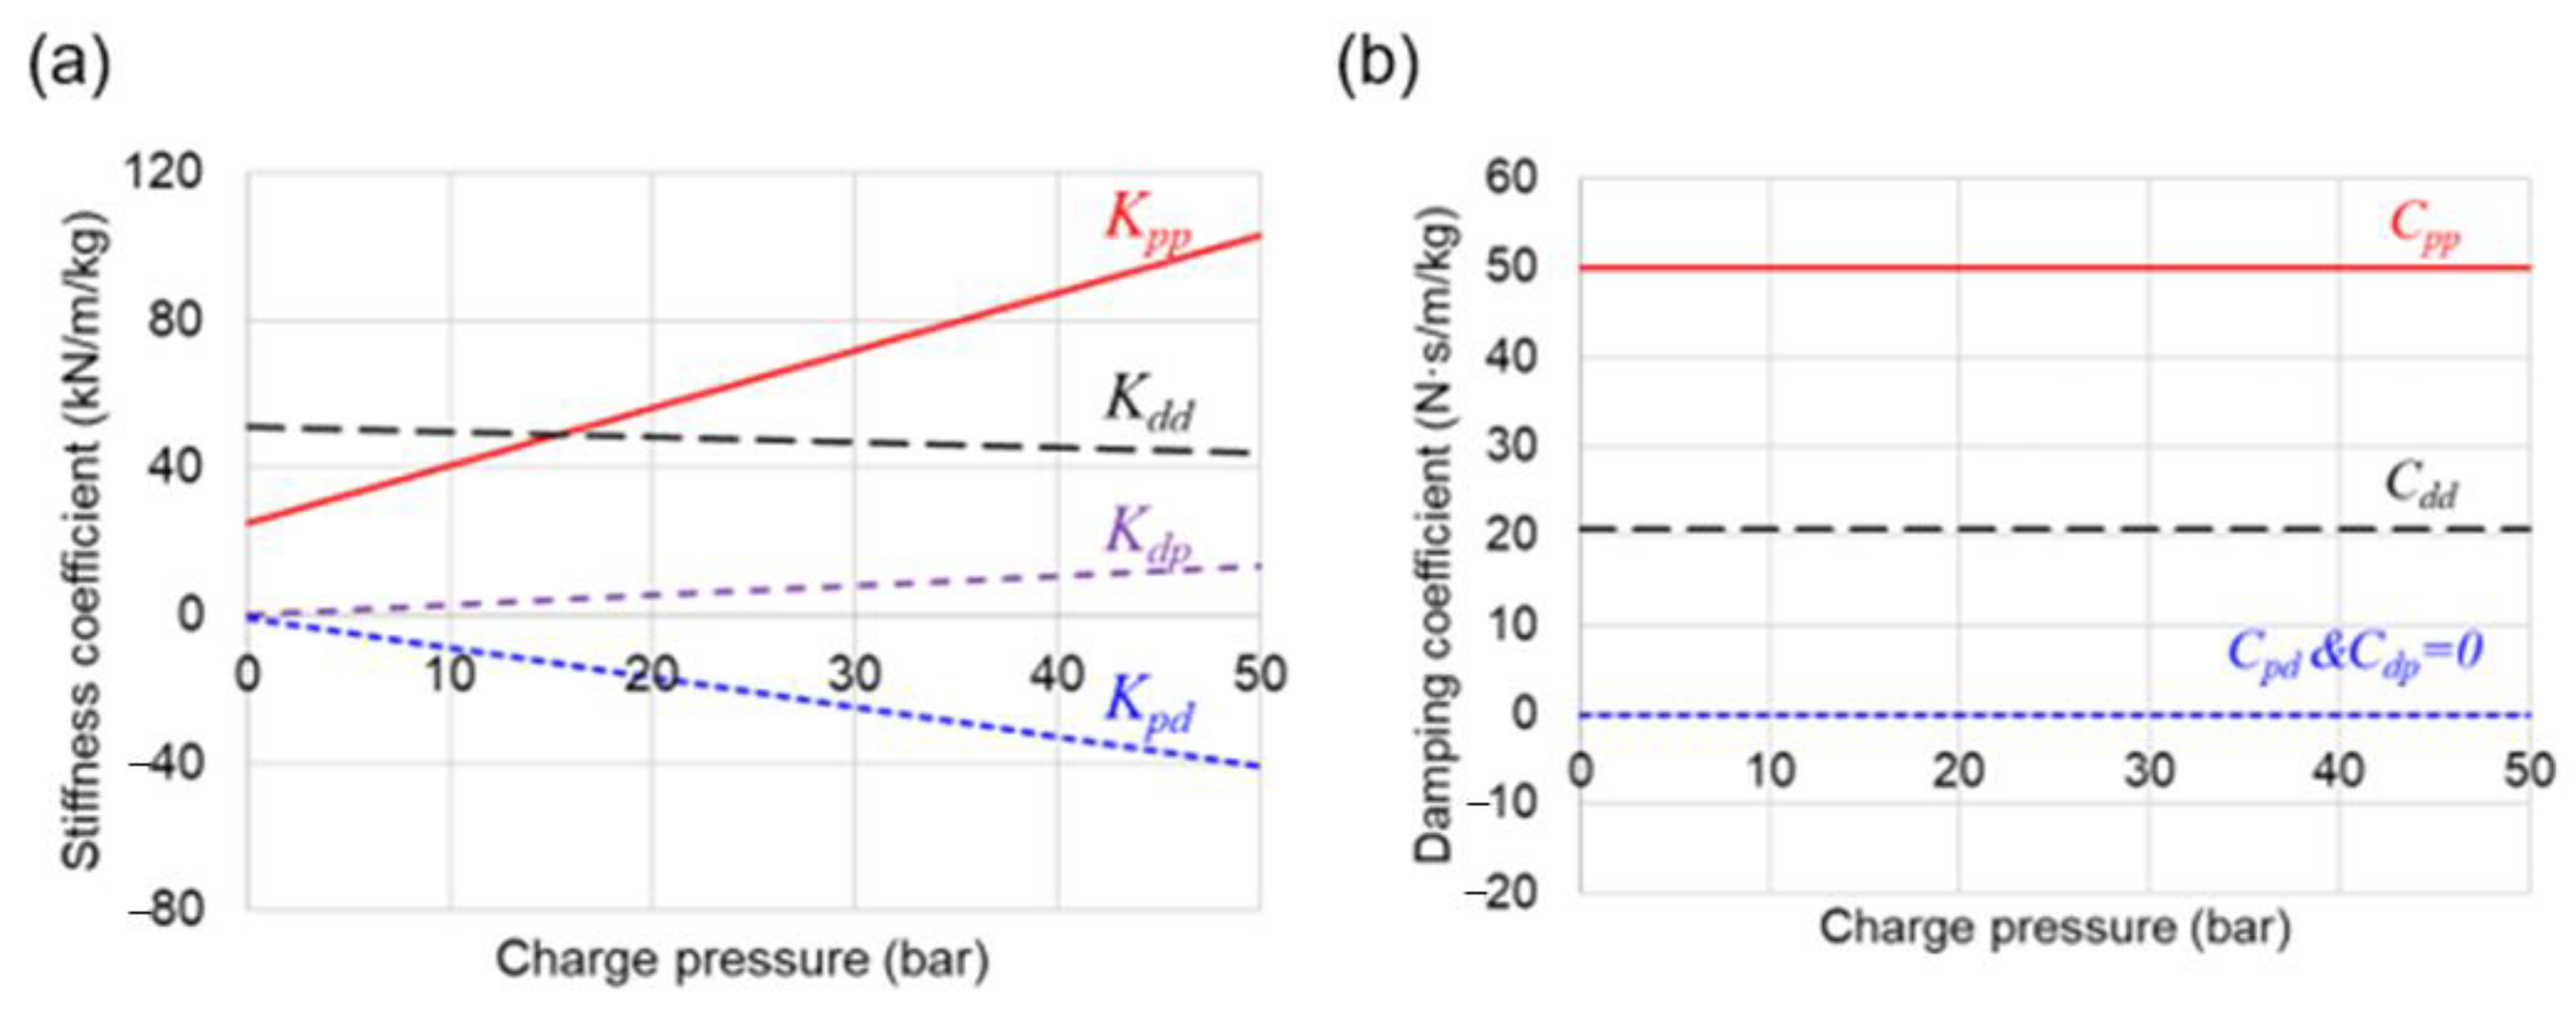
Figure 5a shows the predicted system stiffness coefficients per mass with an increasing charge pressure of 0–50 bar for the reference case 3—The PP mass of 3.6 kg and PP stiffness of 84 kN/m. The stiffness coefficients are divided by the PP and DP masses, respectively. The DP mass is 1.64 kg and DP stiffness is 84 kN/m for all the cases. The first and second subscripts of the stiffness coefficients mean the forced piston and the displaced piston, respectively.
Basically, the pressure force with the positive stiffness acts in the opposite direction to the displacement and generates a restoring force toward an equilibrium position, while the negative stiffness is the opposite and causes a diverging force.
First of all, the stiffness element is composed of the flexure spring stiffness with a constant value and the pressure stiffness variable depending on pressure and temperature conditions; particularly, the cross-coupling coefficients have only the pressure stiffness.
Under the increases in charge pressures, Kpp increases greatly with positive pressure stiffness from the PP spring stiffness, which is the value at zero charge pressure; while Kdd decreases slowly due to the negative pressure stiffness from the DP spring stiffness, and maintains positive. The greater slope of Kpp results from the larger cross-sectional area of the PP than the DP rod, which are the pressure-acting areas. These increasing and decreasing tendencies are also observed in Kdp and Kpd, respectively. In particular, Kpd has negative values over the charge pressures.
In detail, when the PP moves up, the working space of the engine is compressed to a higher pressure, so that the pressure force pushes both the PP and DP downwards, acting as a restoring force thus having a positive stiffness, as in Kpp and Kdp. On the other hand, when the DP moves upwards, the working gas moves from the expansion space to the compression space via the heat exchanger part, and is cooled, so that the working space has a lower pressure. Therefore, the bounce space pressure pushes up both the DP and PP, which then acts as a diverging force with a negative stiffness, shown as the decreasing tendencies in Kdd and Kpd.
Eventually, the Kpd with the negative values leads to the divergent motion of PP due to the DP-induced thermodynamic processes. The Kpp and Kdd are still positive owing to the flexure spring stiffness, keep providing restoring forces and maintaining the piston vibrations. The effect of the pressure stiffness strengthens with increases in the charge pressure.
On the other hand, Figure 5b shows the system damping coefficients per mass, where the damping coefficients are divided by the PP and DP mass, respectively. They are assumed constant over the charge pressures, and only the direct terms are considered. The electromagnetic load damping of linear alternator is approximately 2.5 times that of the heat exchanger damping.
Note that the damping load on the PP by the alternator limits the piston amplitudes by extracting the dynamic power to the load device, while the damping load on DP dissipates energy as a loss in the heat exchangers.
5.2. Natural Frequencies of PP and DP
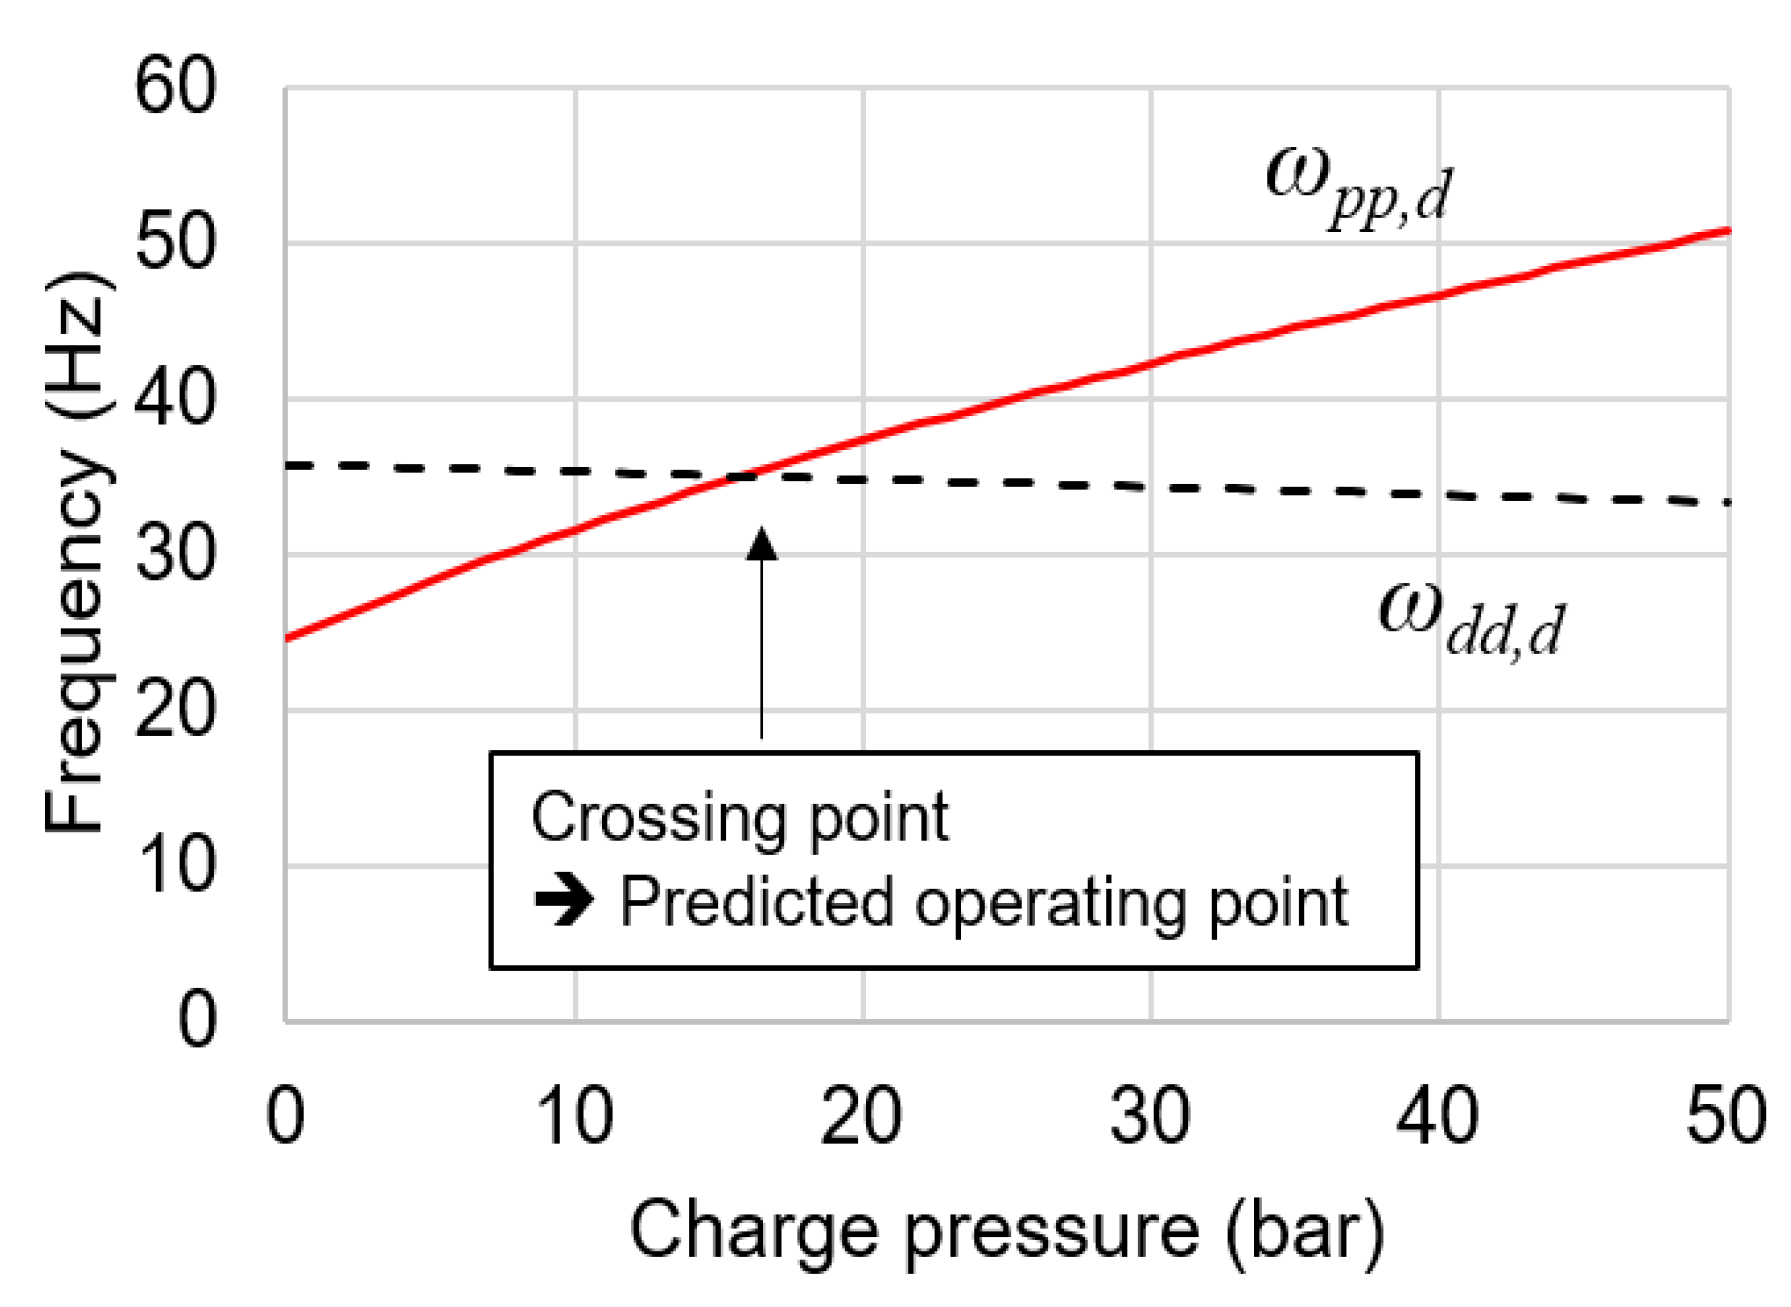
Figure 6 shows the predicted DNFs of PP and DP with increasing charge pressures in the range 0–50 bar for the reference, case 3. As the charge pressure increases, the DNF of PP increases rapidly, and that of DP decreases slowly, which are related to the increases and decreases in the direct system stiffness of Kpp and Kdd, respectively. The two DNFs of pistons are equal and crossing at the charge pressure of 16 bar with a frequency of 35 Hz, forming the resonance condition of the FPSE.
In particular, the DNF curve for DP is relatively constant with slight decreases from the DP spring stiffness. Therefore, the constant DNF of DP determines the vertical position of the crossing point, i.e., the operating frequency of the FPSE. On the other hand, the DNF curve of PP shifts up and down depending on the PP spring stiffness and mass values, so that the horizontal position of the crossing point moves to the left and the right, determining the operable charge pressures. Consequently, the simple vibration analysis predicts operable charge pressures and working frequencies of the FPSE in a simple and direct way.
Theoretically the use of damped natural frequency is more accurate than that of natural frequency. However, the level of damping magnitude in this study yields a minor effect on the natural frequencies. For example, with the damping ratio of 0.17 in Figure 4, the difference is 1.4% from the definition of . Considering difficulties and errors in estimation of damping, the use of natural frequencies makes predictions much easier and more applicable.
5.3. Root Locus Analysis
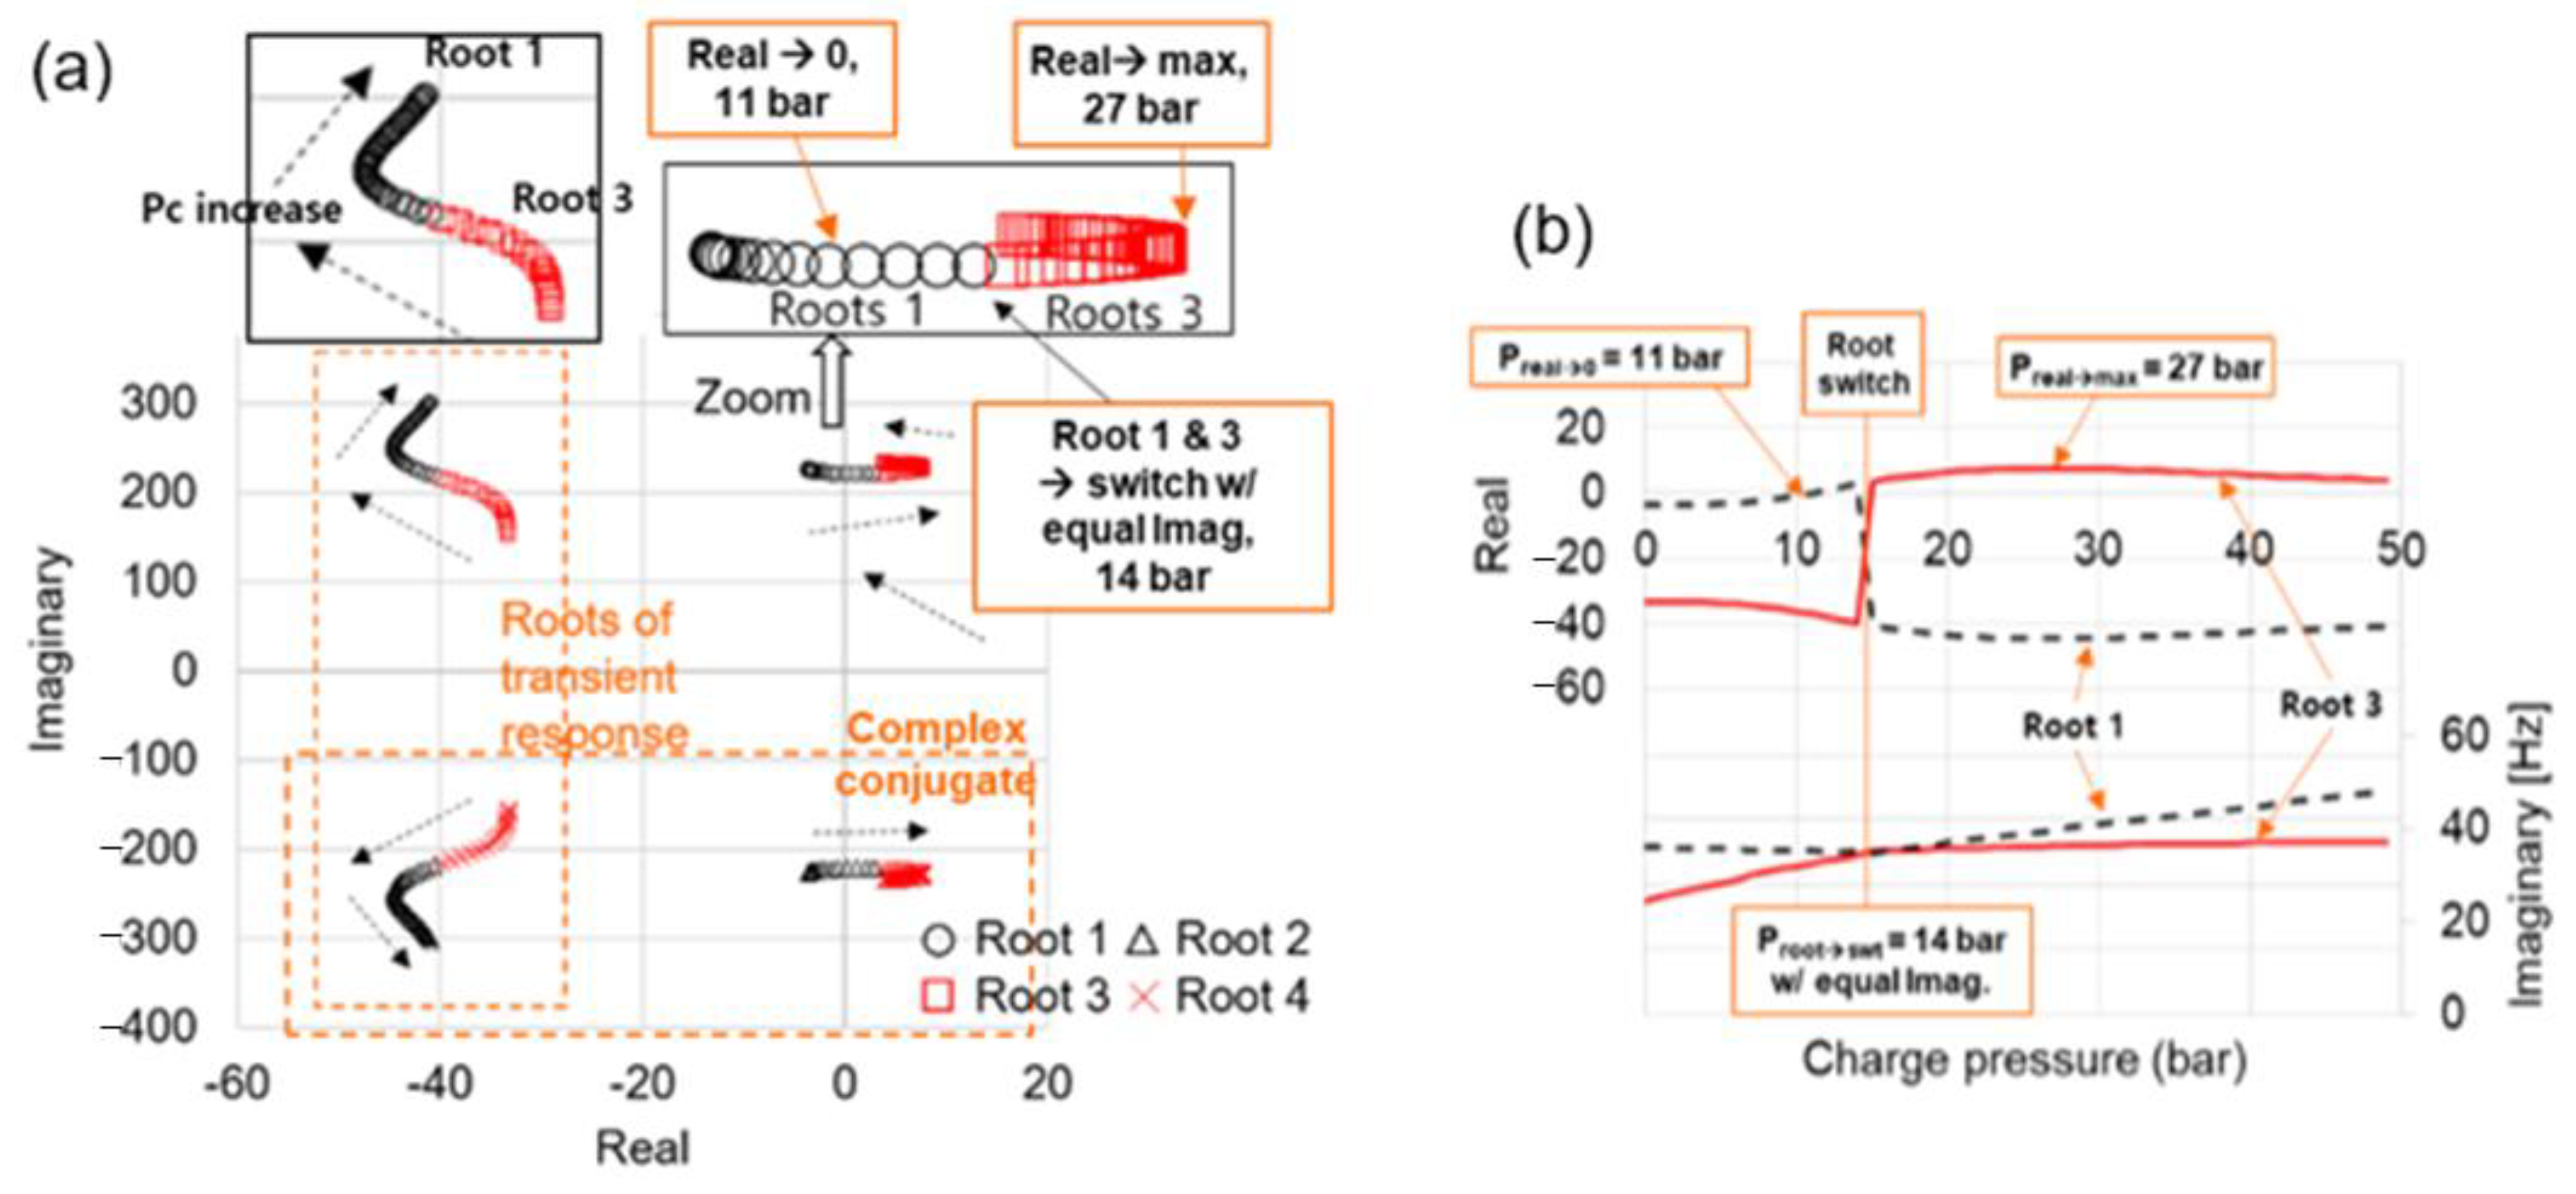
Figure 7a show the root locus trajectory with increasing charge pressures of 0–50 bar for case 3. The fourth-order characteristic equation has four roots with two pairs of complex conjugates, so that only two upper roots are considered. The roots are plotted in the complex plane by denoting the real part along the horizontal axis and the imaginary part along the vertical axis.
With increasing charge pressures, the right upper root moves right, becomes positive at 11 bar, and has a maximum value at 27 bar, then moves left; while the left one moves in the opposite way with negative real values. The right upper root moves upward slightly, implying the increases in the operating frequency.
Note that from the stability theory in mechanical vibrations, FPSEs are considered to start to operate when one of the real parts is greater than zero with diverging amplitudes [6,13]. In reality, the engine has limited piston amplitudes due to energy extractions by damping devices, internal and external. On the other hand, roots with negative real parts have a converging transient response and disappears eventually.
Interestingly, although the roots seem to move continuously, a switch between the root loci occurs at a certain pressure. Figure 7b shows the real and imaginary values of upper poles (roots 1 and 3). The real parts of roots 1 and 3 clearly show a switch with each other at a charge pressure of 14 bar, and form continuous curves. Overall, the real part of root 3 remains positive and maximizes at 27 bar with relatively constant imaginary parts around 220 rad/s, corresponding to an operating frequency of 35 Hz.
6. Experimental Results and Comparison to Analysis
6.1. Experiments on Test Cases
A series of preliminary experiments were performed in advance to find an operable range of charge pressure for each experimental case in Table 2. In the main experiments for the measurement of dynamic behavior, the engine was operated at three charge pressures in the operable range for ~30 s. The expansion and compression space temperatures were maintained at ~450 °C and ~50 °C, respectively, by controlling the heater temperature and cooling flow rate.
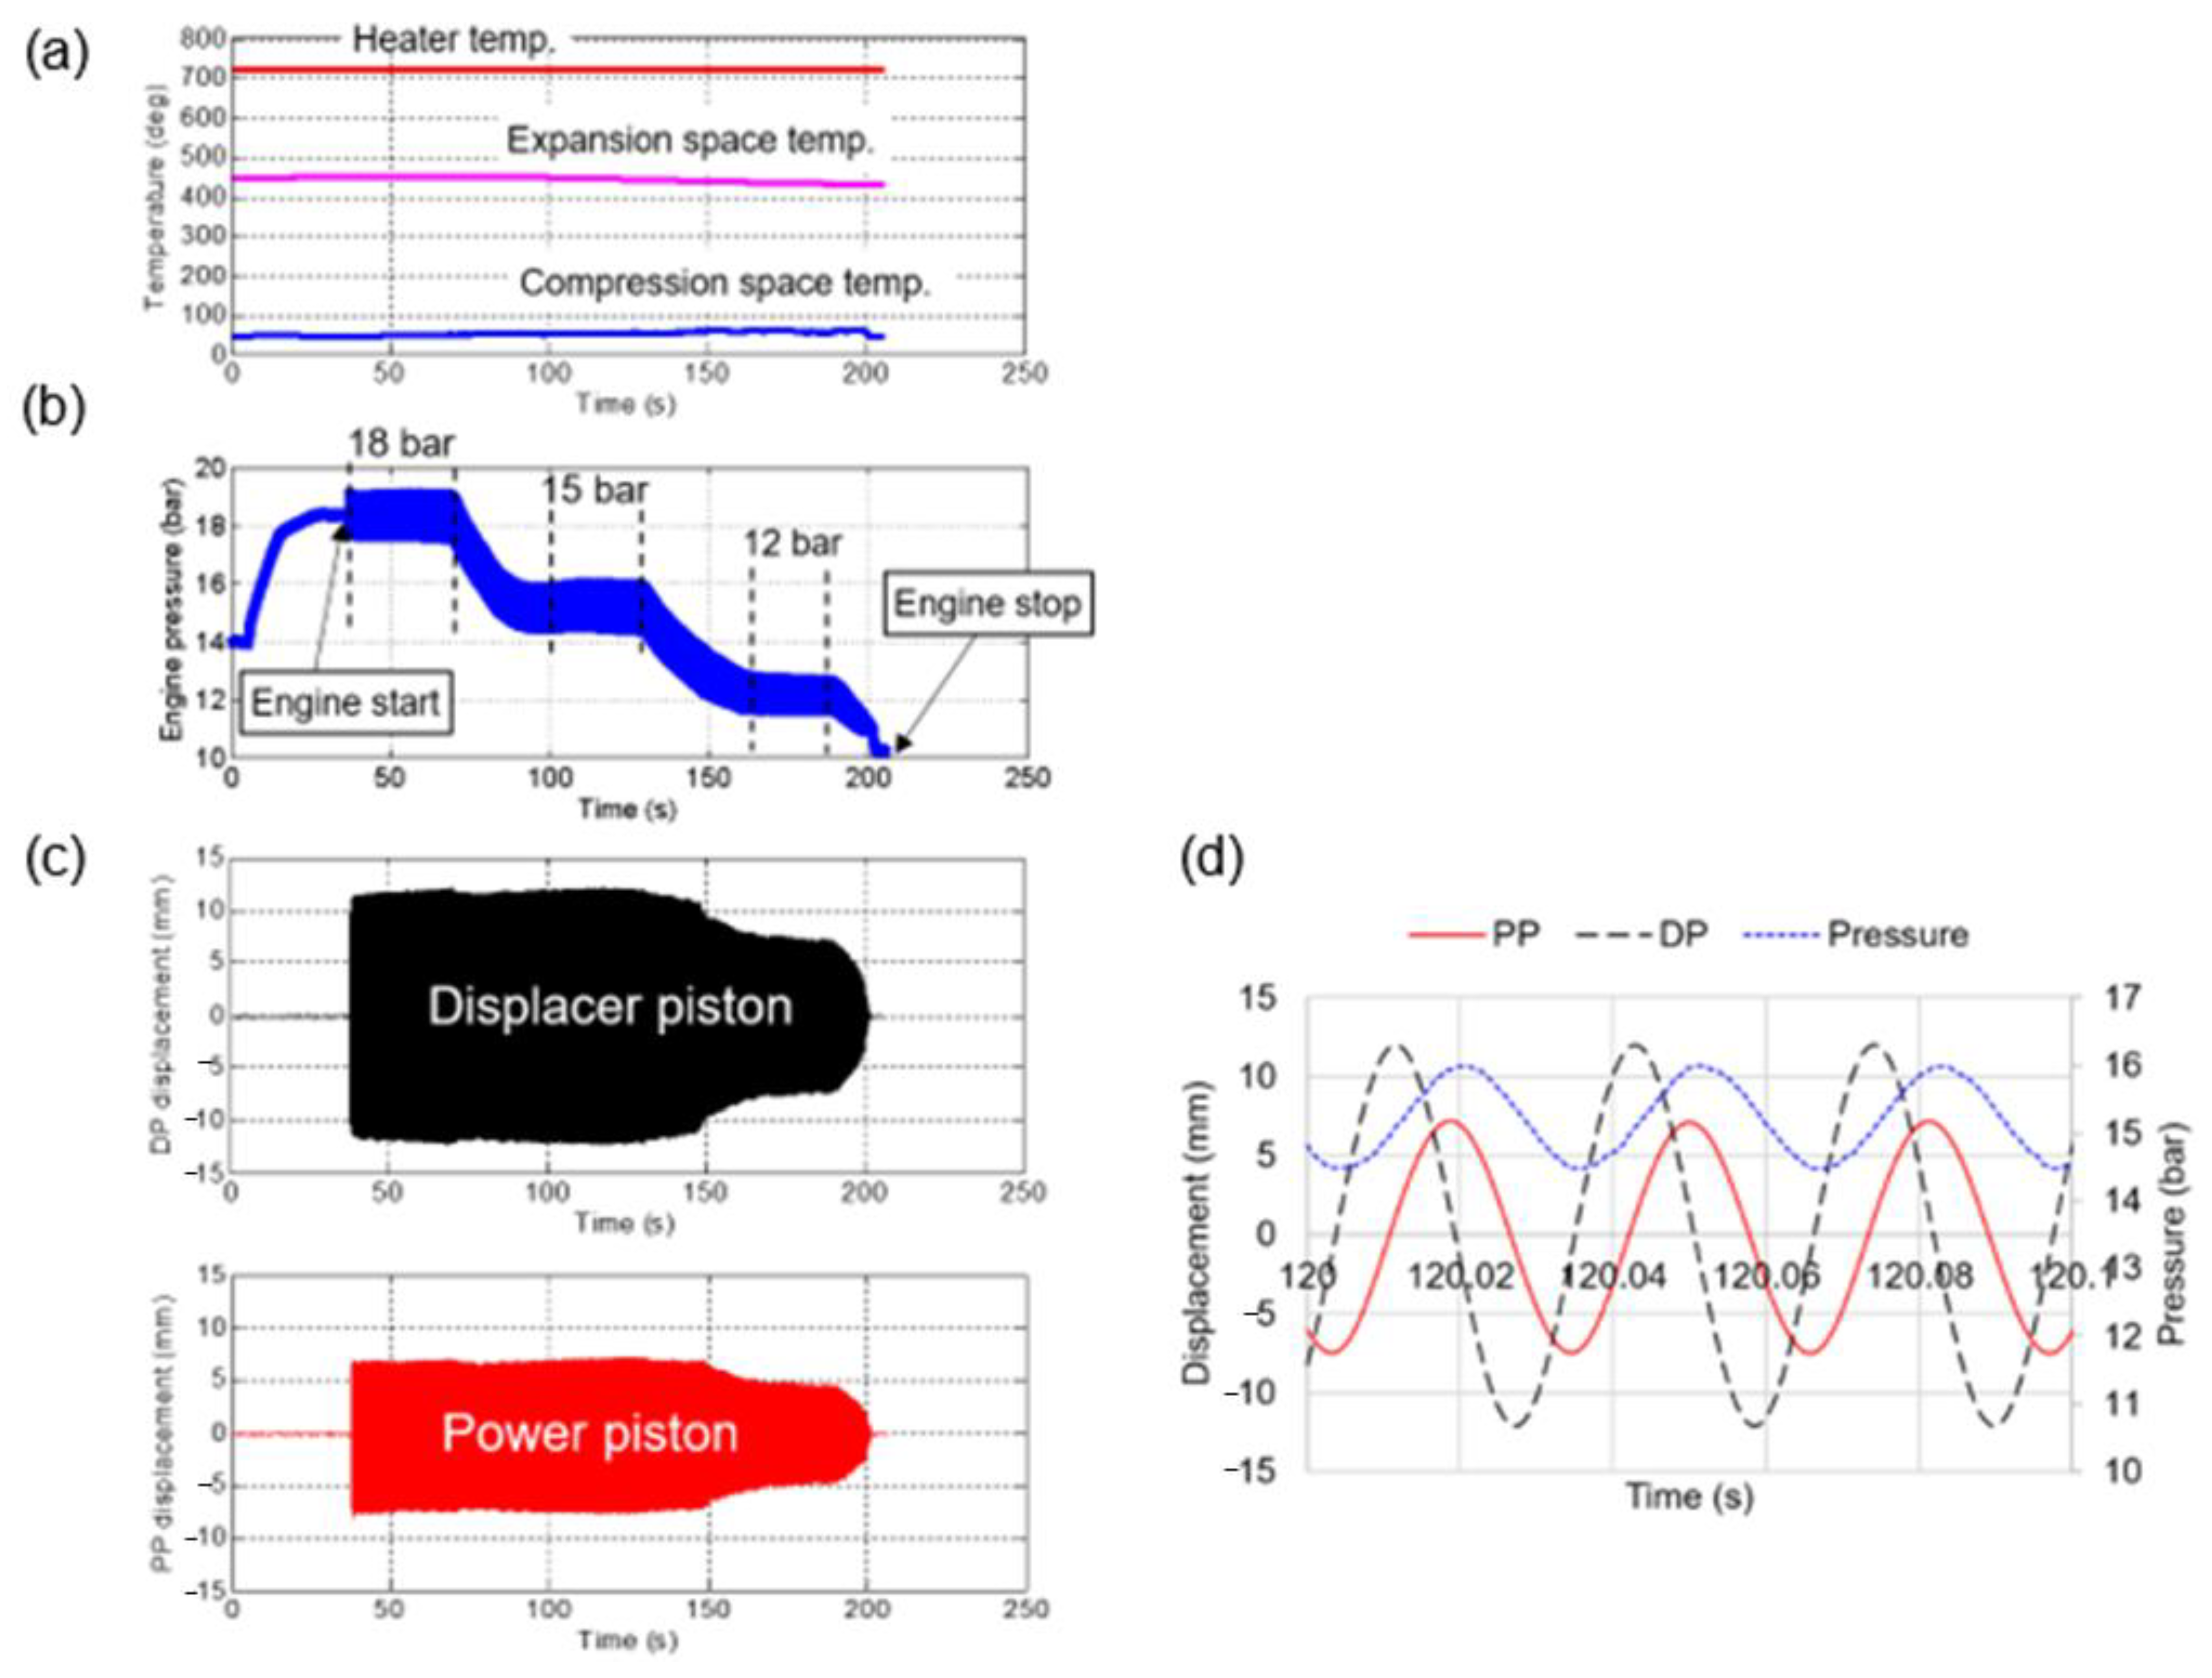
Figure 8 shows the measured (a) temperatures, (b) working pressure, and (c,d) piston displacements at charge pressures of 18 bar, 15 bar, and 12 bar with a load resistance of 80 Ω for the reference, case 3.
When the heater temperature was approximately 700 °C, the expansion and compression space temperatures were maintained at ~450 °C and ~50 °C, respectively. When the engine was charged with the working gas (air) up to 18 bar, it started operating. The linear alternator starts the engine with electric power supplied in the motoring mode, and then is changed to the generating mode. During the decreases in charge pressures, the DP and PP displacements slightly increased at 15 bar and then greatly decreased at 12 bar; eventually, the engine stopped.
At the charge pressure of 15 bar, the DP and PP strokes were 24 mm and 14.5 mm, respectively, with the DP-to-PP stroke ratio was 1.6. The DP–PP phase angle was 82°, i.e., the DP was ahead of the PP by 82°. The phase angle between the PP and the working pressure was 19°, i.e., the PP is ahead of the working pressure. The operating frequency was 31.9 Hz, and was identical for the three charge pressures.
6.2. Comparisons to Analysis Results
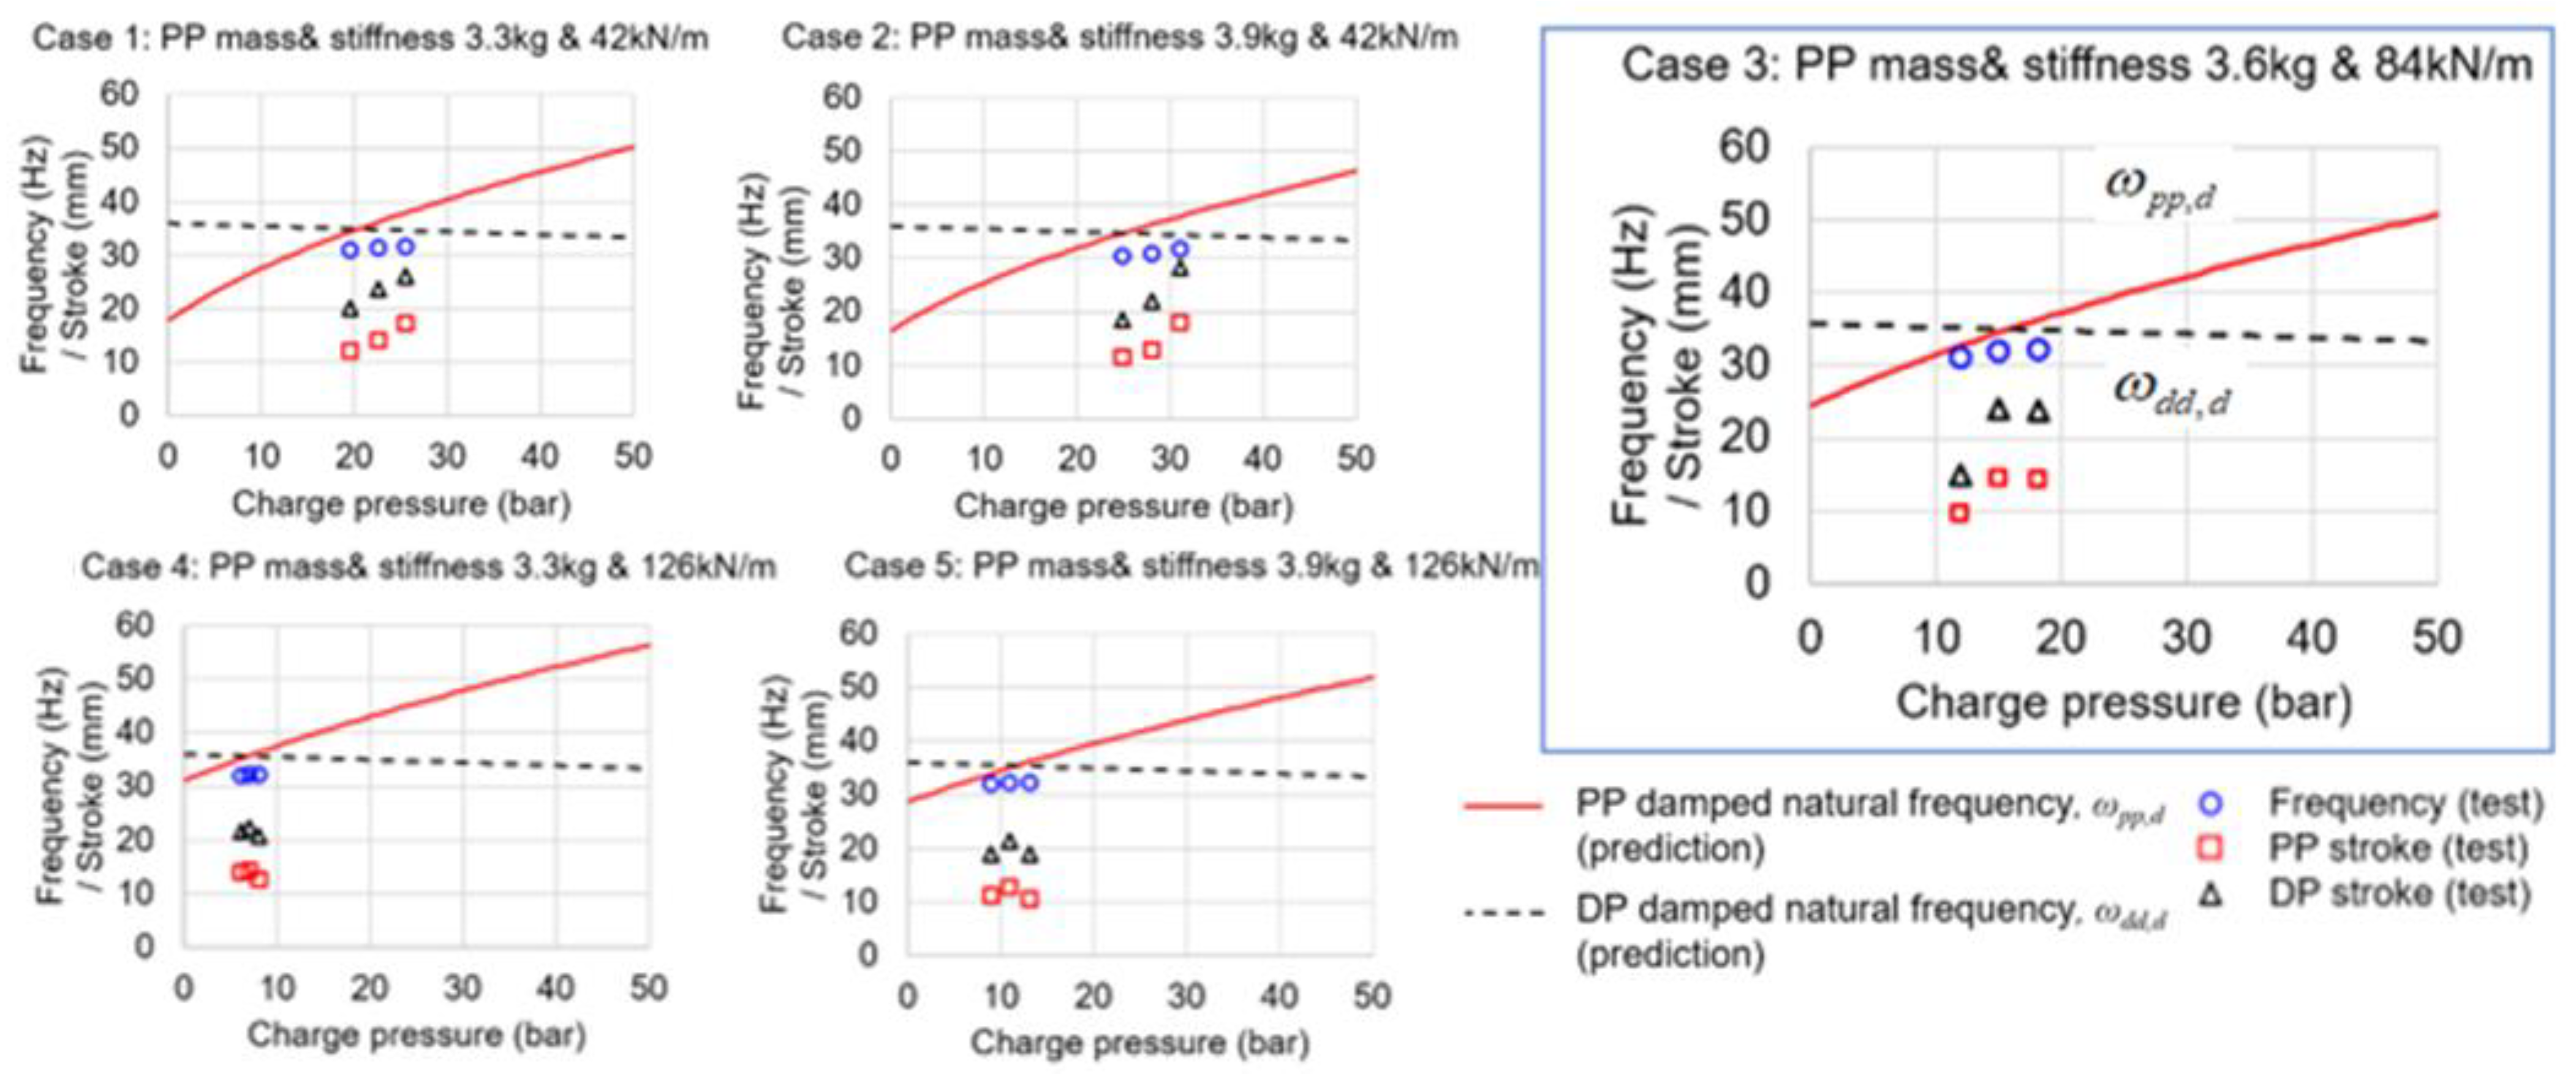
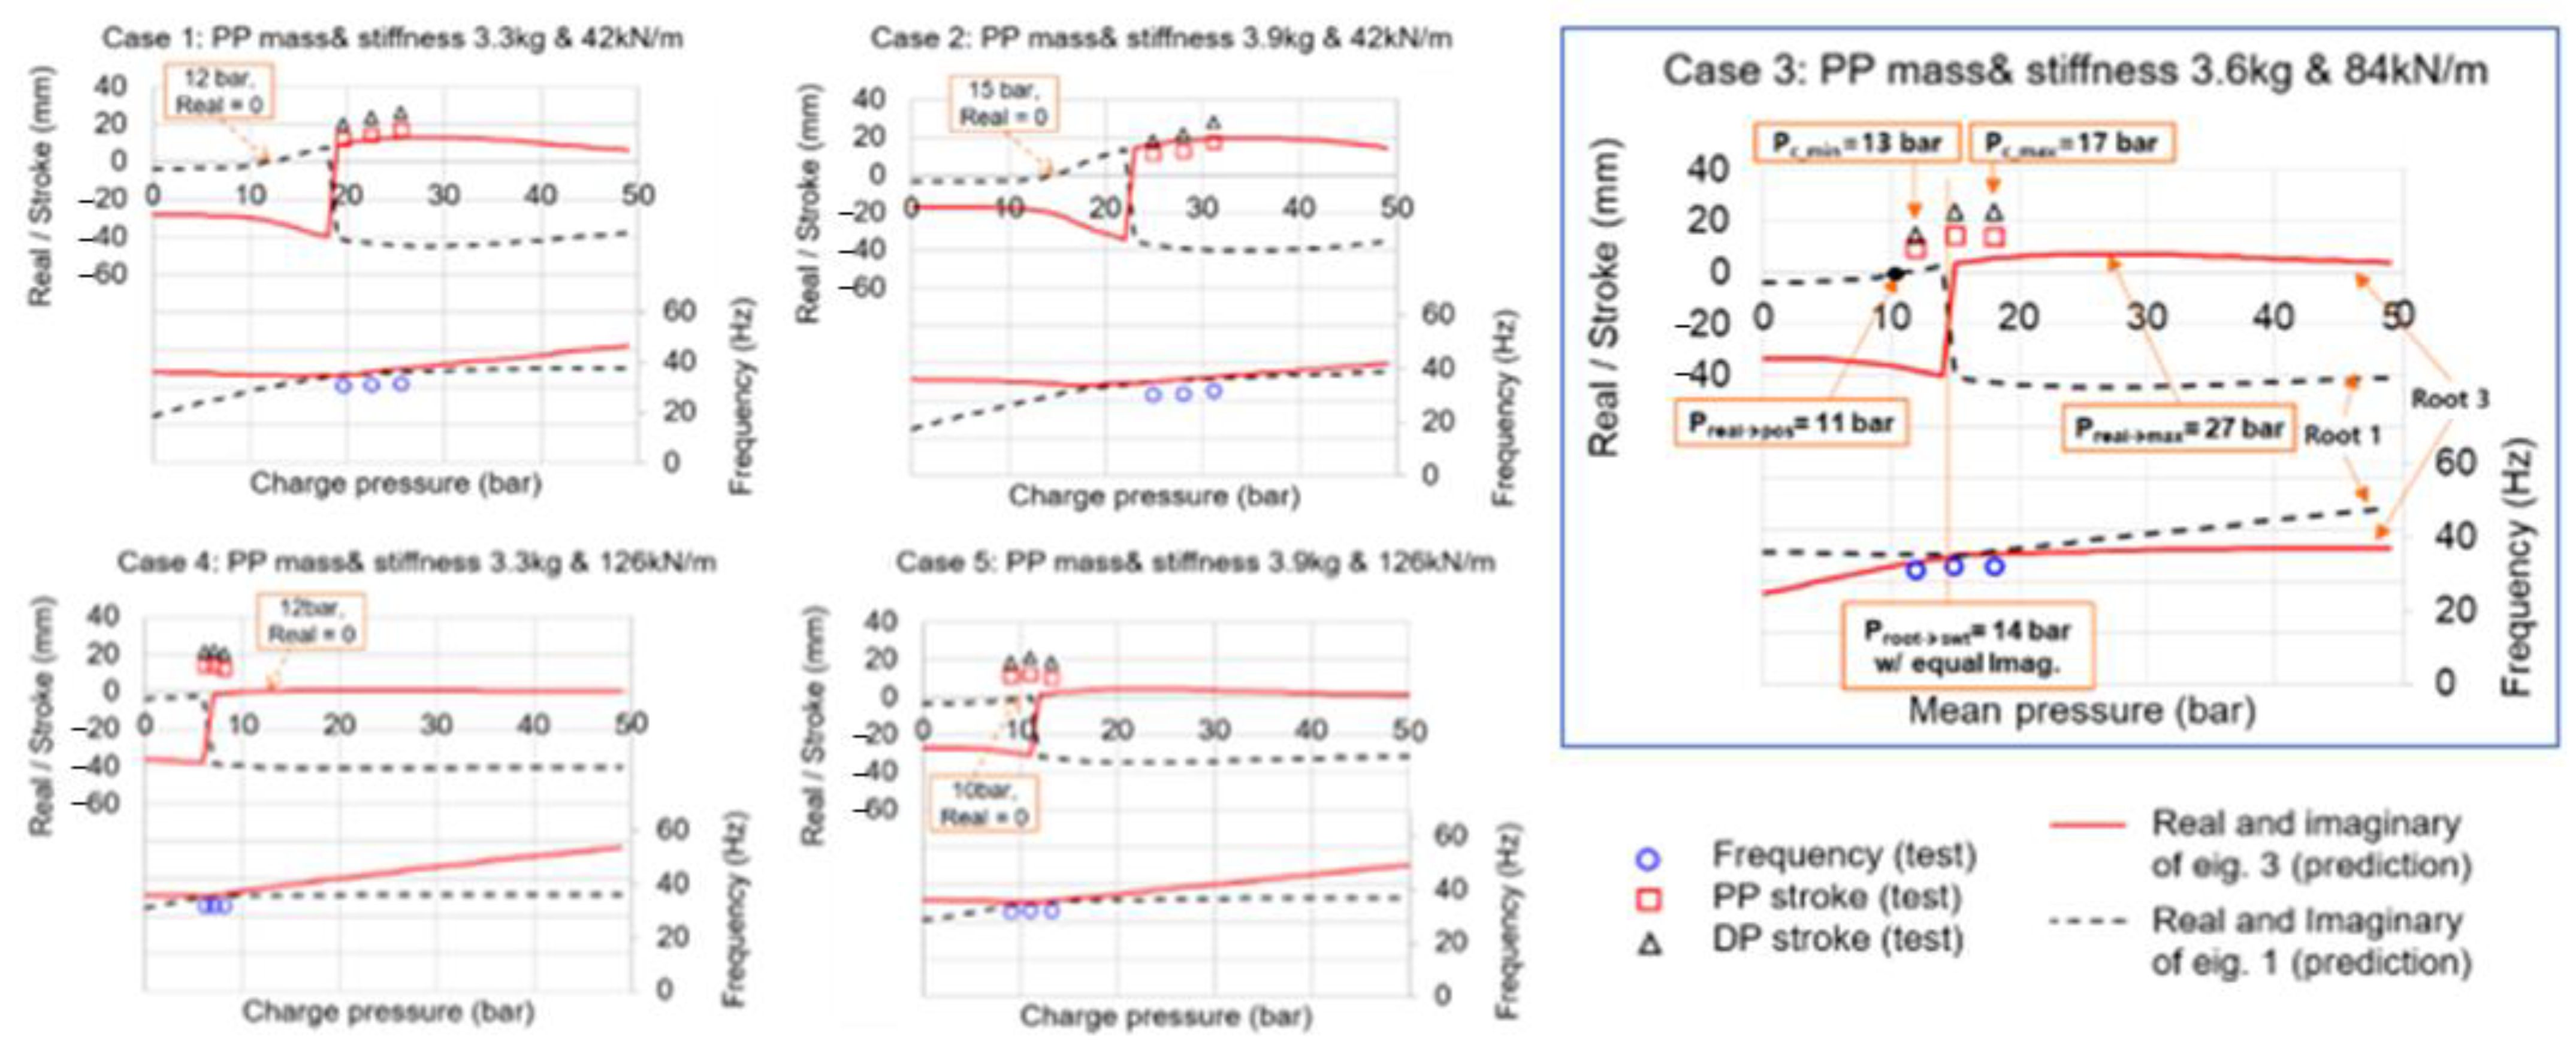
Figure 9 shows a comparison of the experimental results with the simple vibration analyses in terms of working frequency and piston strokes over charge pressures for cases 1–5. Both ends of the three measurements represent the lower and upper limits of operable charge pressures; out of the range, the test engine did not operate.
Overall, the changes in PP mass and spring stiffness lead to large variations in the operable charge pressures from 6 bar to 31 bar. Both the experiments and analyses show that a smaller stiffness and higher mass of PP yield higher operable charge pressures. In addition, at higher levels of charge pressures, the operable pressure range tends to widen.
The engine mostly operates near the predicted pressure, i.e., the crossing point of natural frequency curves of PP and DP. The experiment frequencies are also approximately 3 Hz lower than the predicted values with an error around 10%. The working frequencies are relatively constant for all the cases since the DP mass and stiffness are fixed.
Figure 10 shows a comparison of the experimental results with the simple vibration analyses in terms of working frequency and piston strokes over charge pressures for cases 1–5. The upper and lower parts in each figure compare the measured piston strokes and working frequencies with the real and imaginary part values, respectively.
Especially, the experiment case 3 shows the measured operable range of charge pressures from 13 bar to 17 bar, and the predicted root-zero pressure of 11 bar and root-switch pressure of 14 bar are near the measured pressure range. The measured working frequencies around 33 Hz are close to the imaginary part line around 36 Hz.
In detail, the measured operable ranges of charge pressures locate around or slightly above the root-switch pressures, instead of the root-zero pressures where the real part becomes positive. The piston amplitudes show a tendency to increase with the real part values. The predicted operating frequencies are ~3 Hz higher than the measurements with an error less than 10%.
The changes in the experiment factors of PP mass and PP spring stiffness lead to large variations in the operable charge pressures from 6 bar to 31 bar. The increases in the PP mass shift the operable charge pressures to the right, as in cases 1 and 2 and cases 4 and 5, while the PP stiffness increases result in the opposite, shown in cases 1 to 4 and 2 to 5.
Under the simultaneous decreases in the PP spring stiffness and increases in the PP mass, as in cases of 4, 3, and 2, the real part values increase with higher operable charge pressure. These results imply a proportional relationship of the charge pressure to the strength of resonance in piston motions. Note that higher real part values lead to increase in the speed of divergence of piston motions.
Figure 11 shows the comparison of the experiments with the two dynamic model predictions in terms of the mid-point operable charge pressure and the operating frequency for all the cases 1–5. The root locus predictions employ two criterion of real part zero and root switch for the FPSE operability.
Regarding the operable charge pressure, both the simple vibration analyses and the root locus predictions based on the root switch criterion agree very well with the experiments with an average error ~10%. On the other hand, the criterion of real part zero does not show reasonable and consistent prediction accuracies with an average error ~40%. For the working frequencies, all the models show good agreements with the experiments with a consistent error around 10%. Table 4 and Table 5 summarize the comparison results.
7. Discussions on FPSE Resonance with Phase Angle
The resonant operation of FPSEs is discussed with the DP–PP phase angle using the force vector diagram and the root locus analysis.
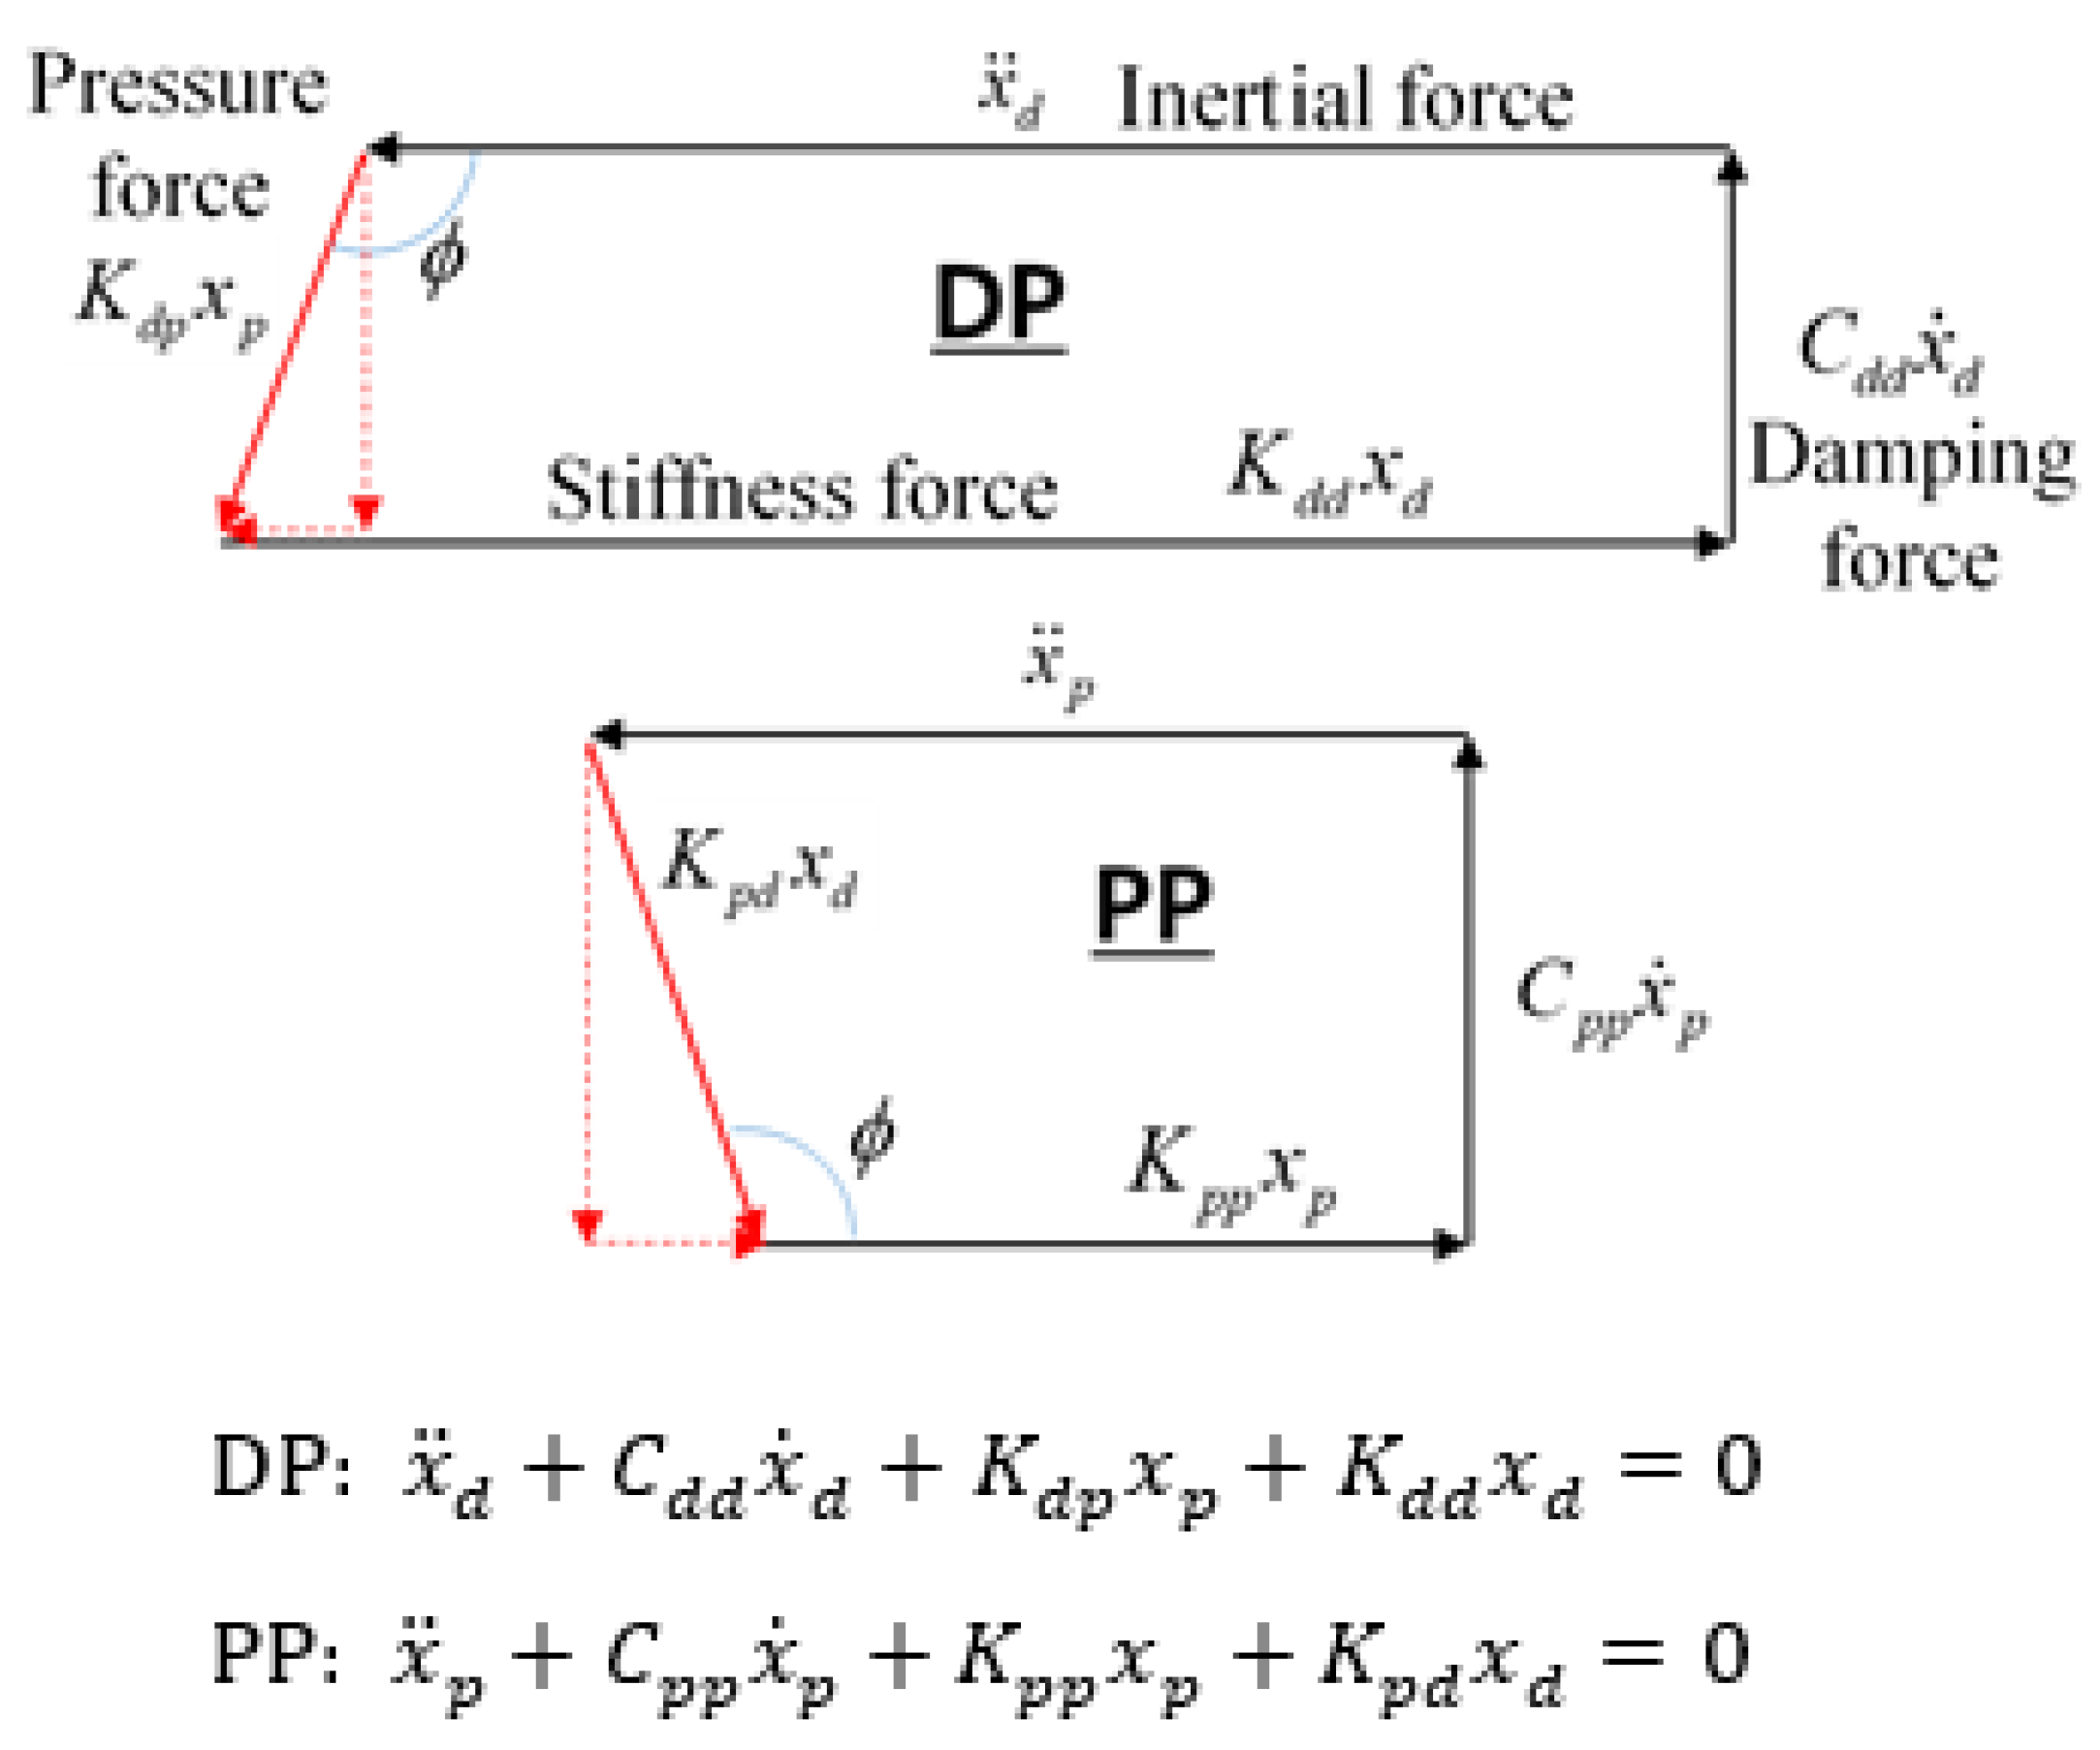
Figure 12 shows the force vector diagrams of the DP and PP, which are drawn from the linearized EOMs in Equation (7). The force vector diagram is composed of the inertial force, damping force, stiffness force, and pressure force, which is frequently used in the FPSE dynamics analyses [26,27,28]. In order to maintain a finite amplitude vibration, called also as limit cycle, the pressure force overcomes the damping force: the flow resistance of heat exchanger part for DP and the external load damping of linear alternator for PP. In addition, the inertial and stiffness forces must balance for the mechanical kinetic and potential energy conservation.
Interestingly, the pressure force of each piston is represented by the cross-coupling pressure stiffness force caused by the other piston displacement. Therefore, the phase angle between the excitation force and piston displacement becomes identical to the DP–PP phase angle.
For example, in the case of DP with a phase angle greater than 90°, the pressure force can be divided into the vertical component in the opposite direction to the damping force and the horizontal component in the same direction of the inertial force. Therefore, the vertical component is used to overcome the damping force, while the horizontal component assists the inertial force to balance the stiffness force. If the phase angle is less than 90°, the horizontal component assists the stiffness force. In particular, when the phase angle is 90°, the pressure force is used solely to overcome damping load without being used for the balance of inertial and stiffness forces.
In the same way, as the charge pressure increases in the PP vector diagram, the direct stiffness force of PP increases (see Figure 5) and thus the phase angle decreases. Consequently, the DP–PP phase angle becomes 90°, resulting in a resonant vibration condition. Note that the Kpd has a negative value and the DP motion is in the opposite direction to the pressure force. Therefore, the DP motion is ahead of the PP by the phase angle, which is the same as that of the DP vector diagram.
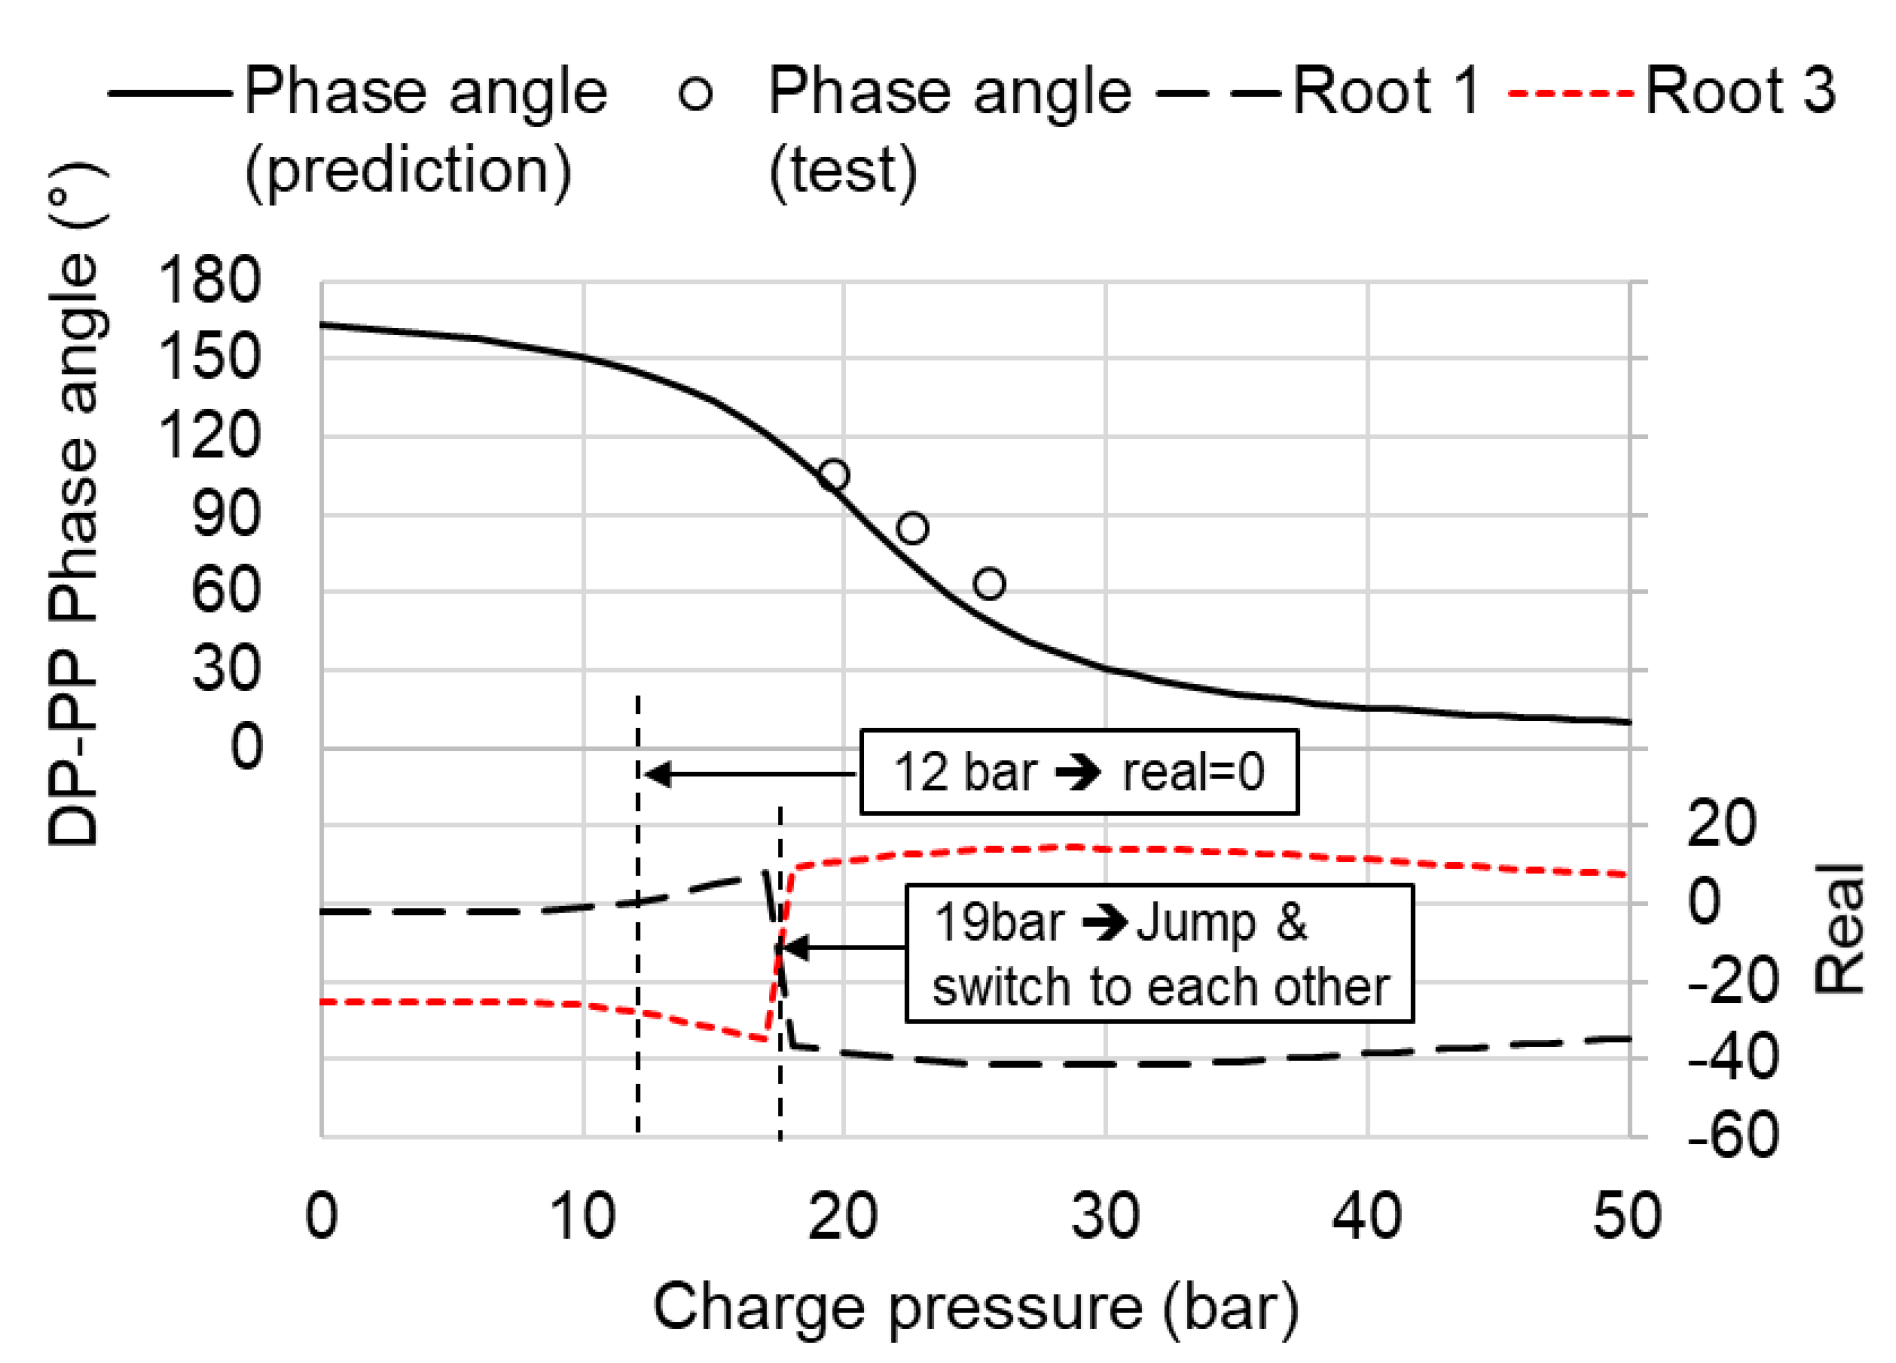
Figure 13 show the predicted DP–PP phase angle and corresponding real part values of Roots 1 and 3 over charge pressures of 0–50 bar for experiment case 1, along with measurements. The phase angle is defined with the zero cross-coupling damping terms, and given as [11]:
As a result, the predicted DP–PP phase angle decreases from 180° to 0° with increasing charge pressures, and at a phase angle of 90°, the root switch occurs. The measured phase angles follow well the predictions. The engine started to operate above the root-switch pressure of 19 bar with a phase angle of 105°and stopped at charge pressure of 26 bar with a phase angle of 60°.
Figure 14 shows the measured DP–PP phase angle for all the cases, 1–5. All the he DP–PP phase angles decrease with increasing charge pressures, and the DP–PP phase angles becomes 90° near the predicted root-switch pressures, shown as the filled points. Eventually, the test FPSE is operable in the range of DP–PP phase angle from 120° to 60°, and operates optimally with the phase angle of 90° in the resonant condition. Note that high performance FPSEs are known to have the phase angle of 50°–60° due to high flow friction in the heat exchanger part for heat transfer performance [29].
8. Conclusions
This paper presents a linear dynamic analysis of beta-type FPSEs on the operable charge pressure and working frequency along with experimental verifications.
The equations of motion of a FPSE are formulated as a 2-DOF vibration system of the PP and DP based on the state equation of ideal gas and the isothermal Stirling cycle model. Each piston is modeled to have a flexure spring and a direct damping. The internal working pressure, which couples the PP and DP motions, are linearized and consequently becomes pressure stiffness terms in the stiffness matrix.
The dynamic models of FPSE that we considered are (1) the 1-DOF simple vibration model of each piston and (2) the 2-DOF root locus model of coupled pistons. The simple vibration model assumes that the engine operates when two natural frequencies of each piston are equal. The root locus method predicts the operating point based on root trajectories in the state space.
We developed a test FPSE for the verification of the dynamic models, and conducted a series of experiments to measure the dynamics behavior of PP and DP under varying charge pressures for various masses and stiffness of the PP.
As a result, an operable range of charge pressure existed during operations of the test FPSE under varying charge pressures. The increases in the PP mass led to increases in the operable charge pressure, while the PP stiffness yielded the opposite results. The working frequencies are not affected by those changes.
Both the prediction models showed good agreements with experimental results. The 1-DOF vibration model was found to be simple and effective for predicting the operating frequency and charge pressure of FPSE. Likewise, the root locus method showed high predictions with the operation criterion of the DP–PP phase angle of 90°, where the root switch occurs. It was found that DP tends to determine the operating frequency and PP does the operable charge pressure.
In addition, the FPSE was confirmed to operate in resonant oscillations when the DP-PP phase angle is 90°, based on the analysis of the force vector diagram of two pistons. In the resonant operation, the cross-coupling effects of piston motions are maximized, and the pressure force is used solely to overcome damping loads without being used to balance the other inertial and stiffness forces.
Finally, the dynamic model developed in this paper can be used in terms of FPSE design and testing by predicting the operating frequency and charge pressure with the FPSE design parameters including the piston mass and spring stiffness, so as to satisfy design specifications or to setup testing conditions. In particular, it can be very helpful in testing with variable piston mass and spring stiffness for engine development and optimization.
Author Contributions
Conceptualization, K.S.; methodology, K.S.; software, D.-J.K.; validation, D.-J.K. and K.S.; formal analysis, D.-J.K.; investigation, D.-J.K.; writing—original draft preparation, D.-J.K.; writing—review and editing, K.S.; supervision, K.S. Both authors have read and agreed to the published version of the manuscript.
Funding
This study was supported by the research program funded by SeoulTech (Seoul National University of Science and Technology).
Conflicts of Interest
The authors declare no conflict of interest.
Nomenclature
| A | Cross-sectional area (m2) |
| C | System damping coefficient (N∙s/m) |
| Celec,load | Load capacitance (F) |
| c | Damping coefficient (N∙s/m) |
| K | System stiffness coefficient (N/m) |
| Kelec | Electro-mechanical coupling constant (N/A) |
| k | Stiffness coefficient (N/m) |
| Lelec,alt | Alternator inductance (H) |
| m | Mass (kg) |
| P | Pressure (N/m2) |
| R | Gas constant (J/kg·°C) |
| Relec,alt | Alternator resistance (Ω) |
| Relec,load | Load resistance (Ω) |
| T | Temperature (°C) |
| V | Working space volume (m3) |
| x | Displacement (m) |
| z | State variable (m) |
| ɣ | Specific heat ratio of working gas |
| ζ | Damping ratio |
| ω | Frequency (Hz) |
| ωalt | Linear alternator design frequency (Hz) |
| ωdd,d | Displacer piston’s damped natural frequency, ignoring the cross-coupling terms of linearized equations of motion (Hz) |
| ωpp,d | Power piston’s damped natural frequency ignoring cross-coupling terms of linearized equations of motion (Hz) |
| Subscripts | |
| 0 | Static equilibrium state |
| B | Bounce space |
| C | Compression space |
| c | Charge |
| d | Displacer piston |
| dd | Displacer piston’s direct term in linearized equations of motion |
| dp | Displacer piston’s cross-coupling term in linearized equations of motion |
| E | Expansion space |
| gas | Working gas |
| H | Hot heat exchanger space |
| K | Cold heat exchanger space |
| p | Power piston |
| pp | Power piston’s direct term in linearized equations of motion |
| pd | Power piston’s cross-coupling term in linearized equations of motion |
| R | Regenerator space |
| r | Displacer rod |
References
- Thimsen, D. Stirling Engine Assessment; Techreport 1007317; EFRI: Palo Alto, CA, USA, 2002. [Google Scholar]
- Romanelli, A. Alternative thermodynamic cycle for the Stirling machine. Am. J. Phys. 2017, 85, 926–931. [Google Scholar] [CrossRef]
- Thomas, B. Benchmark testing of Micro-CHP unit. Appl. Therm. Eng. 2008, 28, 2049–2054. [Google Scholar] [CrossRef]
- González-Pino, I.; Campos-Celador, A.; Pérez-Iribarren, E.; Terés-Zubiaga, J.; Sala, J.M. Parametric study of the operational and economic feasibility of Stirling micro-cogeneration devices in Spain. Appl. Therm. Eng. 2014, 71, 821–829. [Google Scholar] [CrossRef]
- Dentice d’Accadia, M.; Sasso, M.; Sibilio, S.; Vanoli, L. Micro-combined heat and power in residential and light commercial applications. Appl. Therm. Eng. 2003, 23, 1247–1259. [Google Scholar] [CrossRef]
- Formosa, F. Coupled thermodynamic–dynamic semi-analytical model of free piston Stirling engines. Energy Convers. Manag. 2011, 52, 2098–2109. [Google Scholar] [CrossRef] [Green Version]
- Beale, W. Stirling Cycle Type Thermal Device. U.S. Patent 3,552,120, 5 March 1971. [Google Scholar]
- Benvenuto, G.; De Monte, D.; Farina, F. Dynamic Behaviour Prediction of Free-piston Stirling Engines. In Proceedings of the 25th Energy Conversion Engineering Conference, Reno, NV, USA, 12–17 August 1990; pp. 346–351. [Google Scholar] [CrossRef]
- Zare, S.; Tavakolpour-Saleh, A. Free piston Stirling engines: A review. Int. J. Energy Res. 2019, 44, 5039–5070. [Google Scholar] [CrossRef]
- Wood, J.G.; Lane, N. Advanced 35 W Free-Piston Stirling Engine for Space Power Applications. In Proceedings of the Space Technology and Applications International Forum, Albuquerque, NM, USA, 17 January 2003; pp. 662–667. [Google Scholar] [CrossRef]
- Urieli, I.; Berchowitz, D.M. Stirling Cycle Engine Analysis; Adam Hilger Ltd.: Bristol, UK, 1984; pp. 51–69. [Google Scholar]
- Schreiber, J.G.; Geng, S.M.; Lorenz, G.V. RE-1000 Free-Piston Stirling Engine Sensitivity Test Results; Final Report TM-88846; NASA: Cleveland, OH, USA, 1986.
- Redlich, R.W.; Berchowitz, D.M. Linear Dynamics of Free-Piston Stirling Engines. Proc. Inst. Mech. Eng. Part A Power Process Eng. 1985, 199, 203–213. [Google Scholar] [CrossRef]
- Hofacker, M.E.; Tucker, J.M.; Barth, E.J. Modeling and validation of free-piston Stirling engines using impedance controlled hardware-in-the-loop. In Proceedings of the ASME Dynamic Systems and Control Conference, Arlington, VA, USA, 31 October–2 November 2011. Paper No: DSCC2011-6105. [Google Scholar] [CrossRef]
- Mou, J.; Lin, M.; Chi, C.; Hong, G. Startup and dynamic analysis of free piston Stirling engine. In Proceedings of the 27th International Cryogenics Engineering Conference and International Cryogenic Material Conference, Oxford, UK, 3–7 September 2019; p. 012019. [Google Scholar] [CrossRef]
- Zare, S.; Tavakolpour-Saleh, A.R.; Sangdani, M.H. Investigating limit cycle in a free piston Stirling engine using describing function technique and genetic algorithm. Energy Convers. Manag. 2020, 210, 112706. [Google Scholar] [CrossRef]
- Masoumi, A.P.; Tavakolpour-Saleh, A.R. Experimental assessment of damping and heat transfer coefficients in an active free piston Stirling engine using genetic algorithm. Energy 2020, 195, 117064. [Google Scholar] [CrossRef]
- Ye, W.; Wang, X.; Liu, Y. Application of artificial neural network for predicting the dynamic performance of a free piston Stirling engine. Energy 2020, 194, 116912. [Google Scholar] [CrossRef]
- Tavakolpour-Saleh, A.R.; Zare, S.h.; Omidvar, A. Applying perturbation technique to analysis of a free piston Stirling engine possessing nonlinear springs. Appl. Energy 2016, 183, 526–541. [Google Scholar] [CrossRef]
- Karabulut, H. Dynamic analysis of a free piston Stirling engine working with closed and open thermodynamic cycles. Renew. Energy 2011, 36, 1704–1709. [Google Scholar] [CrossRef]
- Schmidt, G. Theorie der Lehmannschen Calorischen Maschine. Z. Ver. Dtsch. Ingenieus 1871, 15, 1–12. [Google Scholar]
- Riofrio, J.A.; Al-Dakkan, K.; Hofacker, M.K.; Barth, E.J. Control-Based Design of Free-Piston Stirling Engine. In Proceedings of the American Control Conference, Seattle, WA, USA, 11–13 June 2008; pp. 1533–1538. [Google Scholar] [CrossRef]
- Sim, K.; Kim, D.J. Development and Performance Measurements of a Beta-Type Free-Piston Stirling Engine Along with Dynamic Model Predictions. J. Eng. Gas Turbines Power 2017, 139, 112806. [Google Scholar] [CrossRef]
- Griffiths, D.J. Introduction to Electrodynamics, 3rd ed.; Prentice Hall: Upper Saddle River, NJ, USA, 1999; pp. 285–344. ISBN 978-013-805-326-0. [Google Scholar]
- Rao, S.S. Mechanical Vibration, 5th ed.; Pearson-Prentice Hall: Upper Saddle River, NJ, USA, 2010; pp. 158–164. ISBN 978-013-212-819-3. [Google Scholar]
- Berchowitz, D.M. A phasor description of the Stirling Cycle. In Proceedings of the International Stirling engine Conference, Newcastle, UK, 24–26 August 2016; pp. 1–11. [Google Scholar]
- Mou, J.; Li, W.; Li, J.; Hong, G. Gas action effect of free piston Stirling engine. Energy Convers. Manag. 2016, 110, 278–286. [Google Scholar] [CrossRef]
- Chen, P.; Yang, P.; Liu, L.; Liu, Y. Parametric investigation of the phase characteristics of a beta-type free piston Stirling engine based on a thermodynamic-dynamic coupled model. Energy 2021, 219, 119658. [Google Scholar] [CrossRef]
- Neill, W.L.; William, T.B. Free-piston Stirling design features. In Proceedings of the International Stirling Engine Conference, Ancona, Italy, 27–30 May 1997; pp. 1–10. [Google Scholar]
Figure 1.
Conceptual diagram of a beta-type free-piston Stirling engine (FPSE) with an external load: (a) schematic layout of the engine and (b) a free-body diagram of the pistons.
Figure 1.
Conceptual diagram of a beta-type free-piston Stirling engine (FPSE) with an external load: (a) schematic layout of the engine and (b) a free-body diagram of the pistons.

Figure 2.
Test FPSE developed by the institute and its test rig: (a) cross-sectional drawing of the test FPSE with sensors, (b) manufactured FPSE inside casing, and (c) the test rig with an electric heater and an external electric load.
Figure 2.
Test FPSE developed by the institute and its test rig: (a) cross-sectional drawing of the test FPSE with sensors, (b) manufactured FPSE inside casing, and (c) the test rig with an electric heater and an external electric load.

Figure 3.
Static load-deflection tests of flexure spring: (a) manufactured spring, (b) measured force–displacement during consecutive pushes and pulls, and (c) the test rig using a lathe.
Figure 3.
Static load-deflection tests of flexure spring: (a) manufactured spring, (b) measured force–displacement during consecutive pushes and pulls, and (c) the test rig using a lathe.

Figure 4.
Prediction of the load damping coefficient and average damping ratio for cases 1–5 at increasing load resistances.
Figure 4.
Prediction of the load damping coefficient and average damping ratio for cases 1–5 at increasing load resistances.

Figure 5.
Predicted (a) system stiffness and (b) damping coefficients with charge pressure increasing from 0 to 50 bar for case 3.
Figure 5.
Predicted (a) system stiffness and (b) damping coefficients with charge pressure increasing from 0 to 50 bar for case 3.

Figure 6.
Predicted PP and DP damped natural frequencies with charge pressure increasing from 0 to 50 bar for case 3.
Figure 6.
Predicted PP and DP damped natural frequencies with charge pressure increasing from 0 to 50 bar for case 3.

Figure 7.
(a) Root locus trajectory with charge pressure increasing from 0 to 50 bar for case 3 and (b) real and imaginary values of upper poles (roots 1 and 3).
Figure 7.
(a) Root locus trajectory with charge pressure increasing from 0 to 50 bar for case 3 and (b) real and imaginary values of upper poles (roots 1 and 3).

Figure 8.
Measured (a) temperatures, (b) working pressure, and (c,d) DP and PP displacements for decreasing control pressures of 18, 15, and 12 bar under a load resistance of 80 Ω for case 3.
Figure 8.
Measured (a) temperatures, (b) working pressure, and (c,d) DP and PP displacements for decreasing control pressures of 18, 15, and 12 bar under a load resistance of 80 Ω for case 3.

Figure 9.
Comparison of experimental and the simple vibration analysis results for cases 1–5. Predicted PP and DP damped natural frequencies with increasing charge pressure of 0–50 bar (prediction) and the operable pressure ranges, the frequency, and the two piston strokes (experiment) are given.
Figure 9.
Comparison of experimental and the simple vibration analysis results for cases 1–5. Predicted PP and DP damped natural frequencies with increasing charge pressure of 0–50 bar (prediction) and the operable pressure ranges, the frequency, and the two piston strokes (experiment) are given.

Figure 10.
Comparison of root locus analyses with experiments for cases 1–5. The real and imaginary parts of the upper pole (eigenvalue 1, 3) with increasing charge pressure of 0–50 bar (prediction) and the operable pressure ranges, the frequency, and the two piston strokes (experiment) are given.
Figure 10.
Comparison of root locus analyses with experiments for cases 1–5. The real and imaginary parts of the upper pole (eigenvalue 1, 3) with increasing charge pressure of 0–50 bar (prediction) and the operable pressure ranges, the frequency, and the two piston strokes (experiment) are given.

Figure 11.
Comparison of experiments with two dynamic model predictions for all the cases 1–5: (a) mid-point operable charge pressure and (b) operating frequency.
Figure 11.
Comparison of experiments with two dynamic model predictions for all the cases 1–5: (a) mid-point operable charge pressure and (b) operating frequency.

Figure 12.
Force vector diagrams for the DP and PP, based on the linearized EOM in Equation (7).

Figure 13.
Predicted and measured DP–PP phase angles and real part values of roots 1 and 3 with charge pressures of 0–50 bar for case 1.
Figure 13.
Predicted and measured DP–PP phase angles and real part values of roots 1 and 3 with charge pressures of 0–50 bar for case 1.

Figure 14.
Measured DP–PP phase angle of test FPSE with increasing charge pressures for experiment cases 1–5.
Figure 14.
Measured DP–PP phase angle of test FPSE with increasing charge pressures for experiment cases 1–5.


Table 1.
Dimensions and specifications of the test FPSE (working gas is air).
| Parameters | Values |
|---|---|
| Mass of PP, mp | 3.60 kg |
| Mass of DP, md | 1.64 kg |
| Stiffness of PP spring, kp | 84 kN/m |
| Stiffness of DP spring, kd | 84 kN/m |
| Diameter of PP & DP | 84 mm |
| Cross-sectional area of PP and DP, Ap and Ad | 56 cm2 |
| Cross-sectional area of DP rod, Ar | 4 cm2 |
| Hot and cold heat exchanger space volumes, VH and VK | 87 cm3 |
| Regenerator space volume, VR | 274 cm3 |
| Regenerator porosity (screen wire mesh type) | 87% |
| Expansion space volume at static equilibrium, VE0 | 144 cm3 |
| Compression space volume at static equilibrium, VC0 | 133 cm3 |
| Bounce space volume at static equilibrium, VB0 | 52,000 cm3 |
| Gas constant of working gas (air), Rgas | 287 J/kg·°C |
| Specific heat ratio of working gas (air), ɣ | 1.4 |
Table 2.
Experimental design with parameters of PP mass and PP spring stiffness (DP mass of 1.64 kg and DP stiffness of 84 kN/m for all cases).
Table 2.
Experimental design with parameters of PP mass and PP spring stiffness (DP mass of 1.64 kg and DP stiffness of 84 kN/m for all cases).
| PP Mass (kg) | ||||
|---|---|---|---|---|
| 3.3 | 3.6 | 3.9 | ||
| PP stiffness (kN/m) | 42 | Case 1 | - | Case 2 |
| 84 | - | Case 3 (ref.) | - | |
| 126 | Case 4 | - | Case 5 | |
Table 3.
Design parameters of the linear alternator.
| Parameters | Values |
|---|---|
| Electromechanical coupling coefficient, Kelec | 119.0 N/A |
| Internal resistance of the linear alternator, Relec,alt | 1.62 Ω |
| Load capacitance, Celec,load | 90 μF |
| Inductance of the linear alternator, Lelec,alt | 0.273 H |
| Linear alternator design frequency, ωalt | 30 Hz |
Table 4.
Comparison of experiments with two dynamic model predictions for all the cases 1–5: mid-point operable charge pressure.
Table 4.
Comparison of experiments with two dynamic model predictions for all the cases 1–5: mid-point operable charge pressure.
| Case | Experiment | Simple Vibration | Root Locus (Root Switch) | Root Locus (Real = 0) | |||
|---|---|---|---|---|---|---|---|
| Pressure (bar) | Pressure (bar) | Error | Pressure (bar) | Error | Pressure (bar) | Error | |
| 1 | 22.5 | 19.8 | 12.1% | 19.5 | 13.4% | 12.1 | 46.3% |
| 2 | 28.0 | 24.3 | 5.8% | 23.4 | 16.5% | 15.0 | 46.5% |
| 3 | 15.0 | 15.8 | 5.6% | 14.4 | 3.8% | 10.9 | 27.2% |
| 4 | 7.1 | 7.2 | 2.0% | 6.8 | 3.6% | 12.3 | 74.3% |
| 5 | 10.9 | 11.5 | 5.1% | 12.0 | 9.6% | 10.0 | 8.6% |
Table 5.
Comparison of experiments with two dynamic model predictions for all the cases 1–5: operating frequency.
Table 5.
Comparison of experiments with two dynamic model predictions for all the cases 1–5: operating frequency.
| Case | Experiment | Simple Vibration | Root Locus (Root Switch) | Root Locus (Real = 0) | |||
|---|---|---|---|---|---|---|---|
| Frequency (Hz) | Frequency (Hz) | Error | Frequency (Hz) | Error | Frequency (Hz) | Error | |
| 1 | 31.3 | 34.9 | 11.3% | 35.0 | 11.7% | 34.8 | 11.2% |
| 2 | 30.8 | 34.7 | 12.5% | 34.7 | 12.6% | 34.2 | 11.0% |
| 3 | 32.0 | 35.1 | 9.9% | 35.2 | 10.3% | 35.2 | 10.0% |
| 4 | 32.2 | 35.6 | 10.6% | 35.8 | 11.2% | 35.8 | 11.2% |
| 5 | 32.2 | 35.3 | 9.6% | 35.4 | 10.0% | 35.5 | 10.1% |
Publisher’s Note: MDPI stays neutral with regard to jurisdictional claims in published maps and institutional affiliations. |
© 2021 by the authors. Licensee MDPI, Basel, Switzerland. This article is an open access article distributed under the terms and conditions of the Creative Commons Attribution (CC BY) license (https://creativecommons.org/licenses/by/4.0/).
Share and Cite
MDPI and ACS Style
Kim, D.-J.; Sim, K. Linear Dynamic Analysis of Free-Piston Stirling Engines on Operable Charge Pressure and Working Frequency along with Experimental Verifications. Appl. Sci. 2021, 11, 5205. https://doi.org/10.3390/app11115205
AMA Style
Kim D-J, Sim K. Linear Dynamic Analysis of Free-Piston Stirling Engines on Operable Charge Pressure and Working Frequency along with Experimental Verifications. Applied Sciences. 2021; 11(11):5205. https://doi.org/10.3390/app11115205
Chicago/Turabian StyleKim, Dong-Jun, and Kyuho Sim. 2021. "Linear Dynamic Analysis of Free-Piston Stirling Engines on Operable Charge Pressure and Working Frequency along with Experimental Verifications" Applied Sciences 11, no. 11: 5205. https://doi.org/10.3390/app11115205
Note that from the first issue of 2016, this journal uses article numbers instead of page numbers. See further details here.