
Using Amorphous CoB Alloy as Transducer to Detect Acoustic Propagation and Heat Transport at Interface


1
Department of Energy Science, Sungkyunkwan University, Suwon 16419, Korea
2
Center for Integrated Nanostructure Physics, Institute for Basic Science (IBS), Suwon 16419, Korea
*
Author to whom correspondence should be addressed.
Appl. Sci. 2021, 11(11), 5155; https://doi.org/10.3390/app11115155
Submission received: 27 April 2021
/
Revised: 31 May 2021
/
Accepted: 31 May 2021
/
Published: 1 June 2021
(This article belongs to the Topic Metallurgical and Materials Engineering)
Abstract
:Featured Application
The use of an amorphous CoB alloy for the transducer layer to measure the acoustic and thermal properties of the soft layer.
Abstract
Acoustic oscillation provides useful information regarding the interfacial coupling between metal transducer layers and substrate materials. The interfacial coupling can be significantly reduced by a mechanically soft layer between the transducer and substrate. However, preserving a thin, soft layer at the interface during fabrication is often challenging. In this study, we demonstrate that an amorphous CoB alloy on top of a sapphire substrate can substantially amplify acoustic oscillations. By analyzing the attenuation of acoustic oscillations, we show that a thin, soft layer with a thickness of >2 ± 1 Å exists at the interface. The intermediate layer at the interface is further verified by investigating heat transport. By analyzing the slow decrease of the temperature of the transducer layer, we determine a thermal conductance of 35 ± 5 MW m−2 K−1 at the transducer/substrate interface. This low value supports the existence of a thin, soft layer at the interface. Our results demonstrate that an amorphous metal with B alloying effectively preserves the soft nature at the interface and detects the acoustic propagation and heat transport across it.
1. Introduction
An acoustic wave is the propagation of strain in a condensed matter, and its propagation speed is determined by the group velocity of low-energy phonons; that is, the speed of sound. Time-resolved measurements of acoustic waves based on short-pulsed lasers, a time-resolved measurement of acoustic waves, often called “picosecond acoustics” or “picosecond ultrasonics”, have been employed to investigate thickness information [1,2,3,4,5], elastic properties [6,7,8,9,10], phonon properties [11,12,13,14,15], and interfacial quality [16,17,18,19]. For example, a time delay between acoustic echoes can be used to accurately determine the thickness of a metal layer on top of an insulating substrate [1,2,3,4,5]. In addition, the interfacial quality between two layers has been investigated from the perspectives of the amplitude and attenuation of acoustic waves [16,17,18,19]. To obtain a strong acoustic signal, a large acoustic mismatch is required. However, many condensed solid phases have a similar acoustic impedance, and acoustic oscillations are often suppressed. Inserting a mechanically soft layer with a small acoustic impedance between two layers can enhance acoustic oscillations, but a soft layer with a thickness of a few nanometers is prone to fabrication damage.
A thin, soft layer at the interface affects not only acoustic propagation but also heat transport. A relatively well-studied system is the strongly coupled interface between two hard materials, such as metals and oxides; thermal conductances at interfaces have been explained by phonon scattering at interfaces and the phonon spectrum of constituent materials [20,21,22,23]. A weakly coupled interface has been achieved by inserting a thin polymer or two-dimensional material at the interface [19,24]. It has been reported that the thermal conductance of the weakly coupled interface strongly depends on the stiffness of interfacial bonds [24,25]. However, the intrinsic nature of interfacial bonds may depend on the preparation method for the insertion layer [26] and the deposition process for the transducer layer.
In this work, we use the Co50B50 (atomic %) alloy as a transducer to detect the propagation of acoustic waves and thermal energy across an interface. Boron (B) is a glass-forming element, and alloying it with a ferromagnetic metal, such as Co, Fe, and Ni, results in an amorphous structure. The amorphous ferromagnet shows improved magnetic properties, such as higher magnetic susceptibility, smaller coercivity, and a smaller eddy current [27]. In addition, amorphous metals can have improved mechanical properties, such as high tensile yield strengths, high elastic strain limits, and a smooth interface with an underlying oxide [28,29]. In this work, we demonstrate that the Co50B50 transducer can drastically enhance acoustic waves compared to the single element of Co. The strong acoustic oscillation results from a soft intermediate layer between Co50B50 and the substrate. By analyzing the frequency and damping of acoustic oscillations using acoustic modeling, we determine the thickness of the intermediate layer to be >2 ± 1 Å. We expect that the soft intermediate layer is preserved by low kinetic damage during the Co50B50 deposition.
We also investigate the heat transport at the interface by measuring the temperature response of the Co50B50 transducer. Owing to its magnetic property, we were able to collect the temperature response of the transducer without contamination by any signal from the substrate. By analyzing the temperature response using thermal modeling, we determine the interfacial thermal conductance of 35 ± 5 MW m−2 K−1, which is one order of magnitude smaller than that of the strongly coupled interface. This low thermal conductance supports the existence of the thin, soft layer at the interface. Our results show that the amorphous Co50B50 alloy is an ideal choice for a transducer layer to investigate acoustic propagation and heat transport across a thin, soft layer.
2. Materials and Methods
We fabricated the sap/Co (10 nm)/Pt (2 nm) and sap/Co50B50/(5~15 nm)/Pt (4 nm) structure using a magnetron sputter with a base pressure of <2 × 10⁻⁷ Torr. The sap layer was a sapphire substrate with an orientation of (0001). The Co or Co50B50 layer acted as a transducer for acoustic waves. The Pt layer acted as a layer that protected Co or Co50B50 from oxidation. All metal layers were deposited with an Ar pressure of 3 mTorr, a target-to-substrate distance of 100 mm, and a typical deposition rate of 0.02 nm s−1. The deposition rate of each layer was predetermined with a single, thick layer, whose thickness was determined by X-ray reflectivity measurements; then, the thickness of each layer was controlled by deposition time. We used a pure element target for the deposition of the Co and Pt layers and a CoB alloy target with an equiatomic composition for deposition of the Co50B50 layer. All layers were deposited at room temperature. The lateral sizes of all samples were around 10 mm.
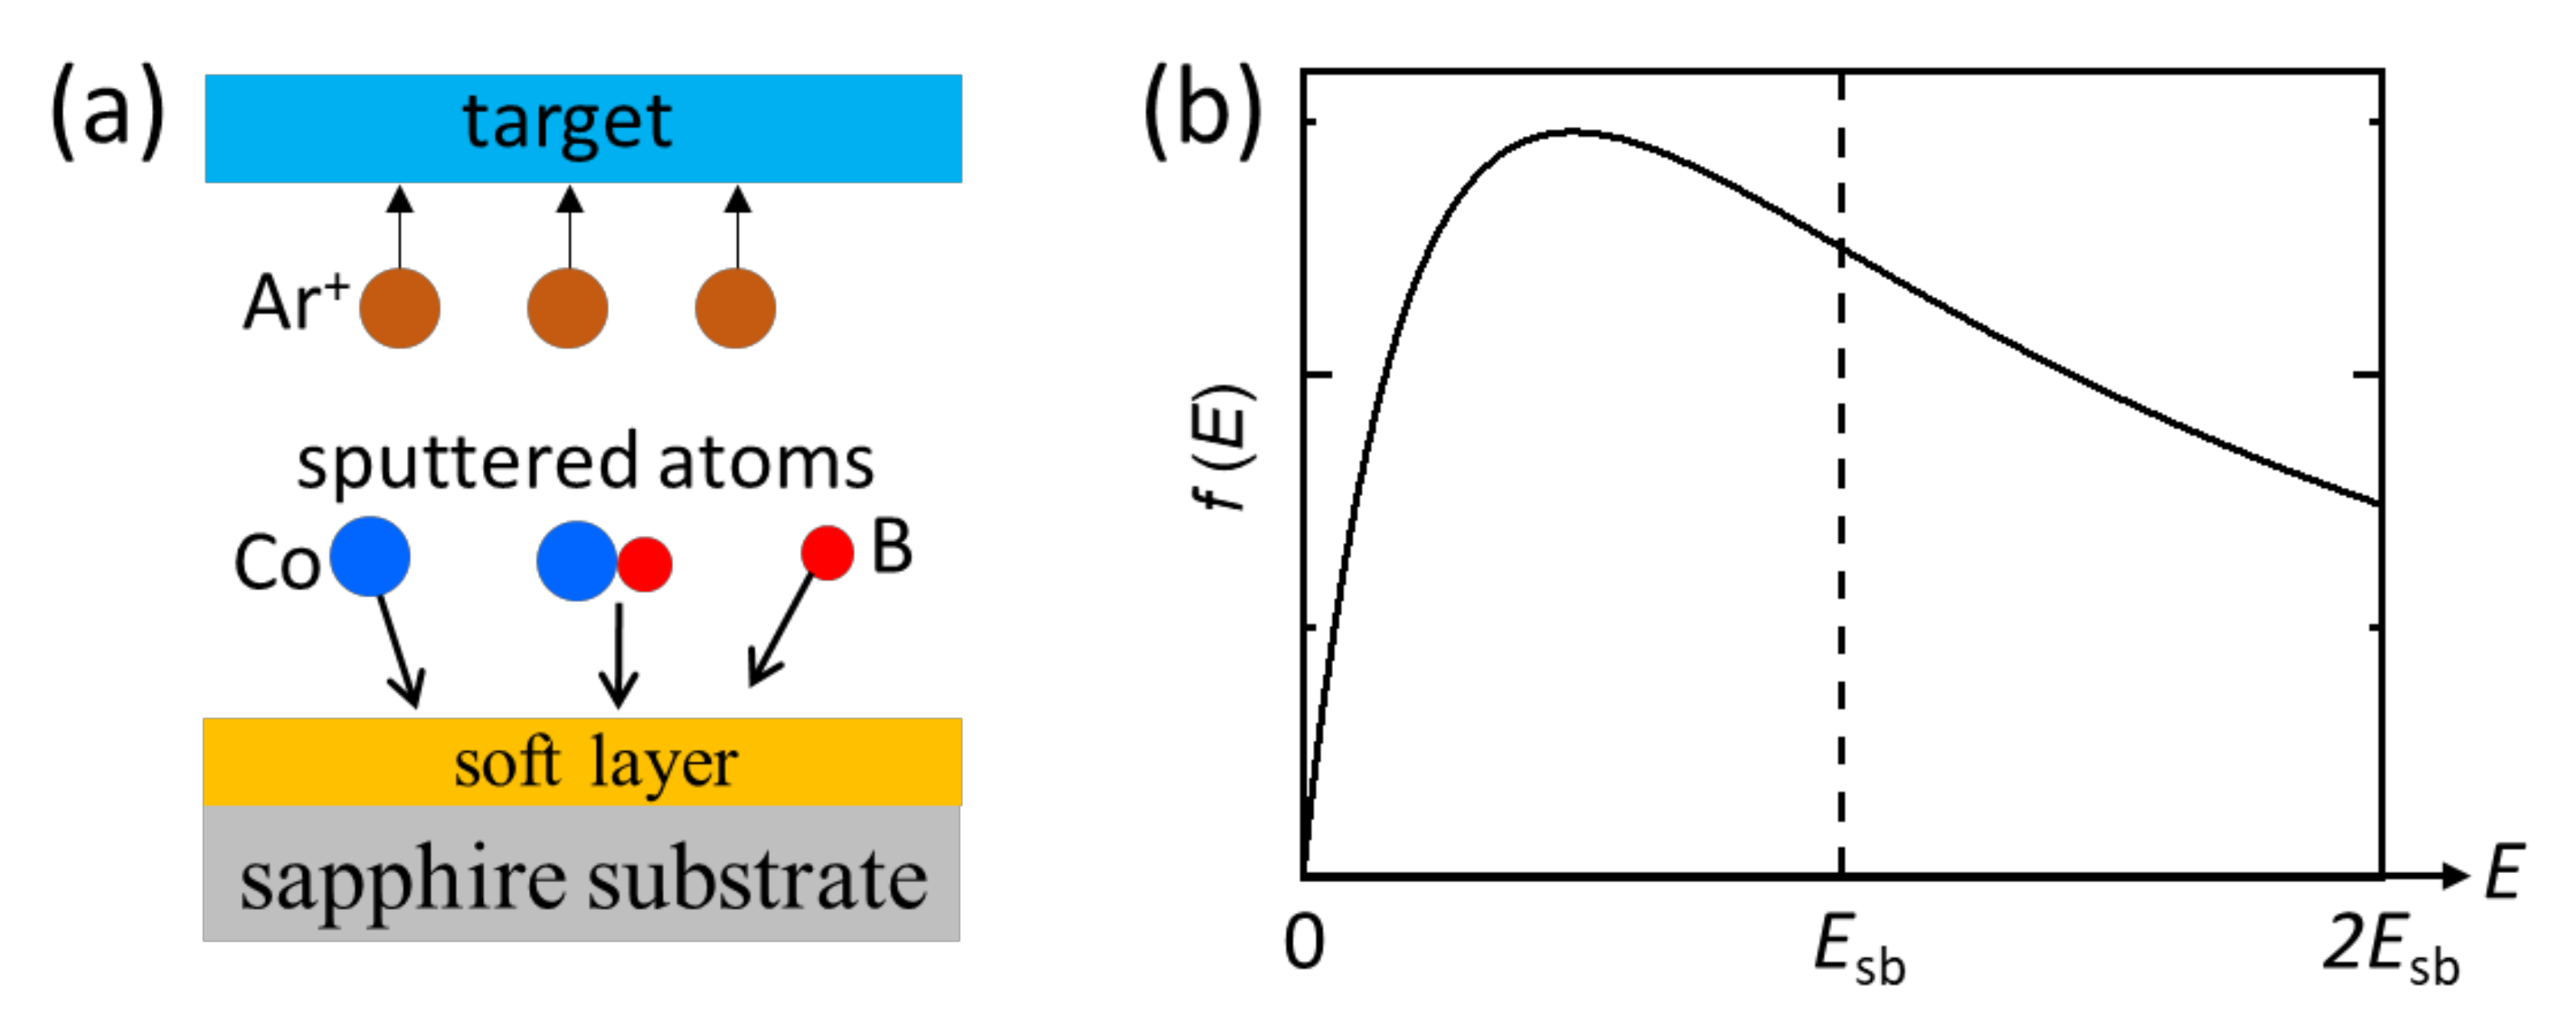
We did not use a special treatment, such as chemical cleaning or pre-annealing, for the substrate. Therefore, a thin, soft layer, such as a polymer, naturally formed on top of the substrate. However, such a thin, soft layer is usually destroyed during the sputtering process because of the high kinetic energy of the sputtered elements, and thus a strong coupling between the deposited layer and substrate is usually achieved. The kinetic energy of the sputtered elements depends critically on the surface binding energy, as follows:
where f(E) is the number fraction of sputtered elements, E is the kinetic energy of the sputtered elements, and Esb is the surface binding energy of the target material with a typical magnitude of a few electronvolts [30]. The schematics for the sputtering process and energy distribution of sputtered elements are shown in Figure 1.
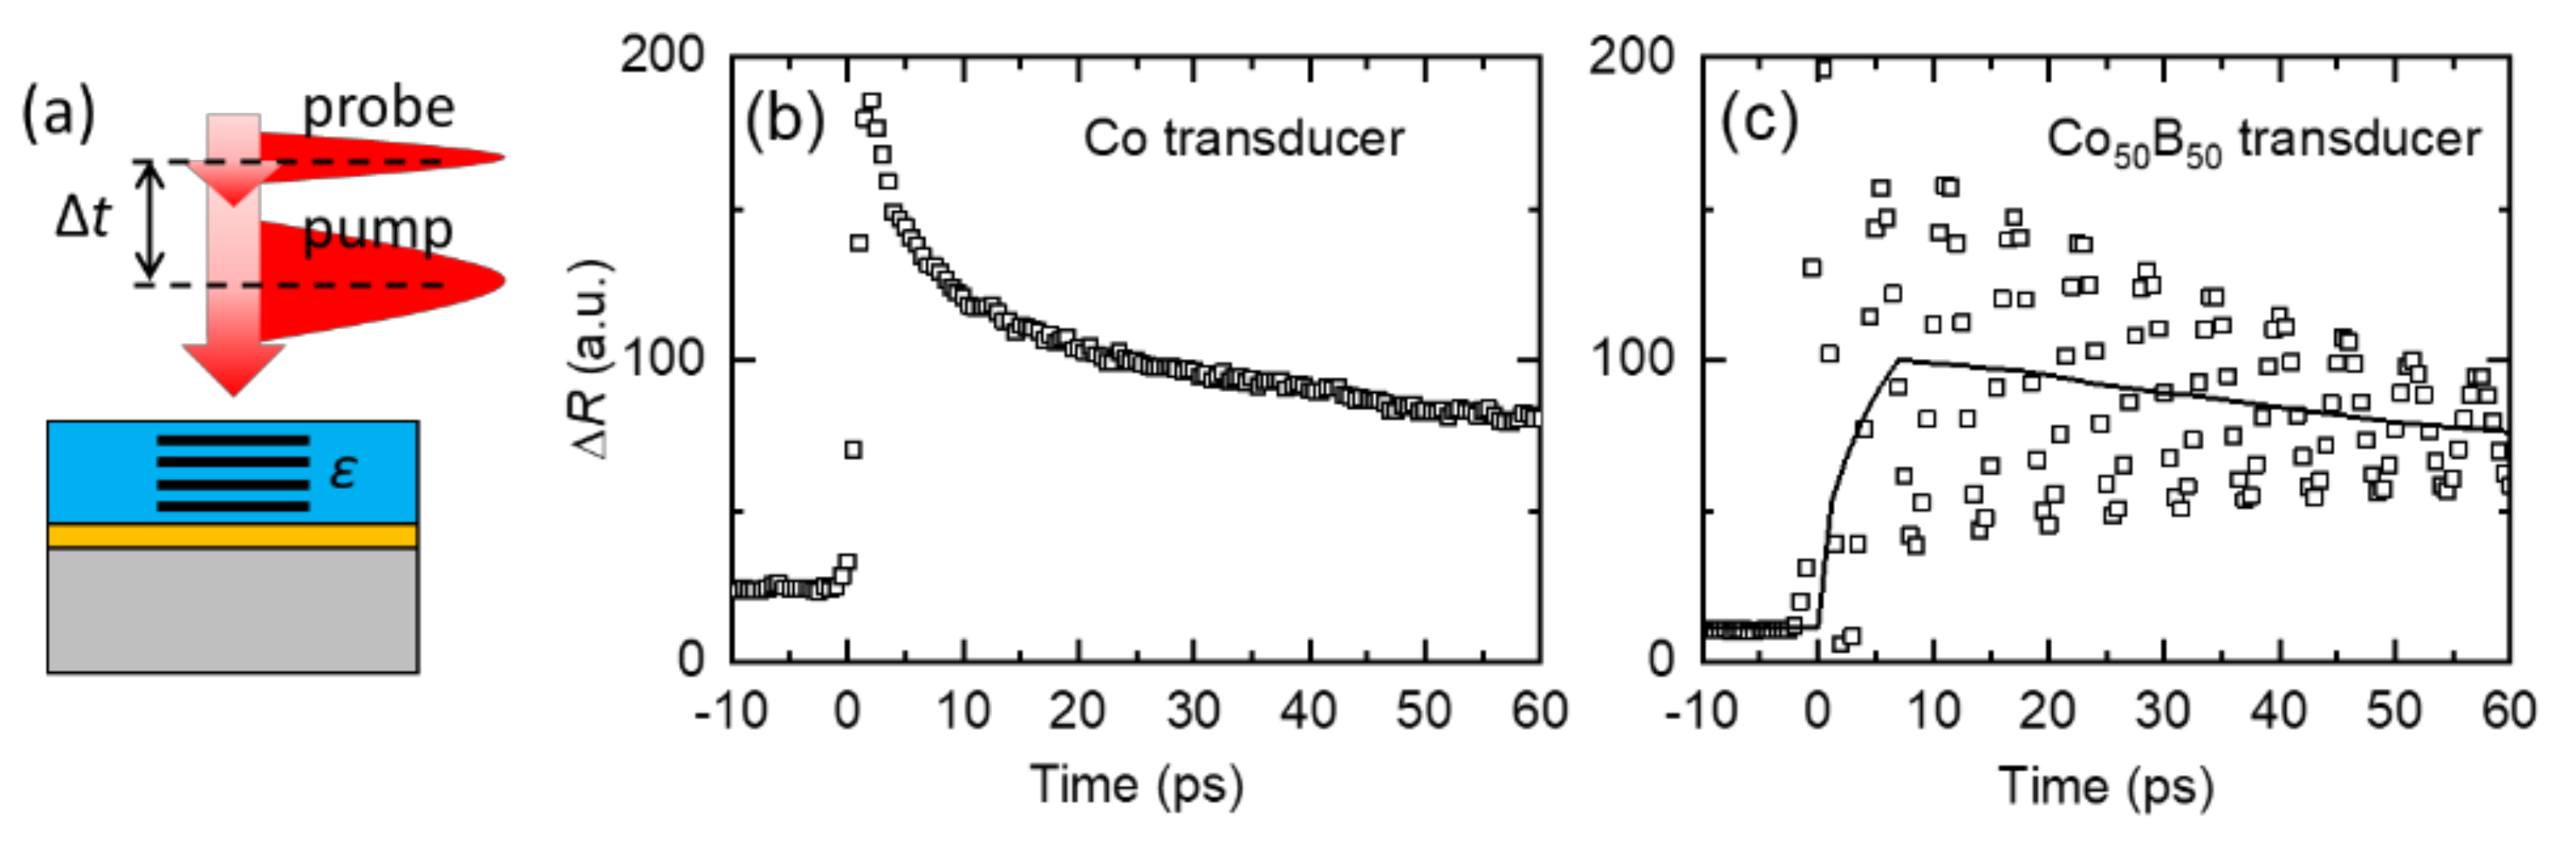
To investigate the propagation of acoustic waves at the interface, we measured the change of reflectivity (ΔR) from the transducer layer as a function of time [1,2,3,4,5,6,7,8,9,10,11,12,13,14,15,16,17,18,19]. When a pump pulse thermally excites the metal transducer, a strain pulse is introduced in the transducer. A probe pulse has a time delay from the pump pulse, measured as ∆R, caused by the changes of temperature (∆T) and strain (∆ε) of the transducer layer. ∆R arising from ∆ε is easily distinguished from that arising from ∆T because ∆ε oscillates rapidly, whereas ∆T changes slowly. ∆R arising from ∆T can be employed to investigate the heat transport from the transducer layer to substrate [31]. However, when the transducer is thinner than the penetration depth of the probe light, ∆T corresponding to both the transducer layer and substrate affects ∆R; thus, the thermal analysis becomes extremely complicated.
To investigate the heat transport at the interface, we measured the magneto-optic Kerr effect (MOKE) from the transducer layer as a function of time [32,33]. When the transducer layer is a ferromagnet, the polarization of the reflected probe light rotates, and the rotation angle (∆θ) is proportional to the change in magnetization (∆M). When ∆M is caused by heating and the resulting ∆T is small enough, a linear relationship between ∆θ and ∆T is achieved [32,33]. Because the sapphire substrate was not a ferromagnet, only the transducer layer contributed to ∆θ regardless of the transducer thickness.
For the pump and probe pulses, we used a Ti:sapphire laser oscillator that produced 0.1 ps laser pulses with a repetition rate of 80 MHz and a wavelength of 785 nm. The generated laser was immediately divided into pump and probe beams using a polarized beam splitter. A mechanical delay stage controlled the time delay between the pump and probe pulses. To increase the signal-to-noise ratio of detection, we modulated the pump/probe at 1 MHz/200 Hz with an electro-optic modulator (EOM)/optical chopper. Due to the group velocity dispersion of the EOM, the pulse width of the pump pulse was increased to 1.2 ps. We irradiated the pump and probe beams on the transducer surface at a spot size of 6 μm with incident fluences of 6 and 0.6 J m−2, respectively, for pump and probe. After reflection from the transducer layer, ∆R and ∆θ values of the probe were collected by a normal and balanced photodetector, respectively. The raw signal from the balanced detector showed a small contribution from ∆R. To collect the pure MOKE signal, we measured ∆θ with magnetic fields of + and−0.5 T, and then collected the difference between them. When we changed the direction of magnetization with magnetic fields, ∆θ changed its sign, whereas ∆R did not. The schematic of the measurement setup is shown in Figure 2.
3. Results
3.1. Acoustic Propagation at Interface
We compared the ∆R responses of the Co and Co50B50 transducers (Figure 3a). In the case of the Co transducer, ∆R showed a typical temperature response (∆R arising from ∆T) without any acoustic oscillations (∆R arising from ∆ε): a rapid increase in ∆T at zero time delay by the pump pulse, followed by a gradual decrease because of slow heat dissipation to the substrate (Figure 3b). In contrast, the Co50B50 transducer showed a strong acoustic oscillation in addition to the slow temperature response (Figure 3c). The magnitude of acoustic oscillation was similar to that of the temperature signal.
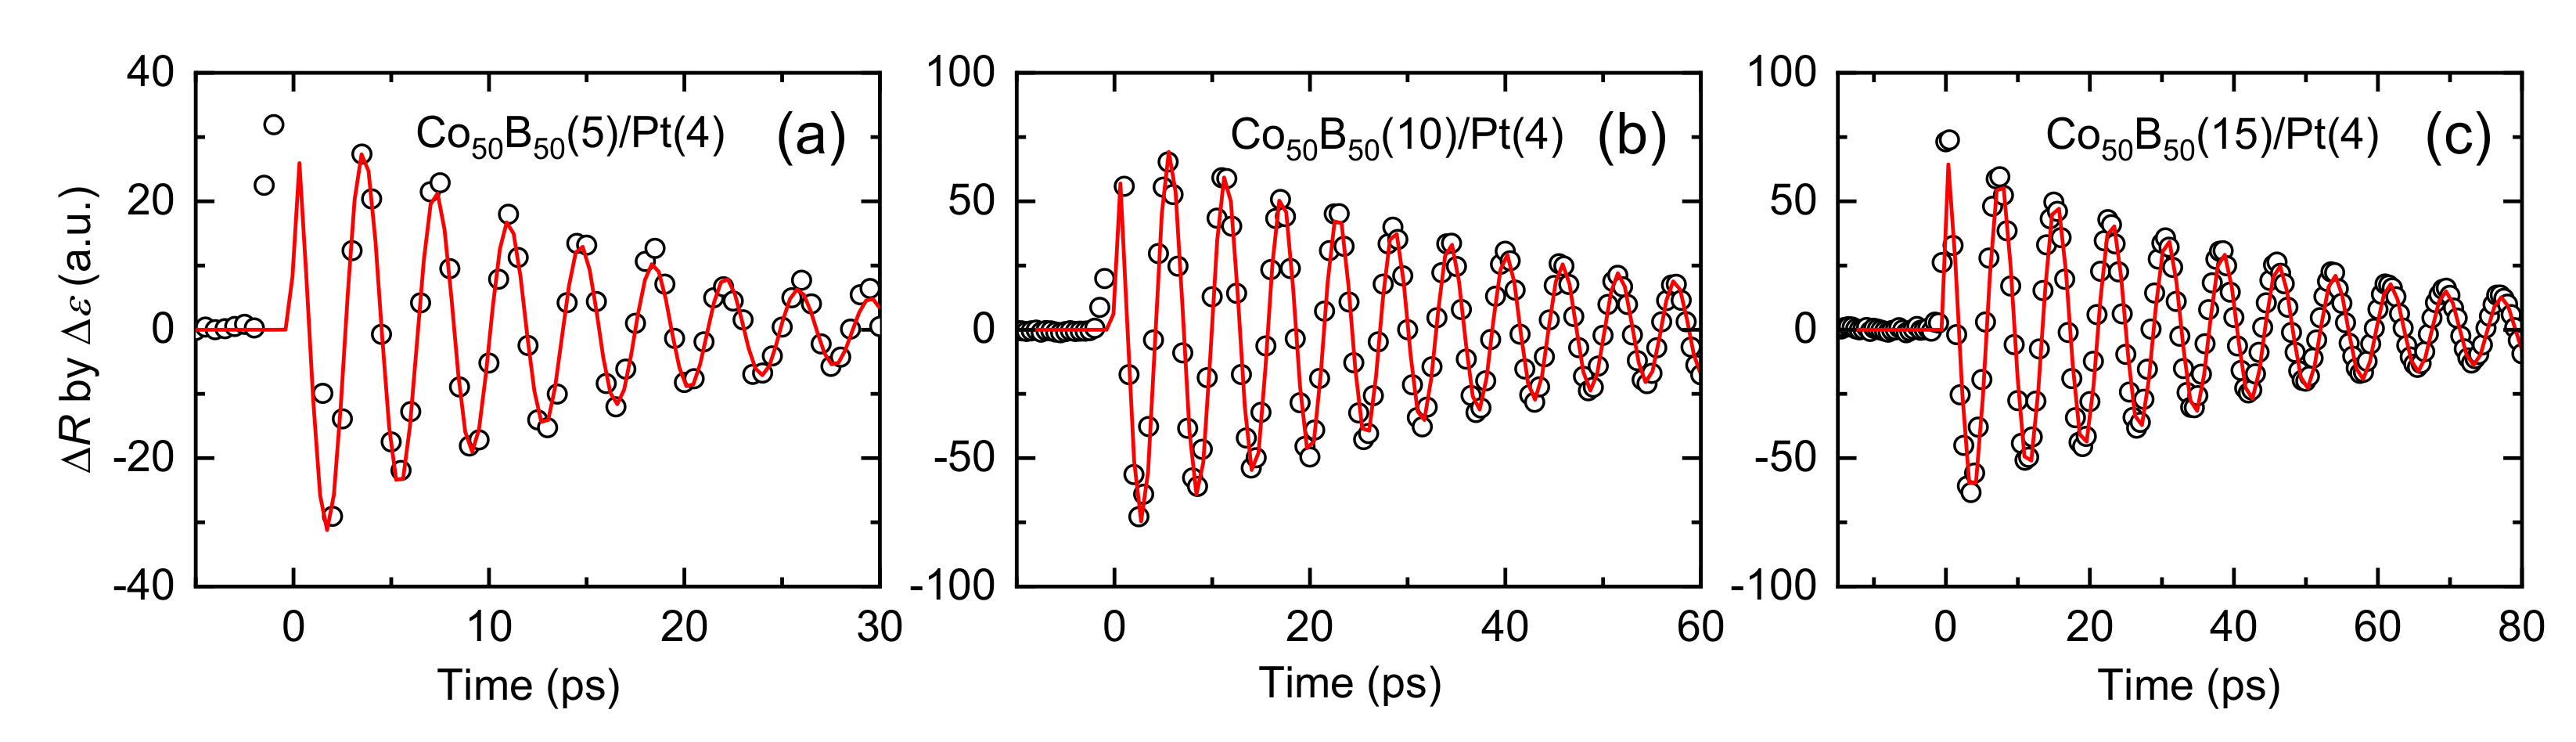
By subtracting the temperature signal from the raw data, we were able to extract acoustic oscillations. Then, we compared the acoustic oscillations obtained with different Co50B50 thicknesses (Figure 4). The oscillations were fitted with a damped cosine function, where A is the oscillation amplitude, f is the oscillation frequency, t is the time delay between the pump and probe, and τ is the exponential decay time. A smaller Co50B50 thickness resulted in a larger f and smaller τ. Such a strong oscillation of acoustic waves indicated that acoustic waves were reflected from the sap/Co50B50 interface with a high reflection coefficient (r). The reflection of acoustic waves was determined by acoustic impedance, , where ρ is the density of the material. When two materials with Z of Z1 and Z2 have infinite thicknesses, r is expressed as [34,35]
Because the sapphire and Co50B50 had a similar Z value of ≈4 × 10⁷ kg m−2 s−1, direct contact between them was not able to produce a strong acoustic oscillation. In the following, we show that a high reflection of acoustic waves was achieved due to the presence of a soft intermediate layer between Co50B50 and sapphire (we did not expect any soft layer at the CoB/Pt interface, because Pt was deposited immediately, in a few seconds, after the CoB deposition inside a vacuum chamber).
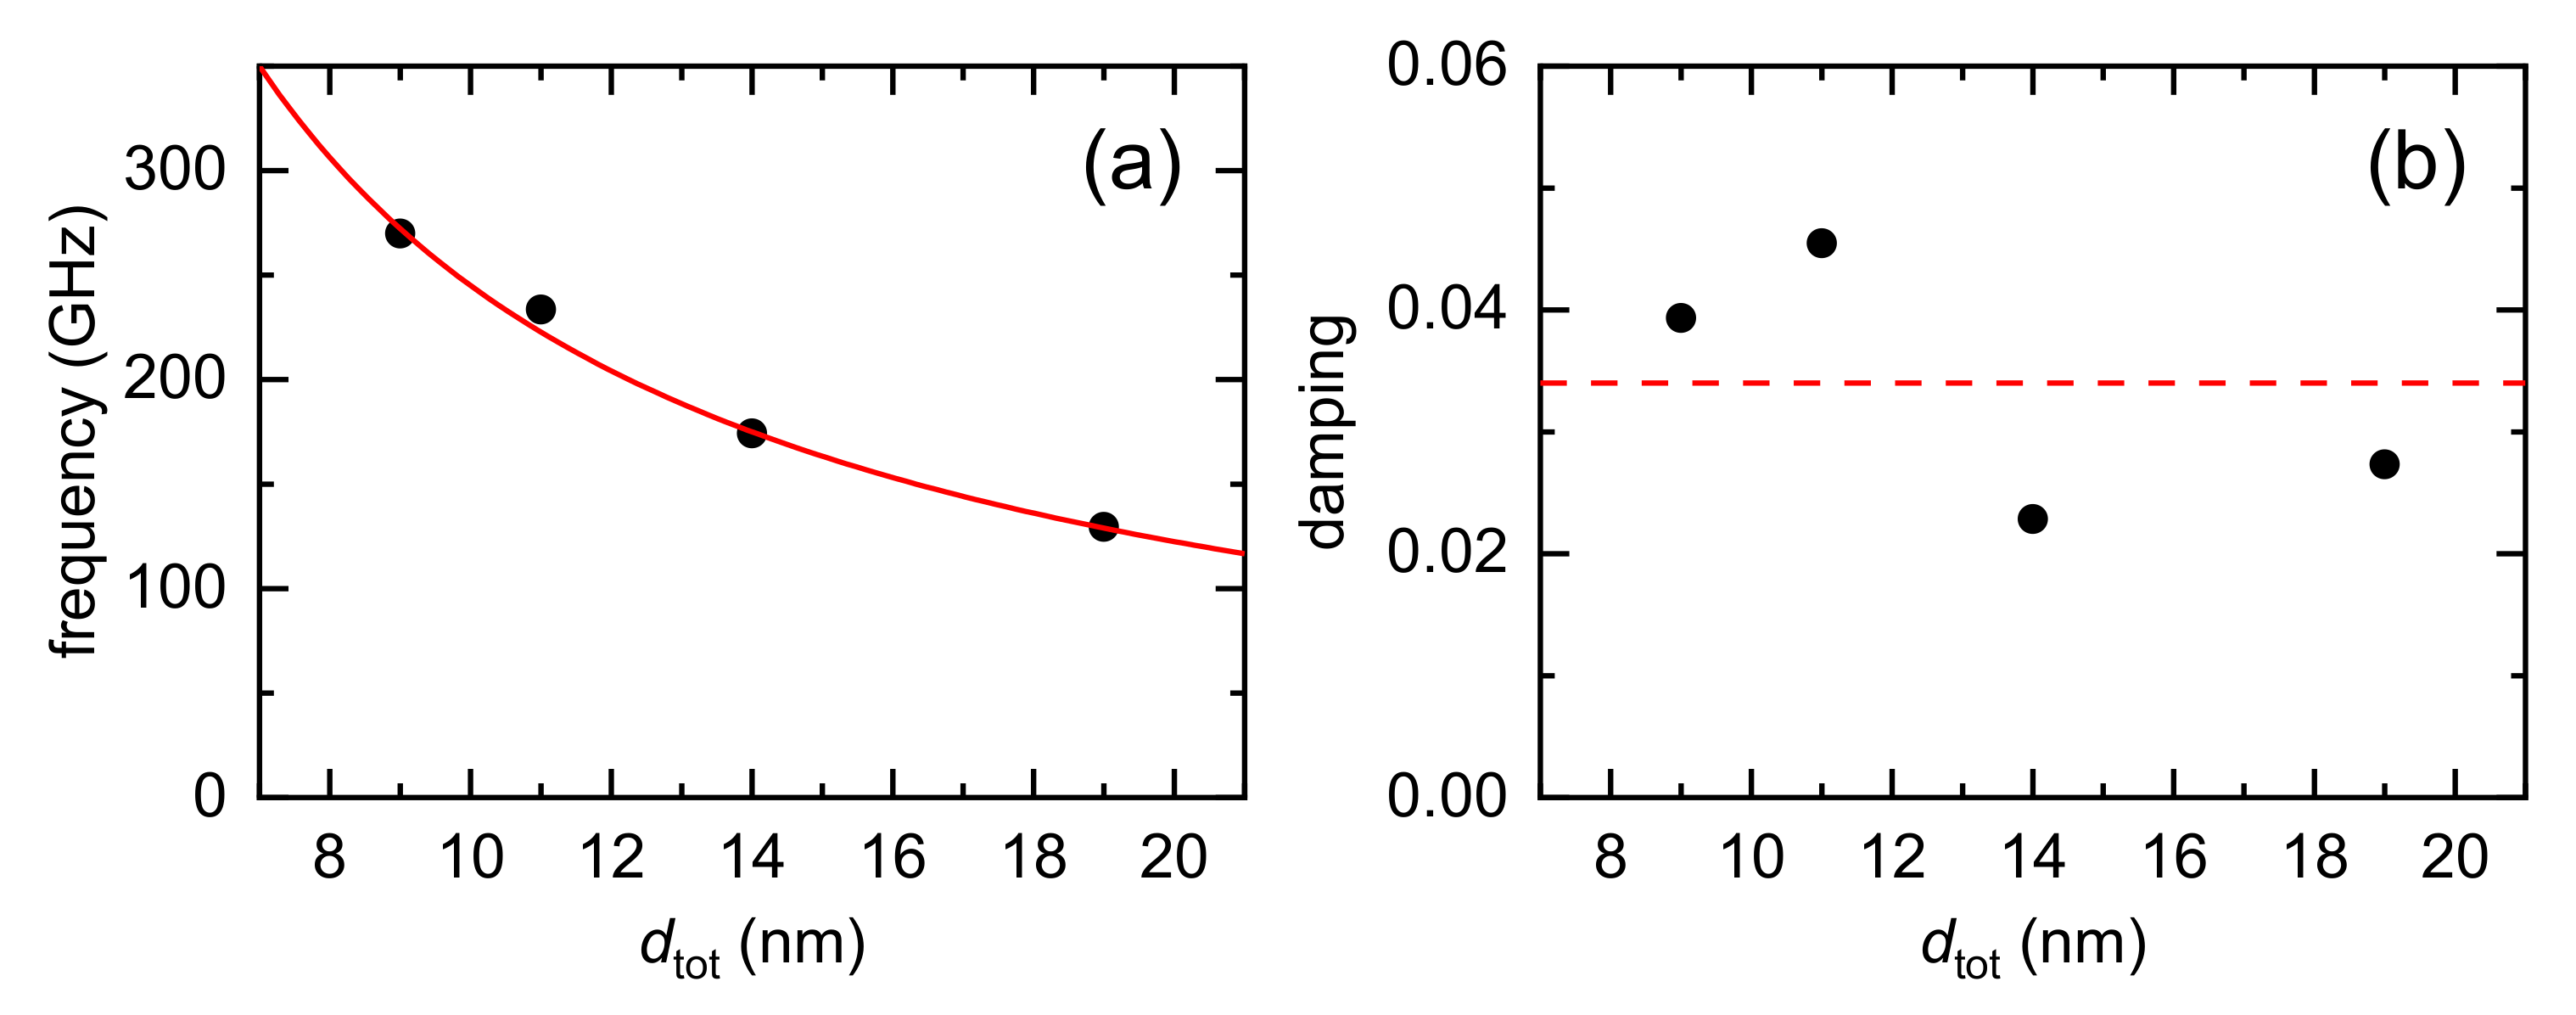
We extracted the thickness of the soft intermediate layer by analyzing acoustic oscillations. The frequency dependence on the transducer thickness is well understood by the speed of sound of the metal transducer (Figure 5a). Using the relationship , where dtot is the thickness of Co50B50+Pt and vs is the effective speed of sound of Co50B50+Pt, we determined vs to be 4900 m s−1. Then, by combining f and τ, we obtained a damping parameter of (Figure 5b). α describes the amplitude attenuation during one period of oscillation; it ranges from zero for no attenuation to for full attenuation after one period. The attenuation of acoustic waves in a medium is caused by the wave transmission at interfaces and bulk attenuation inside the medium. Considering the energy conservation during the wave propagation at interfaces, the wave transmission is related to the wave reflection. Then, α can be expressed as
where rint1 is the reflection coefficient at the bottom interface between the substrate and transducer, rint2 is the reflection coefficient at the top interface between the transducer and air, and βbulk is the bulk attenuation factor in the transducer layer (we note that r can be negative when Z1 < Z2 in Equation (2), so that the reflected wave can change its sign. Since α describes the attenuation of the absolute magnitude of the acoustic wave, α should be related to |r| but not r). rint2 was found to be close to one, considering the large mismatch in the Z values of the transducer and air. The βbulk value of metals depends on the frequency [36,37], and there are no experimental reports regarding ferromagnetic metals at a high frequency of 200 GHz. When βbulk is negligible and α is dominated by rint1, an α of 0.034 ± 0.011 leads to an |rint1| of 0.79 ± 0.07 at the Co50B50/sap interface. When βbulk is as high as ≈107 m−1 [38], the bulk attenuation can explain most of α, and |rint1| will be close to one. Such a large |rint1|of >0.79 cannot be explained by the Z of the transducer and substrate alone; thus, a soft layer should exist at the interface. Then, rint1 is expressed with the acoustic properties of the soft layer [1]:
where ; here, d3 is the thickness of the soft layer and v3 is the speed of sound of the soft layer. Assuming the same Z of 4 × 10⁷ kg m−2 s−1 for CoB and sapphire, and a typical Z3 of 1.7 ± 0.5 × 10⁶ kg m−2 s−1 and v3 of 1.5 ± 0.2 km s−1 for soft materials [34,35], an |rint1| of >0.79 ± 0.07 leads to a d3 of >2 ± 1 Å at an f of 200 GHz.
3.2. Heat Transport at Interface
Next, we investigated the heat transport at the interface. A thin, soft layer at the interface has a critical role in heat flow from the metal transducer to sapphire substrate. We measured the ∆θ of the sap/Co (10 nm)/Pt (2 nm) and sap/Co50B50 (10 nm)/Pt (4 nm) samples up to 2000 ps. Then, we obtained the ratio , where is the signal that is in-phase with the pump modulation and is the signal that is 90° out-of-phase with the pump modulation. This ratio makes the MOKE data more robust to errors caused by the defocusing of the pump beam and misalignment between the pump and probe beams [31,32,33]. The motion of the delay stage caused a slight spatial defocusing and misalignment in the pump spot on the sample, especially at long timescales of nanoseconds. The aforementioned ratio suppressed the errors associated with these issues because both and had the same dependencies on defocusing and overlap.
∆θ is caused by ∆M, and there are two contributions:
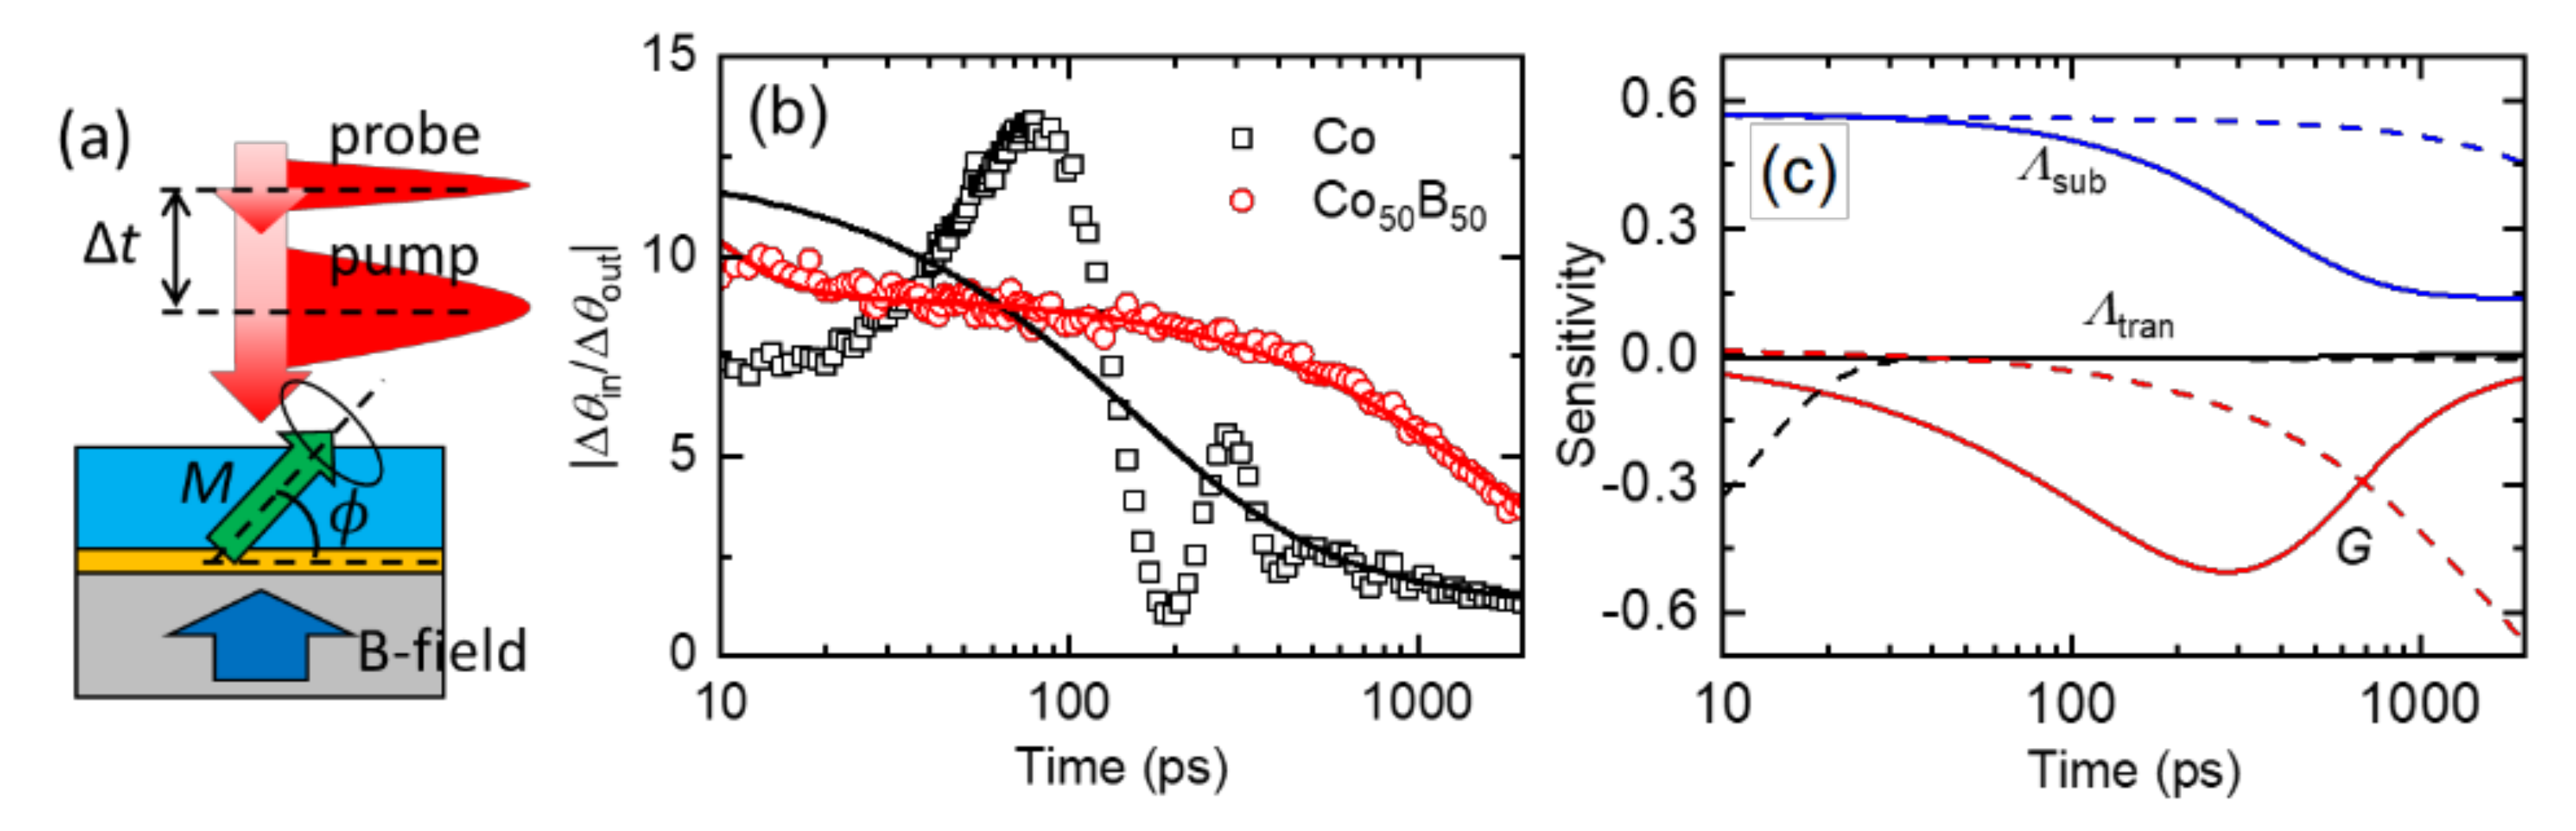
where is the magnitude of magnetization and ϕ is the angle of magnetization (Figure 6a). When the magnetic field is not large enough to fully align the magnetization, a pump pulse can trigger an oscillation of ϕ. In the case of the Co transducer, the measured exhibited a large oscillation and a slow decrease (Figure 6b). With the Co50B50 transducer, a magnetic field of 0.5 T was sufficient to fully align the magnetization; there was no magnetization oscillation. The required magnetic field for the full alignment of magnetization was approximately μ0MS, where μ0 is the vacuum permeability and MS is the saturation magnetization. With an MS of 1.4 × 10⁶ A m−1 of Co, μ0MS was 1.8 T. MS decreased significantly with B alloying, and the μ0MS of Co50B50 was smaller than 0.5 T [39]. For the thermal analysis of the Co sample, we focused on the signal, which was proportional to ∆T of Co, when the oscillation signal decayed completely after 500 ps.
We analyzed the slow decrease in using the time-domain solution of the temperature response of the top surface in the substrate/transducer structure [31]. We treated the Co50B50 and Pt layers as a single layer considering the high thermal conductance at the metallic interfaces [40]. To estimate the sensitivity of thermal modeling to a thermodynamic parameter (γ), we defined the sensitivity parameter as the logarithmic derivative of to changes in γ of the thermal model (Figure 6c):
where γ could be the thermal conductivity (Λ) of each layer or thermal conductance (G) at the interface. The Λ of the metal transducer did not affect thermal modeling, after a few tens of ps, because of its thin thickness. The G at the interface and Λ of the substrate dominated the temperature dynamics. Because the Λ of the sapphire substrate, 30 W m−1 K−1, was the same for the Co and Co50B50 samples, only G was responsible for the difference in the thermal response. When G is as high as 300 MW m−2 K−1, a typical value for a strongly coupled interface between a metallic transducer and insulating substrate [23], ∆T of the transducer should decrease quickly at approximately 100 ps. By contrast, when G is as low as 35 MW m−2 K−1, which is close to that of the metal/graphene/substrate interface [24,26], a significant decrease in ∆T of the transducer occurs at a much longer timescale of 1000 ps. Such a low G value at the Co50B50/substrate interface supports the presence of a thin, soft layer. The thermodynamic parameters for thermal modeling are summarized in Table 1.
4. Discussion
Previously, strong acoustic oscillations and low thermal conductances were achieved by inserting a two-dimensional van der Waals material, such as graphene, between the metal transducer and insulating substrate [24,26]. Graphene can withstand fabrication damage during the deposition process owing to its high mechanical stability. However, preserving a thin, soft layer with weak mechanical stability at the interface is challenging. We expect that the amorphous Co50B50 transducer can reduce the fabrication damage on the soft interface owing to its low surface binding energy (Esb). Although the Esb of the Co50B50 alloy has not been reported, we expect that amorphization by B alloying would have a significant effect on Esb. When Esb was reduced, the kinetic energy during the deposition of the metal transducer decreased (see Equation (1)).
5. Conclusions
In this study, we demonstrate that a Co50B50 transducer on top of a sapphire substrate significantly amplifies the oscillation of acoustic waves. We interpreted the strong acoustic oscillation as the existence of a thin, soft layer between the Co50B50 transducer and sapphire substrate. By analyzing the frequency and damping of acoustic oscillations, we determined the thickness of the soft layer to be >2 ± 1 Å. In addition, owing to its magnetization, we were able to obtain the temperature information of the Co50B50 transducer. By analyzing the slow decrease in the temperature, we determined the thermal conductance at the Co50B50/substrate interface to be 35 ± 5 MW m−2 K−1. Such a low thermal conductance supports the presence of the thin, soft layer at the interface. Because a strong acoustic oscillation and a weak thermal conductance were not observed with the Co transducer, we inferred that the Co50B50 transducer had a critical role in reducing fabrication damage. Amorphous metals with B alloying could be used with various soft materials to investigate acoustic propagation and thermal transport.
Author Contributions
Conceptualization: G.-M.C.; Sample preparation: L.J.; TDTR investigation: L.J. and G.-M.C.; writing—original draft preparation: G.-M.C. All authors have read and agreed to the published version of the manuscript.
Funding
G.-M.C. is supported by the National Research Foundation of Korea (2019R1C1C1009199, 2018M3D1A1058793).
Institutional Review Board Statement
Not applicable.
Informed Consent Statement
Not applicable.
Data Availability Statement
Derived data supporting the findings of this study are available from the corresponding author on request.
Conflicts of Interest
The authors declare no conflict of interest.
References
- Grahn, H.T.; Maris, H.J.; Tauc, J. Picosecond ultrasonics. IEEE J. Quantum Electron. 1989, 25, 2562–2569. [Google Scholar] [CrossRef]
- Lin, H.N.; Stoner, R.; Maris, H.; Tauc, J. Phonon attenuation and velocity measurements in transparent materials by picosecond acoustic interferometry. J. Appl. Phys. 1991, 69, 3816–3822. [Google Scholar] [CrossRef]
- Wright, O. Thickness and sound velocity measurement in thin transparent films with laser picosecond acoustics. J. Appl. Phys. 1992, 71, 1617–1629. [Google Scholar] [CrossRef]
- Lee, Y.C.; Bretz, K.C.; Wise, F.W.; Sachse, W. Picosecond acoustic measurements of longitudinal wave velocity of submicron polymer films. Appl. Phys. Lett. 1996, 69, 1692–1694. [Google Scholar] [CrossRef]
- Nye, R.A.; Kelliher, A.P.; Gaskins, J.T.; Hopkins, P.E.; Parsons, G.N. Understanding Molecular Layer Deposition Growth Mechanisms in Polyurea via Picosecond Acoustics Analysis. Chem. Mater. 2020, 32, 1553–1563. [Google Scholar] [CrossRef]
- Bonello, B.; Perrin, B.; Romatet, E.; Jeannet, J. Application of the picosecond ultrasonic technique to the study of elastic and time-resolved thermal properties of materials. Ultrasonics 1997, 35, 223–231. [Google Scholar] [CrossRef]
- Lee, T.; Ohmori, K.; Shin, C.-S.; Cahill, D.G.; Petrov, I.; Greene, J. Elastic constants of single-crystal TiNx (001)(0.67 ≤ x ≤ 1.0) determined as a function of x by picosecond ultrasonic measurements. Phys. Rev. B 2005, 71, 144106. [Google Scholar] [CrossRef]
- Mante, P.; Robillard, J.; Devos, A. Complete thin film mechanical characterization using picosecond ultrasonics and nanostructured transducers: Experimental demonstration on SiO2. Appl. Phys. Lett. 2008, 93, 071909. [Google Scholar] [CrossRef]
- Viel, A.; Peronne, E.; Sénépart, O.; Becerra, L.; Legay, C.; Semprez, F.; Trichet, L.; Coradin, T.; Hamraoui, A.; Belliard, L. Picosecond ultrasounds as elasticity probes in neuron-like cells models. Appl. Phys. Lett. 2019, 115, 213701. [Google Scholar] [CrossRef] [Green Version]
- Thompson, E.; Manzella, E.; Murray, E.; Pelletier, M.; Stuligross, J.; Daly, B.; Lee, S.; Redwing, R. Picosecond laser ultrasonic measurements of interlayer elastic properties of 2H-MoSe2 and 2H-WSe2. Mater. Today Chem. 2020, 18, 100369. [Google Scholar] [CrossRef]
- Morath, C.; Maris, H. Phonon attenuation in amorphous solids studied by picosecond ultrasonics. Phys. Rev. B 1996, 54, 203. [Google Scholar] [CrossRef]
- Hao, H.-Y.; Maris, H.J. Study of phonon dispersion in silicon and germanium at long wavelengths using picosecond ultrasonics. Phys. Rev. Lett. 2000, 84, 5556. [Google Scholar] [CrossRef]
- Pu, N.-W.; Bokor, J. Study of surface and bulk acoustic phonon excitations in superlattices using picosecond ultrasonics. Phys. Rev. Lett. 2003, 91, 076101. [Google Scholar] [CrossRef]
- Devos, A.; Foret, M.; Ayrinhac, S.; Emery, P.; Rufflé, B. Hypersound damping in vitreous silica measured by picosecond acoustics. Phys. Rev. B 2008, 77, 100201. [Google Scholar] [CrossRef] [Green Version]
- Daly, B.; Kang, K.; Wang, Y.; Cahill, D.G. Picosecond ultrasonic measurements of attenuation of longitudinal acoustic phonons in silicon. Phys. Rev. B 2009, 80, 174112. [Google Scholar] [CrossRef]
- Tas, G.; Loomis, J.; Maris, H.; Bailes Iii, A.; Seiberling, L. Picosecond ultrasonics study of the modification of interfacial bonding by ion implantation. Appl. Phys. Lett. 1998, 72, 2235–2237. [Google Scholar] [CrossRef]
- Rossignol, C.; Perrin, B.; Bonello, B.; Djemia, P.; Moch, P.; Hurdequint, H. Elastic properties of ultrathin permalloy/alumina multilayer films using picosecond ultrasonics and Brillouin light scattering. Phys. Rev. B 2004, 70, 094102. [Google Scholar] [CrossRef]
- Ezzahri, Y.; Grauby, S.; Dilhaire, S.; Rampnoux, J.-M.; Claeys, W. Cross-plan Si/Si Ge superlattice acoustic and thermal properties measurement by picosecond ultrasonics. J. Appl. Phys. 2007, 101, 013705. [Google Scholar] [CrossRef]
- Hohensee, G.T.; Hsieh, W.-P.; Losego, M.D.; Cahill, D.G. Interpreting picosecond acoustics in the case of low interface stiffness. Rev. Sci. Instrum. 2012, 83, 114902. [Google Scholar] [CrossRef]
- Swartz, E.; Pohl, R. Thermal resistance at interfaces. Appl. Phys. Lett. 1987, 51, 2200–2202. [Google Scholar] [CrossRef]
- Stoner, R.; Maris, H. Kapitza conductance and heat flow between solids at temperatures from 50 to 300 K. Phys. Rev. B 1993, 48, 16373. [Google Scholar] [CrossRef]
- Prasher, R.S.; Phelan, P.E. A scattering-mediated acoustic mismatch model for the prediction of thermal boundary resistance. J. Heat Transfer 2001, 123, 105–112. [Google Scholar] [CrossRef]
- Costescu, R.M.; Wall, M.A.; Cahill, D.G. Thermal conductance of epitaxial interfaces. Phys. Rev. B 2003, 67, 054302. [Google Scholar] [CrossRef]
- Hsieh, W.-P.; Lyons, A.S.; Pop, E.; Keblinski, P.; Cahill, D.G. Pressure tuning of the thermal conductance of weak interfaces. Phys. Rev. B 2011, 84, 184107. [Google Scholar] [CrossRef] [Green Version]
- Hu, M.; Keblinski, P.; Schelling, P.K. Kapitza conductance of silicon–amorphous polyethylene interfaces by molecular dynamics simulations. Phys. Rev. B 2009, 79, 104305. [Google Scholar] [CrossRef]
- Estrada, D.; Li, Z.; Choi, G.-M.; Dunham, S.N.; Serov, A.; Lee, J.; Meng, Y.; Lian, F.; Wang, N.C.; Perez, A. Thermal transport in layer-by-layer assembled polycrystalline graphene films. NPJ 2D Mater. Appl. 2019, 3, 1–7. [Google Scholar] [CrossRef] [Green Version]
- Hasegawa, R. Present status of amorphous soft magnetic alloys. J. Magn. Magn. Mater. 2000, 215, 240–245. [Google Scholar] [CrossRef]
- Johnson, W. Bulk amorphous metal—An emerging engineering material. JOM 2002, 54, 40–43. [Google Scholar] [CrossRef]
- Choi, G.-M.; Min, B.-C.; Shin, K.-H. FePdB layer for perpendicular magnetic tunnel junctions. Appl. Phys. Lett. 2010, 97, 202503. [Google Scholar] [CrossRef]
- Thompson, M.W., II. The energy spectrum of ejected atoms during the high energy sputtering of gold. Philos. Mag. 1968, 18, 377–414. [Google Scholar] [CrossRef]
- Cahill, D.G. Analysis of heat flow in layered structures for time-domain thermoreflectance. Rev. Sci. Instrum. 2004, 75, 5119–5122. [Google Scholar] [CrossRef]
- Kang, K.; Choi, G.-M. Thermal coupling parameters between electron, phonon, and magnon of Nickel. J. Magn. Magn. Mater. 2020, 514, 167156. [Google Scholar] [CrossRef]
- Pham Ngoc, L.L.; Kang, K.; Choi, G.-M. The measurement of anisotropic thermal transport using time-resolved magneto-optical Kerr effect. AIP Adv. 2021, 11, 025024. [Google Scholar] [CrossRef]
- Kinsler, L.E.; Frey, A.R.; Coppens, A.B.; Sanders, J.V. Fundamentals of Acoustics, 4th ed.; Wiley: Hoboken, United States, 1999. [Google Scholar]
- Wiley. Properties and Behavior of Polymers, 1st ed.; Wiley: Hoboken, NJ, USA, 2011. [Google Scholar]
- Ryzy, M.; Grabec, T.; Österreicher, J.A.; Hettich, M.; Veres, I.A. Measurement of coherent surface acoustic wave attenuation in polycrystalline aluminum. AIP Adv. 2018, 8, 125019. [Google Scholar] [CrossRef] [Green Version]
- Povey, M.; Meredith, D.; Dobbs, E. Electromagnetic generation and attenuation of ultrasound in ferromagnetic metals. I. J. Phys. F Metal Phys. 1980, 10, 2041. [Google Scholar] [CrossRef]
- Shen, X.; Lu, Z.; Timalsina, Y.P.; Lu, T.-M.; Washington, M.; Yamaguchi, M. Coherent phonon transport measurement and controlled acoustic excitations using tunable acoustic phonon source in GHz-sub THz Range with variable bandwidth. Sci. Rep. 2018, 8, 1–10. [Google Scholar] [CrossRef] [Green Version]
- Mizutani, U.; Hasegawa, M.; Fukamichi, K.; Hattori, Y.; Yamada, Y.; Tanaka, H.; Takayama, S. Magnetic, electronic, and electron-transport properties of amorphous (Co0.85B0.15)100−xXx (X = B, Al, Si, and V) alloys. Phys. Rev. B 1993, 47, 2678. [Google Scholar] [CrossRef]
- Gundrum, B.C.; Cahill, D.G.; Averback, R.S. Thermal conductance of metal-metal interfaces. Phys. Rev. B 2005, 72, 245426. [Google Scholar] [CrossRef]
- Thermophysical Properties Research Center, Purdue University. Thermophysical Properties of High Temperature Solid Materials; Touloukian, Y.S., Ed.; Macmillan: New York, NY, USA, 1967. [Google Scholar]
- Matsuura, M.; Mizutani, U. Low-temperature specific heat study of amorphous Co1−xBx alloys. J. Phys. F Metal Phys. 1983, 13, 1539. [Google Scholar] [CrossRef]
- Terada, Y.; Ohkubo, K.; Mohri, T.; Suzuki, T. Thermal conductivity of cobalt-base alloys. Metall. Mater. Trans. 2003, 34, 2026. [Google Scholar] [CrossRef]
- Parchovianský, M.; Galusek, D.; Švančárek, P.; Sedláček, J.; Šajgalík, P. Thermal behavior, electrical conductivity and microstructure of hot pressed Al2O3/SiC nanocomposites. Ceram. Int. 2014, 40, 14421–14429. [Google Scholar] [CrossRef]
Figure 1.
(a) Schematics for the sputtering process. An Ar+ ion bombards the CoB alloy target. Target elements are ejected from the target surface and deposited on the substrate. (b) The number distribution (f) of the sputtered elements from the target surface is a function of the kinetic energy (E). The maximum f occurs at E with around half the surface binding energy (Esb) of the target material.

Figure 2.
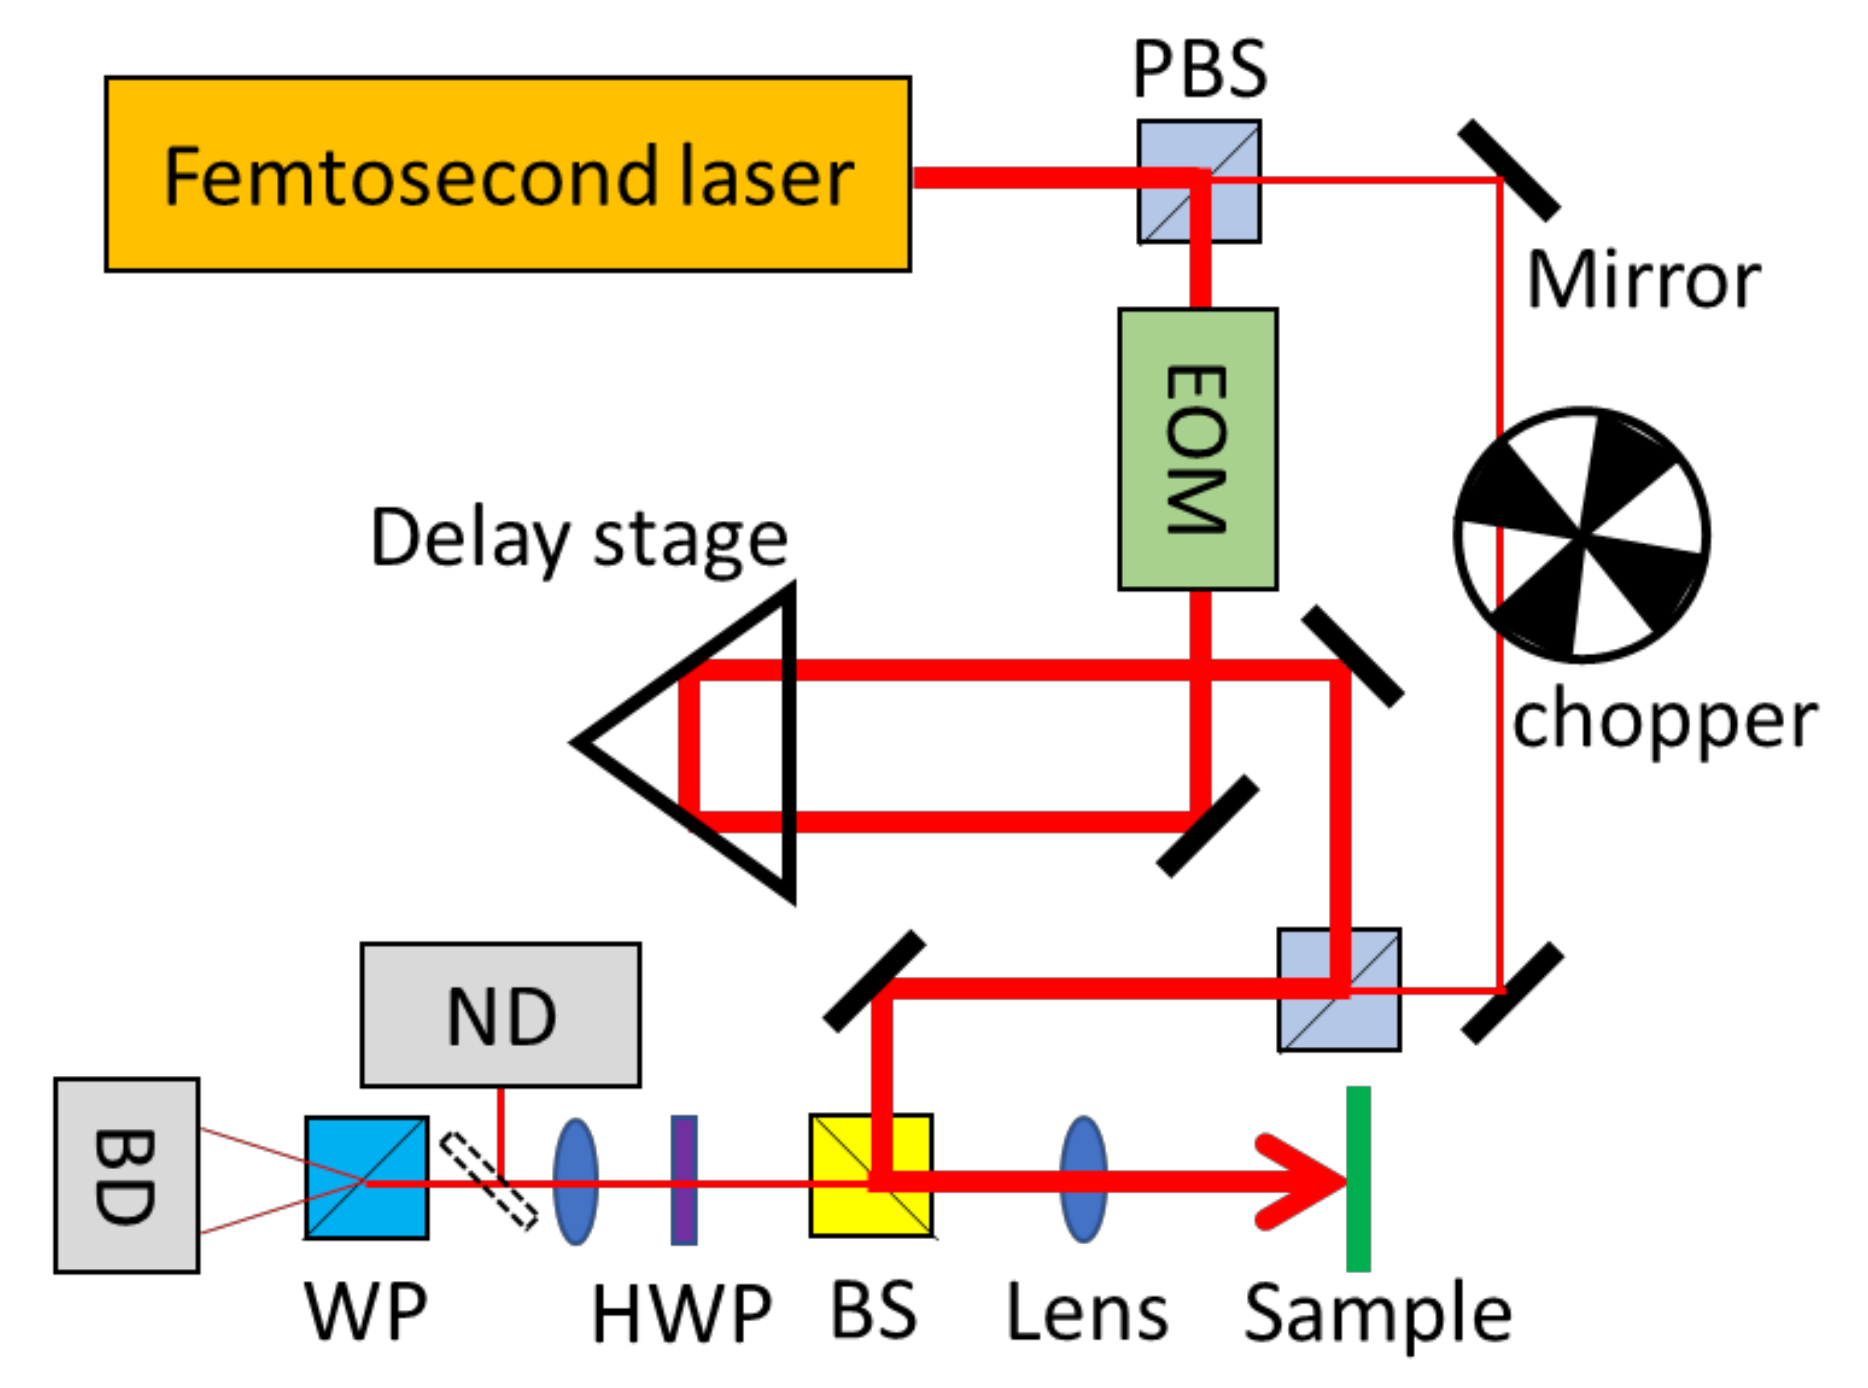
The pump-probe experimental set-up. A pulsed laser was split to the pump (thick red line) and probe (thin red line) via a polarizing beam splitter (PBS). The pump and probe were modulated via an electro-optic modulator (EOM) and optical chopper, respectively. The time delay between the pump and probe was controlled by a delay stage. The pump and probe were focused on the transducer surface by a lens. The reflection from the probe, after the non-polarizing beam splitter (BS), was collected by a normal detector (ND) for ∆R measurement and by a balanced detector (BD) for ∆θ measurement. For ∆θ measurement, a halfwave plate (HWP) and Wollaston prism (WP) were used to control the polarization of the probe beam.
Figure 2.
The pump-probe experimental set-up. A pulsed laser was split to the pump (thick red line) and probe (thin red line) via a polarizing beam splitter (PBS). The pump and probe were modulated via an electro-optic modulator (EOM) and optical chopper, respectively. The time delay between the pump and probe was controlled by a delay stage. The pump and probe were focused on the transducer surface by a lens. The reflection from the probe, after the non-polarizing beam splitter (BS), was collected by a normal detector (ND) for ∆R measurement and by a balanced detector (BD) for ∆θ measurement. For ∆θ measurement, a halfwave plate (HWP) and Wollaston prism (WP) were used to control the polarization of the probe beam.

Figure 3.
∆R comparison of the Co and Co50B50 transducers. (a) Schematics for detection of ∆R, which was caused by changes in the strain (ε). The blue/orange/gray layers represent the transducer/interface/substrate, respectively. ∆R results of the (b) sap/Co (10 nm)/Pt (2 nm) and (c) sap/Co50B50 (10 nm)/Pt (4 nm) sample. The black squares are experimental data. The black line in (b) represents the background temperature signal.

Figure 4.
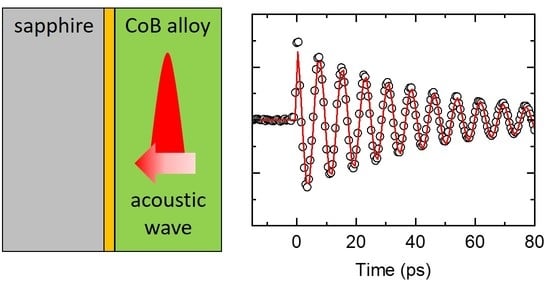
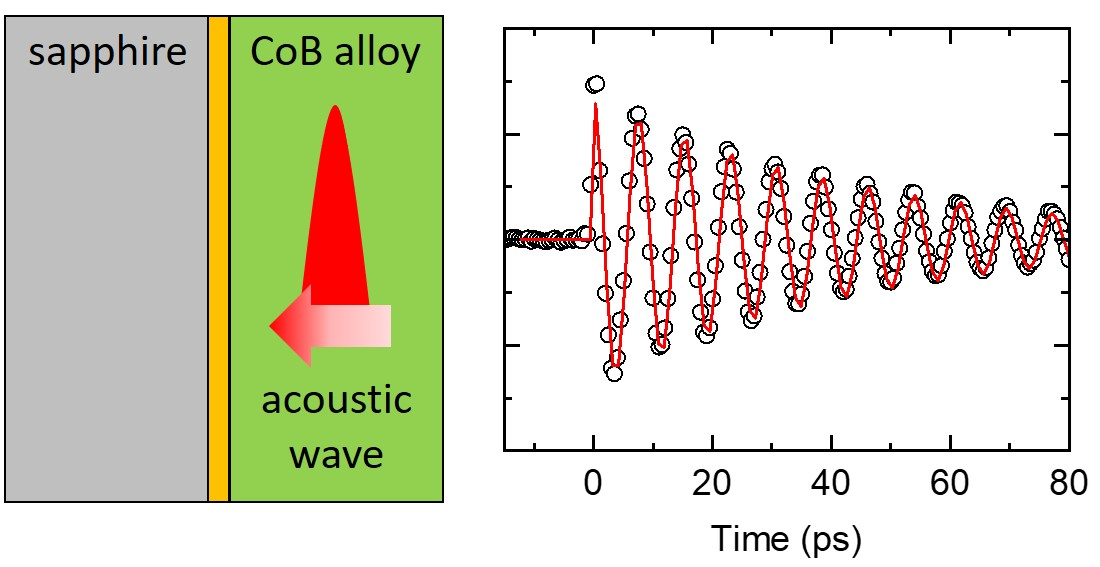
Acoustic oscillation. The extracted acoustic oscillation of the (a) sap/Co50B50 (5 nm)/Pt (4 nm), (b) sap/Co50B50 (10 nm)/Pt (4 nm), and (c) sap/Co50B50 (15 nm)/Pt (4 nm) samples. The black circles are data, and the red lines are fittings with a damped cosine function of . The fitted f and τ: (a) f = 270 GHz, τ = 15 ps; (b) f = 174 GHz, τ = 40 ps; (c) f = 129 GHz, τ = 45 ps.
Figure 4.
Acoustic oscillation. The extracted acoustic oscillation of the (a) sap/Co50B50 (5 nm)/Pt (4 nm), (b) sap/Co50B50 (10 nm)/Pt (4 nm), and (c) sap/Co50B50 (15 nm)/Pt (4 nm) samples. The black circles are data, and the red lines are fittings with a damped cosine function of . The fitted f and τ: (a) f = 270 GHz, τ = 15 ps; (b) f = 174 GHz, τ = 40 ps; (c) f = 129 GHz, τ = 45 ps.

Figure 5.
Frequency and damping of acoustic oscillation. (a) The frequency of the acoustic oscillation of the sap/Co50B50 (5, 7, 10, and 15 nm)/Pt (4 nm) samples. The dtot represents the total thickness of Co50B50 and Pt. The red line is the fitting with , where vs is 4900 m s−1. (b) The damping (α) of acoustic oscillations of the sap/Co50B50 (5, 7, 10, and 15 nm)/Pt (4 nm) samples. The red dotted line indicates an α of 0.034.

Figure 6.
Analysis of heat transport. (a) Schematics for the detection of ∆θ, which is caused by changes of magnetization (M). A magnetic field (B-field) was applied to align M to the normal for the sample plane. The blue/orange/gray layers represent the transducer/interface/substrate, respectively. (b) The ratio of represents the temperature response of the magnetic transducer. The black squares and red circles are experimental data of the sap/Co (10 nm)/Pt (2 nm) and sap/Co50B50 (10 nm)/Pt (4 nm) samples, respectively. The black and red lines are simulation results from thermal modeling with an interfacial thermal conductance of 300 and 35 MW m−2 K−1, respectively. (c) The sensitivity plot for the thermal modeling to a thermodynamic parameter (γ). The black, red, and blue colors are calculation results when γ is the thermal conductivity of the transducer (Λtran), thermal conductance at the interface (G), and thermal conductivity of the substrate (Λsub), respectively. The solid and dashed lines are calculation results with the Co and CoB transducer, respectively.


Table 1.
Thermodynamic properties for thermal analysis in Figure 6. The film structure is a sapphire substrate/metal (Co or CoB) transducer, which is presented with the thickness (d), heat capacity (C), and thermal conductivity (Λ) of each layer, and the thermal conductance (G) at the interface.
Table 1.
Thermodynamic properties for thermal analysis in Figure 6. The film structure is a sapphire substrate/metal (Co or CoB) transducer, which is presented with the thickness (d), heat capacity (C), and thermal conductivity (Λ) of each layer, and the thermal conductance (G) at the interface.
| Layer | d (nm) | C (106 J m−3 K−1) | Λ (W m−1 K−1) | G (MW m−2 K−1) |
|---|---|---|---|---|
| Co transducer | 12 1 | 3.8 4 | 100 6 | 300 ± 50 8 |
| CoB transducer | 14 2 | 4.1 5 | 20 6 | 35 ± 5 8 |
| Substrate | 500,000 3 | 3.1 4 | 30 7 |
1 For the Co(10 nm)/Pt(2 nm) structure. 2 For the Co50B50(10 nm)/Pt(4 nm) structure. 3 When it is thicker than the heat penetration depth, the thickness of the substrate does not affect the thermal analysis. 4 [41]. 5 [42]. 6 [43]. The Λ of the transducer did not affect the thermal analysis, after a few tens of ps, because of its thin thickness. 7 [44]. 8 Fitting results.
Publisher’s Note: MDPI stays neutral with regard to jurisdictional claims in published maps and institutional affiliations. |
© 2021 by the authors. Licensee MDPI, Basel, Switzerland. This article is an open access article distributed under the terms and conditions of the Creative Commons Attribution (CC BY) license (https://creativecommons.org/licenses/by/4.0/).
Share and Cite
MDPI and ACS Style
Jian, L.; Choi, G.-M. Using Amorphous CoB Alloy as Transducer to Detect Acoustic Propagation and Heat Transport at Interface. Appl. Sci. 2021, 11, 5155. https://doi.org/10.3390/app11115155
AMA Style
Jian L, Choi G-M. Using Amorphous CoB Alloy as Transducer to Detect Acoustic Propagation and Heat Transport at Interface. Applied Sciences. 2021; 11(11):5155. https://doi.org/10.3390/app11115155
Chicago/Turabian StyleJian, Liu, and Gyung-Min Choi. 2021. "Using Amorphous CoB Alloy as Transducer to Detect Acoustic Propagation and Heat Transport at Interface" Applied Sciences 11, no. 11: 5155. https://doi.org/10.3390/app11115155
Note that from the first issue of 2016, this journal uses article numbers instead of page numbers. See further details here.