Article

Positioning in the Global Value Chain as a Sustainable Strategy: A Case Study in a Mature Industry

by
Jose Albors-Garrigos
*,
Blanca De Miguel Molina
and
Maria De Miguel Molina
Universidad Politecnica de Valencia, Camino de Vera, s.n., Valencia 46022, Spain
*
Author to whom correspondence should be addressed.
Adm. Sci. 2014, 4(2), 155-172; https://doi.org/10.3390/admsci4020155
Submission received: 4 November 2013 / Revised: 5 May 2014 / Accepted: 22 May 2014 / Published: 19 June 2014
(This article belongs to the Special Issue Sustainability in Global Value Chain)

Abstract

:
As a result of the development of new industrialized countries, such as Brazil, China and other Southern Asian economies, as well as a globalized economy, traditional competitive paradigms based on advantages associated with costs and quality efficiencies or even innovation are no longer sufficient. These previous classical paradigms related competitiveness either to costs or technology innovation and the resources of industry incumbents. However, the combination of adequate knowledge and relationship management with marketing efforts brings forth a reconsideration of the present competitive models that go beyond those analyses from the point of view of global value chains. The objective of this investigation will analyze the governance structure of the territorial value chain in the Spanish and Italian ceramic tile industry, through the understanding of the previous and current roles of several industries involved in the value creation system. By way of both a case study and quantitative methodology approach, we will explore the paradigm change where traditional chain actors are losing their grip on their contribution to the territorial value creation system as new actors appear with a more stable status. The article concludes that proper positioning in the global value chain is a key strategy for the sustainability of the involved firms, especially Small and Medium Enterprises (SME).

1. Introduction

1.1. Introduction Objectives

The aim of this paper is to analyze innovation, structural changes, links and functions in a clustered innovation system under globalization. It starts by analyzing the evolution of the ceramic tile cluster innovation system towards a scenario of global competition. The paper focuses on a conceptual framework based on the ceramic tile global value chain. It analyzes empirically the ceramic tile sector innovation and competitive variables in Spain using qualitative and quantitative methods. This is utilized to draw conclusions on the contribution of technology innovation and the strategic focusing of various actors to compare its results regarding their competitive advantages.
This paper is organized as follows: first, we analyze the evolution of the technology innovation system and the ceramic tile cluster competitive development. Second, we examine the reasons that have contributed to its development and their influences on various critical cluster economic agents. Third, we propose a model for analyzing the roles of these agents from the point of view of the value chain positioning and its governance, based on economic data. Finally, we draw conclusions and propose a new research framework.

1.2. Context of Innovation System within a Cluster Context

In principle, clusters can be defined as “geographic concentrations of interconnected companies and institutions in a particular industry sector or multiple sectors. Clusters encompass an array of linked industries and other entities important for competition” [1]. On the other side, the concept of systems of innovation responds to a systemic view of innovation, where the interaction of agents in the pursuit of technology innovation is more relevant that the R&D activities, per se. Innovation systems may also be analyzed at different levels: regional, national and international. While the national level may be the most relevant, due to the role of country-specific interactions in creating a climate for innovation, international technology flows and collaborations are taking on growing significance [2]. In this direction, national (or regional) innovation systems were defined as “the network of institutions in the public and private sectors whose activities and interactions initiate, import, modify and diffuse new technologies” [3]. We can conclude that cluster and innovation system approaches differ basically on the innovation focus of the latter.
In the past two decades, the phenomenon of the innovation system has attracted the attention and aroused the interest of researchers and experts from different scientific communities. All relevant publications have discussed the advantages or external effects of innovation systems [4].
In addition, companies cannot limit their management to knowledge internally acquired. Rather, territorial resources, such as universities or R&D centers, seem to be crucial factors to complete and complement their own resources and act as agents of economic development. Consequently, competitive advantage lays both locally, as well as internally to the company [5].
However, one of the central constituents in the innovation system environment is the dynamic and complex formation of networks available to businesses located therein, which provides a crucial organizational context. For example, the mere presence of an R&D center in an area only contributes as a static resource that will become dynamic when firms located there interact with each other and utilize that resource [5]. Therefore, a relevant author [6] established a framework that characterizes the variety of linkages in the innovation system as a first-order (relations among companies), second-order (business relations with economic and social institutions) and third-order embeddedness (enterprises are related indirectly through social and economic institutions), all based on the dimensions of economic (systemic) and social embeddedness (critical). External links among innovation systems and other non-localized agents in the same field may also contribute to improve the system’s performance.

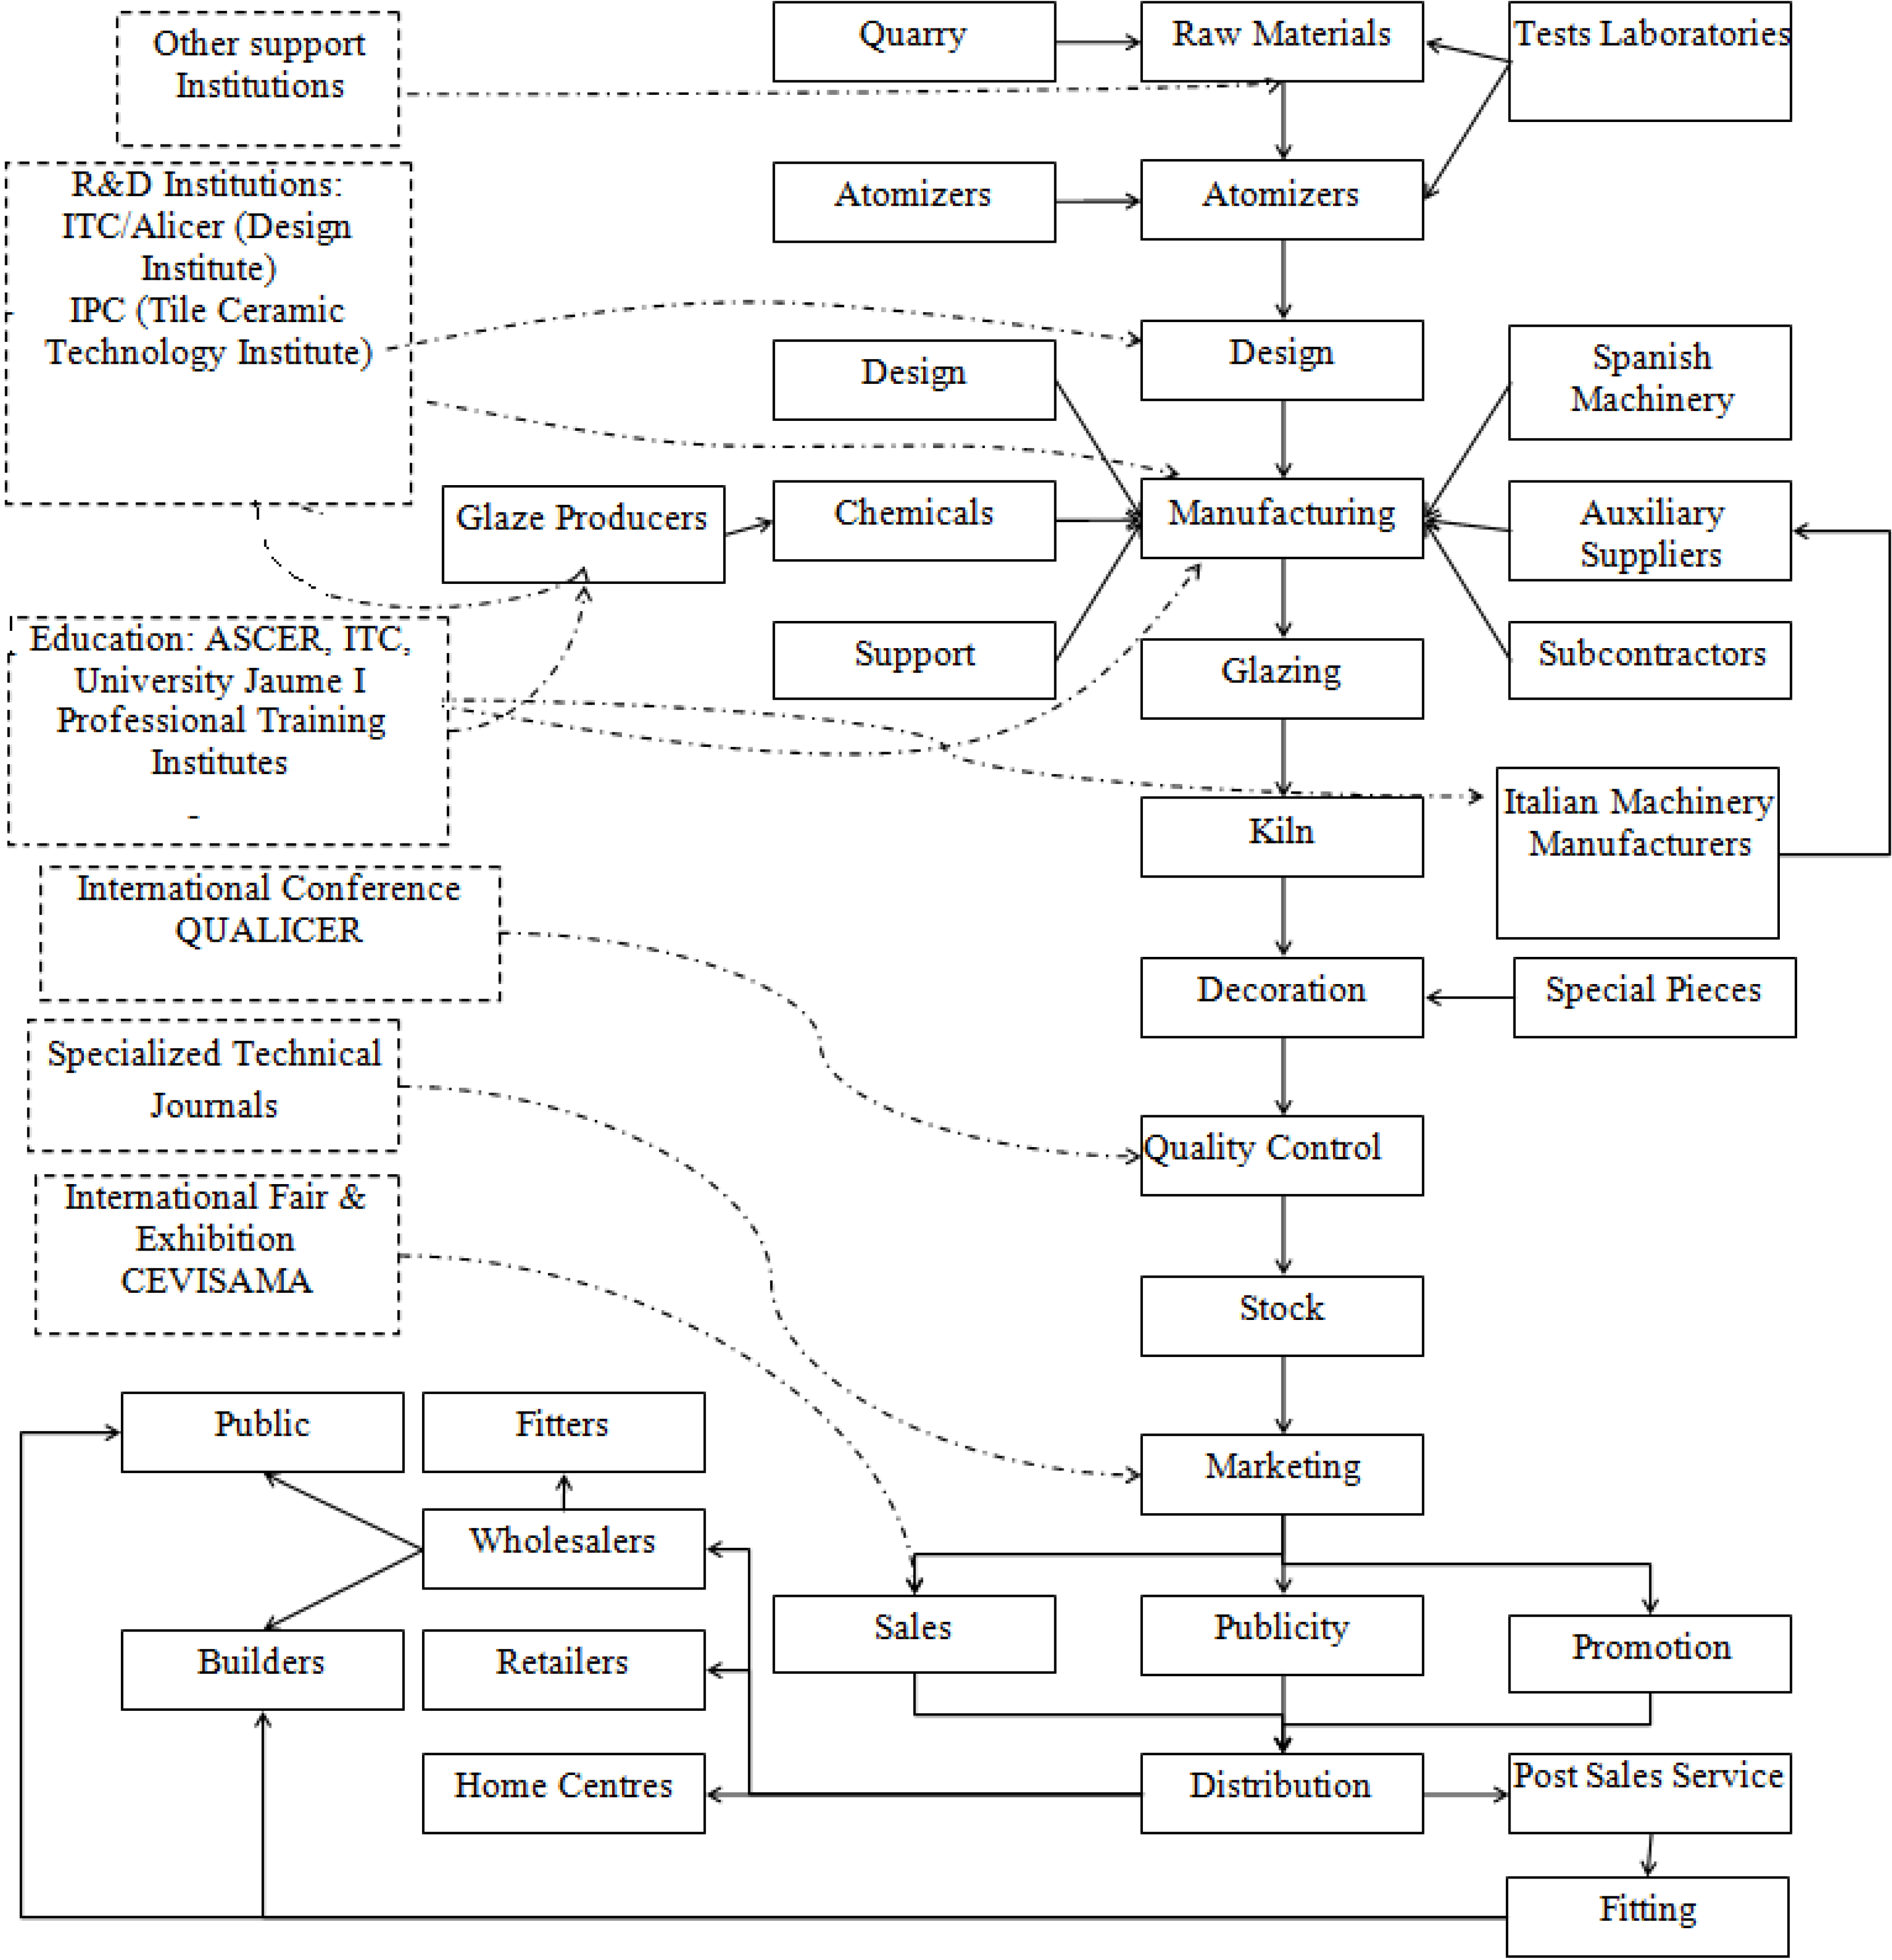
2. The Spanish Ceramic Tile Innovation System

2.1. Innovation Systems and Innovation

Since the influential publication of Schumpeter [7], innovation has been associated with industry competitiveness, and in turn, an influential publication [8] has described the links among macroeconomic forces and technical change. Later, other authors [3,9,10] analyzed the effect of technological innovation on business growth. Academic literature has examined extensively the relationship between competitiveness and technological change.
Technological innovation has been a key factor in the development of global leadership in the ceramic tile industry by Italy and Spain. This has been based on the absorption of innovations generated by the Italian machinery industry [11,12]. It has also been accompanied by an intense interaction among the producers of tile pigments and glazes and tile equipment manufacturers, which has caused a vast improvement in productivity, quality and competitiveness in both clusters. Thus, several authors have emphasized that it is due to innovation success as a result of inter-organizational collaboration among various agents in the Spanish and Italian clusters [13].
The Spanish ceramic tile industry developed in the early eighties and concentrated basically in a cluster in Castellón (east of Spain). It experienced tremendous growth in the next decade, attributable to several elements: (a) the availability of natural gas in the area of Castellón, (b) the development of the enameling and glazing industry (facilitated by the development of a technological discontinuity (single-firing process), (c) a strong ceramic tile domestic demand from the construction sector, (d) the transfer of technology from the Italian machinery industry (The Italian ceramic tile industry is organized, as well, in a regional cluster located around Sassuolo in the north of Italy [11,13]) and (e) amplified by the entry of Spain into the European Union [12]. Thus, it shaped, as in Italy, a model where machinery suppliers and the enameling and glazing industry led a strong technology innovation according to Pavitt’s taxonomy [14]. In this context, it must be taken into account that the largest firms were leading, in most cases, the incorporation of standards, procedures and technologies.
Moreover, the Spanish ceramic tile industry competes especially in the medium or low market segment. Since price is a competitive component in this segment, the innovation process has been crucial to ease the adoption of technologies that reduce production costs [15].
This paradigm based on technological innovation, in addition to the influence of the innovation system of the Italian and Spanish ceramic tile clusters, has promoted the dissemination of these innovations worldwide in the ceramic tile industry. It has also conferred an increase in productivity of 68% from 1990 to 2007 along with a significant growth of domestic and international sales [16]. However, in recent years, there have been radical changes in the global distribution of production. A new market scenario has emerged, and new competitors have proliferated around the world that have access to the technology that differentiates European ceramic tile products. As shown in Table 1, the annual growth rates of production of wall and floor tile ceramics from Italy and Spain have stagnated, while in other countries, such as China, Thailand, Vietnam, India, Indonesia, Egypt, Poland, etc., production has experienced a tremendous growth. The main reasons are industry globalization with higher productivity rates (basically due to lower salaries) in emerging countries and the deflation of the building bubble in Spain.
Table 1. Top ceramic tile manufacturing countries, 2007–2011 [17].
Country2007 (m.2Mill.)2008 (Sq.m.Mill.)2009 (Sq.m.Mill.)2010 (Sq.m.Mill.)2011 (Sq.m.Mill.)% on 2011
world production
% var. 11/10
China3200340036004200480045.714.3
Brazil6377137157538448.012.1
India3853904905506175.912.2
Iran2503203504004754.518.8
Italy5595133683874003.83.2
Spain5854953243663923.77.1
Vietnam2542702953753803.61.3
Indonesia2352762782873173.010.6
Turkey2602252052452602.56.1
Mexico2152232042102192.14.3
Egypt1401602002201751.7−20.5
Thailand 1301301281321491.412.9

2.2. Characteristics of the Spanish Ceramic Tile Innovation System

Spain has been one of the world's leading producers and of ceramic tiles in the industry in Europe (measured in square meters), but also the largest per capita consumer, as it reached 8.1 m2 per capita in 1999 (This figure has reached 1.7 in 2011 once the building bubble was over). The ceramic tile cluster located in an area of 30 km2 provided about 36,000 direct manufacturing jobs, and more than 300 companies from different industries were related to the production of ceramic tile: ceramic tile manufacturers, glaze, pigment and clay producers, suppliers of mechanical machinery for ceramic, transport businesses, distributors, etc. (Association Spanish Tile Ceramic Industry, ASCER). In addition, different public R&D and educational centers offer special courses on the production of wall and floor tiles, thus contributing to knowledge build up in the cluster.
Overall, the innovation system is well equipped institutionally with enough public and private mechanisms to provide suitable support to the value chain. Moreover, the cluster of Castellón integrates smaller firms (73% with less than 100 employees), which are less vertically integrated, need more local resources and have to rely on external valuable services (such as design or marketing). As a result, networks are less structured and more informal [13].
The real strength of the Castellón innovation system is its systemic behavior, which has led to a diffusion mechanism of innovation that would be very difficult to reproduce in another context. Engineers and technicians from the ceramic tile producing firms are in continuous contact with technicians from enamels, pigment and glazing companies. Simultaneously, ceramic tile firms employ chemical engineers educated in the ceramic tile local college or trained in the ITC (Technology Institute for Tile Ceramic research), a local research technology center specializing in ceramic tiles). Therefore, there is a dynamic flow of information and knowledge within the innovation system network. This is the reason the enamel and glazing industry is the main signatory of contracts with the ITC and is the subsector where R&D has shown a higher development within the innovation system, transferring their knowledge through their links with ceramic tile enterprises. At the same time, these links are strengthened by the support of ITC to ceramic tile producers and the hiring of technicians with experience in the different cluster industries. All this implies a smooth flow of tacit and explicit knowledge, based on the use of a common language, culture, understanding and common personal relationships by local workers [11,12,18]. Table 2 resumes the ceramic tile cluster profile during 2013.
Table 2. Profile of the Spanish tile ceramic cluster (2013).
Interviews and Secondary DataCastellon
Cluster paradigm *Production focus; starting to change to a more sophisticated business chain
Competitive advantages *Glazing material suppliers leading the world industry; effective institutions; high know-how and tacit knowledge; efficient production process; clay in the area; collective efficiency
Ceramic tile active workers26,100
Ceramic tile firms265; 73% less than 100 workers
Ceramic tile turnover3448 M Euros
Exports55%
Export average price5.77 Euros/m2
Glazing firms26
Glazing firms turnover835.9 M euros
Glazing firms workers3487
Ceramic Equipment firms41
Ceramic Equipment workers1250
Ceramic Equipment turnover520 M euros
American segments coveredFollowers, medium and low segments covered
European segments coveredLeading Portugal, U.K. and Ireland. Followers in other markets. Medium and low segments covered
Other institutionsChambers of Commerce and other institutions
R&D personnel in Institutions **56 full time (ITC)
R&D institutes budget from projects **Around 3,635,000 Euros
Sources: This comparison has been extracted partially from secondary data and interviews, mainly referring to 2004, especially from ASCER [16], as well as interviews that were carried out; all the figures refer to the cluster. * [18]; ** data, obtained from ITC interviews.
However, a successful process of technological innovation requires technology and organizational competences by all involved actors to manage information in the acquisition of knowledge on clients’ final needs and also to manage the potential innovation contributions of customers’ final products and services. In the case of the Spanish ceramic tile industry, although the inter-organizational competences of the previously mentioned actors (equipment manufacturers, glazing and enamel producers, as well as ceramic tile manufacturers) have been recognized, on the other hand, a clear disengagement on the side of the agents belonging to the final value chain phases, such as distributors, retailers and ceramic tile fitters, has been observed. This can influence the development of a market innovation focus and those agents that have direct contact with the final customers [18].
Due to these considerations, we will try to analyze this context from another perspective: that of the value chain approach that complements the view of the clusters [19] and considers the international competitive perspective.

3. The Value Chain Approach

3.1. Theoretical Approach

When considering the Spanish tile ceramic cluster from an alternative approach the perspective of the value chain will shed some light on the analysis of the cluster’s latest evolution.
Value chain analysis was first proposed by Porter [20], who defined it as the study of the main activities any organization performs. He linked them to its strength and its competitive position. This approach evaluates which value adds each particular activity to the organization’s products or services. In our particular case, this is the main advantage of this paradigm, especially for firms competing in international markets, which require an understanding of dynamic factors within the whole value chain, including the last steps connected with final customers. Thus, it also reflects the strategic decisions of leading firms by positioning themselves in the value chains. We will relate it with the following concept: value chain governance.
For the study of the value chain dynamics we must contemplate three dimensions in the value chain [21]: (a) flow or structure of inputs and outputs; (b) geographic extension; and (c) Governance. The latter, determines the control that the various actors in the value chain can exert on the activities that take place in it. The actors and agents in a value chain directly control their own activities and are controlled directly or indirectly by other actors. In a value chain this pattern of control is referred to as Governance. Table 3 shows the four basic governance patterns: market, balanced network, directed network and hierarchy [22].
The ceramic tile industry presents examples of all of them. Our objective is to typify the existing relationship among four main actors pertaining to this value chain: (a) ceramic tile manufacturers; (b) enamel, glaze and pigment producers; (c) equipment and machinery suppliers as well as (d) ceramic tile distributors, in order to determine their degree of influence and competitiveness in the industry.
Some authors [23,24,25,26] have recently developed a conceptual framework and published some empirical studies of governance from the value chain point of view. From their position, it is possible to recognize, based on the concepts of governance [23], not only which are the actors who achieve the best performances in a certain sector or chain, but also to determine which of these have greater relevance in the decisions that have an effect on this industry. Based on this, and taking into consideration the antecedents of the Spanish ceramic tile industry, it seems that the decision-making has been managed, until now, from the production subsector, headed by the producers of enamels, glazes and pigments, as well as the mechanical equipment suppliers [12].
Table 3. Types of governance in the value chain [21,22].
TypesDefinitionCharacteristics
MarketFirms deal with each other mainly in “arms-length” exchange transactionsMany customers/many suppliers
Repeat transactions possible, but information flows are limited
No technical assistance
Balanced
network
Firms form networks in which no one firm or group of firms exercises undue control over the others. Firms prefer to deal with other members of their networks.The supplier has various customers
If the supplier has few customers, the customer has few suppliers
Intense information flow in both directions
Both sides have capabilities that are hard to substitute.
Commitment to solve problems through negotiation rather than threat or exit
Directed
network
Firms form networks that tend to be controlled by certain lead firms. The lead firms specify what is to be produced by whom, and they monitor the performance of the producing firms.The main customer takes at least 50% of the output
The customer defines the product (design and technical specification)
Monitoring of supplier performance by the customer
The supplier’s exit options are more restricted than the customer’s
The customer provides technical assistance
The customer knows more about the supplier’s costs and capabilities than the supplier knows about the customer’s
HierarchyFirms are vertically integrated, so that they can directly control all or most of the activities of the chainVertical integration of several chain stages within the firm
Supplying establishment owned by customer or vice versa
Very limited autonomy to take decisions at the local level Having to consult with or obtain permission from the “headquarters”

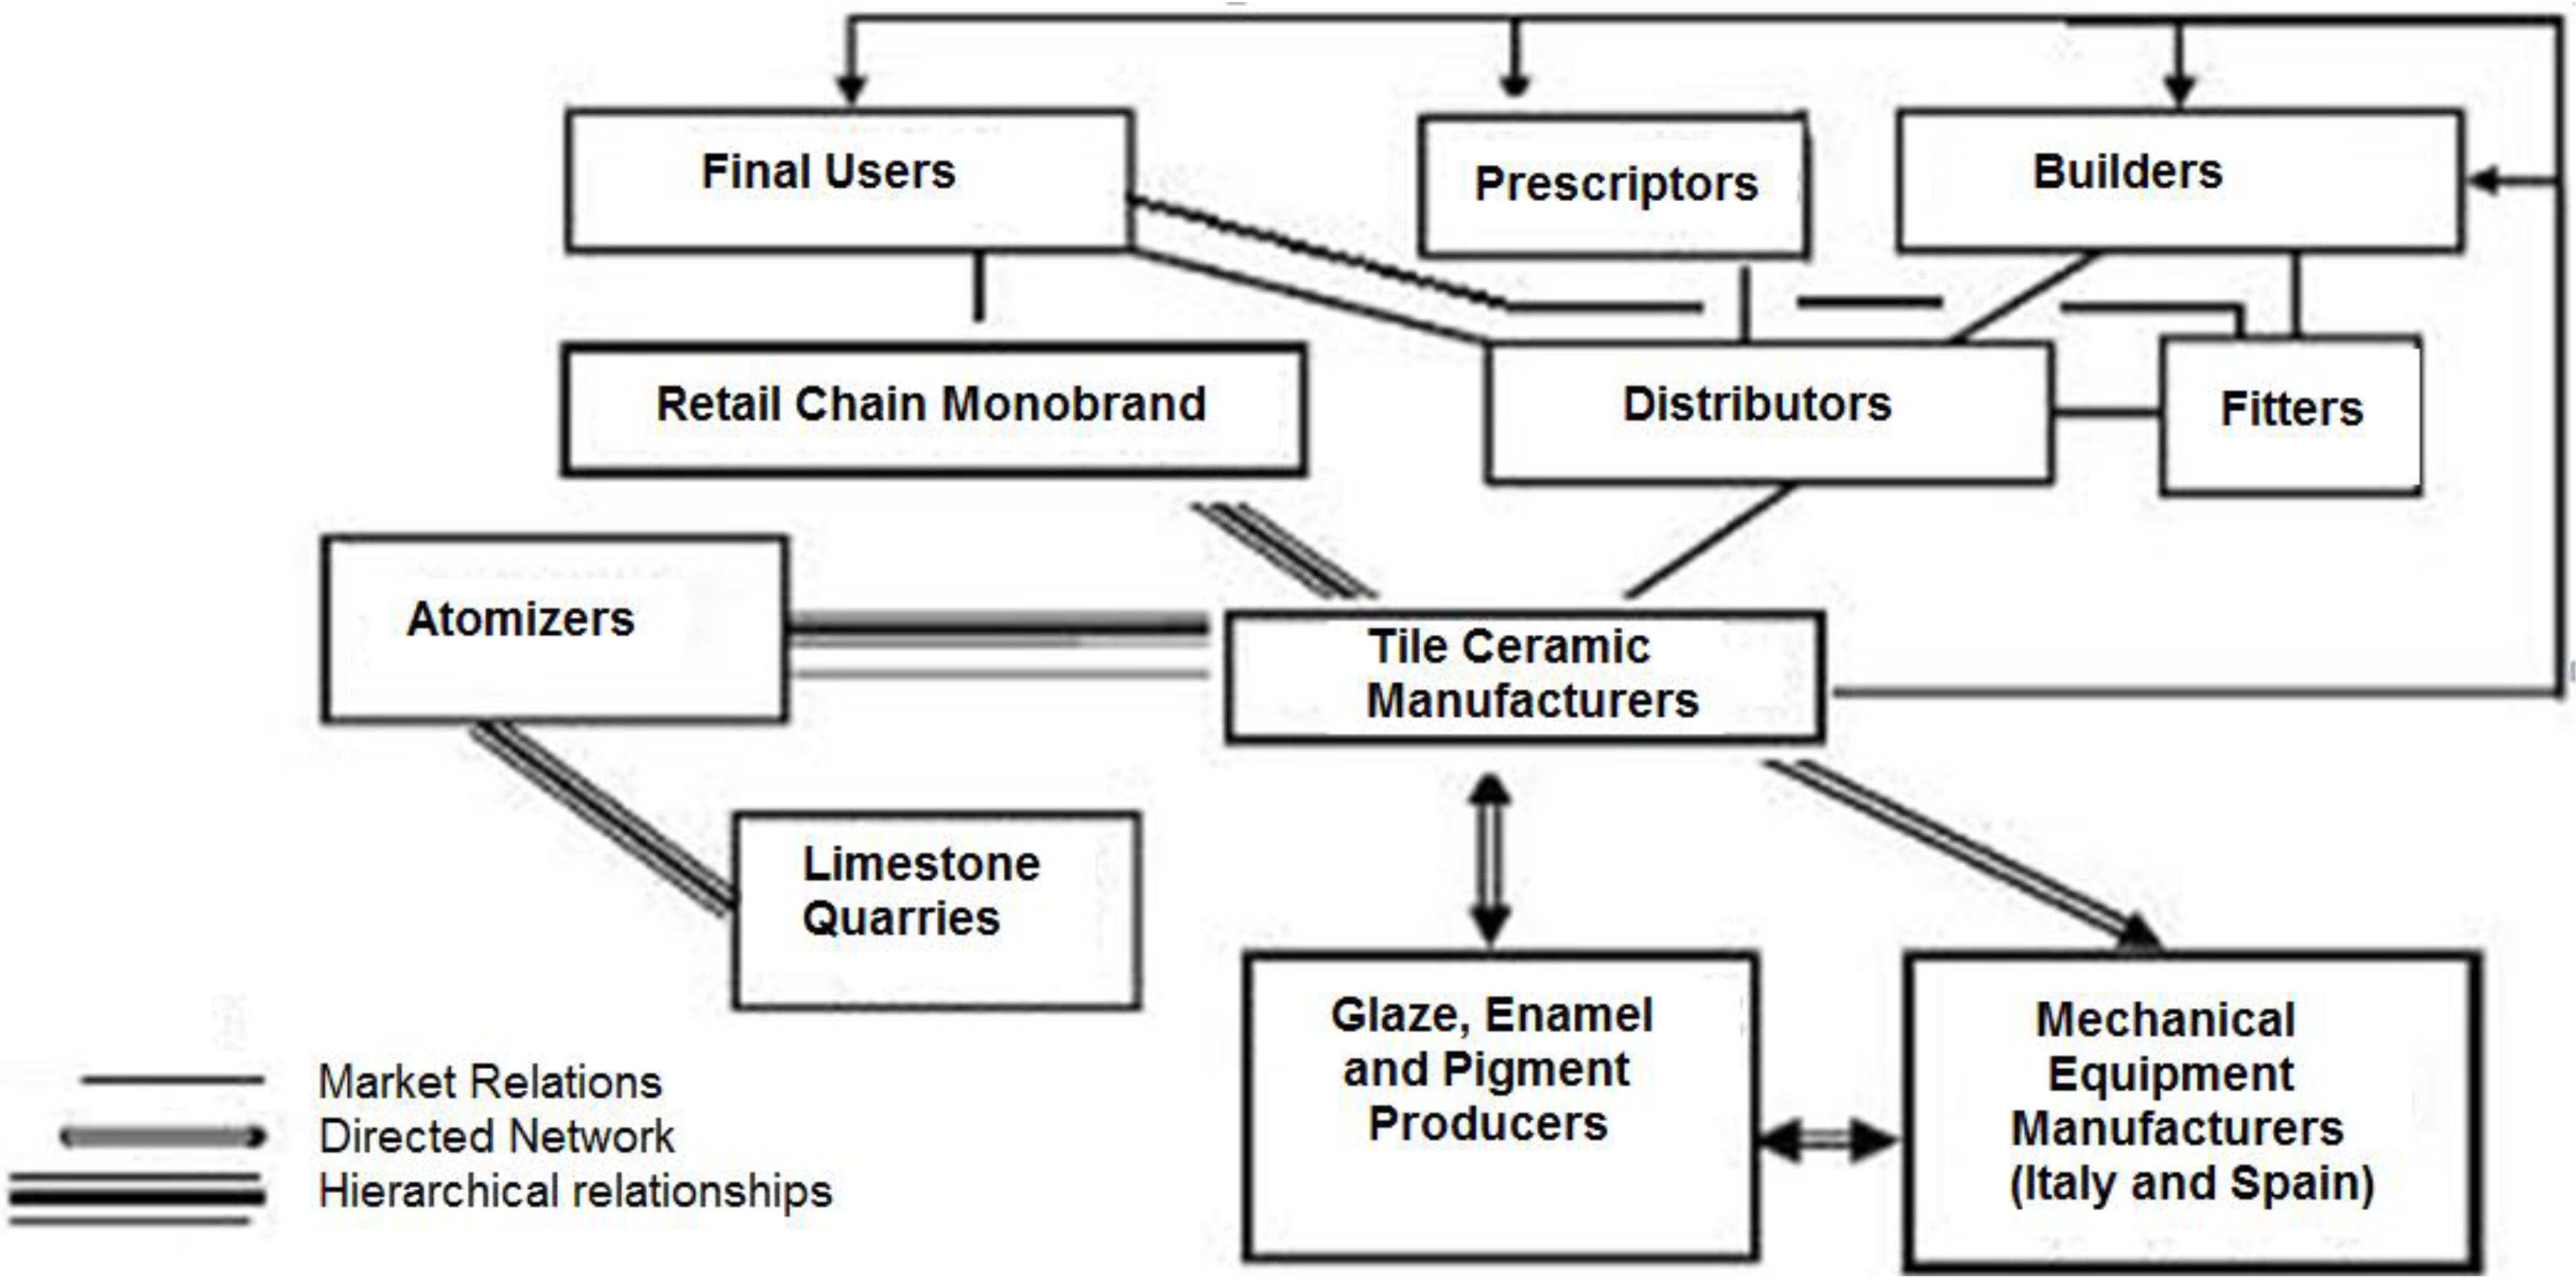
3.2. The Agents and Actors in the Value Chain

In the considered value chain, it is necessary to acknowledge the complete rank of activities required by the ceramic tile product (and service) from its conception. This is illustrated, through the different phases from production (including a combination of physical transformations and embodiments of services of several agents), as well as the delivery to the final consumers [25]. This is represented in Figure 1.
From the value chain point of view, public and private institutions support the main and secondary activities of the main actors: innovation financial support, knowledge dissemination, education and training, networking, etc, Thus, we can identify the value chain of the Spanish ceramic tile cluster as composed of the following actors: limestone producers and atomizers, Italian and Spanish mechanical equipment suppliers, enamel, glazes and pigment producers, public support institutions, private support associations, education centers, distributors, logistic and auxiliary firms, congresses and exhibitions, other agents, such as fitters, etc.
Figure 1. Actors and agents in the value chain of the Spanish ceramic tile cluster [13].
Admsci 04 00155 g001

3.3. Governance Measurement Indicators

Following [24], the governance paradigm, the power of the chain can be related, in a complex form, with the relative size of an individual organization within the chain. It has been thought that the larger the size of the firm, the higher would be its influence in the value chain; in this sense, these authors list many potential indicators to measure it, such as the share of chain sales, the share of chain value added, the share of chain profits, the relative rate of profit, the share of chain buying power, control over a key technology and distinctive competence and, finally, the holder of chain “market identity” (e.g., brand name).
The various measures are listed in Table 4, which includes qualitative and quantitative indicators. Therefore, the agents, who would show the best performance in these indicators, would be those having a higher governance power within the value chain. However, as can be observed, some of these indicators are qualitative, and this fact increases the difficulties in finding acceptable information to quantify the governance level in a given chain. Moreover, those quantitative indicators derive from accountancy measurement, and although they are most utilized, they are subjected to opportunistic manipulation and their value calculated normally with tax criteria [13].
Table 4. Indicators of governance in the value chain [24].
IndicatorsSource of DataType
Share of chain salesBalance sheetsQuantitative
Share of chain value addedFirm-level interviews,
performance data
Quantitative, Qualitative
Share of chain profitsBalance sheetsQuantitative
Rate of profitBalance sheetsQuantitative
Share of chain buying powerFirm-level interviewsQuantitative, Qualitative
Control over a key technology (e.g., drive-train in autos) and holder of distinctive competenceFirm level interviews,
patent registration
Quantitative Qualitative
Holder of chain “market identity” (e.g., brand name)Firm-level interviews;
studies of market share of brands in final markets
Qualitative

4. Research Methodology

Since those indicators listed in Table 3 are of qualitative and quantitative types, the field research has been based on both approaches.
The qualitative data was based on a field survey with interviews carried out during 2009–2010 among 26 ceramic tile manufacturers, 6 enamel, glaze and leading pigment producers, 10 mechanical equipment suppliers and 20 ceramic tile distributors. Interviews were held, as well, with the leading Italian and Spanish ceramic tile industrial associations, such as ASSOPIASTRELLE (Industry Association of Italian Tile Ceramic), ACIMAC (Industry Association of Italian Tile Ceramic Mechanical Equipment Suppliers), ASCER, ANFFEC (Industry Association of Spanish Glaze, Enamel and Pigment Producers), ANDIMAC (Industry Association of Spanish Ceramic Tile Distributors), PROALSO (Industry Association of Spanish Tile Ceramic Fitters) and ASEBEC (Industry Association of Spanish Tile Ceramic Mechanical Equipment Suppliers). It was based, as well, on the visits paid during 2008–2010 to the two leading international exhibitions of ceramic tiles: CERSAI (International Exhibition of Ceramic Tile and Bathroom Furnishings) held in Bologna (Italy) and CEVISAMA (International Exhibition of Tile Ceramic, Natural Stone and Bathroom Furnishings) held in Valencia (Spain), as well as the attendance of the ceramic tile conference, QUALICER (World Congress on Ceramic Tile Quality), held in Castellon (Spain).
Quantitative data was based on the data collected (for the period 1995–2006) from SABI (Sistema de Análisis de Balances Ibéricos) and AMADEUS (Financial Data & Information for Public and Private Companies Across Europe), both managed by Bureau van Dijk, a database that collects financial company information and business intelligence for companies in Spain, Portugal and Europe. Financial data related with Spanish ceramic tile producers (226), Spanish ceramic tile mechanical equipment suppliers (41), Spanish glaze, enamel and pigment producers (25), Italian ceramic tile mechanical equipment suppliers (52) and Spanish ceramic tile distributors (90) was collected and analyzed. Finally, data on registered patents by various actors in the ceramic tile industry, in Spain and Italy, were collected from the European Patent Office website (Espacenet).

5. Analysis of Results

5.1. Governance Relationships among the Analyzed Actors: Qualitative Results

In order to begin our analysis, we will employ those qualitative indicators pointed out in Table 3. The results of the interviews and surveys of the field study [18] show the most representative characteristics of the power relations of the ceramic tile value chain that have been outlined in Figure 2.
Figure 2. Governance relationships among the actors of the ceramic tile industry.
Admsci 04 00155 g002
The analysis will commence in the inferior part of the chain, where the relationships between ceramic tile manufacturers and atomizer firms are represented. These firms are owned by groups of tile manufacturers whose relationship is that of the hierarchic type. The relationships among the enamel, glaze and pigment producers with the tile manufacturers adjust, under our perspective, to a balanced network, given the fact that each manufacturer works with various glaze suppliers. Hence, there exists an intense information flow between both, attributable to the cooperation activities in both directions. These activities include the supply of design and product development, as well as general technology transfer.
Furthermore, the suppliers of ceramic tile mechanical equipment constitute a balanced network with the ceramic tile manufacturers and the glaze, enamel and pigment producers, collaborating with the latter in order to adapt their applications to the machinery. In the Spanish case, the ceramic tile manufacturers are related with their Italian counterparts, as well as with the Spanish ceramic tile mechanical equipment suppliers (most of them related with the Italian ceramic tile mechanical equipment suppliers). In this sense, the interaction between these two subsectors is remarkable, and it has contributed to developing a series of technology innovations, which have contributed to the technological leadership of the European ceramic tile industry [11,12]. Even though, all these innovations generated in the Spanish or Italian industries have been disseminated worldwide [12].
In relation to the commercialization phases of ceramic tile products in the Spanish industry, it has been observed clearly how the relations are of the market type in the majority of cases. However, an exception is the single brand retail stores of a few ceramic tile manufacturers (4–5), which represent a vertical integration and have interchanges that are governed by hierarchic relationships. This subsector is experiencing actual changes with a new association (ANDIMAC) being started and new marketing alternatives gaining momentum. These market relations are formed in such a way, since most of the producers and distributors have an ample range of clients (or suppliers). The information flows are restricted to the transaction operations, leaving aside aspects related to the contribution of each actor to the improvement of the activities and competitiveness of their counterpart, confirming previous results [27].
In the case of the tile fitters, the same interaction pattern has been noted for market relations, where the prevailing condition is the price of services, without having observed any other patterns of interaction that would allow a relevant influence on the process. From our point of view, this is a negative factor. In the case of the British market, the fitters and their training have played an excellent role in the market growth in the utilization of ceramic tiles in the building industry.

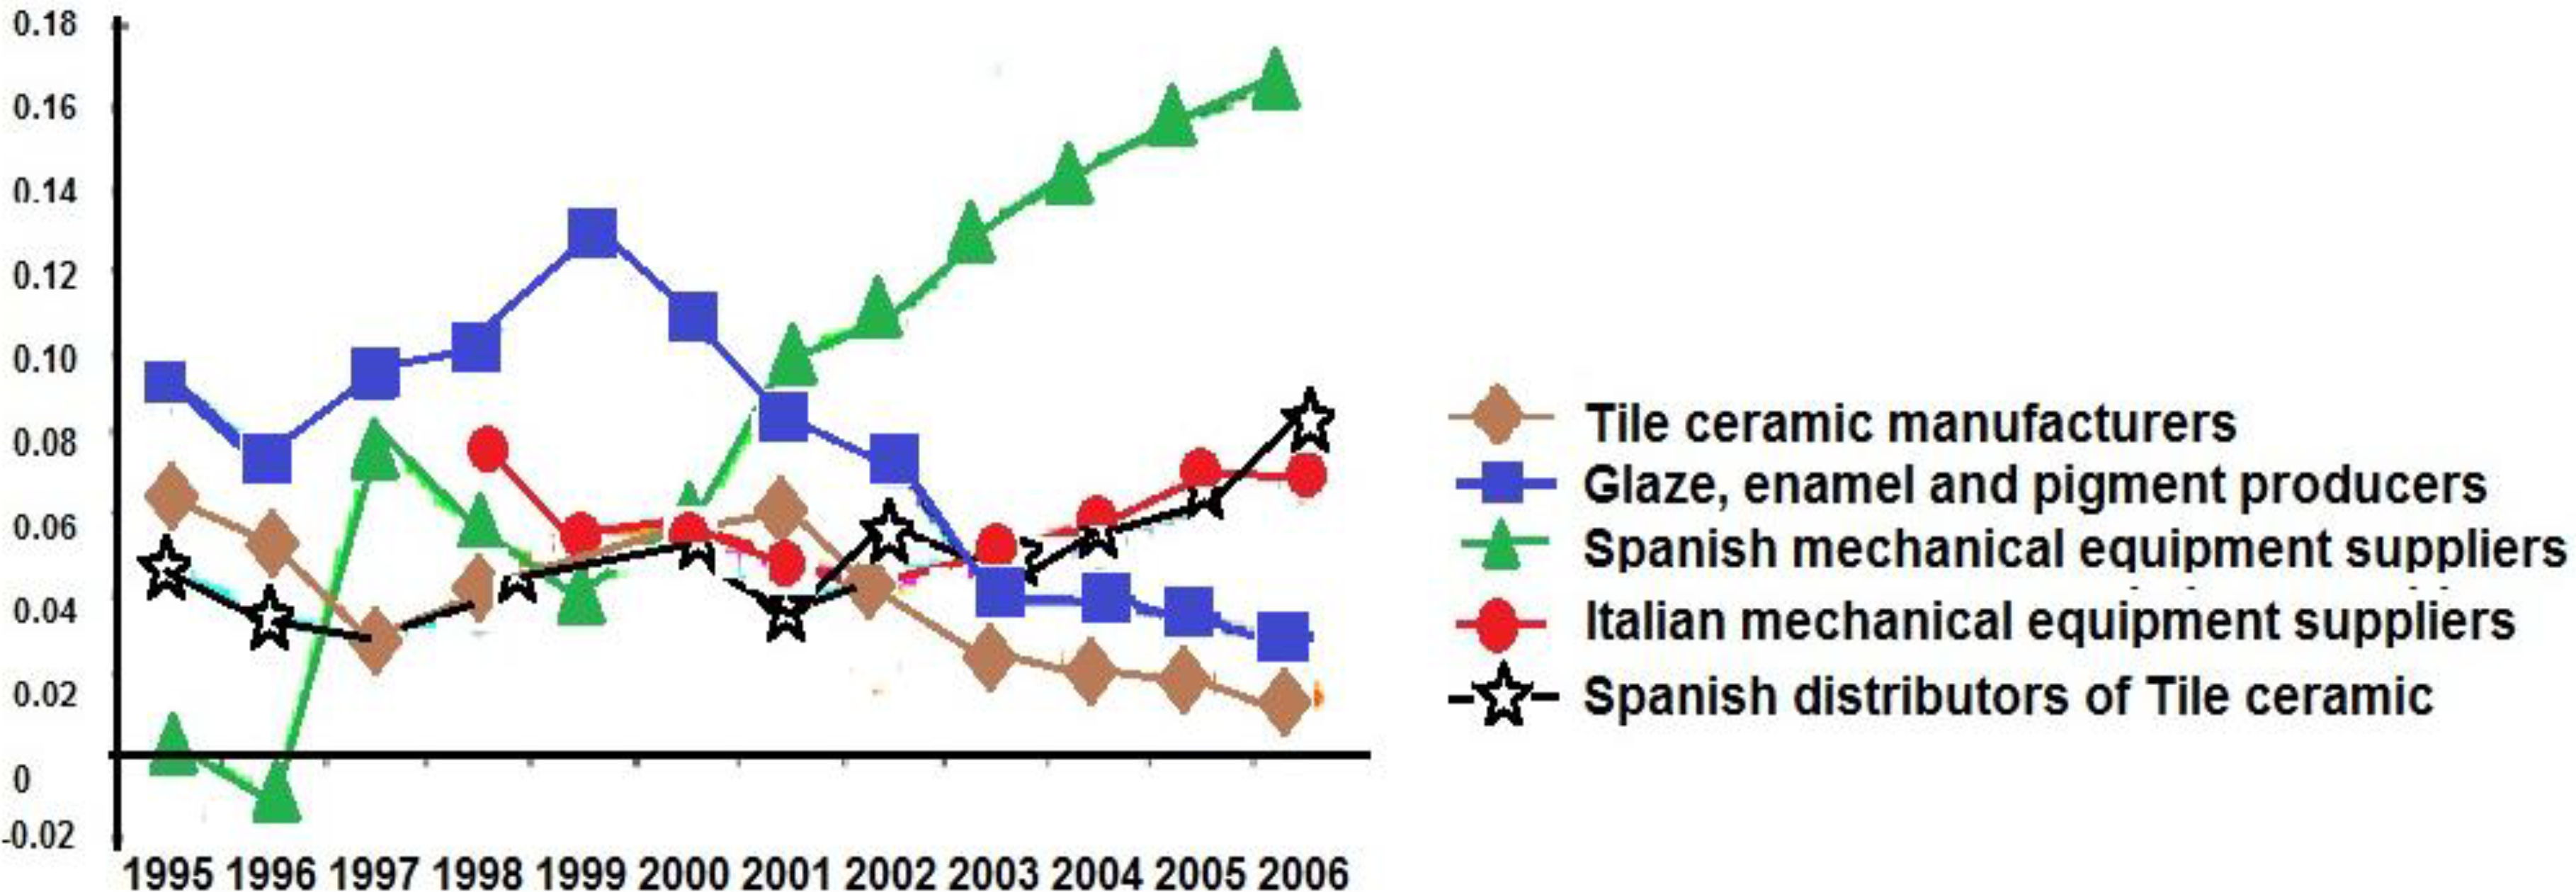
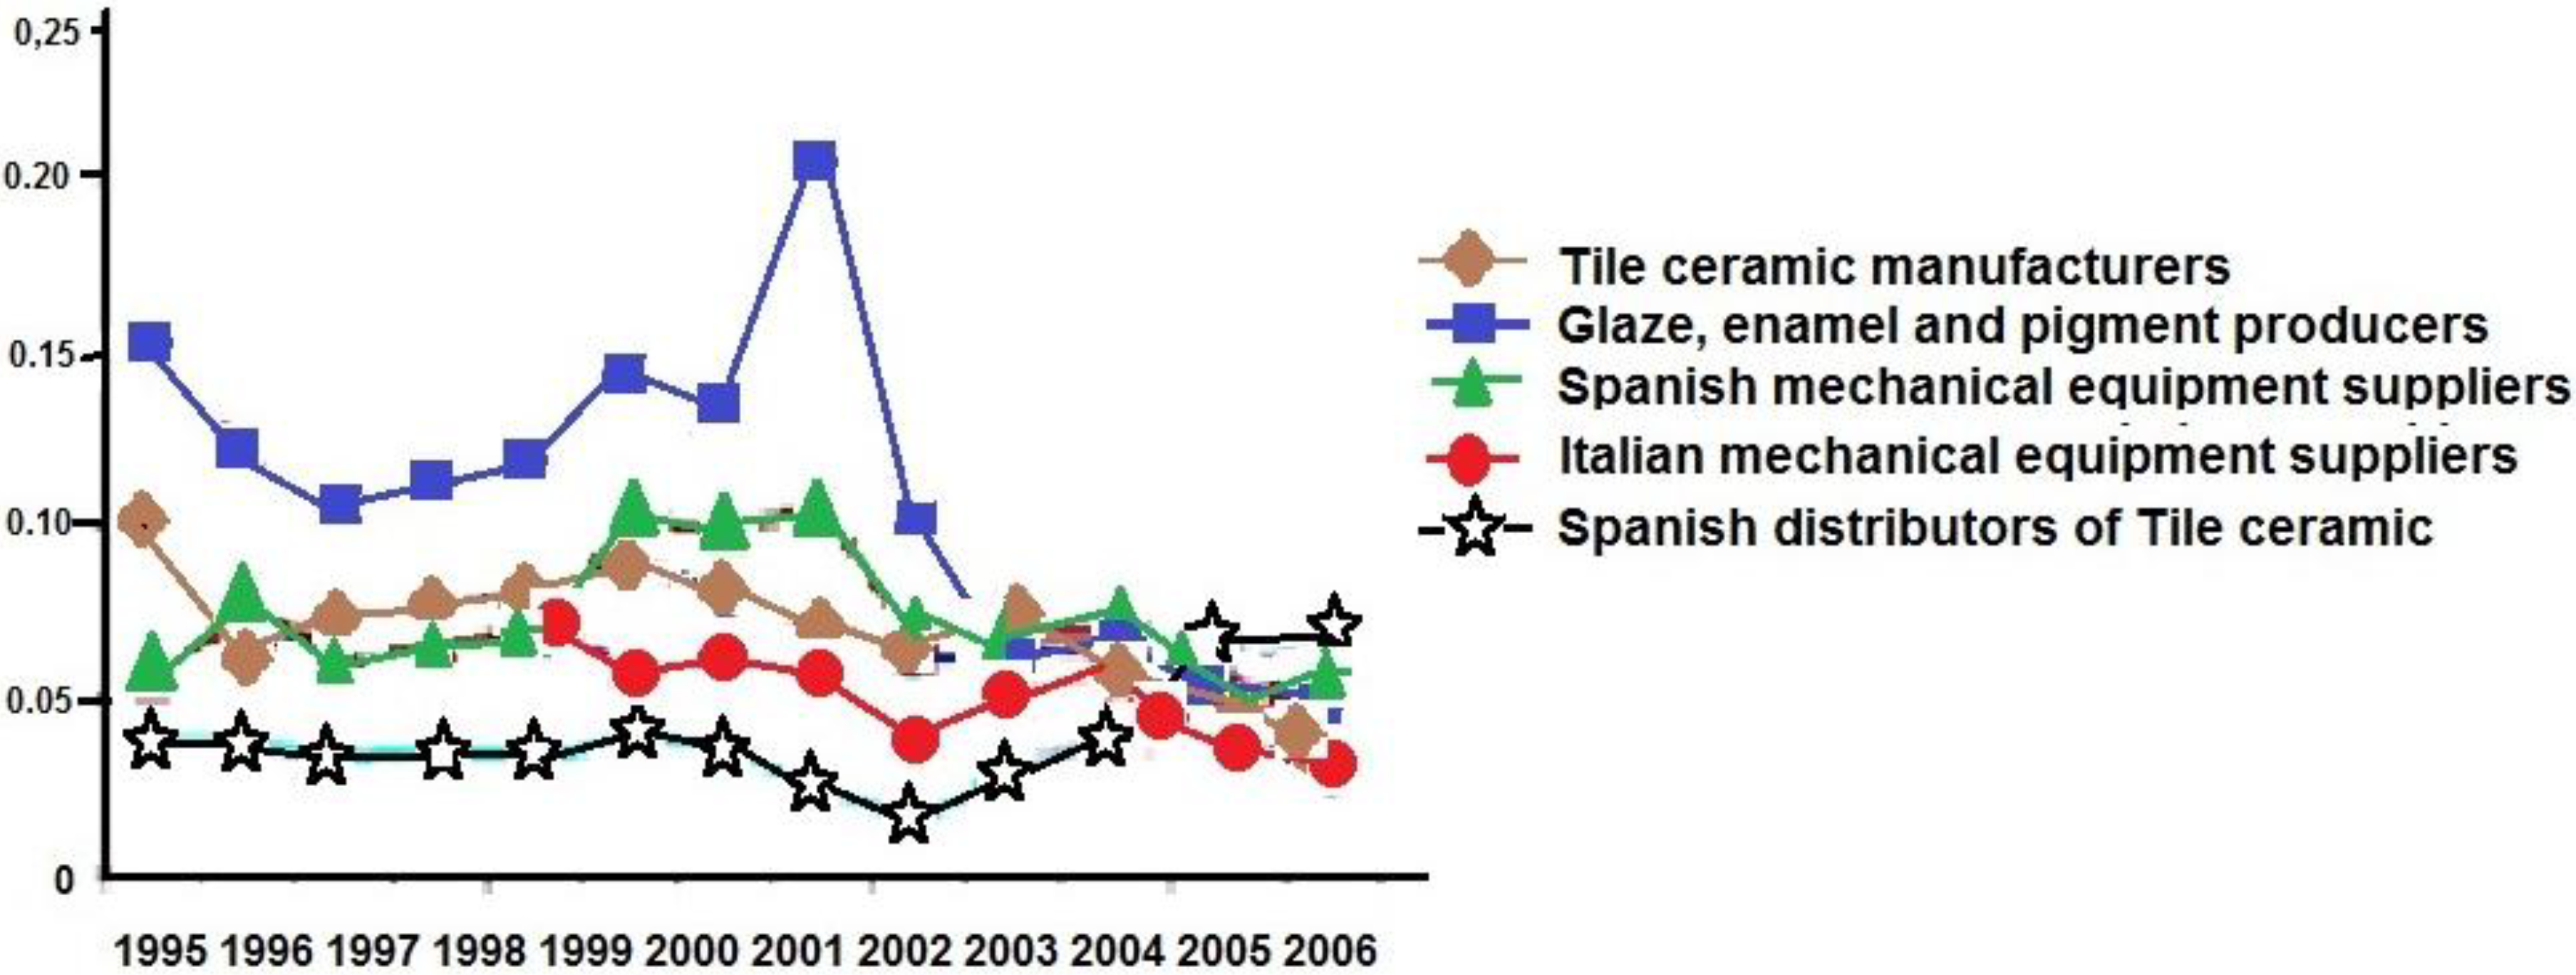
5.2. Governance Relationships among the Analyzed actors: Quantitative Results

With the purpose of complementing the results outlined in the governance map presented in Figure 3 and following the quantitative indicators proposed [24] and summarized in Table 4, we intend to compare the performances of five relevant ceramic tile cluster actors: ceramic tile manufacturers, enamel, glaze and pigment producers, Spanish and Italian mechanical equipment suppliers and, finally, Spanish ceramic tile distributors. For this purpose, we will employ quantitative indicators of financial performance related to the distribution of profits and rents to the inner side of the chain and extend those used in previous studies [13] (see Table 5 below). These are a reasonable proxy for those performance indicators pointed out in Figure 5.
Table 5. Analyzed ratios.
RatioAbbreviation
Return on AssetsROA
Earnings before interest, taxes, depreciation and amortization (EBITDA) on salesEBITDA
Operating profit on assetsOPA
In order to select the firms in each individual sector from the SABI database, we have used the database of firms provided by the different industry associations from the tile sector: ASCER for the ceramic tile manufacturers, ACIMAC for the Italian mechanical equipment suppliers, ANFFEC for the Spanish enamel, glaze and pigment producers, as well as ASEBEC for the Spanish ceramic tile mechanical equipment suppliers. However, in the case of the Spanish ceramic tile distribution firms, there was no database available providing centralized and complete information about its population. Therefore, it was necessary to resort to the industrial activity codes (NACE, Statistical classification of economic activities in the European Community) and later verify their activity by telephone. This was in the context of a previous research project being carried out in the ceramic tile distribution subsector [27].
These lists were contrasted in order to obtain the necessary data to construct the indicators. Moreover, two economic data bases were used: SABI for the Spanish firms and AMADEUS for the Italian equipment manufacturers. Thus, the indicators were drawn for temporary series from 1995 to 2006 for the majority, except for the Italian ceramic tile mechanical suppliers, for which data was only available from 1998.
The representation of the means of returns on assets (ROA), operating profits on assets (OPA) and earnings before interest, taxes, depreciation and amortization on sales (EBITDA) for the analyzed sectors are4 shown in the following Figure 3, Figure 4 and Figure 5. Additionally, a multivariate analysis has been applied to verify the significant differences in the analyzed variables’ means. These differences are significant for p < 0.05 for the majority of the reviewed years. In addition, if we apply procedures to analyze each variable per year and sector, it can be pointed out again that such significant per year differences persist. However, because of the limitation of the paper’s length, it is not possible to include all the tables for each variable.
Figure 3. Return on assets (ROA).
Admsci 04 00155 g003
Figure 4. Operating profit on assets (OPA).
Admsci 04 00155 g004
Figure 5. EBITDA on sales.
Admsci 04 00155 g005
The three indicators emphasize the performance of the enamel, glaze and pigment producers that have experienced performances higher than other sectors shown in previous years, with means above the average of the other sectors. However, a reduction tendency can be observed in the last few years. This can be related with the sales reduction in the last three years (ASCER) and the increasing competition from other countries. Another cause could be the recent increase in the production of porcelain tile (ASCER), a segment in which the suppliers of Italian mechanical equipment possess a dominant role because of technology reasons (A type of ceramic made of a very fine mixture of clays and minerals). These special clays allow porcelain tile to be fired at temperatures even higher than ceramic tile, typically exceeding 1200 degrees (C). The higher temperature results in a very dense tile with higher mechanical properties (Again, new technology and tendency developments may change this situation). Moreover, this presents a contrast with the decrease in the production of conventional ceramic tile, which represents a typology where the enamel producers exert a greater influence [28].
On the other hand, although the temporary series limits the data to 1998, the Italian mechanical equipment suppliers have reported stable return on assets ratios during the last few years. However, this indicator is sensibly lower than that observed in the Spanish mechanical equipment suppliers, closely related (and dependent on) the Italian, but benefiting from lower investments in R&D and production equipment. The Spanish sector of mechanical equipment suppliers [11] should be catalogued as auxiliary (to the Italian), carrying out technical support, repair and maintenance services and manufacturing spares and pieces of intense consumption, such as print, screens, molds, mechanical spares, etc. This added to the lower labor costs (in Spain), resulting in higher returns for the Spanish firms. The subsector of Spanish mechanical equipment suppliers has made, in the last three years, a relevant cooperative effort. This fact can explain its export increase, which, according to ASCER (2007), has experienced an accumulated growth during 1998–2004 of more than 400%. It must be considered, as well, that several Italian firms have delegations located in the Spanish cluster from which they serve export markets worldwide.
The case of the Spanish ceramic tile manufacturers presents a similar condition to that of the enamel glaze and pigment producers. After several years of maintained growth, a decreasing turnover tendency can be observed, due to the increase in competition, especially in countries with an emerging ceramic tile industry, distinctive of a supply and not of a demand market, as has occurred in previous years.
Additionally, the distributors of ceramic tiles, a subsector for which there were no available previous studies, show stable return on asset levels throughout the analyzed period. Although, with some variations, the economic indicators show a more stable growth comparable to other influential subsectors in the ceramic tile industry, such as glaze, enamel and pigment producers and the Italian mechanical equipment suppliers.
From these results, we could draw innovative conclusions in the analysis of governance levels in the ceramic tile industry value chain. On the one hand, it has been corroborated, throughout financial and accountancy indicators, that the subsectors of glaze, enamel and pigment producers and the mechanical equipment suppliers present the best performance levels in the ceramic tile industry. However, a tendency to decrease their rents in the chain in favor of the ceramic tile distribution subsector could be observed, which shows a sustained performance with a slight positive tendency to grow.
Finally, we have considered an alternative quantitative indicator [24] pointed out in Table 4: the control over key technologies in a value chain. The analysis of this indicator confirms that the influence of these subsectors, glaze, enamels and pigment producers, as well as of the mechanical equipment suppliers in the ceramic tile value chain pointed out during the interview phase, is due to its strong capacity for technological innovation. This fact, enhanced by the strong cooperation with the ceramic tile manufacturers, has allowed the reinforcement of these subsector industries, as a leading decision driver.
Figure 6 illustrates the evolution of the key technologies, which have contributed substantially to the process productivity and to radical product improvements. It also shows the influencing agent. Here, we have followed the S curve paradigm proposed by Foster [29] to analyze technology life cycles. It is based on the information provided by field interviews and industry references [30].
Figure 6. Technology discontinuity curves for the ceramic tile industry [12].
Admsci 04 00155 g006
This shows how the development of process technologies, such as continuous rolling kilns, single firing processes, porcelain stoneware and gravure printing (Rotocolor), has transformed the ceramic tile production process. The new porcelain decoration (double-layer molds, etc.) systems have escorted the tile industry development. These were basically led by the mechanical equipment subsector and later followed by the enamel, glaze and pigment subsector. In this direction, the development of a relevant technology disruption in Spain, the digital ceramic tile decoration, has changed the ceramic tile value chain globally [30].
Another quantitative perspective to study key technology control is the analysis of patents drawn from the European Patent Office. It compares the patents published in Italy during the period 1988–2004 by the glaze, enamel and pigment producers, as well as the mechanical equipment suppliers. It has been illustrated in Figure 7.
Figure 7. Published patents in the ceramic tile industry, Spain and Italy [31].
Admsci 04 00155 g007
When comparing the indicators, we have added the patent perspective from Spain during a later period, 1997–2007. However, the lower patenting culture of the Spanish industry has to be taken into account here. The results are useful in our case, since both clusters follow similar technology paradigms. It can be observed how the technological development, reflected in the patents of the mechanical equipment sector, leads to the evolution followed by the patents of producers of enamel glaze and pigment related to product and processes. It has to be pointed out here that the ceramic tile manufacturers do not register patents at all, since the glaze sector is the leading technology agent in their processes.
In spite of the actual existing consensus on the relevance of mechanical equipment suppliers and glaze, enamel and pigment subsectors and though these industries continue to consider technology innovation as a key success factor, their performance is appreciated in conjunction with the decreasing tendency of the ceramic tile manufacturers. The same approach can be applied to the auxiliary sector of Spanish mechanical equipment suppliers, though they have upgraded their value chain role by profiting from their increasing services to the Spanish ceramic tile manufacturers. Furthermore, the ceramic tile distributor subsector, which until now has not represented a relevant agent role within the value interchanges inside the chain, presents greater stability in its levels of returns, margins and operation profits. This can be interpreted from the paradigm change in the ceramic tile sector from a production push to a demand pull model and the sector’s globalization.
The previous considerations allow us to conclude that, to improve the performances of classical value chain actors at the level of value interchanges and governance in the ceramic tile chain, important changes at the strategic level are taking place. Although technological innovation appears as a critical element within any industry, it will be necessary to propitiate value interchanges with other types of actors, such as distributors and retailers, which provide a clearer vision of the customer point of view and its requirements. It is therefore necessary to transform the market relationships, which are maintained in the last phases of the value chain, towards cooperation relationships. In the context of governance, this leans towards balanced networks, which will allow the flow of continuous and valuable information for the adaptation of the processes and products, to comply with the expectations and requirements of the clients.

6. Conclusions

The importance of technological innovation as a competitive success factor for the Spanish ceramic tile industry is unquestionable; especially that of the mechanical equipment suppliers and the glaze, enamel and pigment subsectors, which have differentiated their performance throughout the last decade in comparison with other ceramic tile subsectors. However, in view of the new empirical evidence that has been discussed in the present study, it is obvious that it is necessary to complement their efforts in technology innovation with an applied strategy with those actors and agents that pertain to the commercialization phases of the ceramic tile industry. For those reasons, we have analyzed the ceramic tile industry, not solely from the point of view of clusters and relations, but also with a review of the qualitative nature from the point of view of the value chain and the concepts of governance, which have a higher competitive approach.
Thus, we have used an analysis of finance and accountant performance indicators, applied to five of the actors belonging to the industry. Consequently, we have developed an integrated methodology that permits the analysis of an industry from the perspective of the different relationships among actors and their valuable contribution to the industry in general. However, more information is required to extend the conclusions in a specific form for each actor and especially in the case of the final phases of the value chain, where there are few studies available among the various distribution modes.

Author Contributions

Jose Albors-Garrigos coordinated the research and was responsible of its guidance. Blanca de Miguel Molina carried out the financial statistical analysis on the quantitative indicators while Maria de Miguel-Molina developed the patent search and analyzed the patent data.

Conflicts of interest

The authors declare no conflicts of interest.

References

  1. Porter, M.E. Clusters and the New Economics of Competition. Harv. Bus. Rev. 1998, 76, 77–90. [Google Scholar]
  2. OECD. National Innovation Sysstems. Organization for Economic Development: Paris, France, 1997. [Google Scholar]
  3. Freeman, C. Technology and Economic Performance: Lessons from Japan; Pinter: London, 1987. [Google Scholar]
  4. Cooke, P.; Gomez-Uranga, M.; Etxebarria, G. Regional innovation systems: Institutional and organisational dimensions. Res. Policy. 1997, 26, 475–491. [Google Scholar] [CrossRef]
  5. Camagni, R. Towards a Concept of Territorial Capital. In Modelling Regional Scenarios for the Enlarged Europe; Capello, R., Camagni, R., Chizzolini, B., Fratesi, U., Eds.; Springer: Berlin, Germany, 2008. [Google Scholar]
  6. Johannisson, B.; Ramírez-Pasillas, M.; Karlsson, G. The institucional embeddedness of local inter-firm networks: A leverage for business creation. Entrep. Reg. Dev. 2002, 14, 297–315. [Google Scholar] [CrossRef]
  7. Schumpeter, J. The Theory of Economic Development: An Inquiry into Profits, Capital, Credit, Interest and the Business Cycle; Harvard University Press: Cambridge, MA, USA, 1911; (1934 translation, Cambridge). [Google Scholar]
  8. Patel, P.; Pavitt, K. The Nature and Economic Importance of National Innovation System. Sci. Technol. Ind. Rev. 1994, 14, 125–138. [Google Scholar]
  9. Freeman, C. The Economics of Industrial Innovation; Penguin Books, Ltd.: London, UK, 1974; pp. 197–198. [Google Scholar]
  10. Freeman, C. Innovation and growth. In The Handbook of Industrial Innovation; Dogson, M., Rothwell, R., Eds.; Edward Elgar: Aldershot, UK, 1994. [Google Scholar]
  11. Albors, J. Study and diagnosis on the industry of machinery for the ceramic tile industry. In Técnica Cerámica; Anual Report: Barcelona, Spain, 2000. (In Spanish) [Google Scholar]
  12. Albors, J. Networking and technology transfer in the Spanish ceramic tiles cluster: Its role in the sector competitiveness. J. Technol. Transf. 2002, 27, 263–273. [Google Scholar]
  13. Hervas-Oliver, J.L.; Albors-Garigos, J.; Dalmau Porta, J.I. External ties and the reduction of knowledge asymmetries among clusters within global value chains: The case of the ceramic tile district of Castellon. Eur. Plan. Stud. 2008, 16, 507–520. [Google Scholar] [CrossRef]
  14. Pavitt, K. Sectoral patterns of technical change: Towards a taxonomy and a theory. Res. Policy. 1984, 13, 343–373. [Google Scholar] [CrossRef]
  15. Albors-Garrigos, J.; Hervas-Oliver, J.L. Adoption of Contingent Technology Production Strategies in Mature Industries: An Empirical Study. In Proceedings of the IBIMA Conference, Marraketch, 11 November 2009.
  16. Ascer. Asociación Española de Fabricantes de Azulejos y Pavimentos Cerámicos. Available online: http://www.ASCER.es (accessed on 15 November 2013).
  17. Infotile. International online directory of ceramic tile, stone and allied products and manufacturers. Available online: http://www.Infotile.com (accessed on 20 October 2013).
  18. Albors-Garrigos, J.; Hervas-Oliver, J.L. The European tile ceramic industry in the XXI century. Challenges of the present decade. Bol. Soc. Esp. Cer. Vidrio 2006, 45, 13–21. [Google Scholar]
  19. Belussi, F.; de Propis, L. They are industrial districts, but not as we know them! In Handbook of Industry Studies and Economic Geography; Belussi, F., de Propris, L., Eds.; Edward Elgar: Chentelham, UK, 2014. [Google Scholar]
  20. Porter, M.E. Competitive Advantage: Creating and Sustaining Superior Performance. The Free Press: New York, NY, USA, 1985. [Google Scholar]
  21. Manual for Value Chain on Homeworkers in the Garment Industry. Available online: https://www.ids.ac.uk/idspublication/manual-for-value-chain-research-on-homeworkers-in-the-garment-industry (accessed on 17 June 2014).
  22. Humphrey, J.; Schmitz, H. Governance in global value chains. IDS Bulletin 2001, 32, 19–29. [Google Scholar] [CrossRef] [Green Version]
  23. Gereffi, G. A commodity chains framework for analysing global industries, in Institute of Development Studies, 1999, Background Notes for Workshop on Spreading the Gains from Globalisation. Available online: http://www.ids.ac.uk/ids/global/conf/wkscf.html (accessed on 21 October 2013).
  24. Kaplinsky, R.; Morris, M. A Handbook for Value Chain Research; International Development Research Centre (IRDC): Ottawa, Canada, 2001. [Google Scholar]
  25. Kaplinsky, R.; Readman, J. Integrating SMEs in Global Value Chains: Towards Partnership for Development; UNIDO: Vienna, Austria, 2001. [Google Scholar]
  26. Schmith, H. Does Local Co-operation Matter? Evidence from Industrial Clusters in South Asia and Latin America. Oxf. Dev. Stud. 2000, 28, 323–336. [Google Scholar] [CrossRef]
  27. Albors, J.; Marquez, P.B. Relationships manufacturer distributor as key competitive elements in the case of the spanish ceramic tile cluster. Empirical analysis of the moderating factors. Bol. Soc. Esp. Ceram. V 2008, 47, 339–344. [Google Scholar] [CrossRef]
  28. Meyer-Stamer, J.; Maggi, C.; Seibel, S. Improving upon Nature. Creating Competitive Advantage in Ceramic Tile Clusters in Italy, Spain, and Brazil; INEF Report 54; Institut für Entwicklung und Frieden: Duisburg, Germany, 2001. [Google Scholar]
  29. Foster, R. Innovation. In The Attackers Advantage; Mckinsey: New York, NY, USA, 1986. [Google Scholar]
  30. Albors-Garrigos, J.; Hervas-Oliver, J.L. Disruptive Technology in Mature Industries: Its Contribution to Industry Sustainability. In Proceedings of the PICMET’13: Technology Management in the IT-Driven Services (PICMET), San Jose, CA, USA, 28 July 2013–1 August 2013; pp. 585–596.
  31. EPO. European Patent Office. Available online: http://www.epo.org/searching/free/espacenet.html (accessed on 22 October 2013).

