An Analysis of the Risk Posed by Leachate from Dumpsites in Developing Countries


1
Department of Civil, Environmental, Architectural Engineering and Mathematics, University of Brescia, Via Branze 43, 25123 Brescia, Italy
2
Faculty of Arts, Science and Technology, The University of Northampton, St George’s Avenue, Northampton NN2 6JD, UK
*
Author to whom correspondence should be addressed.
Environments 2018, 5(9), 99; https://doi.org/10.3390/environments5090099
Submission received: 20 July 2018
/
Revised: 28 August 2018
/
Accepted: 30 August 2018
/
Published: 1 September 2018
(This article belongs to the Special Issue Innovative Processes and Technologies for the Management of Hazardous Waste)
Abstract
:The disposal of municipal solid waste into primarily dumpsites in developing countries causes a number of potential public and environmental health risks. While there have been various studies that have evaluated the contaminants that cause the risks, these studies have generally not examined in a holistic way the manner in which these contaminants move. This study therefore sought to model the flow of a range of contaminants in dumpsites (As, Cd, Cu, Pb, Ni, Zn), and potential health risks as a means of enabling the more effective siting of facilities to reduce the risks posed. The study proposes a conservative model, using well consolidated equations and assumption, taking into account the path the pollutant makes to reach the water table and the point of exposure. The modelling may be useful to easily identify the boundaries of the area of risk related to the presence of a dumpsite in a Developing Country, beyond which a local community may use or build a safe well for drinking water. The results show as the area of risk is large and varies significantly with changes in input parameters, suggesting that without site-specific information it is better to follow conservative assumptions.
1. Introduction
According to the United Nations Environment Programme (UNEP) and the International Solid Waste Association (ISWA) [1], while in developed countries, municipal solid waste (MSW) generation rates are beginning to stabilize, or even show a slight decrease, as economies continue to grow rapidly in developing countries, per capita waste generation rates are increasing steadily. This rise is largely due to increases in populations, migration to cities and the development of economies. Crucially, the organic fractions comprise a greater percentage of the MSW arising in developing countries (typically 50–70% of all MSW) than in developed countries (typically 20–40%) [2,3].
Open dumpsites are common in developing countries [1,2,3,4,5,6,7]. Wastes disposed of in dumpsites can pose several public and environmental health risks including groundwater pollution [8,9], heavy metals contamination in the soil [10], as well as the production of greenhouse gas emissions [6,11] and volatile organic compounds (VOCs) [12]. Contamination of ground and surface water in urban areas in low-income countries with organic, inorganic and microbial pollutants due to contamination from leachate is a common and significant problem [13,14].
Leachate formation is dependent on the water balance of landfill site and it takes place when the moisture content in waste cell exceeds its field capacity, the maximum moisture content that a porous medium is able to hold [15]. Typically, the organic fraction of MSW is both the key and the most ‘nutrient rich’ component of the water [1,16,17].
Effectively managing the waste and the potential risks posed in a developing world context is often challenging [18]. For example, there is often limitation in access to effective policies, enforcement, finance and suitable skills and competencies [7,19,20]. An understanding of how best to quantify the risks associated with the waste is therefore important as a means of determining how best to manage these risks.
There have been a number of studies examining the risks posed by landfills and dump sites [21]. These studies have examined a range of pollutants and also employed a range of approaches. For example, Adelopo et al. [21] focused on the heavy metal content of landfills. While Kumarathilaka et al. [12] examined VOCs, Aboyeji and Eigbokhan [22] used geospatial techniques, using GIS to model the spatial characteristics of pollutants. Similarly, Demesouka et al. [23] developed a multicriteria spatial decision support system (MCSDSS), within a GIS software package, that supported the integration of analytic hierarchy process (AHP) and compromise programming methods, as well as a real-life case study of a landfill site in Greece. Kumarathilaka et al. [12] used a combination of gas chromatography and mass selective detectors. Both Nannoni et al. [24] and Adamcová et al. [25] utilized biomonitoring of the accumulation of heavy metals in plants surrounding the sites.
According to Adamcová et al. [25] the risk posed is generally dependent on the type of waste (i.e., hazardous content and percentage of organic matter), the physicochemical reactions occurring in the site and the protection afforded to the ground water.
Previous research has evaluated the fate of various pollutants in the physical environment due to the nearby presence of a landfill or dumpsite. For example, Liu et al. [26] found that landfills contributed to the presence of phthalate esters (PAEs) in the ground water. Porowska [27] concluded that the inorganic carbon in the ground water was 80–47% due to biodegradation of organic matter in nearby landfills. Ilyas et al. [28] investigated levels of polychlorinated biphenyls (PCBs), polybrominated diphenyl ethers (PBDEs), and hexabromocyclododecanes (HBCDs) in sludge, sediments and fish from various locations including a raw leachate pond, a dumpsite and leachate treatment plants in Indonesia. They found high levels of PCBs and PBDEs in sludge from the raw leachate ponds. The profiles of HBCDs were primarily composed of ƴ-and α-isomers in the sludge and fish respectively. Maiti et al. [14] evaluated how the characteristics of leachate impacted on risk to surface water quality near a landfill site in India, and found high levels of TDS (8994.16 ± 6239.2 mg/L), COD (4191.66 ± 2282.19 mg/L), Pb (0.56 ± 0.33 mg/L) and Hg (0.42 ± 0.44 mg/L).
Heavy metals can be particularly problematic because unlike organic pollutants, they do not degrade in the landfill or dumpsite. They can remain within municipal landfills for around 150 years, if leached at a rate of 400 mm/year [21]. Adamcová et al. [25] indicate that the movement of these heavy metals is largely determined by levels of rainfall which impacts upon the production of leachate. As the distance away from the dumpsite or landfill increases, the risk reduces. Yan et al. [9] found that the concentration and contamination profile of perfluoroalkyl acids (PFAAs) was substance and treatment specific.
During the past four decades, the use of flow and solute transport models for predicting the fate and transport of contaminant constituents in groundwater and surface water flow systems has intensified because of environmental and human health concerns arising from municipal, industrial, and hazardous waste disposal activities [29] (pp. 1–5), among others.
However, despite these various studies, a key limitation is that few have examined the movement of the pollutants from a holistic perspective, or indeed sought to model this movement [23,30]. This holistic approach is important with respect to the siting of landfills and other waste treatment facilities to reduce the risks posed and to address public attitudes over the siting of such facilities nearby. Indeed, Butt et al. [30] concluded that there were no computer models in a whole-system and integrated format, which risk assessors could readily and effectively use to underpin risk analyses holistically and yet specifically landfill leachate. This study therefore sought to address this limitation by modeling groundwater contamination, using a simplified equation to find the Soil Attenuation Model (SAM), which takes into account the pathway of the pollutant to the water table.
Specifically, the objective of this study was to examine the contaminated plume and the variation of the area where the risk can be considered admissible varying some inputs. In particular, it is focused on developing countries, where dumpsites are typical, with their related health risks. Therefore, to identify and analyze the health risk area of a dumpsite, considering different scenarios, it may help local communities in the choice of the more appropriate location for a dumpsite as well as in a first evaluation of the level and area of risk related to an existing dumpsite.
2. Materials and Methods
Although usually originating at ground surface, contaminants soon infiltrate through the ground surface, percolate through the unsaturated zone, and reach the groundwater. At this point contaminants are transported with the moving groundwater, eventually reaching pumping wells, streams and lakes [31].
Therefore, analyzing groundwater contamination caused by the escape of leachate from a landfill (or a dumpsite) has to take into consideration the following processes [32]:
- Production of leachate in the landfill;
- Leachate flux through any holes present in the liner system or through the soil (if a liner system is absent);
- Leachate flux through the unsaturated (vadose) zone;
- Leachate mixing with the aquifer;
- Migration of the contaminants through the groundwater.
During these processes, the concentration of the contaminants decreases [31]. The models for predicting the fate and transport of contaminant constituents in groundwater may utilize analytical, semi-analytical, or numerical methods to solve the model equations. Analytical solutions were utilized as they enable key advantages, namely [33] (pp. 1–3): (1) They are mathematically exact and do not involve approximating the model equations as numerical methods do and (2) computer codes can evaluate the solutions quickly. The main disadvantage of the analytical solution methods is that the model equations and initial conditions that are being solved must be “simple” [29].
Dumpsites can be described as open and not regulated holes with no environmental protection [34]. As they do not have a waterproof liner, leaching of leachate will occur. The escape of the leachate from a dumpsite through the vadose zone depends on the characteristics of the site as well as the soil and distance from the water table [32]. Usually it is possible to use the Darcy equation [32] (p. 85) directly:
where:
- Lf = leakage flux through the vadose zone (m3/s);
- Ki = hydraulic conductivity of the soil (m/s);
- A = area of landfill (m2);
- if = vertical hydraulic gradient (-).
where the hydraulic gradient if may be expressed by the following equation:
where:
- hleac = height of leachate from the bottom of the dumpsite (m);
- di = thickness of the vadose zone (m).
At the same time, it has to be considered that as long as the leachate production rate per square meter of dumpsite is lower than the hydraulic conductivity of the soil, the soil remains unsaturated [29]. Thus the depth of leachate at the bottom of the dumpsite is not a consideration.
Furthermore, in the unsaturated (vadose) zone, the transport of contaminants has to be considered, since many chemical and biological activities that take place in this zone significantly affect the eventual contamination of the groundwater in an underlying aquifer [31].
Therefore, to model the transport of contaminants, a simplified equation to find the Soil Attenuation Model (SAM) which takes into account of the pathway of the pollutant to the water table was employed, as follows [32] (p. 145):
where:
- dd = depth of the bottom of dumpsite respect the soil level (m);
- LGW = distance of the water table respect the soil level (m).
when the leachate flux reaches and mixes with the underlying aquifer, contaminants present in the leachate are diluted. The dilution can be estimated by the following equation [35] (pp. 41–46):
where:
- vGW = K × i = Darcy groundwater velocity (m/s);
- L = dumpsite length parallel to groundwater flow (m);
- Ieff = infiltration rate of leachate in the soil (m/s), which may be calculated as follows:
where Sw is the dumpsite length orthogonal to groundwater flow (m).
• SD = thickness of aquifer mixing zone [m], which may be calculated as follows:
where da is the thickness of the aquifer (m).
The LF enables the evaluation of the concentration of the contaminants when they reach the groundwater [32]. Indeed, the LF represents the ratio between the concentration of contaminants at the bottom of the dumpsite Cout,dump and the concentration of contaminants in the groundwater Cgw,0:
The migration of contaminants via groundwater can be calculated by means of the Domenico analytical model, assuming a continuous release source, homogeneous aquifer properties and one dimensional groundwater flow. The following equation represents the Domenico transient solution [36]:
where:
- Cgw(x,y,z,t) = concentration of the contaminant in function of space and time (mg/L);
- Cgw,0 = initial concentration of the contaminant in the groundwater (mg/L);
- αx = longitudinal dispersivity (calculated as αx = 0.1 αx) (m);
- αy = transverse dispersivity (calculated as αy = 0.33 αx) (m);
- αz = vertical dispersivity (calculated as αz = 0.05 αx) (m);
- λ = first order degradation rate constant (1/d);
- R = time delay coefficient (-);
- u = pore velocity (m/s);
- SW = source width perpendicular to groundwater flow direction (m);
- SD = thickness of aquifer mixing zone (m).
Using the hypotheses that the polluting phenomenon is in a steady-state condition (therefore complementary error function reaches its highest value, equal to 2), it is possible to simplify the equation as follows:
Fthermore, using the hypothesis that the contaminants are not degraded (λ = 0), the highest value of Cgw(x, y, z) is obtained. And adopting z = 0 (that is the most cautious value for z), it is possible to determine the contaminant concentration downstream of the landfill by the following equation:
As can be expected, Equation (12) represents a conservative situation, which guarantees a good safety margin for a general case without very detailed site-specific information.
The analysis of the human health risk for pollution events is the systematic analytical process of assessing the risk to human health from contaminants released to or contained in the environment in which humans live [37]. Computational models are central to environmental risk assessment and analysis, and the chosen algorithms establish the risk that the event can cause, as a result of the exposure from the migration of polluting agents in different environmental matrices.
The methodology commonly adopted is based on four steps [38]:
- Hazard identification: Available data are used to determine if a material is likely to pose a hazard to human health. These data are also used to define the type of potential hazard;
- Dose-response assessment: Data are used to estimate the amount of material that may produce a given effect in humans;
- Exposure assessment: Which seeks to determine the extent to which a population is exposed to the material. Fate and transport of the material in the environment, as well as media, pathways and routes of exposure may all be considered in the exposure assessment;
- Risk characterization: Which is the integrating step in the risk assessment process that summarizes the assessment of the effects on human health and of the exposure from multiple environmental media, identifies human subpopulation at elevated risk, combines these assessments into characterizations of human risk, and describes the uncertainty and variability in these characterizations.
For carcinogenic pollutants, risk is estimated as the incremental probability of an individual developing cancer over a lifetime, as a result of exposure to the potential carcinogens, and is calculated as follows [32]:
where:
- SFij = slope factor for the ith substance, referred to the jth exposure pathway (kg d/mg),
- CDIij = chronic daily intake for the ith substance, referred to the jth exposure pathway (mg/(kg × d)), where the general equation of CDI is the following [38]:
where:
- Cpoe = ith contaminant concentration at the point of exposure of the jth pathway (mg/L);
- CR = contact rate, that is the amount of contaminated medium contacted per unit time or event (e.g., for water ingestion is L/d);
- EF = exposure frequency (d/year);
- ED = exposure duration (year);
- BW = body weight (kg);
- AT = averaging time (d).
The potential for non-carcinogenic effects is evaluated by comparing an exposure level over a specified time period (e.g., lifetime) with a reference dose derived for a similar exposure period [32]:
where:
• RfDij = reference dose for the ith substance, referred to the jth exposure pathway (mg/(kg × d)).
Contaminated groundwater can migrate to wells or outcrop into streams and lakes. In this case, the main route of human exposure is ingestion of water [37].
Environmental laws in developing countries are often weaker than in developing countries [39]. As the aim of this study was to identify and analyze the area of health risk related to the presence of dumpsites which contaminates the groundwater in developing countries, it was decided to use the Guidelines of World Health Organization (WHO) for Drinking Water as a reference [40].
According to the WHO [40] (p. 38), the carcinogenic risk R for drinking water is considered admissible when is 10−5; in particular, the tolerable burden of disease is defined as an upper limit of 10−6 DALY (disability-adjusted life year) per person per year. This upper-limit DALY is approximately equivalent to a 10−5 excess lifetime risk of cancer (i.e., 1 excess case of cancer per 100,000 people ingesting drinking-water at the water quality target daily over a 70-year period). At the same time, according to the WHO 10−6 DALY the tolerable burden of disease target may not be achievable or realistic in some locations and circumstances in the short term. Where the overall burden of disease by multiple exposure routes (water, food, air, direct personal contact, etc.) is very high, setting a 10−6 DALY per person per year level of disease burden from waterborne exposure alone will have little impact on the overall disease burden. Setting a less stringent level of acceptable risk, such as 10−5 or even 10−4 DALY per person per year from waterborne exposure may be more realistic and still consistent with the goals of providing high-quality safer water. For non-carcinogenic pollutants hazard indexes is considered admissible when it is less than 1 [38] (p. 120).
Starting from these risk-acceptability criteria, an inverse modeling approach was employed, fixing the maximum admissible concentration of contaminant under the accepted level of risk and defining the borders of the related area of risk for the contaminated plume beyond which the risk is acceptable.
Risk analyses were performed assuming the exposure data reported in Table 1. As leachate can often reach the groundwater, the risk was considered to be related to the ingestion of the groundwater (for instance through wells used by the population). Accordingly, the equation used to calculate the daily assumption rate of contaminated water for kilogram was the following [32] (p. 183):
Table 1 shows the adopted values, taking as a reference Appendix A of the manual of Italian Agency for the Protection of the Environment and for Technical Services [41].
Dumpsites (or open dumps) in developing countries may have very different sizes, being the result of different boundary conditions [1,7]. The same is for soil and aquifer conditions. Furthermore, the uncontrolled open burning inside a dumpsite, a frequent practice in developing countries, may change the size required, since the dumpsite fills up more slowly. It has to be considered as well that the number and type of people that use a dumpsite influence the size and the characteristic of the dumpsite as well. Consequently, it was decided to start with the values reported in Table 2 and successively the values were changed through the sensitivity analysis of sub-paragraph 3.2, studying the magnitude of the output variation.
The characteristics of leachate can vary for several reasons. Indeed leachate quality and quantity are influenced by landfill age, precipitation, weather variation, waste type and composition [15]. Taking as reference literature values related to dumpsites in developing countries (see Appendix A Table A1 this study has used conservatively the highest values of well-defined inorganic contaminants.
Table 3 reports the contaminants considered in the analysis, their concentration in the leachate (CL), RfD (Reference dose) and SF (Slope Factor). The values of RfD and SF were taken from the database of the Italian Higher Institute of Health [42]. As the value of Cgw,0 for Zn was lower than the Cadm it was removed from the calculations.
The concentration of a contaminant at a point in the groundwater may be found using the Domenico Equation (12). It is possible to use the same equation to define the boundary related to the concentration of the contaminants which do not exceed the admissible risk. This method was adopted, using Excel and an iterative procedure to find the coordinates x and y.
At the same time, as leachate has simultaneously more contaminants, the total risk at the point of exposure is given by the sum of each individual risk. Therefore, the total risk will be higher than the individual risk. Consequently, for the toxic compounds, the Equation (1) was adapted as follows:
where:
- RfDi is the value related to each contaminant;
- Cgw,0−i is the initial concentration of each contaminant in the groundwater.
For carcinogenic compounds, since the only compound analyzed belonging to this category was Arsenic, the Equation (12) was utilized.
3. Results
3.1. Baseline Scenario
Using the values from Table 2, the first step was the calculation of the SAM with Equation (3). Afterwards, using Equation (4), the LDF was calculated. The EM was calculated both for carcinogenic and toxic (non-carcinogenic) compounds, both for adults and children, using the values from Table 1. The results are shown in Table 4.
As previously discussed, since each contaminant has a related risk, knowing their SF and/or RfD, it is possible to find their CDI (Chronicle Daily Intake), which was divided by the EM permit to find the Cadm namely the maximum admissible concentration for the contaminant to have an acceptable level of risk.
To define the boundary of the area related to the concentration of the contaminants which do not exceed the admissible risk, Equation (17) was used in the case of toxic risk and Equation (12) in the case of carcinogenic risk, using Excel and an iterative procedure to find the coordinates x and y.
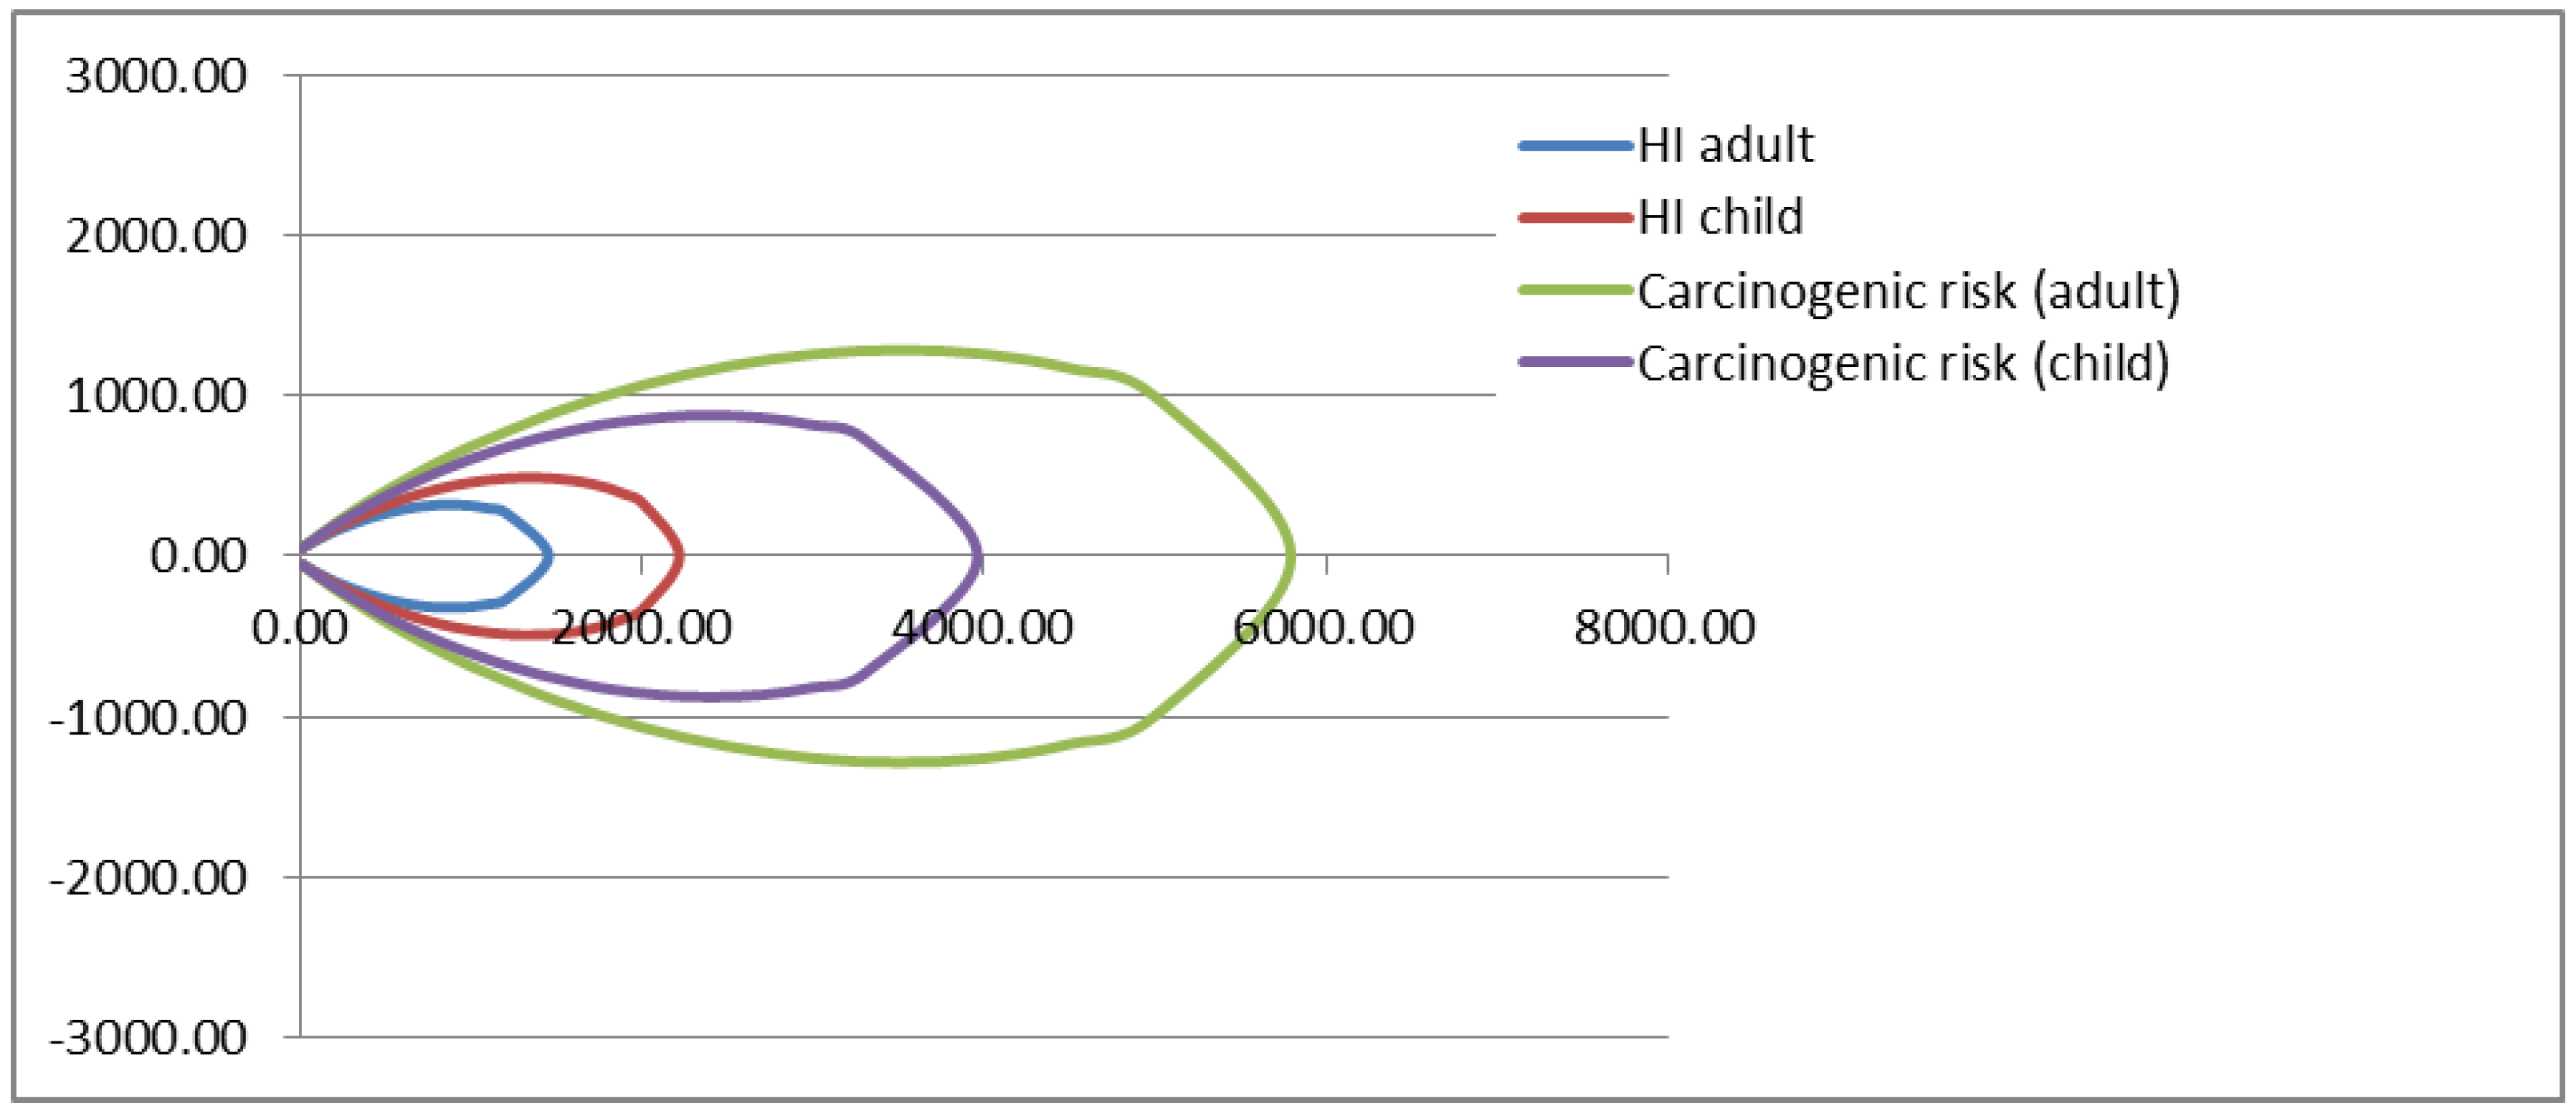
Figure 1 shows the area beyond which the risk can be considered admissible, i.e., the area beyond which people may build and use wells without the risks related to the presence of a dumpsite.
For all the cases, the area of risk is very large. For example, the carcinogenic risk for adults is nearly 6000 m, and 4000 m for a child. For this study, as the carcinogenic risk is related only to the presence of arsenic, the analyses were conservatively continued analyzing the carcinogenic risk for adults. Table 5 shows the x and y axes (values in meters) related to the “objective research” used in Excel to find the values with an iterative procedure, in the case of toxic risks for adults, using Equation (17).
Table 6 shows the axes x and y related to the “objective research” used in Excel to find the values with an iterative procedure, in the case of the carcinogenic risks for adult, using Equation (12).
3.2. Sensitivity Analysis and Different Scenarios
The distance of risk for the population with respect to the dumpsite may vary substantially as the boundary conditions change. As a consequence, a sensitivity analysis was conducted, varying 6 input parameter values, one at a time, within reasonable ranges; in particular:
- The concentration of arsenic in the leachate Cgw,0;
- The distance between the bottom of the dumpsite and the water table dWT−D;
- The hydraulic conductivity of the soil Ks;
- The thickness of groundwater da;
- The annual production of leachate Lpr;
- The area of dumpsite A.
Table 7 presents the results of the sensitivity analysis. The outputs from various input values are compared with the respective “baseline” cases through the relative sensitivity coefficient (S) calculated as follows:
where a and b are baseline input and output values, Δa and Δb are input and output range, respectively.
The distance x for the contaminant concentration to reach the admissible concentration related to the chosen risk is the model output. The sensitivity analysis was conducted along the x axis, to find the maximum distance with respect to the source (the dumpsite) beyond which the carcinogenic risk for adults was less than 10−5. As previously discussed, the carcinogenic risk for adults was chosen for safety reasons, since it was noted that it formed the larger potential area of risk (see Figure 1).
The sensitivity analysis results indicate that model output “x” is very sensitive to the model input parameters Cgw,0 (concentration of contaminant in the leachate) and da (the depth of the groundwater). Regarding the input parameter Ks (hydraulic conductivity of the soil), the model suggests a very low sensitivity. Regarding dWT−D (distance between the bottom of the dumpsite and the water table), the results show that the model is sensitive to this parameter, but not very much.
Regarding the annual production of leachate, as can be seen, the results show that the model is not sensitive to this parameter.
The last parameter considered was the area of dumpsite. Regarding the baseline conditions, in which the dumpsite length parallel and orthogonal to the groundwater flow were both 100 m, in the other two simulations the values were 50 × 50 m2 in the first case and 500 × 500 m2 in the second case. As can be seen, the model is slightly sensitive to this parameter.
4. Discussion
This study evaluated the boundaries of the area of risk due to the escape of leachate from a dumpsite in a developing country. The findings suggest that the area of risk is very large. Carcinogens were a key hazard [10,21]. For example, considering the baseline condition, the carcinogenic risk for adults is nearly 6000 m, and 4000 m for a child. This could be due to two reasons:
- The proposed model is conservative, as the contaminants are not considered to have degraded (λ = 0);
- The concentration of the contaminants in the leachate is very high and the model is for a dumpsite (without waterproof liner at the bottom), where there is consistent diffusion of very dangerous leachate towards the aquifer.
However, it is important to note that these are precautionary estimations and so they might be higher than the reality.
Similar to Reference [25], the sensitivity analysis results indicate that model output “x” is very sensitive to the model input parameters Cgw,0 (concentration of contaminant in the leachate) and da (the depth of the groundwater). Regarding Cgw,0, the maximum value considered was 3.1 mg/L, only twice the initial concentration since the baseline value was already very high, namely the maximum among the ones found in literature. The minimum value was 10 times lower. Regarding da, the sensitivity result can be explained by the fact that the source of contamination is a dumpsite, which does not have an impermeable liner and as a consequence, each year, significant quantities of leachate can reach the underlying groundwater. The greater the depth of the groundwater, the greater the area of influence of the model, due to the steady-state conditions.
Regarding the input parameter Ks (hydraulic conductivity of the soil), the model suggests a very low sensitivity. This can be explained by the fact that the Domenico equation used is related to a steady-state condition, therefore time does not influence the equation. Furthermore, conservatively, it was assigned λ = 0. The only influence of Ks in the model is related to the vadose zone.
Regarding dWT−D (distance between the bottom of the dumpsite and the water table), the results show that the model is sensitive to this parameter, but not very much. This can be explained by the fact that the equation used to take into consideration this parameter in the vadose zone is very simple.
There were limitations in the study. For example, the model was not sensitive to the production of the leachate. This is due to the fact that dumpsites do not have an impermeable liner at the bottom and as a consequence the amount of leachate which reaches the aquifer is always very high. As previously discussed, provided that the production of leachate in the dumpsite is lower than the hydraulic conductivity of the soil (in this case annual production of leachate of 10,000 m3), the soil remains unsaturated. As a consequence, the quantity of leachate at the bottom of the dumpsite is low, and all of it crosses the vadose zone, reaching the water table. However, when the leachate production rate per square meter is higher than the conductivity of the soil, the soil becomes saturated. The dumpsite is unable to drain off all the leachate, causing it to accumulate.
The model had limited sensitivity with respect to the dumpsite extension. Indeed, when the area is 25 times higher respect the baseline condition, the distance of the area of risk in the x axis is only 1.66 times higher (see Table 7).
Using Table 7, the model offers a range of potential combinations and outputs. Thus it would be possible to adapt it to a site-specific situation in a developing country. Future research should focus on less conservative models. It would also be good to compare the key outputs of the model with leachate concentration, considering particularly the boundary conditions in the field.
5. Conclusions
Increasing quantities and the hazardousness of waste being disposed of in dumpsites and landfills in developing countries mean that there are increasing risks posed not only to the environment, but also to the public health of those in close proximity to the sites [1,4,6,7,8,9]. Therefore, there is a need for further studies that provide a holistic evaluation of the risk potential in order to minimize these risks.
The importance of this model is related to the fact that in developing countries dumpsites are common as well as the weakness of suitable tools to assure healthy conditions for nearby communities involved. The outputs from the model could inform more effective policies, enforcement, finance and suitable skills and competencies [7,20]. The procedure followed can represent a first step in a risk analysis or help to evaluate the area of risk beyond which a community may build and use safety wells for drinking water.
Author Contributions
Conceptualization, M.V. and T.T.; Methodology, M.V. and G.V.; Software, G.V.; Validation, G.V. and M.V.; Formal Analysis, G.V.; Investigation, G.V.; Resources, M.V.; Writing−Original Draft Preparation, G.V. and T.T.; Writing−Review & Editing, G.V. and T.T.; Visualization, G.V.; Supervision, M.V.; Project Administration, M.V.
Funding
This research received no external funding.
Conflicts of Interest
The authors declare no conflict of interest.
Appendix A

Table A1.
Data related to the dumpsites taken as reference. The concentrations of inorganic pollutants in the leachate are expressed in mg/L.
Table A1.
Data related to the dumpsites taken as reference. The concentrations of inorganic pollutants in the leachate are expressed in mg/L.
| Site | Country | Source | Cd | Cu | Pb | Ni | Zn | As |
|---|---|---|---|---|---|---|---|---|
| Aba Eku dumpsite—Ibadan | Nigeria | [43] | 0.3 | 0.36 | 1.54 | |||
| Lapite dumpsite—Ibadan | Nigeria | [43] | 0.13 | 0.19 | 1.61 | |||
| Awotan dumpsite—Ibadan | Nigeria | [43] | 0.12 | 0.16 | 0.83 | |||
| Olusosun dumpsite—Lagos | Nigeria | [43] | 2.2 | 0.39 | 11.8 | |||
| Solous 3 dumpsite—Lagos | Nigeria | [43] | 0.07 | 0.23 | 1.45 | |||
| Solous 2 dumpsite—Lagos | Nigeria | [43] | 1.38 | 1.09 | 8.95 | |||
| Matale | Sri Lanka | [44] | 0.1 | 0.57 | 1.78 | 1.15 | 6.88 | 0.52 |
| Bandaragama | Sri Lanka | [44] | 0.09 | 0.23 | 0.48 | 0.91 | 5.36 | 0.72 |
| Kolonnawa | Sri Lanka | [44] | 0.02 | 0.06 | 0.42 | 4.47 | 11.76 | 0.71 |
| Gampola | Sri Lanka | [44] | 0 | 0.73 | 0.03 | 0.33 | 0.466 | 0.16 |
| Gohagoda | Sri Lanka | [44] | 0 | 0.33 | 0.02 | 0.33 | 0.39 | 0.15 |
| Wennapuwa | Sri Lanka | [44] | 0.05 | 0.43 | 0.09 | 0.4 | 0.41 | 0.94 |
| Rathnapura | Sri Lanka | [44] | 0.05 | 0.63 | 0.17 | 1.31 | 1.68 | 1.55 |
| Negombo | Sri Lanka | [44] | 0.05 | 0.54 | 0.33 | 0.67 | 2.06 | 0.85 |
| Dhapa, Kolkata | India | [45] | 0.32 | 0.6 | 0.51 | 7.61 | 0.03 | |
| Dhapa, Kolkata | India | [45] | 0.27 | 0.69 | 0.43 | 3.26 | 0.22 |
References
- UNEP; ISWA. Global Waste Management Outlook; United Nations Environment Programme: Nairobi, Kenya, 2015; ISBN 978-92-807-3479-9. [Google Scholar]
- Vaccari, M.; Di Bella, V.; Vitali, F.; Collivignarelli, C. From mixed to separate collection of solid waste: Benefits for the town of Zavidovici (Bosnia and Herzegovina). Waste Manag. 2013, 33, 277–286. [Google Scholar] [CrossRef] [PubMed]
- Perteghella, A.; Vaccari, M. Organic waste valorization through composting process: A full−scale case study in Maxixe, Mozambique. Environ. Eng. Manag. J. 2017, 16, 1819–1826. [Google Scholar]
- Collivignarelli, C.; Vaccari, M.; Di Bella, V.; Giardina, D. Techno−economic evaluation for the improvement of MSW collection in somaliland and puntland. Waste Manag. Res. 2011, 29, 521–531. [Google Scholar] [CrossRef] [PubMed]
- Nnaji, C.C.; Kumar Yadav, K.; Kumar, V. Status of municipal solid waste generation and disposal in Nigeria. J. Environ. Sci. 2015, 37, 206–217. [Google Scholar] [CrossRef]
- Nwagbie, N.M.; Wirlen, Y.L.; Yinda, G.S.; Vander Zaag, A.C. Quantifying greenhouse gas emissions from municipal solid waste dumpsites in Cameroon. Waste Manag. 2018, in press. [Google Scholar]
- Ojuri, O.O.; Ayodele, F.O.; Oluwatuyi, O.E. Risk assessment and rehabilitation potential of a millennium city dumpsite in Sub-Saharan Africa. Waste Manag. 2018, 76, 621–628. [Google Scholar] [CrossRef] [PubMed]
- Oyelami, A.C.; Aladejana, J.A.; Agbede, O.O. Assessment of the impact of open waste dumpsites on groundwater quality: A case study of the Onibu-eja dumpsite, Southwestern Nigeria. Procedia Earth Planet. Sci. 2013, 7, 648–651. [Google Scholar] [CrossRef]
- Yan, H.; Cousins, I.T.; Zhang, C.; Zhou, Q. Perfluoroalkyl acids in municipal landfill from China: Occurrence, fate during leachate treatment and potential impact on groundwater. Sci. Total Environ. 2015, 524–525, 23–31. [Google Scholar] [CrossRef] [PubMed]
- Ojuri, O.O.; Taiwo, O.A.; Oluwatuyi, O.E. Heavy metal migration along a rural highway route: Ilesha-akure roadside soil, southwestern, Nigeria. J. Glob. NEST 2018, 18, 742–760. [Google Scholar]
- Gollapalli, M.; Kota, S.H. Methane emissions from a landfill in north−east India: Performance of various landfill gas emission models. Environ. Pollut. 2018, 234, 174–180. [Google Scholar] [CrossRef] [PubMed]
- Kumarathilaka, P.; Jayawardhana, Y.; Basnayake, B.F.A.; Mowjood, M.I.M.; Nagamori, M.; Saito, T.; Kawamoto, K.; Vithanage, M. Characterizing volatile organic compounds in leachate from Gohagoda municipal solid waste dumpsite, Sri Lanka. Ground Water. Sustain. Dev. 2016, 2–3, 1–6. [Google Scholar] [CrossRef]
- Han, D.; Currell, M.J. Persistent organic pollutants in China’s surface water system. Sci. Total Environ. 2014, 580, 602–625. [Google Scholar] [CrossRef] [PubMed]
- Maiti, S.K.; De, S.; Hazra, T.; Debsarkar, A.; Dutta, A. Characterization of leachate and its impact on surface and groundwater quality of a closed dumpsite—A case study at Dhapa, Kolkata, India. Procedia Environ. Sci. 2016, 35, 391–399. [Google Scholar] [CrossRef]
- Kamaruddin, M.A.; Yusoff, M.S.; Rui, L.M.; Isa, A.M.; Zawawi, M.H.; Alrozy, R. An overview of municipal solid waste management and landfill leachate treatment: Malaysia and Asian perspectives. Environ. Sci. Pollut. Res. 2017, 24, 26988–27020. [Google Scholar] [CrossRef] [PubMed]
- Gidarakos, E.; Havas, G.; Ntzamilis, P. Municipal solid waste composition determination supporting the integrated solid waste management system in the island of Crete. Waste Manag. 2006, 26, 668–679. [Google Scholar] [CrossRef] [PubMed]
- An, C.J.; Huang, G.H.; Yao, Y.; Sun, W.; An, K. Performance of in−vessel composting of food waste in the presence of coal ash and uric acid. J. Hazard. Mater. 2012, 203–204, 38–45. [Google Scholar] [CrossRef] [PubMed]
- Di Bella, V.; Vaccari, M. Constraints for solid waste management in Somaliland. Waste Resour. Manag. 2014, 167, 62–71. [Google Scholar] [CrossRef]
- Caniato, M.; Vaccari, M. How to assess solid waste management in armed conflicts? A new methodology applied to the Gaza Strip, Palestine. Waste Manag. Res. 2014, 32, 908–917. [Google Scholar] [CrossRef] [PubMed]
- Al-Khatib, I.A.; Kontogianni, S.; Abu Nabaa, H.; Alshami, N.; Al-Sari’, M.I. Public perception of hazardousness caused by current trends of municipal solid waste management. Waste Manag. 2015, 36, 323–330. [Google Scholar] [CrossRef] [PubMed]
- Adelopo, A.O.; Haris, P.I.; Alo, B.I.; Huddersman, K.; Jnkins, R.O. Multivariate analyses of the effects of age, particle size and landfill depth on heavy metals pollution content of closed and active landfill precursors. Waste Manag. 2018, 78, 227–237. [Google Scholar] [CrossRef]
- Aboyeji, O.S.; Eigbokhan, S.F. Evaluations of groundwater contamination by leachates around Olusosun open dumpsite in Lagos metropolis, southwest Nigeria. J. Environ. Manag. 2016, 183, 333–341. [Google Scholar] [CrossRef] [PubMed]
- Demesouka, O.E.; Vavatsikos, A.P.; Anagnostopoulos, K.P. Suitability analysis for siting MSW landfills and its multicriteria spatial decision support system: Method, implementation and case study. Waste Manag. 2013, 33, 1190–1206. [Google Scholar] [CrossRef] [PubMed]
- Nannoni, F.; Santolini, R.; Protano, G. Heavy metal accumulation in evernia prunastri lichen transplants around a municipal solid waste landfill in central Italy. Waste Manag. 2015, 43, 353–362. [Google Scholar] [CrossRef] [PubMed]
- Adamcová, D.; Radziemska, M.; Ridošková, A.; Bartoň, S.; Pelcová, P.; Elbl, J.; Kynický, J.; Brtnický, M.; Vaverková, M.D. Environmental assessment of the effects of a municipal landfill on the content and distribution of heavy metals in Tanacetum vulgare L. Chemosphere 2017, 85, 1011–1018. [Google Scholar] [CrossRef] [PubMed]
- Liu, H.; Liang, Y.; Zhang, D.; Wang, C.; Liang, H.; Cai, H. Impact of MSW landfill on the environmental contamination of phthalate esters. Waste Manag. 2010, 30, 1569–1576. [Google Scholar] [CrossRef] [PubMed]
- Porowska, D. Determination of the origin of dissolved inorganic carbon in ground water around a reclaimed landfill in Otwock using stable carbon isotopes. Waste Manag. 2015, 39, 216–225. [Google Scholar] [CrossRef] [PubMed]
- Ilyas, M.; Sudaryanto, A.; Setiawan, I.E.; Riyadi, A.S.; Isobe, T.; Tanabe, S. Characterization of polychlorinated biphenyls and brominated flame retardants in sludge, sediment and fish from municipal dumpsite at Surabaya, Indonesia. Chemosphere 2013, 93, 1500–1510. [Google Scholar] [CrossRef] [PubMed]
- Batu, V. Applied flow and solute transport modeling. In Aquifers: Fundamental Principles and Analytical and Numerical Methods; CRC Press: Boca Raton, FL, USA, 2006; ISBN 978970-8493-3574-7. [Google Scholar]
- Butt, T.E.; Alam, A.; Gouda, H.M.; Paul, P.; Mair, M. Baseline study and risk analysis of landfill leachate—Current state-of-the-science of computer aided approaches. Sci. Total Environ. 2017, 580, 130–135. [Google Scholar] [CrossRef] [PubMed]
- Bear, J.; Cheng, A. Modeling Groundwater Flow and Contaminant Transport; Bear, J., Ed.; Springer: Dordrecht, The Netherlands, 2010; ISBN 978-1-4020-6681-8. [Google Scholar]
- APAT. Criteri Metodologici per l’Applicazione Dell’Analisi Assoluta di Rischio Alle Discariche; Agenzia per la Protezione Dell’Ambiente e per i Servizi Tecnici: Rome, Italy, 2005. Available online: http://www.isprambiente.gov.it/it/temi/siti-contaminati/analisi-di-rischio (accessed on 13 June 2018).
- Goltz, M.; Huang, J. Analytical Modeling of Solute Transport in Groundwater; John Wiley & Sons: Hoboken, NJ, USA, 2017; ISBN 9780470242346. [Google Scholar]
- Dubey, A.; Chakrabarti, M.; Pandit, D. Landfill mining as a remediation technique for open dumpsites in India. Procedia Environ. Sci. 2016, 35, 319–327. [Google Scholar] [CrossRef]
- US EPA. Soil Screening Guidance: Technical Background Document, 2nd ed.; U.S. Environmental Protection Agency: Washington, DC, USA, 1996.
- Domenico, P.A. An analytical model for multidimensional transport of a decaying contaminant species. J. Hydrol. 1987, 91, 49–58. [Google Scholar] [CrossRef]
- Fjeld, R.A.; Eisenberg, N.A.; Compton, K.L. Quantitative Environmental Risk Analysis for Human Health; John Wiley & Sons: Hoboken, NJ, USA, 2007; ISBN 13: 978-0-471-72243-4. [Google Scholar]
- APAT. Criteri Metodologici per l’Applicazione dell’Analisi Assoluta di Rischio ai siti Contaminati; Agenzia per la Protezione dell’Ambiente e per i Servizi Tecnici: Rome, Italy, 2008. Available online: http://www.isprambiente.gov.it/it/temi/siti-contaminati/analisi-di-rischio (accessed on 13 June 2018).
- Faure, M.; du Plessis, W. The Balancing of Interests in Environmental Law in Africa; Pretoria University Law Press: Pretoria, South Africa, 2011; ISBN 978-1-920538-05-7. [Google Scholar]
- WHO (World Health Organization). Guidelines for Drinking-Water Quality, 4th ed.; World Health Organization: Geneva, Switzerland, 2011; ISBN 9789241548151. [Google Scholar]
- APAT. Criteri Metodologici per l’Applicazione dell’Analisi Assoluta di Rischio ai siti Contaminati—Appendici; Agenzia per la Protezione dell’Ambiente e per i servizi Tecnici: Rome, Italy, 2008. Available online: http://www.isprambiente.gov.it/it/temi/siti-contaminati/analisi-di-rischio (accessed on 13 June 2018).
- Istituto Superiore di Sanità. Banca Dati ISS−INAIL per AdR. Available online: http://old.iss.it/iasa/?tipo=40 (accessed on 19 June 2018).
- Oketola, A.A.; Akpotu, S.O. Assessment of solid waste and dumpsite leachate and topsoil. Chem. Ecol. 2015, 31, 134–146. [Google Scholar] [CrossRef]
- Sewwandi, B.G.N.; Takahiro, K.; Kawamoto, K.; Hamamoto, S.; Asamoto, S.; Sato, H. Evaluation of leachate contamination potential of municipal solid waste dumpsites in Sri Lanka using leachate pollution index. In Proceedings of the Sardinia 2013, Fourteenth International Waste Management and Landfill Symposium, Santa Margherita di Pula, Italy, 30 September–4 October 2013. [Google Scholar]
- Ziyang, L.; Youcai, Z.; Tao, Y.; Yu, S.; Huili, C.; Nanwen, Z.; Renhua, H. Natural attenuation and characterization of contaminants composition in landfill leachate under different disposing ages. Sci. Total Environ. 2009, 407, 3385–3391. [Google Scholar] [CrossRef] [PubMed]
Figure 1.
Estimated area of risk with regard to both carcinogenic and toxic (not carcinogenic) contaminants. The values along the axes are expressed in meters.
Figure 1.
Estimated area of risk with regard to both carcinogenic and toxic (not carcinogenic) contaminants. The values along the axes are expressed in meters.
Table 1.
Exposure data for the contaminated groundwater ingestion.
| Variable | Adopted Value |
|---|---|
| IR = ingestion rate | 1 L/d for children 2 L/d for adults |
| EF = exposure frequency | 350 d/year |
| ED = exposure duration | 6 year for children 30 year for adults |
| AT = averaging time | 365 d/year × ED for non carcinogens 365 d/year × 70 year for carcinogens |
| BW = body weight | 15 kg for children 70 kg for adults |
Table 2.
Baseline conditions assumed for the study.
| Parameter (Symbol) | Value |
|---|---|
| Dumpsite length parallel to groundwater flow (W) | 100 m |
| Dumpsite length orthogonal to groundwater flow (SW) | 100 m |
| Area of dumpsite (A) | 10,000 m2 |
| Distance between the bottom of dumpsite and the soil level (dd) | 10 m |
| Distance between water table and soil level (LGW) | 20 m |
| Thickness of aquifer (da) | 20 m |
| Hydraulic conductivity of the soil (Ks) | 10−8 m/s |
| Hydraulic gradient of the aquifer (i) | 0.002 |
| Distance between bottom of dumpsite and the water table (dGW-D) | 10 m |
| Annual production of leachate per hectare of dumpsite (Lpr) | 3000 m3/(ha × year) |
Table 3.
Baseline characteristics of the contaminants used in the model.
| Substance | CL (mg/L) | RfDingestion (mg/(kg × d) | SFingestion (kg × d)/mg |
|---|---|---|---|
| Arsenic (As) | 1.55 | 0.0003 | 1.5 |
| Cadmium (Cd) | 0.1 | 0.001 | - |
| Copper (Cu) | 0.73 | 0.04 | - |
| Lead (Pb) | 2.2 | 0.0035 | - |
| Nickel (Ni) | 4.47 | 0.02 | - |
| Zinc (Zn) | 11.76 | 0.3 | - |
Table 4.
Values of SAM, LDF and EM calculated, assuming baseline conditions.
| Parameter | Value |
|---|---|
| SAM | 0.5 |
| LDF | 1 |
| EMadult,carc | 0.0117 |
| EMadult,tox | 0.0274 |
| EMchild,carc | 0.0055 |
| EMchild,tox | 0.0639 |
Table 5.
The borders of the contaminated plume along axes x and y in the case of toxic risk for adults.
Table 5.
The borders of the contaminated plume along axes x and y in the case of toxic risk for adults.
| x (m) | y (m) |
|---|---|
| 0.10 | −50.05851589 |
| 100.00 | −108.0540149 |
| 200.00 | −159.263278 |
| 300.00 | −202.8877164 |
| 400.00 | −239.7397805 |
| 500.00 | −269.8516474 |
| 600.00 | −293.2173686 |
| 700.00 | −309.7434434 |
| 800.00 | −319.1689787 |
| 900.00 | −320.9862189 |
| 1000.00 | −314.3114564 |
| 1100.00 | −297.6151914 |
| 1200.00 | −268.0616333 |
| 1446.21 | 0 |
| 1200.00 | 268.0616333 |
| 1100.00 | 297.6151914 |
| 1000.00 | 314.3114564 |
| 900.00 | 320.9862189 |
| 800.00 | 319.1689787 |
| 700.00 | 309.7434434 |
| 600.00 | 293.2173686 |
| 500.00 | 269.8516474 |
| 400.00 | 239.7397805 |
| 300.00 | 202.8877164 |
| 200.00 | 159.263278 |
| 100.00 | 108.0540149 |
| 0.10 | 50.05851589 |
Table 6.
The borders of the contaminated plume along axes x and y in the case of the carcinogenic risk for adults.
Table 6.
The borders of the contaminated plume along axes x and y in the case of the carcinogenic risk for adults.
| x (m) | y (m) |
|---|---|
| 0.1 | −50.082136 |
| 100.00 | −131.7928697 |
| 200.00 | −208.4954584 |
| 300.00 | −280.0226457 |
| 400.00 | −347.6746693 |
| 500.00 | −411.8695975 |
| 600.00 | −472.7682353 |
| 700.00 | −530.6104992 |
| 800.00 | −585.5937807 |
| 900.00 | −637.8924357 |
| 1000.00 | −687.6562402 |
| 1500.00 | −902.3287908 |
| 2000.00 | −1066.524568 |
| 2500.00 | −1184.747167 |
| 3000.00 | −1258.006789 |
| 3500.00 | −1284.471258 |
| 4000.00 | −1258.909276 |
| 4500.00 | −1170.459383 |
| 5000.00 | −993.823005 |
| 5797.30 | 0 |
| 5000.00 | 993.823005 |
| 4500.00 | 1170.459383 |
| 4000.00 | 1258.909276 |
| 3500.00 | 1284.471258 |
| 3000.00 | 1258.006789 |
| 2500.00 | 1184.747167 |
| 2000.00 | 1066.524568 |
| 1500.00 | 902.3287908 |
| 1000.00 | 687.6562402 |
| 900.00 | 637.8924357 |
| 800.00 | 585.5937807 |
| 700.00 | 530.6104992 |
| 600.00 | 472.7682353 |
| 500.00 | 411.8695975 |
| 400.00 | 347.6746693 |
| 300.00 | 280.0226457 |
| 200.00 | 208.4954584 |
| 100.00 | 131.7928697 |
| 0.10 | 50.082136 |
Table 7.
Sensitivity analysis for the proposed model.
| Input Parameter | Value | Factor of Input Change from Baseline | Model Output x (m) | Factor of x Difference from Baseline | Relative Sensitivity S |
|---|---|---|---|---|---|
| Cgw,0 (mg/L) | 1.55 (baseline) | −−− | 5797.3 | −−− | 0.5783 |
| 0.155 | 0.1 | 1831.2 | 0.33 | ||
| 3.1 | 2 | 8200.7 | 1.50 | ||
| dWT−D (m) | 10 (baseline) | −−− | 5797.3 | −−− | 0.1492 |
| 5 | 0.5 | 6693.6 | 1.22 | ||
| 40 | 4 | 3666.5 | 0.67 | ||
| Ks (m/s) | 10−8 (baseline) | −−− | 5797.3 | −−− | 0.0002 |
| 10−10 | 0.01 | 5797.3 | −−− | ||
| 10−6 | 1000 | 5680.1 | 0.98 | ||
| da (m) | 20 (baseline) | −−− | 5797.3 | −−− | 0.4712 |
| 10 | 0.5 | 4100.7 | 0.71 | ||
| 40 | 4 | 8198.4 | 1.41 | ||
| Lpr (m3/year) | 3000 (baseline) | −−− | 5797.3 | −−− | 0.0001 |
| 1000 | 0.33 | 5795.0 | 0.9996 | ||
| 10,000 | 3.33 | 5797.3 | −−− | ||
| A (m2) | 10,000 (baseline) | −−− | 5797.3 | −−− | 0.0384 |
| 2500 | 0.25 | 4100.2 | 0.70 | ||
| 250,000 | 25 | 9607.0 | 1.66 |
© 2018 by the authors. Licensee MDPI, Basel, Switzerland. This article is an open access article distributed under the terms and conditions of the Creative Commons Attribution (CC BY) license (http://creativecommons.org/licenses/by/4.0/).
Share and Cite
MDPI and ACS Style
Vaccari, M.; Vinti, G.; Tudor, T. An Analysis of the Risk Posed by Leachate from Dumpsites in Developing Countries. Environments 2018, 5, 99. https://doi.org/10.3390/environments5090099
AMA Style
Vaccari M, Vinti G, Tudor T. An Analysis of the Risk Posed by Leachate from Dumpsites in Developing Countries. Environments. 2018; 5(9):99. https://doi.org/10.3390/environments5090099
Chicago/Turabian StyleVaccari, Mentore, Giovanni Vinti, and Terry Tudor. 2018. "An Analysis of the Risk Posed by Leachate from Dumpsites in Developing Countries" Environments 5, no. 9: 99. https://doi.org/10.3390/environments5090099
Note that from the first issue of 2016, this journal uses article numbers instead of page numbers. See further details here.