Pronounced Antagonism of Zinc and Arsenate on Toxicity to Barley Root Elongation in Soil

Division of Soil and Water Management, KU Leuven, 3001 Leuven, Belgium
*
Author to whom correspondence should be addressed.
Environments 2018, 5(7), 83; https://doi.org/10.3390/environments5070083
Submission received: 17 May 2018
/
Revised: 6 July 2018
/
Accepted: 13 July 2018
/
Published: 17 July 2018
(This article belongs to the Special Issue Environmental Toxicology of Trace Metals)
Abstract
:Zinc (Zn) and arsenic (As) occur as mixed contaminants in soil and the interactions between them remain unclear. Here, we investigated a Zn2+ and H2AsO4− mixture interaction and their effects on plant growth. Three different soils were spiked with ZnCl2 and NaH2AsO4, each dosed singly or in combination. The soils were leached to remove excessive salt and were aged (>7 days), before toxicity testing using a 5-day root elongation of barley (Hordeum vulgare L.). In the single treatments, the 50% inhibitory effect concentrations in the soil (EC50, total measured concentration) were 2000–3800 mg Zn kg−1 and 96–620 mg As kg−1, depending on the soils. The mixture analyses based on the total concentrations showed overall and significant Zn–As antagonism in two soils, either based on the concentration addition (CA) or independent action (IA) model, whereas no significant interactions (either CA or IA) were found in one soil, which had the lowest content of Fe-oxides. The soil solution composition showed a decreased As concentration upon the addition of ZnCl2 at an equal soil As total concentration; however, the reverse was not found, in line with the cation–anion electrostatic interaction or formation of ternary surface complexes on Fe-oxides. The data revealed that the Zn–As antagonisms (total concentrations) are partially related to the increased Zn immobilizing As in soil.
1. Introduction
Zinc (Zn) and arsenic (As) are moderate to minor natural soil constituents, with background concentration in the range of 10–300 mg kg−1 for Zn and 0.1–80 mg kg−1 for As [1]. Zinc is an essential nutrient for plants and animals, but high Zn concentrations in soils may exert toxic effects on plants and soil microbial activity, affecting the soil fertility and crop yields under prolonged exposure [2]. Arsenic is a non-essential trace element with well-known toxic effects on plants and animals [3]. The toxic threshold values for these elements range between 60–14,000 mg Zn kg−1 soil and 5–200 mg As kg−1 soil [4,5]. Such thresholds can be exceeded in many locations, not only related to point pollution and mining activities, but also in the regions with geogenic anomalies [1,6]. Zinc and arsenic often occur as mixed contamination in the soils affected by industrial processes, such as pyro-metallurgical production, nonferrous mineral mining, coal, oil and wood combustion, and cement and phosphate fertilizer production [7].
The toxicity of the mixtures is affected by the joined effects, but may be modulated by interactions among the components [8]. The mixture effects can be calculated from the doses of each constituent with either the concentration addition (CA) or from the corresponding effects of the doses with the independent action (IA) reference model. The theoretical frameworks are outlined in several classical reviews [9,10]. The CA model is generally applied to the toxicants with a similar mode of action, while the IA model is applied when the mode of action is suspected or known to be different [8]. Deviations from the model predictions are classified as synergistic or antagonistic interactions, depending on the direction of the deviation. Metal mixtures are frequently studied and the CA model has been shown to produce conservative toxicity predictions in most cases [11]. Many studies have been performed with mixtures of cationic metals [12]. In contrast, only a few metal and metalloid mixture toxicity studies have focused on Zn and As interactions, therefore, their joint toxic effects remain unclear.
The soil chemical interactions suggest that Zn and As do not act independently. Zinc in soils is present as a cation (Zn2+), with a pronounced pH dependent sorption on organic matter and on Fe + Al oxyhydroxides [1,13]. In well aerated soils, As is present as As(V), that is, different anions of AsO4 (e.g., H2AsO4−) with a strong sorption on Fe–Al oxyhydroxides, and with phosphate (PO4) anions or organic matter as competing compounds [14]. Increasing the soil Zn decreases the As solubility in soil [15,16], whereas increasing the AsO4 decreases the Zn solubility, and has also been shown in studies using Fe-oxides as adsorbents [17,18]. This may occur because of the precipitation of zinc arsenate or because of the formation of ternary Zn–As-(hydro)oxides complexes. In principle, mere electrostatic interactions can also explain such trends, that is, increasing the Zn2+ sorption on Fe–Al oxyhydroxides increases the positive electrical potential, facilitating the sorption of anionic AsO4.
Limited evidence suggests the toxic interactions of Zn and As in soil. Das et al. [19,20] measured the effects of the Zn and As co-occurrence on the rice grain yield in a field experiment with As contaminated submerged soils. Increasing the Zn application enhanced the yield, which was related to a reduced soil As solubility upon the Zn addition. In the nutrient solution, Patel et al. [21] reported the positive effect of the Zn addition (25 mg Zn L−1) on mung bean seeds germination exposed to test solutions with increasing As concentrations (0–250 mg As L−1). In none of such As toxicity studies, was the Zn toxicity analyzed. We previously reported Zn and As toxicity on barley root elongation in solution culture experiments, where single toxicities were used to predict the responses to different mixture combinations [22]. The similar predictions obtained by the CA and IA models did not allow the identification of either equal or dissimilar modes of action, but the additive toxicity dominated the mixtures according to both models. Kader et al. [16] studied the effects of the added Zn on the As solubility in a soil solution, its toxicity, and the As bioaccumulation in cucumber plants. They applied increasing As doses at three different Zn levels (background, EC10, and EC50) in five soil types. The soil solution As concentrations inversely varied with the Zn level, confirming the interactions described above. The growth of cucumber seedlings was impacted by As and by Zn. The effect on growth related to the soil solution, and As showed mere additive response (IA) of Zn to As in four of the five soils, and synergism according to the IA in one soil. That study did not analyse the CA or IA concept applied to the (conventional) total concentration in the soil. In addition, that study did not analyse the interaction of As on Zn toxicity (i.e., the interaction in the reverse direction).
This study was set up to identify the type and magnitude of the Zn–As toxic interactions on soil-grown plants, with attention to interactions related to the soil chemical ones. As the Zn2+ enhances the sorption of H2AsO4− in soil, we speculate an overall antagonistic interaction when using total Zn and As concentrations in soil, but that the toxic concentrations expressed as dissolved elements in soil will predict additive effects, resembling the results found in hydroponics [22]. The soils with different chemical properties were used to vary the type of interactions on the solid phase. It is well established that the toxic effects of the cationic Zn2+ decrease as the soil cation exchange capacity (CEC) increases [23], while the toxic effects of the anionic H2AsO4− decrease as the concentration of Al and Fe oxides increases [24].
2. Materials and Methods
2.1. Experimental Design
Three soils were selected to investigate the mixture toxicity of Zn and As to barley (Hordeum vulgare L.) in a 5-day root elongation test. The experimental set up consisted of a fractional factorial design and a ray design (Figure 1), including a control treatment and six dose levels of each mixture component yielding 29 combinations of Zn and As doses, which were simultaneously applied on each soil in the triplicates. The ray design is typically set up to test the CA model, whereas the restricted factorial compares the effect of one toxicant in the presence or absence of a fixed dose of the other one, sensitively testing the validity of the IA model.
2.2. Soil Samples
The soils came from different mining sites in Mexico where Zn–As contamination occurs. These soils were selected as reference (least enriched) soils, based on their different Zn and As background concentrations and physico-chemical properties. A preliminary toxicity test was carried out to confirm that the barley plants were able to grow, despite the highly original, likely geogenic, total soil Zn and As concentrations. Additionally, the soil solution Zn and As concentrations in the control treatments were about two orders of magnitude lower than the previously reported phytotoxic dissolved concentrations [22].
The experimental soils were sampled in 2014 at three major mining districts in the central region of Mexico, Zimapan, soil 1 (S1); Pozos, soil 2 (S2); and Taxco, soil 3 (S3). The collected soils belong to the reference soil groups of Vertisols, Regosols/Leptosols, and Pheozems, according to the Word Reference Base soil classification system WRB-2014 [25]. The sampling points were systematically located on positive slopes at least 100 m away from the mining-waste pool edges. The soil samples consisted of about 20 kg of top soil (0–20 cm depth) taken after cleaning the shallow litter. All of the soils were air dried, sieved at 4 mm, and mixed to ensure homogeneity. The soils were stored at room temperature, in dry and dark conditions.
2.3. Stock Soils and Soil Treatments
The different Zn and As treatments were prepared by mixing highly Zn or As spiked soils, referred to here as stock soils, with uncontaminated soils in various proportions. Firstly, the Zn and As spiked stock soils were prepared. Two kilograms of each soil were mixed with deionized water (0.2 L kg−1) and pre-incubated for 7 days at 20 °C, to restore the microbial activity. Then, the Zn stock soils were prepared by spiking 1 kg of each soil with 500 mL of a ZnCl2 solution with a nominal concentration of 40 g Zn L−1, thereby obtaining a nominal Zn concentration of 20 g Zn kg−1 oven dry soil. Similarly, the As stock soils were obtained by spiking 0.5 kg of each soil with 250 mL of a Na2HAsO4·7H2O solution with nominal concentration of 20 g As L−1, thereby obtaining a nominal As concentration of 10 g As kg−1 oven dry soil. In addition, the stock soils for the highest Zn–As mixture dose were prepared by adding 175 mL of the 40 g Zn L−1 solution and 376 mL of the 20 g As L−1 solution to 500 g of each soil, thereby obtaining nominal concentrations of 14 g Zn and 15 g As kg−1 dry soil. The stock soils were homogenized and incubated at 20 °C for 7 days. After the incubation time, the stock soils were leached to remove salt excess, due to the spiking. Artificial rain water (pH 5.9) containing (in mmol L−1) 0.5 CaCl2, 0.5 Ca(NO3)2, 0.5 MgCl2, 1.0 Na2SO4, and 1.0 KCl was used to perform the leaching procedure, as described by Smolders and Oorts [26]. Next, the soils were dried under artificial light at 23 °C for 1 day. The dried spiked soils were mixed with deionized water to reach a gravimetric moisture content of 0.2 L kg−1.
After incubation and leaching, the spiked and un-spiked soils were mixed at different ratios to prepare every single and mixture treatment, as shown in Figure 1. All of the soil treatments were amended with 4 mM KNO3 and 0.25 mM KH2PO4 solutions to reach final concentrations of 100 mg N kg−1 soil and 50 mg P kg−1 soil. Each treatment was homogenized by hand mixing, stored at 20 °C in 1 L closed plastic pots, and incubated for one more week. At the end of this last incubation time, the soil samples of all of the treatments were divided in three 50 mL (30 mm diameter × 115 mm length) plastic tubes for further use in the root elongation test.
2.4. Root Elongation Test
Summer barley seeds (Hordeum vulgare L.) were pre-germinated on moistened filter paper for 48 h, under dark conditions at 25 °C. Three pre-germinated seedlings of a similar root length (mean of initial root length: REinitial~1.2 cm) were selected and placed beneath the soil surface of each tube, covering the surface with a layer of polyethylene beads to reduce water loses by evaporation. All of the tubes were randomly placed in a growth chamber (Weiss Technik, Ebbw Vale, UK), with a 16–8 h day–night cycle (20–16 °C corresponding temperatures), a photosynthetic photon flux density of 570 μmol m−2 s−1, and a relative humidity at 75%. The plants were grown for 5 days. The tubes were watered daily by adding deionized water, and the water addition was controlled by weight. On the 6th day the soil was removed from the plastic tubes and the roots were recovered, cleaned, and their length was recorded. The net root elongation (NRE; cm) was obtained by subtracting the mean REinitial from the final root length of the longest root of each plant (REend).
The tube averaged NRE was the endpoint of each replicate and was normalized to the control value, that is, the relative root elongation (RRE; %), was calculated as the NRE of a treatment (NREt) relative to the average net root elongation of the of the corresponding soil control treatment (no Zn or As added) (NREc), and expressed as a percentage, as follows:
2.5. Soil Analyses
Selected soil properties were determined on 2 mm sieved subsamples, including the soil pH, effective cation exchange capacity (eCEC), oxalate extractable iron oxy-hydroxides (FeOx), total carbon (TC), inorganic carbon, and total metal concentrations. The measured properties are shown in Table 1 and the measurement details are specified in the Supplemental Information, Table S1.
The subsamples of each soil treatment were analyzed for their total Zn and As concentrations using inductively coupled plasma optical emission spectrometry (ICP-OES, Thermo-Fisher Scientific ICAP 7000, Massachusetts, USA) after hot acid digestion. After the root elongation test, 8 mL of deionized water was added to 25 g of the homogenized soil subsamples of the selected treatments (indicated in Figure 1), mixed, and incubated in 50 mL closed plastic tubes for 2 days [27]. The soils were centrifuged (15 min at 2200 g) and the soil solutions (pw) were recovered and filtered through a 0.45 µm filter. The filtered soil solution solutions were analyzed by inductively coupled plasma mass spectrometry (ICP-MS, Agilent 7700x, Santa Clara, CA, USA) for macro (K, Ca, Mg, and P) and micro (Fe, Mn, Cu, and Mo) nutrients and for Zn and As concentrations. Arsenic was measured at m/z 75 with use of helium gas in a collision cell to remove possible mass interferences (i.e., Ar–Cl from ZnCl2 spiking).
2.6. Single and Mixture Toxicity Models
The Zn and As dose–response curves for each soil were obtained by fitting the experimental data of the singly dosed series (expressed as total or dissolved concentrations) and the root response (i.e., RRE(%) values) to the log-logistic dose–response model [28] using JMP Pro 13.1.0 (SAS Institute, Cary NC, USA, 2016), as follows:
where ci is the measured Zn or As concentration for a specific treatment, expressed either in mg kg−1 for the total soil concentrations, or in μmol L−1 for the soil solution dissolved concentrations. The fitted parameter, β, is the slope, and EC50 is the effective concentration causing the 50% inhibitory effect.
The mixture toxicity assessment was performed by applying the reference models of the concentration addition (CA) and independent action (IA). Under the CA model, a similar mode of action for Zn and As is assumed. This model calculates the effect from the sum of the toxic units (TU), with one TU equal to the EC50 value of each contaminant; the TUs can be summed and if the toxicants act additively, the following condition holds:
Expressing this in terms of the RRE (Equation (2)) yields is as follows:
Equation (4) can be used expressing the Zn and As doses as the total concentrations (mg kg−1 soil) or dissolved concentrations (µmol L−1 pw). Equation (4) was used to predict the CA relative root elongation values (RREpred, %) from the doses of Zn and As, using the SOLVER function in Excel, under this ΣTU = 1 assumption.
Under the IA model, the effect is predicted from the principle of multiplying the non-effect fractions [29], that is:
With %RREZn and %RREAs as the predicted relative root elongation when exposed singly to Zn or As (Equation (2)), with doses expressed as either mg kg−1 soil or µmol L−1 pw.
The more-than additive (synergism) or less-than additive (antagonism) deviations were evaluated following the Jonker MIXTOX model [30]. This approach applies the CA or IA reference models on the whole data set. The original models are modified with a parametric function (G) that depends on the expression of the mixture components, whether as relative toxic units (zi in Equation (6)) for the CA model, or as individual effects (qi, in Equation (7)) for the IA model.
with TU50i being the TU of component i causing the 50% of effect.
The expression of G in the Mixtox model depends on the selected toxic model, and the involved parameters depend on a specific deviation pattern (Table S2). Parameter (α), accounts for significant synergistic or antagonistic deviations from the predicted responses. Parameter (β) evaluates if the significant deviations depend on the dose level (DL). Parameter (βi) reveals deviations depending on the dose ratio (DR) and is related to a specific mixture component [31,32]. All of the parameters were evaluated by solving the modified CA and IA models with the SOLVER function in Excel, applying the corresponding additivity assumptions. Finally, the extended reference models were compared using a χ2 statistic test to find significant (p < 0.05) improvements in the model [30].
3. Results
3.1. Soil Samples and Zn–As Treatments
The three soils all had a neutral pH (Table 1). The pH after the soil spiking and leaching increased up to 7.3 ± 0.1, except for those at the highest mixture doses, which consistently presented pH values of 6.4 ± 0.4. The oxalate-extractable Fe concentration (i.e., active oxy-hydroxides [FeOxOH]) decreased S1 > S3 > S2. The total organic carbon content (on a dry weight basis) was the lowest for S1 and the highest for S2. The effective CEC of S1 was the highest, and comparable for soils S2 and S3. Immediately after spiking, the total Zn and As concentrations of the stock soils were close to the nominal values, but leaching largely reduced the total Zn to 45% of the initial content, while As was depleted to 20% of the initial content. The measured total Zn and As concentrations for all of the soil mixtures (i.e., the soil treatments) are shown in Table S3.
3.2. Root Elongation
The averaged net root elongation (NRE) responses of all of the treatments are shown in Table S4. The barley NRE in the control treatments of the soils S1 (9.6 ± 1 cm) and S3 (9.1 ± 2 cm) were significantly lower (p < 0.05) than that of S2 (11 ± 1 cm). The lowest single Zn total concentration above which the root elongation was reduced, compared to the control (p < 0.05, Dunnett test), was 1300 mg Zn kg−1 for soil S3, and 2100 mg Zn kg−1 for soils S2 and S1; soil S1 had the highest eCEC. For the total As single doses, significant NRE inhibition started from 55 mg As kg−1 in S2, the lowest Fe containing soil, and from 604 mg As kg−1 in S1, the soil with highest FeOx concentration. The total (mg kg−1) concentrations of the single Zn and As were used to obtain dose–response curves according to the log-logistic model in Equation (2) (Table 2 and Figure S1). The Zn EC50 value for S3 was significantly lower than those of S2 and S1, while the total As EC50 was significantly higher for S1 compared with S2 and S3. Note the large impact of the background concentration on the EC50 of As, is as follows: if the EC50 values are background corrected, then the added As concentrations reducing 50% of the NRE are (in mg As kg−1) 415 (S1), 84 (S2), and 26 (S3) (i.e., more largely varying among the soils than the total concentrations). In Table S5, different expressions of Zn and As EC50 concentrations can be seen.
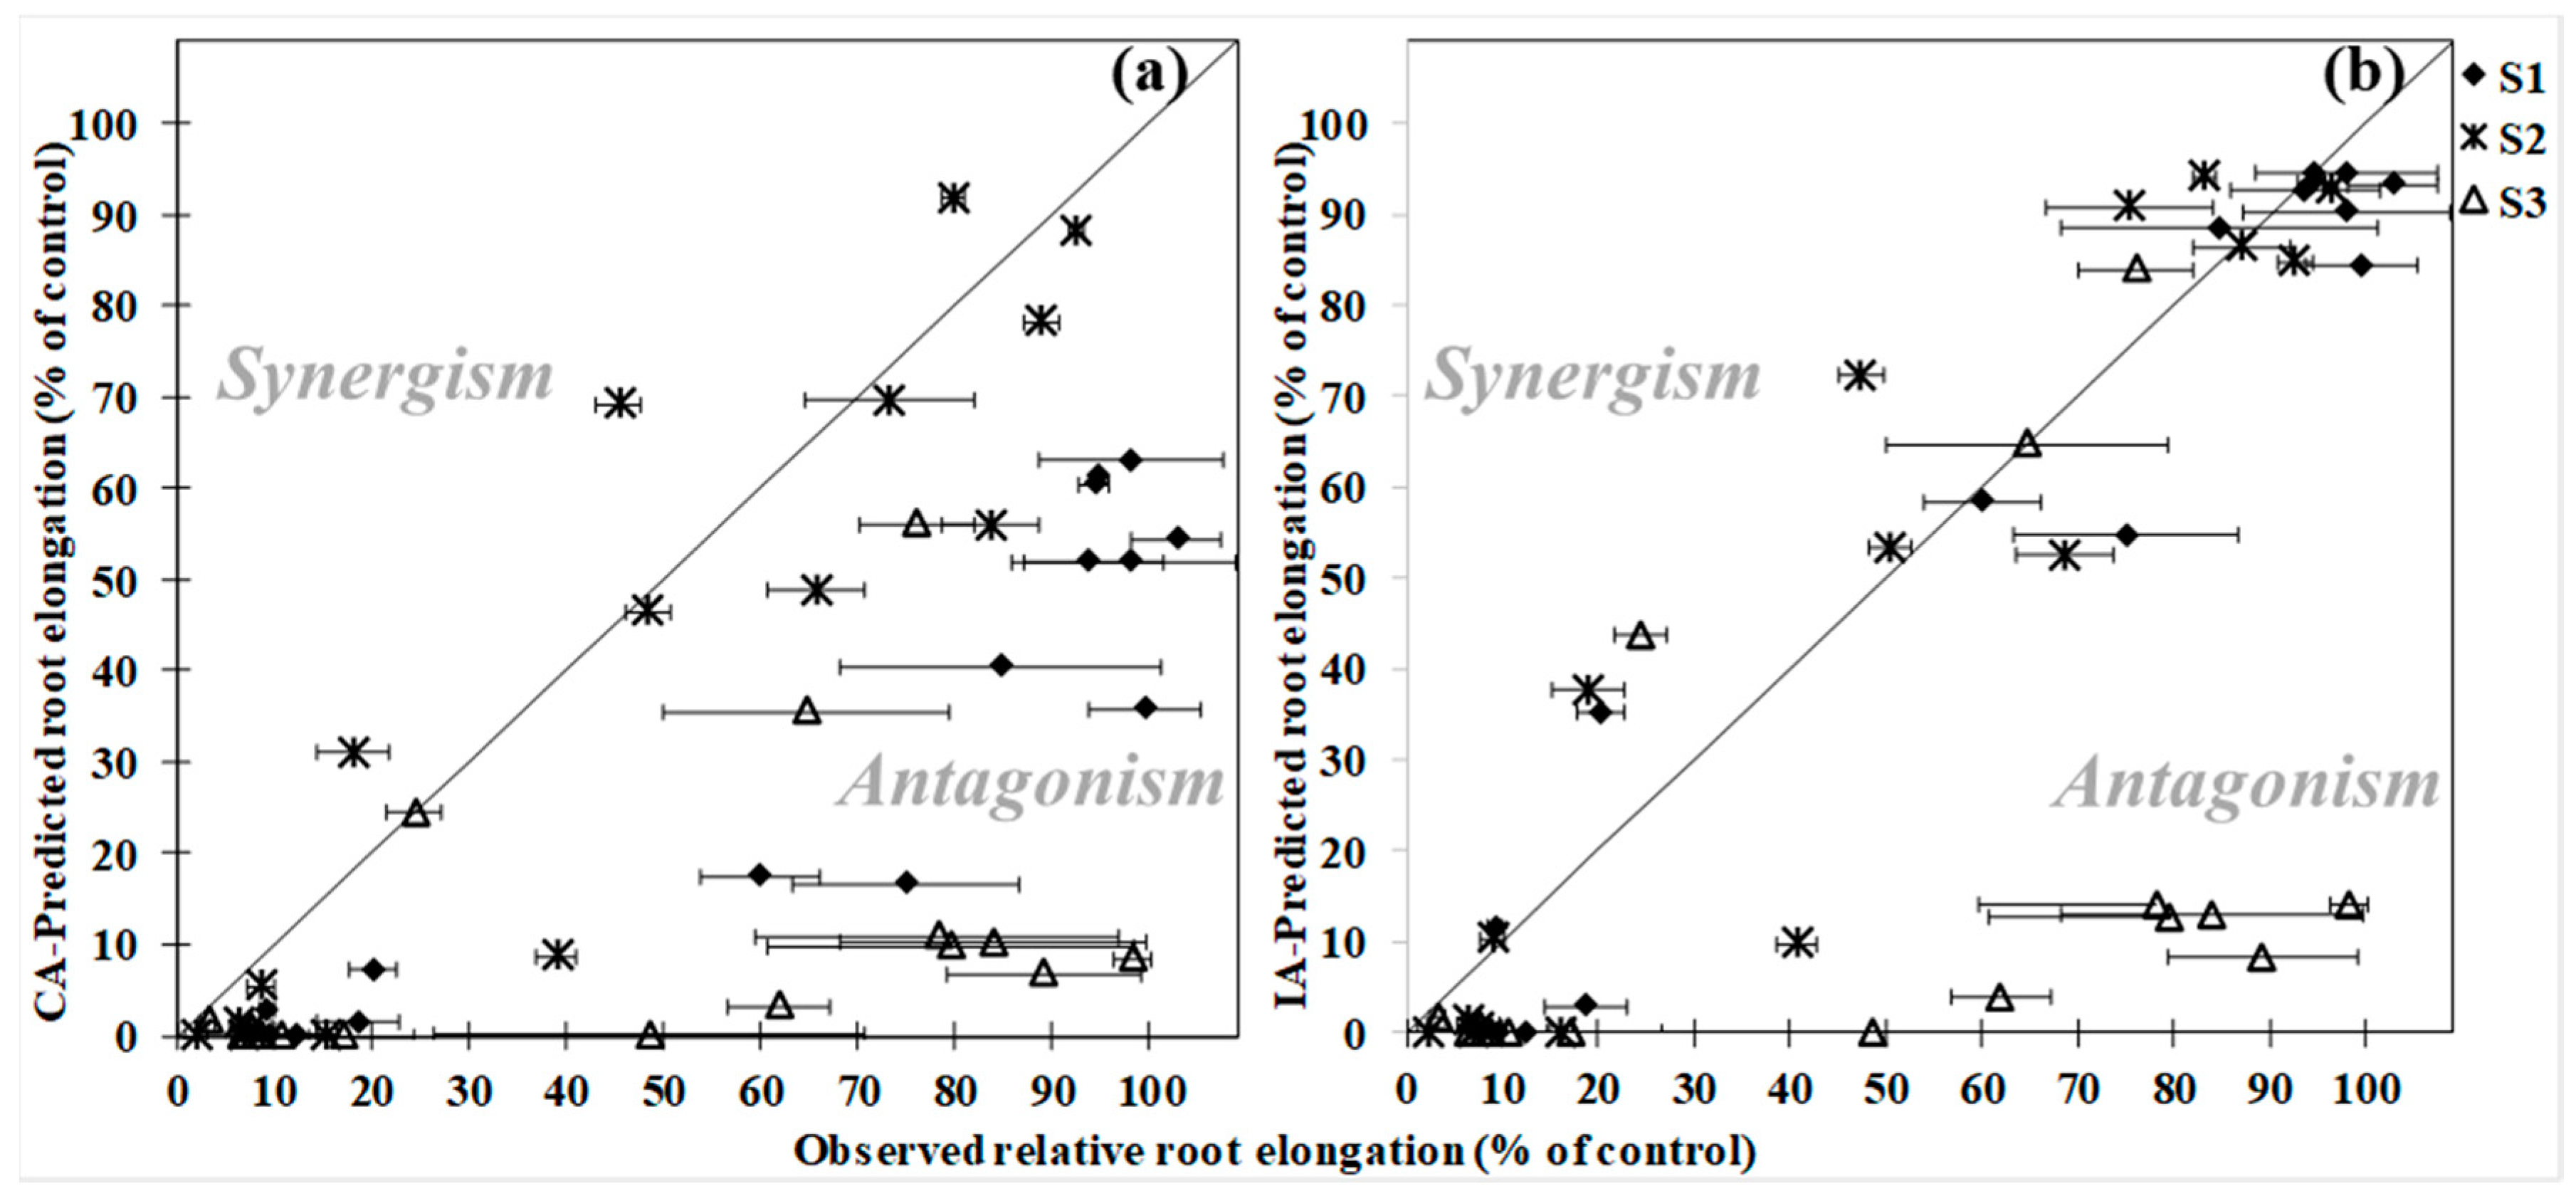
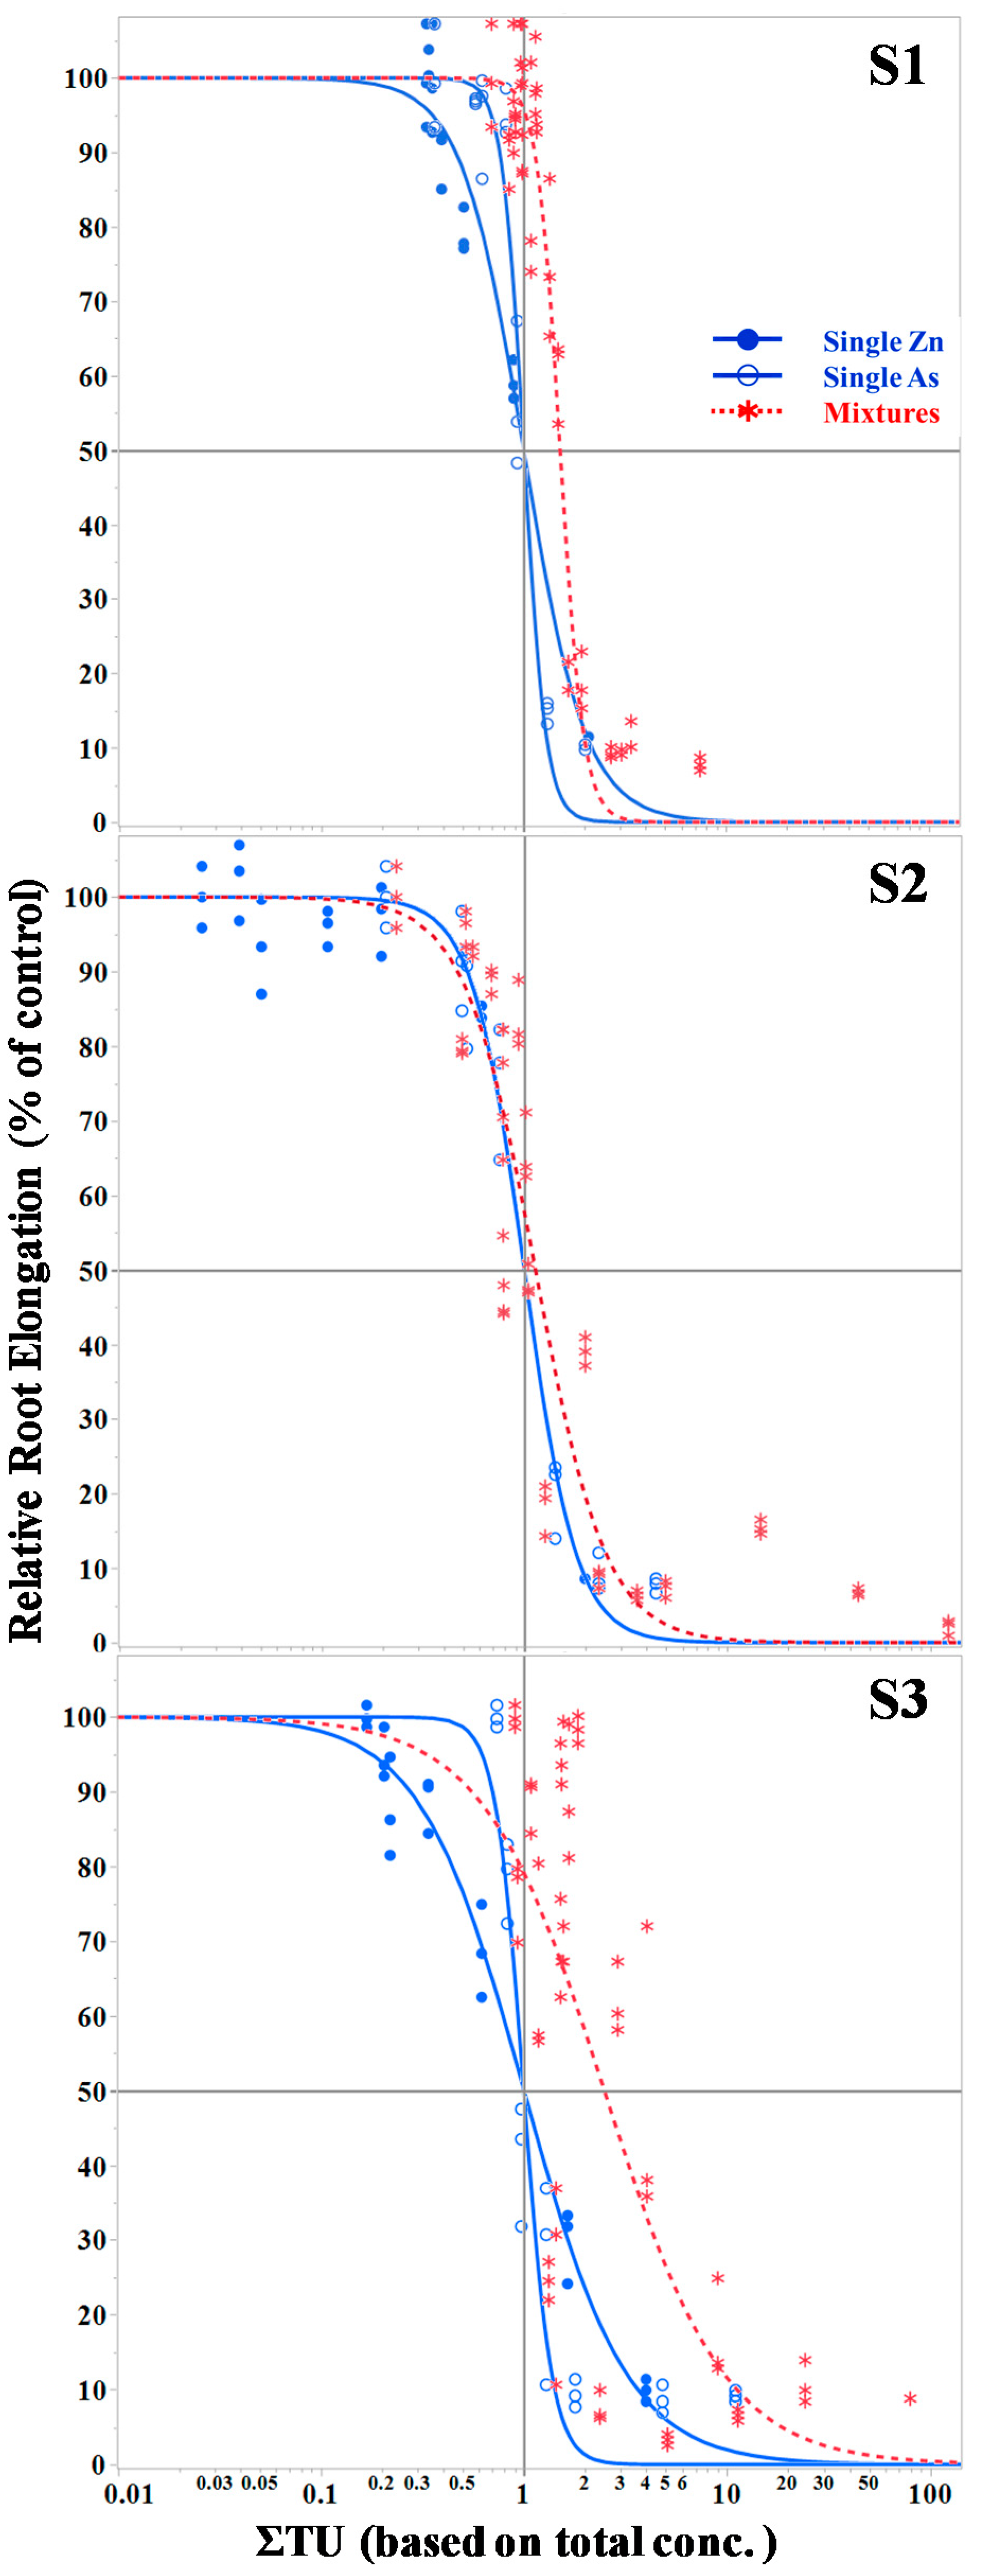
A strong toxic antagonism was found in the mixture treatment, either analyzed on the ray treatments (first indication), on the restricted factorial treatments (second indication), or on all of the treatments combined (third indication). Firstly, the ΣTU50 values obtained from the simultaneously increasing doses (the ray series in Figure 1) are of 1.4 for S1, 1.5 for S2, and 3.8 for S3 (details not shown). According to the CA model, ΣTU50 values >1 indicate antagonism. Secondly, the mixture treatments corresponding to the restricted factorials in Figure 1 test the effect of a fixed dose of one component on the EC50 of the other. This approach represents the toxic additivity concept according to the IA model. In this case, the NRE of the zero added Zn at a fixed As was the reference to calculate the RRE for the Zn treatment series and vice versa. That analysis showed that increasing the Zn at a fixed As concentration produced Zn EC50 values (>3700 mg Zn kg−1 soil) higher than the corresponding values without the As addition for S2 and S3, indicating the antagonism of As on Zn toxicity. Conversely, increasing the As doses at a fixed Zn concentration yielded an As EC50 larger than the single As, only for S1 (>800 mg As kg−1 soil), and not for the other soils, suggesting that the antagonism according to the IA model is not identical in both directions (details not shown). Thirdly, the analysis of all of the mixture treatments together confirmed the overall antagonism. Figure 2 shows that the 50% RRE is obtained at ΣTU > 1 for the mixture treatments (red-dotted curve), with effects found at ΣTU50 = 1.5 (S1), 1.1 (S2), and 2.5 (S3). Finally, the observed RRE values were compared with the CA and IA predicted RRE using the data of all of the mixture treatments (Figure 3). The CA consistently predicted larger effects in a higher number of treatments than the IA model for the total concentration expression. The significance of the interaction can be evaluated using the 95% confidence interval (95% CI) of the observed responses. In this way, 80% of the predicted responses with the CA model were below the observed responses (1:1 line) in Figure 3, with major occurrence in soils S1 and S3. The predicted responses under the IA model showed a smaller number of antagonistic cases, but still above 50% of the mixtures. The additional analysis under the MixTox model was used to evaluate the departures from additivity [30]. The introduction of additional parameters to the original model improved the fit in all cases. The values of the a parameters (Table 3) confirmed statistically significant antagonism in soils S1 and S3, but not in soil S2.
3.3. Zinc and As Concentrations in Soil Solution
The zinc and arsenic single concentrations in the soil solution increased with the increasing doses (Table S6). The solubility interactions between Zn and As were detected in the mixture treatments (Figure S2, Table S7). For all of the soils with a high Zn (>1400 mg kg−1 for S1, >320 mg kg−1 for S2, and >450 mg kg−1 for S3) exhibited reduced dissolved As concentrations when compared with similar single As treatments. These interactions were more pronounced in the mixtures with high Zn and As. In contrast, increasing the total As did not show a consistent effect on the dissolved Zn concentrations in relation to the corresponding single Zn treatments; only S2 showed reduced dissolved Zn when the As total concentration is >370 mg kg−1, while other variations are more likely related to the differences between the total concentrations of single and mixture treatments.
The EC50 values expressed as soil solution concentrations are shown in Table 2. The Zn EC50 values, expressed in molar units, are about two to eight times higher than those of As, similarly to the previously reported trends [22]. The predicted responses based on the soil solution concentrations were similar for the CA and IA models (Figure S3). Only a limited number of predictions could be made, as only a few number of soil solution mixtures were analyzed. The soil solution data revealed antagonisms of soluble As and Zn on the root elongation with one synergistic interaction in soil S1, resulting from a mixture with 0.34 Zn TU and 0.57 As TU (ΣTU = 0.91). The predicted response for such a mixture was quite close to a 50% RRE for both of the models. However, the observed response was only the 22% RRE, being the only case for which the predicted response result was larger than the observed one. The interpretation of MixTox-model parameters based on the soil solution concentrations was not used as too few data were present to model the interactions.
4. Discussion
This study used three soils with contrasting properties to vary the factors controlling Zn and As bioavailability and, potentially, the magnitude of the Zn–As interactions. The Zn EC50 values found here in the spiked soils (2000–4000 mg Zn kg−1) are somewhat larger than those earlier obtained in the spiked soils for the same endpoint (140–2200 mg Zn kg−1 [33]). However, the role of eCEC on the Zn sensitivity was evident, as soil S1 with the highest eCEC exhibited the largest Zn EC50 value. Along the same line, the As EC50, expressed here as added As, ranged 26–415 mg As kg−1, well in line with the reported values for the same species in the spiked soils (35–460 mg As kg−1 [24]). Again, soil S1 with the highest Al and Fe-oxides concentration makes the barley root elongation the least sensitive to As.
This study has shown pronounced antagonism between Zn and As. This interaction was more pronounced when evaluated with CA than when evaluated with the IA model. Earlier interaction studies have not discriminated the analysis between the CA or IA models, because of the limited doses used [16]. In general, the studies described in the introduction point to Zn–As antagonism and the same is true for interactions between As and other divalent metal ions. The antagonistic interactions between As and copper (Cu) or nickel (Ni) were found for rice plants grown in flooded soils [34]. Cadmium (Cd) and As also acted antagonistically (ΣTU50 = 1.5) for wheat root elongation [35], and this interaction is also found in wheat when exposed to Cd and As in nutrient solution [36]. Antagonism based on the total Zn and As concentrations in soil is well explained by such solubility interactions, as shown in previous Zn–As and Cd–As mixture toxicity studies [19,20,36]. However, a slight antagonistic response based on dissolved concentrations has been detected at high effect doses [22], suggesting that some plant physiological mechanisms, such as Zn reducing oxidative stress, are also involved. This is also illustrated here by the antagonistic interactions found when relating the doses to soil solution concentrations (Figure S3).
The CA model most elegantly expresses the mixture interactions and is also most easily adopted in the regulations [12]. The data analysis under the IA assumption also confirms antagonism, albeit less pronounced. The restricted factorial have shown antagonism according to the IA for the treatments with increasing Zn doses at a fixed level of As for soils S2 and S3, and at increasing doses of As at a fixed Zn level for S1, illustrating that the effect of Zn on As toxicity is not necessarily the same effect of As on Zn toxicity.
The reduction of the soil solution As concentrations upon the Zn addition has been previously reported and is commonly attributed to the co-sorption or precipitation process involving Zn and As [15,16,19,20]. The Zn concentrations in the solution of single spiked soils reach >1mM and the same is true for AsO4−3 concentrations. The solubility product of Zn3(AsO4)2 equals logKsp = −27.5 and its molar solubility at pH = 7 is <1 mM, suggesting that this precipitate can be formed in the mixtures at the highest doses. Speciation calculations with Visual Minteq 3.1 using the observed pH and soil solution concentrations of Zn, As, and macro-elements, ignoring Zn-complexation by dissolved organic matter (DOM), revealed that this precipitate potentially occurs only in the mixtures with the highest dose level of both elements (Table S8), where the RRE is practically zero. The lack of DOM data means that this speciation calculation overestimates the likelihood of precipitation, as the Zn2+ ion activity is overestimated. This suggests that the effects of Zn on immobilizing As, observed at lower As doses where the toxicity antagonism are found, are unrelated to the formation of Zn3(AsO4)2, but that either of the electrostatic interactions or the formation of ternary complexes on Fe–Al oxy-hydroxides explain the interaction [17,18]. Interestingly, the least and non-significant toxic antagonism was found in soil S2 (Figure 2 and Figure 3), which has the lowest Fe-oxides content. The effects of Zn on immobilizing As are also the least pronounced in S2, whereas these effects are larger in soils S1 and S3 (Figure S2). This, again, points to Zn–As interactions taking place on the oxides of Fe and Al.
Taken together, the Zn–As mixtures with low total doses provoked significantly less additive effects on barley relative root elongation. The existence of such antagonistic toxic interactions was confirmed by the different toxicity models used [30]. The interaction is partially related to Zn immobilizing As, but the antagonism generally remained when the doses were expressed on the soil solution basis (Figure S3), also suggesting physiological interactions. An example of the latter is the one observed by Patel et al., between the As-induced oxidative stress and the Zn-enhanced antioxidative activity of catalase and phenolic compounds [21]. Interestingly, the Cd–As mixture physiological effect on wheat, reported by Liu et al., resulted in synergistic oxidative stress, and points out the different roles of Zn and Cd in the plant antioxidant defense system [36]. Plotting the NRE to either just the total Zn or just the total As, and comparing the single with the mixture treatments (Figure S4), shows that the Zn–As antagonism is not sufficiently strong to overcome the single effect of none of the components, suggesting that risk assessment should take the joint effects into account, for a possibly less that additive effect.
Supplementary Materials
The following are available online at https://www.mdpi.com/2076-3298/5/7/83/s1, Figure S1: Dose–response curves for total Zn and total As, Figure S2: Soil solution concentration as a function of total soil concentration for As (top) and Zn (bottom) in single and mixture treatments, Figure S3: Predicted vs observed root relative elongation using soil solution Zn and Arsenic concentrations, Figure S4: Barley net root elongation response to total Zn or As soil concentrations in single and mixture treatments, Table S1: Analytical methods, Table S2: MixTox–model parameters, Table S3: Zinc and arsenic total concentrations, Table S4: Net Root Elongation response, Table S5: Zinc and arsenic EC50 values using different concentration expressions, Table S6: Zinc and arsenic concentrations in soils solution of selected treatments, Table S7: Total and soil solution concentrations of As and Zn for selected single and mixture treatments, Table S8: Ion activity products of potential precipitated species in soil solution of selected treatments.
Author Contributions
Investigation, formal analysis, and original draft preparation: G.G.-R. Writing (review and editing): D.M. Supervision, conceptualization, and resources: E.S.
Funding
This research was partially funded by Consejo Nacional de Ciencia y Tecnología (Conacyt, Mexico) grant number 359484.
Acknowledgments
The authors thank J. Plevoets and A. Fettweis for supporting the experimental work.
Conflicts of Interest
The authors declare no conflict of interest. The founding sponsors had no role in the design of the study; in the collection, analyses, or interpretation of data; in the writing of the manuscript; and in the decision to publish the results.
References
- Alloway, B.J. Heavy Metals in Soils, 3rd ed.; Springer: Dordrecht, The Netherlands, 2013. [Google Scholar]
- Nagajyoti, P.C.; Lee, K.D.; Sreekanth, T.V.M. Heavy metals, occurrence and toxicity for plants: A review. Environ. Chem. Lett. 2010, 8, 199–216. [Google Scholar] [CrossRef]
- Abbas, G.; Murtaza, B.; Bibi, I.; Shahid, M.; Niazi, N.K.; Khan, M.I.; Amjad, M.; Hussain, M. Arsenic Uptake, Toxicity, Detoxification, and Speciation in Plants: Physiological, Biochemical, and Molecular Aspects. Int. J. Environ. Res. Public Health 2018, 15, 59. [Google Scholar] [CrossRef] [PubMed]
- Reimann, C.; Fabian, K.; Birke, M.; Filzmoser, P.; Demetriades, A.; Négrel, P.; Oorts, K.; Matschullat, J.; de Caritat, P.; Albanese, S.; et al. GEMAS: Establishing geochemical background and threshold for 53 chemical elements in European agricultural soil. Appl. Geochem. 2018, 88, 302–318. [Google Scholar] [CrossRef]
- Teaf, C.M.; Covert, D.J.; Teaf, P.A.; Starks, M.J. Arsenic Cleanup Criteria for Soils in the US and Abroad: Comparing Guidelines and Understanding Inconsistencies. In Proceedings of the Annual International Conference on Soils, Sediments, Water and Energy, Amherst, MA, USA, 18–21 October 2010; Volume 15, p. 10. [Google Scholar]
- Rodríguez, L.; Ruiz, E.; Alonso-Azcárate, J.; Rincón, J. Heavy metal distribution and chemical speciation in tailings and soils around a Pb-Zn mine in Spain. J. Environ. Manag. 2009, 90, 1106–1116. [Google Scholar] [CrossRef] [PubMed]
- Smith, K.S.; Huyck, H.L.O. An overview of the abundance, relative mobility, bioavailability, and human toxicity of metals. Rev. Econ. Geol. 1999, 6A–6B, 29–70. [Google Scholar]
- Backhaus, T.; Faust, M. Predictive Environmental Risk Assessment of Chemical Mixtures. Environ. Sci. Technol. 2012, 46, 2564–2573. [Google Scholar] [CrossRef] [PubMed]
- De Zwart, D.; Posthuma, L. Complex mixture toxicity for single and multiple species: Proposed methodologies. Environ. Toxicol. Chem. 2005, 24, 2665–2676. [Google Scholar] [CrossRef] [PubMed]
- Badot, P.-M.; Degiorgi, F.; Adam, O.; Ctini, G. Combined Exposure to Mixture of Chemicals. An Impossible Challenge? In Pesticides—The Impact of Pesticides Exposure; Stoycheva, M., Ed.; InTech Europe: London, UK, 2009; pp. 67–90. ISBN 978-953-307-531-0. [Google Scholar]
- Vijver, M.G.; Elliot, E.G.; Peijnenburg, W.J.G.M.; de Snoo, G.R. Response predictions for organisms water-exposed to metal mixtures: A meta-analysis. Environ. Toxicol. Chem. 2011, 30, 1482–1487. [Google Scholar] [CrossRef] [PubMed]
- Nys, C.; Versieren, L.; Cordery, K.I.; Blust, R.; Smolders, E.; de Schamphelaere, K.A.C. Systematic Evaluation of Chronic Metal-Mixture Toxicity to Three Species and Implications for Risk Assessment. Environ. Sci. Technol. 2017, 51, 4615–4623. [Google Scholar] [CrossRef] [PubMed]
- U.S. Environmental Protection Agency (USEPA). Ecological Soil Screening Levels for Zinc Interim Final; USEPA: Washingtong, DC, USA, 2007.
- Arco-Lazaro, E.; Agudo, I.; Clemente, R.; Bernal, M.P. Arsenic (V) adsorption-desorption in agricultural and mine soils : Effects of organic matter addition and phosphate competition. Environ. Pollut. 2016, 216, 71–79. [Google Scholar] [CrossRef] [PubMed]
- Sanchary, I.J.; Huq, S.M.I. Remediation of Arsenic Toxicity in the Soil-Plant System by Using Zinc Fertilizers. J. Agric. Chem. Environ. 2017, 6, 30–37. [Google Scholar] [CrossRef]
- Kader, M.; Lamb, D.T.; Wang, L.; Megharaj, M.; Naidu, R. Zinc-arsenic interactions in soil: Solubility, toxicity and uptake. Chemosphere 2017, 187, 357–367. [Google Scholar] [CrossRef] [PubMed]
- Grafe, M.; Nachtegaal, M.; Sparks, D. Formation of Metal-Arsenate Precipitates at the Goethite-Water Interface. Environ. Sci. Technol. 2004, 38, 6561–6570. [Google Scholar] [CrossRef] [PubMed]
- Carabante, I.; Grahn, M.; Holmgren, A.; Kumpiene, J.; Hedlund, J. Influence of Zn(II) on the adsorption of arsenate onto ferrihydrite. Environ. Sci. Technol. 2012, 46, 13152–13159. [Google Scholar] [CrossRef] [PubMed]
- Das, D.K.; Garai, T.K.; Sarkar, S.; Sur, P. Interaction of Arsenic with Zinc and organics in a rice (Oryza sativa L.)—Cultivated field in India. Sci. World J. 2005, 5, 646–651. [Google Scholar] [CrossRef] [PubMed]
- Das, I.; Sanyal, S.K.; Ghosh, K.; Das, D.K. Arsenic mitigation in soil-plant system through zinc application in West Bengal soils. Bioremediat. J. 2016, 20, 24–37. [Google Scholar] [CrossRef]
- Patel, H.V.; Parmar, S.R.; Chudasama, C.J.; Mangrola, A.V. Interactive studies of Zinc with Cadmium & Arsenic on seed germination and antioxidant properties of Phaseolus aureus Roxb. Int. J. Plant Anim. Environ. Sci. 2013, 3, 166–174. [Google Scholar]
- Guzmán-Rangel, G.; Versieren, L.; Qiu, H.; Smolders, E. Additive toxicity of zinc and arsenate on barley (Hordeum vulgare) root elongation. Environ. Toxicol. Chem. 2017, 36, 1556–1562. [Google Scholar] [CrossRef] [PubMed]
- Smolders, E.; Oorts, K.; Van Sprang, P.; Schoeters, I.; Janssen, C.R.; McGrath, S.P.; McLaughlin, M.J. Toxicity of trace metals in soils as affected by soil type and aging after contamination: Using calibrated bioavailability models to set ecological soil standards. Environ. Toxicol. Chem. 2009, 28, 1633–1642. [Google Scholar] [CrossRef] [PubMed]
- Song, J.; Zhao, F.; McGrath, S.P.; Luo, Y. Influence of soil properties and aging on arsenic phytotoxicity. Environ. Toxicol. Chem. 2006, 25, 1663–1670. [Google Scholar] [CrossRef] [PubMed]
- IUSS Working Group WRB. World Reference Base for Soil Resources 2014. International Soil Classification System for Naming Soils and Creating Legends for Soil Maps; FAO: Rome, Italy, 2014. [Google Scholar]
- Smolders, E.; Oorts, K. Development of a Predictive Model of Bioavailability and Toxicity of Copper in Soils: Microbial Toxicity; Final Report of ICA Projects; Laboratory of Soil and Water Management, Katholieke Universiteit: Leuven, Belgium, 2004. [Google Scholar]
- Di Bonito, M.; Breward, N.; Crout, N.; Smith, B.; Young, S. Overview of Selected Soil Pore Water Extraction Methods for the Determination of Potentially Toxic Elements in Contaminated Soils: Operational and Technical Aspects. In Site Characterization, Data Analysis and Case Histories; 208AD; Elsevier: London, UK, 2008; pp. 213–249. [Google Scholar]
- Seefeldt, S.S.; Jensen, J.E.; Fuerst, E.P. Log-logistic analysis of herbicide dose-response relationships. Weed Technol. 1995, 9, 218–227. [Google Scholar] [CrossRef]
- Backhaus, T.; Altenburger, R.; Bodeker, W.; Faust, M.; Scholze, M.; Grimme, L.H. Predictibility of the toxicity of a multiple mixture of dissimilary acting chemicals to Vibrio fischeri. Environ. Toxicol. Chem. 2000, 19, 2348–2356. [Google Scholar] [CrossRef]
- Jonker, M.J.; Svendsen, C.; Bedaux, J.J.M.; Bongers, M.; Kammenga, J.E. Significance testing of synergistic/antagonistic, dose level-dependent, or dose ratio-dependent effects in mixture dose-response analysis. Environ. Toxicol. Chem. 2005, 24, 2701–2713. [Google Scholar] [CrossRef] [PubMed]
- Haas, C.N.; Cidambi, K.; Kersten, S.; Wright, K. Quantitative description of mixture toxicity: Effect of level of response on interactions. Environ. Toxicol. Chem. 1996, 15, 1429–1437. [Google Scholar] [CrossRef]
- Carter, W.H.; Gennings, C. Analysis of Chemical Combinations: Relating Isobolograms to Response. Surfaces. In Toxicology of Chemical Mixtures: Case Studies, Mechanisms, and Novel Approaches; Academic Press: London, UK, 1994; pp. 643–664. [Google Scholar]
- Hamels, F.; Malevé, J.; Sonnet, P.; Berggren-Kleja, D.; Smolders, E. Phytotoxicity of trace metals in spiked and field-contaminated soils: Linking soil-extractable metals with toxicity. Environ. Toxicol. Chem. 2014, 33, 2479–2487. [Google Scholar] [CrossRef] [PubMed]
- Tang, T.; Miller, D.M. Growth and tissue composition of rice grown in soil treated with inorganic copper, nickel, and arsenic. Commun. Soil Sci. Plant Anal. 1991, 22, 2037–2045. [Google Scholar] [CrossRef]
- Cao, Q.; Hu, Q.H.; Khan, S.; Wang, Z.J.; Lin, A.J.; Du, X.; Zhu, Y.G. Wheat phytotoxicity from arsenic and cadmium separately and together in solution culture and in a calcareous soil. J. Hazard. Mater. 2007, 148, 377–382. [Google Scholar] [CrossRef] [PubMed] [Green Version]
- Liu, X.; Zhang, S.; Shan, X.; Christie, P. Combined toxicity of cadmium and arsenate to wheat seedlings and plant uptake and antioxidative enzyme responses to cadmium and arsenate co-contamination. Ecotoxicol. Environ. Saf. 2007, 68, 305–313. [Google Scholar] [CrossRef] [PubMed] [Green Version]
Figure 1.
Selected zinc (Zn)–arsenic (As) treatments for each experimental soil. The experimental design includes a fractional factorial (solid lines) and a concentration gradient (dashed line). The single Zn and As initial addition were the same for the three experimental soils. The selected treatments to measure the Zn and As in the soil solution are marked with (*).
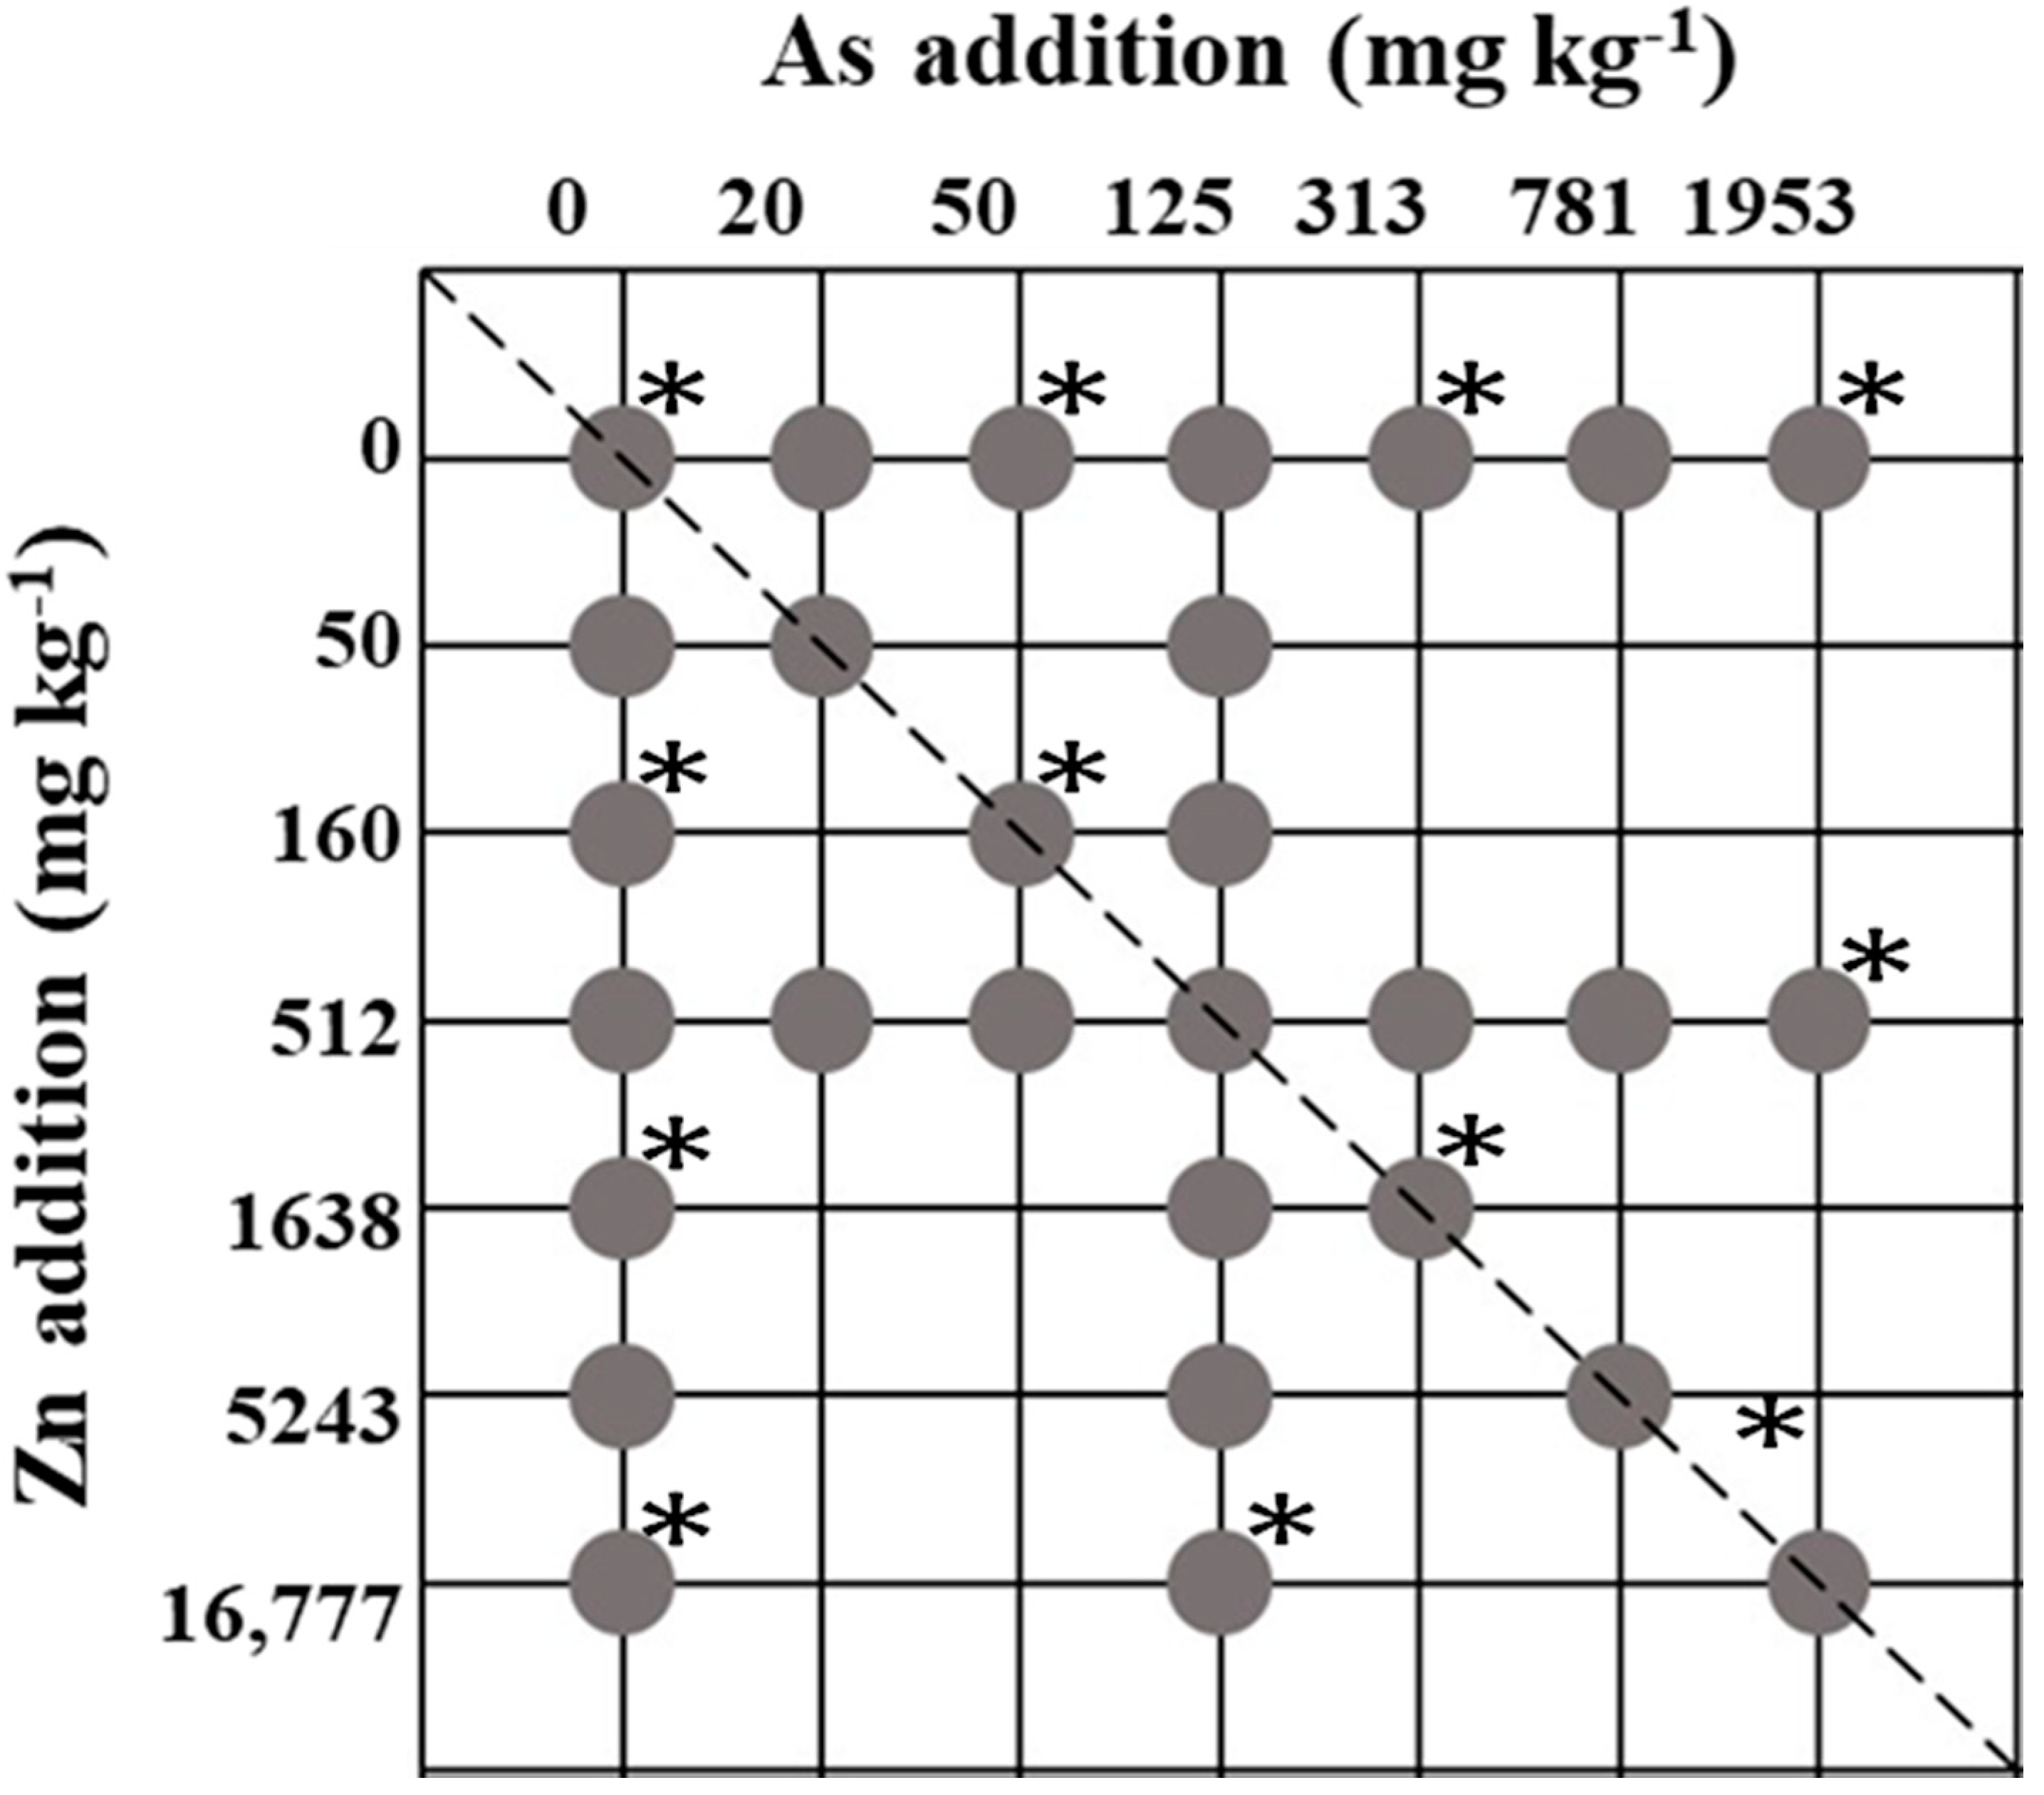
Figure 2.
Dose–response curves comparing single element (blue) and mixture (red) treatments for each soil (S1, S2 and S3). Doses are expressed as ΣTU (TU—toxic units) calculated on a total concentration basis; TU = 1 and the 50% relative effect reference lines are shown in grey.
Figure 2.
Dose–response curves comparing single element (blue) and mixture (red) treatments for each soil (S1, S2 and S3). Doses are expressed as ΣTU (TU—toxic units) calculated on a total concentration basis; TU = 1 and the 50% relative effect reference lines are shown in grey.
Figure 3.
Predicted vs. observed relative responses under the two principal reference models, concentration addition (CA) (a) and independent action (IA) (b). The errors bars correspond to the 95% confidence interval (CI) for each treatment observation.
Figure 3.
Predicted vs. observed relative responses under the two principal reference models, concentration addition (CA) (a) and independent action (IA) (b). The errors bars correspond to the 95% confidence interval (CI) for each treatment observation.

Table 1.
Selected chemical properties for the three soils.
| Soil | pH | TOC a | eCEC b | Fe c | Al c | Zn d | As d |
|---|---|---|---|---|---|---|---|
| (CaCl2) | (%) | (cmolc kg−1) | (mg kg−1) | (mg kg−1) | |||
| S1 | 6.9 | 0.9 | 43 | 2200 | 1500 | 1400 | 240 |
| S2 | 6.9 | 3.1 | 18 | 920 | 1200 | 90 | 20 |
| S3 | 6.8 | 1.8 | 17 | 1700 | 870 | 350 | 70 |
a TOC: Total organic carbon. b eCEC: Effective cationic exchange capacity. c Amonium oxalate extractable iron or aluminium on dry mass basis. d Background total metal concentration on dry mass basis. Zn—Zinc; As—arsenic.
Table 2.
Log-logistic dose–response parameters for single Zn and As treatments. Doses are expressed in mg kg−1 for the soil total concentrations and in µmol L−1 for the dissolved concentrations in the soil solution.
Table 2.
Log-logistic dose–response parameters for single Zn and As treatments. Doses are expressed in mg kg−1 for the soil total concentrations and in µmol L−1 for the dissolved concentrations in the soil solution.
| Soil | Soil Total Concentration Dose Expression (mg kg−1) | |||||||||||
|---|---|---|---|---|---|---|---|---|---|---|---|---|
| Zn | As | |||||||||||
| EC50 | LCL a | UCL b | β | LCL | UCL | EC50 | LCL | UCL | β | LCL | UCL | |
| S1 | 4200 | 3800 | 4700 | 2.8 | 2.3 | 3.6 | 650 | 690 | 8 | 5.6 | ||
| S2 | 3400 | 3000 | 3800 | 3.4 | 2.8 | 4.5 | 110 | 98 | 110 | 3.4 | 2.8 | 4.2 |
| S3 | 2100 | 1900 | 2300 | 1.7 | 1.5 | 1.9 | 100 | 91 | 100 | 6.2 | 4.2 | 12 |
| Soil Solution Concentration Dose Expression (µmol L−1) | ||||||||||||
| Zn | As | |||||||||||
| EC50 | LCL | UCL | β | LCL | UCL | EC50 | LCL | UCL | β | LCL | UCL | |
| S1 | 180 | 400 | 0.8 | 0.6 | 110 | 73 | 190 | 0.9 | 0.6 | |||
| S2 | 280 | 150 | 800 | 1.0 | 0.8 | 1.8 | 40 | 31 | 52 | 1.2 | 1 | 1.5 |
| S3 | 27 | 20 | 1.4 | 2.4 | 3.5 | 2.8 | 1.8 | 1.2 | ||||
a LCL: lower confidence limit for a 95% confidence interval. b UCL: upper confidence limit a 95% confidence interval. EC = effect concentrations.
Table 3.
Obtained parameters from fitting experimental data to the different MixTox-model expanded functions, using the soil total element concentrations as the dose expressions.
Table 3.
Obtained parameters from fitting experimental data to the different MixTox-model expanded functions, using the soil total element concentrations as the dose expressions.
| Soil | Parameter a † | Interpretation of Interactions | |
|---|---|---|---|
| CA | IA | ||
| S1 | 2 ** | 10 * | Significant antagonism according to CA and IA |
| S2 | 0.3 | 0.0 | No significant interaction according to CA and IA |
| S3 | 11 * | 0.5 ** | Significant antagonism according to CA and IA |
† Parameter a > 0 implies antagonism. CA: Concentration addition model. IA: Independent action model. * p < 0.05. ** p < 0.01.
© 2018 by the authors. Licensee MDPI, Basel, Switzerland. This article is an open access article distributed under the terms and conditions of the Creative Commons Attribution (CC BY) license (http://creativecommons.org/licenses/by/4.0/).
Share and Cite
MDPI and ACS Style
Guzman-Rangel, G.; Montalvo, D.; Smolders, E. Pronounced Antagonism of Zinc and Arsenate on Toxicity to Barley Root Elongation in Soil. Environments 2018, 5, 83. https://doi.org/10.3390/environments5070083
AMA Style
Guzman-Rangel G, Montalvo D, Smolders E. Pronounced Antagonism of Zinc and Arsenate on Toxicity to Barley Root Elongation in Soil. Environments. 2018; 5(7):83. https://doi.org/10.3390/environments5070083
Chicago/Turabian StyleGuzman-Rangel, Georgina, Daniela Montalvo, and Erik Smolders. 2018. "Pronounced Antagonism of Zinc and Arsenate on Toxicity to Barley Root Elongation in Soil" Environments 5, no. 7: 83. https://doi.org/10.3390/environments5070083
Note that from the first issue of 2016, this journal uses article numbers instead of page numbers. See further details here.