Assessing the Potential for Small-Scale Aquaculture in Cambodia


Department of Community Sustainability, Michigan State University, East Lansing, MI 48824, USA
*
Author to whom correspondence should be addressed.
Environments 2018, 5(7), 76; https://doi.org/10.3390/environments5070076
Submission received: 28 May 2018
/
Revised: 24 June 2018
/
Accepted: 26 June 2018
/
Published: 29 June 2018
(This article belongs to the Special Issue Agricultural Ecosystem Services)
Abstract
:Fisheries in Cambodia play an important role in supporting household food security and livelihoods throughout the country. Inland fisheries production is largely dependent on numerous ecosystem services, particularly the floodwaters of the Tonle Sap Lake basin, which has been degraded from increased fishing pressure because of population growth and a rising demand for fish. To address the dual problem of food insecurity and overfishing, an integrated food security and climate change program involved the promotion of small-scale aquaculture through semi-intensive pond management. The objective of this study is to examine perceptions of small-scale aquaculture by participants in this program in order to assess the potential for aquaculture to contribute to household food security and conservation of the Tonle Sap Lake ecosystem. Focus group discussions and a household survey were conducted among current and previous fish farmers. Results demonstrate that most farmers continue to practice small-scale aquaculture as a means to supplement household food availability and income. Numerous barriers to adoption of small-scale aquaculture were identified, including access to water, prices of commercial fish feed, selling price of fish in markets and concerns about profitability. Seasonal water scarcity is the most prominent challenge in promoting aquaculture technologies, so aquaculture development should be expanded in areas where there are abundant supplies of water, or where use of water storage techniques is feasible. Aquaculture technology appears to have the potential to contribute to food security, nutrition and household income and to the conservation of the wild fisheries of the Tonle Sap Lake.
1. Introduction
Fish and fishing are central to Cambodian culture and fisheries throughout the country play an important role in supporting household food security and livelihoods. Cambodians are among the highest consumers of freshwater fish in the world, with annual per capita fish consumption estimated at 52.4 kg [1]. More than 80% of the total animal protein in the Cambodian diet is estimated to come from fish and other aquatic animals, most of which comes from inland water bodies.
Inland fisheries production has largely depended upon annual flooding of the plains and wetlands around the Tonle Sap Lake and along the Tonle Sap River, which reverses direction during the monsoon season to flow northward, backing up into the Mekong River. The mean surface area of the Tonle Sap Lake swells more than four times in size, from 3500 km2 during the dry months (December to April), to a maximum of up to 14,500 km2 during the wet season (July to September) [2]. The months of flooding encourages the spawning and growth of fish stocks and other aquatic life, many of them migrating from higher reaches of the Mekong River and down the Tonle Sap River.
As the water levels in the Tonle Sap Lake subside, fish are easy to catch. Population growth, improved fishing technologies and rising demand for fish have increased fishing pressure in the Tonle Sap Lake basin. Although some natural fish stocks appear to have declined over the years, overall fish catches in the Tonle Sap area have risen in recent decades. However, the increase in population has outpaced the increase in fisheries production, resulting in a decline in the quantity and quality of catch per fisher, primarily because of increased competition for resources [3]. Furthermore, fish resources are threatened by illegal fishing, which has increased pressures on wild populations of fish and reduced the availability of an essential source of protein for the Cambodian people. These pressures have raised questions about the capacity of the ecosystems of the Tonle Sap Lake basin to support a growing population and the associated increase in demand for fish to support household food security.
Aquaculture in Cambodia is practiced in both freshwater and marine environments and occurs at multiple scales, from small-scale, subsistence production to large-scale, commercial production. More than half of total production is freshwater cage culture, which dominates the sector. Smallholder high-input pond aquaculture represents only about 18% of total production. Aquaculture is one of the fastest growing food production sectors in Cambodia but it currently contributes only about 10% of the country’s total fish production [3,4,5]. Cambodia’s aquaculture sector sustained average annual growth of over 14% between 1993 and 2014 and more than 18% between 2002 and 2014 and total production is approximately 112,000 tonnes [5].
Aquaculture holds considerable potential to improve nutrition and supplement household incomes through the sale of surplus catch. Thus, adoption of aquaculture production and improved resource management has the potential to contribute to poverty alleviation if it provides poor households with opportunities to diversify production systems and reduce food insecurity. However, aquaculture is dependent on numerous ecosystem services, including water provisioning and nutrient cycling. In the context of a climate that is characterized by two major seasons, with rain only between May and November, there are limits to the potential for small-scale aquaculture, including water scarcity, droughts and flooding during the rainy season. Promotion of small-scale aquaculture and community-based fisheries have been integral components of the country’s strategy for equitable agricultural development that prioritizes poverty alleviation and food security. Successful development of small-scale aquaculture would require significant market improvements in areas where aquaculture can support sustainable livelihoods [3].
In this context, the United States Agency for International Development developed an integrated food security and climate change program entitled, Helping Address Rural Vulnerabilities and Ecosystem STability (HARVEST). The HARVEST program used a variety of interventions in Cambodia to address its objectives of improving food security and building capacity to adapt to the effects of climate change. One of the interventions involved the promotion of small-scale aquaculture through semi-intensive pond management. The program provided assistance in multiple phases for smallholder aquaculture farmers in four provinces in Cambodia surrounding the Tonle Sap Lake (Pursat, Battambang, Siem Reap and Kompong Thom). The first phase included provision of startup materials, subsidized inputs (e.g., fingerlings, fish feed and lime), training and other extension services related to small-pond aquaculture. (Fingerlings refer to the early developmental stage of fish growth in aquaculture and are typically purchased from breeding hatcheries. Fish feed is commonly produced from a combination of soybeans, corn, rice and other grains. Lime is used in aquaculture by applying various acid-neutralizing compounds of calcium or magnesium to improve pH and alkalinity in ponds and enhance the effects of fertilization.) Support in subsequent cycles involved gradually decreasing input provision until farmers received only extension services. The aim of the interventions was to support a transition to small-pond aquaculture that is sustainable but it is not clear whether farmers will adopt the practices and continue to engage in aquaculture after the input subsidies were terminated.
Technology adoption has been studied extensively in smallholder agriculture but less so in small-scale aquaculture. Adoption has been defined as a mental process that an individual undergoes from first hearing about an innovation to final adoption [6]. Other definitions have emphasized the need to distinguish between individual and aggregate adoption, as the introduction of new technologies results in a period of disequilibrium and inefficient use of resources by the individual farmer and learning and experimenting lead the farmer toward new levels of equilibrium [7,8]. Aggregate adoption is measured by the aggregate level of use of a specific new technology within a given geographical area or among a given population. In most cases, agricultural technologies are introduced in packages that include several components, such as specific practices and inputs and this is true of the HARVEST Aquaculture Program. Farmers may face several options and they may adopt the complete package of innovations introduced in the region or subsets of the package, and adoption processes may follow specific sequential patterns, depending in part on external factors such as the development of the value chain and input markets [9].
The objective of this study is to examine farmers’ perceptions of aquaculture and perspectives on household food security, as part of the evaluation of the HARVEST Aquaculture and Fisheries program component. Specifically, this study aimed to address the following research questions:
- What are the primary drivers of adoption of small-scale aquaculture practices?
- What are the barriers to adoption of small-scale aquaculture practices?
- What are the primary reasons for discontinuing the practice of small-scale aquaculture?
The conceptual framework for the study is based on the notion that adoption of small-scale aquaculture is likely to be driven by (i) household factors, such as knowledge, education, skills and land tenure security, as well as (ii) external factors, such as access to hatcheries for fingerlings, access to input markets, input prices, access to fish markets for the sale of fish and selling price of fish. Barriers to aquaculture technology adoption are likely to include shortcomings in household factors, such as insufficient knowledge, or unfavorable conditions in external factors, such as a lack of access to markets, high input prices and low selling prices of fish, all of which diminish profitability and may lead to discontinuation of the practice.
The study draws upon data collected in focus group discussions and a rural household survey to examine the farmers’ perceptions of aquaculture, identify the constraints and barriers to adoption faced by farmers, examine the reasons that some farmers discontinued the practice of aquaculture and develop conclusions about the viability of small-scale aquaculture to contribute to rural household food security and resource conservation.
2. Materials and Methods
In order to examine farmers’ perceptions of aquaculture and perspectives on household food security, the study employed focus group discussions and a household survey of past and current participants in the aquaculture component of the HARVEST program. The use of mixed methods allowed for the analysis of both quantitative and qualitative data to assess the potential for adoption of small-scale aquaculture technologies in rural Cambodia.
2.1. Focus Group Discussions
In order to inform the development of a survey questionnaire, four focus group discussions (FGDs) were held in February 2015, one FGD in each of the four target provinces. The focus groups ranged in size from 7 to 11 participants, with a total of 35 participants across the four provinces. The aim of the FGDs was to understand specific aquaculture practices, the input supply and value chain for aquaculture, the barriers and constraints to aquaculture adoption and the general views and perspectives of farmers engaged in the Cambodia HARVEST Aquaculture Program. Participants were not randomly selected among HARVEST clients; rather, they were recruited in order to ensure diversity among farmer types (e.g., clients in their first cycle of farming fish, second-cycle farmers, graduated farmers, etc.).
2.2. Survey Questionnaire Development
The household survey was implemented in order to understand client household characteristics, assess levels of fish production, characterize the barriers and constraints to aquaculture adoption and identify the reasons for discontinuing the practice of aquaculture.
The survey questionnaire was drafted based on a review of literature, survey research practices and a number of Cambodia HARVEST reports. Insights from observations of the Cambodia HARVEST Aquaculture and Fisheries Program also contributed to the first round of questionnaire drafting. To ensure that the questionnaire covered important aspects of the Cambodia HARVEST Aquaculture and Fisheries Program, the team conducted pre-testing of the survey prior to implementation. In addition, findings from FGDs were integrated into development of the questionnaire. Finally, the questionnaire was reviewed by a panel of experts and eventually translated into the Khmer language. The household survey questionnaire (in English) is provided in the supplementary file.
2.3. Sampling Design
This evaluation survey utilized the cluster sampling method. The population for the sampling frame is comprised of the total number of 1571 Cambodia HARVEST Aquaculture Program clients across all four target provinces. For statistically meaningful results, the minimum sample size is at least 450 clients. To minimize standard error as much as possible, this study assigned 10 households to each cluster and the number of clusters was allocated proportionally among the four provinces with an adjustment to those with lower and higher numbers of clusters.
With the proportion of clients per province and with the adjustment to those with lower and higher number of clusters, the sample clusters per target province were:
Pursat: 15 clusters
Battambang: 15 clusters
Siem Reap: 7 clusters
Kampong Thom: 8 clusters
Clusters were selected using the simple random sampling method. With this method, every village had an equal chance of being selected. A list of all target villages of the Cambodia HARVEST Aquaculture Program out of the four target provinces was prepared. Villages were given random numbers and then the villages were selected as a cluster. For selected villages with fewer beneficiaries, the evaluation team collapsed the beneficiaries from one or two neighboring villages (based on the real geography).
The survey sample was randomly selected from the list of all current and former program participants. Every household in the selected villages was given a random number and the top 10 households were chosen. A reserve sample list was prepared using the same method. In the event that members of any sample household were not present, or no one was available for an interview, a household in the reserve list would be selected to replace it.
2.4. Survey Data Collection
Ten enumerators were recruited from a group of senior students from the Faculty of Fisheries of the Royal University of Agriculture and training was provided to them on the implementation of the household survey in July 2015. For data collection, the team of ten enumerators was divided into two teams of five members each and each team was led by a team leader who had prior experience in conducting field surveys.
Data entry was completed by university staff members through a template developed in Microsoft Access as the platform and data cleaning involved importing the dataset into SPSS and examining frequency and cross-tabulation to cross-check against paper versions of the completed surveys for consistency and accuracy.
A total of 451 households were contacted for the household survey and 15 clients declined to be interviewed because they were not qualified or were occupied with other livelihood activities. Therefore, the survey sample consisted of 436 households and their responses were used for data analysis. Descriptive statistics such as frequency count, mean and standard deviation were used to analyze data. Quotes from focus group discussions were used to complement findings. A non-parametric test was used to determine differences in perceptions between those respondents who indicated that they continue to farm fish and those who did not by testing for the equality of means between these two independent groups.
3. Results
Results are reported below, including descriptive statistics of the households, sources of information and fish production in small-scale aquaculture, followed by a discussion of the drivers of adoption of small-scale aquaculture and the barriers to the adoption of improved farming practices and technologies.
3.1. Aquaculture Clients
For sampling purposes, the population of the household survey included the clients of the Cambodia HARVEST Aquaculture Program. In accordance with the Identification of Poor Households (IDPoor) Programme, households in the region are identified by the Ministry of Planning as poor or non-poor and they are given identification cards from government authorities with their poverty category classification. The purpose of the Programme is to develop a standardized tool and procedures to identify poor households throughout the country, to be used for household and geographical targeting. The Programme is led by the Ministry of Planning in collaboration with the Department of Local Administration of the Ministry of Interior. From the household survey, more non-poor households (86.2%) participated in the household survey than poor households across the four target provinces. Of 436 total respondents, only 60 respondents identified as poor households. Frequency counts by poor and non-poor households are provided in Table 1.
There are numerous reasons for the low rate of participation of poor households in the Cambodia HARVEST Aquaculture Program, as compared to non-poor households. For example, to be eligible to participate in the aquaculture program, a farmer had to already have a pond or space suitable for raising fish and he/she had to be able to contribute at least 50 percent of the total cost for buying fish feed. Many poor households lack the land and resources to meet those qualifications.
Most rural households in the region are not only involved in fish farming but they also earn income from the sale of rice and vegetables and from wage labor and self-employment. The first and second most important sources of household income are provided in Table 2. Sale of rice was reported to be the most important source of income among respondents, while sale of fish was reported to be the second most important source of income.
3.2. Fish Production
Table 3 provides the average fish production in the prior 12 months by aquaculture farmers who continue to practice pond aquaculture by province (n = 324). The average number of cycles completed was 1.63 and average production in the last 12 months was 537.4 kg. Average pond size is 353.5 m2 and ranges from an average of 238.3 in Kampong Thom to 595.1 m2 in Siem Reap.
The Cambodia HARVEST Aquaculture Program worked with small-scale farmers with pond sizes ranging from less than 100 m2 to over 400 m2. Pond sizes are divided into three categories: (i) small (less than 100 m2), (ii) medium (100 m2 to 400 m2) and (iii) large (greater than 400 m2). Table 4 presents the distribution of respondents by province and size of fish ponds. In all four provinces, few households owned ponds smaller than 100 m2. Between 16.7 and 32.8 percent of farmers across the four provinces reported having fish ponds in this category. The majority of sample respondents owned fish ponds between 100 m2 and 400 m2, ranging from 45.1 percent to 57.0 percent. Fewer of the sample reporting having fish ponds over 400 m2 in size. It is interesting to note the regional variation, with nearly one-third of households from Battambang and Siem Reap provinces reported having large ponds, while nearly as many from Kompong Thom and Pursat reported having small ponds, which is more than double the share that reported having large ponds.
Average fish production by species and province is provided below in Table 5. Pangasius catfish produced the highest average yield per square meter (3.33 kg), followed by Nile tilapia (2.67 kg). Respondents in Pursat Province reported the highest average yields of both species (Pangasius catfish, 3.76 kg/m2; Nile tilapia, 3.99 kg/m2).
Fish production and sales by species is provided below in Table 6. A large proportion of sampled respondents in all four provinces reported raising Pangasius catfish (36.5 percent of respondents); the average production was 763.6 kg and 89 percent of households reported having sold some of their fish output. Walking catfish was raised by 27 percent of respondents; the average production was 360.1kg and 97 percent of households reported having sold fish.
Most respondents currently raising fish reported that they sold their fish in markets or to buyers. For example, households producing climbing perch reported average production per 417.1 kg and respondents (n = 41) sold an average of 355.7 kg, or 85.3% of total production. Households producing walking catfish reported average production of 360.1 kg and 82 of 85 respondents reported having sold an average of 292.5 kg, or 81.2% of total production. This indicates that aquaculture can be one source of livelihood diversification in rural areas. In total, 298 of 315 households currently raising fish reported having sold an average of 451.2 kg, or 86.7% of total production.
Some farmers who sold fish expressed the advantages of selling a fresh product, such as the following comment from an FGD participant:
“I sold my fish by myself, not selling to a retail seller or middleperson at all. If consumers did not come to my farm, I would not sell them my fish. Our fish is fresh.”[Battambang FGD participant]
3.3. Drivers of Adoption
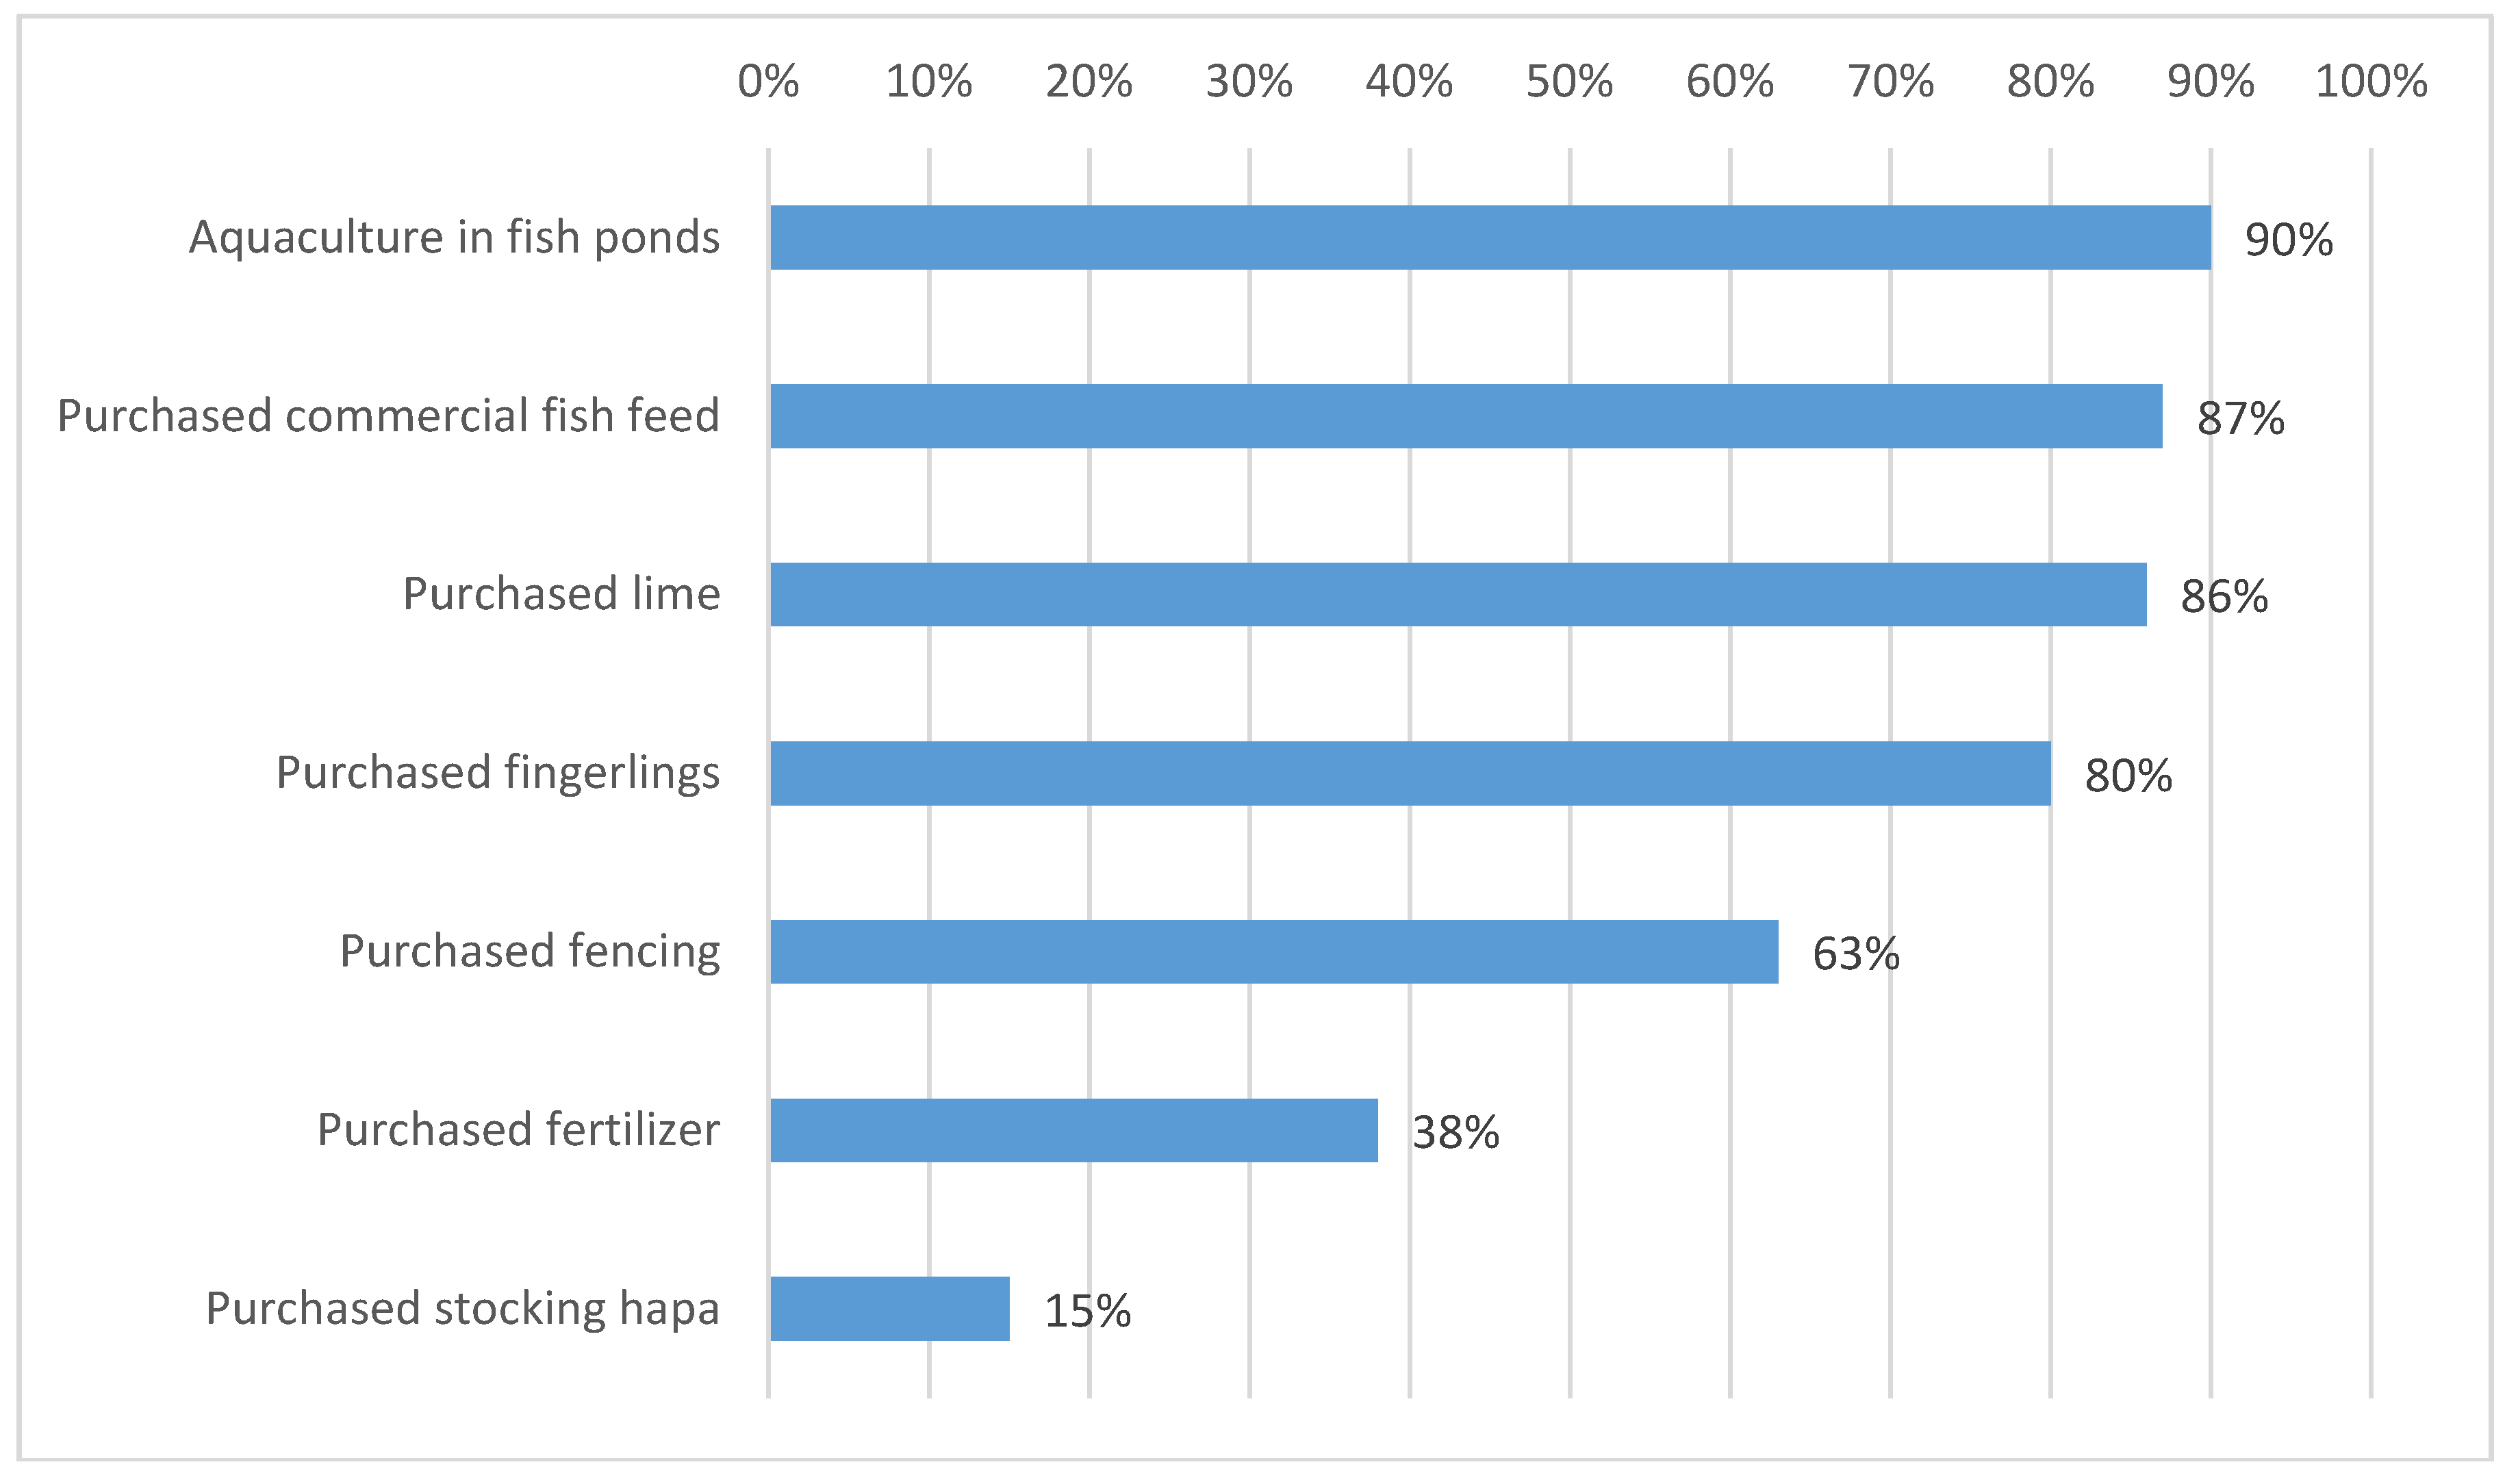
Numerous drivers of adoption were identified in the study, including the increasing scarcity of wild fish, increased earnings potential from aquaculture production, advantages of working from home over migration and increased household food availability. The majority of respondents who indicated that they would continue raising fish (n = 324) mentioned continuing to use many of the technologies that were part of the HARVEST program, even after the subsidies were discontinued (see Figure 1). Between 80 percent and 90 percent of farmers mentioned they would continue to purchase fingerlings, lime and commercial fish feed and continue raising fish using ponds. Only 63 percent mentioned purchasing fencing and this technology is apparently vital to success. The relatively low percentage does not necessarily mean that aquaculture farmers will not use this technology, as some may use readily available resources for fencing their ponds. Fewer than half of respondents mentioned continuing to use purchased fertilizer and stocking hapa (or a net enclosure).
Most farmers who continue to raise fish expressed positive views about the practice of aquaculture. These sentiments were supported by comments from the FGDs, such as the following quotation:
“I continue raising fish in two ponds, on my own without support. I graduated [from the HARVEST program] and now I have a new pond on my own.”[Pursat FGD participant]
3.4. Barriers to Adoption
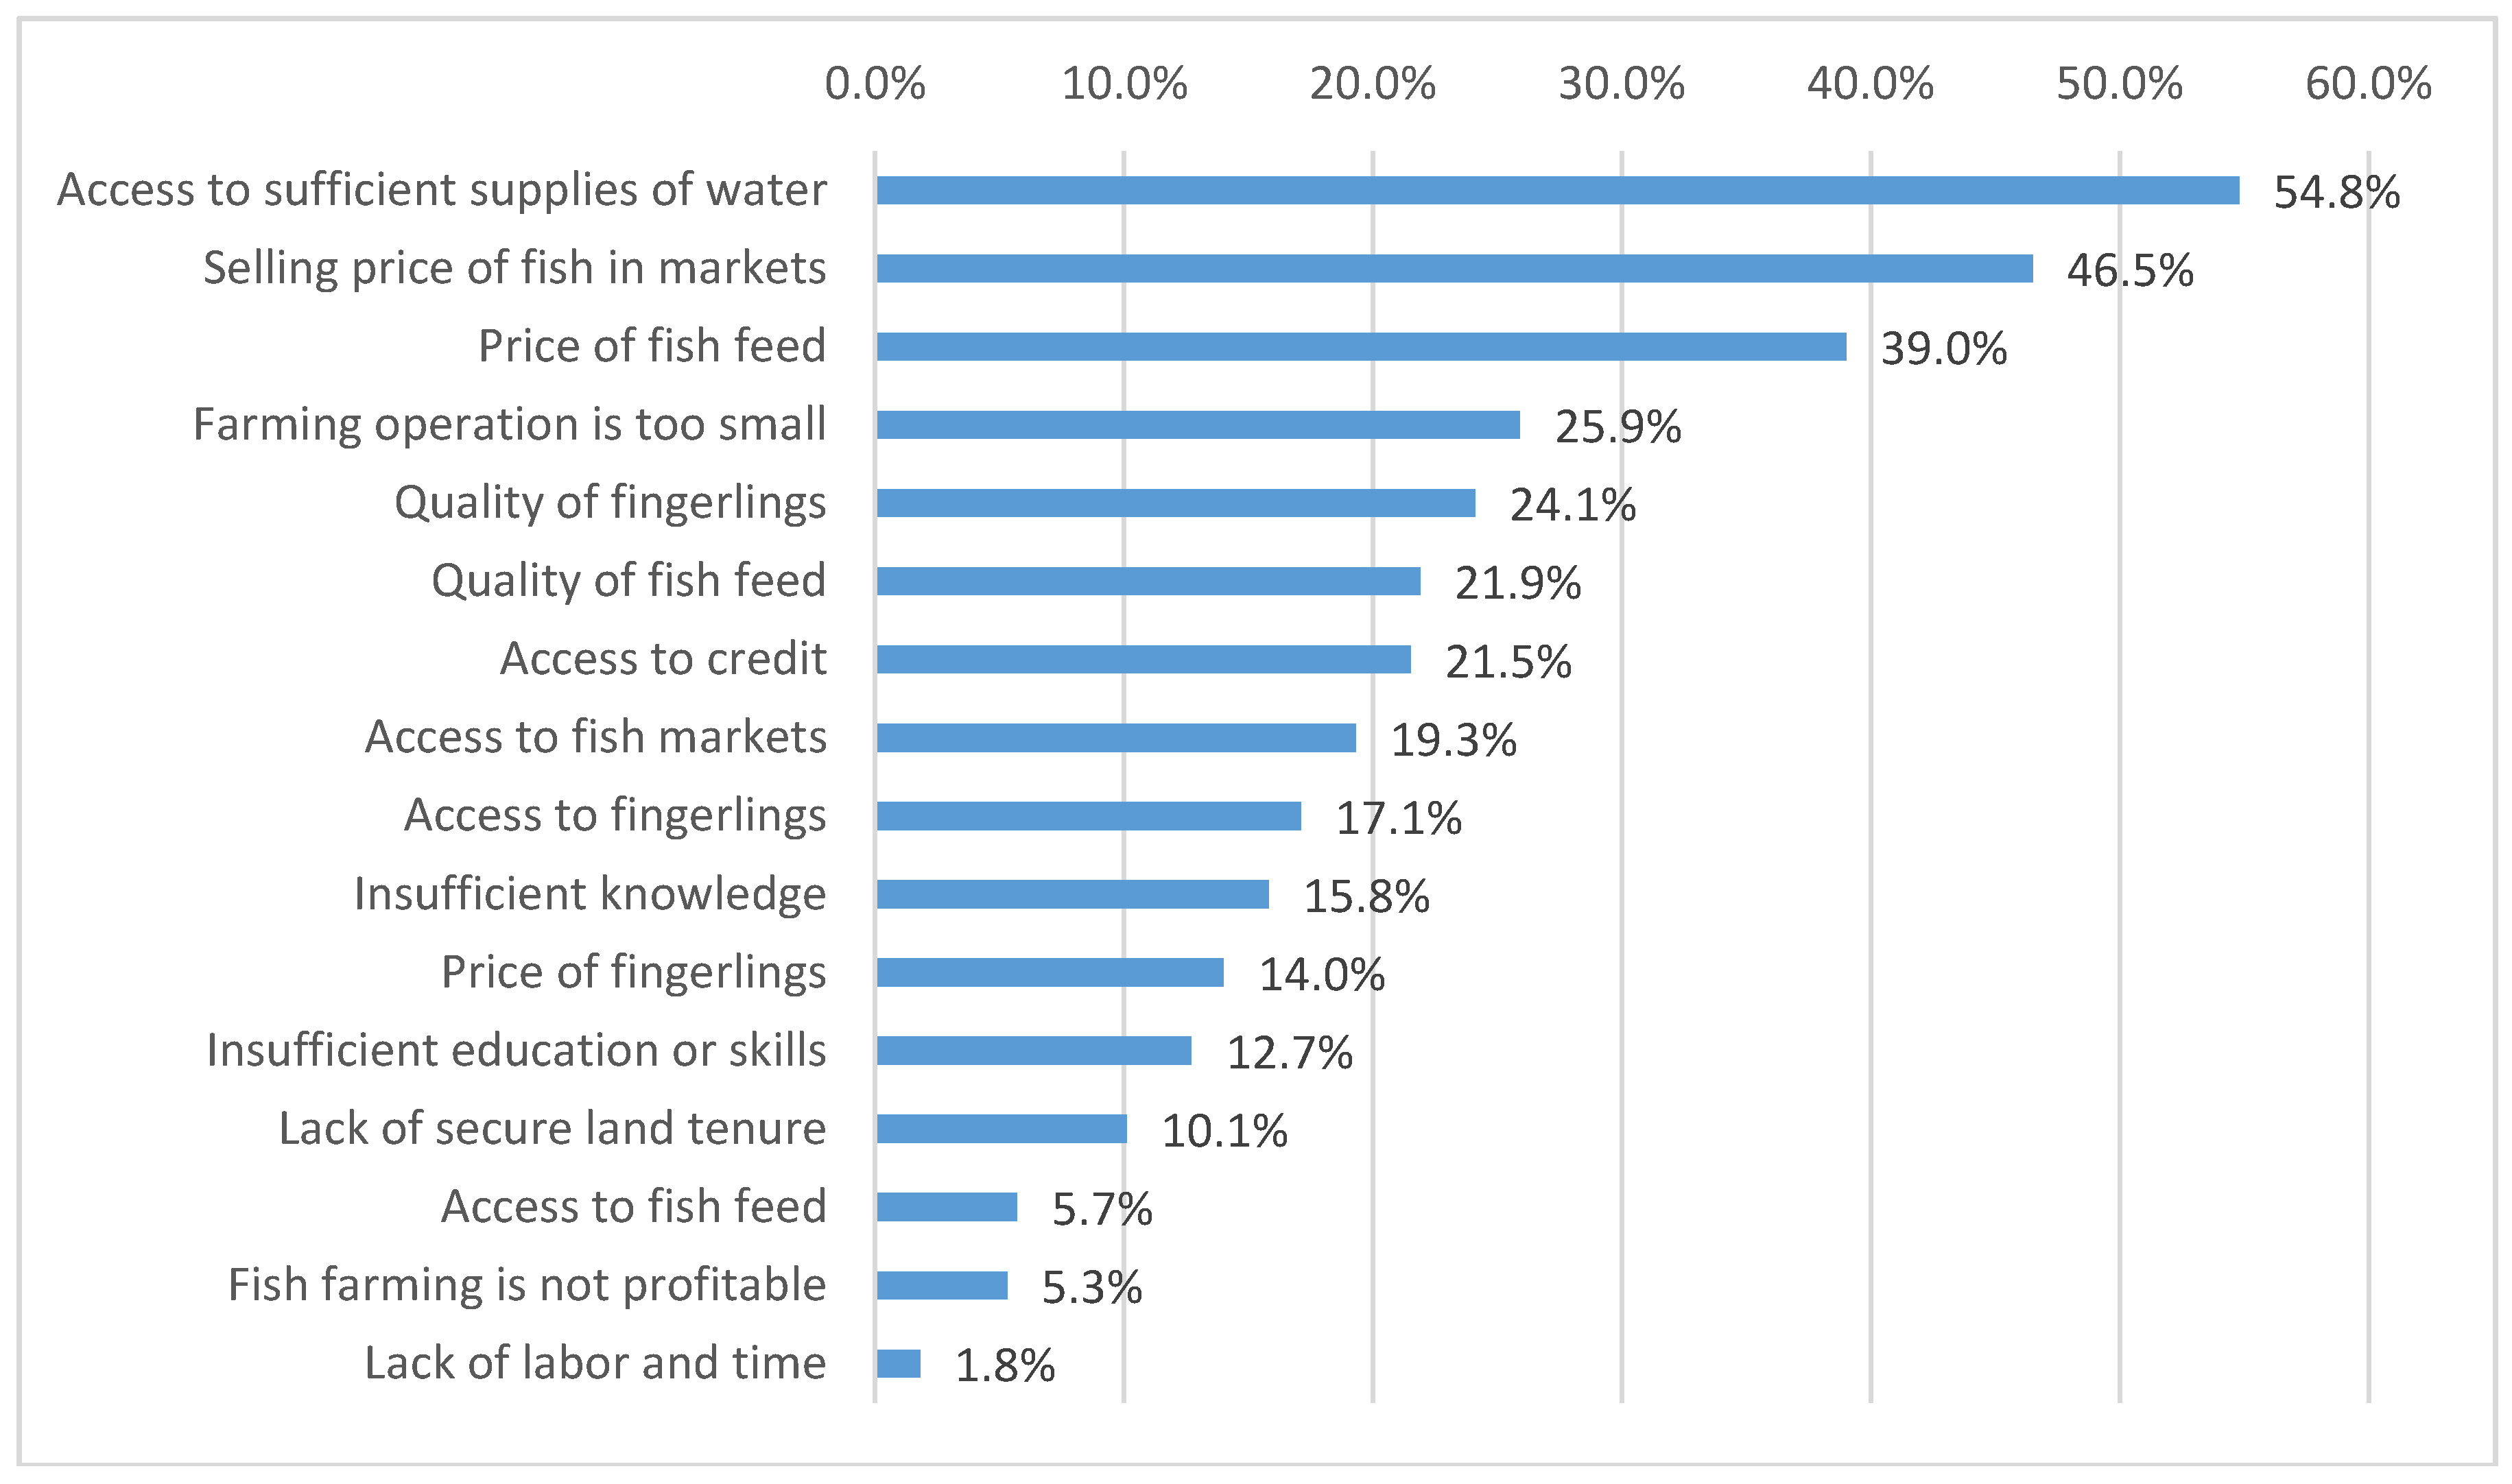
The 324 respondents who continue raising fish were asked if they believe that there are “barriers to adopting new and improved farming practices or technologies.” The 228 respondents who said they did perceive barriers to technology adoption responded to questions about factors that hindered them from adopting improved farming practices or technologies. The statements about barriers to adoption of improved practices or technologies were identified in the focus group discussions that were held prior to the household survey. Responses to the questions about barriers to adoption of specific practices are presented in Figure 2 (n = 228). Out of 16 factors, lack of water was the most important barrier for 54.8 percent of respondents. This finding highlights the importance of the ecosystem service of water provisioning in supporting small-scale aquaculture.
The second most common response was the market price of local small-scale aquaculture fish and the third most common response was the price of commercial fish feed. Respondents indicated that low market prices for fish combined with the high cost of commercial fish feed reduces the profitability of small-scale aquaculture. This finding highlights the importance of value chain development, including the expansion of markets for the sale of fish as well as input markets.
Participants in the FGDs also mentioned a range of barriers to adoption of some of the aquaculture practices, including lack of water. The following quotations illustrate the perceptions of some farmers about the challenges associated with water scarcity:
“… there is a lack of water for only 3 or 4 months during the dry season because there is no water source like a stream or canal.”[Pursat FGD participant]
“The important thing is that people cannot afford it [aquaculture]. A lack of money for digging new ponds is a reason and lack of water sources is the other.”[Pursat FGD participant]
“… In that region, we do not have enough water for filling the pond. It’s really hard. The water in the pond was bad and we could not pump out and fill in with new water.”[Battambang FGD participant]
Participants in the FGDs also mentioned challenges related to stagnant market prices for fish and high costs of commercial fish feed. These challenges are supported by the following quotations:
“…fish feed price keeps increasing…for high protein fish feed, the price is 4000 riels/kg [about US $1] but the price for fish [from aquaculture] does not increase at all.”[Battambang FGD participant]
Therefore, in order to ensure the long-term sustainability of the practice of small-scale aquaculture, secure access to sufficient freshwater for fish production will be an important priority. The expansion of markets for fish and commercial fish feed may facilitate greater adoption of aquaculture, particularly among poor households.
Statistical tests were conducted on responses to questions about statements about barriers to adoption of improved farming practices or technologies between poor and non-poor households, according to their IDPoor status. The Mann-Whitney test is a non-parametric test of the differences in median values that makes no assumption about the distribution of responses between the two groups. A p-value (Prob > |z|) of 0.05 or less indicates that there is a significant difference between the responses of the two groups at a 5 percent significance level. Results of these statistical tests on responses to questions about barriers to adoption are presented in Table 7, according to the IDPoor status of households. None of the responses to questions about barriers to adoption were statistically significant between these two groups, as none of the p-values were less than or equal to 0.05. This finding implies that there are no statistical differences between poor and non-poor households with respect to their perceptions of the barriers to adoption of improved aquaculture practices or technologies.
3.5. Drivers of Discontinuing the Practice
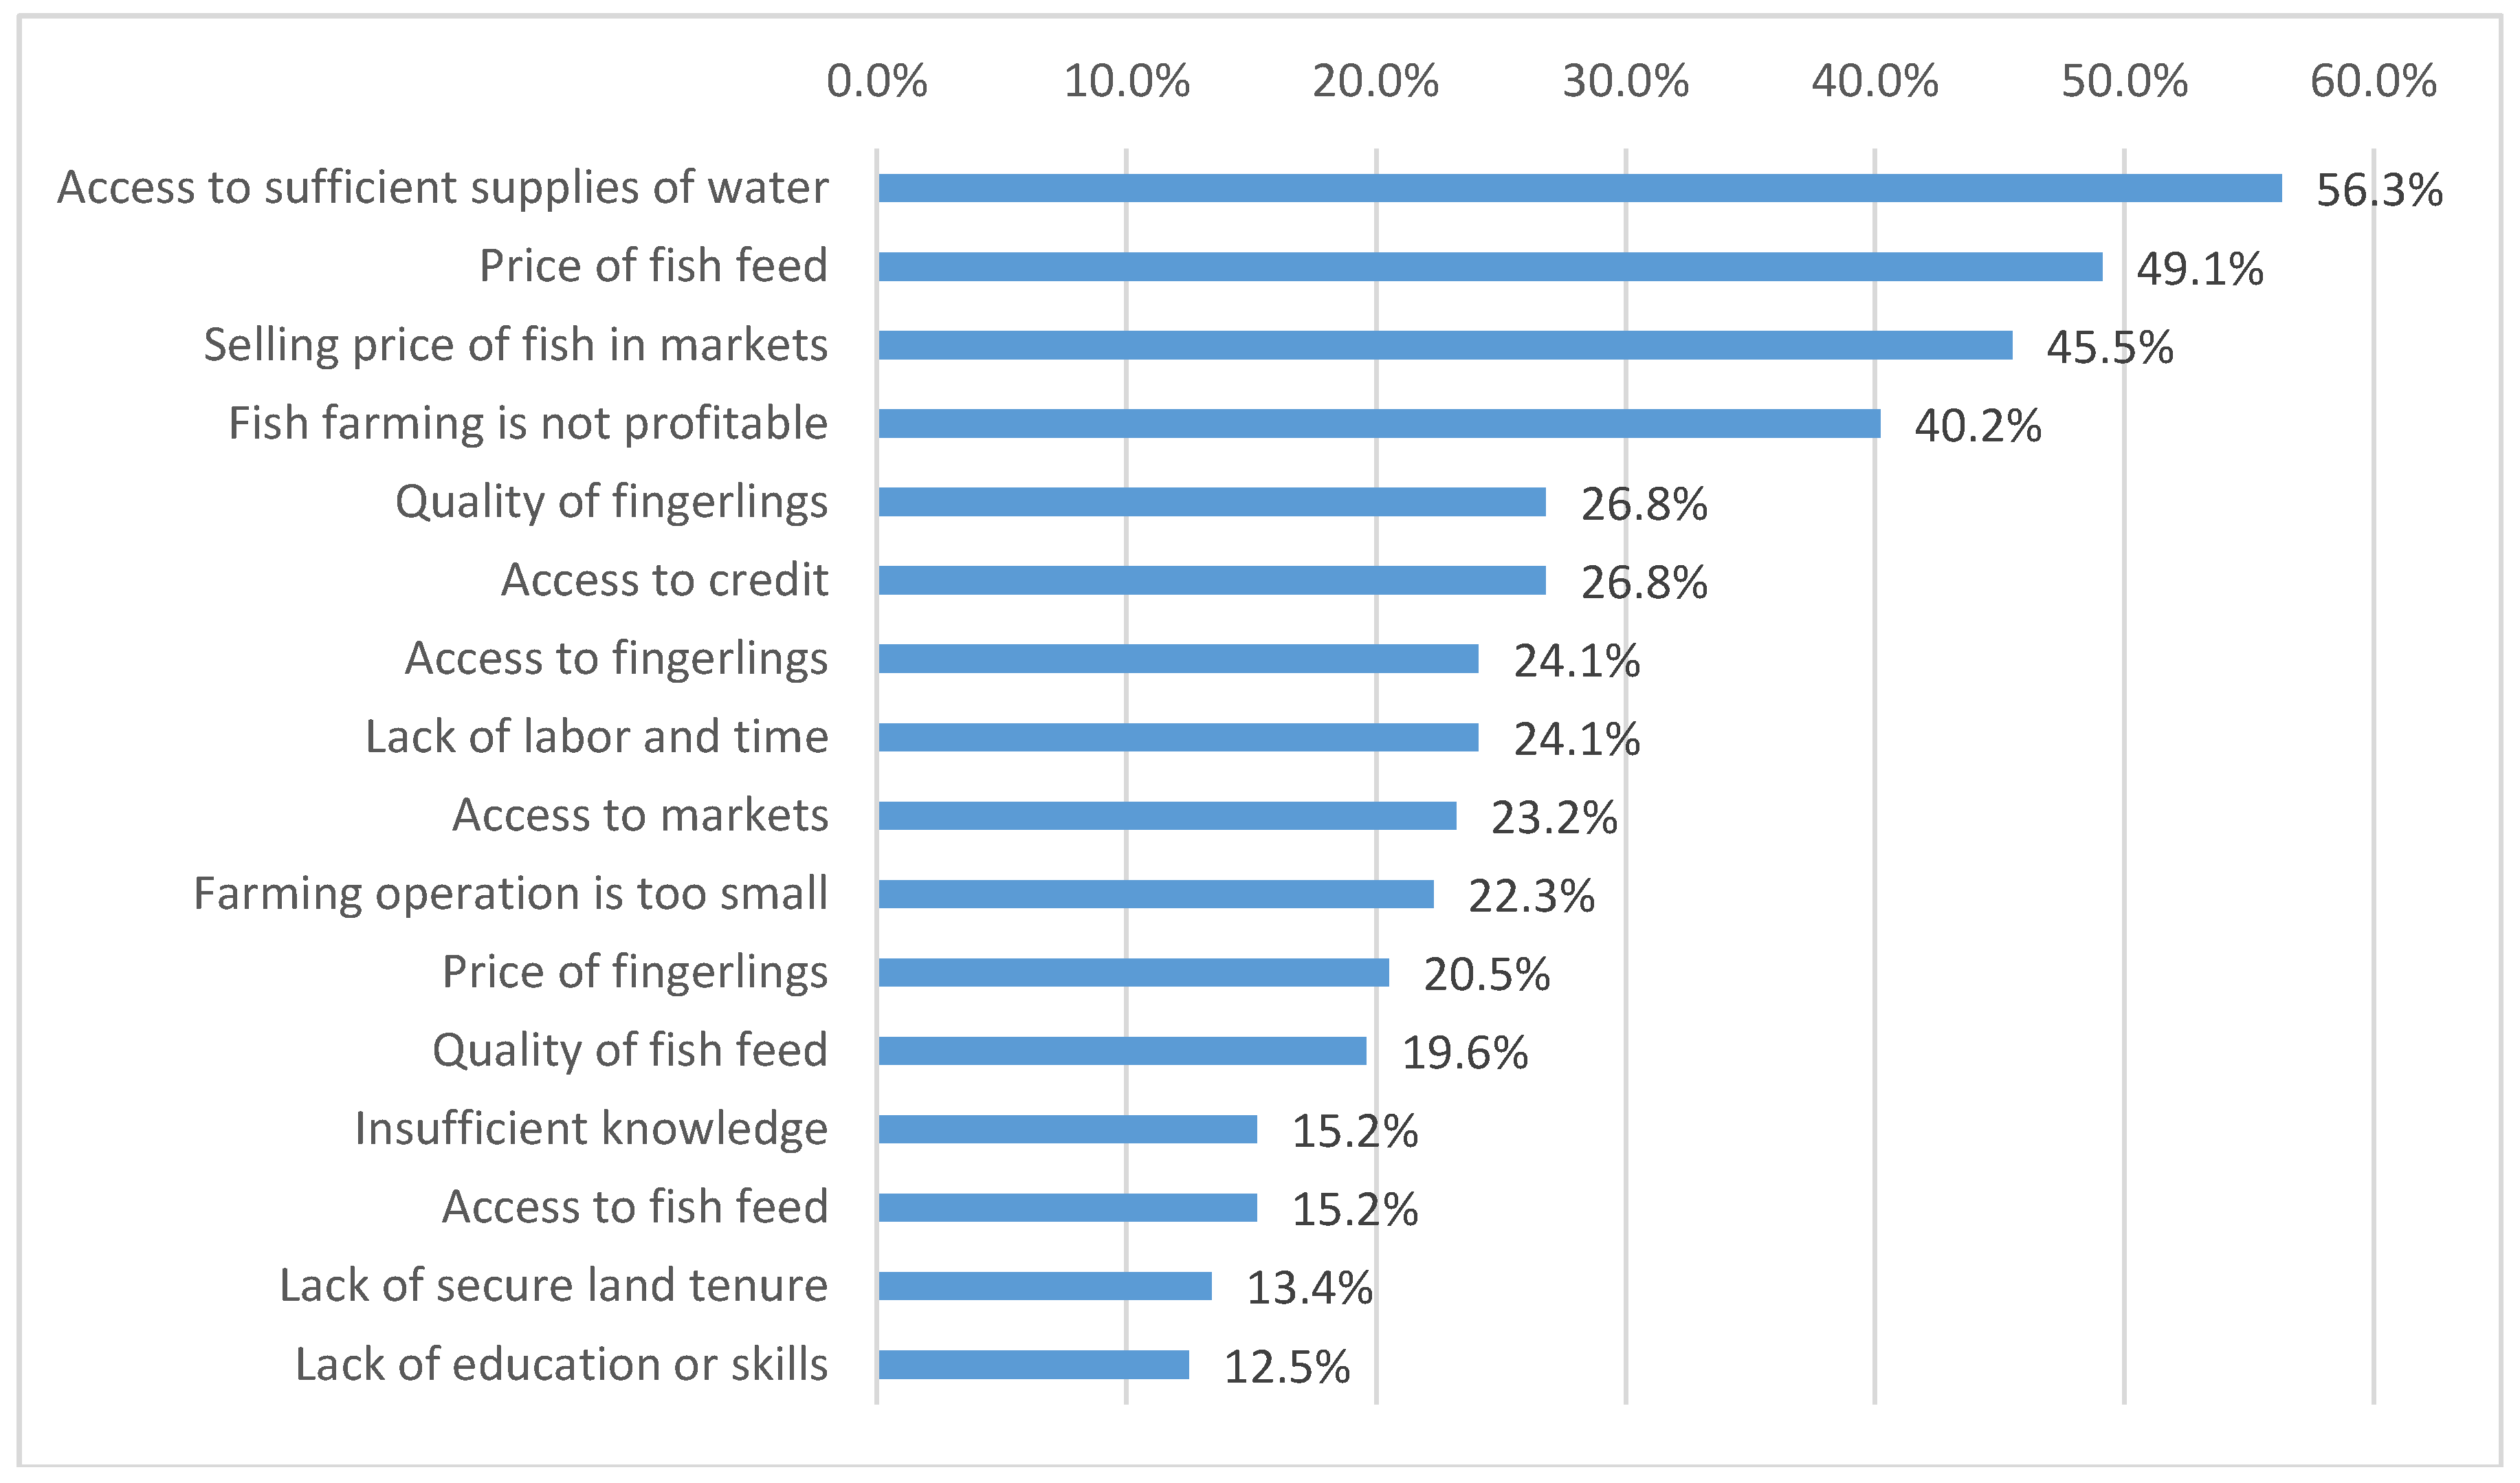
Not all respondents have continued to raise fish. Out of 436, 112 respondents had already discontinued the practice of small-scale aquaculture at the time of the household survey. More than half of those respondents indicated that they stopped raising fish because of problems related to access to fresh water. Approximately half of respondents indicated that they stopped raising fish because of high prices for commercial fish feed. Concerns about the selling price of fish in markets and the profitability of small-scale fishing operations were also among the major reasons.
Responses to questions about the reasons for discontinuing the practice of small-scale aquaculture are presented in Figure 3. Access to sufficient supplies of water was identified as the most important reason for discontinuing aquaculture practices. Other common barriers to adoption of continuing to raise fish were the price of fish feed, low selling price of aquaculture fish and profitability. Other factors were noted, including access to quality fingerlings, as well as access to credit, labor and fish markets.
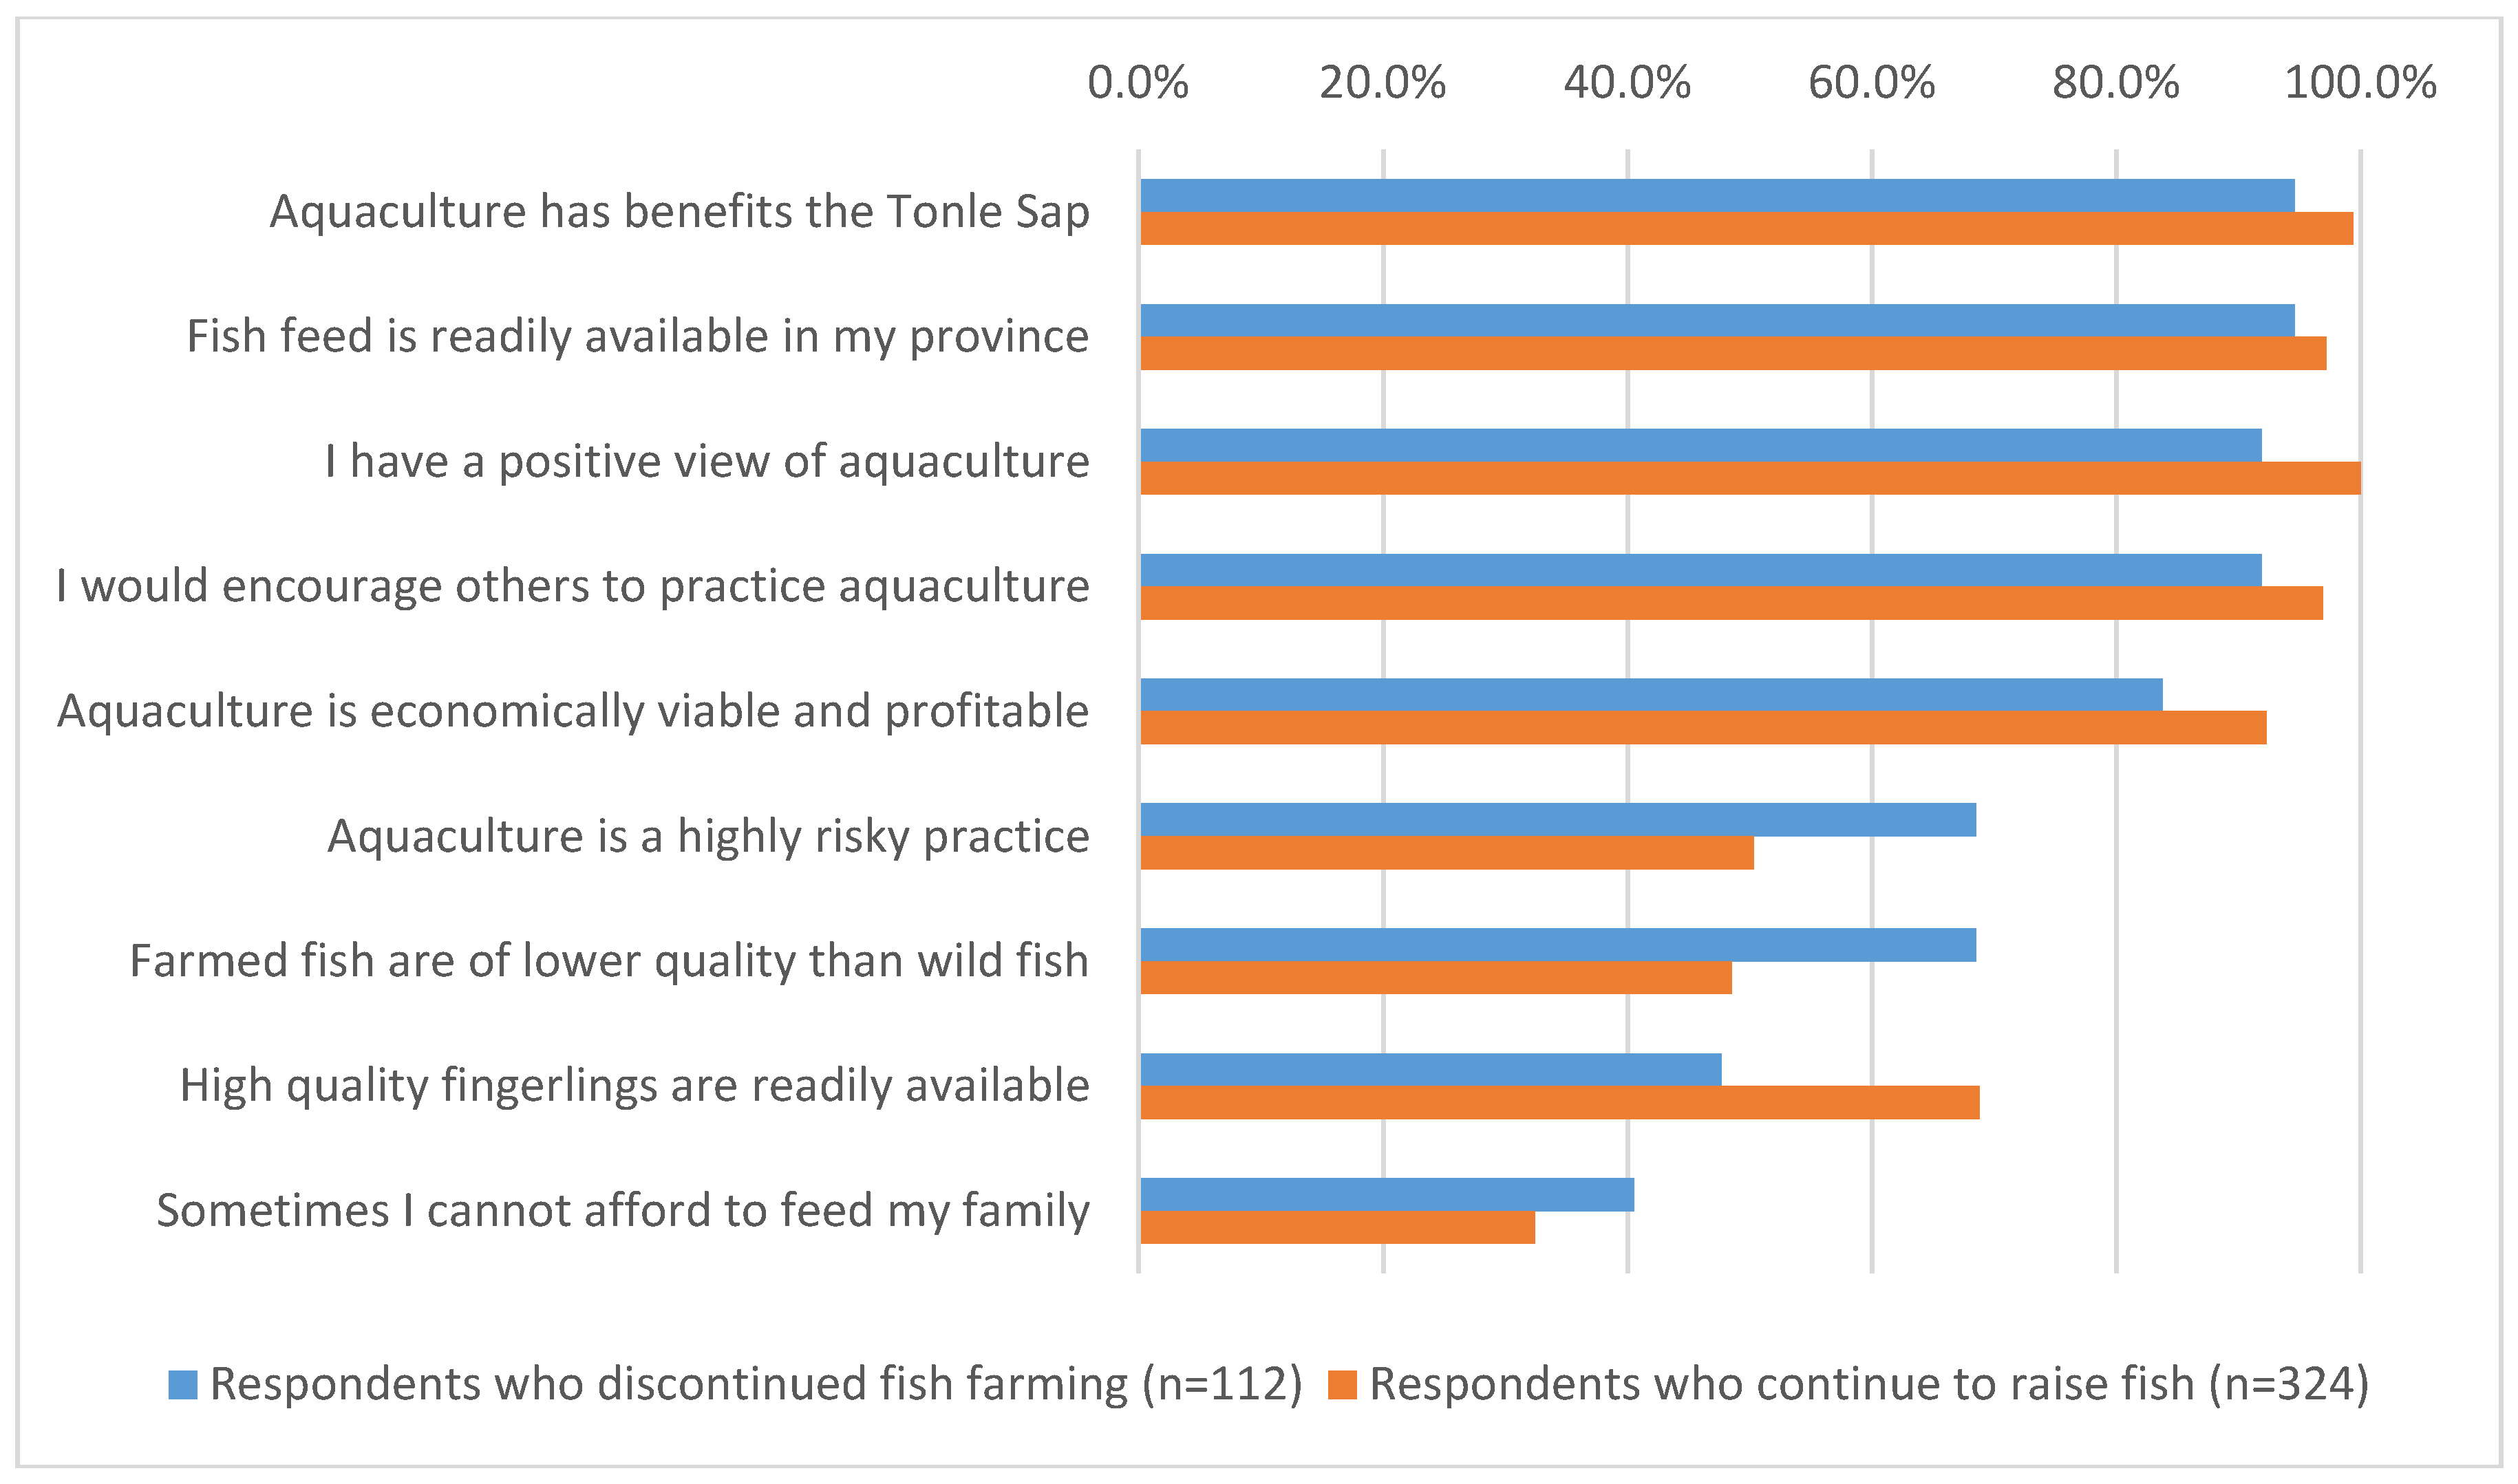
The survey also asked both farmers who had discontinued the practice of aquaculture as well as farmers who continue to raise fish about their overall perspectives on small-scale aquaculture. All respondents were asked about their agreement or disagreement with statements about perceptions of small-scale aquaculture. The statements about perceptions of aquaculture were identified in the focus group discussions that were held prior to the household survey. Respondents were asked to respond by saying if they agree, disagree, or neither. Responses to statements about aquaculture are presented in Figure 4 and in general, respondents in both groups had similar views. For instance, 99.4 percent of those who continued raising fish and 94.6 percent of those who discontinued indicated that small-scale aquaculture is environmentally beneficial for the sustainability of the Tonle Sap Lake. They reported believing that when more farmers raise fish in aquaculture systems, there is less fishing pressure on the Tonle Sap capture fishery. When asked about the availability of fish feed, most respondents from both groups indicated that availability of fish feed was not a major concern. Furthermore, most respondents from both groups indicated that they considered small-scale aquaculture to be a good livelihood activity and most indicated that they would encourage their friends and family members to participate in the activity. However, respondents who are still practicing aquaculture tended to have a more positive view of fish farming and they were more likely to perceive aquaculture as economically viable and profitable, as compared to respondents who no longer practice aquaculture. They were also less likely to perceive farmed fish to be of lower quality and they were less likely to be unable to feed their families.
Statistical tests were conducted on responses to questions about statements about small-scale aquaculture between those respondents who indicated that they continue to farm fish and those who did not. The Mann-Whitney test is a non-parametric test of the differences in median values that makes no assumption about the distribution of responses between the two groups. A p-value (Prob > |z|) of 0.05 or less indicates that there is a significant difference between the responses of the two groups at a 5 percent significance level. Responses to these questions are presented in Table 8, according to whether or not the respondents continue farming fish. Statistically significant responses to statements are marked with an asterisk (*).
There are statistically significant differences between respondents who continue to farm fish and those who discontinued the practices in terms of their views of aquaculture, the quality of farmed fish, the risks involved with the practice, whether they would encourage others to practice aquaculture and the availability of high-quality fingerlings. There were also significant differences between these two groups in terms of the profitability of aquaculture and of its contribution to fisheries conservation in the Tonle Sap Lake.
4. Discussion
Numerous drivers of adoption of small-scale aquaculture production were identified in both the FGDs and household survey, including the increasing scarcity of wild fish from the Tonle Sap Lake, increased earnings potential from aquaculture, advantages of working from home over migration, increased household food availability and increased household income. Results demonstrate that most participants in the program continue to practice small-scale aquaculture as a means to supplement household food availability and income. Understanding the drivers of adoption of aquaculture is important for the development of policies aimed at improving household food security and conserving the natural resources of the Tonle Sap Lake ecosystem.
The findings of the FGDs indicate that small-scale aquaculture could be a means to supplement household food availability and income. However, the household survey revealed that a number of smallholders discontinued small-scale aquaculture for various reasons. Therefore, understanding the drivers and barriers of adoption of aquaculture is important for the development of policies aimed at improving household food security and conserving the natural resources of the Tonle Sap Lake ecosystem.
Access to water is the most prominent challenge in promoting aquaculture technologies, so aquaculture development will have greater potential for adoption in areas where there are abundant supplies of water, or where water storage techniques are feasible. It is also important to promote practices that reduce losses during flooding. The results have implications for the potential for small-scale aquaculture adoption and for environmental policy and rural development in Cambodia.
In areas where wild fish are not abundant, respondents suggested that preferences for aquaculture fish have evolved. These responses were supported by comments from FGD participants, such as this quotation:
“… previously most consumers said that aquaculture fish was not tasty. So, they preferred captured fish from a lake or somewhere. But nowadays, captured fish are not abundant, so now it is clear that most consumers changed their habits to eat aquaculture fish. They changed their preferences.”[Battambang FGD participant]
Adoption of small-scale aquaculture systems is limited by several factors, including access to water, prices of commercial fish feed, selling price of fish in markets and concerns about profitability. Access to fingerlings was identified as a regional barrier. In this context, small-scale aquaculture has the potential to enhance the sustainability of rural livelihoods in the Tonle Sap Lake region by providing a key source protein to vulnerable rural populations. Farmers reported believing that greater adoption of the practice of small-scale aquaculture has the potential to reduce fishing pressure on the capture fishery of the Tonle Sap Lake basin.
Approximately one quarter of respondents reported having stopped fish farming as a livelihood activity altogether. The main reasons behind this are not the quality of technology but rather there are issues related to inputs and marketing, such as the availability of water, the price of fish feed, the selling price of fish in the market, concerns about profitability and the quality of fingerlings. The findings have implications for policies that encourage the expansion of markets for the sale of fish and the development of input supply chains to increase the adoption of small-scale aquaculture technologies.
5. Conclusions
Small-scale aquaculture holds considerable potential to improve nutrition, enhance household food security and supplement household incomes through the sale of surplus fish. Therefore, adoption of aquaculture technologies and improved resource management has the potential to contribute to poverty alleviation if it provides poor households with opportunities to diversify production systems beyond rice cultivation, which is the most important source of income for rural households. Aquaculture is dependent on numerous ecosystem services, including water provisioning and nutrient cycling. In the context of a climate that is characterized by two weather seasons, there are two major biophysical limits to the potential for small-scale aquaculture—specifically water scarcity during the dry season and flooding during the rainy season.
Water remains the most prominent challenge in promoting aquaculture technologies, so aquaculture development may be more effective in areas where there are abundant supplies of water and protection from flooding during the rainy season, or where water storage techniques are feasible. It is important to consider the importance of the potential benefits to aquaculture development in adapting to the effects of environmental change and in promoting benefits to biodiversity conservation, diversifying livelihood strategies, reducing reliance on wild fish stocks, promoting practices to reduce losses during flooding and demonstrating fish production on a seasonal basis (during the wet season) to mitigate the effects of prolonged drought periods.
There was a low rate of participation among poor households in the aquaculture program intervention, as compared to non-poor households. This is likely related to eligibility requirements, which included that farmers already have a pond or space suitable for raising fish and that they had to be able to contribute at least 50 percent of the total cost for buying fish feed. Many poor households lack the land and resources to meet those qualifications. Therefore, this requirement did not allow for participation by potential adopters who did not qualify for the program, leading to some bias to the estimates of the overall drivers of adoption among the rural population. However, there were no statistical differences between poor and non-poor participants in terms of their perceptions of barriers to adoption of small-scale aquaculture technologies.
While aquaculture has the potential to contribute to food security, nutrition and household income, it is important that aquaculture policy address barriers to adoption and scaling out, such as issues related to access to freshwater for ponds, poorly-developed input supply chains and the availability of markets, especially in rural areas. For example, in addition to the promoted technologies, it is important for the subsector to ensure a quality supply of fingerlings locally throughout the region. It is also important that aquaculture extension services be strengthened. Effective development of small-scale aquaculture would require significant market improvements in areas where aquaculture can support sustainable livelihoods. However, there is a need for further research to examine the social networks of aquaculture farmers to better understand how technologies and practices are disseminated and diffused and which factors determine the adoption of technologies. Farmer field schools and the use of lead farmers (or model farmers) could also be used to promote the adoption of aquaculture technologies to neighboring farmers. The results of this study have implications for environmental policy and rural development in Cambodia.
Supplementary Materials
The household survey questionnaire (in English) is provided in the supplementary file which is available at https://www.mdpi.com/2076-3298/5/7/76/s1.
Author Contributions
R.B.R. and M.S. conceptualized the study and designed the survey. R.B.R. analyzed the data and M.S. contributed to the interpretation of the results. R.B.R. led the writing of the manuscript, with input from M.S. Both authors provided contributed to the research design, data analysis and preparation of the manuscript.
Funding
This research was funded by the United States Agency for International Development, with funding from the Michigan State University Food Security III Cooperative Agreement No. GDG-A-00-02-00021-00 and Associate Award No. AID-442-LA-12-00001.
Acknowledgments
This study benefitted from contributions and insights from Samonn Mith and Sreng Bora, who supervised the data collection. The authors are also grateful to the participating farmers and to the administration, faculty and students of the Royal University of Agriculture, Cambodia. Any errors or omissions are the responsibility of the authors.
Conflicts of Interest
The authors declare no conflict of interest.
References
- Hortle, K.G. Consumption and the Yield of Fish and Other Aquatic Animals from the Lower Mekong Basin; MRC Technical Paper No. 16; Mekong River Commission: Vientiane, Lao PDR, 2007. [Google Scholar]
- Mekong River Commission. Overview of the Hydrology of the Mekong Basin; Mekong River Commission: Vientiane, Lao PDR, 2005. [Google Scholar]
- Joffre, O.; Kura, Y.; Pant, J.; Brakel, S.N.; Ross, L.G. Aquaculture for the Poor in Cambodia: Lessons Learned; The WorldFish Center: Phnom Penh, Cambodia, 2010; 16p. [Google Scholar]
- Van Brakel, M.L.; Ross, L.G. Aquaculture development and scenarios of change in fish trade and market access for the poor in Cambodia. Aquac. Res. 2011, 42, 931–942. [Google Scholar] [CrossRef]
- Joffre, O.; So, N.; Chheng, P. Aquaculture Production in Cambodia: Trends and Patterns in Recent Years; Inland Fisheries Research and Development Institute (Fisheries Administration) and WorldFish: Phnom Penh, Cambodia, 2016; 15p. [Google Scholar]
- Rogers, E. Diffusion of Innovations; Free Press of Glencoe: New York, NY, USA, 1962. [Google Scholar]
- Schulz, T.W. The value of the ability to deal with disequilibrium. J. Econ. Lit. 1975, 13, 827–846. [Google Scholar]
- Feder, G.; Just, R.E.; Zilberman, D. Adoption of agricultural innovations in developing countries: A survey. Econ. Dev. Cult. Chang. 1985, 33, 255–298. [Google Scholar] [CrossRef]
- Mann, C.K. Packages of practices: A step at a time with clusters. Stud. Dev. 1978, 21, 73–81. [Google Scholar]
Figure 1.
Adoption of fish farming technologies (n = 324).

Figure 2.
Barriers to adoption of improved farming practices or technologies (n = 228).

Figure 3.
Reasons for discontinuing the practice of small-scale aquaculture (n = 112).

Figure 4.
Comparisons of respondents’ agreement with statements regarding aquaculture (n = 436).


Table 1.
Sample of aquaculture clients, by province and IDPoor (the Identification of Poor Households) status.
Table 1.
Sample of aquaculture clients, by province and IDPoor (the Identification of Poor Households) status.
| Province | Poor (n = 60) | Non-Poor (n = 376) | |||
|---|---|---|---|---|---|
| Frequency | Percent | Frequency | Percent | Total | |
| Battambang | 23 | 16.5% | 116 | 83.5% | 139 |
| Kampong Thom | 6 | 7.5% | 74 | 92.5% | 80 |
| Pursat | 23 | 15.5% | 125 | 84.5% | 148 |
| Siem Reap | 8 | 11.6% | 61 | 88.4% | 69 |
| Total | 60 | 13.5% | 376 | 86.2% | 436 |
Table 2.
Sources of household income.
| Sources of Income | Most Important Source | Second Most Important Source | ||
|---|---|---|---|---|
| Frequency | Percent | Frequency | Percent | |
| Sales of fish | 31 | 7.1 | 82 | 18.8 |
| Sales of rice | 182 | 41.7 | 77 | 17.7 |
| Sales from vegetable gardens | 59 | 13.5 | 71 | 16.3 |
| Wage labor | 54 | 12.4 | 57 | 13.1 |
| Small business/self-employed | 62 | 14.2 | 55 | 12.6 |
| Remittances | 14 | 3.2 | 16 | 3.7 |
| Sales of livestock | 4 | 0.9 | 55 | 12.6 |
| Other | 30 | 6.9 | 23 | 5.3 |
Table 3.
Fish production among aquaculture clients, by province.
| Province | Farmers Currently Raising Fish | Number of Cycles | Fish Produced | Pond Size | |
|---|---|---|---|---|---|
| Frequency | Percent | Mean (#) | Mean (kg) | Mean (m2) | |
| Battambang (n = 139) | 108 | 77.7% | 1.69 | 581.0 | 382.0 |
| Kampong Thom (n = 80) | 58 | 72.5% | 1.55 | 384.3 | 238.3 |
| Pursat (n = 148) | 107 | 72.3% | 1.71 | 545.2 | 272.2 |
| Siem Reap (n = 69) | 51 | 73.9% | 1.43 | 602.0 | 595.1 |
| Total (n = 324) | 324 | 74.3% | 1.63 | 537.4 | 353.5 |
Table 4.
Households, by province and size of fish ponds.
| Province | Less Than 100 m2 | 100 m2 to 400 m2 | More Than 400 m2 | |||
|---|---|---|---|---|---|---|
| Frequency | Percent | Frequency | Percent | Frequency | Percent | |
| Battambang (n = 139) | 23 | 16.7% | 69 | 50.0% | 47 | 33.3% |
| Kampong Thom (n = 80) | 26 | 32.8% | 44 | 55.2% | 10 | 12.1% |
| Pursat (n = 148) | 43 | 29.0% | 84 | 57.0% | 21 | 14.0% |
| Siem Reap (n = 69) | 16 | 23.5% | 31 | 45.1% | 22 | 31.4% |
| Total (n = 324) | 108 | 24.8% | 228 | 52.3% | 100 | 22.9% |
Table 5.
Average fish production, by species and province (kg/m2).
| Mean, in kg/m2 (SD) | |||||
|---|---|---|---|---|---|
| Fish Species | Battambang | Kampong Thom | Pursat | Siem Reap | Total |
| Climbing perch | 2.03 (2.20) | 1.30 (0.78) | 1.90 (1.71) | 1.90 (1.71) | 1.69 (1.51) |
| Walking catfish | 1.53 (0.98) | 1.56 (1.41) | 2.05 (1.15) | 2.05 (1.15) | 1.66 (1.11) |
| Nile tilapia | 0.76 (0.49) | 0.49 (0.22) | 3.99 (6.72) | 2.20 (0.02) | 2.67 (5.24) |
| Pangasius catfish | 2.39 (1.79) | 3.66 (1.52) | 3.76 (4.63) | 3.31 (1.97) | 3.33 (3.72) |
| Red tilapia | 1.94 (2.69) | 0.61 (0.00) | 1.19 (1.48) | 1.11 (1.05) | 1.57 (2.17) |
| Silver barb | 0.54 (0.29) | 0.36 (0.19) | n.a. | n.a. | 0.58 (0.37) |
Table 6.
Fish production and sales, by species.
| Fish Species | Total Fish Produced (kg) | Households That Sold Fish | Fish Sold (kg) | Revenue Received (USD) | ||
|---|---|---|---|---|---|---|
| Frequency | Mean (SD) | Frequency | Percent | Mean (SD) | Mean (SD) | |
| Climbing perch | 41 | 417.1 (403.5) | 41 | 100% | 355.7 (372.3) | 631.0 (680.3) |
| Walking catfish | 85 | 360.1 (479.0) | 82 | 97% | 292.5 (373.1) | 446.4 (622.4) |
| Nile tilapia | 30 | 378.2 (541.9) | 26 | 79% | 251.1 (455.4) | 411.4 (678.2) |
| Pangasius catfish | 115 | 763.6 (587.6) | 108 | 89% | 707.7 (537.7) | 834.0 (613.0) |
| Red tilapia | 43 | 362.1 (415.3) | 42 | 91% | 296.9 (383.4) | 575.8 (733.8) |
| Silver barb | 8 | 181.0 (138.5) | 7 | 78% | 148.1 (124.5) | 276.9 (243.5) |
| Total (n = 324) | 315 | 520.3 (543.1) | 298 | 92% | 451.2 (488.8) | 631.6 (676.5) |
Table 7.
Statistical test of differences about barriers to adoption of improved fish farming practices or technologies between poor and non-poor households (n = 340).
Table 7.
Statistical test of differences about barriers to adoption of improved fish farming practices or technologies between poor and non-poor households (n = 340).
| Barriers to Adoption | z = | Prob > |z| = |
|---|---|---|
| Household factors | ||
| Insufficient knowledge | 1.029 | 0.3037 |
| Insufficient education or skills | 0.759 | 0.4480 |
| Lack of secure land tenure | 0.827 | 0.4085 |
| Farming operation is too small | 1.373 | 0.1698 |
| Lack of labor and time | 0.418 | 0.6757 |
| Fish farming is not profitable | −1.554 | 0.1201 |
| External factors | ||
| Access to sufficient supplies of water | 0.810 | 0.4177 |
| Access to fingerlings | −0.284 | 0.7764 |
| Quality of fingerlings | 0.826 | 0.4086 |
| Price of fingerlings | −0.715 | 0.4745 |
| Access to fish feed | 0.588 | 0.5566 |
| Quality of fish feed | −0.095 | 0.9241 |
| Price of fish feed | 0.227 | 0.8208 |
| Access to credit | 1.673 | 0.0944 |
| Access to fish markets | −1.595 | 0.1108 |
| Selling price of fish in markets | 1.219 | 0.2228 |
Table 8.
Statistical test of differences about perceptions of small-scale aquaculture among respondents who continue to farm fish and those who do not (n = 436).
Table 8.
Statistical test of differences about perceptions of small-scale aquaculture among respondents who continue to farm fish and those who do not (n = 436).
| Statement | z = | Prob > |z| = |
|---|---|---|
| I have a positive view of aquaculture * | −5.435 | 0.0000 |
| Farmed fish are of lower quality than wild caught fish * | 3.671 | 0.0002 |
| Fish feed is readily available in my province | −1.707 | 0.0879 |
| Sometimes I cannot afford all of the food to feed my family or myself | 1.381 | 0.1673 |
| Aquaculture is a highly risky practice * | 2.740 | 0.0061 |
| I would encourage my friends and family to participate in aquaculture * | −2.530 | 0.0114 |
| High quality fingerlings are readily available in my province * | −3.919 | 0.0001 |
| Aquaculture helps to conserve natural resources in the Tonle Sap * | −3.610 | 0.0003 |
| Aquaculture is an economically viable and profitable activity * | −2.765 | 0.0057 |
* Statements for which there is a statistically significant difference between responses from the two groups.
© 2018 by the authors. Licensee MDPI, Basel, Switzerland. This article is an open access article distributed under the terms and conditions of the Creative Commons Attribution (CC BY) license (http://creativecommons.org/licenses/by/4.0/).
Share and Cite
MDPI and ACS Style
Richardson, R.B.; Suvedi, M. Assessing the Potential for Small-Scale Aquaculture in Cambodia. Environments 2018, 5, 76. https://doi.org/10.3390/environments5070076
AMA Style
Richardson RB, Suvedi M. Assessing the Potential for Small-Scale Aquaculture in Cambodia. Environments. 2018; 5(7):76. https://doi.org/10.3390/environments5070076
Chicago/Turabian StyleRichardson, Robert B., and Murari Suvedi. 2018. "Assessing the Potential for Small-Scale Aquaculture in Cambodia" Environments 5, no. 7: 76. https://doi.org/10.3390/environments5070076
Note that from the first issue of 2016, this journal uses article numbers instead of page numbers. See further details here.